NIELSEN - Global Trust in Advertising 2012
10
A Nielsen Report Global Trust in Advertising and Brand Messages April 2012
-
Upload
stefano-ceresa -
Category
Documents
-
view
250 -
download
2
Transcript of NIELSEN - Global Trust in Advertising 2012

A Nielsen Report
Global Trust in Advertising and Brand Messages
April 2012
2 Copyright © 2012 The Nielsen Company.
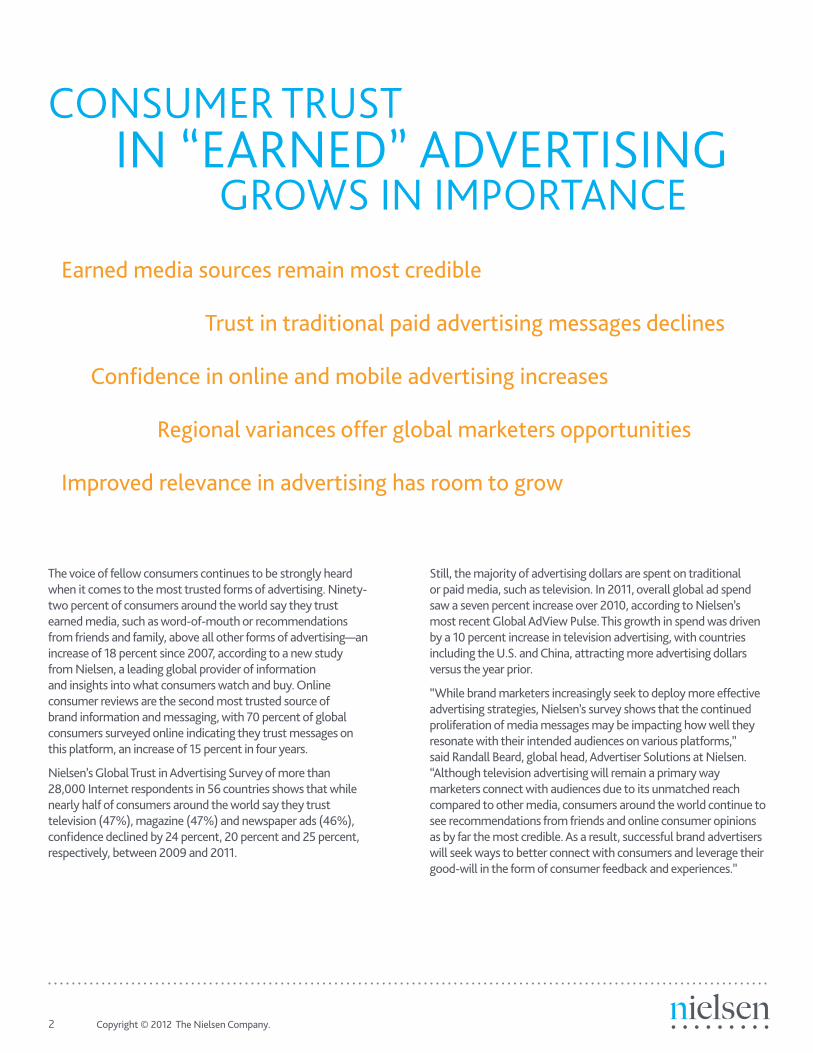
The voice of fellow consumers continues to be strongly heard when it comes to the most trusted forms of advertising. Ninety-two percent of consumers around the world say they trust earned media, such as word-of-mouth or recommendations from friends and family, above all other forms of advertising—an increase of 18 percent since 2007, according to a new study from Nielsen, a leading global provider of information and insights into what consumers watch and buy. Online consumer reviews are the second most trusted source of brand information and messaging, with 70 percent of global consumers surveyed online indicating they trust messages on this platform, an increase of 15 percent in four years.
Nielsen’s Global Trust in Advertising Survey of more than 28,000 Internet respondents in 56 countries shows that while nearly half of consumers around the world say they trust television (47%), magazine (47%) and newspaper ads (46%), confidence declined by 24 percent, 20 percent and 25 percent, respectively, between 2009 and 2011.
Still, the majority of advertising dollars are spent on traditional or paid media, such as television. In 2011, overall global ad spend saw a seven percent increase over 2010, according to Nielsen’s most recent Global AdView Pulse. This growth in spend was driven by a 10 percent increase in television advertising, with countries including the U.S. and China, attracting more advertising dollars versus the year prior.
“While brand marketers increasingly seek to deploy more effective advertising strategies, Nielsen’s survey shows that the continued proliferation of media messages may be impacting how well they resonate with their intended audiences on various platforms,” said Randall Beard, global head, Advertiser Solutions at Nielsen. “Although television advertising will remain a primary way marketers connect with audiences due to its unmatched reach compared to other media, consumers around the world continue to see recommendations from friends and online consumer opinions as by far the most credible. As a result, successful brand advertisers will seek ways to better connect with consumers and leverage their good-will in the form of consumer feedback and experiences.”
IN “EARNED” ADVERTISINGCONSUMER TRUST
GROWS IN IMPORTANCE
Earned media sources remain most credible
Trust in traditional paid advertising messages declines
Confidence in online and mobile advertising increases
Regional variances offer global marketers opportunities
Improved relevance in advertising has room to grow
Copyright © 2012 The Nielsen Company. 3
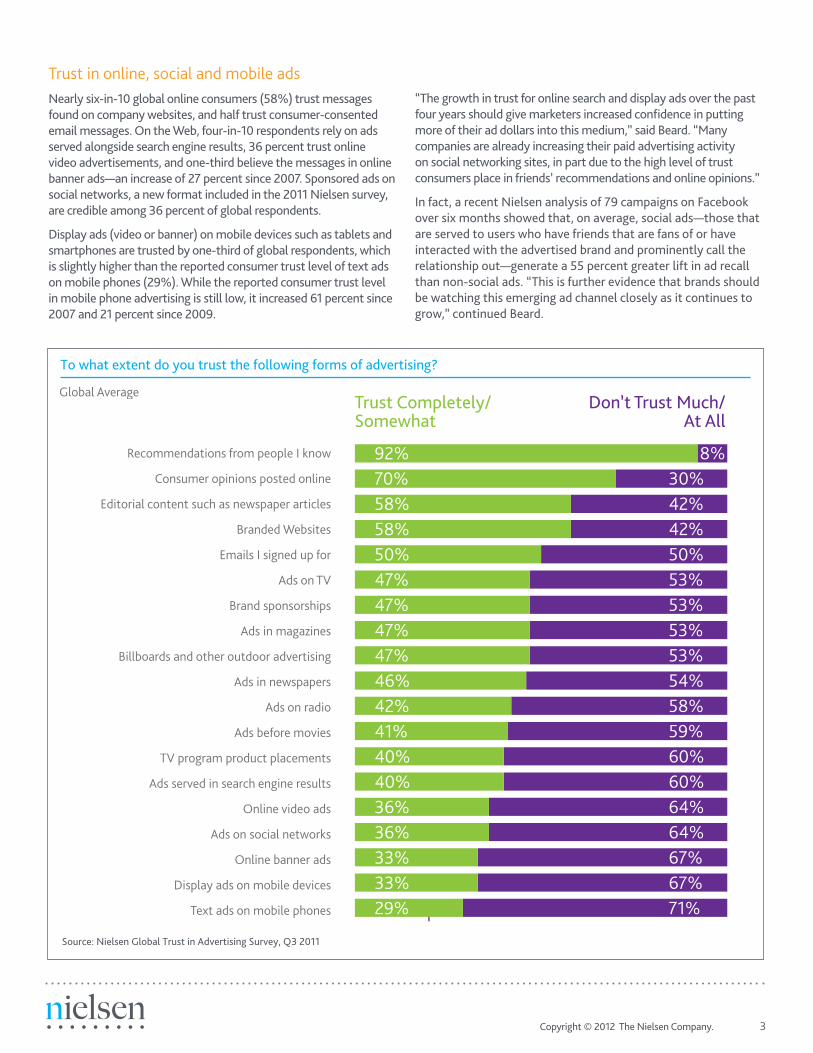
Trust in online, social and mobile ads Nearly six-in-10 global online consumers (58%) trust messages found on company websites, and half trust consumer-consented email messages. On the Web, four-in-10 respondents rely on ads served alongside search engine results, 36 percent trust online video advertisements, and one-third believe the messages in online banner ads—an increase of 27 percent since 2007. Sponsored ads on social networks, a new format included in the 2011 Nielsen survey, are credible among 36 percent of global respondents.
Display ads (video or banner) on mobile devices such as tablets and smartphones are trusted by one-third of global respondents, which is slightly higher than the reported consumer trust level of text ads on mobile phones (29%). While the reported consumer trust level in mobile phone advertising is still low, it increased 61 percent since 2007 and 21 percent since 2009.
“The growth in trust for online search and display ads over the past four years should give marketers increased confidence in putting more of their ad dollars into this medium,” said Beard. “Many companies are already increasing their paid advertising activity on social networking sites, in part due to the high level of trust consumers place in friends’ recommendations and online opinions.”
In fact, a recent Nielsen analysis of 79 campaigns on Facebook over six months showed that, on average, social ads—those that are served to users who have friends that are fans of or have interacted with the advertised brand and prominently call the relationship out—generate a 55 percent greater lift in ad recall than non-social ads. “This is further evidence that brands should be watching this emerging ad channel closely as it continues to grow,” continued Beard.
To what extent do you trust the following forms of advertising?
Trust Completely/Somewhat
Global AverageDon’t Trust Much/
At All
Source: Nielsen Global Trust in Advertising Survey, Q3 2011
Recommendations from people I know
Consumer opinions posted online
Editorial content such as newspaper articles
Branded Websites
Emails I signed up for
Ads on TV
Brand sponsorships
Ads in magazines
Billboards and other outdoor advertising
Ads in newspapers
Ads on radio
Ads before movies
TV program product placements
Ads served in search engine results
Online video ads
Ads on social networks
Online banner ads
Display ads on mobile devices
Text ads on mobile phones
92%70%58%58%50%47%47%47%47%46%42%41%40%40%36%36%33%33%29%
8%30%42%42%50%53%53%53%53%54%58%59%60%60%64%64%67%67%71%
4 Copyright © 2012 The Nielsen Company.
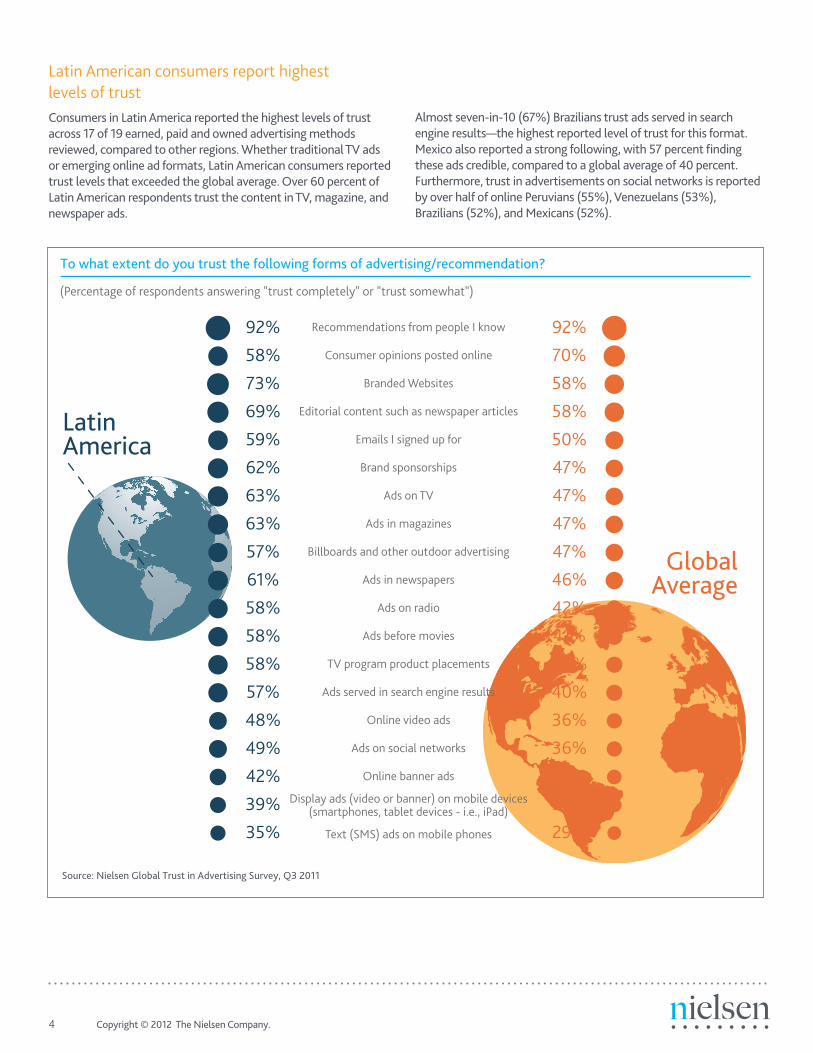
Latin American consumers report highest levels of trust Consumers in Latin America reported the highest levels of trust across 17 of 19 earned, paid and owned advertising methods reviewed, compared to other regions. Whether traditional TV ads or emerging online ad formats, Latin American consumers reported trust levels that exceeded the global average. Over 60 percent of Latin American respondents trust the content in TV, magazine, and newspaper ads.
Almost seven-in-10 (67%) Brazilians trust ads served in search engine results—the highest reported level of trust for this format. Mexico also reported a strong following, with 57 percent finding these ads credible, compared to a global average of 40 percent. Furthermore, trust in advertisements on social networks is reported by over half of online Peruvians (55%), Venezuelans (53%), Brazilians (52%), and Mexicans (52%).
To what extent do you trust the following forms of advertising/recommendation?
LatinAmerica
GlobalAverage
Source: Nielsen Global Trust in Advertising Survey, Q3 2011
Recommendations from people I know
Consumer opinions posted online
Branded Websites
Editorial content such as newspaper articles
Emails I signed up for
Brand sponsorships
Ads on TV
Ads in magazines
Billboards and other outdoor advertising
Ads in newspapers
Ads on radio
Ads before movies
TV program product placements
Ads served in search engine results
Online video ads
Ads on social networks
Online banner ads
Display ads (video or banner) on mobile devices (smartphones, tablet devices - i.e., iPad)
Text (SMS) ads on mobile phones
92%
58%
73%
69%
59%
62%
63%
63%
57%
61%
58%
58%
58%
57%
48%
49%
42%
39%
35%
92%
70%
58%
58%
50%
47%
47%
47%
47%
46%
42%
41%
40%
40%
36%
36%
33%
33%
29%
(Percentage of respondents answering "trust completely" or "trust somewhat")
Copyright © 2012 The Nielsen Company. 5
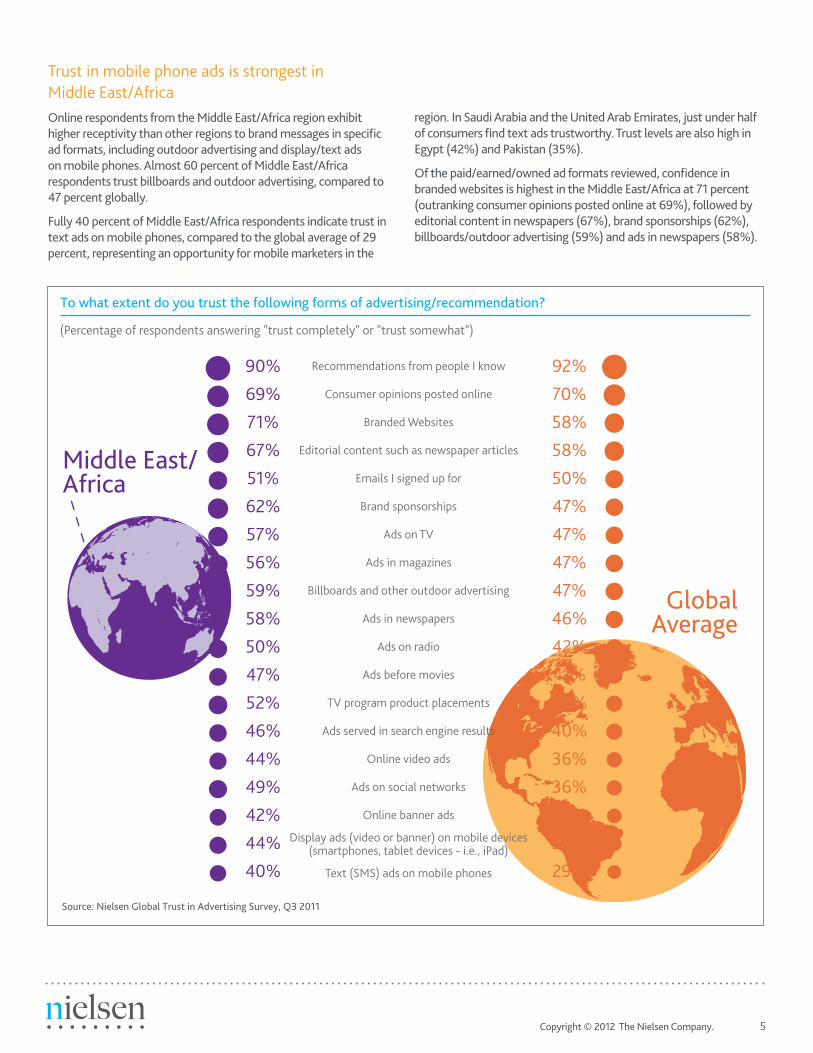
Trust in mobile phone ads is strongest in Middle East/Africa Online respondents from the Middle East/Africa region exhibit higher receptivity than other regions to brand messages in specific ad formats, including outdoor advertising and display/text ads on mobile phones. Almost 60 percent of Middle East/Africa respondents trust billboards and outdoor advertising, compared to 47 percent globally.
Fully 40 percent of Middle East/Africa respondents indicate trust in text ads on mobile phones, compared to the global average of 29 percent, representing an opportunity for mobile marketers in the
region. In Saudi Arabia and the United Arab Emirates, just under half of consumers find text ads trustworthy. Trust levels are also high in Egypt (42%) and Pakistan (35%).
Of the paid/earned/owned ad formats reviewed, confidence in branded websites is highest in the Middle East/Africa at 71 percent (outranking consumer opinions posted online at 69%), followed by editorial content in newspapers (67%), brand sponsorships (62%), billboards/outdoor advertising (59%) and ads in newspapers (58%).
To what extent do you trust the following forms of advertising/recommendation?
Middle East/Africa
GlobalAverage
Source: Nielsen Global Trust in Advertising Survey, Q3 2011
Recommendations from people I know
Consumer opinions posted online
Branded Websites
Editorial content such as newspaper articles
Emails I signed up for
Brand sponsorships
Ads on TV
Ads in magazines
Billboards and other outdoor advertising
Ads in newspapers
Ads on radio
Ads before movies
TV program product placements
Ads served in search engine results
Online video ads
Ads on social networks
Online banner ads
Display ads (video or banner) on mobile devices (smartphones, tablet devices - i.e., iPad)
Text (SMS) ads on mobile phones
90%
69%
71%
67%
51%
62%
57%
56%
59%
58%
50%
47%
52%
46%
44%
49%
42%
44%
40%
92%
70%
58%
58%
50%
47%
47%
47%
47%
46%
42%
41%
40%
40%
36%
36%
33%
33%
29%
(Percentage of respondents answering "trust completely" or "trust somewhat")
6 Copyright © 2012 The Nielsen Company.
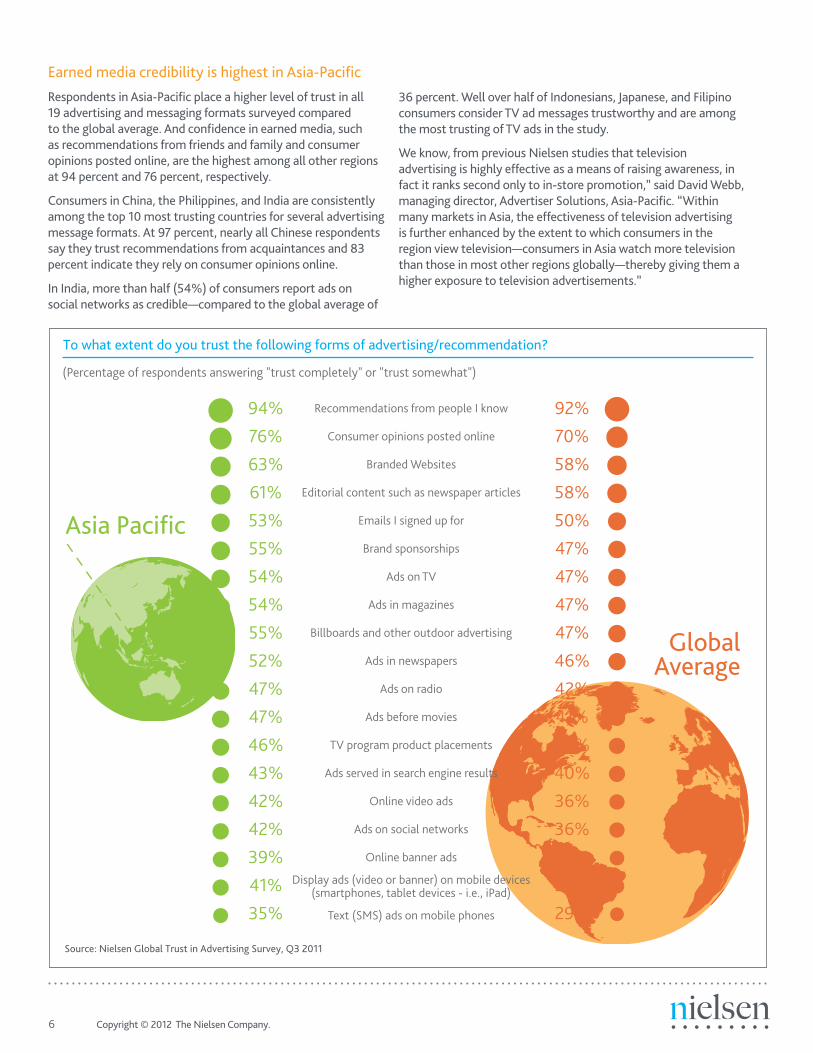
Earned media credibility is highest in Asia-Pacific
Respondents in Asia-Pacific place a higher level of trust in all 19 advertising and messaging formats surveyed compared to the global average. And confidence in earned media, such as recommendations from friends and family and consumer opinions posted online, are the highest among all other regions at 94 percent and 76 percent, respectively.
Consumers in China, the Philippines, and India are consistently among the top 10 most trusting countries for several advertising message formats. At 97 percent, nearly all Chinese respondents say they trust recommendations from acquaintances and 83 percent indicate they rely on consumer opinions online.
In India, more than half (54%) of consumers report ads on social networks as credible—compared to the global average of
36 percent. Well over half of Indonesians, Japanese, and Filipino consumers consider TV ad messages trustworthy and are among the most trusting of TV ads in the study.
We know, from previous Nielsen studies that television advertising is highly effective as a means of raising awareness, in fact it ranks second only to in-store promotion,” said David Webb, managing director, Advertiser Solutions, Asia-Pacific. “Within many markets in Asia, the effectiveness of television advertising is further enhanced by the extent to which consumers in the region view television—consumers in Asia watch more television than those in most other regions globally—thereby giving them a higher exposure to television advertisements.”
To what extent do you trust the following forms of advertising/recommendation?
Asia Pacific
GlobalAverage
Source: Nielsen Global Trust in Advertising Survey, Q3 2011
Recommendations from people I know
Consumer opinions posted online
Branded Websites
Editorial content such as newspaper articles
Emails I signed up for
Brand sponsorships
Ads on TV
Ads in magazines
Billboards and other outdoor advertising
Ads in newspapers
Ads on radio
Ads before movies
TV program product placements
Ads served in search engine results
Online video ads
Ads on social networks
Online banner ads
Display ads (video or banner) on mobile devices (smartphones, tablet devices - i.e., iPad)
Text (SMS) ads on mobile phones
94%
76%
63%
61%
53%
55%
54%
54%
55%
52%
47%
47%
46%
43%
42%
42%
39%
41%
35%
92%
70%
58%
58%
50%
47%
47%
47%
47%
46%
42%
41%
40%
40%
36%
36%
33%
33%
29%
(Percentage of respondents answering "trust completely" or "trust somewhat")
Copyright © 2012 The Nielsen Company. 7
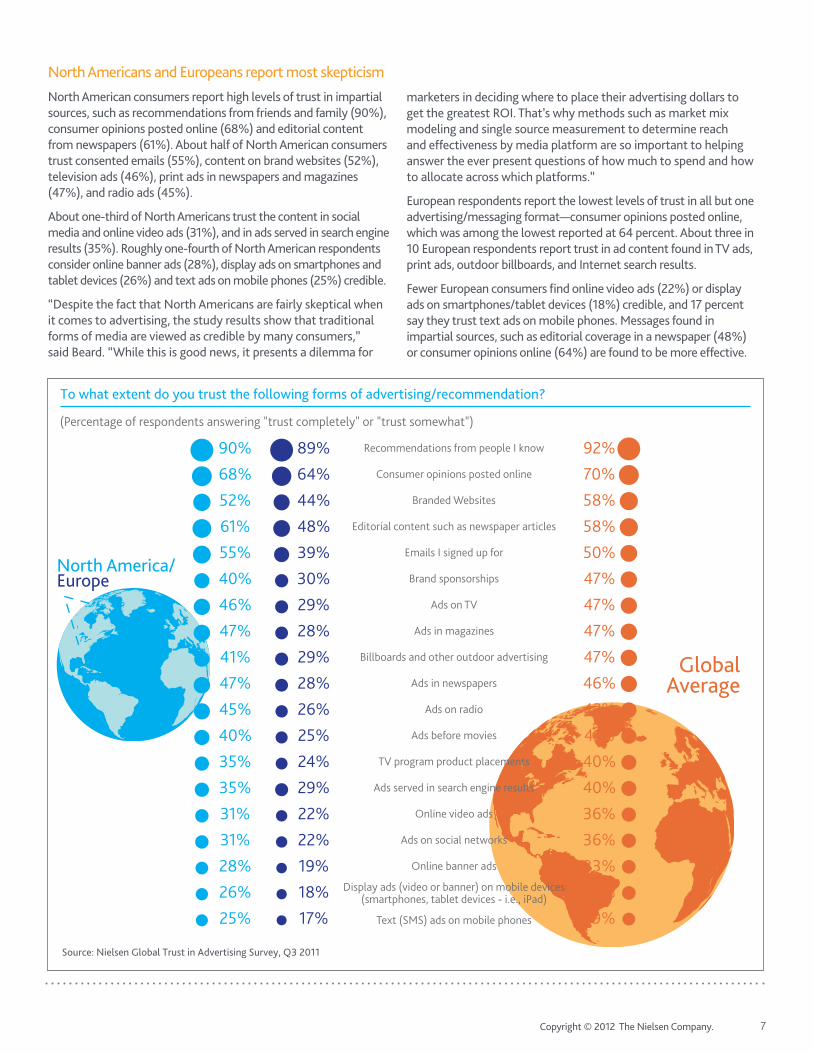
North Americans and Europeans report most skepticism
North American consumers report high levels of trust in impartial sources, such as recommendations from friends and family (90%), consumer opinions posted online (68%) and editorial content from newspapers (61%). About half of North American consumers trust consented emails (55%), content on brand websites (52%), television ads (46%), print ads in newspapers and magazines (47%), and radio ads (45%).
About one-third of North Americans trust the content in social media and online video ads (31%), and in ads served in search engine results (35%). Roughly one-fourth of North American respondents consider online banner ads (28%), display ads on smartphones and tablet devices (26%) and text ads on mobile phones (25%) credible.
“Despite the fact that North Americans are fairly skeptical when it comes to advertising, the study results show that traditional forms of media are viewed as credible by many consumers,” said Beard. “While this is good news, it presents a dilemma for
marketers in deciding where to place their advertising dollars to get the greatest ROI. That’s why methods such as market mix modeling and single source measurement to determine reach and effectiveness by media platform are so important to helping answer the ever present questions of how much to spend and how to allocate across which platforms.”
European respondents report the lowest levels of trust in all but one advertising/messaging format—consumer opinions posted online, which was among the lowest reported at 64 percent. About three in 10 European respondents report trust in ad content found in TV ads, print ads, outdoor billboards, and Internet search results.
Fewer European consumers find online video ads (22%) or display ads on smartphones/tablet devices (18%) credible, and 17 percent say they trust text ads on mobile phones. Messages found in impartial sources, such as editorial coverage in a newspaper (48%) or consumer opinions online (64%) are found to be more effective.
To what extent do you trust the following forms of advertising/recommendation?
Source: Nielsen Global Trust in Advertising Survey, Q3 2011
(Percentage of respondents answering "trust completely" or "trust somewhat")
North America/Europe
GlobalAverage
Recommendations from people I know
Consumer opinions posted online
Branded Websites
Editorial content such as newspaper articles
Emails I signed up for
Brand sponsorships
Ads on TV
Ads in magazines
Billboards and other outdoor advertising
Ads in newspapers
Ads on radio
Ads before movies
TV program product placements
Ads served in search engine results
Online video ads
Ads on social networks
Online banner ads
Display ads (video or banner) on mobile devices (smartphones, tablet devices - i.e., iPad)
Text (SMS) ads on mobile phones
89%
64%
44%
48%
39%
30%
29%
28%
29%
28%
26%
25%
24%
29%
22%
22%
19%
18%
17%
92%
70%
58%
58%
50%
47%
47%
47%
47%
46%
42%
41%
40%
40%
36%
36%
33%
33%
29%
90%
68%
52%
61%
55%
40%
46%
47%
41%
47%
45%
40%
35%
35%
31%
31%
28%
26%
25%
8 Copyright © 2012 The Nielsen Company.
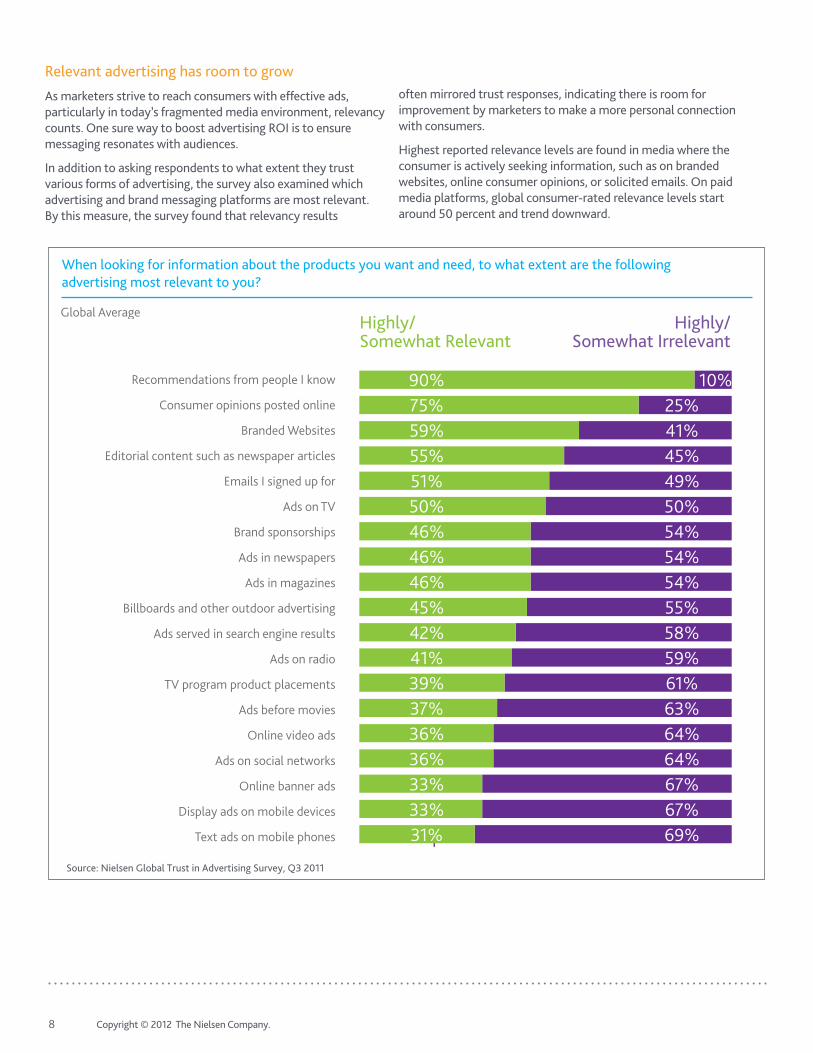
Relevant advertising has room to grow
As marketers strive to reach consumers with effective ads, particularly in today’s fragmented media environment, relevancy counts. One sure way to boost advertising ROI is to ensure messaging resonates with audiences.
In addition to asking respondents to what extent they trust various forms of advertising, the survey also examined which advertising and brand messaging platforms are most relevant. By this measure, the survey found that relevancy results
often mirrored trust responses, indicating there is room for improvement by marketers to make a more personal connection with consumers.
Highest reported relevance levels are found in media where the consumer is actively seeking information, such as on branded websites, online consumer opinions, or solicited emails. On paid media platforms, global consumer-rated relevance levels start around 50 percent and trend downward.
Source: Nielsen Global Trust in Advertising Survey, Q3 2011
Recommendations from people I know
Consumer opinions posted online
Branded Websites
Editorial content such as newspaper articles
Emails I signed up for
Ads on TV
Brand sponsorships
Ads in newspapers
Ads in magazines
Billboards and other outdoor advertising
Ads served in search engine results
Ads on radio
TV program product placements
Ads before movies
Online video ads
Ads on social networks
Online banner ads
Display ads on mobile devices
Text ads on mobile phones
When looking for information about the products you want and need, to what extent are the following advertising most relevant to you?
Highly/Somewhat Irrelevant
Global AverageHighly/Somewhat Relevant
10%25%41%45%49%50%54%54%54%55%58%59%61%63%64%64%67%67%69%
90%75%59%55%51%50%46%46%46%45%42%41%39%37%36%36%33%33%31%
Copyright © 2012 The Nielsen Company. 9
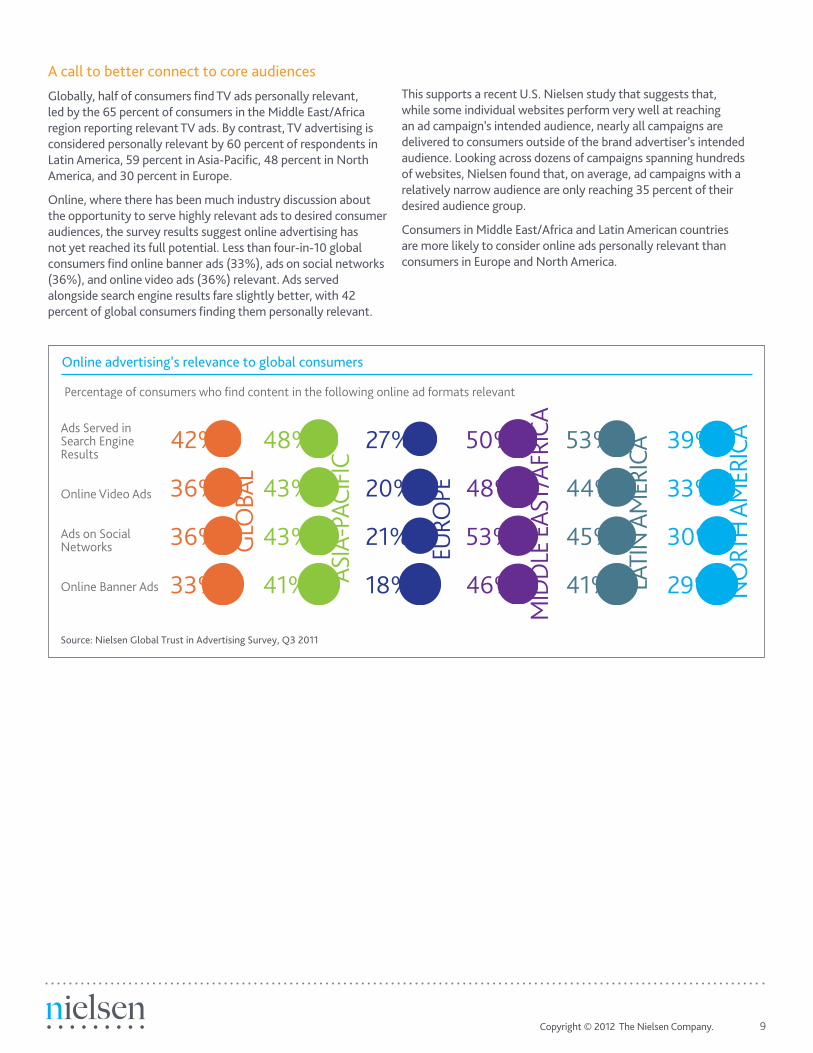
A call to better connect to core audiences
Globally, half of consumers find TV ads personally relevant, led by the 65 percent of consumers in the Middle East/Africa region reporting relevant TV ads. By contrast, TV advertising is considered personally relevant by 60 percent of respondents in Latin America, 59 percent in Asia-Pacific, 48 percent in North America, and 30 percent in Europe.
Online, where there has been much industry discussion about the opportunity to serve highly relevant ads to desired consumer audiences, the survey results suggest online advertising has not yet reached its full potential. Less than four-in-10 global consumers find online banner ads (33%), ads on social networks (36%), and online video ads (36%) relevant. Ads served alongside search engine results fare slightly better, with 42 percent of global consumers finding them personally relevant.
This supports a recent U.S. Nielsen study that suggests that, while some individual websites perform very well at reaching an ad campaign’s intended audience, nearly all campaigns are delivered to consumers outside of the brand advertiser’s intended audience. Looking across dozens of campaigns spanning hundreds of websites, Nielsen found that, on average, ad campaigns with a relatively narrow audience are only reaching 35 percent of their desired audience group.
Consumers in Middle East/Africa and Latin American countries are more likely to consider online ads personally relevant than consumers in Europe and North America.
Online advertising’s relevance to global consumers
Percentage of consumers who find content in the following online ad formats relevant
Source: Nielsen Global Trust in Advertising Survey, Q3 2011
Online Advertising’s Relevance to Global Consumers Percentage of consumers who find content in the following online ad formats relevant…
Global Asia Pacific Europe Middle
East/Africa Latin America
North America
Ads Served in Search Engine Results 42% 48% 27% 50% 53% 39% Online Video Ads 36% 43% 20% 48% 44% 33% Ads on Social Networks 36% 43% 21% 53% 45% 30% Online Banner Ads 33% 41% 18% 46% 41% 29%
Ads Served in Search Engine Results
Online Video Ads
Ads on Social Networks
Online Banner Ads
GLOBAL
42%
36%
36%
33% ASIA-PACIFIC
48%
43%
43%
41%
EUROPE
27%
20%
21%
18%
MID
DLE
EAS
T/AF
RICA50%
48%
53%
46% LATI
N A
MER
ICA
NO
RTH
AM
ERIC
A53%
44%
45%
41%
39%
33%
30%
29%
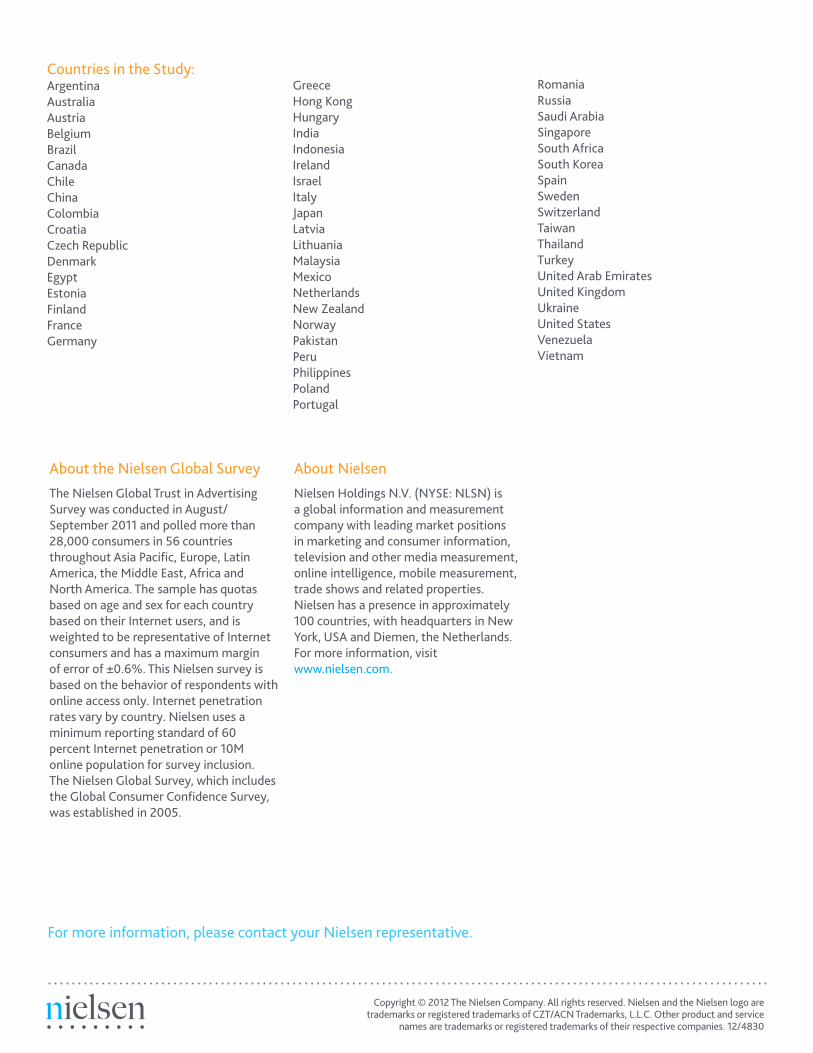
RomaniaRussiaSaudi ArabiaSingaporeSouth AfricaSouth KoreaSpainSwedenSwitzerlandTaiwanThailandTurkeyUnited Arab EmiratesUnited KingdomUkraineUnited StatesVenezuelaVietnam
About Nielsen
Nielsen Holdings N.V. (NYSE: NLSN) is a global information and measurement company with leading market positions in marketing and consumer information, television and other media measurement, online intelligence, mobile measurement, trade shows and related properties. Nielsen has a presence in approximately 100 countries, with headquarters in New York, USA and Diemen, the Netherlands. For more information, visit www.nielsen.com.
For more information, please contact your Nielsen representative.
Copyright © 2012 The Nielsen Company. All rights reserved. Nielsen and the Nielsen logo are trademarks or registered trademarks of CZT/ACN Trademarks, L.L.C. Other product and service
names are trademarks or registered trademarks of their respective companies. 12/4830
Countries in the Study:ArgentinaAustraliaAustriaBelgiumBrazilCanadaChileChinaColombiaCroatiaCzech RepublicDenmarkEgyptEstoniaFinlandFranceGermany
GreeceHong KongHungaryIndiaIndonesiaIrelandIsraelItalyJapanLatviaLithuaniaMalaysiaMexicoNetherlandsNew ZealandNorwayPakistanPeruPhilippinesPolandPortugal
About the Nielsen Global Survey
The Nielsen Global Trust in Advertising Survey was conducted in August/September 2011 and polled more than 28,000 consumers in 56 countries throughout Asia Pacific, Europe, Latin America, the Middle East, Africa and North America. The sample has quotas based on age and sex for each country based on their Internet users, and is weighted to be representative of Internet consumers and has a maximum margin of error of ±0.6%. This Nielsen survey is based on the behavior of respondents with online access only. Internet penetration rates vary by country. Nielsen uses a minimum reporting standard of 60 percent Internet penetration or 10M online population for survey inclusion. The Nielsen Global Survey, which includes the Global Consumer Confidence Survey, was established in 2005.