NIEHS Epi-Stats Workshop: Data Set Code · NIEHS Epi-Stats Workshop: Data Set Code. Table of...
251
NIEHS Epi-Stats Workshop: Data Set Code Table of Contents 1. Combining Visualization Methods with Structural Equation Models for the Analysis Of Chemical Mixture Data........................................................................................................................................... 1 2. A Methodology for Building Bayesian Networks to Evaluate the Health Effects of Environmental Chemical Mixtures .................................................................................................................................. 5 3. A Statistical Framework for Assessing Association Between Health Effects and Combined Exposures 19 4. Bayesian Kernel Machine Regression for Estimating the Health Effects of Multi-Pollutant Mixtures .. 20 5. Cheminformatics Approaches to Analyze the Effects of Environmental Chemical Mixtures ................ 22 6. A Two Step Variable Selection Procedure Using Prioritization of Interactions Followed by Lasso ....... 23 7. Integrating Toxicology and Mechanistic Evidence Into Complex Mixtures Analysis Using a Flexible Bayesian Approach ................................................................................................................................. 29 8. Two-Step Shrinkage-Based Regression Strategy for Assessing Health Effects of Chemical Mixtures in Environmental Epidemiology ................................................................................................................. 37 9. A Two Stage Approach to Analysis of Health Effects of Environmental Chemical Mixtures: Informed Sparse Principal Component Analysis Followed by Segmented Regression .......................................... 54 10. Direct Assessment of Public Health Impacts of Exposure Mixtures: A Bayesian G-Formula Approach 58 11. Do Your Exposures Need Supervision?................................................................................................... 91 12. Principal Component Analysis: An Application for Understanding Health Effects of Environmental Chemical Mixture Exposures .................................................................................................................. 93 13. Interpretation Without Causation: A Data Analysis at the Intersection of Statistics and Epidemiology ................................................................................................................................................................ 109 14. Examining Associations Between Multi Pollutant Exposure Profiles and Health Outcomes via Bayesian Profile Regression.................................................................................................................... 110 15. Analysis of Simulated Data Sets using Conformal Predictions ............................................................... 113 16. Analysis of Chemical Mixture Simulated Data Using Regularized Regression Models .......................... 121 17. Building Models to Assess the Effects of Chemical Mixtures by Estimating Similar Modes of Action ..................................................................................................................................................... 144 18. Application of Principal Component Analysis and Stepwise Regression to Identify the Exposure Variables Associated with Health Outcome and Determine Dose-Response Relationship ................... 151
Transcript of NIEHS Epi-Stats Workshop: Data Set Code · NIEHS Epi-Stats Workshop: Data Set Code. Table of...

NIEHS Epi-Stats Workshop: Data Set Code
Table of Contents 1. Combining Visualization Methods with Structural Equation Models for the Analysis Of Chemical
Mixture Data ........................................................................................................................................... 1
2. A Methodology for Building Bayesian Networks to Evaluate the Health Effects of Environmental
Chemical Mixtures .................................................................................................................................. 5
3. A Statistical Framework for Assessing Association Between Health Effects and Combined Exposures 19
4. Bayesian Kernel Machine Regression for Estimating the Health Effects of Multi-Pollutant Mixtures .. 20
5. Cheminformatics Approaches to Analyze the Effects of Environmental Chemical Mixtures ................ 22
6. A Two Step Variable Selection Procedure Using Prioritization of Interactions Followed by Lasso ....... 23
7. Integrating Toxicology and Mechanistic Evidence Into Complex Mixtures Analysis Using a Flexible
Bayesian Approach ................................................................................................................................. 29
8. Two-Step Shrinkage-Based Regression Strategy for Assessing Health Effects of Chemical Mixtures in
Environmental Epidemiology ................................................................................................................. 37
9. A Two Stage Approach to Analysis of Health Effects of Environmental Chemical Mixtures: Informed
Sparse Principal Component Analysis Followed by Segmented Regression .......................................... 54
10. Direct Assessment of Public Health Impacts of Exposure Mixtures: A Bayesian G-Formula Approach 58
11. Do Your Exposures Need Supervision?................................................................................................... 91
12. Principal Component Analysis: An Application for Understanding Health Effects of Environmental
Chemical Mixture Exposures .................................................................................................................. 93
13. Interpretation Without Causation: A Data Analysis at the Intersection of Statistics and Epidemiology
................................................................................................................................................................ 109
14. Examining Associations Between Multi Pollutant Exposure Profiles and Health Outcomes via
Bayesian Profile Regression .................................................................................................................... 110
15. Analysis of Simulated Data Sets using Conformal Predictions ............................................................... 113
16. Analysis of Chemical Mixture Simulated Data Using Regularized Regression Models .......................... 121
17. Building Models to Assess the Effects of Chemical Mixtures by Estimating Similar Modes of
Action ..................................................................................................................................................... 144
18. Application of Principal Component Analysis and Stepwise Regression to Identify the Exposure
Variables Associated with Health Outcome and Determine Dose-Response Relationship ................... 151

19. Identifying the Relative Importance of Multiple Correlated Exposures in Predicting a Continuous
Outcome Using the Random Forest Ensemble Learning Method .......................................................... 154
20. Improving Prediction Models by Adding Interaction Terms Using a Feasible Solution Algorithm ........ 155
21. Factor Mixture Models for Assessing Health Effects of Environmental Chemical Mixtures: An
Application Using Simulated Data Sets .................................................................................................. 156
22. Dimension Reduction for Chemical Exposure Risk Assessment ............................................................. 159
23. Set-based Interaction Tests for High-Dimensional Environmental Exposome Data .............................. 170
24. Analyzing Mixtures in Epidemiology Data by Smoothing in Exposure Space......................................... 194
25. Variable Selection and Multivariate Adaptive Spline Assessments to Investigate Effects of Chemical
Mixtures in a Prospective Cohort Study of Mother-Child Pairs ............................................................. 203
26. Bayesian Non-Parametric Regression for Multi-Pollutant Mixtures ...................................................... 205
27. Modeling Environmental Chemical Mixtures with Weighted Quantile Sum Regression ....................... 212
28. Assessing Health Associations with Environmental Chemical Mixtures using Lasso and its
Generalizations ....................................................................................................................................... 213
29. Assessing the Impact of Environmental Mixtures on Children’s Neurodevelopment ........................... 218
30. Analysis of the First Simulated Dataset using Nonlinear and Weighted Quantile Sum (WQS)
Regression .............................................................................................................................................. 226
31. Bayesian Methods for Assessing Health Effects of Chemical Mixtures ................................................. 239
32. Assessing Health Effects of Environmental Chemical Mixtures Using Stepwise Multiple Linear
Regression .............................................................................................................................................. 240
33. Traditional Epidemiological Approaches to Analyze Chemical Mixtures and Human Health ................ 249

1. Combining Visualization Methods with Structural Equation Models for
the Analysis Of Chemical Mixture DataPresenting Author: Sophia Banton
Organization: Emory University
Contributing Authors: Sophia A. Banton1, 2, Ruiyan Luo2, Shuzhao Li1 1Department of Medicine, Emory University, Atlanta, GA 2School of Public Health, Georgia State University, Atlanta GA
Code:
#Read in the SAS data set #Using library sas7bdat # in R library(sas7bdat) my.real.data <- read.sas7bdat("data_05182015.sas7bdat") write.table(my.real.data, file = paste(dir, sep = "","my.real.data.txt"),sep = "\t")
#ASSESS NORMALITY library ("MVN")
mydata <- (read.table ( paste(dir, sep = "","/my.real.data.txt"), stringsAsFactors = FALSE,fill = TRUE,header = TRUE,check.names = F,sep = "\t")) rownames (mydata) <- mydata$id MDI <- mydata[,6] my.predictors <- log2(mydata[,7:28]) my.data <- cbind (MDI,my.predictors)
uniPlot (my.data) uniPlot (my.data, type = "histogram")
my.new.data <- cbind (MDI, mydata[,1:5], my.predictors) rownames (my.new.data) <- mydata$id write.table(my.new.data, file = paste(dir, sep = "","transformed.real.data.txt"),sep = "\t", row.names = T, col.name=T)
#CORRELATION #MATRIX library (corrplot) cor.matrix <- cor (my.new.data, method = "spearman")
corrplot(cor.matrix, method="circle", order = "hclust", addrect =10, tl.pos = "l", tl.col = "black", p.mat = res2[[1]],insig = "blank", sig.level = 0.05
1

)
#Combine w/ sifnificant test cor.mtest <- function(mat, conf.level = 0.99) { mat <- as.matrix(mat) n <- ncol(mat)
p.mat <- lowCI.mat <- uppCI.mat <- matrix(NA, n, n) diag(p.mat) <- 0 diag(lowCI.mat) <- diag(uppCI.mat) <- 1 for (i in 1:(n - 1)) { for (j in (i + 1):n) {
tmp <- cor.test(mat[, i], mat[, j], conf.level = conf.level) p.mat[i, j] <- p.mat[j, i] <- tmp$p.value
lowCI.mat[i, j] <- lowCI.mat[j, i] <- tmp$conf.int[1] uppCI.mat[i, j] <- uppCI.mat[j, i] <- tmp$conf.int[2]
} } return(list(p.mat, lowCI.mat, uppCI.mat)) }
res1 <- cor.mtest(cor.matrix, 0.95) res2 <- cor.mtest(cor.matrix, 0.99)
#NETWORK PLOTS library (igraph) cor.matrix <- cor (my.new.data, method = "spearman") t = which(cor.matrix > 0.6 & lower.tri(cor.matrix),arr.ind=TRUE) t = which(abs(cor.matrix) > 0.19 & lower.tri(cor.matrix),arr.ind=TRUE) t.graph=graph.data.frame(t, directed=F)
E(t.graph)$color = ifelse(cor.matrix[t] > abs(0.8),'darkblue','gray') E(t.graph)$width = ifelse(cor.matrix[t] > abs(0.6),3, 1) V(t.graph)$color = "SkyBlue2" V(t.graph)$size=degree(t.graph)*10 t.names <- colnames(cor.matrix)[as.numeric(V(t.graph)$name)]
plot(t.graph, vertex.shape="circle", vertex.label.color="black", layout = layout.fruchterman.reingold, vertex.size = 20, edge.arrow.size = 0.9, #edge.color = "black", vertex.label=t.names, vertex.frame.color = "white", #edge.width = 1, vertex.label.cex= 1.25
)
### CONFOUNDER DETECTION with hierarchical clustering and heat maps library (ggplot2) library (made4)
2
#Test for assocation confounders (Z1-Z5) mydata <- (read.table ( paste(dir, sep = "","/data.sorted.by.CHILD.SEX.txt"), stringsAsFactors = FALSE,fill = TRUE,header = TRUE,check.names = F,sep = "\t")) temp <- colnames (mydata) my.col.names <- temp[2:ncol(mydata)] rownames (mydata) <- mydata [,1] mydata <- mydata[-1]
#drop id row mydata <- mydata[-1,]
heatplot (mydata, cols.default = T, dend = "both", scale = "row", classvec = my.col.names, classvecCol=c("darkblue", "red"), #labCol = my.col.names, #labRow = "", keysize = 0.75, margins = c(10,15), cexRow = 1.25, cexCol = 1.0
)
###STRUCTURAL EQUATION MODELING #PATH ANALYSIS library (lavaan)
mydata <- (read.table ( paste(dir, sep = "","/transformed.real.data.txt"), stringsAsFactors = FALSE,fill = TRUE,header = TRUE,check.names = F,sep = "\t")) rownames (mydata) <- mydata$id
myModel <- 'MDI ~ mom_educ + mom_race
mom_educ ~ mom_smoke mom_race ~ mom_age
# Age is a hub mom_age ~ lip_PBDE_47 + lip_pcb194 + lip_pcb74 + child_sex
lip_PBDE_47 ~ lip_PBDE_99 + lip_PBDE_100 + lip_PBDE_153 lip_pcb194 ~ lip_pcb199 + lip_pcb196_203 lip_pcb74 ~ lip_pcb118 + lip_pcb99 + lip_nonachlor lip_nonachlor ~ lip_oxychlor lip_oxychlor ~ lip_hcb
lip_pcb99 ~ lip_pcb105 + lip_pcb180 + lip_pcb153 lip_pcb153 ~ lip_pcb170 + lip_pcb138_158 + lip_pp_dde lip_pcb138_158 ~ lip_pcb156 + lip_pcb187 + lip_pcb146
' myfit <- sem(myModel, data = mydata) summary(myfit, fit.measures = TRUE)
3

#PLOT SEM library (semPlot)
mydata <- (read.table ( paste(dir, sep = "","sem_plot_data.txt"), stringsAsFactors = FALSE,fill = TRUE,header = TRUE,check.names = F,sep = "\t")) dim (mydata) str (mydata)
res1 <- lm (MDI ~ educ + race, data = mydata) res2 <- lm (educ ~ smoke, data = mydata) res3 <- lm (race ~ age , data = mydata) res4 <- lm (age ~ PBDE47 + pcb194 + pcb74 + sex , data = mydata) res5 <- lm (PBDE47 ~ PBDE99 + PBDE100 + PBDE153, , data = mydata) res6 <- lm (pcb194 ~ pcb199 + pcb196_203 , data = mydata) res7 <- lm (pcb74 ~ pcb118 + pcb99 + nonachlor, data = mydata) res8 <- lm (nonachlor ~ oxychlor , data = mydata) res9 <- lm (oxychlor ~ hcb , data = mydata) res10 <- lm (pcb99 ~ pcb105 + pcb180 + pcb153 , data = mydata) res11 <- lm (pcb153 ~ pcb170 + pcb138_158 + dde , data = mydata) res12 <- lm (pcb138_158 ~ pcb156 + pcb187 + pcb146 , data = mydata)
semPaths(res1 + res2 + res3 + res4 + res5 + res6 + res7 + res8 + res9 + res10 + res11 + res12, "est", "hide", shapeMan = "square", layout = "tree", color = "Skyblue2", negCol = "red", cut = 0.6, posCol = "darkblue", edge.label.cex = .01, label.cex = .1, intercepts=FALSE, sizeMan = 5, allVars = FALSE
)
4

2. A Methodology for Building Bayesian Networks to Evaluate the Health
Effects of Environmental Chemical MixturesPresenting Author: Sarah Kreidler
Organization: Neptune and Company
Contributing Authors: Sarah M. Kreidler, Ph.D., D.P.T., Tom Stockton, Ph.D., Paul K. Black, Ph.D.,
Stephen M. Beaulieu, MSPH
Code:
Common.R
#
# Project: NIEHS proposal for Workshop: Statistical Approaches for Assessing Health Effects of
# Environmental Chemical Mixtures in Epidemiology Studies
#
# http://tools.niehs.nih.gov/conference/dert_epidemiology_2014/index.cfm#Goals
#
if (Sys.info()[1] == "Windows") {
# input directory for data sets, including raw and manually edited data
IN_DATA_DIR <- "..\\datasets"
# output directory for data sets, which are produced during data analysis
OUT_DATA_DIR <- "..\\datasets"
# output directory for figures
OUT_FIGURES_DIR <- "..\\figures"
# output directory for tables
OUT_TABLES_DIR <- "..\\tables"
# output directory for automated reports, logs, and listings
OUT_REPORT_DIR <- "..\\reports"
# filename separator
FILE_SEP = "\\"
} else {
# input directory for data sets, including raw and manually edited data
IN_DATA_DIR <- "../datasets"
# output directory for data sets, which are produced during data analysis
OUT_DATA_DIR <- "../datasets"
# output directory for figures
OUT_FIGURES_DIR <- "../figures"
# output directory for tables
OUT_TABLES_DIR <- "../tables"
# output directory for automated reports, logs, and listings
OUT_REPORT_DIR <- "../reports"
# filename separator
FILE_SEP = "/"
}
#
5

# Convenience wrapper around paste for input data files
#
inDataFile <- function(filename) {
return (paste(c(IN_DATA_DIR,FILE_SEP,filename), collapse=""))
}
#
# Convenience wrapper around paste for output data files
#
outDataFile <- function(filename) {
return (paste(c(OUT_DATA_DIR,FILE_SEP,filename), collapse=""))
}
#
# Convenience wrapper around paste for output data files
#
outFigure <- function(filename) {
return (paste(c(OUT_FIGURES_DIR,FILE_SEP,filename), collapse=""))
}
#
# Convenience wrapper around paste for output tables
#
outTable <- function(filename) {
return (paste(c(OUT_TABLES_DIR,FILE_SEP,filename), collapse=""))
}
readData.R
library(XLConnect)
# set up common directories - !! set working dir to 'src' directory!!
source("common.R")
#--------------------
# load the data sets
#--------------------
# load simulated data set 1
# File: "DataSet1.xls"
data1 <- readWorksheetFromFile(inDataFile("DataSet1.xls"), sheet=1, header=TRUE)
# Z is binary, so make it into a factor
data1$Z_factor <- factor(data1$Z)
# log transformed exposures
# (since these are likely concentrations and are non-normal)
data1$log_X1 <- log(data1$X1)
data1$log_X2 <- log(data1$X2)
data1$log_X3 <- log(data1$X3)
data1$log_X4 <- log(data1$X4)
data1$log_X5 <- log(data1$X5)
data1$log_X6 <- log(data1$X6)
data1$log_X7 <- log(data1$X7)
# drop the observation number since it is not needed for this analysis
data1 <- data1[,-1]
# load simulated data set 2
# Original file: "DataSet2.xls"
#
# Note, predictors are quite normal, so we don't transform as in data set 1
6

data2 <- readWorksheetFromFile(inDataFile("DataSet2.xls"), sheet=1, header=TRUE)
data2$z3_factor <- factor(data2$z3)
# drop the observation number
data2 <- data2[,-1]
# load real world data set
# Original file: "data_05182015.csv"
#
# Note, predictors are quite normal, so we don't transform as in data set 1
dataRealWorld <- read.csv(inDataFile("data_05182015.csv"), header=TRUE)
# fix some types so we can use the data with bnlearn
dataRealWorld$child_sex = as.factor(dataRealWorld$child_sex)
dataRealWorld$mom_educ = as.factor(dataRealWorld$mom_educ)
dataRealWorld$mom_age = as.factor(dataRealWorld$mom_age)
dataRealWorld$mom_race = as.factor(dataRealWorld$mom_race)
dataRealWorld$mom_smoke = as.factor(dataRealWorld$mom_smoke)
dataRealWorld$mdi = as.numeric(dataRealWorld$mdi)
# drop the observation number
dataRealWorld <- dataRealWorld[,-ncol(dataRealWorld)]
#--------------------------
# save as Rdata files
#--------------------------
save(data1, file=outDataFile("DataSet1.Rdata"))
save(data2, file=outDataFile("DataSet2.Rdata"))
save(dataRealWorld, file=outDataFile("RealWorldData.Rdata"))
analysis.R
#
# NIEHS environmental mixtures
#
#
# Goals:
# 1. Which exposures contribute to the outcome? Are there any that do not? (Qualitative)
# 2. Which exposures contribute to the outcome and by how much? (Quantitative)
# 3. Is there evidence of "interaction" or not? Be explicit with your definition of interaction
# (toxicologists, epidemiologists and biostatisticians tend to think about this quite
differently).
# 4. What is the effect of joint exposure to the mixture? (Qualitative)
# 5. What is the joint dose-response function? For example, if you can describe Y as a function
of
# the exposures, what is your estimate of the function Y=f(X1,…,Xp)? (Quantitative)
# 6. Provide metrics for your answer. For example, consider adjusted r square or root mean square
error, etc.
# 7. Analysts may also provide a description of the joint distribution of the exposure data.
#
library(pcalg)
library(MASS)
library(Rgraphviz)
library(corrgram)
library(bnlearn)
library(gbm)
library(gRain)
library(forecast)
library(MethComp)
library(gRbase)
library(caret)
7

options(scipen=10)
#
# set up common directories - !! set working dir to src directory !!
#
source("common.R")
# set the p-value threshold for keeping an edge in the DAG
includeThreshold <- 0.1
# This panel combines edits the "shade" panel from the package
# to overlay the correlation value as requested
panel.shadeNtext <- function (x, y, corr = NULL, col.regions, ...)
{
if (is.null(corr))
corr <- cor(x, y, use = "pair")
ncol <- 14
pal <- col.regions(ncol)
col.ind <- as.numeric(cut(corr, breaks = seq(from = -1, to = 1,
length = ncol + 1), include.lowest = TRUE))
usr <- par("usr")
rect(usr[1], usr[3], usr[2], usr[4], col = pal[col.ind],
border = NA)
if (corr > 0.4) {
box(col="green")
} else {
box(col = "lightgray")
}
on.exit(par(usr))
par(usr = c(0, 1, 0, 1))
r <- formatC(corr, digits = 2, format = "f")
cex.cor <- .8/strwidth("-X.xx")
text(0.5, 0.5, r, cex = cex.cor)
}
#
# Conveience wrapper to overlay a normal curve
# on a histogram
#
histNormPlot <- function(g, main="Histogram") {
h<-hist(g, breaks=10, density=10, col="lightgray", xlab="Accuracy", main=main)
xfit<-seq(min(g),max(g),length=40)
yfit<-dnorm(xfit,mean=mean(g),sd=sd(g))
yfit <- yfit*diff(h$mids[1:2])*length(g)
lines(xfit, yfit, col="black", lwd=2)
}
#----------------------------------------------------------------------
# Data Set 1
#----------------------------------------------------------------------
# load the data set
load(outDataFile("DataSet1.Rdata"))
#
# Create the starting DAG based on scientific assumptions
#
# classify our variables as covariates, exposures or outcomes
covariates <- names(data1)[9]
outcome = names(data1)[1]
exposuresRaw <- names(data1)[2:8]
exposures <- unlist(lapply(exposuresRaw, function(e) { return(sprintf("log_%s",e))}))
8

#exposures <- exposuresRaw
set.seed(1456)
folds <- createFolds(data1$Y, k = 5, list = TRUE, returnTrain = TRUE)
fold = folds$Fold1 # later - full k-fold CV
data1.train = data1[fold,]
data1.test = data1[-fold,]
# create empty blacklist and whitelist
blacklist = data.frame(from=character(0), to=character(0))
whitelist = data.frame(from=character(0), to=character(0))
#
# Preliminary EDA
#
# look at correlations
pairs(~Y+log_X1+log_X2+log_X3+log_X4+log_X5+log_X6+log_X7+Z, data=data1.train,
main="Data set 1: pairwise plots")
corrgram(data1.train, order=FALSE, lower.panel=panel.shadeNtext,
upper.panel=NULL, text.panel=panel.txt,
main="Dataset 1: Correlations")
# run spearman correlations with Z since binary
corList <- sapply(1:7, function(x) {
varname <- sprintf("log_X%d", x)
spearmanCor <- cor(data1.train$Z, data1.train[,varname], method="spearman")
return(list(varname, spearmanCor))
#print(spearmaneCor)
})
#-----------------------------------
# Build starting DAG for data set 1
#-----------------------------------
#
# Assumptions:
#
# Y = outcome data, 1 continuous variable
# X1 - X7= exposure data, 7 continuous variables
# Z: potential confounder, binary
# initial potential DAG
#
# We use the log transformed Xi's due to lack of normality
#
nodes <- c(covariates,outcome,exposures)
dag1 <- new("graphNEL", nodes=nodes, edgemode="directed")
for(covar in covariates) {
dag1 <- addEdge(covar, outcome, dag1, 1)
for(exposure in exposures) {
dag1 <- addEdge(covar, exposure, dag1, 1)
}
}
for(exposure in exposures) {
dag1 <- addEdge(exposure, outcome, dag1, 1)
}
plot(dag1)
#--------------------
# EDA, dataset 1
#--------------------
#### Assess confounding
# check if Z is associated with Xi's
for(covar in covariates) {
9
for(exposure in exposures) {
fit <- lm(sprintf("%s ~ %s", exposure, covar), data=data1.train)
pval <- as.numeric(summary(fit)$coefficients[2,4])
if (pval > includeThreshold) {
print(sprintf("No association of %s with %s: p=%f", covar, exposure, pval))
dag1 <- removeEdge(covar, exposure, dag1)
blacklist <- rbind(blacklist, data.frame(from=c(covar), to=c(exposure)))
} else {
whitelist <- rbind(whitelist, data.frame(from=c(covar), to=c(exposure)))
}
}
# check association with outcome
fit <- lm(sprintf("%s ~ %s", outcome, covar), data=data1.train)
pval <- as.numeric(summary(fit)$coefficients[2,4])
if (pval > includeThreshold) {
print(sprintf("No association of %s with %s: p=%f", covar, outcome, pval))
dag1 <- removeEdge(covar, outcome, dag1)
blacklist <- rbind(blacklist, data.frame(from=c(covar), to=c(exposure)))
} else {
whitelist <- rbind(whitelist, data.frame(from=c(covar), to=c(exposure)))
}
}
#
# Check if exposures are associated with the outcome, controlling for
# covariates
#
for(exposure in exposures) {
# determine covariate list
inEdgeList <- unlist(inEdges(dag1)[exposure])
exposureCovar <- intersect(covariates,inEdgeList)
if (length(exposureCovar) > 0) {
fit <- lm(sprintf("Y ~ %s + %s", exposure, paste(exposureCovar, collapse=" + ")),
data=data1.train)
} else {
fit <- lm(sprintf("Y ~ %s", exposure), data=data1.train)
}
pval <- as.numeric(summary(fit)$coefficients[2,4])
if (pval > includeThreshold) {
print(sprintf("No association of %s with mdi (controlling for %s): p=%f", exposure,
paste(exposureCovar, collapse=", "), pval))
dag1 <- removeEdge(exposure, "Y", dag1)
blacklist <- rbind(blacklist, data.frame(from=c(exposure), to=c("Y")))
} else {
whitelist <- rbind(whitelist, data.frame(from=c(exposure), to=c("Y")))
}
}
plot(dag1)
#------------------------
# Data set 1: run Bayes net
#------------------------
# estimate the parameters
bn1 <- as.bn(dag1)
fit = bn.fit(bn1, data1.train[,c(covariates,outcome,exposures)])
# see how we did
pred = predict(fit$Y, data1.test) # predicts the value of node C given test set
10

predData = data.frame(pred=pred, actual=data1.test[, "Y"]) # compare the actual and
predicted
accuracy(f = pred, x = data1.test[, "Y"])
BlandAltman(pred, data1.test$Y)
#----------------------------------------------------------------------
# Data Set 2
#----------------------------------------------------------------------
load(outDataFile("DataSet2.Rdata"))
# prelimary EDA
histNormPlot(data2$y)
histNormPlot(data2$x1)
histNormPlot(data2$x2)
histNormPlot(data2$x3)
histNormPlot(data2$x4)
histNormPlot(data2$x5)
histNormPlot(data2$x6)
histNormPlot(data2$x7)
histNormPlot(data2$x8)
histNormPlot(data2$x9)
histNormPlot(data2$x10)
histNormPlot(data2$x11)
histNormPlot(data2$x12)
histNormPlot(data2$x13)
histNormPlot(data2$x14)
pairs(data2.train)
corrgram(data2.train, order=FALSE, lower.panel=panel.shadeNtext,
upper.panel=NULL, text.panel=panel.txt,
main="Dataset 2: Correlations")
# classify our variables as covariates, exposures or outcomes
covariates <- names(data2)[16:18]
outcome = names(data2)[1]
exposuresRaw <- names(data2)[2:15]
#exposures <- unlist(lapply(exposuresRaw, function(e) { return(sprintf("log_%s",e))}))
# exposures were quite normal in data2, so no need to use log transformed
exposures <- exposuresRaw
set.seed(15732)
folds <- createFolds(data2$y, k = 5, list = TRUE, returnTrain = TRUE)
# create empty blacklist and whitelist
blacklist = data.frame(from=character(0), to=character(0))
whitelist = data.frame(from=character(0), to=character(0))
## the z3's are in order, so make sure we get some of each in the training set
fold <- folds$Fold1
data2.train <- data2[fold,]
data2.test <- data2[-fold,]
#-----------------------------------
# Build starting DAG for data set 2
#-----------------------------------
# note, we add removed edges to the blacklist as we go
#
# Assumptions:
#
# Y = The outcome, a continuous variable.
11

# X1 - X14 = Fourteen exposure biomarkers. Each is a continuous variable.
# Z1-Z2: Potential confounders that are continuous.
# Z3: A potential confounder that is binary.
#
nodes <- c(covariates,outcome,exposures)
dag2 <- new("graphNEL", nodes=nodes, edgemode="directed")
for(covar in covariates) {
dag2 <- addEdge(covar, outcome, dag2, 1)
for(exposure in exposures) {
dag2 <- addEdge(covar, exposure, dag2, 1)
}
}
for(i in 1:length(exposures)) {
dag2 <- addEdge(exposures[i], outcome, dag2, 1)
if (i < length(exposures)) {
for(j in (i+1):length(exposures)) {
dag2 <- addEdge(exposures[i], exposures[j], dag2, 1)
dag2 <- addEdge(exposures[j], exposures[i], dag2, 1)
}
}
}
plot(dag2)
# assess confounding
# check if Z is associated with Xi's
for(covar in covariates) {
for(exposure in exposures) {
fit <- lm(sprintf("%s ~ %s", exposure, covar), data=data2.train)
pval <- as.numeric(summary(fit)$coefficients[2,4])
if (pval > includeThreshold) {
print(sprintf("No association of %s with %s: p=%f", covar, exposure, pval))
dag2 <- removeEdge(covar, exposure, dag2)
blacklist <- rbind(blacklist, data.frame(from=c(covar), to=c(exposure)))
} else {
whitelist <- rbind(whitelist, data.frame(from=c(covar), to=c(exposure)))
}
}
# check association with outcome
fit <- lm(sprintf("%s ~ %s", outcome, covar), data=data2.train)
pval <- as.numeric(summary(fit)$coefficients[2,4])
if (pval > includeThreshold) {
print(sprintf("No association of %s with %s: p=%f", covar, outcome, pval))
dag2 <- removeEdge(covar, outcome, dag2)
blacklist <- rbind(blacklist, data.frame(from=c(covar), to=c(exposure)))
} else {
whitelist <- rbind(whitelist, data.frame(from=c(covar), to=c(exposure)))
}
}
plot(dag2)
#
# Remove connections between exposures
#
for(i in 1:length(exposures)) {
if (i < length(exposures)) {
for(j in (i+1):length(exposures)) {
exp1 = exposures[i]
exp2 = exposures[j]
fit <- lm(sprintf("%s ~ %s", exp1, exp2), data=data2.train)
pval <- as.numeric(summary(fit)$coefficients[2,4])
if (pval > includeThreshold) {
12

print(sprintf("No association of %s with %s: p=%f", exp1, exp2, pval))
dag2 <- removeEdge(exp1, exp2, dag2)
dag2 <- removeEdge(exp2, exp1, dag2)
blacklist <- rbind(blacklist, data.frame(from=c(exp1,exp2), to=c(exp2,exp1)))
}
}
}
}
plot(dag2)
#
# Remove connections between exposures and outcome
# while controlling for covariates
#
for(exposure in exposures) {
# determine covariate list
inEdgeList <- unlist(inEdges(dag2)[exposure])
exposureCovar <- intersect(covariates,inEdgeList)
if (length(exposureCovar) > 0) {
fit <- lm(sprintf("y ~ %s + %s", exposure, paste(exposureCovar, collapse=" + ")),
data=data2.train)
} else {
fit <- lm(sprintf("y ~ %s", exposure), data=data2.train)
}
pval <- as.numeric(summary(fit)$coefficients[2,4])
if (pval > includeThreshold) {
print(sprintf("No association of %s with mdi (controlling for %s): p=%f", exposure,
paste(exposureCovar, collapse=", "), pval))
dag2 <- removeEdge(exposure, "y", dag2)
blacklist <- rbind(blacklist, data.frame(from=c(exposure), to=c("y")))
} else {
whitelist <- rbind(whitelist, data.frame(from=c(exposure), to=c("y")))
}
}
plot(dag2)
#-------------------
# Data set 2: gradient boosting - !!Not using this right now!!
#------------------
y.gbm = gbm(y~.,data=data2.train,n.trees=5000,interaction.depth=5)
summary(y.gbm)
x1.gbm = gbm(x1~.,data=data2.train,n.trees=5000,interaction.depth=5)
summary(x1.gbm)
x2.gbm = gbm(x2~.,data=data2.train,n.trees=5000,interaction.depth=5)
summary(x2.gbm)
x3.gbm = gbm(x3~.,data=data2.train,n.trees=5000,interaction.depth=5)
summary(x3.gbm)
# Now use a bayesian learning approach to reduce the edges
# between the xi's
hcDag2 = hc(data2.train[,c(covariates,outcome,exposures)],
whitelist=whitelist, blacklist=blacklist)
plot(as.graphNEL(hcDag2))
13

#----------------------
# Data set 2: Bayes net
#----------------------
#res2 = hc(data2.train, blacklist=blacklist)
fit = bn.fit(hcDag2, data2.train[,c(covariates,outcome,exposures)])
# see how we did
pred2 = predict(fit$y, data2.test) # predicts the value of node C given test set
pred2Data <- data.frame(pred=pred2, actual=data2.test[, "y"]) # compare the actual and
predicted
accuracy(f = pred2, x = data2.test[, "y"])
BlandAltman(pred2, data2.test$y)
plot(pred2Data$actual, pred2Data$pred)
plot(pred2Data$actual, pred2Data$pred - pred2Data$actual)
#------------------------------------------
#
# Real World Data Set
#
#------------------------------------------
# histograms
runHistograms <- function(data) {
table(data$child_sex)
table(data$mom_educ)
table(data$mom_age)
table(data$mom_race)
table(data$mom_smoke)
histNormPlot(data$mdi, main="MDI")
histNormPlot(data$lip_PBDE_47, main="lip_PBDE_47")
histNormPlot(data$lip_PBDE_99, main="lip_PBDE_99")
histNormPlot(data$lip_PBDE_100, main="lip_PBDE_100")
histNormPlot(data$lip_PBDE_153, main="lip_PBDE_153")
histNormPlot(data$lip_hcb, main="lip_hcb")
histNormPlot(data$lip_pp_dde, main="lip_pp_dde")
histNormPlot(data$lip_oxychlor, main="lip_oxychlor")
histNormPlot(data$lip_nonachlor, main="lip_nonachlor")
histNormPlot(data$lip_pcb74, main="lip_pcb74")
histNormPlot(data$lip_pcb99, main="lip_pcb99")
histNormPlot(data$lip_pcb105, main="lip_pcb105")
histNormPlot(data$lip_pcb118, main="lip_pcb118")
histNormPlot(data$lip_pcb146, main="lip_pcb146")
histNormPlot(data$lip_pcb153, main="lip_pcb153")
histNormPlot(data$lip_pcb156, main="lip_pcb156")
histNormPlot(data$lip_pcb170, main="lip_pcb170")
histNormPlot(data$lip_pcb180, main="lip_pcb180")
histNormPlot(data$lip_pcb187, main="lip_pcb187")
histNormPlot(data$lip_pcb194, main="lip_pcb194")
histNormPlot(data$lip_pcb199, main="lip_pcb199")
histNormPlot(data$lip_pcb138_158, main="lip_pcb138_158")
histNormPlot(data$lip_pcb196_203, main="lip_pcb196_203")
}
# pair-wise plots
runPairwisePlots <- function(data) {
# pair wise plots
plot(data$child_sex, data$mdi)
plot(data$mom_educ, data$mdi)
plot(data$mom_age, data$mdi)
plot(data$mom_race, data$mdi)
14

plot(data$mom_smoke, data$mdi)
plot(data$lip_PBDE_47, data$mdi)
plot(data$lip_PBDE_99, data$mdi)
plot(data$lip_PBDE_100, data$mdi)
plot(data$lip_PBDE_153, data$mdi)
plot(data$lip_hcb, data$mdi)
plot(data$lip_pp_dde, data$mdi)
plot(data$lip_oxychlor, data$mdi)
plot(data$lip_nonachlor, data$mdi)
plot(data$lip_pcb74, data$mdi)
plot(data$lip_pcb99, data$mdi)
plot(data$lip_pcb105, data$mdi)
plot(data$lip_pcb118, data$mdi)
plot(data$lip_pcb146, data$mdi)
plot(data$lip_pcb153, data$mdi)
plot(data$lip_pcb156, data$mdi)
plot(data$lip_pcb170, data$mdi)
plot(data$lip_pcb180, data$mdi)
plot(data$lip_pcb187, data$mdi)
plot(data$lip_pcb194, data$mdi)
plot(data$lip_pcb199, data$mdi)
plot(data$lip_pcb138_158, data$mdi)
plot(data$lip_pcb196_203, data$mdi)
}
runCorrelations <- function(data) {
# visualization of correlation
corrgram(data, order=TRUE, lower.panel=panel.shadeNtext,
upper.panel=NULL, text.panel=panel.txt,
main="Correlations ")
corrgram(data[,6:ncol(data)], order=TRUE, lower.panel=panel.pts,
upper.panel=NULL)
}
library(caret)
# load the data
load(outDataFile("RealWorldData.Rdata"))
# classify our variables as covariates, exposures or outcomes
covariates <- names(dataRealWorld)[1:5]
outcome = "mdi"
exposuresRaw <- names(dataRealWorld)[8:ncol(dataRealWorld)]
exposures <- unlist(lapply(exposuresRaw, function(e) { return(sprintf("log_%s",e))}))
#exposures <- exposuresRaw
# log transform the exposure variables
for(exposure in exposuresRaw) {
dataRealWorld[,sprintf("log_%s",exposure)] = log(dataRealWorld[,exposure])
}
set.seed(1066)
folds <- createFolds(dataRealWorld$mdi, k = 5, list = TRUE, returnTrain = TRUE)
# create empty blacklist and whitelist
blacklist = data.frame(from=character(0), to=character(0))
whitelist = data.frame(from=character(0), to=character(0))
fold = folds$Fold1
dataRW.train = dataRealWorld[fold,]
dataRW.test = dataRealWorld[-fold,]
#
# Build the starting DAG.
15

# Outcome: mdi
# Confounders: child_sex, mom_educ, mom_age, mom_race, mom_smoke
# Exposures: serum values
#
# create nodes for starting DAG
nodes <- c(covariates, outcome, exposures)
dagRW <- new("graphNEL", nodes=nodes, edgemode="directed")
# create edges for starting DAG
#
# Scientific assumptions:
# - covariates are potential confounders in the relationship between
# exposures and outcome for all exposures
# - we assume covariates are independent of one another
# - undirected edges may exist between all exposures
#
for(covar in covariates) {
dagRW <- addEdge(covar, outcome, dagRW, 1)
for(exposure in exposures) {
dagRW <- addEdge(covar, exposure, dagRW, 1)
}
}
for(i in 1:length(exposures)) {
dagRW <- addEdge(exposures[i], outcome, dagRW, 1)
if (i < length(exposures)) {
for(j in (i+1):length(exposures)) {
dagRW <- addEdge(exposures[i], exposures[j], dagRW, 1)
dagRW <- addEdge(exposures[j], exposures[i], dagRW, 1)
}
}
}
dawRW.start = dagRW
plot(dagRW,
attrs=list(node=list(shape="box", height=20, width=40,
fillcolor="lightblue"))
)
#
# Remove connections between the covariates and the outcome
# if no correlation exists
#
for(covar in covariates) {
fit <- lm(sprintf("mdi ~ %s", covar), data=dataRW.train)
pval <- as.numeric(summary(fit)$coefficients[2,4])
if (pval > includeThreshold) {
print(sprintf("No association of %s with mdi: p=%f", covar, pval))
dagRW <- removeEdge(covar, "mdi", dagRW)
blacklist <- rbind(blacklist, data.frame(from=c(covar), to=c("mdi")))
} else {
whitelist <- rbind(whitelist, data.frame(from=c(covar), to=c("mdi")))
}
}
#
# Remove connections between the covariates and the exposures
#
for(covar in covariates) {
for(exposure in exposures) {
16
fit <- lm(sprintf("%s ~ %s", exposure, covar), data=dataRW.train)
pval <- as.numeric(summary(fit)$coefficients[2,4])
if (pval > includeThreshold) {
print(sprintf("No association of %s with %s: p=%f", covar, exposure, pval))
dagRW <- removeEdge(covar, exposure, dagRW)
blacklist <- rbind(blacklist, data.frame(from=c(covar), to=c(exposure)))
} else {
whitelist <- rbind(whitelist, data.frame(from=c(covar), to=c(exposure)))
}
}
}
#
# Remove connections between exposures
#
for(i in 1:length(exposures)) {
if (i < length(exposures)) {
for(j in (i+1):length(exposures)) {
exp1 = exposures[i]
exp2 = exposures[j]
fit <- lm(sprintf("%s ~ %s", exp1, exp2), data=dataRW.train)
pval <- as.numeric(summary(fit)$coefficients[2,4])
if (pval > includeThreshold) {
print(sprintf("No association of %s with %s: p=%f", exp1, exp2, pval))
dagRW <- removeEdge(exp1, exp2, dagRW)
dagRW <- removeEdge(exp2, exp1, dagRW)
blacklist <- rbind(blacklist, data.frame(from=c(exp1,exp2), to=c(exp2,exp1)))
}
}
}
}
#
# Remove connections between exposures and outcome
# while controlling for covariates
#
for(exposure in exposures) {
# determine covariate list
inEdgeList <- unlist(inEdges(dagRW)[exposure])
exposureCovar <- intersect(covariates,inEdgeList)
if (length(exposureCovar) > 0) {
fit <- lm(sprintf("mdi ~ %s + %s", exposure, paste(exposureCovar, collapse=" + ")),
data=dataRW.train)
} else {
fit <- lm(sprintf("mdi ~ %s", exposure), data=dataRW.train)
}
pval <- as.numeric(summary(fit)$coefficients[2,4])
if (pval > includeThreshold) {
print(sprintf("No association of %s with mdi (controlling for %s): p=%f", exposure,
paste(exposureCovar, collapse=", "), pval))
dagRW <- removeEdge(exposure, "mdi", dagRW)
blacklist <- rbind(blacklist, data.frame(from=c(exposure), to=c("mdi")))
} else {
whitelist <- rbind(whitelist, data.frame(from=c(exposure), to=c("mdi")))
}
}
17

plot(dagRW,
attrs=list(node=list(shape="box", height=20, width=40,
fillcolor="lightblue"))
)
# use hill climbing to remove any remaining undirected edges
sg = subGraph(c("mdi",inEdges("mdi", dagRW)$mdi), dagRW)
plot(sg,
attrs=list(node=list(shape="box", height=20, width=40,
fillcolor="lightblue"))
)
# Now use a bayesian learning approach to reduce the edges
# between the xi's
hcDag = hc(dataRW.train[,c(covariates,outcome,exposures)], whitelist=whitelist,
blacklist=blacklist)
plot(as.graphNEL(hcDag),
attrs=list(node=list(shape="box", height=20, width=40,
fillcolor="lightblue"))
)
#}
#----------------------
# Real world Data set: Bayes net
#----------------------
# estimate the parameters
fit = bn.fit(hcDag, dataRW.train[,c(covariates,outcome,exposures)])
# see how we did
predRW = predict(fit$mdi, dataRW.test[,c(covariates,outcome,exposures)]) # predicts the value
of node C given test set
predRWData <- data.frame(pred=predRW, actual=dataRW.test[, "mdi"]) # compare the actual
and predicted
accuracy(f = predRW, x = dataRW.test[, "mdi"])
BlandAltman(predRW, dataRW.test[, "mdi"])
plot(predRWData$actual, predRWData$pred,ylim=c(60,100))
plot(predRWData$actual, predRWData$pred - predRWData$actual)
18

3. A Statistical Framework for Assessing Association Between Health
Effects and Combined ExposuresPresenting Author: Shuo Chen
Organization: University of Maryland, College Park
Contributing Authors: Shuo Chen, Jing Zhang, Chengsheng Jiang, and Don Milton
Code:
Not available.
19

4. Bayesian Kernel Machine Regression for Estimating the Health Effects
of Multi-Pollutant MixturesPresenting Author: Birgit Claus Henn
Organization: Boston University
Contributing Authors: Jennifer Bobb, Linda Valeri, Birgit Claus Henn, and Brent Coull
Code:
## Install bkmr R package - only have to do this once
## Note: The R functions provided here are actively
## being developed and are likely to be updated.
## An R package is currently under development.
install.packages("http://www.biostat.jhsph.edu/~jfeder/bkmr_0.1.0.tar.gz",
repos = NULL, type = "source")
## load in bkmr R package
library(bkmr)
## load other packages used by this script
## you may need to install them; if so use the command
## install.packages(c("gdata", "ggplot2"), depends = "Depends")
library(gdata) ## for reading in the Excel file
library(ggplot2) ## for making plots
## Read in data ##########################
## the file "DataSet1.xls" should be in the current working directory
## load data
dat <- read.xls("DataSet1.xls", sheet = 1, header = TRUE)
## set up the data
y <- dat$Y
expos <- scale(dat[, paste0("X", 1:7)])
covar <- matrix(dat$Z, ncol = 1)
## Fit model #############################
set.seed(1000)
## type ?kmbayes to see the help file
fit <- kmbayes(y = y, expos = expos, covar = covar, iter = 5000, quiet =
FALSE, modsel = TRUE, control.params = list(r.jump = 0.03, lambda.jump =
20))
## Summarize model fit ###################
## Plot the exposure-response function
## Single-pollutant exposure-response function for other exposures fixed
at their 50th percentile.
20

expos.resp.univar <- ExposureResponseUnivar(fit = fit, y = y, expos =
expos, covar = covar, q.fixed = 0.5)
ggplot(expos.resp.univar, aes(z, est, ymin = est - 1.96*se, ymax = est +
1.96*se)) +
geom_smooth(stat = "identity") +
facet_wrap(~exposure, ncol = 2, scales = "free") +
xlab("exposure") + ylab("h(X)")
## Compute numerical summaries
## Compute summary statistics comparing the exposure-response function
when a single exposure variable is at the 75th percentile as compared to
when that exposure is at the 25th percentile, for all of the other
exposures are fixed at their median
risks.singpol <- SingPolRiskSummaries(fit = fit, y = y, expos = expos,
covar = covar, q.fixed = 0.5)
ggplot(risks.singpol, aes(exposure, est, ymin = est - 1.96*se, ymax = est
+ 1.96*se)) + geom_hline(yintercept = 0, col = "brown", lty = 2) +
geom_pointrange() + ylab("change in risk")
21

5. Cheminformatics Approaches to Analyze the Effects of Environmental
Chemical MixturesPresenting Author: Denis Fourches
Organization: Department of Chemistry, Bioinformatics Research Center, North Carolina State
University
Contributing Authors: Denis Fourches*,1 and Ryan Lougee2
1 Department of Chemistry, Bioinformatics Research Center, North Carolina State University, Raleigh, NC, USA.
2 Department of Toxicology, North Carolina State University, Raleigh, NC, USA.
Code:
Not available.
22

6. A Two Step Variable Selection Procedure Using Prioritization of
Interactions Followed by LassoPresenting Author: Jiang Gui
Organization: Department of Biomeical Data Dcience, Dartmouth College
Contributing Authors: JIang Gui, Margaret R. Karagas
Code:
library(xlsReadWrite)
library(glmnet)
data1 <- read.xls("DataSet1.xls",sheet=1)
data2 <- read.xls("DataSet2.xls",sheet=1)
# start simulation 1
y <- data1[,2]
x <- data1[,3:9]
z <- data1[,10]
pdf(file='scatterplot.pdf') # scatterplot checking linear relationship
for (i in 1:7)
{
plot(x[,i],y)
}
dev.off()
x1 <- sqrt(x) # most variables has square root relationship with outcome
pdf(file='scatterplot1.pdf')
for (i in 1:7)
{
plot(x1[,i],y)
}
dev.off()
23

x1 <-as.matrix(x1)
#fit <- lars(cbind(x1,z),y)
fit <- glmnet(cbind(x1,z),y)
datax <- cbind(x1,z)
fit3 <- cv.glmnet(datax,y)
bestno <- (1:length(fit3$cvm))[fit3$cvm==min(fit3$cvm)] #pick the turning parameter using cross-
validation
fit2=glmnet(datax,y, lambda=fit3$lambda[bestno])
(fit2$beta)
summary(lm(y~x1[,1]+x1[,2]+x1[,4]+x1[,5]+x1[,7]+z)) # drop x3 and x6 and refit linear regression
# end simulation 1
# start simulation 2
y <- data2[,2]
x <- data2[,3:16]
z <- data2[,17:19]
x<- as.matrix(x)
z<- as.matrix(z)
pdf(file='smooth.pdf') # scatterplot checking linear relationship
for (i in 1:14)
{
plot(smooth.spline((x[,i]), y))
}
dev.off()
index <- 0
tt<-1
qi <- 0
24

xnew1 <- x
for (i in 1:14) {
fit <- smooth.spline((x[,i]), y)
fit <- smooth.spline((x[,i]), y)
qi[i]<-cor(fit$x,fit$y)
xnew1[,i] <- smooth.spline(x[,i])$y
}
# calulate correlation between outcome and smoothed predictors
pij <-qij <- qij1<- matrix(0, 13,14)
xnew <- x
index <- 0
tt<-1
keepin <- matrix(0, 100, 3)
for (i in 1:13) {
for (j in ((i+1):14)){
index <- index+1
pij[i,j] <- summary(lm(y~x[,i]*x[,j]+z))$coef[7,4] # calculate the adjusted p-values for interactions
if(pij[i,j]<0.05) {xnew <- cbind(xnew, x[,i]*x[,j])
keepin[tt, ] <- c(index, i, j)
tt <- tt+1
}
fit <- smooth.spline((x[,i]*x[,j]), y)
qij[i,j]<-cor(fit$x,fit$y) # calculate correlation between outcome and smoothed interactions
qij1[i,j] <- abs(qij[i,j]) - max(abs(qi[i]), abs(qi[j])) # estimate the improvement of linearity after
conosidering interaction
}
}
25
datax <- cbind(z, xnew, x[,2]*x[,12]*x[,13])
fit <- glmnet(datax,y)
fit3 <- cv.glmnet(datax,y)
bestno <- (1:length(fit3$cvm))[fit3$cvm==min(fit3$cvm)]
fit2=glmnet(datax,y, lambda=fit3$lambda[bestno])
(fit2$beta)
summary(lm(y~x[,1]+x[,6]+ x[,3]*x[,10]+x[,2]*x[,12]*x[,13]+x[,14]+z))
# end simulation 2
# start real data
data <- read.delim("bb.txt")
y <- data[,28]
x <- data[,6:27]
z <- data[,1:5]
x<- as.matrix(x)
z<- as.matrix(z)
pdf(file='smooth-real.pdf') # scatterplot checking linear relationship
for (i in 1:22)
{
plot(smooth.spline((x[,i]), y))
}
dev.off()
pdf(file='scatterplot3.pdf') # scatterplot checking linear relationship
for (i in 1:22)
{
plot((x[,i]),y)
26

}
dev.off()
pdf(file='scatterplot4.pdf') # scatterplot checking linear relationship
for (i in 1:22)
{
plot(log(x[,i]),y)
}
dev.off()
x <- log(x)
index <- 0
tt<-1
qi <- 0
xnew1 <- x
for (i in 1:22) {
fit <- smooth.spline((x[,i]), y)
fit <- smooth.spline((x[,i]), y)
qi[i]<-cor(fit$x,fit$y)
xnew1[,i] <- smooth.spline(x[,i])$y
}
# calulate correlation between outcome and smoothed predictors
pij <-qij <- qij1<- matrix(0, 21,22)
xnew <- x
index <- 0
tt<-1
keepin <- matrix(0, 100, 3)
for (i in 1:21) {
for (j in ((i+1):22)){
27

index <- index+1
pij[i,j] <- summary(lm(y~x[,i]*x[,j]+z))$coef[7,4] # calculate the adjusted p-values for interactions
if(pij[i,j]<0.05) {xnew <- cbind(xnew, x[,i]*x[,j])
keepin[tt, ] <- c(index, i, j)
tt <- tt+1
}
fit <- smooth.spline((x[,i]*x[,j]), y)
qij[i,j]<-cor(fit$x,fit$y) # calculate correlation between outcome and smoothed interactions
qij1[i,j] <- abs(qij[i,j]) - max(abs(qi[i]), abs(qi[j])) # estimate the improvement of linearity after
conosidering interaction
}
}
plot(smooth.spline((x[,7]*x[,16]), y))
plot(smooth.spline((x[,11]*x[,14]), y))
plot(smooth.spline((x[,11]*x[,17]), y))
plot(smooth.spline((x[,11]*x[,16]), y))
plot(smooth.spline((x[,7]*x[,18]), y))
xnew <- cbind(xnew, x[,7]*x[,16], x[,11]*x[,14], x[,11]*x[,17], x[,11]*x[,16], x[,7]*x[,18])
#plot(smooth.spline((x[,10]*x[,15]), y))
datax <- cbind(z, xnew)
fit <- glmnet(datax,y)
fit3 <- cv.glmnet(datax,y)
bestno <- (1:length(fit3$cvm))[fit3$cvm==min(fit3$cvm)]
fit2=glmnet(datax,y, lambda=fit3$lambda[bestno])
(fit2$beta)
index <- c(2,4,11,13,18,19)
summary(lm(y~x[,index]+x[,7]*x[,18]+z)) #final model
28

7. Integrating Toxicology and Mechanistic Evidence Into Complex
Mixtures Analysis Using a Flexible Bayesian ApproachPresenting Author: Ghassan Hamra
Organization: Drexel University School of Public Health
Contributing Authors: Ghassan Hamra, Richard MacLehose, David Richardson, Stephen Bertke, Robert
Daniels
Code:
rm(list=ls())
##########################################################################
###
#### NIEHS workshop on mixtures
#### Real world dataset, HOME study (prolly)
##########################################################################
###
## load necessary libraries, rstan and foreign (<- to read in STATA file)
library(R2jags)
library(rstan)
library(gdata)
library(Epi)
library(coda)
library(moments)
##set working directory and read in STATA file
setwd("~/Dropbox/Academic/NIEHSmixtures/datasets")
real <- read.csv('mixtures.csv')
## create sum exposure for groups
real$PCB_sum <- (real$lip_pcb153 + real$lip_pcb74 + real$lip_pcb99
+ real$lip_pcb105 + real$lip_pcb118 + real$lip_pcb146 + real$lip_pcb156
+ real$lip_pcb170 + real$lip_pcb180 + real$lip_pcb187 + real$lip_pcb194
+ real$lip_pcb199 + real$lip_pcb138_158 + real$lip_pcb196_203)
real$PBDE_sum <- (real$lip_PBDE_47 + real$lip_PBDE_99 + real$lip_PBDE_100
+ real$lip_PBDE_153)
real$OP_sum <- (real$lip_pp_dde + real$lip_hcb + real$lip_oxychlor +
real$lip_nonachlor )
29

summary(real)
str(real)
correlations <- cor(real)
write.csv(correlations,'correlations.csv')
######################################################
## model1:
## pre-summed exposures
######################################################
m1 <- function() {
for (n in 1:270){
mdi[n] ~ dnorm(y.hat[n],y.tau) #simply notes the outcome is a linear,
normally distributed variable
y.hat[n] <- beta0 + beta[1]*PCB_sum[n] + beta[2]*PBDE_sum[n] +
beta[3]*OP_sum[n] +
phi[1]*child_sex[n] + phi[2]*mom_educ[n] + phi[3]*mom_age[n] +
phi[4]*mom_race[n] + phi[5]*mom_smoke[n]}
# noninformative priors for the betas & covariates
for (m in 1:5) {
phi[m] ~ dnorm(0,0.0001)
}
for (q in 1:3) {
beta[q] ~ dnorm(0,0.0001)
}
# Priors for other variables
beta0 ~ dnorm(0,0.0001)
y.tau <- pow(y.sigma, -2)
y.sigma ~ dunif(0, 100)
}
## TEll JAGS what variables to monitor
d1.parms <- c('beta0', 'beta[1:3]', 'phi[1:5]', 'y.tau')
## Run JAGS model
set.seed(00001)
d1.jags <- jags(data=real,parameters.to.save=d1.parms,
n.chains=3, n.iter=10000, n.burnin=1000,n.thin=2,
model.file=m1)
#print(d1.jags, digits=5)
30

JAGS.results <- d1.jags$BUGSoutput$summary
write.table(x=JAGS.results,
file='~/Dropbox/Academic/NIEHSmixtures/Results/d1results.csv', sep=",")
######################################################
## model 2:
## set w = 1 for all components
######################################################
m2 <- function() {
for (n in 1:270){
mdi[n] ~ dnorm(y.hat[n],y.tau) #simply notes the outcome is a linear,
normally distributed variable
PCB[n] <- lip_pcb153[n] + w[1]*lip_pcb74[n] + w[2]*lip_pcb99[n]
# PCB exposure model, 153 is referent
+ w[3]*lip_pcb105[n] + w[4]*lip_pcb118[n] + w[5]*lip_pcb146[n] +
w[6]*lip_pcb156[n]
+ w[7]*lip_pcb170[n] + w[8]*lip_pcb180[n] + w[9]*lip_pcb187[n] +
w[9]*lip_pcb194[n]
+ w[10]*lip_pcb199[n] + w[11]*lip_pcb138_158[n] +
w[12]*lip_pcb196_203[n]
PBDE[n] <- lip_PBDE_47[n] + w[13]*lip_PBDE_99[n] +
w[14]*lip_PBDE_100[n] + w[15]*lip_PBDE_153[n] # PBDE exposure model, 47 is
referent
OP[n] <- lip_pp_dde[n] + w[16]*lip_hcb[n] + w[17]*lip_oxychlor[n] +
w[18]*lip_nonachlor[n] #pesticide model, pp_dde is referent
cov[n] <- phi[1]*child_sex[n] + phi[2]*mom_educ[n] + phi[3]*mom_age[n]
+ phi[4]*mom_race[n] + phi[5]*mom_smoke[n] # covariate model
y.hat[n] <- beta0 + beta[1]*PCB[n] + beta[2]*PBDE[n] + beta[3]*OP[n]
+ cov[n] # This is the outcome model
}
# noninformative priors for the betas
for (v in 1:18) {
w[v] <- 1
}
for (m in 1:5) {
phi[m] ~ dnorm(0,0.0001)
}
31

for (q in 1:3) {
beta[q] ~ dnorm(0,0.0001)
}
# Priors for other variables
beta0 ~ dnorm(0,0.0001)
y.tau <- pow(y.sigma, -2)
y.sigma ~ dunif(0, 100)
}
## TEll JAGS what variables to monitor
d2.parms <- c('beta0', 'beta[1:3]', 'phi[1:5]', 'y.tau')
## Run JAGS model
set.seed(00002)
d2.jags <- jags(data=real,parameters.to.save=d1.parms,
n.chains=3, n.iter=10000, n.burnin=1000,n.thin=2,
model.file=m2)
#print(d2.jags, digits=5)
JAGS.results <- d2.jags$BUGSoutput$summary
write.table(x=JAGS.results,
file='~/Dropbox/Academic/NIEHSmixtures/Results/d2results.csv', sep=",")
######################################################
## Model 3
## Dirichlet prior
######################################################
m3 <- function() {
for (n in 1:270){
mdi[n] ~ dnorm(y.hat[n],y.tau) #simply notes the outcome is a linear,
normally distributed variable
PCB[n] <- lip_pcb153[n] + w[1]*lip_pcb74[n] + w[2]*lip_pcb99[n]
# PCB exposure model, 153 is referent
+ w[3]*lip_pcb105[n] + w[4]*lip_pcb118[n] +
w[5]*lip_pcb146[n] + w[6]*lip_pcb156[n]
+ w[7]*lip_pcb170[n] + w[8]*lip_pcb180[n] +
w[9]*lip_pcb187[n] + w[9]*lip_pcb194[n]
+ w[10]*lip_pcb199[n] + w[11]*lip_pcb138_158[n] +
w[12]*lip_pcb196_203[n]
PBDE[n] <- lip_PBDE_47[n] + w[13]*lip_PBDE_99[n] +
w[14]*lip_PBDE_100[n] + w[15]*lip_PBDE_153[n] # PBDE exposure model, 47 is
referent
32
OP[n] <- lip_pp_dde[n] + w[16]*lip_hcb[n] + w[17]*lip_oxychlor[n] +
w[18]*lip_nonachlor[n] #pesticide model, pp_dde is referent
cov[n] <- phi[1]*child_sex[n] + phi[2]*mom_educ[n] + phi[3]*mom_age[n]
+ phi[4]*mom_race[n] + phi[5]*mom_smoke[n] # covariate model
y.hat[n] <- beta0 + beta[1]*PCB[n] + beta[2]*PBDE[n] + beta[3]*OP[n]
+ cov[n] # This is the outcome model
}
# noninformative priors for the betas
t[1]<-1
t[2]<-0.01
t[3]<-100
t[4]~dnorm(0,.01);T(0,)
for (v in 1:18) {
k[v]~dcat(p[])
}
w[1]<-t[k[1]]
w[2]<-t[k[2]]
w[3]<-t[k[3]]
w[4]<-t[k[4]]
w[5]<-t[k[5]]
w[6]<-t[k[6]]
w[7]<-t[k[7]]
w[8]<-t[k[8]]
w[9]<-t[k[9]]
w[10]<-t[k[10]]
w[11]<-t[k[11]]
w[12]<-t[k[12]]
w[13]<-t[k[13]]
w[14]<-t[k[14]]
w[15]<-t[k[15]]
w[16]<-t[k[16]]
w[17]<-t[k[17]]
w[18]<-t[k[18]]
p[1]<-r[1]
for (k in 1:3){
r[k]~dbeta(1,alpha)
}
for (k in 2:3){
p[k]<-r[k]*(1-r[k-1])*p[k-1]/r[k-1]
}
p[4]<-1-sum(p[1:3])
alpha <- 1
33

for (m in 1:5) {
phi[m] ~ dnorm(0,0.0001)
}
for (q in 1:3) {
beta[q] ~ dnorm(0,0.0001)
}
# Priors for other variables
beta0 ~ dnorm(0,0.0001)
y.tau <- pow(y.sigma, -2)
y.sigma ~ dunif(0, 100)
}
## TEll JAGS what variables to monitor
d1.parms <- c('beta0', 'beta[1:3]','w[1:18]', 'phi[1:5]', 'y.tau')
## Run JAGS model
# set.seed(03061501)
d3.jags <- jags(data=real,parameters.to.save=d1.parms,
n.chains=3, n.iter=50000, n.burnin=10000,n.thin=2,
model.file=m3)
#print(d1.jags, digits=5)
JAGS.results <- d3.jags$BUGSoutput$summary
write.table(x=JAGS.results,
file='~/Dropbox/Academic/NIEHSmixtures/Results/d3results.csv', sep=",")
###################################
## model 4
## shrink betas
###################################
m4 <- function() {
for (n in 1:270){
mdi[n] ~ dnorm(y.hat[n],y.tau) #simply notes the outcome is a linear,
normally distributed variable
PCB[n] <- lip_pcb153[n] + w[1]*lip_pcb74[n] + w[2]*lip_pcb99[n]
# PCB exposure model, 153 is referent
+ w[3]*lip_pcb105[n] + w[4]*lip_pcb118[n] + w[5]*lip_pcb146[n] +
w[6]*lip_pcb156[n]
+ w[7]*lip_pcb170[n] + w[8]*lip_pcb180[n] + w[9]*lip_pcb187[n] +
w[9]*lip_pcb194[n]
+ w[10]*lip_pcb199[n] + w[11]*lip_pcb138_158[n] +
w[12]*lip_pcb196_203[n]
34

PBDE[n] <- lip_PBDE_47[n] + w[13]*lip_PBDE_99[n] +
w[14]*lip_PBDE_100[n] + w[15]*lip_PBDE_153[n] # PBDE exposure model, 47 is
referent
OP[n] <- lip_pp_dde[n] + w[16]*lip_hcb[n] + w[17]*lip_oxychlor[n] +
w[18]*lip_nonachlor[n] #pesticide model, pp_dde is referent
cov[n] <- phi[1]*child_sex[n] + phi[2]*mom_educ[n] + phi[3]*mom_age[n]
+ phi[4]*mom_race[n] + phi[5]*mom_smoke[n] # covariate model
y.hat[n] <- beta0 + beta[1]*PCB[n] + beta[2]*PBDE[n] + beta[3]*OP[n]
+ cov[n] # This is the outcome model
}
# noninformative priors for the betas
t[1]<-1
t[2]<-0.01
t[3]<-100
t[4]~dnorm(0,.01);T(0,)
for (v in 1:18) {
k[v]~dcat(p[])
}
w[1]<-t[k[1]]
w[2]<-t[k[2]]
w[3]<-t[k[3]]
w[4]<-t[k[4]]
w[5]<-t[k[5]]
w[6]<-t[k[6]]
w[7]<-t[k[7]]
w[8]<-t[k[8]]
w[9]<-t[k[9]]
w[10]<-t[k[10]]
w[11]<-t[k[11]]
w[12]<-t[k[12]]
w[13]<-t[k[13]]
w[14]<-t[k[14]]
w[15]<-t[k[15]]
w[16]<-t[k[16]]
w[17]<-t[k[17]]
w[18]<-t[k[18]]
p[1]<-r[1]
for (k in 1:3){
r[k]~dbeta(1,alpha)
}
for (k in 2:3){
35

p[k]<-r[k]*(1-r[k-1])*p[k-1]/r[k-1]
}
p[4]<-1-sum(p[1:3])
alpha <- 1
for (m in 1:5) {
phi[m] ~ dnorm(0,0.0001)
}
for (q in 1:3) {
beta[q] ~ dnorm(beta.m,beta.tau)
}
# Priors for other variables
beta0 ~ dnorm(0,0.0001)
sigma.beta ~ dunif(0,100)
beta.tau <- 1/(pow(sigma.beta,2))
beta.m ~ dnorm(0,0.0001)
y.tau <- pow(y.sigma, -2)
y.sigma ~ dunif(0, 100)
}
## TEll JAGS what variables to monitor
d1.parms <- c('beta0', 'beta[1:3]','w[1:18]', 'phi[1:5]', 'y.tau',
'beta.m','beta.tau')
## Run JAGS model
set.seed(00004)
d4.jags <- jags(data=real,parameters.to.save=d1.parms,
n.chains=3, n.iter=50000, n.burnin=10000,n.thin=2,
model.file=m4)
#print(d4.jags, digits=5)
JAGS.results <- d4.jags$BUGSoutput$summary
write.table(x=JAGS.results,
file='~/Dropbox/Academic/NIEHSmixtures/Results/d4results.csv', sep=",")
36

8. Two-Step Shrinkage-Based Regression Strategy for Assessing Health
Effects of Chemical Mixtures in Environmental EpidemiologyPresenting Author: Xindi Hu
Organization: Department of Environmental Health, Harvard University
Contributing Authors: Xindi Hu
Code:
#Annotated code for Two-step shrinkage-based regression strategy for assessing health effects of
chemical mixtures in environmental epidemiology
#Xindi Hu, Harvard University
#Simulated dataset 1, one-step strategy#
library(RnavGraph) #Wheel plot
library(RnavGraphImageData) #Wheel plot
library(Rgraphviz) #Wheel plot
library(glmnet) #Ridge, lasso and elastic-net
library(hierNet) #Lasso for hierarchical interaction
######## Read in simulated data set 1 ########
ds.1<-read.csv("DataSet1.csv")
######## Data preparation ########
ds.1.log<-ds.1
ds.1.log[,2:9]<-sapply(ds.1.log[,2:9],log) #log transform X1-X7 and Y
ds.1.log<-ds.1.log[,-1] #remove ID column
x<-ds.1.log[,-1] #put all independent vars in x
y<-ds.1.log$Y
set.seed (10)
#standardize continuous independent vars and outcome by 2*SD, keep binary intact
std2<-function(var)
{var<-(var-mean(var))/(2*sd(var))}
x<-data.frame(x)
x[,1:7]<-sapply(x[,1:7],std2)
y<-std2(y)
######## Ridge ########
x<-as.matrix(x)
ridge.fit<-glmnet(x,y,alpha=0)
37

ridge.cv<-cv.glmnet(x,y,alpha =0)
ridge.pred=predict(ridge.fit,s=ridge.cv$lambda.1se,newx=x)
mean((ridge.pred -y)^2) #MSE
ridge.out<-glmnet(x,y,alpha =0, lambda =ridge.cv$lambda.1se)
ridge.coef<-predict(ridge.out, type ="coefficients",s=ridge.cv$lambda.1se )[1:9,]
ridge.coef
######## Lasso ########
x<-as.matrix(x)
lasso.fit<-glmnet(x,y,alpha=1)
lasso.cv<-cv.glmnet(x,y,alpha =1)
lasso.pred=predict(lasso.fit,s=lasso.cv$lambda.1se,newx=x)
mean((lasso.pred -y)^2)
lasso.out<-glmnet(x,y,alpha =1, lambda =lasso.cv$lambda.1se)
lasso.coef<-predict(lasso.out, type ="coefficients",s=lasso.cv$lambda.1se )[1:9,]
lasso.coef
######## Elastic net ########
#tune alpha
MSE<-rep(NA,100)
Lambda<-rep(NA,100)
alpha<-seq(0,1,length=100)
for (i in 1:100)
{
x<-as.matrix(x)
lasso.mod<-glmnet(x,y,alpha =alpha[i])
set.seed (10)
cv.out=cv.glmnet(x,y,alpha =alpha[i])
print(i)
Lambda[i]<-cv.out$lambda.min
lasso.pred=predict(lasso.mod,s=cv.out$lambda.min,newx=x)
MSE[i]<-mean((lasso.pred -y)^2)
}
bestalpha<-alpha[which.min(MSE)]
bestlambda<-Lambda[which.min(MSE)]
#Use the best alpha to run elastic net
set.seed (10)
lasso.mod<-glmnet(x,y,alpha =bestalpha)
postscript("DS1Maineffect_scaled.eps", horizontal = FALSE, onefile = FALSE, paper = "special", height =
6, width = 8)
par(mfrow=c(1,2))
38

plot(lasso.mod, "lambda", label=TRUE)
set.seed (10)
cv.out=cv.glmnet(x,y,alpha =bestalpha)#cross-validation
plot(cv.out)
dev.off()
bestlam =cv.out$lambda.1se
lasso.pred=predict(lasso.mod,s=bestlam ,newx=x)
mean((lasso.pred -y)^2) #MSE for main effect only
out=glmnet(x,y,alpha =bestalpha)
lasso.coef=predict(out, type ="coefficients",s=bestlam )[1:9,]
lasso.coef
######## Hierarchical LASSO ########
#strong hierarchy
grid <-10^ seq (-10,10, length =100)
lasso.str.fit<-hierNet.path(x,y,strong = TRUE)
str.cv<-hierNet.cv(lasso.str.fit,x,y,nfolds=10,folds=NULL,trace=0)
bestlam<-str.cv$lamhat.1se
x<-as.matrix(x)
lasso.str<-hierNet(x, y, lam=bestlam, delta=1e-8, strong=TRUE, diagonal=TRUE, aa=NULL, zz=NULL,
center=TRUE, stand.main=TRUE, stand.int=FALSE,
rho=nrow(x), niter=100, sym.eps=1e-3,
step=1, maxiter=2000, backtrack=0.2, tol=1e-5, trace=0)
yhat<-predict(lasso.str, newx=x, newzz=NULL)
mean((yhat -y)^2) #MSE for strong hierarchical lasso
lasso.str
write.csv(lasso.str$th,"ds1strth.csv")
#Wheel plot for SHL
adjM<-abs(lasso.str$th)
rownames(adjM) <- c('X1','X2','X3','X4','X5','X6','X7','Z')
colnames(adjM) <- c('X1','X2','X3','X4','X5','X6','X7','Z')
postscript("DS1str.eps", horizontal = FALSE, onefile = FALSE, paper = "special", height = 6, width = 6)
par(mfrow=c(1,1))
G <- new("graphAM", adjMat = adjM, edgemode = "directed")
ng.LG <- ng_graph(name = "3D Transition", graph = G, sep = '++', layout = "circle")
plot(ng.LG)
dev.off()
#weak hierarchy
lasso.wk.fit<-hierNet.path(x,y,lamlist=grid,delta=1e-
8,minlam=min(grid),maxlam=max(grid),nlam=length(grid),
39

diagonal = TRUE, strong = FALSE, aa = NULL, zz = NULL,
stand.main = TRUE, stand.int = FALSE,
rho = nrow(x), niter = 100, sym.eps = 0.001,
step = 1, maxiter = 2000, backtrack = 0.2, tol = 1e-05, trace=0)
wk.cv<-hierNet.cv(lasso.wk.fit,x,y,nfolds=10,folds=NULL,trace=0)
postscript("DS1Interactions_scaled.eps", horizontal = FALSE, onefile = FALSE, paper = "special", height =
6, width = 8)
par(mfrow=c(1,2))
plot(str.cv)
plot(wk.cv)
dev.off()
bestlam<-wk.cv$lamlist[which.min(wk.cv$cv.err)]
lasso.wk<-hierNet(x, y, lam=bestlam, delta=1e-8, strong=FALSE, diagonal=TRUE, aa=NULL, zz=NULL,
center=TRUE, stand.main=TRUE, stand.int=FALSE,
rho=nrow(x), niter=100, sym.eps=1e-3,
step=1, maxiter=2000, backtrack=0.2, tol=1e-5, trace=0)
yhat<-predict(lasso.wk, newx=x, newzz=NULL)
mean((yhat -y)^2) #MSE for weak hierarchical lasso
lasso.wk
write.csv(lasso.wk$th,"ds1wkth.csv")
#Wheel plot for WHL
adjM<-abs(lasso.wk$th)
all(adjM == t(adjM))
library(Rgraphviz)
rownames(adjM) <- c('X1','X2','X3','X4','X5','X6','X7','Z')
colnames(adjM) <- c('X1','X2','X3','X4','X5','X6','X7','Z')
postscript("DS1wk.eps", horizontal = FALSE, onefile = FALSE, paper = "special", height = 6, width = 6)
par(mfrow=c(1,1))
G <- new("graphAM", adjMat = adjM, edgemode = "directed")
ng.LG <- ng_graph(name = "3D Transition", graph = G, sep = '++', layout = "circle")
plot(ng.LG)
dev.off()
#Simulated dataset 2, one-step strategy#
library(RnavGraph) #Wheel plot
library(RnavGraphImageData) #Wheel plot
library(Rgraphviz) #Wheel plot
library(glmnet) #Ridge, lasso and elastic-net
library(hierNet) #Lasso for hierarchical interaction
40

######## Read in dataset ########
ds.2<-read.csv("DataSet2.csv")
######## Data preparation ########
#standardize continuous independent vars and outcome by 2*SD, keep binary intact
std2<-function(var)
{var<-(var-mean(var))/(2*sd(var))}
x<-ds.2[,3:19]
x<-data.frame(x)
x[,1:16]<-sapply(x[,1:16],std2)
y<-ds.2$y
y<-std2(y)
######## Ridge ########
x<-as.matrix(x)
ridge.fit<-glmnet(x,y,alpha=0)
ridge.cv<-cv.glmnet(x,y,alpha =0)
ridge.pred=predict(ridge.fit,s=ridge.cv$lambda.1se,newx=x)
mean((ridge.pred -y)^2)
ridge.out<-glmnet(x,y,alpha =0, lambda =ridge.cv$lambda.1se)
ridge.coef<-predict(ridge.out, type ="coefficients",s=ridge.cv$lambda.1se )[1:18,]
ridge.coef
######## Lasso ########
x<-as.matrix(x)
lasso.fit<-glmnet(x,y,alpha=1)
lasso.cv<-cv.glmnet(x,y,alpha =1)
lasso.pred=predict(lasso.fit,s=lasso.cv$lambda.1se,newx=x)
mean((lasso.pred -y)^2)
lasso.out<-glmnet(x,y,alpha =1, lambda =lasso.cv$lambda.1se)
lasso.coef<-predict(lasso.out, type ="coefficients",s=lasso.cv$lambda.1se )[1:18,]
lasso.coef
######## Elastic-net ########
set.seed (10)
#tune alpha
MSE<-rep(NA,100)
Lambda<-rep(NA,100)
alpha<-seq(0,1,length=100)
for (i in 1:100)
41
{
x<-as.matrix(x)
lasso.mod<-glmnet(x,y,alpha =alpha[i])
set.seed (10)
cv.out=cv.glmnet(x,y,alpha =alpha[i])
print(i)
Lambda[i]<-cv.out$lambda.min
lasso.pred=predict(lasso.mod,s=cv.out$lambda.min,newx=x)
MSE[i]<-mean((lasso.pred -y)^2)
}
bestalpha<-alpha[which.min(MSE)]
bestlambda<-Lambda[which.min(MSE)]
set.seed (10)
x<-as.matrix(x)
#use the best alpha to run elastic-net
lasso.mod<-glmnet(x,y,alpha =bestalpha)
postscript("DS2Maineffect_scaled.eps", horizontal = FALSE, onefile = FALSE, paper = "special", height =6,
width = 12, point=18)
par(mfrow=c(1,2))
plot(lasso.mod,"lambda", label=TRUE,xlim = c(-9,-1))
set.seed (10)
cv.out=cv.glmnet(x,y,alpha =bestalpha)#cross-validation
plot(cv.out)
dev.off()
cv.out$lambda.min
bestlam =cv.out$lambda.1se
#tune lambda
lasso.pred=predict(lasso.mod,s=bestlam ,newx=x)
mean((lasso.pred -y)^2) #MSE for one-step strategy of dataset 2
out=glmnet(x,y,alpha =bestalpha)
lasso.coef=predict(out, type ="coefficients",s=bestlam)[1:18,]
lasso.coef
######## Hierarchical lasso ########
#strong hierarchy (SHL)
lasso.str.fit2<-hierNet.path(x,y,strong = TRUE)
str.cv2<-hierNet.cv(lasso.str.fit2,x,y,nfolds=10,folds=NULL,trace=0)
bestlam<-str.cv2$lamhat.1se
lasso.str2<-hierNet(x, y, lam=bestlam, delta=1e-8, strong=TRUE, diagonal=TRUE, aa=NULL, zz=NULL,
center=TRUE, stand.main=TRUE, stand.int=FALSE,
rho=nrow(x), niter=100, sym.eps=1e-3,
42

step=1, maxiter=2000, backtrack=0.2, tol=1e-5, trace=0)
yhat<-predict(lasso.str2, newx=x, newzz=NULL)
mean((yhat -y)^2) #MSE for strong hierarchical
lasso.str2
write.csv(lasso.str2$th,"ds2strth.csv")
#Draw wheel plot
adjM<-abs(lasso.str2$th)
rownames(adjM) <- c('X1','X2','X3','X4','X5','X6','X7','X8','X9','X10','X11','X12','X13','X14','Z1','Z2','Z3')
colnames(adjM) <- c('X1','X2','X3','X4','X5','X6','X7','X8','X9','X10','X11','X12','X13','X14','Z1','Z2','Z3')
postscript("DS2str.eps", horizontal = FALSE, onefile = FALSE, paper = "special", height = 6, width = 6)
par(mfrow=c(1,1))
G <- new("graphAM", adjMat = adjM, edgemode = "directed")
ng.LG <- ng_graph(name = "Dataset2:strong hierarchy", graph = G, sep = '++', layout = "circle")
plot(ng.LG)
dev.off()
#weak hierarchy (WHL)
lasso.wk.fit2<-hierNet.path(x,y,strong = FALSE)
wk.cv2<-hierNet.cv(lasso.wk.fit2,x,y,nfolds=10,folds=NULL,trace=0)
postscript("DS2Interactions_scaled.eps", horizontal = FALSE, onefile = FALSE, paper = "special", height =
6, width = 8)
par(mfrow=c(1,2))
plot(str.cv2)
plot(wk.cv2)
dev.off()
print(wk.cv2)
wk.cv2$cv.err
bestlam<-wk.cv2$lamhat.1se
lasso.wk2<-hierNet(x, y, lam=bestlam, delta=1e-8, strong=FALSE, diagonal=TRUE, aa=NULL, zz=NULL,
center=TRUE, stand.main=TRUE, stand.int=FALSE,
rho=nrow(x), niter=100, sym.eps=1e-3,
step=1, maxiter=2000, backtrack=0.2, tol=1e-5, trace=0)
yhat<-predict(lasso.wk2, newx=x, newzz=NULL)
mean((yhat -y)^2) #MSE for weak hierarchical
write.csv(lasso.wk2$th,"ds2wkth.csv")
#draw wheel plot
adjM<-abs(lasso.wk2$th)
all(adjM == t(adjM))
rownames(adjM) <- c('X1','X2','X3','X4','X5','X6','X7','X8','X9','X10','X11','X12','X13','X14','Z1','Z2','Z3')
colnames(adjM) <- c('X1','X2','X3','X4','X5','X6','X7','X8','X9','X10','X11','X12','X13','X14','Z1','Z2','Z3')
43

postscript("DS2wk.eps", horizontal = FALSE, onefile = FALSE, paper = "special", height = 6, width = 6)
par(mfrow=c(1,1))
G <- new("graphAM", adjMat = adjM, edgemode = "directed")
ng.LG <- ng_graph(name = "Dataset2:weak hierarchy", graph = G, sep = '++', layout = "circle")
plot(ng.LG)
dev.off()
#Two-step strategy for dataset 1
library(RnavGraph) #Wheel plot
library(RnavGraphImageData) #Wheel plot
library(Rgraphviz) #Wheel plot
library(glmnet) #Ridge, lasso and elastic-net
library(hierNet) #Lasso for hierarchical interaction
library(rpart) #Classification and regression tree
######## Read in dataset1 ########
ds.1<-read.csv("DataSet1.csv")
######## Data preparation ########
ds.1.log<-ds.1
ds.1.log[,2:9]<-sapply(ds.1.log[,2:9],log) #log transform X1-X7 and Y
######## Classification & regression tree ########
#10-fold
predictor.cart = c()
node.cart = c()
# grow the tree
n<-1000 #iterations
ds1.cart = rpart(
Y ~ X1+X2+X3+X4+X5+X6+X7+Z, method="anova",
control=rpart.control(minsplit=n*0.01,cp=0.02),data=as.data.frame(ds.1))
# prune the tree by min CP
ds1.pcart = prune(ds1.cart, cp= ds1.cart$cptable[which.min(ds1.cart$cptable[, "xerror"]), "CP"])
unique(ds1.pcart$frame$var) #X5 X7 Z
ds.1.log<-ds.1.log[,-1]
44

#subset the important variables to be included in suubsequent analyses
x<-subset(ds.1.log, select=c("X5","X7","Z"))
y<-ds.1.log$Y
set.seed (10)
######## Data preparation ########
#standardize continuous independent vars and outcome by 2*SD, keep binary intact
std2<-function(var)
{var<-(var-mean(var))/(2*sd(var))}
x<-data.frame(x)
x[,1:2]<-sapply(x[,1:2],std2)
y<-std2(y)
######## Elastic-net ########
library(glmnet)
#tune alpha
MSE<-rep(NA,100)
Lambda<-rep(NA,100)
alpha<-seq(0,1,length=100)
for (i in 1:100)
{
x<-as.matrix(x)
lasso.mod<-glmnet(x,y,alpha =alpha[i])
set.seed (10)
cv.out=cv.glmnet(x,y,alpha =alpha[i])
print(i)
Lambda[i]<-cv.out$lambda.min
lasso.pred=predict(lasso.mod,s=cv.out$lambda.min,newx=x)
MSE[i]<-mean((lasso.pred -y)^2)
}
bestalpha<-alpha[which.min(MSE)]
bestlambda<-Lambda[which.min(MSE)]
#elastic-net with the selected best alpha value
set.seed (10)
lasso.mod<-glmnet(x,y,alpha =bestalpha)
postscript("DS1Maineffect_TREE.eps", horizontal = FALSE, onefile = FALSE, paper = "special", height = 6,
width = 12, point=18)
par(mfrow=c(1,2))
plot(lasso.mod, "lambda", label=TRUE, xlim=c(-7,-1))
set.seed (10)
45

cv.out=cv.glmnet(x,y,alpha =bestalpha)#cross-validation
plot(cv.out)
dev.off()
bestlam =cv.out$lambda.1se
lasso.pred=predict(lasso.mod,s=bestlam ,newx=x)
#result of elastic net
mean((lasso.pred -y)^2) #MSE for main effect only
out=glmnet(x,y,alpha =bestalpha)
lasso.coef=predict(out, type ="coefficients",s=bestlam )[1:4,]
lasso.coef
######## Hierarchical lasso ########
#strong hierarchy (SHL)
lasso.str.fit<-hierNet.path(x,y,strong = TRUE)
str.cv<-hierNet.cv(lasso.str.fit,x,y,nfolds=10,folds=NULL,trace=0)
bestlam<-str.cv$lamhat.1se
x<-as.matrix(x)
lasso.str<-hierNet(x, y, lam=bestlam, delta=1e-8, strong=TRUE, diagonal=TRUE, aa=NULL, zz=NULL,
center=TRUE, stand.main=TRUE, stand.int=FALSE,
rho=nrow(x), niter=100, sym.eps=1e-3,
step=1, maxiter=2000, backtrack=0.2, tol=1e-5, trace=0)
yhat<-predict(lasso.str, newx=x, newzz=NULL)
mean((yhat -y)^2) #MSE for SHL
write.csv(lasso.str$th,"ds1TREEstrth.csv")
#Wheel plot for SHL
adjM<-abs(lasso.str$th)
rownames(adjM) <- colnames(x)
colnames(adjM) <- colnames(x)
postscript("DS1TREEstr.eps", horizontal = FALSE, onefile = FALSE, paper = "special", height = 6, width = 6)
par(mfrow=c(1,1))
G <- new("graphAM", adjMat = adjM, edgemode = "directed")
ng.LG <- ng_graph(name = "3D Transition", graph = G, sep = '++', layout = "circle")
plot(ng.LG)
dev.off()
#weak hierarchy (WHL)
lasso.wk.fit<-hierNet.path(x,y,strong = FALSE)
wk.cv<-hierNet.cv(lasso.wk.fit,x,y,nfolds=10,folds=NULL,trace=0)
postscript("DS1TREEInteractions_scaled.eps", horizontal = FALSE, onefile = FALSE, paper = "special",
height = 6, width = 8)
par(mfrow=c(1,2))
46

plot(str.cv)
plot(wk.cv)
dev.off()
bestlam<-wk.cv$lamhat.1se
lasso.wk<-hierNet(x, y, lam=bestlam, delta=1e-8, strong=FALSE, diagonal=TRUE, aa=NULL, zz=NULL,
center=TRUE, stand.main=TRUE, stand.int=FALSE,
rho=nrow(x), niter=100, sym.eps=1e-3,
step=1, maxiter=2000, backtrack=0.2, tol=1e-5, trace=0)
yhat<-predict(lasso.wk, newx=x, newzz=NULL)
mean((yhat -y)^2) #MSE for weak hierarchical lasso
lasso.wk
write.csv(lasso.wk$th,"ds1TREEwkth.csv")
#Wheel plot for WHL
adjM<-abs(lasso.wk$th)
all(adjM == t(adjM))
rownames(adjM) <- colnames(x)
colnames(adjM) <- colnames(x)
postscript("DS1TREEwk.eps", horizontal = FALSE, onefile = FALSE, paper = "special", height = 6, width =
6)
par(mfrow=c(1,1))
G <- new("graphAM", adjMat = adjM, edgemode = "directed")
ng.LG <- ng_graph(name = "3D Transition", graph = G, sep = '++', layout = "circle")
plot(ng.LG)
dev.off()
#Two-step strategy for dataset 2
library(RnavGraph) #Wheel plot
library(RnavGraphImageData) #Wheel plot
library(Rgraphviz) #Wheel plot
library(glmnet) #Ridge, lasso and elastic-net
library(hierNet) #Lasso for hierarchical interaction
library(rpart) #Classification and regression tree
######## Read-in dataset ########
ds.2<-read.csv("DataSet2.csv")
######## Classification & regression tree ########
47

# grow the tree
n<-1000 #iterations
ds2.cart <- rpart(
y ~ x1+x2+x3+x4+x5+x6+x7+x8+x9+x10+x11+x12+x13+x14+z1+z2+z3, method="anova",
control=rpart.control(minsplit=n*0.01,cp=0.01),data=as.data.frame(ds.2))
#prune the tree
ds2.pcart = prune(ds2.cart, cp= ds2.cart$cptable[which.min(ds2.cart$cptable[, "xerror"]), "CP"])
unique(ds2.pcart$frame$var)
#subset data based on the CART results
x<-subset(ds.2, select=c("x10","x12","x13", "x14", "x3", "x6", "x8", "z2", "z3"))
######## Data preparation ########
#standardize continuous independent vars and outcome by 2*SD, keep binary intact
std2<-function(var)
{var<-(var-mean(var))/(2*sd(var))}
x<-data.frame(x)
x[,1:8]<-sapply(x[,1:8],std2)
y<-ds.2$y
y<-std2(y)
######## Ridge ########
x<-as.matrix(x)
ridge.fit<-glmnet(x,y,alpha=0)
ridge.cv<-cv.glmnet(x,y,alpha =0)
ridge.pred=predict(ridge.fit,s=ridge.cv$lambda.1se,newx=x)
mean((ridge.pred -y)^2)
ridge.out<-glmnet(x,y,alpha =0, lambda =ridge.cv$lambda.1se)
ridge.coef<-predict(ridge.out, type ="coefficients",s=ridge.cv$lambda.1se )[1:10,]
ridge.coef
######## Lasso ########
x<-as.matrix(x)
lasso.fit<-glmnet(x,y,alpha=1)
lasso.cv<-cv.glmnet(x,y,alpha =1)
lasso.pred=predict(lasso.fit,s=lasso.cv$lambda.1se,newx=x)
mean((lasso.pred -y)^2)
lasso.out<-glmnet(x,y,alpha =1, lambda =lasso.cv$lambda.1se)
lasso.coef<-predict(lasso.out, type ="coefficients",s=lasso.cv$lambda.1se )[1:10,]
lasso.coef
######## Elastic net ########
set.seed (10)
48

#tune alpha
MSE<-rep(NA,100)
Lambda<-rep(NA,100)
alpha<-seq(0,1,length=100)
for (i in 1:100)
{
x<-as.matrix(x)
lasso.mod<-glmnet(x,y,alpha =alpha[i])
set.seed (10)
cv.out=cv.glmnet(x,y,alpha =alpha[i])
print(i)
Lambda[i]<-cv.out$lambda.min
lasso.pred=predict(lasso.mod,s=cv.out$lambda.min,newx=x)
MSE[i]<-mean((lasso.pred -y)^2)
}
bestalpha<-alpha[which.min(MSE)]
bestlambda<-Lambda[which.min(MSE)]
#run elastic-net with best alpha value
set.seed (10)
x<-as.matrix(x)
lasso.mod<-glmnet(x,y,alpha =bestalpha)#, lambda =grid)
postscript("DS2TREEMaineffect_scaled.eps", horizontal = FALSE, onefile = FALSE, paper = "special",
height =6, width = 12, point=18)
par(mfrow=c(1,2))
plot(lasso.mod,"lambda", label=TRUE,xlim = c(-9,-1))
set.seed (10)
cv.out=cv.glmnet(x,y,alpha =bestalpha)#cross-validation
plot(cv.out)
dev.off()
bestlam =cv.out$lambda.1se
lasso.pred=predict(lasso.mod,s=bestlam ,newx=x)
mean((lasso.pred -y)^2) #MSE for elastic net
out=glmnet(x,y,alpha =bestalpha)
lasso.coef=predict(out, type ="coefficients",s=bestlam)[1:10,]
lasso.coef
######## Hierarchical lasso ########
#strong hierarchy (SHL)
lasso.str.fit2<-hierNet.path(x,y,strong = TRUE)
str.cv2<-hierNet.cv(lasso.str.fit2,x,y,nfolds=10,folds=NULL,trace=0)
49

print(str.cv2)
bestlam<-str.cv2$lamhat.1se
lasso.str2<-hierNet(as.matrix(x), y, lam=bestlam, delta=1e-8, strong=TRUE, diagonal=TRUE, aa=NULL,
zz=NULL,
center=TRUE, stand.main=TRUE, stand.int=FALSE,
rho=nrow(x), niter=100, sym.eps=1e-3,
step=1, maxiter=2000, backtrack=0.2, tol=1e-5, trace=0)
yhat<-predict(lasso.str2, newx=x, newzz=NULL)
mean((yhat -y)^2) #MSE for strong hierarchical
lasso.str2
write.csv(lasso.str2$th,"ds2TREEstrth.csv")
#Wheel plot for SHL
adjM<-abs(lasso.str2$th)
all(adjM == t(adjM))
rownames(adjM) <- colnames(x)
colnames(adjM) <- colnames(x)
postscript("DS2TREEstr.eps", horizontal = FALSE, onefile = FALSE, paper = "special", height = 6, width = 6)
par(mfrow=c(1,1))
G <- new("graphAM", adjMat = adjM, edgemode = "directed")
ng.LG <- ng_graph(name = "Dataset2:strong hierarchy", graph = G, sep = '++', layout = "circle")
plot(ng.LG)
dev.off()
#weak hierarchy (WHL)
lasso.wk.fit2<-hierNet.path(x,y,strong = FALSE)
wk.cv2<-hierNet.cv(lasso.wk.fit2,x,y,nfolds=10,folds=NULL,trace=0)
postscript("DS2TREEInteractions_scaled.eps", horizontal = FALSE, onefile = FALSE, paper = "special",
height = 6, width = 8)
par(mfrow=c(1,2))
plot(str.cv2)
plot(wk.cv2)
dev.off()
print(wk.cv2)
wk.cv2$cv.err
bestlam<-wk.cv2$lamhat.1se
lasso.wk2<-hierNet(x, y, lam=bestlam, delta=1e-8, strong=FALSE, diagonal=TRUE, aa=NULL, zz=NULL,
center=TRUE, stand.main=TRUE, stand.int=FALSE,
rho=nrow(x), niter=100, sym.eps=1e-3,
step=1, maxiter=2000, backtrack=0.2, tol=1e-5, trace=0)
yhat<-predict(lasso.wk2, newx=x, newzz=NULL)
50

mean((yhat -y)^2) #MSE for weak hierarchical
lasso.wk2
write.csv(lasso.wk2$th,"ds2TREEwkth.csv")
#Wheel plot for WHL
adjM<-abs(lasso.wk2$th)
all(adjM == t(adjM))
rownames(adjM) <- colnames(x)
colnames(adjM) <- colnames(x)
postscript("DS2TREEwk.eps", horizontal = FALSE, onefile = FALSE, paper = "special", height = 6, width =
6)
par(mfrow=c(1,1))
G <- new("graphAM", adjMat = adjM, edgemode = "directed")
ng.LG <- ng_graph(name = "Dataset2:weak hierarchy", graph = G, sep = '++', layout = "circle")
plot(ng.LG)
dev.off()
#Appendix: annotated R-codes
library(RnavGraph) #Wheel plot
library(RnavGraphImageData) #Wheel plot
library(Rgraphviz) #Wheel plot
library(rpart) #Classification and regression tree
library(sas7bdat) #Read SAS dataset
library(hierNet) #Lasso for hierarchical interactions
######## Read in real world data set from SAS ########
ds<-read.sas7bdat("data_05182015.sas7bdat")
######## Classification & regression tree ########
# grow the tree
n<-length(ds$id) #sample size
ds.cart <- rpart(
mdi ~
child_sex+mom_educ+mom_age+mom_race+mom_smoke+lip_PBDE_47+lip_PBDE_99+lip_PBDE_100+li
p_PBDE_153+lip_hcb+
lip_pp_dde+lip_oxychlor+lip_nonachlor+lip_pcb74+lip_pcb99+lip_pcb105+lip_pcb118+lip_pcb146+lip_p
cb153+lip_pcb156+lip_pcb170+lip_pcb180
51

+lip_pcb187+lip_pcb194+lip_pcb199+lip_pcb138_158+lip_pcb196_203, method="anova",
control=rpart.control(minsplit=n*0.01,cp=0.01),data=as.data.frame(ds))
#prune the tree
ds.pcart <- prune(ds.cart, cp= ds.cart$cptable[which.min(ds.cart$cptable[, "xerror"]), "CP"])
levels(ds.pcart$frame$var)
#standardize continuous independent vars and outcome by 2*SD, keep binary intact
std2<-function(var)
{var<-(var-mean(var))/(2*sd(var))}
#subset dataset based on the tree nodes
x<-subset(ds, select=levels(ds.pcart$frame$var)[-1])
######## Data preparation ########
x<-data.frame(x)
x[,-c(14,15)]<-sapply(x[,-c(14,15)],log)#log-transform continous variables
x<-sapply(x,std2)#standardize continuous variables
y<-ds$mdi
y<-log(y)#log-transform outcome variable
y<-std2(y)#standardize outcome variable
######## Hierarchical LASSO ########
#strong hierarchy lasso (SHL)
lasso.str.fit<-hierNet.path(x,y,strong = TRUE)
str.cv<-hierNet.cv(lasso.str.fit,x,y,nfolds=10,folds=NULL,trace=0)#10-fold cross validation
bestlam<-str.cv$lamhat
lasso.str<-hierNet(as.matrix(x), y, lam=bestlam, delta=1e-8, strong=TRUE, diagonal=TRUE, aa=NULL,
zz=NULL,
center=TRUE, stand.main=TRUE, stand.int=FALSE,
rho=nrow(x), niter=100, sym.eps=1e-3,
step=1, maxiter=2000, backtrack=0.2, tol=1e-5, trace=0)
hierNet.varimp(lasso.str, x, y)
yhat<-predict(lasso.str, newx=x, newzz=NULL)
mean((yhat -y)^2) #MSE for SHL,MSE= 0.2061
lasso.str #Results from SHL
write.csv(lasso.str$th,"dsTREEstrth.csv")
#Draw wheel plot
adjM<-abs(lasso.str$th)
rownames(adjM) <- colnames(x)
colnames(adjM) <- colnames(x)
52

postscript("DSTREEstr.eps", horizontal = FALSE, onefile = FALSE, paper = "special", height = 6, width = 6)
par(mfrow=c(1,1))
G <- new("graphAM", adjMat = adjM, edgemode = "directed")
ng.LG <- ng_graph(name = "Real world dataset:strong hierarchy", graph = G, sep = '++', layout = "circle")
plot(ng.LG)
dev.off()
######## Hierarchical LASSO ########
#weak hierarchy lasso (WHL)
lasso.wk.fit<-hierNet.path(x,y,strong = FALSE)
wk.cv<-hierNet.cv(lasso.wk.fit,x,y,nfolds=10,folds=NULL,trace=0)
bestlam<-wk.cv$lamhat
lasso.wk<-hierNet(x, y, lam=bestlam, delta=1e-8, strong=FALSE, diagonal=TRUE, aa=NULL, zz=NULL,
center=TRUE, stand.main=TRUE, stand.int=FALSE,
rho=nrow(x), niter=100, sym.eps=1e-3,
step=1, maxiter=2000, backtrack=0.2, tol=1e-5, trace=0)
hierNet.varimp(lasso.wk, x, y)
yhat<-predict(lasso.wk, newx=x, newzz=NULL)
mean((yhat -y)^2) #MSE for WHL,0.1950767
lasso.wk #Results from WHL
write.csv(lasso.wk$th,"dsTREEwkth.csv")
#Draw wheel plot
adjM<-abs(lasso.wk$th)
rownames(adjM) <- colnames(x)
colnames(adjM) <- colnames(x)
postscript("DSTREEwk.eps", horizontal = FALSE, onefile = FALSE, paper = "special", height = 6, width = 6)
par(mfrow=c(1,1))
G <- new("graphAM", adjMat = adjM, edgemode = "directed")
ng.LG <- ng_graph(name = "Real world dataset:weak hierarchy", graph = G, sep = '++', layout = "circle")
plot(ng.LG)
dev.off()
53

9. A Two Stage Approach to Analysis of Health Effects of Environmental
Chemical Mixtures: Informed Sparse Principal Component Analysis
Followed by Segmented RegressionPresenting Author: Roman Jandarov
Organization: University of Cincinnati
Contributing Authors: Roman A. Jandarov, Liang Niu, and Susan M. Pinney
Code:
#####################################################################################
############
# function updates parameters in iterative optimization algorithm
update.min <- function(z, delta){
return(sign(z)*(abs(z)>=delta)*(abs(z)-delta))
}
#####################################################################################
############
# function calculates norm of vector
norm.vec <- function(vec){
sqrt(sum(vec^2))
}
#####################################################################################
############
# function calculates proportion of explained variance in sparse PCA
variance.space.sparse.pca <- function(X, spObj){
pev_tmp = rep(NA, dim(spObj$v)[2])
for(k in 1:(dim(spObj$v)[2])){
vv = spObj$v[,1:k]
V_k = X%*%vv%*%solve(t(vv)%*%vv)%*%t(vv)
pev_tmp[k] = sum(diag(t(V_k)%*%V_k))/sum(diag(t(X)%*%X))
}
out = pev_tmp - c(0, pev_tmp[1:(length(pev_tmp)-1)])
out
}
54

#####################################################################################
############
# function calculates frobenius norm of matrix X-Y
frob.norm <- function(X, Y){
tmp = (X - Y)
sum(diag(tmp%*%t(tmp))) + 2*lambda2*sum(abs(beta))
}
#####################################################################################
############
# function calculates PCA one component at a time
informed.sparse.pca.one.at.time <-function(X, lambda, weights, niter=100, err=10^(-3), trace=FALSE){
u.init = svd(X)$u[,1]
v.init = svd(X)$v[,1]*svd(X)$d[1]
u.d <- v.d <- 1
iter <- 0
while(u.d>err | v.d>err){
iter <- iter+1
v1 <- t(X)%*%u.init
v1 <- update.min(v1, lambda*weights)
u1 = c(X%*%v1)
u1 = u1/norm.vec(u1)
u.d <- sqrt(sum((u1-u.init)^2))
v.d <- sqrt(sum((v1-v.init)^2))
if(iter > niter){
print("Fail to converge! Increase the niter!")
break
}
u.init <- u1
v.init <- v1
if(trace){
print(paste("iter:", iter, "u.d:", u.d, "v.d:", v.d))
55

}
}
return(list(u=cbind(u1), v = cbind(v1)))
}
#####################################################################################
############
# function calculates all PCA components
informed.sparse.pca.all.at.once <-function(X, lambda.vec, weights, K, niter=100, err=10^(-3),
trace=FALSE){
u = matrix(NA, dim(X)[1], K)
v = matrix(NA, dim(X)[2], K)
v.norm = matrix(NA, dim(X)[2], K)
X.0 = X
for(i in 1:K){
tmp = informed.sparse.pca.one.at.time(X.0, lambda.vec[i], weights)
u[,i] = tmp$u
v[,i] = tmp$v
v.norm[,i] = tmp$v/norm.vec(tmp$v)
X.0 = X.0 - u[,i]%*%t(v[,i])
}
return(list(u=cbind(u), v = cbind(v), v.norm = cbind(v.norm)))
}
#####################################################################################
############
# Example with simulated data 2
# load data
MyData1 = read.csv(file = "DataSet2M.csv", header = TRUE)
Exposures = (MyData1[,-c(1:2, ((dim(MyData1)[2]-2):(dim(MyData1)[2])))])
# calculate weights
X = as.matrix(scale(Exposures))
t = apply(Exposures, 2, quantile, prob = c(0.05)) -
apply(Exposures, 2, quantile, prob = c(0.95))
weights = 1/rank(abs(t)); weights = weights/norm.vec(weights)
# define penalty
56

K = 5
lambda.vec = rep(0, 14)
lambda.vec = lambda.vec[1:K]
t = informed.sparse.pca.all.at.once(X, lambda.vec, weights, K)
# view loadings
t$v.norm
sum(variance.space.sparse.pca(X, t))
order(weights)
#####################################################################################
############
# segmented regression is used in second step of ourproach
# example
library(segmented)
regSeg.lm = lm(y ~ PC1 + PC2 + PC3 + PC4 + PC5 + PC5*z3 + z1 + z2 + z3, data = dati)
o1<-segmented(regSeg.lm, seg.Z=~PC1+PC2+PC3+PC4+PC5, psi=list(PC1=NA, PC2=NA, PC3=NA, PC4 =
NA, PC5 = NA),
control=seg.control(stop.if.error=FALSE,n.boot=0, it.max=200))
summary(o1)
#####################################################################################
############
57

10. Direct Assessment of Public Health Impacts of Exposure Mixtures:
A Bayesian G-Formula Approach
Presenting Author: Alexander Keil
Organization: UNC Chapel Hill
Contributing Authors: Alexander P. Keil, Jessie P. Buckley, Jessie K. Edwards
Code:
See next page for code.
58

Code for NIEHS Epi-Stats Workshop (July 13-14, 2015)
Authors: Alexander Keil, Jessie Edwards, Jessie Buckley
Language: STAN (v 2.6.0)
Contents: 3 programs (bgf_ds1_01.stan, bgf_ds2_01.stan, bgf_real_01.stan)
Description: implement Bayesian g-formula using Bayesian LASSO for shrinkage on two simulated datasets and one real-world data
set
/*---------------------------------------------------------------------------------------------------------------------
Author: Alex Keil
Program: bgf_ds1_01.stan
Language: STAN 2.6.0
Date: Monday, March 16, 2015 at 10:19:18 AM
Project: NIEHS mixtures workshop
Tasks: implement bayesian lasso g-formula algorithm, fixing bugs from previous version
Data in:
Data out:
Description:
Released under the GNU General Public License: http://www.gnu.org/copyleft/gpl.html
---------------------------------------------------------------------------------------------------------------------*/
functions{
//expexpon function from sas (exponenential-exponential distribution)
// note that this is distinct from the double exponenential distribution
// call using expexpon(scale);
real expexpon_log(real y, real scale){
return log(1 / scale * exp(y) * exp( -exp(y) / scale));
}
}
data{
int<lower=0> N;
int<lower=0> J;
row_vector[N] y;
row_vector[N] x1;
row_vector[N] x2;
row_vector[N] x3;
row_vector[N] x4;
row_vector[N] x5;
row_vector[N] x6;
row_vector[N] x7;
row_vector[N] z;
59

}
transformed data{
real mu0[J];
//interventions
matrix[18,N] x1int; //size 16 array of N-sized arrays
matrix[18,N] x2int;
matrix[18,N] x3int;
matrix[18,N] x4int;
matrix[18,N] x5int;
matrix[18,N] x6int;
matrix[18,N] x7int;
row_vector[N] x1p;
row_vector[N] x2p;
row_vector[N] x3p;
row_vector[N] x4p;
row_vector[N] x5p;
row_vector[N] x6p;
row_vector[N] x7p;
real q1;
real q2;
real q3;
real q4;
real q5;
real q6;
real q7;
//getting quantiles
q1 <- sort_asc(x1)[375]; //75th percentile
q2 <- sort_asc(x2)[375]; //75th percentile
q3 <- sort_asc(x3)[375]; //75th percentile
q4 <- sort_asc(x4)[375]; //75th percentile
q5 <- sort_asc(x5)[375]; //75th percentile
q6 <- sort_asc(x6)[375]; //75th percentile
q7 <- sort_asc(x7)[375]; //75th percentile
for(n in 1:N){
x1p[n] <- cbrt(x1[n]); // cube root function
x2p[n] <- cbrt(x2[n]);
x3p[n] <- cbrt(x3[n]);
60

x4p[n] <- cbrt(x4[n]);
x5p[n] <- cbrt(x5[n]);
x6p[n] <- cbrt(x6[n]);
x7p[n] <- cbrt(x7[n]);
}
// making design matrices for interventions
for(k in 1:18){
x1int[k] <- x1p;
x2int[k] <- x2p;
x3int[k] <- x3p;
x4int[k] <- x4p;
x5int[k] <- x5p;
x6int[k] <- x6p;
x7int[k] <- x7p;
}
//interventions
for(n in 1:N){
//single interventions
//for 1st-7th interventions, multiply variable by 50%
x1int[1,n] <- cbrt(x1[n] * 0.5);
x2int[2,n] <- cbrt(x2[n] * 0.5);
x3int[3,n] <- cbrt(x3[n] * 0.5);
x4int[4,n] <- cbrt(x4[n] * 0.5);
x5int[5,n] <- cbrt(x5[n] * 0.5);
x6int[6,n] <- cbrt(x6[n] * 0.5);
x7int[7,n] <- cbrt(x7[n] * 0.5);
//for 8th-14th interventions, compare single variable to its 3rd quartile
x1int[8,n] <- if_else(x1[n]<q1, x1p[n], cbrt(q1));
x2int[9,n] <- if_else(x2[n]<q2, x2p[n], cbrt(q2));
x3int[10,n] <- if_else(x3[n]<q3, x3p[n], cbrt(q3));
x4int[11,n] <- if_else(x4[n]<q4, x4p[n], cbrt(q4));
x5int[12,n] <- if_else(x5[n]<q5, x5p[n], cbrt(q5));
x6int[13,n] <- if_else(x6[n]<q6, x6p[n], cbrt(q6));
x7int[14,n] <- if_else(x7[n]<q7, x7p[n], cbrt(q7));
//joint interventions
// x1, x2
x1int[15,n] <- cbrt(x1[n] * 0.5);
x2int[15,n] <- cbrt(x2[n] * 0.5);
x3int[15,n] <- cbrt(x3[n] * 0.5);
61

x1int[16,n] <- if_else(x1[n]<q1, x1p[n], cbrt(q1));
x2int[16,n] <- if_else(x2[n]<q2, x2p[n], cbrt(q2));
x3int[16,n] <- if_else(x3[n]<q3, x3p[n], cbrt(q3));
// x4, x7
x4int[17,n] <- cbrt(x4[n] * 0.5);
x7int[17,n] <- cbrt(x7[n] * 0.5);
x4int[18,n] <- if_else(x4[n]<q4, x4p[n], cbrt(q4));
x7int[18,n] <- if_else(x7[n]<q7, x7p[n], cbrt(q7));
}
//prior for beta
mu0 <- rep_array(0.0, J);
}
parameters{
real intercept;
vector[J] b;
vector<lower=0>[J] omega;
real<lower=0> sigma2;
real<lower=0> lambda;
}
transformed parameters{
}
model{
vector[J] tau;
row_vector[N] py;
//hyper-hyperpriors for shrinkage
lambda ~ gamma(1.0, 10.0);
//hyperpriors for beta
sigma2 ~ inv_gamma(0.1, 0.1); //scale parameter is switched in stan vs. sas (stan scale parameter = iscale parameter
in sas)
for(j in 1:J){
//unable to vectorize this due to limitations with creating custom sampling distributions
omega[j] ~ expexpon(2.0/lambda); //custom sampler function created above
tau[j] <- sqrt(sigma2*exp(omega[j]));
}
//model for y
intercept ~ normal(0,sqrt(2000));
62
b ~ normal(mu0,tau); //stan uses standard deviation in second argument
py <-
intercept + b[1] * x1p + b[2] * x2p + b[3] * x3p + b[4] * x4p + b[5] *
x5p + b[6] * x6p + b[7] * x7p + b[8] * z + b[9] * x1p .* x1p + b[10] *
x1p .* x2p + b[11] * x1p .* x3p + b[12] * x1p .* x4p + b[13] *
x1p .* x5p + b[14] * x1p .* x6p + b[15] * x1p .* x7p + b[16] * x1p .* z +
b[17] * x2p .* x2p + b[18] * x2p .* x3p + b[19] * x2p .* x4p + b[20] *
x2p .* x5p + b[21] * x2p .* x6p + b[22] * x2p .* x7p + b[23] * x2p .* z +
b[24] * x3p .* x3p + b[25] * x3p .* x4p + b[26] * x3p .* x5p + b[27] *
x3p .* x6p + b[28] * x3p .* x7p + b[29] * x3p .* z + b[30] * x4p .* x4p +
b[31] * x4p .* x5p + b[32] * x4p .* x6p + b[33] * x4p .* x7p + b[34] *
x4p .* z + b[35] * x5p .* x5p + b[36] * x5p .* x6p + b[37] * x5p .* x7p +
b[38] * x5p .* z + b[39] * x6p .* x6p + b[40] * x6p .* x7p + b[41] * x6p .* z +
b[42] * x7p .* x7p + b[43] * x7p .* z;
y ~ normal(py, sqrt(sigma2));
}
generated quantities{
real lasso;
//matrix[18, N] iy; //uncomment if you want individual level counterfactual variables
vector[18] fy;
real fynat;
lasso <- sqrt(lambda);
fynat <- mean(intercept + b[1] * x1p + b[2] * x2p + b[3] * x3p + b[4] * x4p + b[5] *
x5p + b[6] * x6p + b[7] * x7p + b[8] * z + b[9] * x1p .* x1p + b[10] *
x1p .* x2p + b[11] * x1p .* x3p + b[12] * x1p .* x4p + b[13] *
x1p .* x5p + b[14] * x1p .* x6p + b[15] * x1p .* x7p + b[16] * x1p .* z +
b[17] * x2p .* x2p + b[18] * x2p .* x3p + b[19] * x2p .* x4p + b[20] *
x2p .* x5p + b[21] * x2p .* x6p + b[22] * x2p .* x7p + b[23] * x2p .* z +
b[24] * x3p .* x3p + b[25] * x3p .* x4p + b[26] * x3p .* x5p + b[27] *
x3p .* x6p + b[28] * x3p .* x7p + b[29] * x3p .* z + b[30] * x4p .* x4p +
b[31] * x4p .* x5p + b[32] * x4p .* x6p + b[33] * x4p .* x7p + b[34] *
x4p .* z + b[35] * x5p .* x5p + b[36] * x5p .* x6p + b[37] * x5p .* x7p +
b[38] * x5p .* z + b[39] * x6p .* x6p + b[40] * x6p .* x7p + b[41] * x6p .* z +
b[42] * x7p .* x7p + b[43] * x7p .* z);
//generate counterfactuals
for(k in 1:18){
/*
// uncomment this section if you want individual level counterfactual variables
iy[k] <-
intercept + b[1] * x1int[k] + b[2] * x2int[k] + b[3] * x3int[k] + b[4] * x4int[k] + b[5] *
63

x5int[k] + b[6] * x6int[k] + b[7] * x7int[k] + b[8] * z + b[9] * x1int[k] .* x1int[k] + b[10] *
x1int[k] .* x2int[k] + b[11] * x1int[k] .* x3int[k] + b[12] * x1int[k] .* x4int[k] + b[13] *
x1int[k] .* x5int[k] + b[14] * x1int[k] .* x6int[k] + b[15] * x1int[k] .* x7int[k] + b[16] * x1int[k] .* z +
b[17] * x2int[k] .* x2int[k] + b[18] * x2int[k] .* x3int[k] + b[19] * x2int[k] .* x4int[k] + b[20] *
x2int[k] .* x5int[k] + b[21] * x2int[k] .* x6int[k] + b[22] * x2int[k] .* x7int[k] + b[23] * x2int[k] .* z +
b[24] * x3int[k] .* x3int[k] + b[25] * x3int[k] .* x4int[k] + b[26] * x3int[k] .* x5int[k] + b[27] *
x3int[k] .* x6int[k] + b[28] * x3int[k] .* x7int[k] + b[29] * x3int[k] .* z + b[30] * x4int[k] .* x4int[k] +
b[31] * x4int[k] .* x5int[k] + b[32] * x4int[k] .* x6int[k] + b[33] * x4int[k] .* x7int[k] + b[34] *
x4int[k] .* z + b[35] * x5int[k] .* x5int[k] + b[36] * x5int[k] .* x6int[k] + b[37] * x5int[k] .* x7int[k] +
b[38] * x5int[k] .* z + b[39] * x6int[k] .* x6int[k] + b[40] * x6int[k] .* x7int[k] + b[41] * x6int[k] .* z +
b[42] * x7int[k] .* x7int[k] + b[43] * x7int[k] .* z;
fy[k] <- mean(iy[k]);
*/
fy[k] <- mean(
intercept + b[1] * x1int[k] + b[2] * x2int[k] + b[3] * x3int[k] + b[4] * x4int[k] + b[5] *
x5int[k] + b[6] * x6int[k] + b[7] * x7int[k] + b[8] * z + b[9] * x1int[k] .* x1int[k] + b[10] *
x1int[k] .* x2int[k] + b[11] * x1int[k] .* x3int[k] + b[12] * x1int[k] .* x4int[k] + b[13] *
x1int[k] .* x5int[k] + b[14] * x1int[k] .* x6int[k] + b[15] * x1int[k] .* x7int[k] + b[16] * x1int[k] .* z +
b[17] * x2int[k] .* x2int[k] + b[18] * x2int[k] .* x3int[k] + b[19] * x2int[k] .* x4int[k] + b[20] *
x2int[k] .* x5int[k] + b[21] * x2int[k] .* x6int[k] + b[22] * x2int[k] .* x7int[k] + b[23] * x2int[k] .* z +
b[24] * x3int[k] .* x3int[k] + b[25] * x3int[k] .* x4int[k] + b[26] * x3int[k] .* x5int[k] + b[27] *
x3int[k] .* x6int[k] + b[28] * x3int[k] .* x7int[k] + b[29] * x3int[k] .* z + b[30] * x4int[k] .* x4int[k] +
b[31] * x4int[k] .* x5int[k] + b[32] * x4int[k] .* x6int[k] + b[33] * x4int[k] .* x7int[k] + b[34] *
x4int[k] .* z + b[35] * x5int[k] .* x5int[k] + b[36] * x5int[k] .* x6int[k] + b[37] * x5int[k] .* x7int[k] +
b[38] * x5int[k] .* z + b[39] * x6int[k] .* x6int[k] + b[40] * x6int[k] .* x7int[k] + b[41] * x6int[k] .* z +
b[42] * x7int[k] .* x7int[k] + b[43] * x7int[k] .* z);
}
}
/*---------------------------------------------------------------------------------------------------------------------
Author: Alex Keil
Program: bgf_ds2_01.stan
Language: STAN 2.6.0
Date: Monday, March 16, 2015 at 10:19:18 AM
Project: NIEHS mixtures workshop
Tasks: implement bayesian lasso g-formula algorithm, fixing bugs from previous version
Data in:
Data out:
Description:
Released under the GNU General Public License: http://www.gnu.org/copyleft/gpl.html
64

---------------------------------------------------------------------------------------------------------------------*/
functions{
//expexpon function from sas (exponenential-exponential distribution)
// note that this is distinct from the double exponenential distribution
// call using expexpon(scale);
real expexpon_log(real y, real scale){
return log(1 / scale * exp(y) * exp( -exp(y) / scale));
}
}
data{
int<lower=0> N;
int<lower=0> J;
row_vector[N] y;
row_vector[N] x1;
row_vector[N] x2;
row_vector[N] x3;
row_vector[N] x4;
row_vector[N] x5;
row_vector[N] x6;
row_vector[N] x7;
row_vector[N] x8;
row_vector[N] x9;
row_vector[N] x10;
row_vector[N] x11;
row_vector[N] x12;
row_vector[N] x13;
row_vector[N] x14;
row_vector[N] z1;
row_vector[N] z2;
row_vector[N] z3;
}
transformed data{
real mu0[J];
//interventions
matrix[32,N] x1int; //size 16 array of N-sized arrays
matrix[32,N] x2int;
matrix[32,N] x3int;
matrix[32,N] x4int;
matrix[32,N] x5int;
matrix[32,N] x6int;
65

matrix[32,N] x7int;
matrix[32,N] x8int;
matrix[32,N] x9int;
matrix[32,N] x10int;
matrix[32,N] x11int;
matrix[32,N] x12int;
matrix[32,N] x13int;
matrix[32,N] x14int;
row_vector[N] x1p;
row_vector[N] x2p;
row_vector[N] x3p;
row_vector[N] x4p;
row_vector[N] x5p;
row_vector[N] x6p;
row_vector[N] x7p;
row_vector[N] x8p;
row_vector[N] x9p;
row_vector[N] x10p;
row_vector[N] x11p;
row_vector[N] x12p;
row_vector[N] x13p;
row_vector[N] x14p;
real q1;
real q2;
real q3;
real q4;
real q5;
real q6;
real q7;
real q8;
real q9;
real q10;
real q11;
real q12;
real q13;
real q14;
//getting quantiles
q1 <- sort_asc(x1)[375]; //75th percentile
q2 <- sort_asc(x2)[375];
q3 <- sort_asc(x3)[375];
66

q4 <- sort_asc(x4)[375];
q5 <- sort_asc(x5)[375];
q6 <- sort_asc(x6)[375];
q7 <- sort_asc(x7)[375];
q8 <- sort_asc(x8)[375];
q9 <- sort_asc(x9)[375];
q10 <- sort_asc(x10)[375];
q11 <- sort_asc(x11)[375];
q12 <- sort_asc(x12)[375];
q13 <- sort_asc(x13)[375];
q14 <- sort_asc(x14)[375];
for(n in 1:N){
x1p[n] <- x1[n]; // no transformation, already log transformed (per NIEHS)
x2p[n] <- x2[n];
x3p[n] <- x3[n];
x4p[n] <- x4[n];
x5p[n] <- x5[n];
x6p[n] <- x6[n];
x7p[n] <- x7[n];
x8p[n] <- x8[n];
x9p[n] <- x9[n];
x10p[n] <- x10[n];
x11p[n] <- x11[n];
x12p[n] <- x12[n];
x13p[n] <- x13[n];
x14p[n] <- x14[n];
}
// making design matrices for interventions (using row assigment)
for(k in 1:32){
x1int[k] <- x1p;
x2int[k] <- x2p;
x3int[k] <- x3p;
x4int[k] <- x4p;
x5int[k] <- x5p;
x6int[k] <- x6p;
x7int[k] <- x7p;
x8int[k] <- x8p;
x9int[k] <- x9p;
67

x10int[k] <- x10p;
x11int[k] <- x11p;
x12int[k] <- x12p;
x13int[k] <- x13p;
x14int[k] <- x14p;
}
//interventions
for(n in 1:N){
//single interventions
//for 1st-7th interventions, add log(%) because this is natural log variable
x1int[1,n] <- x1[n] + log(0.5);
x2int[2,n] <- x2[n] + log(0.5);
x3int[3,n] <- x3[n] + log(0.5);
x4int[4,n] <- x4[n] + log(0.5);
x5int[5,n] <- x5[n] + log(0.5);
x6int[6,n] <- x6[n] + log(0.5);
x7int[7,n] <- x7[n] + log(0.5);
x8int[8,n] <- x8[n] + log(0.5);
x9int[9,n] <- x9[n] + log(0.5);
x10int[10,n] <- x10[n] + log(0.5);
x11int[11,n] <- x11[n] + log(0.5);
x12int[12,n] <- x12[n] + log(0.5);
x13int[13,n] <- x13[n] + log(0.5);
x14int[14,n] <- x14[n] + log(0.5);
//for 15th-28th interventions, compare single variable to its 3rd quartile
x1int[15,n] <- if_else(x1p[n]<q1, x1p[n], q1);
x2int[16,n] <- if_else(x2p[n]<q2, x2p[n], q2);
x3int[17,n] <- if_else(x3p[n]<q3, x3p[n], q3);
x4int[18,n] <- if_else(x4p[n]<q4, x4p[n], q4);
x5int[19,n] <- if_else(x5p[n]<q5, x5p[n], q5);
x6int[20,n] <- if_else(x6p[n]<q6, x6p[n], q6);
x7int[21,n] <- if_else(x7p[n]<q7, x7p[n], q7);
x8int[22,n] <- if_else(x8p[n]<q8, x8p[n], q8);
x9int[23,n] <- if_else(x9p[n]<q9, x9p[n], q9);
x10int[24,n] <- if_else(x10p[n]<q10, x10p[n], q10);
x11int[25,n] <- if_else(x11p[n]<q11, x11p[n], q11);
x12int[26,n] <- if_else(x12p[n]<q12, x12p[n], q12);
x13int[27,n] <- if_else(x13p[n]<q13, x13p[n], q13);
x14int[28,n] <- if_else(x14p[n]<q14, x14p[n], q14);
//joint interventions
68

//x3,4,5
x3int[29,n] <- x3[n] + log(0.5);
x4int[29,n] <- x4[n] + log(0.5);
x5int[29,n] <- x5[n] + log(0.5);
x3int[30,n] <- if_else(x3p[n]<q3, x3p[n], q3);
x4int[30,n] <- if_else(x4p[n]<q4, x4p[n], q4);
x5int[30,n] <- if_else(x5p[n]<q5, x5p[n], q5);
//x10, 12
x10int[31,n] <- x10[n] + log(0.5);
x12int[31,n] <- x12[n] + log(0.5);
x10int[32,n] <- if_else(x10p[n]<q10, x10p[n], q10);
x12int[32,n] <- if_else(x12p[n]<q12, x12p[n], q12);
}
//prior for beta
mu0 <- rep_array(0.0, J);
}
parameters{
real intercept;
vector[J] b;
vector<lower=0>[J] omega;
real<lower=0> sigma2;
real<lower=0> lambda;
}
transformed parameters{
}
model{
vector[J] tau;
row_vector[N] py;
//hyper-hyperpriors for shrinkage
lambda ~ gamma(1.0, 10.0);
//hyperpriors for beta
sigma2 ~ inv_gamma(0.1, 0.1); //scale parameter is switched in stan vs. sas (stan scale parameter = iscale parameter
in sas)
for(j in 1:J){
//unable to vectorize this due to limitations with creating custom sampling distributions
69

omega[j] ~ expexpon(2.0/lambda); //custom sampler function created above
tau[j] <- sqrt(sigma2*exp(omega[j]));
}
//model for y
intercept ~ normal(0,sqrt(2000));
b ~ normal(mu0,tau); //stan uses standard deviation in second argument
py <-
intercept + b[1] * x1p + b[2] * x2p + b[3] * x3p + b[4] * x4p + b[5] * x5p + b[6] * x6p + b[7] * x7p + b[8] *
x8p +
b[9] * x9p + b[10] * x10p + b[11] * x11p + b[12] * x12p + b[13] * x13p + b[14] * x14p + b[15] * z1 + b[16]
* z2 + b[17] * z3
+ b[18] * x1p .* x1p + b[19] * x1p .* x10p + b[20] * x1p .* x11p + b[21] * x1p .* x12p + b[22] * x1p .*
x13p + b[23] * x1p .* x14p + b[24] * x1p .* x2p +
b[25] * x1p .* x3p + b[26] * x1p .* x4p + b[27] * x1p .* x5p + b[28] * x1p .* x6p + b[29] * x1p .* x7p +
b[30] * x1p .* x8p + b[31] * x1p .* x9p + b[32] *
x1p .* z1 + b[33] * x1p .* z2 + b[34] * x1p .* z3 + b[35] * x10p .* x10p + b[36] * x10p .* x11p + b[37] *
x10p .* x12p + b[38] * x10p .* x13p + b[39] *
x10p .* x14p + b[40] * x10p .* z1 + b[41] * x10p .* z2 + b[42] * x10p .* z3 + b[43] * x11p .* x11p + b[44]
* x11p .* x12p + b[45] * x11p .* x13p +
b[46] * x11p .* x14p + b[47] * x11p .* z1 + b[48] * x11p .* z2 + b[49] * x11p .* z3 + b[50] * x12p .* x12p
+ b[51] * x12p .* x13p + b[52] *
x12p .* x14p + b[53] * x12p .* z1 + b[54] * x12p .* z2 + b[55] * x12p .* z3 + b[56] * x13p .* x13p + b[57]
* x13p .* x14p + b[58] * x13p .* z1 + b[59]
* x13p .* z2 + b[60] * x13p .* z3 + b[61] * x14p .* x14p + b[62] * x14p .* z1 + b[63] * x14p .* z2 + b[64]
* x14p .* z3 + b[65] * x2p .* x10p + b[66]
* x2p .* x11p + b[67] * x2p .* x12p + b[68] * x2p .* x13p + b[69] * x2p .* x14p + b[70] * x2p .* x2p +
b[71] * x2p .* x3p + b[72] * x2p .* x4p + b[73] *
x2p .* x5p + b[74] * x2p .* x6p + b[75] * x2p .* x7p + b[76] * x2p .* x8p + b[77] * x2p .* x9p + b[78] *
x2p .* z1 + b[79] * x2p .* z2 + b[80] * x2p .* z3 +
b[81] * x3p .* x10p + b[82] * x3p .* x11p + b[83] * x3p .* x12p + b[84] * x3p .* x13p + b[85] * x3p .*
x14p + b[86] * x3p .* x3p + b[87] * x3p .* x4p +
b[88] * x3p .* x5p + b[89] * x3p .* x6p + b[90] * x3p .* x7p + b[91] * x3p .* x8p + b[92] * x3p .* x9p +
b[93] * x3p .* z1 + b[94] * x3p .* z2 + b[95] *
x3p .* z3 + b[96] * x4p .* x10p + b[97] * x4p .* x11p + b[98] * x4p .* x12p + b[99] * x4p .* x13p + b[100]
* x4p .* x14p + b[101] * x4p .* x4p + b[102] *
x4p .* x5p + b[103] * x4p .* x6p + b[104] * x4p .* x7p + b[105] * x4p .* x8p + b[106] * x4p .* x9p +
b[107] * x4p .* z1 + b[108] * x4p .* z2 + b[109] *
x4p .* z3 + b[110] * x5p .* x10p + b[111] * x5p .* x11p + b[112] * x5p .* x12p + b[113] * x5p .* x13p +
b[114] * x5p .* x14p + b[115] * x5p .* x5p +
70

b[116] * x5p .* x6p + b[117] * x5p .* x7p + b[118] * x5p .* x8p + b[119] * x5p .* x9p + b[120] * x5p .* z1
+ b[121] * x5p .* z2 + b[122] * x5p .* z3 +
b[123] * x6p .* x10p + b[124] * x6p .* x11p + b[125] * x6p .* x12p + b[126] * x6p .* x13p + b[127] * x6p
.* x14p + b[128] * x6p .* x6p + b[129] *
x6p .* x7p + b[130] * x6p .* x8p + b[131] * x6p .* x9p + b[132] * x6p .* z1 + b[133] * x6p .* z2 + b[134]
* x6p .* z3 + b[135] * x7p .* x10p + b[136] *
x7p .* x11p + b[137] * x7p .* x12p + b[138] * x7p .* x13p + b[139] * x7p .* x14p + b[140] * x7p .* x7p +
b[141] * x7p .* x8p + b[142] * x7p .* x9p +
b[143] * x7p .* z1 + b[144] * x7p .* z2 + b[145] * x7p .* z3 + b[146] * x8p .* x10p + b[147] * x8p .* x11p
+ b[148] * x8p .* x12p + b[149] *
x8p .* x13p + b[150] * x8p .* x14p + b[151] * x8p .* x8p + b[152] * x8p .* x9p + b[153] * x8p .* z1 +
b[154] * x8p .* z2 + b[155] * x8p .* z3 + b[156]
* x9p .* x10p + b[157] * x9p .* x11p + b[158] * x9p .* x12p + b[159] * x9p .* x13p + b[160] * x9p .* x14p
+ b[161] * x9p .* x9p + b[162] * x9p .* z1 +
b[163] * x9p .* z2 + b[164] * x9p .* z3 + b[165] * z1 .* z1 + b[166] * z1 .* z2 + b[167] * z1 .* z3 +
b[168] * z2 .* z2 + b[169] * z2 .* z3;
y ~ normal(py, sqrt(sigma2));
}
generated quantities{
real lasso;
real fynat;
//matrix[32, N] iy; //uncomment if you want individual level counterfactual variables
vector[32] fy;
vector[32] fy_exp;
lasso <- sqrt(lambda);
fynat <- mean(intercept + b[1] * x1p + b[2] * x2p + b[3] * x3p + b[4] * x4p + b[5] * x5p + b[6] * x6p + b[7] * x7p +
b[8] * x8p +
b[9] * x9p + b[10] * x10p + b[11] * x11p + b[12] * x12p + b[13] * x13p + b[14] * x14p + b[15] * z1 + b[16]
* z2 + b[17] * z3
+ b[18] * x1p .* x1p + b[19] * x1p .* x10p + b[20] * x1p .* x11p + b[21] * x1p .* x12p + b[22] * x1p .*
x13p + b[23] * x1p .* x14p + b[24] * x1p .* x2p +
b[25] * x1p .* x3p + b[26] * x1p .* x4p + b[27] * x1p .* x5p + b[28] * x1p .* x6p + b[29] * x1p .* x7p +
b[30] * x1p .* x8p + b[31] * x1p .* x9p + b[32] *
x1p .* z1 + b[33] * x1p .* z2 + b[34] * x1p .* z3 + b[35] * x10p .* x10p + b[36] * x10p .* x11p + b[37] *
x10p .* x12p + b[38] * x10p .* x13p + b[39] *
x10p .* x14p + b[40] * x10p .* z1 + b[41] * x10p .* z2 + b[42] * x10p .* z3 + b[43] * x11p .* x11p + b[44]
* x11p .* x12p + b[45] * x11p .* x13p +
b[46] * x11p .* x14p + b[47] * x11p .* z1 + b[48] * x11p .* z2 + b[49] * x11p .* z3 + b[50] * x12p .* x12p
+ b[51] * x12p .* x13p + b[52] *
x12p .* x14p + b[53] * x12p .* z1 + b[54] * x12p .* z2 + b[55] * x12p .* z3 + b[56] * x13p .* x13p + b[57]
* x13p .* x14p + b[58] * x13p .* z1 + b[59]
71

* x13p .* z2 + b[60] * x13p .* z3 + b[61] * x14p .* x14p + b[62] * x14p .* z1 + b[63] * x14p .* z2 + b[64]
* x14p .* z3 + b[65] * x2p .* x10p + b[66]
* x2p .* x11p + b[67] * x2p .* x12p + b[68] * x2p .* x13p + b[69] * x2p .* x14p + b[70] * x2p .* x2p +
b[71] * x2p .* x3p + b[72] * x2p .* x4p + b[73] *
x2p .* x5p + b[74] * x2p .* x6p + b[75] * x2p .* x7p + b[76] * x2p .* x8p + b[77] * x2p .* x9p + b[78] *
x2p .* z1 + b[79] * x2p .* z2 + b[80] * x2p .* z3 +
b[81] * x3p .* x10p + b[82] * x3p .* x11p + b[83] * x3p .* x12p + b[84] * x3p .* x13p + b[85] * x3p .*
x14p + b[86] * x3p .* x3p + b[87] * x3p .* x4p +
b[88] * x3p .* x5p + b[89] * x3p .* x6p + b[90] * x3p .* x7p + b[91] * x3p .* x8p + b[92] * x3p .* x9p +
b[93] * x3p .* z1 + b[94] * x3p .* z2 + b[95] *
x3p .* z3 + b[96] * x4p .* x10p + b[97] * x4p .* x11p + b[98] * x4p .* x12p + b[99] * x4p .* x13p + b[100]
* x4p .* x14p + b[101] * x4p .* x4p + b[102] *
x4p .* x5p + b[103] * x4p .* x6p + b[104] * x4p .* x7p + b[105] * x4p .* x8p + b[106] * x4p .* x9p +
b[107] * x4p .* z1 + b[108] * x4p .* z2 + b[109] *
x4p .* z3 + b[110] * x5p .* x10p + b[111] * x5p .* x11p + b[112] * x5p .* x12p + b[113] * x5p .* x13p +
b[114] * x5p .* x14p + b[115] * x5p .* x5p +
b[116] * x5p .* x6p + b[117] * x5p .* x7p + b[118] * x5p .* x8p + b[119] * x5p .* x9p + b[120] * x5p .* z1
+ b[121] * x5p .* z2 + b[122] * x5p .* z3 +
b[123] * x6p .* x10p + b[124] * x6p .* x11p + b[125] * x6p .* x12p + b[126] * x6p .* x13p + b[127] * x6p
.* x14p + b[128] * x6p .* x6p + b[129] *
x6p .* x7p + b[130] * x6p .* x8p + b[131] * x6p .* x9p + b[132] * x6p .* z1 + b[133] * x6p .* z2 + b[134]
* x6p .* z3 + b[135] * x7p .* x10p + b[136] *
x7p .* x11p + b[137] * x7p .* x12p + b[138] * x7p .* x13p + b[139] * x7p .* x14p + b[140] * x7p .* x7p +
b[141] * x7p .* x8p + b[142] * x7p .* x9p +
b[143] * x7p .* z1 + b[144] * x7p .* z2 + b[145] * x7p .* z3 + b[146] * x8p .* x10p + b[147] * x8p .* x11p
+ b[148] * x8p .* x12p + b[149] *
x8p .* x13p + b[150] * x8p .* x14p + b[151] * x8p .* x8p + b[152] * x8p .* x9p + b[153] * x8p .* z1 +
b[154] * x8p .* z2 + b[155] * x8p .* z3 + b[156]
* x9p .* x10p + b[157] * x9p .* x11p + b[158] * x9p .* x12p + b[159] * x9p .* x13p + b[160] * x9p .* x14p
+ b[161] * x9p .* x9p + b[162] * x9p .* z1 +
b[163] * x9p .* z2 + b[164] * x9p .* z3 + b[165] * z1 .* z1 + b[166] * z1 .* z2 + b[167] * z1 .* z3 +
b[168] * z2 .* z2 + b[169] * z2 .* z3);
//generate counterfactuals
for(k in 1:32){
/*
// uncomment this section if you want individual level counterfactual variables
iy[k] <-
intercept + b[1] * x1int[k] + b[2] * x2int[k] + b[3] * x3int[k] + b[4] * x4int[k] + b[5] * x5int[k] + b[6] *
x6int[k] + b[7] * x7int[k] + b[8] * x8int[k] +
b[9] * x9int[k] + b[10] * x10int[k] + b[11] * x11int[k] + b[12] * x12int[k] + b[13] * x13int[k] + b[14] *
x14int[k] + b[15] * z1 + b[16] * z2 + b[17] * z3
72

+ b[18] * x1int[k] .* x1int[k] + b[19] * x1int[k] .* x10int[k] + b[20] * x1int[k] .* x11int[k] + b[21] *
x1int[k] .* x12int[k] + b[22] * x1int[k] .* x13int[k] + b[23] * x1int[k] .* x14int[k] + b[24] * x1int[k] .* x2int[k] +
b[25] * x1int[k] .* x3int[k] + b[26] * x1int[k] .* x4int[k] + b[27] * x1int[k] .* x5int[k] + b[28] *
x1int[k] .* x6int[k] + b[29] * x1int[k] .* x7int[k] + b[30] * x1int[k] .* x8int[k] + b[31] * x1int[k] .* x9int[k] +
b[32] *
x1int[k] .* z1 + b[33] * x1int[k] .* z2 + b[34] * x1int[k] .* z3 + b[35] * x10int[k] .* x10int[k] + b[36]
* x10int[k] .* x11int[k] + b[37] * x10int[k] .* x12int[k] + b[38] * x10int[k] .* x13int[k] + b[39] *
x10int[k] .* x14int[k] + b[40] * x10int[k] .* z1 + b[41] * x10int[k] .* z2 + b[42] * x10int[k] .* z3 +
b[43] * x11int[k] .* x11int[k] + b[44] * x11int[k] .* x12int[k] + b[45] * x11int[k] .* x13int[k] +
b[46] * x11int[k] .* x14int[k] + b[47] * x11int[k] .* z1 + b[48] * x11int[k] .* z2 + b[49] * x11int[k] .*
z3 + b[50] * x12int[k] .* x12int[k] + b[51] * x12int[k] .* x13int[k] + b[52] *
x12int[k] .* x14int[k] + b[53] * x12int[k] .* z1 + b[54] * x12int[k] .* z2 + b[55] * x12int[k] .* z3 +
b[56] * x13int[k] .* x13int[k] + b[57] * x13int[k] .* x14int[k] + b[58] * x13int[k] .* z1 + b[59]
* x13int[k] .* z2 + b[60] * x13int[k] .* z3 + b[61] * x14int[k] .* x14int[k] + b[62] * x14int[k] .* z1 +
b[63] * x14int[k] .* z2 + b[64] * x14int[k] .* z3 + b[65] * x2int[k] .* x10int[k] + b[66]
* x2int[k] .* x11int[k] + b[67] * x2int[k] .* x12int[k] + b[68] * x2int[k] .* x13int[k] + b[69] * x2int[k]
.* x14int[k] + b[70] * x2int[k] .* x2int[k] + b[71] * x2int[k] .* x3int[k] + b[72] * x2int[k] .* x4int[k] + b[73] *
x2int[k] .* x5int[k] + b[74] * x2int[k] .* x6int[k] + b[75] * x2int[k] .* x7int[k] + b[76] * x2int[k] .*
x8int[k] + b[77] * x2int[k] .* x9int[k] + b[78] * x2int[k] .* z1 + b[79] * x2int[k] .* z2 + b[80] * x2int[k] .* z3 +
b[81] * x3int[k] .* x10int[k] + b[82] * x3int[k] .* x11int[k] + b[83] * x3int[k] .* x12int[k] + b[84] *
x3int[k] .* x13int[k] + b[85] * x3int[k] .* x14int[k] + b[86] * x3int[k] .* x3int[k] + b[87] * x3int[k] .* x4int[k] +
b[88] * x3int[k] .* x5int[k] + b[89] * x3int[k] .* x6int[k] + b[90] * x3int[k] .* x7int[k] + b[91] *
x3int[k] .* x8int[k] + b[92] * x3int[k] .* x9int[k] + b[93] * x3int[k] .* z1 + b[94] * x3int[k] .* z2 + b[95] *
x3int[k] .* z3 + b[96] * x4int[k] .* x10int[k] + b[97] * x4int[k] .* x11int[k] + b[98] * x4int[k] .*
x12int[k] + b[99] * x4int[k] .* x13int[k] + b[100] * x4int[k] .* x14int[k] + b[101] * x4int[k] .* x4int[k] + b[102] *
x4int[k] .* x5int[k] + b[103] * x4int[k] .* x6int[k] + b[104] * x4int[k] .* x7int[k] + b[105] * x4int[k]
.* x8int[k] + b[106] * x4int[k] .* x9int[k] + b[107] * x4int[k] .* z1 + b[108] * x4int[k] .* z2 + b[109] *
x4int[k] .* z3 + b[110] * x5int[k] .* x10int[k] + b[111] * x5int[k] .* x11int[k] + b[112] * x5int[k] .*
x12int[k] + b[113] * x5int[k] .* x13int[k] + b[114] * x5int[k] .* x14int[k] + b[115] * x5int[k] .* x5int[k] +
b[116] * x5int[k] .* x6int[k] + b[117] * x5int[k] .* x7int[k] + b[118] * x5int[k] .* x8int[k] + b[119] *
x5int[k] .* x9int[k] + b[120] * x5int[k] .* z1 + b[121] * x5int[k] .* z2 + b[122] * x5int[k] .* z3 +
b[123] * x6int[k] .* x10int[k] + b[124] * x6int[k] .* x11int[k] + b[125] * x6int[k] .* x12int[k] + b[126]
* x6int[k] .* x13int[k] + b[127] * x6int[k] .* x14int[k] + b[128] * x6int[k] .* x6int[k] + b[129] *
x6int[k] .* x7int[k] + b[130] * x6int[k] .* x8int[k] + b[131] * x6int[k] .* x9int[k] + b[132] * x6int[k]
.* z1 + b[133] * x6int[k] .* z2 + b[134] * x6int[k] .* z3 + b[135] * x7int[k] .* x10int[k] + b[136] *
x7int[k] .* x11int[k] + b[137] * x7int[k] .* x12int[k] + b[138] * x7int[k] .* x13int[k] + b[139] *
x7int[k] .* x14int[k] + b[140] * x7int[k] .* x7int[k] + b[141] * x7int[k] .* x8int[k] + b[142] * x7int[k] .* x9int[k] +
b[143] * x7int[k] .* z1 + b[144] * x7int[k] .* z2 + b[145] * x7int[k] .* z3 + b[146] * x8int[k] .*
x10int[k] + b[147] * x8int[k] .* x11int[k] + b[148] * x8int[k] .* x12int[k] + b[149] *
x8int[k] .* x13int[k] + b[150] * x8int[k] .* x14int[k] + b[151] * x8int[k] .* x8int[k] + b[152] * x8int[k]
.* x9int[k] + b[153] * x8int[k] .* z1 + b[154] * x8int[k] .* z2 + b[155] * x8int[k] .* z3 + b[156]
73

* x9int[k] .* x10int[k] + b[157] * x9int[k] .* x11int[k] + b[158] * x9int[k] .* x12int[k] + b[159] *
x9int[k] .* x13int[k] + b[160] * x9int[k] .* x14int[k] + b[161] * x9int[k] .* x9int[k] + b[162] * x9int[k] .* z1 +
b[163] * x9int[k] .* z2 + b[164] * x9int[k] .* z3 + b[165] * z1 .* z1 + b[166] * z1 .* z2 + b[167] * z1 .*
z3 + b[168] * z2 .* z2 + b[169] * z2 .* z3;
fy[k] <- mean(iy[k]);
*/
fy[k] <- mean(
intercept + b[1] * x1int[k] + b[2] * x2int[k] + b[3] * x3int[k] + b[4] * x4int[k] + b[5] * x5int[k] + b[6] *
x6int[k] + b[7] * x7int[k] + b[8] * x8int[k] +
b[9] * x9int[k] + b[10] * x10int[k] + b[11] * x11int[k] + b[12] * x12int[k] + b[13] * x13int[k] + b[14] *
x14int[k] + b[15] * z1 + b[16] * z2 + b[17] * z3
+ b[18] * x1int[k] .* x1int[k] + b[19] * x1int[k] .* x10int[k] + b[20] * x1int[k] .* x11int[k] + b[21] *
x1int[k] .* x12int[k] + b[22] * x1int[k] .* x13int[k] + b[23] * x1int[k] .* x14int[k] + b[24] * x1int[k] .* x2int[k] +
b[25] * x1int[k] .* x3int[k] + b[26] * x1int[k] .* x4int[k] + b[27] * x1int[k] .* x5int[k] + b[28] *
x1int[k] .* x6int[k] + b[29] * x1int[k] .* x7int[k] + b[30] * x1int[k] .* x8int[k] + b[31] * x1int[k] .* x9int[k] +
b[32] *
x1int[k] .* z1 + b[33] * x1int[k] .* z2 + b[34] * x1int[k] .* z3 + b[35] * x10int[k] .* x10int[k] + b[36]
* x10int[k] .* x11int[k] + b[37] * x10int[k] .* x12int[k] + b[38] * x10int[k] .* x13int[k] + b[39] *
x10int[k] .* x14int[k] + b[40] * x10int[k] .* z1 + b[41] * x10int[k] .* z2 + b[42] * x10int[k] .* z3 +
b[43] * x11int[k] .* x11int[k] + b[44] * x11int[k] .* x12int[k] + b[45] * x11int[k] .* x13int[k] +
b[46] * x11int[k] .* x14int[k] + b[47] * x11int[k] .* z1 + b[48] * x11int[k] .* z2 + b[49] * x11int[k] .*
z3 + b[50] * x12int[k] .* x12int[k] + b[51] * x12int[k] .* x13int[k] + b[52] *
x12int[k] .* x14int[k] + b[53] * x12int[k] .* z1 + b[54] * x12int[k] .* z2 + b[55] * x12int[k] .* z3 +
b[56] * x13int[k] .* x13int[k] + b[57] * x13int[k] .* x14int[k] + b[58] * x13int[k] .* z1 + b[59]
* x13int[k] .* z2 + b[60] * x13int[k] .* z3 + b[61] * x14int[k] .* x14int[k] + b[62] * x14int[k] .* z1 +
b[63] * x14int[k] .* z2 + b[64] * x14int[k] .* z3 + b[65] * x2int[k] .* x10int[k] + b[66]
* x2int[k] .* x11int[k] + b[67] * x2int[k] .* x12int[k] + b[68] * x2int[k] .* x13int[k] + b[69] * x2int[k]
.* x14int[k] + b[70] * x2int[k] .* x2int[k] + b[71] * x2int[k] .* x3int[k] + b[72] * x2int[k] .* x4int[k] + b[73] *
x2int[k] .* x5int[k] + b[74] * x2int[k] .* x6int[k] + b[75] * x2int[k] .* x7int[k] + b[76] * x2int[k] .*
x8int[k] + b[77] * x2int[k] .* x9int[k] + b[78] * x2int[k] .* z1 + b[79] * x2int[k] .* z2 + b[80] * x2int[k] .* z3 +
b[81] * x3int[k] .* x10int[k] + b[82] * x3int[k] .* x11int[k] + b[83] * x3int[k] .* x12int[k] + b[84] *
x3int[k] .* x13int[k] + b[85] * x3int[k] .* x14int[k] + b[86] * x3int[k] .* x3int[k] + b[87] * x3int[k] .* x4int[k] +
b[88] * x3int[k] .* x5int[k] + b[89] * x3int[k] .* x6int[k] + b[90] * x3int[k] .* x7int[k] + b[91] *
x3int[k] .* x8int[k] + b[92] * x3int[k] .* x9int[k] + b[93] * x3int[k] .* z1 + b[94] * x3int[k] .* z2 + b[95] *
x3int[k] .* z3 + b[96] * x4int[k] .* x10int[k] + b[97] * x4int[k] .* x11int[k] + b[98] * x4int[k] .*
x12int[k] + b[99] * x4int[k] .* x13int[k] + b[100] * x4int[k] .* x14int[k] + b[101] * x4int[k] .* x4int[k] + b[102] *
x4int[k] .* x5int[k] + b[103] * x4int[k] .* x6int[k] + b[104] * x4int[k] .* x7int[k] + b[105] * x4int[k]
.* x8int[k] + b[106] * x4int[k] .* x9int[k] + b[107] * x4int[k] .* z1 + b[108] * x4int[k] .* z2 + b[109] *
x4int[k] .* z3 + b[110] * x5int[k] .* x10int[k] + b[111] * x5int[k] .* x11int[k] + b[112] * x5int[k] .*
x12int[k] + b[113] * x5int[k] .* x13int[k] + b[114] * x5int[k] .* x14int[k] + b[115] * x5int[k] .* x5int[k] +
74

b[116] * x5int[k] .* x6int[k] + b[117] * x5int[k] .* x7int[k] + b[118] * x5int[k] .* x8int[k] + b[119] *
x5int[k] .* x9int[k] + b[120] * x5int[k] .* z1 + b[121] * x5int[k] .* z2 + b[122] * x5int[k] .* z3 +
b[123] * x6int[k] .* x10int[k] + b[124] * x6int[k] .* x11int[k] + b[125] * x6int[k] .* x12int[k] + b[126]
* x6int[k] .* x13int[k] + b[127] * x6int[k] .* x14int[k] + b[128] * x6int[k] .* x6int[k] + b[129] *
x6int[k] .* x7int[k] + b[130] * x6int[k] .* x8int[k] + b[131] * x6int[k] .* x9int[k] + b[132] * x6int[k]
.* z1 + b[133] * x6int[k] .* z2 + b[134] * x6int[k] .* z3 + b[135] * x7int[k] .* x10int[k] + b[136] *
x7int[k] .* x11int[k] + b[137] * x7int[k] .* x12int[k] + b[138] * x7int[k] .* x13int[k] + b[139] *
x7int[k] .* x14int[k] + b[140] * x7int[k] .* x7int[k] + b[141] * x7int[k] .* x8int[k] + b[142] * x7int[k] .* x9int[k] +
b[143] * x7int[k] .* z1 + b[144] * x7int[k] .* z2 + b[145] * x7int[k] .* z3 + b[146] * x8int[k] .*
x10int[k] + b[147] * x8int[k] .* x11int[k] + b[148] * x8int[k] .* x12int[k] + b[149] *
x8int[k] .* x13int[k] + b[150] * x8int[k] .* x14int[k] + b[151] * x8int[k] .* x8int[k] + b[152] * x8int[k]
.* x9int[k] + b[153] * x8int[k] .* z1 + b[154] * x8int[k] .* z2 + b[155] * x8int[k] .* z3 + b[156]
* x9int[k] .* x10int[k] + b[157] * x9int[k] .* x11int[k] + b[158] * x9int[k] .* x12int[k] + b[159] *
x9int[k] .* x13int[k] + b[160] * x9int[k] .* x14int[k] + b[161] * x9int[k] .* x9int[k] + b[162] * x9int[k] .* z1 +
b[163] * x9int[k] .* z2 + b[164] * x9int[k] .* z3 + b[165] * z1 .* z1 + b[166] * z1 .* z2 + b[167] * z1 .*
z3 + b[168] * z2 .* z2 + b[169] * z2 .* z3);
fy_exp[k] <- mean(exp(
intercept + b[1] * x1int[k] + b[2] * x2int[k] + b[3] * x3int[k] + b[4] * x4int[k] + b[5] * x5int[k] + b[6] *
x6int[k] + b[7] * x7int[k] + b[8] * x8int[k] +
b[9] * x9int[k] + b[10] * x10int[k] + b[11] * x11int[k] + b[12] * x12int[k] + b[13] * x13int[k] + b[14] *
x14int[k] + b[15] * z1 + b[16] * z2 + b[17] * z3
+ b[18] * x1int[k] .* x1int[k] + b[19] * x1int[k] .* x10int[k] + b[20] * x1int[k] .* x11int[k] + b[21] *
x1int[k] .* x12int[k] + b[22] * x1int[k] .* x13int[k] + b[23] * x1int[k] .* x14int[k] + b[24] * x1int[k] .* x2int[k] +
b[25] * x1int[k] .* x3int[k] + b[26] * x1int[k] .* x4int[k] + b[27] * x1int[k] .* x5int[k] + b[28] *
x1int[k] .* x6int[k] + b[29] * x1int[k] .* x7int[k] + b[30] * x1int[k] .* x8int[k] + b[31] * x1int[k] .* x9int[k] +
b[32] *
x1int[k] .* z1 + b[33] * x1int[k] .* z2 + b[34] * x1int[k] .* z3 + b[35] * x10int[k] .* x10int[k] + b[36]
* x10int[k] .* x11int[k] + b[37] * x10int[k] .* x12int[k] + b[38] * x10int[k] .* x13int[k] + b[39] *
x10int[k] .* x14int[k] + b[40] * x10int[k] .* z1 + b[41] * x10int[k] .* z2 + b[42] * x10int[k] .* z3 +
b[43] * x11int[k] .* x11int[k] + b[44] * x11int[k] .* x12int[k] + b[45] * x11int[k] .* x13int[k] +
b[46] * x11int[k] .* x14int[k] + b[47] * x11int[k] .* z1 + b[48] * x11int[k] .* z2 + b[49] * x11int[k] .*
z3 + b[50] * x12int[k] .* x12int[k] + b[51] * x12int[k] .* x13int[k] + b[52] *
x12int[k] .* x14int[k] + b[53] * x12int[k] .* z1 + b[54] * x12int[k] .* z2 + b[55] * x12int[k] .* z3 +
b[56] * x13int[k] .* x13int[k] + b[57] * x13int[k] .* x14int[k] + b[58] * x13int[k] .* z1 + b[59]
* x13int[k] .* z2 + b[60] * x13int[k] .* z3 + b[61] * x14int[k] .* x14int[k] + b[62] * x14int[k] .* z1 +
b[63] * x14int[k] .* z2 + b[64] * x14int[k] .* z3 + b[65] * x2int[k] .* x10int[k] + b[66]
* x2int[k] .* x11int[k] + b[67] * x2int[k] .* x12int[k] + b[68] * x2int[k] .* x13int[k] + b[69] * x2int[k]
.* x14int[k] + b[70] * x2int[k] .* x2int[k] + b[71] * x2int[k] .* x3int[k] + b[72] * x2int[k] .* x4int[k] + b[73] *
x2int[k] .* x5int[k] + b[74] * x2int[k] .* x6int[k] + b[75] * x2int[k] .* x7int[k] + b[76] * x2int[k] .*
x8int[k] + b[77] * x2int[k] .* x9int[k] + b[78] * x2int[k] .* z1 + b[79] * x2int[k] .* z2 + b[80] * x2int[k] .* z3 +
b[81] * x3int[k] .* x10int[k] + b[82] * x3int[k] .* x11int[k] + b[83] * x3int[k] .* x12int[k] + b[84] *
x3int[k] .* x13int[k] + b[85] * x3int[k] .* x14int[k] + b[86] * x3int[k] .* x3int[k] + b[87] * x3int[k] .* x4int[k] +
75

b[88] * x3int[k] .* x5int[k] + b[89] * x3int[k] .* x6int[k] + b[90] * x3int[k] .* x7int[k] + b[91] *
x3int[k] .* x8int[k] + b[92] * x3int[k] .* x9int[k] + b[93] * x3int[k] .* z1 + b[94] * x3int[k] .* z2 + b[95] *
x3int[k] .* z3 + b[96] * x4int[k] .* x10int[k] + b[97] * x4int[k] .* x11int[k] + b[98] * x4int[k] .*
x12int[k] + b[99] * x4int[k] .* x13int[k] + b[100] * x4int[k] .* x14int[k] + b[101] * x4int[k] .* x4int[k] + b[102] *
x4int[k] .* x5int[k] + b[103] * x4int[k] .* x6int[k] + b[104] * x4int[k] .* x7int[k] + b[105] * x4int[k]
.* x8int[k] + b[106] * x4int[k] .* x9int[k] + b[107] * x4int[k] .* z1 + b[108] * x4int[k] .* z2 + b[109] *
x4int[k] .* z3 + b[110] * x5int[k] .* x10int[k] + b[111] * x5int[k] .* x11int[k] + b[112] * x5int[k] .*
x12int[k] + b[113] * x5int[k] .* x13int[k] + b[114] * x5int[k] .* x14int[k] + b[115] * x5int[k] .* x5int[k] +
b[116] * x5int[k] .* x6int[k] + b[117] * x5int[k] .* x7int[k] + b[118] * x5int[k] .* x8int[k] + b[119] *
x5int[k] .* x9int[k] + b[120] * x5int[k] .* z1 + b[121] * x5int[k] .* z2 + b[122] * x5int[k] .* z3 +
b[123] * x6int[k] .* x10int[k] + b[124] * x6int[k] .* x11int[k] + b[125] * x6int[k] .* x12int[k] + b[126]
* x6int[k] .* x13int[k] + b[127] * x6int[k] .* x14int[k] + b[128] * x6int[k] .* x6int[k] + b[129] *
x6int[k] .* x7int[k] + b[130] * x6int[k] .* x8int[k] + b[131] * x6int[k] .* x9int[k] + b[132] * x6int[k]
.* z1 + b[133] * x6int[k] .* z2 + b[134] * x6int[k] .* z3 + b[135] * x7int[k] .* x10int[k] + b[136] *
x7int[k] .* x11int[k] + b[137] * x7int[k] .* x12int[k] + b[138] * x7int[k] .* x13int[k] + b[139] *
x7int[k] .* x14int[k] + b[140] * x7int[k] .* x7int[k] + b[141] * x7int[k] .* x8int[k] + b[142] * x7int[k] .* x9int[k] +
b[143] * x7int[k] .* z1 + b[144] * x7int[k] .* z2 + b[145] * x7int[k] .* z3 + b[146] * x8int[k] .*
x10int[k] + b[147] * x8int[k] .* x11int[k] + b[148] * x8int[k] .* x12int[k] + b[149] *
x8int[k] .* x13int[k] + b[150] * x8int[k] .* x14int[k] + b[151] * x8int[k] .* x8int[k] + b[152] * x8int[k]
.* x9int[k] + b[153] * x8int[k] .* z1 + b[154] * x8int[k] .* z2 + b[155] * x8int[k] .* z3 + b[156]
* x9int[k] .* x10int[k] + b[157] * x9int[k] .* x11int[k] + b[158] * x9int[k] .* x12int[k] + b[159] *
x9int[k] .* x13int[k] + b[160] * x9int[k] .* x14int[k] + b[161] * x9int[k] .* x9int[k] + b[162] * x9int[k] .* z1 +
b[163] * x9int[k] .* z2 + b[164] * x9int[k] .* z3 + b[165] * z1 .* z1 + b[166] * z1 .* z2 + b[167] * z1 .*
z3 + b[168] * z2 .* z2 + b[169] * z2 .* z3));
}
}
/*---------------------------------------------------------------------------------------------------------------------
Author: Alex Keil
Program: bgf_real_01.stan
Language: STAN 2.6.0
Date: Thursday, May 28, 2015 at 6:58:25 PM
Project: NIEHS mixtures workshop
Tasks: implement bayesian [lasso?] g-formula algorithm on real world dataset
Data in: real.standata
Data out:
Description:
Released under the GNU General Public License: http://www.gnu.org/copyleft/gpl.html
---------------------------------------------------------------------------------------------------------------------*/
76

functions{
//expexpon function from sas (exponenential-exponential distribution)
// note that this is distinct from the double exponenential distribution
// call using expexpon(scale);
real expexpon_log(real y, real scale){
return log(1 / scale * exp(y) * exp( -exp(y) / scale));
}
}
data{
int<lower=0> J; //number of model parameters
int<lower=0> K; //number of interventions
int<lower=0> N; //number of observations
row_vector[N] child_sex;
row_vector[N] mom_educ;
row_vector[N] mom_age;
row_vector[N] mom_race;
row_vector[N] mom_smoke;
row_vector[N] mdi; //primary outcome
//primary exposures
row_vector[N] lip_pbde_47;
row_vector[N] lip_pbde_99;
row_vector[N] lip_pbde_100;
row_vector[N] lip_pbde_153;
row_vector[N] lip_hcb;
row_vector[N] lip_pp_dde;
row_vector[N] lip_oxychlor;
row_vector[N] lip_nonachlor;
row_vector[N] lip_pcb74;
row_vector[N] lip_pcb99;
row_vector[N] lip_pcb105;
row_vector[N] lip_pcb118;
row_vector[N] lip_pcb146;
row_vector[N] lip_pcb153;
row_vector[N] lip_pcb156;
row_vector[N] lip_pcb170;
row_vector[N] lip_pcb180;
row_vector[N] lip_pcb187;
row_vector[N] lip_pcb194;
row_vector[N] lip_pcb199;
row_vector[N] lip_pcb138_158;
77

row_vector[N] lip_pcb196_203;
}
//left off here: more edits below
transformed data{
//transformed variables
vector[J] mu0;
row_vector[N] x1;
row_vector[N] x2;
row_vector[N] x3;
row_vector[N] x4;
row_vector[N] x5;
row_vector[N] x6;
row_vector[N] x7;
row_vector[N] x8;
row_vector[N] x9;
row_vector[N] x10;
row_vector[N] x11;
row_vector[N] x12;
row_vector[N] x13;
row_vector[N] x14;
row_vector[N] x15;
row_vector[N] x16;
row_vector[N] x17;
row_vector[N] x18;
row_vector[N] x19;
row_vector[N] x20;
row_vector[N] x21;
row_vector[N] x22;
row_vector[N] z1;
row_vector[N] z2;
row_vector[N] z3;
row_vector[N] z4;
row_vector[N] z5;
//interventions
matrix[K, N] xint1;
78

matrix[K, N] xint2;
matrix[K, N] xint3;
matrix[K, N] xint4;
matrix[K, N] xint5;
matrix[K, N] xint6;
matrix[K, N] xint7;
matrix[K, N] xint8;
matrix[K, N] xint9;
matrix[K, N] xint10;
matrix[K, N] xint11;
matrix[K, N] xint12;
matrix[K, N] xint13;
matrix[K, N] xint14;
matrix[K, N] xint15;
matrix[K, N] xint16;
matrix[K, N] xint17;
matrix[K, N] xint18;
matrix[K, N] xint19;
matrix[K, N] xint20;
matrix[K, N] xint21;
matrix[K, N] xint22;
//indexes
for(n in 1:N){
x1[n] <- log(lip_pbde_47[n]);
x2[n] <- log(lip_pbde_99[n]);
x3[n] <- log(lip_pbde_100[n]);
x4[n] <- log(lip_pbde_153[n]);
x5[n] <- log(lip_hcb[n]);
x6[n] <- log(lip_pp_dde[n]);
x7[n] <- log(lip_oxychlor[n]);
x8[n] <- log(lip_nonachlor[n]);
x9[n] <- log(lip_pcb74[n]);
x10[n] <- log(lip_pcb99[n]);
x11[n] <- log(lip_pcb105[n]);
x12[n] <- log(lip_pcb118[n]);
x13[n] <- log(lip_pcb146[n]);
x14[n] <- log(lip_pcb153[n]);
x15[n] <- log(lip_pcb156[n]);
x16[n] <- log(lip_pcb170[n]);
x17[n] <- log(lip_pcb180[n]);
79

x18[n] <- log(lip_pcb187[n]);
x19[n] <- log(lip_pcb194[n]);
x20[n] <- log(lip_pcb199[n]);
x21[n] <- log(lip_pcb138_158[n]);
x22[n] <- log(lip_pcb196_203[n]);
z1[n] <- (child_sex[n]);
z2[n] <- (mom_educ[n]);
z3[n] <- (mom_age[n]);
z4[n] <- (mom_race[n]);
z5[n] <- (mom_smoke[n]);
}
// making design matrices for interventions
for(k in 1:K){
xint1[k] <- x1;
xint2[k] <- x2;
xint3[k] <- x3;
xint4[k] <- x4;
xint5[k] <- x5;
xint6[k] <- x6;
xint7[k] <- x7;
xint8[k] <- x8;
xint9[k] <- x9;
xint10[k] <- x10;
xint11[k] <- x11;
xint12[k] <- x12;
xint13[k] <- x13;
xint14[k] <- x14;
xint15[k] <- x15;
xint16[k] <- x16;
xint17[k] <- x17;
xint18[k] <- x18;
xint19[k] <- x19;
xint20[k] <- x20;
xint21[k] <- x21;
xint22[k] <- x22;
}
//interventions
for(n in 1:N){
80

//single interventions (22)
//multiply variable by 50%
xint1[1,n] <- x1[n] + log(0.5);
xint2[2,n] <- x2[n] + log(0.5);
xint3[3,n] <- x3[n] + log(0.5);
xint4[4,n] <- x4[n] + log(0.5);
xint5[5,n] <- x5[n] + log(0.5);
xint6[6,n] <- x6[n] + log(0.5);
xint7[7,n] <- x7[n] + log(0.5);
xint8[8,n] <- x8[n] + log(0.5);
xint9[9,n] <- x9[n] + log(0.5);
xint10[10,n] <- x10[n] + log(0.5);
xint11[11,n] <- x11[n] + log(0.5);
xint12[12,n] <- x12[n] + log(0.5);
xint13[13,n] <- x13[n] + log(0.5);
xint14[14,n] <- x14[n] + log(0.5);
xint15[15,n] <- x15[n] + log(0.5);
xint16[16,n] <- x16[n] + log(0.5);
xint17[17,n] <- x17[n] + log(0.5);
xint18[18,n] <- x18[n] + log(0.5);
xint19[19,n] <- x19[n] + log(0.5);
xint20[20,n] <- x20[n] + log(0.5);
xint21[21,n] <- x21[n] + log(0.5);
xint22[22,n] <- x22[n] + log(0.5);
//joint interventions (7)
// x1-x4 (pbde)
xint1[23,n] <- x1[n] + log(0.5);
xint2[23,n] <- x2[n] + log(0.5);
xint3[23,n] <- x3[n] + log(0.5);
xint4[23,n] <- x4[n] + log(0.5);
// x5-x8 (pests)
xint5[24,n] <- x5[n] + log(0.5);
xint6[24,n] <- x6[n] + log(0.5);
xint7[24,n] <- x7[n] + log(0.5);
xint8[24,n] <- x8[n] + log(0.5);
// x19-x22 (pcbs)
xint9[25,n] <- x9[n] + log(0.5);
xint10[25,n] <- x10[n] + log(0.5);
xint11[25,n] <- x11[n] + log(0.5);
xint12[25,n] <- x12[n] + log(0.5);
81

xint13[25,n] <- x13[n] + log(0.5);
xint14[25,n] <- x14[n] + log(0.5);
xint15[25,n] <- x15[n] + log(0.5);
xint16[25,n] <- x16[n] + log(0.5);
xint17[25,n] <- x17[n] + log(0.5);
xint18[25,n] <- x18[n] + log(0.5);
xint19[25,n] <- x19[n] + log(0.5);
xint20[25,n] <- x20[n] + log(0.5);
xint21[25,n] <- x21[n] + log(0.5);
xint22[25,n] <- x22[n] + log(0.5);
// x1-x8 (pbde + pest)
xint1[26,n] <- x1[n] + log(0.5);
xint2[26,n] <- x2[n] + log(0.5);
xint3[26,n] <- x3[n] + log(0.5);
xint4[26,n] <- x4[n] + log(0.5);
xint5[26,n] <- x5[n] + log(0.5);
xint6[26,n] <- x6[n] + log(0.5);
xint7[26,n] <- x7[n] + log(0.5);
xint8[26,n] <- x8[n] + log(0.5);
// x5-x22 (pests + pcbs)
xint5[27,n] <- x5[n] + log(0.5);
xint6[27,n] <- x6[n] + log(0.5);
xint7[27,n] <- x7[n] + log(0.5);
xint8[27,n] <- x8[n] + log(0.5);
xint9[27,n] <- x9[n] + log(0.5);
xint10[27,n] <- x10[n] + log(0.5);
xint11[27,n] <- x11[n] + log(0.5);
xint12[27,n] <- x12[n] + log(0.5);
xint13[27,n] <- x13[n] + log(0.5);
xint14[27,n] <- x14[n] + log(0.5);
xint15[27,n] <- x15[n] + log(0.5);
xint16[27,n] <- x16[n] + log(0.5);
xint17[27,n] <- x17[n] + log(0.5);
xint18[27,n] <- x18[n] + log(0.5);
xint19[27,n] <- x19[n] + log(0.5);
xint20[27,n] <- x20[n] + log(0.5);
xint21[27,n] <- x21[n] + log(0.5);
xint22[27,n] <- x22[n] + log(0.5);
82

// x1-x4, x9-x22 (pbdes + pcbs)
xint1[28,n] <- x1[n] + log(0.5);
xint2[28,n] <- x2[n] + log(0.5);
xint3[28,n] <- x3[n] + log(0.5);
xint4[28,n] <- x4[n] + log(0.5);
xint9[28,n] <- x9[n] + log(0.5);
xint10[28,n] <- x10[n] + log(0.5);
xint11[28,n] <- x11[n] + log(0.5);
xint12[28,n] <- x12[n] + log(0.5);
xint13[28,n] <- x13[n] + log(0.5);
xint14[28,n] <- x14[n] + log(0.5);
xint15[28,n] <- x15[n] + log(0.5);
xint16[28,n] <- x16[n] + log(0.5);
xint17[28,n] <- x17[n] + log(0.5);
xint18[28,n] <- x18[n] + log(0.5);
xint19[28,n] <- x19[n] + log(0.5);
xint20[28,n] <- x20[n] + log(0.5);
xint21[28,n] <- x21[n] + log(0.5);
xint22[28,n] <- x22[n] + log(0.5);
// x1-x22 (all)
xint1[29,n] <- x1[n] + log(0.5);
xint2[29,n] <- x2[n] + log(0.5);
xint3[29,n] <- x3[n] + log(0.5);
xint4[29,n] <- x4[n] + log(0.5);
xint5[29,n] <- x5[n] + log(0.5);
xint6[29,n] <- x6[n] + log(0.5);
xint7[29,n] <- x7[n] + log(0.5);
xint8[29,n] <- x8[n] + log(0.5);
xint9[29,n] <- x9[n] + log(0.5);
xint10[29,n] <- x10[n] + log(0.5);
xint11[29,n] <- x11[n] + log(0.5);
xint12[29,n] <- x12[n] + log(0.5);
xint13[29,n] <- x13[n] + log(0.5);
xint14[29,n] <- x14[n] + log(0.5);
xint15[29,n] <- x15[n] + log(0.5);
xint16[29,n] <- x16[n] + log(0.5);
xint17[29,n] <- x17[n] + log(0.5);
xint18[29,n] <- x18[n] + log(0.5);
xint19[29,n] <- x19[n] + log(0.5);
xint20[29,n] <- x20[n] + log(0.5);
xint21[29,n] <- x21[n] + log(0.5);
83

xint22[29,n] <- x22[n] + log(0.5);
}
//prior for beta
for(j in 1:J){
mu0[j] <- 0.0;
}
}
parameters{
real b0;
vector[J] b;
vector<lower=0>[J] omega;
real<lower=0> sigma2;
real<lower=0> lambda;
}
transformed parameters{
}
model{
vector[J] tau;//these could also be parameters, but this way cuts down on the output file size
row_vector[N] py;
//hyper-hyperpriors for shrinkage
//lambda ~ gamma(1.0, 10.0);
lambda ~ gamma(1.0, 2.5);
for(j in 1:J){
//unable to vectorize
omega[j] ~ expexpon(2.0/lambda); //custom sampler function created above
tau[j] <- sqrt(sigma2 * exp(omega[j]));
}
//hyperpriors for beta
// sigma2 ~ inv_gamma(0.1, 0.1); //scale parameter is switched in stan vs. sas (stan scale parameter = iscale
parameter in sas)
sigma2 ~ inv_gamma(0.2, 0.2); //scale parameter is switched in stan vs. sas (stan scale parameter = iscale parameter
in sas)
py <- (b0 + b[1]*x1 + b[2]*x2 + b[3]*x3 + b[4]*x4 + b[5]*x5 + b[6]*x6 + b[7]*x7 + b[8]*x8 + b[9]*x9 + b[10]*x10 +
b[11]*x11 + b[12]*x12 + b[13]*x13 + b[14]*x14 + b[15]*x15 + b[16]*x16 + b[17]*x17 + b[18]*x18 + b[19]*x19 + b[20]*x20 +
84

b[21]*x21 + b[22]*x22 + b[23]*z1 + b[24]*z2 + b[25]*z3 + b[26]*z4 + b[27]*z5 + b[28]*x1 .* x1 + b[29]*x1 .* x2 +
b[30]*x1 .* x3 + b[31]*x1 .* x4 + b[32]*x1 .* x5 + b[33]*x1 .* x6 + b[34]*x1 .* x7 + b[35]*x1 .* x8 + b[36]*x1 .* x9 +
b[37]*x1 .* x10 + b[38]*x1 .* x11 + b[39]*x1 .* x12 + b[40]*x1 .* x13 + b[41]*x1 .* x14 + b[42]*x1 .* x15 + b[43]*x1 .*
x16 + b[44]*x1 .* x17 + b[45]*x1 .* x18 + b[46]*x1 .* x19 + b[47]*x1 .* x20 + b[48]*x1 .* x21 + b[49]*x1 .* x22 +
b[50]*x1 .* z1 + b[51]*x1 .* z2 + b[52]*x1 .* z3 + b[53]*x1 .* z4 + b[54]*x1 .* z5 + b[55]*x2 .* x2 + b[56]*x2 .* x3 +
b[57]*x2 .* x4 + b[58]*x2 .* x5 + b[59]*x2 .* x6 + b[60]*x2 .* x7 + b[61]*x2 .* x8 + b[62]*x2 .* x9 + b[63]*x10 .* x2 +
b[64]*x11 .* x2 + b[65]*x12 .* x2 + b[66]*x13 .* x2 + b[67]*x14 .* x2 + b[68]*x15 .* x2 + b[69]*x16 .* x2 + b[70]*x17
.* x2 + b[71]*x18 .* x2 + b[72]*x19 .* x2 + b[73]*x2 .* x20 + b[74]*x2 .* x21 + b[75]*x2 .* x22 + b[76]*x2 .* z1 +
b[77]*x2 .* z2 + b[78]*x2 .* z3 + b[79]*x2 .* z4 + b[80]*x2 .* z5 + b[81]*x3 .* x3 + b[82]*x3 .* x4 + b[83]*x3 .* x5 +
b[84]*x3 .* x6 + b[85]*x3 .* x7 + b[86]*x3 .* x8 + b[87]*x3 .* x9 + b[88]*x10 .* x3 + b[89]*x11 .* x3 + b[90]*x12 .* x3
+ b[91]*x13 .* x3 + b[92]*x14 .* x3 + b[93]*x15 .* x3 + b[94]*x16 .* x3 + b[95]*x17 .* x3 + b[96]*x18 .* x3 + b[97]*x19
.* x3 + b[98]*x20 .* x3 + b[99]*x21 .* x3)
+(b[100]*x22 .* x3 + b[101]*x3 .* z1 + b[102]*x3 .* z2 + b[103]*x3 .* z3 + b[104]*x3 .* z4 + b[105]*x3 .* z5 +
b[106]*x4 .* x4 + b[107]*x4 .* x5 + b[108]*x4 .* x6 + b[109]*x4 .* x7 + b[110]*x4 .* x8 + b[111]*x4 .* x9 + b[112]*x10
.* x4 + b[113]*x11 .* x4 + b[114]*x12 .* x4 + b[115]*x13 .* x4 + b[116]*x14 .* x4 + b[117]*x15 .* x4 + b[118]*x16 .* x4
+ b[119]*x17 .* x4 + b[120]*x18 .* x4 + b[121]*x19 .* x4 + b[122]*x20 .* x4 + b[123]*x21 .* x4 + b[124]*x22 .* x4 +
b[125]*x4 .* z1 + b[126]*x4 .* z2 + b[127]*x4 .* z3 + b[128]*x4 .* z4 + b[129]*x4 .* z5 + b[130]*x5 .* x5 + b[131]*x5
.* x6 + b[132]*x5 .* x7 + b[133]*x5 .* x8 + b[134]*x5 .* x9 + b[135]*x10 .* x5 + b[136]*x11 .* x5 + b[137]*x12 .* x5 +
b[138]*x13 .* x5 + b[139]*x14 .* x5 + b[140]*x15 .* x5 + b[141]*x16 .* x5 + b[142]*x17 .* x5 + b[143]*x18 .* x5 +
b[144]*x19 .* x5 + b[145]*x20 .* x5 + b[146]*x21 .* x5 + b[147]*x22 .* x5 + b[148]*x5 .* z1 + b[149]*x5 .* z2 +
b[150]*x5 .* z3 + b[151]*x5 .* z4 + b[152]*x5 .* z5 + b[153]*x6 .* x6 + b[154]*x6 .* x7 + b[155]*x6 .* x8 + b[156]*x6
.* x9 + b[157]*x10 .* x6 + b[158]*x11 .* x6 + b[159]*x12 .* x6 + b[160]*x13 .* x6 + b[161]*x14 .* x6 + b[162]*x15 .* x6
+ b[163]*x16 .* x6 + b[164]*x17 .* x6 + b[165]*x18 .* x6 + b[166]*x19 .* x6 + b[167]*x20 .* x6 + b[168]*x21 .* x6 +
b[169]*x22 .* x6 + b[170]*x6 .* z1 + b[171]*x6 .* z2 + b[172]*x6 .* z3 + b[173]*x6 .* z4 + b[174]*x6 .* z5 + b[175]*x7
.* x7 + b[176]*x7 .* x8 + b[177]*x7 .* x9 + b[178]*x10 .* x7 + b[179]*x11 .* x7 + b[180]*x12 .* x7 + b[181]*x13 .* x7 +
b[182]*x14 .* x7 + b[183]*x15 .* x7 + b[184]*x16 .* x7 + b[185]*x17 .* x7 + b[186]*x18 .* x7 + b[187]*x19 .* x7 +
b[188]*x20 .* x7 + b[189]*x21 .* x7 + b[190]*x22 .* x7 + b[191]*x7 .* z1 + b[192]*x7 .* z2 + b[193]*x7 .* z3 +
b[194]*x7 .* z4 + b[195]*x7 .* z5 + b[196]*x8 .* x8 + b[197]*x8 .* x9 + b[198]*x10 .* x8 + b[199]*x11 .* x8)
+(b[200]*x12 .* x8 + b[201]*x13 .* x8 + b[202]*x14 .* x8 + b[203]*x15 .* x8 + b[204]*x16 .* x8 + b[205]*x17 .*
x8 + b[206]*x18 .* x8 + b[207]*x19 .* x8 + b[208]*x20 .* x8 + b[209]*x21 .* x8 + b[210]*x22 .* x8 + b[211]*x8 .* z1 +
b[212]*x8 .* z2 + b[213]*x8 .* z3 + b[214]*x8 .* z4 + b[215]*x8 .* z5 + b[216]*x9 .* x9 + b[217]*x10 .* x9 + b[218]*x11
.* x9 + b[219]*x12 .* x9 + b[220]*x13 .* x9 + b[221]*x14 .* x9 + b[222]*x15 .* x9 + b[223]*x16 .* x9 + b[224]*x17 .* x9
+ b[225]*x18 .* x9 + b[226]*x19 .* x9 + b[227]*x20 .* x9 + b[228]*x21 .* x9 + b[229]*x22 .* x9 + b[230]*x9 .* z1 +
b[231]*x9 .* z2 + b[232]*x9 .* z3 + b[233]*x9 .* z4 + b[234]*x9 .* z5 + b[235]*x10 .* x10 + b[236]*x10 .* x11 +
b[237]*x10 .* x12 + b[238]*x10 .* x13 + b[239]*x10 .* x14 + b[240]*x10 .* x15 + b[241]*x10 .* x16 + b[242]*x10 .* x17 +
b[243]*x10 .* x18 + b[244]*x10 .* x19 + b[245]*x10 .* x20 + b[246]*x10 .* x21 + b[247]*x10 .* x22 + b[248]*x10 .* z1 +
b[249]*x10 .* z2 + b[250]*x10 .* z3 + b[251]*x10 .* z4 + b[252]*x10 .* z5 + b[253]*x11 .* x11 + b[254]*x11 .* x12 +
b[255]*x11 .* x13 + b[256]*x11 .* x14 + b[257]*x11 .* x15 + b[258]*x11 .* x16 + b[259]*x11 .* x17 + b[260]*x11 .* x18 +
b[261]*x11 .* x19 + b[262]*x11 .* x20 + b[263]*x11 .* x21 + b[264]*x11 .* x22 + b[265]*x11 .* z1 + b[266]*x11 .* z2 +
b[267]*x11 .* z3 + b[268]*x11 .* z4 + b[269]*x11 .* z5 + b[270]*x12 .* x12 + b[271]*x12 .* x13 + b[272]*x12 .* x14 +
b[273]*x12 .* x15 + b[274]*x12 .* x16 + b[275]*x12 .* x17 + b[276]*x12 .* x18 + b[277]*x12 .* x19 + b[278]*x12 .* x20 +
b[279]*x12 .* x21 + b[280]*x12 .* x22 + b[281]*x12 .* z1 + b[282]*x12 .* z2 + b[283]*x12 .* z3 + b[284]*x12 .* z4 +
85

b[285]*x12 .* z5 + b[286]*x13 .* x13 + b[287]*x13 .* x14 + b[288]*x13 .* x15 + b[289]*x13 .* x16 + b[290]*x13 .* x17 +
b[291]*x13 .* x18 + b[292]*x13 .* x19 + b[293]*x13 .* x20 + b[294]*x13 .* x21 + b[295]*x13 .* x22 + b[296]*x13 .* z1 +
b[297]*x13 .* z2 + b[298]*x13 .* z3 + b[299]*x13 .* z4)
+(b[300]*x13 .* z5 + b[301]*x14 .* x14 + b[302]*x14 .* x15 + b[303]*x14 .* x16 + b[304]*x14 .* x17 + b[305]*x14
.* x18 + b[306]*x14 .* x19 + b[307]*x14 .* x20 + b[308]*x14 .* x21 + b[309]*x14 .* x22 + b[310]*x14 .* z1 + b[311]*x14
.* z2 + b[312]*x14 .* z3 + b[313]*x14 .* z4 + b[314]*x14 .* z5 + b[315]*x15 .* x15 + b[316]*x15 .* x16 + b[317]*x15 .*
x17 + b[318]*x15 .* x18 + b[319]*x15 .* x19 + b[320]*x15 .* x20 + b[321]*x15 .* x21 + b[322]*x15 .* x22 + b[323]*x15 .*
z1 + b[324]*x15 .* z2 + b[325]*x15 .* z3 + b[326]*x15 .* z4 + b[327]*x15 .* z5 + b[328]*x16 .* x16 + b[329]*x16 .* x17
+ b[330]*x16 .* x18 + b[331]*x16 .* x19 + b[332]*x16 .* x20 + b[333]*x16 .* x21 + b[334]*x16 .* x22 + b[335]*x16 .* z1
+ b[336]*x16 .* z2 + b[337]*x16 .* z3 + b[338]*x16 .* z4 + b[339]*x16 .* z5 + b[340]*x17 .* x17 + b[341]*x17 .* x18 +
b[342]*x17 .* x19 + b[343]*x17 .* x20 + b[344]*x17 .* x21 + b[345]*x17 .* x22 + b[346]*x17 .* z1 + b[347]*x17 .* z2 +
b[348]*x17 .* z3 + b[349]*x17 .* z4 + b[350]*x17 .* z5 + b[351]*x18 .* x18 + b[352]*x18 .* x19 + b[353]*x18 .* x20 +
b[354]*x18 .* x21 + b[355]*x18 .* x22 + b[356]*x18 .* z1 + b[357]*x18 .* z2 + b[358]*x18 .* z3 + b[359]*x18 .* z4 +
b[360]*x18 .* z5 + b[361]*x19 .* x19 + b[362]*x19 .* x20 + b[363]*x19 .* x21 + b[364]*x19 .* x22 + b[365]*x19 .* z1 +
b[366]*x19 .* z2 + b[367]*x19 .* z3 + b[368]*x19 .* z4 + b[369]*x19 .* z5 + b[370]*x20 .* x20 + b[371]*x20 .* x21 +
b[372]*x20 .* x22 + b[373]*x20 .* z1 + b[374]*x20 .* z2 + b[375]*x20 .* z3 + b[376]*x20 .* z4 + b[377]*x20 .* z5 +
b[378]*x21 .* x21 + b[379]*x21 .* x22 + b[380]*x21 .* z1 + b[381]*x21 .* z2 + b[382]*x21 .* z3 + b[383]*x21 .* z4 +
b[384]*x21 .* z5 + b[385]*x22 .* x22 + b[386]*x22 .* z1 + b[387]*x22 .* z2 + b[388]*x22 .* z3 + b[389]*x22 .* z4 +
b[390]*x22 .* z5 + b[391]*z1 .* z2 + b[392]*z1 .* z3 + b[393]*z1 .* z4 + b[394]*z1 .* z5 + b[395]*z2 .* z3 + b[396]*z2
.* z4 + b[397]*z2 .* z5 + b[398]*z3 .* z4 + b[399]*z3 .* z5 + b[400]*z4 .* z5)
;
//beta coefficients
b0 ~ normal(0,sqrt(2000));
b ~ normal(mu0,tau); //stan uses standard error in second argument
//model for outcome (mdi)
mdi ~ normal(py, sqrt(sigma2));
}
generated quantities{
real lasso;
vector[K] fy;
real fynat;
lasso <- sqrt(lambda);
fynat <- mean((b0 + b[1]*x1 + b[2]*x2 + b[3]*x3 + b[4]*x4 + b[5]*x5 + b[6]*x6 + b[7]*x7 + b[8]*x8 + b[9]*x9 +
b[10]*x10 + b[11]*x11 + b[12]*x12 + b[13]*x13 + b[14]*x14 + b[15]*x15 + b[16]*x16 + b[17]*x17 + b[18]*x18 + b[19]*x19 +
b[20]*x20 + b[21]*x21 + b[22]*x22 + b[23]*z1 + b[24]*z2 + b[25]*z3 + b[26]*z4 + b[27]*z5 + b[28]*x1 .* x1 + b[29]*x1 .*
x2 + b[30]*x1 .* x3 + b[31]*x1 .* x4 + b[32]*x1 .* x5 + b[33]*x1 .* x6 + b[34]*x1 .* x7 + b[35]*x1 .* x8 + b[36]*x1 .*
86

x9 + b[37]*x1 .* x10 + b[38]*x1 .* x11 + b[39]*x1 .* x12 + b[40]*x1 .* x13 + b[41]*x1 .* x14 + b[42]*x1 .* x15 +
b[43]*x1 .* x16 + b[44]*x1 .* x17 + b[45]*x1 .* x18 + b[46]*x1 .* x19 + b[47]*x1 .* x20 + b[48]*x1 .* x21 + b[49]*x1 .*
x22 + b[50]*x1 .* z1 + b[51]*x1 .* z2 + b[52]*x1 .* z3 + b[53]*x1 .* z4 + b[54]*x1 .* z5 + b[55]*x2 .* x2 + b[56]*x2 .*
x3 + b[57]*x2 .* x4 + b[58]*x2 .* x5 + b[59]*x2 .* x6 + b[60]*x2 .* x7 + b[61]*x2 .* x8 + b[62]*x2 .* x9 + b[63]*x10 .*
x2 + b[64]*x11 .* x2 + b[65]*x12 .* x2 + b[66]*x13 .* x2 + b[67]*x14 .* x2 + b[68]*x15 .* x2 + b[69]*x16 .* x2 +
b[70]*x17 .* x2 + b[71]*x18 .* x2 + b[72]*x19 .* x2 + b[73]*x2 .* x20 + b[74]*x2 .* x21 + b[75]*x2 .* x22 + b[76]*x2 .*
z1 + b[77]*x2 .* z2 + b[78]*x2 .* z3 + b[79]*x2 .* z4 + b[80]*x2 .* z5 + b[81]*x3 .* x3 + b[82]*x3 .* x4 + b[83]*x3 .*
x5 + b[84]*x3 .* x6 + b[85]*x3 .* x7 + b[86]*x3 .* x8 + b[87]*x3 .* x9 + b[88]*x10 .* x3 + b[89]*x11 .* x3 + b[90]*x12
.* x3 + b[91]*x13 .* x3 + b[92]*x14 .* x3 + b[93]*x15 .* x3 + b[94]*x16 .* x3 + b[95]*x17 .* x3 + b[96]*x18 .* x3 +
b[97]*x19 .* x3 + b[98]*x20 .* x3 + b[99]*x21 .* x3)
+(b[100]*x22 .* x3 + b[101]*x3 .* z1 + b[102]*x3 .* z2 + b[103]*x3 .* z3 + b[104]*x3 .* z4 + b[105]*x3 .*
z5 + b[106]*x4 .* x4 + b[107]*x4 .* x5 + b[108]*x4 .* x6 + b[109]*x4 .* x7 + b[110]*x4 .* x8 + b[111]*x4 .* x9 +
b[112]*x10 .* x4 + b[113]*x11 .* x4 + b[114]*x12 .* x4 + b[115]*x13 .* x4 + b[116]*x14 .* x4 + b[117]*x15 .* x4 +
b[118]*x16 .* x4 + b[119]*x17 .* x4 + b[120]*x18 .* x4 + b[121]*x19 .* x4 + b[122]*x20 .* x4 + b[123]*x21 .* x4 +
b[124]*x22 .* x4 + b[125]*x4 .* z1 + b[126]*x4 .* z2 + b[127]*x4 .* z3 + b[128]*x4 .* z4 + b[129]*x4 .* z5 + b[130]*x5
.* x5 + b[131]*x5 .* x6 + b[132]*x5 .* x7 + b[133]*x5 .* x8 + b[134]*x5 .* x9 + b[135]*x10 .* x5 + b[136]*x11 .* x5 +
b[137]*x12 .* x5 + b[138]*x13 .* x5 + b[139]*x14 .* x5 + b[140]*x15 .* x5 + b[141]*x16 .* x5 + b[142]*x17 .* x5 +
b[143]*x18 .* x5 + b[144]*x19 .* x5 + b[145]*x20 .* x5 + b[146]*x21 .* x5 + b[147]*x22 .* x5 + b[148]*x5 .* z1 +
b[149]*x5 .* z2 + b[150]*x5 .* z3 + b[151]*x5 .* z4 + b[152]*x5 .* z5 + b[153]*x6 .* x6 + b[154]*x6 .* x7 + b[155]*x6
.* x8 + b[156]*x6 .* x9 + b[157]*x10 .* x6 + b[158]*x11 .* x6 + b[159]*x12 .* x6 + b[160]*x13 .* x6 + b[161]*x14 .* x6
+ b[162]*x15 .* x6 + b[163]*x16 .* x6 + b[164]*x17 .* x6 + b[165]*x18 .* x6 + b[166]*x19 .* x6 + b[167]*x20 .* x6 +
b[168]*x21 .* x6 + b[169]*x22 .* x6 + b[170]*x6 .* z1 + b[171]*x6 .* z2 + b[172]*x6 .* z3 + b[173]*x6 .* z4 + b[174]*x6
.* z5 + b[175]*x7 .* x7 + b[176]*x7 .* x8 + b[177]*x7 .* x9 + b[178]*x10 .* x7 + b[179]*x11 .* x7 + b[180]*x12 .* x7 +
b[181]*x13 .* x7 + b[182]*x14 .* x7 + b[183]*x15 .* x7 + b[184]*x16 .* x7 + b[185]*x17 .* x7 + b[186]*x18 .* x7 +
b[187]*x19 .* x7 + b[188]*x20 .* x7 + b[189]*x21 .* x7 + b[190]*x22 .* x7 + b[191]*x7 .* z1 + b[192]*x7 .* z2 +
b[193]*x7 .* z3 + b[194]*x7 .* z4 + b[195]*x7 .* z5 + b[196]*x8 .* x8 + b[197]*x8 .* x9 + b[198]*x10 .* x8 + b[199]*x11
.* x8)
+(b[200]*x12 .* x8 + b[201]*x13 .* x8 + b[202]*x14 .* x8 + b[203]*x15 .* x8 + b[204]*x16 .* x8 +
b[205]*x17 .* x8 + b[206]*x18 .* x8 + b[207]*x19 .* x8 + b[208]*x20 .* x8 + b[209]*x21 .* x8 + b[210]*x22 .* x8 +
b[211]*x8 .* z1 + b[212]*x8 .* z2 + b[213]*x8 .* z3 + b[214]*x8 .* z4 + b[215]*x8 .* z5 + b[216]*x9 .* x9 + b[217]*x10
.* x9 + b[218]*x11 .* x9 + b[219]*x12 .* x9 + b[220]*x13 .* x9 + b[221]*x14 .* x9 + b[222]*x15 .* x9 + b[223]*x16 .* x9
+ b[224]*x17 .* x9 + b[225]*x18 .* x9 + b[226]*x19 .* x9 + b[227]*x20 .* x9 + b[228]*x21 .* x9 + b[229]*x22 .* x9 +
b[230]*x9 .* z1 + b[231]*x9 .* z2 + b[232]*x9 .* z3 + b[233]*x9 .* z4 + b[234]*x9 .* z5 + b[235]*x10 .* x10 +
b[236]*x10 .* x11 + b[237]*x10 .* x12 + b[238]*x10 .* x13 + b[239]*x10 .* x14 + b[240]*x10 .* x15 + b[241]*x10 .* x16 +
b[242]*x10 .* x17 + b[243]*x10 .* x18 + b[244]*x10 .* x19 + b[245]*x10 .* x20 + b[246]*x10 .* x21 + b[247]*x10 .* x22 +
b[248]*x10 .* z1 + b[249]*x10 .* z2 + b[250]*x10 .* z3 + b[251]*x10 .* z4 + b[252]*x10 .* z5 + b[253]*x11 .* x11 +
b[254]*x11 .* x12 + b[255]*x11 .* x13 + b[256]*x11 .* x14 + b[257]*x11 .* x15 + b[258]*x11 .* x16 + b[259]*x11 .* x17 +
b[260]*x11 .* x18 + b[261]*x11 .* x19 + b[262]*x11 .* x20 + b[263]*x11 .* x21 + b[264]*x11 .* x22 + b[265]*x11 .* z1 +
b[266]*x11 .* z2 + b[267]*x11 .* z3 + b[268]*x11 .* z4 + b[269]*x11 .* z5 + b[270]*x12 .* x12 + b[271]*x12 .* x13 +
b[272]*x12 .* x14 + b[273]*x12 .* x15 + b[274]*x12 .* x16 + b[275]*x12 .* x17 + b[276]*x12 .* x18 + b[277]*x12 .* x19 +
b[278]*x12 .* x20 + b[279]*x12 .* x21 + b[280]*x12 .* x22 + b[281]*x12 .* z1 + b[282]*x12 .* z2 + b[283]*x12 .* z3 +
b[284]*x12 .* z4 + b[285]*x12 .* z5 + b[286]*x13 .* x13 + b[287]*x13 .* x14 + b[288]*x13 .* x15 + b[289]*x13 .* x16 +
87
b[290]*x13 .* x17 + b[291]*x13 .* x18 + b[292]*x13 .* x19 + b[293]*x13 .* x20 + b[294]*x13 .* x21 + b[295]*x13 .* x22 +
b[296]*x13 .* z1 + b[297]*x13 .* z2 + b[298]*x13 .* z3 + b[299]*x13 .* z4)
+(b[300]*x13 .* z5 + b[301]*x14 .* x14 + b[302]*x14 .* x15 + b[303]*x14 .* x16 + b[304]*x14 .* x17 +
b[305]*x14 .* x18 + b[306]*x14 .* x19 + b[307]*x14 .* x20 + b[308]*x14 .* x21 + b[309]*x14 .* x22 + b[310]*x14 .* z1 +
b[311]*x14 .* z2 + b[312]*x14 .* z3 + b[313]*x14 .* z4 + b[314]*x14 .* z5 + b[315]*x15 .* x15 + b[316]*x15 .* x16 +
b[317]*x15 .* x17 + b[318]*x15 .* x18 + b[319]*x15 .* x19 + b[320]*x15 .* x20 + b[321]*x15 .* x21 + b[322]*x15 .* x22 +
b[323]*x15 .* z1 + b[324]*x15 .* z2 + b[325]*x15 .* z3 + b[326]*x15 .* z4 + b[327]*x15 .* z5 + b[328]*x16 .* x16 +
b[329]*x16 .* x17 + b[330]*x16 .* x18 + b[331]*x16 .* x19 + b[332]*x16 .* x20 + b[333]*x16 .* x21 + b[334]*x16 .* x22 +
b[335]*x16 .* z1 + b[336]*x16 .* z2 + b[337]*x16 .* z3 + b[338]*x16 .* z4 + b[339]*x16 .* z5 + b[340]*x17 .* x17 +
b[341]*x17 .* x18 + b[342]*x17 .* x19 + b[343]*x17 .* x20 + b[344]*x17 .* x21 + b[345]*x17 .* x22 + b[346]*x17 .* z1 +
b[347]*x17 .* z2 + b[348]*x17 .* z3 + b[349]*x17 .* z4 + b[350]*x17 .* z5 + b[351]*x18 .* x18 + b[352]*x18 .* x19 +
b[353]*x18 .* x20 + b[354]*x18 .* x21 + b[355]*x18 .* x22 + b[356]*x18 .* z1 + b[357]*x18 .* z2 + b[358]*x18 .* z3 +
b[359]*x18 .* z4 + b[360]*x18 .* z5 + b[361]*x19 .* x19 + b[362]*x19 .* x20 + b[363]*x19 .* x21 + b[364]*x19 .* x22 +
b[365]*x19 .* z1 + b[366]*x19 .* z2 + b[367]*x19 .* z3 + b[368]*x19 .* z4 + b[369]*x19 .* z5 + b[370]*x20 .* x20 +
b[371]*x20 .* x21 + b[372]*x20 .* x22 + b[373]*x20 .* z1 + b[374]*x20 .* z2 + b[375]*x20 .* z3 + b[376]*x20 .* z4 +
b[377]*x20 .* z5 + b[378]*x21 .* x21 + b[379]*x21 .* x22 + b[380]*x21 .* z1 + b[381]*x21 .* z2 + b[382]*x21 .* z3 +
b[383]*x21 .* z4 + b[384]*x21 .* z5 + b[385]*x22 .* x22 + b[386]*x22 .* z1 + b[387]*x22 .* z2 + b[388]*x22 .* z3 +
b[389]*x22 .* z4 + b[390]*x22 .* z5 + b[391]*z1 .* z2 + b[392]*z1 .* z3 + b[393]*z1 .* z4 + b[394]*z1 .* z5 + b[395]*z2
.* z3 + b[396]*z2 .* z4 + b[397]*z2 .* z5 + b[398]*z3 .* z4 + b[399]*z3 .* z5 + b[400]*z4 .* z5));
//generate counterfactuals
for(k in 1:K){
fy[k] <- mean((b0 + b[1]*xint1[k] + b[2]*xint2[k] + b[3]*xint3[k] + b[4]*xint4[k] + b[5]*xint5[k] + b[6]*xint6[k] +
b[7]*xint7[k] + b[8]*xint8[k] + b[9]*xint9[k] + b[10]*xint10[k] + b[11]*xint11[k] + b[12]*xint12[k] + b[13]*xint13[k] +
b[14]*xint14[k] + b[15]*xint15[k] + b[16]*xint16[k] + b[17]*xint17[k] + b[18]*xint18[k] + b[19]*xint19[k] +
b[20]*xint20[k] + b[21]*xint21[k] + b[22]*xint22[k] + b[23]*z1 + b[24]*z2 + b[25]*z3 + b[26]*z4 + b[27]*z5 +
b[28]*xint1[k] .* xint1[k] + b[29]*xint1[k] .* xint2[k] + b[30]*xint1[k] .* xint3[k] + b[31]*xint1[k] .* xint4[k] +
b[32]*xint1[k] .* xint5[k] + b[33]*xint1[k] .* xint6[k] + b[34]*xint1[k] .* xint7[k] + b[35]*xint1[k] .* xint8[k] +
b[36]*xint1[k] .* xint9[k] + b[37]*xint1[k] .* xint10[k] + b[38]*xint1[k] .* xint11[k] + b[39]*xint1[k] .* xint12[k] +
b[40]*xint1[k] .* xint13[k] + b[41]*xint1[k] .* xint14[k] + b[42]*xint1[k] .* xint15[k] + b[43]*xint1[k] .* xint16[k] +
b[44]*xint1[k] .* xint17[k] + b[45]*xint1[k] .* xint18[k] + b[46]*xint1[k] .* xint19[k] + b[47]*xint1[k] .* xint20[k] +
b[48]*xint1[k] .* xint21[k] + b[49]*xint1[k] .* xint22[k] + b[50]*xint1[k] .* z1 + b[51]*xint1[k] .* z2 +
b[52]*xint1[k] .* z3 + b[53]*xint1[k] .* z4 + b[54]*xint1[k] .* z5 + b[55]*xint2[k] .* xint2[k] + b[56]*xint2[k] .*
xint3[k] + b[57]*xint2[k] .* xint4[k] + b[58]*xint2[k] .* xint5[k] + b[59]*xint2[k] .* xint6[k] + b[60]*xint2[k] .*
xint7[k] + b[61]*xint2[k] .* xint8[k] + b[62]*xint2[k] .* xint9[k] + b[63]*xint10[k] .* xint2[k] + b[64]*xint11[k] .*
xint2[k] + b[65]*xint12[k] .* xint2[k] + b[66]*xint13[k] .* xint2[k] + b[67]*xint14[k] .* xint2[k] + b[68]*xint15[k] .*
xint2[k] + b[69]*xint16[k] .* xint2[k] + b[70]*xint17[k] .* xint2[k] + b[71]*xint18[k] .* xint2[k] + b[72]*xint19[k] .*
xint2[k] + b[73]*xint2[k] .* xint20[k] + b[74]*xint2[k] .* xint21[k] + b[75]*xint2[k] .* xint22[k] + b[76]*xint2[k] .*
z1 + b[77]*xint2[k] .* z2 + b[78]*xint2[k] .* z3 + b[79]*xint2[k] .* z4 + b[80]*xint2[k] .* z5 + b[81]*xint3[k] .*
xint3[k] + b[82]*xint3[k] .* xint4[k] + b[83]*xint3[k] .* xint5[k] + b[84]*xint3[k] .* xint6[k] + b[85]*xint3[k] .*
xint7[k] + b[86]*xint3[k] .* xint8[k] + b[87]*xint3[k] .* xint9[k] + b[88]*xint10[k] .* xint3[k] + b[89]*xint11[k] .*
xint3[k] + b[90]*xint12[k] .* xint3[k] + b[91]*xint13[k] .* xint3[k] + b[92]*xint14[k] .* xint3[k] + b[93]*xint15[k] .*
88

xint3[k] + b[94]*xint16[k] .* xint3[k] + b[95]*xint17[k] .* xint3[k] + b[96]*xint18[k] .* xint3[k] + b[97]*xint19[k] .*
xint3[k] + b[98]*xint20[k] .* xint3[k] + b[99]*xint21[k] .* xint3[k])
+(b[100]*xint22[k] .* xint3[k] + b[101]*xint3[k] .* z1 + b[102]*xint3[k] .* z2 + b[103]*xint3[k] .* z3 +
b[104]*xint3[k] .* z4 + b[105]*xint3[k] .* z5 + b[106]*xint4[k] .* xint4[k] + b[107]*xint4[k] .* xint5[k] +
b[108]*xint4[k] .* xint6[k] + b[109]*xint4[k] .* xint7[k] + b[110]*xint4[k] .* xint8[k] + b[111]*xint4[k] .* xint9[k] +
b[112]*xint10[k] .* xint4[k] + b[113]*xint11[k] .* xint4[k] + b[114]*xint12[k] .* xint4[k] + b[115]*xint13[k] .*
xint4[k] + b[116]*xint14[k] .* xint4[k] + b[117]*xint15[k] .* xint4[k] + b[118]*xint16[k] .* xint4[k] +
b[119]*xint17[k] .* xint4[k] + b[120]*xint18[k] .* xint4[k] + b[121]*xint19[k] .* xint4[k] + b[122]*xint20[k] .*
xint4[k] + b[123]*xint21[k] .* xint4[k] + b[124]*xint22[k] .* xint4[k] + b[125]*xint4[k] .* z1 + b[126]*xint4[k] .* z2
+ b[127]*xint4[k] .* z3 + b[128]*xint4[k] .* z4 + b[129]*xint4[k] .* z5 + b[130]*xint5[k] .* xint5[k] + b[131]*xint5[k]
.* xint6[k] + b[132]*xint5[k] .* xint7[k] + b[133]*xint5[k] .* xint8[k] + b[134]*xint5[k] .* xint9[k] +
b[135]*xint10[k] .* xint5[k] + b[136]*xint11[k] .* xint5[k] + b[137]*xint12[k] .* xint5[k] + b[138]*xint13[k] .*
xint5[k] + b[139]*xint14[k] .* xint5[k] + b[140]*xint15[k] .* xint5[k] + b[141]*xint16[k] .* xint5[k] +
b[142]*xint17[k] .* xint5[k] + b[143]*xint18[k] .* xint5[k] + b[144]*xint19[k] .* xint5[k] + b[145]*xint20[k] .*
xint5[k] + b[146]*xint21[k] .* xint5[k] + b[147]*xint22[k] .* xint5[k] + b[148]*xint5[k] .* z1 + b[149]*xint5[k] .* z2
+ b[150]*xint5[k] .* z3 + b[151]*xint5[k] .* z4 + b[152]*xint5[k] .* z5 + b[153]*xint6[k] .* xint6[k] + b[154]*xint6[k]
.* xint7[k] + b[155]*xint6[k] .* xint8[k] + b[156]*xint6[k] .* xint9[k] + b[157]*xint10[k] .* xint6[k] +
b[158]*xint11[k] .* xint6[k] + b[159]*xint12[k] .* xint6[k] + b[160]*xint13[k] .* xint6[k] + b[161]*xint14[k] .*
xint6[k] + b[162]*xint15[k] .* xint6[k] + b[163]*xint16[k] .* xint6[k] + b[164]*xint17[k] .* xint6[k] +
b[165]*xint18[k] .* xint6[k] + b[166]*xint19[k] .* xint6[k] + b[167]*xint20[k] .* xint6[k] + b[168]*xint21[k] .*
xint6[k] + b[169]*xint22[k] .* xint6[k] + b[170]*xint6[k] .* z1 + b[171]*xint6[k] .* z2 + b[172]*xint6[k] .* z3 +
b[173]*xint6[k] .* z4 + b[174]*xint6[k] .* z5 + b[175]*xint7[k] .* xint7[k] + b[176]*xint7[k] .* xint8[k] +
b[177]*xint7[k] .* xint9[k] + b[178]*xint10[k] .* xint7[k] + b[179]*xint11[k] .* xint7[k] + b[180]*xint12[k] .*
xint7[k] + b[181]*xint13[k] .* xint7[k] + b[182]*xint14[k] .* xint7[k] + b[183]*xint15[k] .* xint7[k] +
b[184]*xint16[k] .* xint7[k] + b[185]*xint17[k] .* xint7[k] + b[186]*xint18[k] .* xint7[k] + b[187]*xint19[k] .*
xint7[k] + b[188]*xint20[k] .* xint7[k] + b[189]*xint21[k] .* xint7[k] + b[190]*xint22[k] .* xint7[k] + b[191]*xint7[k]
.* z1 + b[192]*xint7[k] .* z2 + b[193]*xint7[k] .* z3 + b[194]*xint7[k] .* z4 + b[195]*xint7[k] .* z5 + b[196]*xint8[k]
.* xint8[k] + b[197]*xint8[k] .* xint9[k] + b[198]*xint10[k] .* xint8[k] + b[199]*xint11[k] .* xint8[k])
+(b[200]*xint12[k] .* xint8[k] + b[201]*xint13[k] .* xint8[k] + b[202]*xint14[k] .* xint8[k] +
b[203]*xint15[k] .* xint8[k] + b[204]*xint16[k] .* xint8[k] + b[205]*xint17[k] .* xint8[k] + b[206]*xint18[k] .*
xint8[k] + b[207]*xint19[k] .* xint8[k] + b[208]*xint20[k] .* xint8[k] + b[209]*xint21[k] .* xint8[k] +
b[210]*xint22[k] .* xint8[k] + b[211]*xint8[k] .* z1 + b[212]*xint8[k] .* z2 + b[213]*xint8[k] .* z3 + b[214]*xint8[k]
.* z4 + b[215]*xint8[k] .* z5 + b[216]*xint9[k] .* xint9[k] + b[217]*xint10[k] .* xint9[k] + b[218]*xint11[k] .*
xint9[k] + b[219]*xint12[k] .* xint9[k] + b[220]*xint13[k] .* xint9[k] + b[221]*xint14[k] .* xint9[k] +
b[222]*xint15[k] .* xint9[k] + b[223]*xint16[k] .* xint9[k] + b[224]*xint17[k] .* xint9[k] + b[225]*xint18[k] .*
xint9[k] + b[226]*xint19[k] .* xint9[k] + b[227]*xint20[k] .* xint9[k] + b[228]*xint21[k] .* xint9[k] +
b[229]*xint22[k] .* xint9[k] + b[230]*xint9[k] .* z1 + b[231]*xint9[k] .* z2 + b[232]*xint9[k] .* z3 + b[233]*xint9[k]
.* z4 + b[234]*xint9[k] .* z5 + b[235]*xint10[k] .* xint10[k] + b[236]*xint10[k] .* xint11[k] + b[237]*xint10[k] .*
xint12[k] + b[238]*xint10[k] .* xint13[k] + b[239]*xint10[k] .* xint14[k] + b[240]*xint10[k] .* xint15[k] +
b[241]*xint10[k] .* xint16[k] + b[242]*xint10[k] .* xint17[k] + b[243]*xint10[k] .* xint18[k] + b[244]*xint10[k] .*
xint19[k] + b[245]*xint10[k] .* xint20[k] + b[246]*xint10[k] .* xint21[k] + b[247]*xint10[k] .* xint22[k] +
b[248]*xint10[k] .* z1 + b[249]*xint10[k] .* z2 + b[250]*xint10[k] .* z3 + b[251]*xint10[k] .* z4 + b[252]*xint10[k] .*
89

z5 + b[253]*xint11[k] .* xint11[k] + b[254]*xint11[k] .* xint12[k] + b[255]*xint11[k] .* xint13[k] + b[256]*xint11[k]
.* xint14[k] + b[257]*xint11[k] .* xint15[k] + b[258]*xint11[k] .* xint16[k] + b[259]*xint11[k] .* xint17[k] +
b[260]*xint11[k] .* xint18[k] + b[261]*xint11[k] .* xint19[k] + b[262]*xint11[k] .* xint20[k] + b[263]*xint11[k] .*
xint21[k] + b[264]*xint11[k] .* xint22[k] + b[265]*xint11[k] .* z1 + b[266]*xint11[k] .* z2 + b[267]*xint11[k] .* z3 +
b[268]*xint11[k] .* z4 + b[269]*xint11[k] .* z5 + b[270]*xint12[k] .* xint12[k] + b[271]*xint12[k] .* xint13[k] +
b[272]*xint12[k] .* xint14[k] + b[273]*xint12[k] .* xint15[k] + b[274]*xint12[k] .* xint16[k] + b[275]*xint12[k] .*
xint17[k] + b[276]*xint12[k] .* xint18[k] + b[277]*xint12[k] .* xint19[k] + b[278]*xint12[k] .* xint20[k] +
b[279]*xint12[k] .* xint21[k] + b[280]*xint12[k] .* xint22[k] + b[281]*xint12[k] .* z1 + b[282]*xint12[k] .* z2 +
b[283]*xint12[k] .* z3 + b[284]*xint12[k] .* z4 + b[285]*xint12[k] .* z5 + b[286]*xint13[k] .* xint13[k] +
b[287]*xint13[k] .* xint14[k] + b[288]*xint13[k] .* xint15[k] + b[289]*xint13[k] .* xint16[k] + b[290]*xint13[k] .*
xint17[k] + b[291]*xint13[k] .* xint18[k] + b[292]*xint13[k] .* xint19[k] + b[293]*xint13[k] .* xint20[k] +
b[294]*xint13[k] .* xint21[k] + b[295]*xint13[k] .* xint22[k] + b[296]*xint13[k] .* z1 + b[297]*xint13[k] .* z2 +
b[298]*xint13[k] .* z3 + b[299]*xint13[k] .* z4)
+(b[300]*xint13[k] .* z5 + b[301]*xint14[k] .* xint14[k] + b[302]*xint14[k] .* xint15[k] +
b[303]*xint14[k] .* xint16[k] + b[304]*xint14[k] .* xint17[k] + b[305]*xint14[k] .* xint18[k] + b[306]*xint14[k] .*
xint19[k] + b[307]*xint14[k] .* xint20[k] + b[308]*xint14[k] .* xint21[k] + b[309]*xint14[k] .* xint22[k] +
b[310]*xint14[k] .* z1 + b[311]*xint14[k] .* z2 + b[312]*xint14[k] .* z3 + b[313]*xint14[k] .* z4 + b[314]*xint14[k] .*
z5 + b[315]*xint15[k] .* xint15[k] + b[316]*xint15[k] .* xint16[k] + b[317]*xint15[k] .* xint17[k] + b[318]*xint15[k]
.* xint18[k] + b[319]*xint15[k] .* xint19[k] + b[320]*xint15[k] .* xint20[k] + b[321]*xint15[k] .* xint21[k] +
b[322]*xint15[k] .* xint22[k] + b[323]*xint15[k] .* z1 + b[324]*xint15[k] .* z2 + b[325]*xint15[k] .* z3 +
b[326]*xint15[k] .* z4 + b[327]*xint15[k] .* z5 + b[328]*xint16[k] .* xint16[k] + b[329]*xint16[k] .* xint17[k] +
b[330]*xint16[k] .* xint18[k] + b[331]*xint16[k] .* xint19[k] + b[332]*xint16[k] .* xint20[k] + b[333]*xint16[k] .*
xint21[k] + b[334]*xint16[k] .* xint22[k] + b[335]*xint16[k] .* z1 + b[336]*xint16[k] .* z2 + b[337]*xint16[k] .* z3 +
b[338]*xint16[k] .* z4 + b[339]*xint16[k] .* z5 + b[340]*xint17[k] .* xint17[k] + b[341]*xint17[k] .* xint18[k] +
b[342]*xint17[k] .* xint19[k] + b[343]*xint17[k] .* xint20[k] + b[344]*xint17[k] .* xint21[k] + b[345]*xint17[k] .*
xint22[k] + b[346]*xint17[k] .* z1 + b[347]*xint17[k] .* z2 + b[348]*xint17[k] .* z3 + b[349]*xint17[k] .* z4 +
b[350]*xint17[k] .* z5 + b[351]*xint18[k] .* xint18[k] + b[352]*xint18[k] .* xint19[k] + b[353]*xint18[k] .* xint20[k]
+ b[354]*xint18[k] .* xint21[k] + b[355]*xint18[k] .* xint22[k] + b[356]*xint18[k] .* z1 + b[357]*xint18[k] .* z2 +
b[358]*xint18[k] .* z3 + b[359]*xint18[k] .* z4 + b[360]*xint18[k] .* z5 + b[361]*xint19[k] .* xint19[k] +
b[362]*xint19[k] .* xint20[k] + b[363]*xint19[k] .* xint21[k] + b[364]*xint19[k] .* xint22[k] + b[365]*xint19[k] .* z1
+ b[366]*xint19[k] .* z2 + b[367]*xint19[k] .* z3 + b[368]*xint19[k] .* z4 + b[369]*xint19[k] .* z5 + b[370]*xint20[k]
.* xint20[k] + b[371]*xint20[k] .* xint21[k] + b[372]*xint20[k] .* xint22[k] + b[373]*xint20[k] .* z1 +
b[374]*xint20[k] .* z2 + b[375]*xint20[k] .* z3 + b[376]*xint20[k] .* z4 + b[377]*xint20[k] .* z5 + b[378]*xint21[k] .*
xint21[k] + b[379]*xint21[k] .* xint22[k] + b[380]*xint21[k] .* z1 + b[381]*xint21[k] .* z2 + b[382]*xint21[k] .* z3 +
b[383]*xint21[k] .* z4 + b[384]*xint21[k] .* z5 + b[385]*xint22[k] .* xint22[k] + b[386]*xint22[k] .* z1 +
b[387]*xint22[k] .* z2 + b[388]*xint22[k] .* z3 + b[389]*xint22[k] .* z4 + b[390]*xint22[k] .* z5 + b[391]*z1 .* z2 +
b[392]*z1 .* z3 + b[393]*z1 .* z4 + b[394]*z1 .* z5 + b[395]*z2 .* z3 + b[396]*z2 .* z4 + b[397]*z2 .* z5 + b[398]*z3
.* z4 + b[399]*z3 .* z5 + b[400]*z4 .* z5));
}
}
90

11. Do Your Exposures Need Supervision?Presenting Author: Jenna Krall
Organization: Emory University
Contributing Authors: Jenna R. Krall, Howard H. Chang, Katherine M. Gass, W. Michael Caudle,
Matthew J. Strickland
Code:
# Full code can be found at:
# https://github.com/kralljr/niehs-epistats
################
# Setup
# Read in dataset
dat <- read.csv("DataSet2.csv")
# Load libraries
library(psych)
library(splines)
library(rpart)
# Specify covariates
covar <- which(substr(colnames(dat), 1, 1) == "x")
################
# PCA approach
pr1 <- principal(dat[, covar], nfactors = 6)
# Get scores
scores <- pr1$scores
colnames(scores) <- paste0("rotPC", seq(1, 6))
# Scale results
scores <- sweep(scores, 2, apply(scores, 2, sd), "/")
# Create new data
datPC <- data.frame(dat, scores)
# Adjusted linear model
lm1 <- lm(y ~ rotPC1 + rotPC2 + rotPC3 + rotPC4 + rotPC5 + rotPC6 + z1 + z3 + ns(z2, 3), data = datPC)
summary(lm1)$coef
################
# C&RT approach
# First regress out confounders
residxy <- dat
residxy <- apply(residxy, 2, function(x) lm(x ~ z1 + z3 + ns(z2, 3), data = dat)$resid)
# Reformat data
residxy <- residxy[, -which(colnames(residxy) %in% c("z1", "z2", "z3"))]
91

residxy <- data.frame(residxy)
colnames(residxy) <- paste0("r", colnames(residxy))
# Specify control for C&RT model
fit.control <- rpart.control(xval = 100, cp = 0, minbucket = 5, maxcompete = 4)
# Run C&RT model
whcov <- which(substr(colnames(residxy), 1, 2) == "rx")
eqn1 <- paste("ry ~", paste(colnames(residxy)[whcov], collapse = "+"))
rpart1 <- rpart(eval(eqn1), data = residxy, control = fit.control)
92

12. Principal Component Analysis: An Application for Understanding
Health Effects of Environmental Chemical Mixture Exposures Presenting Author: Cristina Murray-Krezan
Organization: University of New Mexico
Contributing Authors: Johnnye Lewis, Curtis Miller, Cristina Murray-Krezan
Code:
See next page for code.
93

/************************************************************************/
/*Purpose: Method 1 for NIEHS Chemical Mixtures Simulated Data Set 1 */
/*Author: Cristina Murray-Krezan, UNM */
/*Program: SAS */
/*Date: April 2015 */
/************************************************************************/
proc import out= work.data1set
datafile= "Z:\...\dataset1.xls"
dbms=excelcs replace;
range="simdata3#txt$";
scantext=yes;
usedate=yes;
scantime=yes;
run;
data data1set2;
set data1set;
logy = log(y);
sqrty = sqrt(y);
array Orig{7} X1-X7; array logx{7} logx1-logx7;
do i = 1 to 7;
logx{i} = log(Orig{i});
end;
drop i;
run;
/*look at correlations between variables*/
proc corr data = data1set2 pearson spearman;
var y x1-x7;
run; proc corr data = data1set2 pearson spearman;
var logy logx1-logx7;
run;
/*Perform PCA over all X variables*/
proc princomp data = data1set2 PLOTS=SCORE(ELLIPSE NCOMP=3) out=PC_X1_X7;
var logx1-logx7;
title "PCA logX1-logX7";
run;
/*Manually create interactions for use in PROC GLMSELECT*/
94

data pc_only;
set pc_x1_x7;
z_prin1 = z*prin1;
z_prin2 = z*prin2;
z_prin3 = z*prin3;
z_prin4 = z*prin4;
run;
/*Select only first 4 PCs since they account for >90% common variance*/
/*Use AIC for model selection for interactions, keeping main effects*/
/*Also checked model selection via SBC and CP criteria to confirm similar models selected, not shown*/
proc glmselect data = pc_only;
model y = z prin1 prin2 prin3 prin4
z_prin1 z_prin2 z_prin3 z_prin4
/selection=stepwise(choose=aic) select=aic include = 5 stop = aic showpvals ;
title "Reg model with PC1-4 and Z model selection = aic";
run;
quit;
/*Final model*/
proc glm data = pc_only;
class z; *So can calculated ls means;
model y = z prin1 prin2 prin3 prin4
z_prin1 z_prin3 z_prin4/solution e1 e3;
output out = regmod1 r = resids p = predpts;
title "Reg model with PC1-4 and Z model";
lsmeans z/cl;
run;
quit;
/*Assumptions check*/
proc sgplot data = regmod1;
histogram resids;
run; proc sgplot data = regmod1;
scatter x=predpts y=resids;
run;
proc univariate data = regmod1 normal;
var resids;
ppplot;
run;
95

#########################################################################
#Purpose: Method 2 for NIEHS Chemical Mixtures Simulated Data Set 1 #
#Author: Curtis Miller, UNM #
#Program: R #
#Date: April 2015 #
#Note: USED THIS CODE TO CALCULATE FINAL MODEL ESTIMATES #
#########################################################################
dat1 <- read.csv('../data/DataSet1.csv',header=T)
Xmod <- log(dat1)[,3:9]
names(Xmod) <- paste('log',1:7,sep='X')
pc1 <- princomp(Xmod)
dat1b <- as.data.frame(cbind(dat1[,c('Y','Z')],pc1$score))
names(dat1b)[1:2] <- c('Y','Z')
names(dat1b)[3:9] <- paste('pc',1:7,sep='1')
str1 <- 'Y~Z*('
for(j in 3:9) str1 <- paste(str1,names(dat1b)[j],sep='+')
str1 <- paste(str1,')',sep='')
str1 <- sub('(+','(',str1,fixed=T)
lm1 <- lm(formula=as.formula(str1),data=dat1b)
lm1summ<-summary(lm1)
cat('Full model:\n')
show(as.formula(str1))
cat('\nNumber of Coefficients:',length(lm1$coefficients),'\nCoefficients:\n')
show(formatC(lm1summ$coefficients,digits=4,format='g'))
cat('Adjusted R^2:',lm1summ$adj.r.squared)
qq <- lm1summ$fstatistic
cat('\np-value of F statistic:',formatC(1-pf(qq[1],qq[2],qq[3]),digits=4,
format='g'),'\n')
# Now reduce this first model
library(MASS)
rlm1 <- stepAIC(lm1,trace=0)
rlm1summ <- summary(rlm1)
cat('Reduced model\npredictors:\n')
show(as.formula(as.character(rlm1$terms)))
cat('\nNumber of Coefficients:',length(rlm1$coefficients),'\nCoefficients:\n')
show(formatC(rlm1summ$coefficients,digits=4,format='g'))
96

cat('Adjusted R^2:',rlm1summ$adj.r.squared)
qq <- rlm1summ$fstatistic
cat('\np-value of F statistic:',formatC(1-pf(qq[1],qq[2],qq[3]),digits=4,
format='g'),'\n')
# Next add Z and all interactions with Z
# Indices of candidates for removal
rlm.old <- rlm1
rlmsumm.old <- rlm1summ
stopcrit <- 0
count <- 0
while(!stopcrit){
count <- count + 1
ii <- which(rlmsumm.old$coefficients[,4]>0.05)
l1 <- length(rlm.old$coefficients)
l2 <- length(ii)
# Eliminate predictors which do not appear as components of higher interactions
cc <- matrix(NA,nc=l2,nr=l1)
uu <- strsplit(names(rlm.old$coefficients),split=':')
for(j in 1:l1){
for(k in 1:l2){
cc[j,k] <- prod(uu[[ii[k]]]%in%uu[[j]])
}
}
jj <- which(apply(cc,2,sum)==1)
ii2 <- setdiff(2:l1,ii[jj])
str <- 'Y~'
for(j in ii2) str <- paste(str,names(rlm.old$coefficients)[j],sep='+')
str <- sub('~+','~',str,fixed=T)
lm.new <- lm(formula=as.formula(str),data=dat1b)
lmsumm.new <-summary(lm.new)
cat('Full model:\n')
show(as.formula(str))
cat('\nNumber of Coefficients:',length(lm.new$coefficients),'\n')
cat('Adjusted R^2:',lmsumm.new$adj.r.squared)
qq <- lmsumm.new$fstatistic
cat('\np-value of F statistic:',formatC(1-pf(qq[1],qq[2],qq[3]),digits=4,
format='g'),'\n')
rlm.new <- stepAIC(lm.new,trace=0)
97

rlmsumm.new <- summary(rlm.new)
cat('\nNumber of coefficients in reduced model:',
length(rlm.new$coefficients),'\n')
stopcrit <- 1*(length(rlm.new$coefficients)==length(lm.new$coefficients) &
length(jj)==0)
rlm.old <- rlm.new
rlmsumm.old <- rlmsumm.new
}
cat('\nFormula for final model:\n')
show(rlm.new$call)
cat('\nCoefficients of final model:\n')
show(formatC(rlmsumm.new$coefficients,digits=4,format='g'))
##exported predicted values as “y_dat1model.csv” for comparison with Method 1 predicted values and Ys#
/**************SAS code to combine predicted Ys from Methods 1 & 2******************/
proc import out= work.mod2
datafile= "C:\...\y_dat1model.csv"
dbms=csv replace;
getnames=no;
datarow=1;
run;
data both_mods;
merge mod2 (in = in1) regmod1 (in = in2);
keep y var1 predpts;
run;
data both_mods2;
merge mod2 (in = in1) regmod1 (in = in2);
keep y var1;
run;
data both_mods_stacked;
set both_mods2 regmod1;
if var1 ne . then do;
predys = var1;
class = "method2";
end;
else if predpts ne . then do;
predys = predpts;
class = "method1";
98

end;
keep y var1 predpts class predys;
run;
proc univariate data = both_mods_stacked normal;
class class;
var predys;
histogram /normal kernel;
run; proc npar1way data = both_mods_stacked;
class class;
var predys;
run;
proc export data= work.both_mods
outfile= "C:\... \both_mods_dataset1.dta"
dbms=stata replace;
run;
proc export data= work.both_mods_stacked
outfile= "C:\... \both_mods_stacked_dataset1.dta"
dbms=stata replace;
run;
/***********************Stata Code to construct graphs, with some manual formatting**************/
clear
use "C:\...\both_mods_dataset1.dta"
twoway (scatter y predpts) (scatter y var1) (lfit y predpts) (scatter y var1)
twoway (scatter y predpts) (scatter y var1) (lfit y predpts) (lfit y var1)
clear
use "C:\...\both_mods_stacked_dataset1.dta"
histogram Value, fcolor(blue) lcolor(black) kdensity ylabel(, angle(horizontal)) ymtick(,
angle(horizontal)) xsize(4) ysize(4) by(, graphregion(fcolor(white))) by(DataSource, cols(1))
/*###############################END DATA SET 1#########################################*/
99

/************************************************************************/
/*Purpose: Method 1 for NIEHS Chemical Mixtures Simulated Data Set 2 */
/*Author: Cristina Murray-Krezan, UNM */
/*Program: SAS */
/*Date: April 2015 */
/************************************************************************/
proc import out= work.simdat
datafile= "C:\...\dataset2.xls"
dbms=excelcs replace;
range="Sheet1$";
scantext=yes;
usedate=yes;
scantime=yes;
run;
/*distributions checked—all normal*/
proc corr data = simdat pearson;
var x1 x2 x3 x4 x5 x6 x7 x8 x9 x10 x11 x12 x13 x14 z1 z2;
run;
proc princomp data = simdat PLOTS=SCORE(ELLIPSE NCOMP=3) out=PC_X1_X14;
var x1-x14;
title "PCA X1-X14";
run;
data interactions;
set PC_X1_X14;
z1_pc1 = z1*prin1;
z1_pc2 = z1*prin2;
z1_pc3 = z1*prin3;
z1_pc4 = z1*prin4;
z1_pc5 = z1*prin5;
z1_pc6 = z1*prin6;
z1_pc7 = z1*prin7;
z2_pc1 = z2*prin1;
z2_pc2 = z2*prin2;
z2_pc3 = z2*prin3;
z2_pc4 = z2*prin4;
z2_pc5 = z2*prin5;
100

z2_pc6 = z2*prin6;
z2_pc7 = z2*prin7;
z3_pc1 = z3*prin1;
z3_pc2 = z3*prin2;
z3_pc3 = z3*prin3;
z3_pc4 = z3*prin4;
z3_pc5 = z3*prin5;
z3_pc6 = z3*prin6;
z3_pc7 = z3*prin7;
run;
proc glmselect data = interactions;
class z3;
model y = z1 z2 z3 prin1 prin2 prin3 prin4 prin5 prin6 prin7
z1_pc1
z1_pc2
z1_pc3
z1_pc4
z1_pc5
z1_pc6
z1_pc7
z2_pc1
z2_pc2
z2_pc3
z2_pc4
z2_pc5
z2_pc6
z2_pc7
z3_pc1
z3_pc2
z3_pc3
z3_pc4
z3_pc5
z3_pc6
z3_pc7
/selection=stepwise(choose=aic) select=AIC include = 10 stop = aic showpvals steps=50;
title "Reg model selection 1 with Z based on aic";
run;
quit;
101

proc glm data = interactions;
class z3;
model y = z1 z2 z3 prin1 prin2 prin4 prin5
z1_pc4 z2_pc4 z3_pc1 z3_pc2 z3_pc5 /solution;
output out = regmod1 r = resids p = predpts;
title "Reg model 1";
run;
quit;
proc sgplot data = regmod1;
scatter x = predpts y = resids;
run;
proc sgplot data = regmod1;
histogram resids;
run; proc univariate data = regmod1 normal;
var resids;
ppplotl;
run;
#########################################################################
#Purpose: Method 2 for NIEHS Chemical Mixtures Simulated Data Set 2 #
#Author: Curtis Miller, UNM #
#Program: R #
#Date: April 2015 #
#Note: USED THIS CODE TO CALCULATE FINAL MODEL ESTIMATES #
#########################################################################
dat2 <- read.csv('../data/DataSet2.csv',header=T)
# X3-X5, X8, X14 are very highly correlated
pc1 <- princomp(dat2[,c(5:7,10)])
# X7,X9 are very highly correlated
pc2 <- princomp(dat2[,c(9,11)])
# X10,X11 are very highly correlated
pc3 <- princomp(dat2[,12:13])
# X12,X13 are very highly correlated
pc4 <- princomp(dat2[,14:15])
dat2b <- cbind(dat2[,2:4],pc1$score,pc2$score,pc3$score,pc4$score,
dat2[,c(8,16:19)])
102

names(dat2b)[4:13] <- paste(rep('pc',10),rep(1:4,c(4,rep(2,3))),
c(1:4,rep(1:2,3)),sep='')
library(MASS)
cat('Model with z variables first\n')
lm0 <- lm(y~z1*z2*z3,data=dat2b)
lm0summ <- summary(lm0)
cat('model is y~z1*z2*z3\nCoefficients:\n')
show(formatC(lm0summ$coefficients,digits=4,format='g'))
cat('Adjusted R^2:',formatC(lm0summ$adj.r.squared,digits=4,format='g'))
qq <- lm0summ$fstatistic
cat('\np-value of F statistic:',formatC(1-pf(qq[1],qq[2],qq[3]),digits=4,
format='g'),'\n')
rlm0 <- stepAIC(lm0,trace=0)
rlm0summ <- summary(rlm0)
cat('Reduced model:\n')
show(rlm0$terms[[3]])
cat('\nCoefficients:\n')
show(formatC(rlm0summ$coefficients,digits=4,format='g'))
cat('Adjusted R^2:',formatC(rlm0summ$adj.r.squared,digits=4,format='g'))
qq <- rlm0summ$fstatistic
cat('\np-value of F statistic:',formatC(1-pf(qq[1],qq[2],qq[3]),digits=4,
format='g'),'\n')
cat(" First model with X's alone, including second order interactions\n",
"of untransformed X's and first components of PC decompositions\n")
xind <- grep('x',names(dat2b))
pcind <- grep('pc',names(dat2b))
uu <- strsplit(names(dat2b)[pcind],split='')
lastdigits <- vector(length=length(pcind))
for(j in 1:length(pcind)) lastdigits[j] <- uu[[j]][4]
ind <- sort(c(xind,pcind[which(lastdigits=='1')]))
ind2 <- pcind[which(lastdigits!='1')]
str1 <- 'y~('
for(j in ind) str1 <-paste(str1,names(dat2b)[j],sep='+')
str1 <- paste(str1,')^2',sep='')
for(j in ind2)str1 <- paste(str1,names(dat2b)[j],sep='+')
str1 <- sub("(+","(",str1,fixed=T)
#
lm1 <- lm(formula=as.formula(str1),data=dat2b)
103

lm1summ <- summary(lm1)
cat('Full model:\n')
show(as.formula(str1))
cat('\nNumber of terms = ',length(lm1$coefficients),'\nAdjusted R^2:',
formatC(lm1summ$adj.r.squared,digits=4,format='g'))
qq <- lm1summ$fstatistic
cat('\np-value of F statistic:',formatC(1-pf(qq[1],qq[2],qq[3]),digits=4,
format='g'),'\n')
rlm1 <- stepAIC(lm1,trace=0)
rlm1summ <- summary(rlm1)
cat('Reduced model:\n')
show(rlm1$terms[[3]])
cat('\nNumber of terms:',length(rlm1$coefficients),'\nCoefficients:\n')
show(formatC(rlm1summ$coefficients,digits=4,format='g'))
cat('Adjusted R^2:',formatC(rlm1summ$adj.r.squared,digits=4,format='g'))
qq <- rlm1summ$fstatistic
cat('\np-value of F statistic:',formatC(1-pf(qq[1],qq[2],qq[3]),digits=4,
format='g'),'\n')
# lm0 showed that we can drop z1 as a predictor
cat('\nAdd interactions with z variables\n')
str2 <- paste('y~(z1+z2+z3)*(',as.character(rlm1$call[[2]])[[3]],')',sep='')
lm2 <- lm(formula=as.formula(str2),data=dat2b)
lm2summ<-summary(lm2)
cat('Full model:\n')
show(as.formula(str2))
cat('\nNumber of terms = ',length(lm2$coefficients),'\nAdjusted R^2:',
formatC(lm2summ$adj.r.squared,digits=4,format='g'))
qq <- lm2summ$fstatistic
cat('\np-value of F statistic:',formatC(1-pf(qq[1],qq[2],qq[3]),digits=4,
format='g'),'\n')
rlm2 <- stepAIC(lm2,trace=0)
rlm2summ <- summary(rlm2)
cat('Reduced model:\n')
show(rlm2$terms[[3]])
cat('\nNumber of terms:',length(rlm2$coefficients))
if(length(rlm2$coefficients)<=30){
cat('\nCoefficients:\n')
show(formatC(rlm2summ$coefficients,digits=4,format='g'))
104

}
cat('\nAdjusted R^2:',formatC(rlm2summ$adj.r.squared,digits=4,format='g'))
qq <- rlm2summ$fstatistic
cat('\np-value of F statistic:',formatC(1-pf(qq[1],qq[2],qq[3]),digits=4,
format='g'),'\n')
rlm.old <- rlm2
rlmsumm.old <- rlm2summ
stopcrit <- 0
count <- 0
# Change - drop all effects with p>0.05 that are not components of higher
# interactions
# Reduce model, repeat until model selection does not drop any predictors
while(!stopcrit){
count <- count+1
ii <- which(rlmsumm.old$coefficients[,4]>0.05)
l1 <- length(rlm.old$coefficients)
l2 <- length(ii)
cc <- matrix(NA,nc=l2,nr=l1)
uu <- strsplit(names(rlm.old$coefficients),split=':')
for(j in 1:l1){
for(k in 1:l2){
cc[j,k] <- prod(uu[[ii[k]]]%in%uu[[j]])
}
}
jj <- which(apply(cc,2,sum)==1)
ii2 <- setdiff(2:l1,ii[jj])
newstr <- 'y~'
for(j in ii2) newstr <- paste(newstr,names(rlm.old$coefficients)[j],
sep='+')
newstr <- sub('~+','~',newstr,fixed=T)
lm.new <- lm(formula=as.formula(newstr),data=dat2b)
lmsumm.new <- summary(lm.new)
cat('Full model:\n')
show(as.formula(newstr))
cat('\nNumber of terms=',length(lm.new$coefficients),'\nAdjusted R^2:',
formatC(lmsumm.new$adj.r.squared,digits=4,format='g'))
qq <- lmsumm.new$fstatistic
105

cat('\np-value of F statistic:',formatC(1-pf(qq[1],qq[2],qq[3]),digits=4,
format='g'),'\n')
rlm.new <- stepAIC(lm.new,trace=0)
rlmsumm.new <- summary(rlm.new)
cat('Reduced model:\n')
show(rlm.new$terms[[3]])
cat('\nNumber of terms:',length(rlm.new$coefficients),'\nAdjusted R^2:',
formatC(rlmsumm.new$adj.r.squared,digits=4,format='g'))
qq <- rlmsumm.new$fstatistic
cat('\np-value of F statistic:',formatC(1-pf(qq[1],qq[2],qq[3]),digits=4,
format='g'),'\n')
stopcrit <- 1*(length(rlm.new$coefficients)==length(rlm.old$coefficients))
rlm.old <- rlm.new
rlmsumm.old <- rlmsumm.new
}
cat('\nCoefficients:\n')
show(formatC(rlmsumm.new$coefficients,digits=4,format='g'))
cat('Sigma=',formatC(rlmsumm.new$sigma,digits=4,format='g'),'\n')
fstr <- paste('y = ',as.character(formatC(rlm.new$coefficients[j],digits=5,
format='g')),sep='')
mp <- c(' - ',' + ')
for(j in 2:length(rlm.new$coefficients)){
q <- rlm.new$coefficients[j]
sq <- (3+sign(q))/2
fstr <- paste(fstr,mp[sq],as.character(formatC(sign(q)*q,digits=5,format=
'g')),'*',names(q),sep='')
}
cat('dose-response formula:\n')
cat(fstr,'\n')
#exported predicted values as “y_dat2model.csv” for comparison with Method 1 predicted values and Ys#
/**************SAS code to combine predicted Ys from Methods 1 & 2******************/
proc import out= work.mod2
datafile= "C:\...\y_dat2model.csv"
dbms=csv replace;
getnames=no;
datarow=1;
106

run;
data both_mods;
merge mod2 (in = in1) regmod1 (in = in2);
keep y var1 predpts;
run;
data both_mods2;
merge mod2 (in = in1) regmod1 (in = in2);
keep y var1;
run;
data both_mods_stacked;
set both_mods2 regmod1;
if var1 ne . then do;
predys = var1;
class = "method2";
end;
else if predpts ne . then do;
predys = predpts;
class = "method1";
end;
keep y var1 predpts class predys;
run;
proc univariate data = both_mods_stacked normal;
class class;
var predys;
histogram /normal kernel;
run; proc npar1way data = both_mods_stacked;
class class;
var predys;
run;
proc export data= work.both_mods
outfile= "C:\... \both_mods_dataset2.dta"
dbms=stata replace;
run;
proc export data= work.both_mods_stacked
outfile= "C:\... \both_mods_stacked_dataset2.dta"
dbms=stata replace;
107

run;
/***********************Stata Code to construct graphs, with some manual formatting**************/
clear
use "C:\...\both_mods_dataset2.dta"
twoway (scatter y predpts) (scatter y var1) (lfit y predpts) (scatter y var1)
twoway (scatter y predpts) (scatter y var1) (lfit y predpts) (lfit y var1)
clear
import excel "C:\...\both_mods_stacked_dataset2.dta", sheet("Sheet1") firstrow
histogram Y, fcolor(blue) lcolor(black) kdensity ylabel(, angle(horizontal)) ymtick(, angle(horizontal))
xsize(4) ysize(4) by(, graphregion(fcolor(white))) by(DataSource, cols(1))
/*##################################END DATA SET 2#####################################*/
108

13. Interpretation Without Causation: A Data Analysis at the
Intersection of Statistics and Epidemiology Presenting Author: Emily Mitchell
Organization: NICHD, NIH
Contributing Authors: Emily M. Mitchell, Neil J. Perkins, Germaine M. Buck Louis, and Enrique F.
Schisterman
Code:
Not available.
109

14. Examining Associations Between Multi Pollutant Exposure Profiles
and Health Outcomes via Bayesian Profile Regression Presenting Author: John Molitor
Organization: Oregon State University
Contributing Authors: John Molitor, Eric Coker and Silvia Liverani
Code:
Computer Code Used:
Below we provide code/script to analyze simulated Dataset 1, with discretized covariates. Note that this
script is really just calling the open source R package PReMiuM, which clusters exposures, adjusts for
fixed effects, and uses these constructs to model the outcome via a likelihood model.
The PReMiuM package allows exposures to be categorical or continuous, allows for presence/absence of
fixed effects, and affords a variety of outcomes, both continuous and binary via choice of likelihood
models, e.g. logistic, Poisson, normal etc. For more information see Liverani et al. (2013).
Other datasets can be analyzed with small changes to code listed below:
-------------------------------
rm(list=ls())
require(PReMiuM)
num.cat <- 3
prefix <- "d1.discrete"
pick.col <- 1; pick.col.other <- 5
cov.names <- c("X1","X2","X3","X4","X5","X6","X7")
fixed.names <- c("Z")
##################
### data stuff ###
##################
##require(gdata); d1 <- read.xls("DataSet1.xls"); save(d1,file="d1.obj")
load("d1.obj")
var.select.type <- "Continuous"
y.model.type <- "Normal"
num.clus.init <- 50
nBurn <- 20000
nSweeps <- 100000
num.after.thin <- 1000
nFilter <- max(round(nSweeps / num.after.thin),1) ## see number of iterates chosen
hyp <- setHyperparams(shapeSigmaSqY=0.001,scaleSigmaSqY=0.001)
outcome.name <- "Y"
110

my.data <- d1
my.data[,cov.names] <- apply(my.data[,cov.names],2,cut,breaks=num.cat,labels=F) - 1
x.model.type <- "Discrete"
############
### Runs ###
############
## run - predict
values <- 0:(num.cat-1)
combinations <- expand.grid(values,values)
predict.file.john <- as.data.frame(matrix(NA,nrow(combinations),length(cov.names)))
names(predict.file.john) <- cov.names
predict.file.john[,cov.names[pick.col]] <- combinations[,1]
predict.file.john[,cov.names[pick.col.other]] <- combinations[,2]
do.predict <- T
source("run.model.R")
predictions <- pp.normal$cp$predictedYPerSweep
pdf(paste(output.dir,"/preds.",prefix,".pdf",sep=""))
par(mfrow=c(3,3))
for (i in 1:dim(predictions)[2]) {
plot(density(predictions[,i,1]),xlim=c(5,30),ylim=c(0,1),
main=paste(cov.names[pick.col],"=",combinations[i,1],", ",
cov.names[pick.col.other],"=",combinations[i,2],sep=""),
xlab=outcome.name)
}
dev.off()
save.image(paste("mega",prefix,".obj",sep=""))
### Program run.model.R ###
my.seed <- 1
output.dir <- paste("output.",prefix,sep="")
if(file.exists(output.dir))
unlink(output.dir,rec=T)
dir.create(output.dir)
output.place <- paste(output.dir,"/","output",sep="")
pp.normal <- list()
if(do.predict != T) {
pp.normal$runInfoObj <- profRegr(yModel=y.model.type,xModel=x.model.type,
111

nSweeps=nSweeps,nBurn=nBurn,nFilter=nFilter,
output=output.place,
varSelectType=var.select.type,
seed=my.seed,nClusInit=num.clus.init,nProgress=100,
hyper=hyp,
data=my.data,
covNames=cov.names,
fixedEffectsNames=fixed.names,
##predict=predict.file.john,
outcome=outcome.name)
} else {
pp.normal$runInfoObj <- profRegr(yModel=y.model.type,xModel=x.model.type,
nSweeps=nSweeps,nBurn=nBurn,nFilter=nFilter,
output=output.place,
varSelectType=var.select.type,
seed=my.seed,nClusInit=num.clus.init,nProgress=100,
hyper=hyp,
data=my.data,
covNames=cov.names,
fixedEffectsNames=fixed.names,
predict=predict.file.john,
outcome=outcome.name)
}
pp.normal$dissimObj <- calcDissimilarityMatrix(pp.normal$runInfoObj)
pp.normal$clusObj <- calcOptimalClustering(pp.normal$dissimObj)
pp.normal$riskProfileObj <- calcAvgRiskAndProfile(pp.normal$clusObj)
pp.normal$plot <- plotRiskProfile(pp.normal$riskProfileObj,paste(output.dir,"/clusters.",prefix,".png",sep=""))
if(var.select.type != "None") pp.normal$rho <- summariseVarSelectRho(pp.normal$runInfoObj)
if(do.predict == T)
pp.normal$cp <- calcPredictions(pp.normal$riskProfileObj,fullSweepPredictions=T,doRaoBlackwell=T)
save(pp.normal,file=paste(output.dir,"/pp",".",prefix,".obj",sep=""))
References
Liverani S, Hastie DI, Azizi L, Papathomas M, Richardson S. 2013. PReMiuM: An R Package for Profile
Regression Mixture Models using Dirichlet Processes. ArXiv13032836 Stat.
112

15. Analysis of Simulated Data Sets using Conformal PredictionsPresenting Author: Ulf Norinder
Organization: Swedish Toxicology Sciences Research Center (Swetox)
Contributing Authors: Ulf Norinder
Code:
Code for Using the Inductive Conformal Predictions
The code uses Scikit-learn, numpy and scipy.
#!/usr/bin/env python
import os,sys
from sklearn.ensemble import RandomForestRegressor
from sklearn.cross_decomposition import PLSRegression
import numpy as np
from numpy.core.numeric import asanyarray
import tab_io
import write_out
import scipy
from sklearn.utils import shuffle
from sklearn.preprocessing import StandardScaler
def main():
try:
sys.argv[1]
except IndexError:
print "You need to specify and input file"
sys.exit(1)
try:
sys.argv[2]
except IndexError:
print "You need to specify randomForest (r) or PLS regression
(p)"
sys.exit(1)
if sys.argv[2] == 'p':
try:
sys.argv[3]
except IndexError:
print "You need to specify number of pls components (0 for
scan)"
sys.exit(1)
113

#read in the training file
data0 = tab_io.read_data1(sys.argv[1])
#set the training features
if sys.argv[2] == 'r':
sys.argv[2] = 'rf'
if sys.argv[2] == 'p':
sys.argv[2] = 'pls'
aa =sys.argv[1]+"_"+sys.argv[2]+"_proc_pred100sum.csv"
aa2 =sys.argv[1]+"_"+sys.argv[2]+"_proc_pred100sum.coeff"
if os.path.isfile(aa):
os.remove(aa)
if os.path.isfile(aa2):
os.remove(aa2)
f = open(aa,'w')
f.write('Title\tPred\tGB_region_0.8\ttarget\tloop\n')
f.close()
if sys.argv[2] == 'pls':
f = open(aa2,'w')
f.write('variable_number\tPLS_coeff\tloop\n')
f.close()
if sys.argv[2] == 'pls':
f = open(aa2,'w')
f.write('variable_number\tPLS_coeff\tloop\n')
f.close()
data1 = data0
iwrite = 1
plsloop = 1
plsloop1 = 2
if sys.argv[2] == 'pls':
dd2 =sys.argv[1]+"_"+sys.argv[2]+"_proc_"+sys.argv[3]+".comp"
if os.path.isfile(dd2):
os.remove(dd2)
114
fimp2 = open(dd2,'w')
iwrite = 0
if sys.argv[3] == '0':
plsloop1 = 15
else:
iwrite = 1
plsloop = int(sys.argv[3])
plsloop1 = plsloop + 1
plscompmin = -1
sumerrtotmin = -99
if sys.argv[2] != 'pls':
dd
=sys.argv[1]+"_"+sys.argv[2]+"_proc_pred200sum_feat_imp.txt"
if os.path.isfile(dd):
os.remove(dd)
fimp = open(dd,'w')
fimp.write('Feature\tImportance\tloop\n')
if sys.argv[2] == 'pls':
train = [x[1:] for x in data1]
arr = asanyarray(train)
data = arr.astype(float)
train = [x[1:] for x in data]
numcols = len(train[0])
if plsloop1 > numcols:
plsloop1 = numcols
for xx00 in range(1, 3):
if xx00 > 1:
if sys.argv[2] != 'pls':
sys.exit(1)
iwrite = 1
plsloop = plscompmin
plsloop1 = plscompmin + 1
print "Using min pls components: %d" % (plsloop)
for xx0 in range(plsloop, plsloop1):
sumerrtot = []
for xx in range(1, 101):
data1 = shuffle(data1, random_state=0)
115

label = [x[0] for x in data1]
train = [x[1:] for x in data1]
arr = asanyarray(train)
data = arr.astype(float)
target = [x[0] for x in data]
train = [x[1:] for x in data]
numcols = len(train[0])
if sys.argv[2] == 'pls':
scalex = StandardScaler().fit(train)
train = scalex.transform(train)
scaley2 =
StandardScaler(with_mean=False).fit(target)
scaley = StandardScaler().fit(target)
target = scaley.transform(target)
trs = int(len(train))
part1 = int(0.8*len(train))
part2 = int(0.7*0.8*len(train))
print "dataset size %d" % (trs)
print "train size %d" % (part1)
print "proper trset %d" % (part2)
labeltr = label[:part1]
lltr = len(labeltr)
print "************* fitting the model %d" % (xx)
labeltest = label[part1:]
labeltr = label[:part1]
labelcal = label[part2:part1]
ll = len(labeltest)
num = [xx]*ll
lltr = len(labeltr)
numtr = [xx]*lltr
llcal = len(labelcal)
numcal = [xx]*llcal
# print train[:part1]
if sys.argv[2] == 'rf':
gb = RandomForestRegressor(n_estimators = 100)
116
if sys.argv[2] == 'pls':
gb =
PLSRegression(n_components=xx0,max_iter=1000,scale=False)
gb.fit(train[:part2], target[:part2])
predicted = gb.predict(train[part1:])
predicted = [x for x in predicted]
if sys.argv[2] == 'pls':
predicted = [x[0] for x in predicted]
coeff = gb.coefs
coeff = [x[0] for x in coeff]
arr = asanyarray(coeff)
coeff = arr.astype(float)
llcoeff = len(coeff)
numcoeff = [xx]*llcoeff
coeff0 = range(llcoeff)
if iwrite > 0:
write_out.writeOutListsApp(aa2, [coeff0,
coeff, numcoeff])
# print "pls coeffs"
# print (coeff)
if sys.argv[2] != 'pls':
importances = gb.feature_importances_
std = np.std([tree.feature_importances_ for tree
in gb.estimators_], axis=0)
# indices = np.argsort(importances)[::-1]
# Print the feature ranking
print("Feature ranking:")
lenimp = len(importances)
for f in range(0, lenimp):
# print("%d. feature %d (%f)" % (f + 1,
indices[f], importances[indices[f]]))
# print("%d. feature %d (%f)" % (f + 1, f,
importances[f]))
fimp.write("%d\t%f\t%d\n" % (f+1,
importances[f], xx))
bio = target[part1:]
bio = [x for x in bio]
biotr = target[:part1]
117

biotr = [x for x in biotr]
biocal = target[part2:part1]
biocal = [x for x in biocal]
# run model against calibration data
calibr = gb.predict(train[:part2])
if sys.argv[2] == 'pls':
calibr = [x[0] for x in calibr]
err = np.subtract(calibr,target[:part2])
err = np.absolute(err)
err2 = err
#err2 = np.log(err)
# print "tr err"
# print (err2)
# fit the calibration data
# print "fitting calibration %d" % (xx)
if sys.argv[2] == 'rf':
gb2 = RandomForestRegressor(n_estimators = 50)
if sys.argv[2] == 'pls':
gb2 =
PLSRegression(n_components=xx0,max_iter=1000,scale=False)
gb2.fit(train[:part2], err2)
predictederrtest = gb2.predict(train[part1:])
predictederrcal = gb2.predict(train[part2:part1])
predictedtrerr = gb2.predict(train[:part2])
predictedtrerr = [x for x in predictedtrerr]
if sys.argv[2] == 'pls':
predictederrtest = [x[0] for x in
predictederrtest]
predictederrcal = [x[0] for x in predictederrcal]
predictedtrerr = [x[0] for x in predictedtrerr]
# print "pred tr err"
# print (predictedtrerr)
alpha = []
118

predictedcal = gb.predict(train[part2:part1])
predictedcal = [x for x in predictedcal]
if sys.argv[2] == 'pls':
predictedcal = [x[0] for x in predictedcal]
err = np.subtract(predictedcal,target[part2:part1])
err = np.absolute(err)
sumerr = sum(err)/llcal
sumerrtot.append(sumerr)
sumerrtot2 = sum(sumerrtot)
# print "sum calibr err"
# print (sumerr)
# print (sumerrtot2)
# print "calibr err"
# print (err)
# print "calibr err pred"
# print (predictederrcal)
alpha1 = np.divide(err,predictederrcal)
alpha.append(alpha1)
parterr = int(len(alpha1))
# print "alpha1"
# print (alpha1)
alphasort = np.sort(alpha, axis=None)
parterr = int(0.8*len(alphasort))
factor = alphasort[parterr]
# print "alphasort"
# print (factor)
#predrange = np.exp(predictederrtest)
predrange = predictederrtest
if sys.argv[2] == 'pls':
predrange = np.absolute(predrange)
# print "test err pred"
# print (predrange)
predrange2 = factor*np.array(predrange)
119

predrange2 = [x for x in predrange2]
bio2 = bio
predicted2 = predicted
if sys.argv[2] == 'pls':
bio2 = scaley.inverse_transform(bio)
predicted2 = scaley.inverse_transform(predicted)
predrange2 =
scaley2.inverse_transform(predrange2)
if iwrite > 0:
write_out.writeOutListsApp(aa, [labeltest,
predicted2, predrange2, bio2, num])
print ('Finished')
print "sum calibr err"
print (sumerrtot2)
print (xx0)
if sys.argv[2] == 'pls':
fimp2.write("%d\t%f\n" % (xx0, sumerrtot2))
if xx0 == 1:
sumerrtotmin = sumerrtot2
plscompmin = xx0
else:
if sumerrtotmin > sumerrtot2:
sumerrtotmin = sumerrtot2
plscompmin = xx0
print ('min plsloop and total calibration error')
print (plscompmin)
print (sumerrtotmin)
if sys.argv[2] == 'pls':
fimp2.write("%d\t%f\n" % (plscompmin, sumerrtotmin))
if __name__=="__main__":
main()
120

16. Analysis of Chemical Mixture Simulated Data Using Regularized
Regression Models Presenting Author: Sung Kyun Park
Organization: University of Michigan
Contributing Authors: Sung Kyun Park,1,2 Yin-Hsiu Chen,3 Weiye Wang,1 John Meeker,2 Bhramar
Mukherjee3 1Department of Epidemiology, School of Public Health, University of Michigan, Ann Arbor, MI, USA
2Department of Environmental Health Sciences, School of Public Health, University of Michigan, Ann Arbor, MI, USA
3Department of Biostatistics, School of Public Health, University of Michigan, Ann Arbor, MI, USA
Code:
Data 1
########################
#Number of records:500
#Data per subject:Y, X1, X2, X3, X4, X5, X6, X7, Z
#Y = outcome data, 1 continuous variable
#X1 - X7= exposure data, 7 continuous variables
#Z: potential confounder, binary
########################
library(foreign)
library(Hmisc)
library(epicalc)
library(ggplot2)
library(xlsx)
library(car)
library('gcdnet')
library("microbenchmark")
library("matrixStats")
library(nlme)
library(mgcv)
setwd("C:\\Users\\ISHTAR\\Dropbox\\NIEHS\\data")
setwd("/Users/weiyewang/Dropbox/NIEHS/data")
#setwd("/Users/weiyewang/Downloads") # set working directory
getwd()
#setwd("C:/Users/yinhsiuc/Desktop/BIOSTAT-Yin-Hsiu Chen/Bhramar/Misc/")
dat <- read.csv("DataSet1.csv")
dat1 <- dat[, -1]
names(dat1)
names(dat)
######################################
# correlation
######################################
# exploratory
cor(dat1[, -9]) # pearson correlation
attach(dat)
121

cor1 <- cbind(X1,X2,X3,X4,X5,X6,X7,Z,Y)
rcorr(cor1, type="spearman")
rcorr(cor1, type="pearson")
#HIGHLY CORRELATED PAIRS in Spearmen
# X5 X6 0.672928392887115
# X2 Z 0.706335604190826
# X3 Z 0.745038211345673
# X1 Z 0.857001125812531
# X1 X2 0.857356548309326
# X1 X3 0.878108620643616
# X2 X3 0.8808473944664
#x1,x2,x3,z; x5,x6
#########################################################
require(mgcv)
# check single univariate relationship x~y; with z
#########################################################
par(mfrow = c(2, 4))
for(i in 1:7) {
dat_temp <- dat1[, c(1, i+1, 9)]
colnames(dat_temp)[2] = "x"
mod <- gam(Y ~ s(x) + Z, data = dat_temp)
# ord_temp <- order(dat1[, i+1])
plot(mod,xlab=names(dat1)[1+i])
# plot(dat1[, i+1], dat1[, 1], main = colnames(dat1)[i+1], ylab = "y", xlab =
"", pch = 20, lwd = 1)
# lines(dat1[ord_temp, i+1], mod$fitted.values[ord_temp], pch = 20, type = "l",
col = 2, lwd = 2)
}
# X7 is typically log-distributed
####################################################
# log-transformation and standardization
####################################################
# only log-transform X7
dat1[, 8] <- log(dat1[, 8])
mod <- gam(Y ~ s(X7) + Z, data = dat1)
plot(mod,xlab="logX7")
summ(dat1)
# data standardization (mean to 0)
dat1[, 2:8] <- (dat1[, 2:8] - rep(1, 500)%*%t(apply(dat1[, 2:8], 2, mean))) / (rep(1,
500)%*%t(apply(dat1[, 2:8], 2, sd)))
summ(dat1)
# data expansion: add interaction terms
dat2 <- data.frame(matrix(0, 500, 37))
colnames(dat2)[1:9] <- colnames(dat1)
dat2[, 1:9] <-dat1
122

k = 10
for(i in 1:7) {
for(j in (i+1):8) {
dat2[, k] <- dat1[, i+1]*dat1[, j+1]
colnames(dat2)[k] <- paste(colnames(dat1)[i+1], ".", colnames(dat1)[j+1], sep =
"")
k = k + 1
}
}
names(dat2)
# data expansion: add quadratic terms
names(dat)
X_sq <- dat[, 3:8]^2
colnames(X_sq)
colnames(X_sq) <- paste("x",1:6,"sq",sep="")
colnames(X_sq)
datsq <- cbind(dat2,X_sq)
####################################
# main effect
####################################
mod_main <- lm(Y ~ X1 + X2 + X3 + X4 + X5 + X6 + X7 + Z, data = dat1)
summary(mod_main) # R^2:0.9392
# if log-transform all exposures, the r^2=0.92 which is worse than only log(x7)
# leave-one-out cross validation: LOOCV
pred_main_oob <- rep(0, 500)
for(i in 1:500) {
dat_train <- dat1[-i, ]
dat_test <- dat1[i, ]
mod_main_temp <- lm(Y ~ X1 + X2 + X3 + X4 + X5 + X6 + X7 + Z, data = dat_train)
pred_main_oob[i] <- predict(mod_main_temp, dat_test)
}
cor(dat1[, 1], pred_main_oob)^2 # OOB R^2=0.9367
1 - (1- cor(dat1[, 1], pred_main_oob)^2)*499/(499- 8)
# OOB adjusted R^2=0.9357
###################################################
# main effects plus quardratic terms (x1~x6)
##################################################
mod_mainq <- lm(Y ~ X1 + X2 + X3 + X4 + X5 + X6 + log(X7) + Z +
I(X1*X1) + I(X2*X2) + I(X3*X3) + I(X4*X4) + I(X5*X5) + I(X6*X6) ,
data = dat)
summary(mod_mainq) # R^2:0.9463
# LOOCV
pred_mainq_oob <- rep(0, 500)
for(i in 1:500) {
dat_train <- dat[-i, ]
dat_test <- dat[i, ]
mod_mainq_temp <- lm(Y ~ X1 + X2 + X3 + X4 + X5 + X6 + log(X7) + Z +
123

I(X1*X1) + I(X2*X2) + I(X3*X3) + I(X4*X4) + I(X5*X5) +
I(X6*X6) + I(X7*X7), data = dat_train)
pred_mainq_oob[i] <- predict(mod_mainq_temp, dat_test)
}
cor(dat1[, 1], pred_mainq_oob)^2 # OOB R^2=0.94225
1 - (1- cor(dat1[, 1], pred_mainq_oob)^2)*499/(499- 14)
# OOB adjusted R^2=0.941
############################################
# main + interaction + quadratic (x1~x6)
#############################################
mod_mainiq <- lm(Y ~ .+ I(X1*X1) + I(X2*X2) + I(X3*X3) + I(X4*X4) + I(X5*X5) +
I(X6*X6) + .*., data = dat1)
summary(mod_mainiq) # R^2: 0.9529
# LOOCV
pred_mainiq_oob <- rep(0, 500)
for(i in 1:500) {
dat_train <- dat1[-i, ]
dat_test <- dat1[i, ]
mod_mainiq_temp <- lm(Y ~ . +
I(X1*X1) + I(X2*X2) + I(X3*X3) + I(X4*X4) + I(X5*X5) +
I(X6*X6) + I(X7*X7)+.*., data = dat_train)
pred_mainiq_oob[i] <- predict(mod_mainiq_temp, dat_test)
}
cor(dat1[, 1], pred_mainiq_oob)^2 # OOB R^2=0.9420
1 - (1- cor(dat1[, 1], pred_mainiq_oob)^2)*499/(499- 42) #adj OOB R^2: 0.9367
##################################################
# backward
##################################################
##with only interaction terms
names(dat1)
fit.ml=lm(Y~.+.*.,data=dat1) #for log-tranformed patx
summary(fit.ml)
fit.back=step(fit.ml,direction='backward')
summary(fit.back)
#Multiple R-squared: 0.9505, Adjusted R-squared: 0.9489
#lm(formula = Y ~ X1 + X2 + X3 + X4 + X5 + X6 + X7 + Z + X1:X2 +
#X1:X7 + X2:X5 + X3:X4 + X4:X5 + X5:X6 + X5:X7, data = dat1)
mod_bac <- lm(Y ~ X1 + X2 + X3 + X4 + X5 + X6 + X7 + Z +
X1*X2 + X1*X7 + X2*X5 + X3*X4 + X4*X5 + X5*X6 + X5*X7, data = dat1)
summary(mod_bac) # R2=0.9505, aR2=0.9489
mean((dat1[, 1] - predict(mod_bac))^2) # MSE=5.823961
#num.x=15
# LOOCV
pred_bac_oob <- rep(0, 500)
for(i in 1:500) {
dat_train <- dat1[-i, ]
dat_test <- dat1[i, ]
mod_bac_temp <- lm(Y ~ X1 + X2 + X3 + X4 + X5 + X6 + X7 + Z +
X1*X2 + X1*X7 + X2*X5 + X3*X4 + X4*X5 + X5*X6 + X5*X7, data =
dat_train)
pred_bac_oob[i] <- predict(mod_bac_temp, dat_test)
124

}
cor(dat1[, 1], pred_bac_oob)^2 # 0.947321
cor(dat1[, 1], pred_bac_oob)^2 - (1- cor(dat1[, 1], pred_bac_oob)^2)*15/(499- 15)
#0.9456884
mean((dat1[, 1] - pred_bac_oob)^2) # MSPE=6.192533
##with only quadratic terms
fitq.ml=lm(Y~.+I(X1*X1) + I(X2*X2) + I(X3*X3) + I(X4*X4) + I(X5*X5) + I(X6*X6) +
I(X7*X7),data=dat1)
summary(fitq.ml)
fitq.back=step(fitq.ml,direction = 'backward')
summary(fitq.back)
##with both interaction and quadratic terms (final version)
fitiq.ml=lm(Y~.+.*.+I(X1*X1) + I(X2*X2) + I(X3*X3) + I(X4*X4) + I(X5*X5) + I(X6*X6) +
I(X7*X7),data=dat1)
summary(fitiq.ml)
fitiq.back=step(fitiq.ml,direction = 'backward')
summary(fitiq.back)
#Multiple R-squared: 0.9517, Adjusted R-squared: 0.9501
mod_bac <- lm(Y ~ X1 + X2 + X3 + X4 + X5 + X6 + X7 + Z + I(X5*X5) +
X1*X2 + X1*X7 + X2*X5 + X3*X4 + X4*X5 + X5*X6 + X5*X7 , data = dat1)
summary(mod_bac) # R2=0.9517, aR2=0.9501
mean((dat1[, 1] - predict(mod_bac))^2) # MSE=5.678461
# LOOCV
pred_bac_oob <- rep(0, 500)
for(i in 1:500) {
dat_train <- dat1[-i, ]
dat_test <- dat1[i, ]
mod_bac_temp <- lm(Y ~ X1 + X2 + X3 + X4 + X5 + X6 + X7 + Z + I(X5*X5) +
X1*X2 + X1*X7 + X2*X5 + X3*X4 + X4*X5 + X5*X6 + X5*X7,
data = dat_train)
pred_bac_oob[i] <- predict(mod_bac_temp, dat_test)
}
cor(dat1[, 1], pred_bac_oob)^2 # 0.9483385
cor(dat1[, 1], pred_bac_oob)^2 - (1- cor(dat1[, 1], pred_bac_oob)^2)*16/(499- 16)
#0.9466271
mean((dat1[, 1] - pred_bac_oob)^2) # MSPE=6.072982
###############################################
# hiernet
###############################################
library(hierNet)
names(dat1)
#################################################
# code from Aaron 0618
####
n <- dim(dat)[1];n
X <- data.matrix(dat1[, 2:9]) #including Z
Y <- dat1[, 1];Y
###############################
125

# set up fold for CV
set.seed(500)
foldid_mat <- cbind(sample(n), rep(1:5, each = n / 5))
foldid_mat
foldid_mat <- foldid_mat[order(foldid_mat[, 1]), ]
mod_all_hiernet <- hierNet.path(X[, 1:8], Y, nlam = 1000)
mod_all_cv_hiernet <- hierNet.cv(mod_all_hiernet, X[, 1:8], Y, folds =
list(foldid_mat[, 2]))
#i,lam= 1 44.93
names(mod_all_cv_hiernet)
#[1] "lamlist" "cv.err" "cv.se" "lamhat" "lamhat.1se" "nonzero"
"folds" "call" ß
mod_hiernet <- hierNet.path(X[, 1:8], Y, lam = mod_all_cv_hiernet$lamhat)
mod_hiernet$bp #main effect with possitive beta value
#> mod_hiernet$bp
# [,1]
#1 2.960294
#2 1.075089
#3 0.145743
#4 0.000000
#5 0.000000
#6 0.000000
#7 3.349976
#8 5.432947
mod_hiernet$bn #main effect with negative beta value
# [,1]
#1 0.0000000
#2 0.0000000
#3 0.0000000
#4 0.4149483
#5 3.9694649
#6 0.1410102
#7 0.0000000
#8 0.0000000
which((abs(mod_hiernet$bp) + abs(mod_hiernet$bn))!=0)
(mod_hiernet$th[,,1] + t(mod_hiernet$th[,,1])) / 2
#> (mod_hiernet$th[,,1] + t(mod_hiernet$th[,,1])) / 2
# 1 2 3 4 5 6 7
8
#1 0.0000000 -0.28220344 0.0000000 0.000000000 0.0000000 0.00000000 0.44261349
0.000000000
#2 -0.2822034 -0.06943963 0.0000000 0.000000000 -0.1504882 0.00000000 0.05601534
0.000000000
#3 0.0000000 0.00000000 0.0000000 -0.205257384 0.0000000 0.00000000 0.00000000
0.000000000
#4 0.0000000 0.00000000 -0.2052574 -0.037953909 0.1930656 0.00000000 0.00000000 -
0.001305879
#5 0.0000000 -0.15048817 0.0000000 0.193065605 0.3213330 0.17004357 -0.29379791 -
0.164978922
#6 0.0000000 0.00000000 0.0000000 0.000000000 0.1700436 0.02888338 0.00000000 -
0.013365648
#7 0.4426135 0.05601534 0.0000000 0.000000000 -0.2937979 0.00000000 0.00000000
0.000000000
126
#8 0.0000000 0.00000000 0.0000000 -0.001305879 -0.1649789 -0.01336565 0.00000000
0.000000000
names(mod_hiernet)
Y_pred_hiernet <- predict(mod_hiernet, X[, 1:8])
###with quadratic terms
cor(Y_pred_hiernet, Y)^2 # R^2=0.9508538
mean((Y - Y_pred_hiernet)^2) # mse=5.806482
1 - (1- cor(Y_pred_hiernet, Y)^2)*499/(499- 23) #adj R^2=0.948
pred_hier_oob <- rep(0, 500)
for(i in 1:500) {
dat_train <- dat1[-i,2:9]
dat_test <- dat1[i,2:9]
mod_hier_temp <- hierNet.path(dat_train[, 1:8], dat1[-i,1], lam =
mod_all_cv_hiernet$lamhat) #CV with selected lambda
pred_hier_oob[i] <- predict(mod_hier_temp, dat_test[,1:8])
}
cor(dat1[, 1], pred_hier_oob)^2 # OOB R^2=0.946
1 - (1- cor(dat1[, 1], pred_hier_oob)^2)*499/(499- 23) #0.9432
mean((dat1[, 1] - pred_hier_oob)^2) # MSPE=6.3942
################################# PART 2 #################################
## fold ID
set.seed(0)
n <- dim(dat)[1];n
foldid_mat <- cbind(sample(n), rep(1:5, each = n / 5))
foldid_mat <- foldid_mat[order(foldid_mat[, 1]), ]
X <- data.matrix(datsq[, 2:43])
Y <- dat1[,1]
############################################################
# LASSO & Enet
############################################################
library('gcdnet')#for lasso, adpative lasso, elastic net, adaptive elastic net
###########
# if with quadratic
####
#LASSO
par(mfrow = c(1, 1))
cv_lasso <- cv.gcdnet(X, Y, lambda2 = 0, method="ls", foldid = foldid_mat[, 2])
plot(cv_lasso)
lambda_opt_lasso <- cv_lasso$lambda.min;lambda_opt_lasso
#0.03386603
fit_lasso <- gcdnet(X, Y, lambda = lambda_opt_lasso, lambda2 = 0, method = "ls")
127

beta_lasso <- coef(fit_lasso)
sum(beta_lasso!=0) # 24
Y_pred_lasso <- cbind(1, X)%*%as.vector(beta_lasso)
cor(Y_pred_lasso, Y)^2 # 0.9514
mean((Y - Y_pred_lasso)^2) # 5.714
row.names(beta_lasso)[which(beta_lasso!=0)]
row.names(beta_lasso)[order(abs(beta_lasso),decreasing = TRUE)][1:sum(beta_lasso!=0)]
beta_lasso
cor(Y_pred_lasso, Y)^2 # R^2=0.9513
1 - (1- cor(Y_pred_lasso, Y)^2)*499/(499- 22) #adj R^2=0.949
mean((Y - Y_pred_lasso)^2) # MSE = 5.714
pred_lasso_oob <- rep(0, 500)
for(i in 1:500) {
dat_train <- datsq[-i,2:43]
dat_test <- datsq[i,2:43]
fit_lasso <- gcdnet(dat_train[, 1:42], datsq[-i,1], lambda = lambda_opt_lasso,
lambda2 = 0, method = "ls")
beta_lasso <- coef(fit_lasso)
sum(beta_lasso!=0) # 21
pred_lasso_oob[i] <- cbind(1, data.matrix(dat_test[,1:42]))%*%as.vector(beta_lasso)
}
cor(dat2[, 1], pred_lasso_oob)^2 # OOB R^2=0.9468
1 - (1- cor(dat1[, 1], pred_lasso_oob)^2)*499/(499- 22) #0.9443
mean((dat1[, 1] - pred_lasso_oob)^2) # MSPE=6.255
#########
# enet_quadratic
lambda2_list <- seq(0.001, 0.1, 0.001)
min_cv_enet <- numeric(length(lambda2_list))
for(i in 1:length(lambda2_list)) {
cv_enet <- cv.gcdnet(X, Y, lambda2 = lambda2_list[i], foldid = foldid_mat[, 2],
method = "ls")
min_cv_enet[i] <- min(cv_enet$cvm)
print(i)
}
plot(lambda2_list, min_cv_enet, xlab = "lambda2",ylab = "minimum CV error", type =
'l')
cv_enet <- cv.gcdnet(X, Y, foldid = foldid_mat[, 2], lambda2 =
lambda2_list[which.min(min_cv_enet)],method = "ls")
plot(cv_enet) #CV error given lambda and the optimal lambda2
lambda_opt_enet <- cv_enet$lambda.min
fit_enet <- gcdnet(X, Y, lambda=lambda_opt_enet, lambda2 =
lambda2_list[which.min(min_cv_enet)], method="ls")
beta_enet <- coef(fit_enet)
beta_enet
sum(beta_enet!=0) # 24
128

Y_pred_enet <- cbind(1, X)%*%as.vector(beta_enet)
cor(Y_pred_enet, Y)^2 # 0.9512
mean((Y - Y_pred_enet)^2) # 5.745
row.names(beta_enet)[which(beta_enet!=0)]
# SAME variables selected AS LASSO
cor(Y_pred_enet, Y)^2 # R^2=0.9513
1 - (1- cor(Y_pred_enet, Y)^2)*499/(499- 22) #adj R^2=0.949
mean((Y - Y_pred_enet)^2) # MSE = 5.825
names(dat2)
pred_enet_oob <- rep(0, 500)
for(i in 1:500) {
dat_train <- datsq[-i,2:43]
dat_test <- datsq[i,2:43]
fit_enet <- gcdnet(dat_train[, 1:42], datsq[-i,1], lambda=lambda_opt_enet, lambda2 =
lambda2_list[which.min(min_cv_enet)], method = "ls")
beta_enet <- coef(fit_enet)
sum(beta_enet!=0) # 21
pred_enet_oob[i] <- cbind(1, data.matrix(dat_test[,1:42]))%*%as.vector(beta_enet)
}
cor(dat2[, 1], pred_enet_oob)^2 # OOB R^2=0.9467
1 - (1- cor(dat1[, 1], pred_enet_oob)^2)*499/(499- 22) #0.9443
mean((dat1[, 1] - pred_enet_oob)^2) # MSPE=6.265
################################
# adaptive LASSO(quadratic)
colnames(X)
# calculate for weight as penalty factor
v_star <- log(sum(beta_enet!=0)) / log(n)
gamma <- ceiling(2*v_star/(1 - v_star)) + 1;gamma #4
X_sd <- apply(X, 2, sd)
weights_ad <- (abs(beta_enet[-1]*X_sd) + 1/n)^(-gamma)
X
X_non0 <- X[, which(beta_enet[-1]!=0)]
X_non0
weights_ad_non0 <- weights_ad[which(beta_enet[-1] != 0)]
cv_adlasso <- cv.gcdnet(X_non0, Y, lambda = seq(0.000001, 0.001, length.out = 1000),
foldid = foldid_mat[, 2],
lambda2 = 0, pf = weights_ad_non0, method="ls")
plot(cv_adlasso,ylab='MSPE (5-folds CV)')
lambda_opt_adlasso <- cv_adlasso$lambda.min;lambda_opt_adlasso
fit_adlasso <- gcdnet(X_non0, Y, lambda = lambda_opt_adlasso, lambda2 = 0, pf =
weights_ad_non0, method="ls")
beta_adlasso <- coef(fit_adlasso)
sum(beta_adlasso!=0) # 18
Y_pred_adlasso <- cbind(1, X[, which(beta_enet[-1] != 0)])%*%as.vector(beta_adlasso)
cor(Y_pred_adlasso, Y)^2 # 0.952
mean((Y - Y_pred_adlasso)^2) # 5.670
129

row.names(beta_adlasso)[which(beta_adlasso!=0)]
#[1] "(Intercept)" "X1" "X2" "X3" "X4" "X5"
"X6"
#[8] "X7" "Z" "X1.X2" "X1.X7" "X2.X5" "X3.X4"
"X4.X5"
#[15] "X5.X6" "X5.X7" "X5.Z" "x5sq"
cor(Y_pred_adlasso, Y)^2 # R^2=0.952
1 - (1- cor(Y_pred_adlasso, Y)^2)*499/(499- 17) #adj R^2=0.95
mean((Y - Y_pred_adlasso)^2) # MSE = 5.670
pred_adlasso_oob <- rep(0, 500)
for(i in 1:500) {
dat_train <- X_non0[-i,]
dat_test <- X_non0[i,]
fit_adlasso <- gcdnet(dat_train, dat2[-i,1], lambda = lambda_opt_adlasso, lambda2 =
0, pf = weights_ad_non0,method = "ls")
beta_adlasso <- coef(fit_adlasso)
sum(beta_adlasso!=0)
pred_adlasso_oob[i] <- 1*beta_adlasso[1]+(dat_test%*%as.vector(beta_adlasso[-1]))
}
cor(dat2[, 1], pred_adlasso_oob)^2 # OOB R^2=0.9482
1 - (1- cor(dat1[, 1], pred_adlasso_oob)^2)*499/(499- 17) #0.9465
mean((dat1[, 1] - pred_adlasso_oob)^2) # MSPE=6.084
beta_adlasso
######################calculate error and p-values for adaptive LASSO...
sigma2_adlasso <- crossprod(Y - Y_pred_adlasso) / (n - sum(beta_adlasso!=0) - 1)
X_adlasso <- X_non0[, which(beta_adlasso[-1] != 0)]
X_std_adlasso <- X_adlasso / (rep(1, n)%*%t(apply(X_adlasso, 2, sd)))
var_std_non0_adlasso <- solve(crossprod(X_std_adlasso))*c(sigma2_adlasso)
var_non0_adlasso <- diag(1 / apply(X_adlasso, 2, sd))%*%var_std_non0_adlasso%*%diag(1
/ apply(X_adlasso, 2, sd))
var_int_adlasso <- apply(X_adlasso, 2, mean)%*%var_non0_adlasso%*%apply(X_adlasso, 2,
mean)
adlasso_tab <- matrix(0, sum(beta_adlasso!=0), 3)
rownames(adlasso_tab) <- rownames(beta_adlasso)[which(beta_adlasso!=0)]
colnames(adlasso_tab) <- c("beta", "sd", "p-value")
adlasso_tab[, 1] <- beta_adlasso[which(beta_adlasso!=0), ]
adlasso_tab[, 2] <- c(sqrt(var_int_adlasso), sqrt(diag(var_non0_adlasso)))
adlasso_tab[, 3] <- sapply(abs(adlasso_tab[, 1]) / adlasso_tab[, 2], function(x) 2*(1
- pnorm(x)))
adlasso_tab
summary(lm(Y ~ X_adlasso))$coef
###########
#adaptive enet (quardratic)
130
lambda2_list_adenet <- seq(0.01, 1, by = 0.01)
min_cv_adenet <- numeric(length(lambda2_list_adenet))
for(i in 1:length(lambda2_list_adenet)) {
cv_adenet <- cv.gcdnet(X_non0, Y, foldid = foldid_mat[, 2],
lambda2 = lambda2_list_adenet[i], pf = weights_ad_non0,
method="ls")
min_cv_adenet[i] <- min(cv_adenet$cvm)
print(i)
}
plot(lambda2_list_adenet, min_cv_adenet, xlab = "lambda2",ylab = "minimum CV error",
type = 'l')
cv_adenet <- cv.gcdnet(X_non0, Y, foldid = foldid_mat[, 2], lambda=seq(0.000001,
0.001, length.out = 1000),
lambda2 = lambda2_list_adenet[which.min(min_cv_adenet)],method
= "ls", pf = weights_ad_non0)
plot(cv_adenet) #CV error given lambda and the optimal lambda2
lambda_opt_adenet <- cv_adenet$lambda.min;lambda_opt_adenet
fit_adenet <- gcdnet(X_non0, Y, lambda = lambda_opt_adenet, lambda2 =
lambda2_list_adenet[which.min(min_cv_adenet)],
method="ls", pf = weights_ad_non0)
beta_adenet <- coef(fit_adenet)
sum(beta_adenet!=0) # 18
Y_pred_adenet <- cbind(1, X[, which(beta_enet[-1] != 0)])%*%as.vector(beta_adenet)
cor(Y_pred_adenet, Y)^2 # 0.9511
mean((Y - Y_pred_adenet)^2) # 5.749
row.names(beta_adenet)[which(beta_adenet!=0)]
#[1] ""(Intercept)" "X1" "X2" "X3" "X4" "X5"
"X6"
#[8] "X7" "Z" "X1.X2" "X1.X7" "X2.X5" "X3.X4"
"X4.X5"
#[15] "X5.X6" "X5.X7" "X5.Z" "x5sq"
##same variable selected as adj LASSO
beta_adenet
cor(Y_pred_adenet, Y)^2 # R^2=0.9511
1 - (1- cor(Y_pred_adenet, Y)^2)*499/(499- 17) #adj R^2=0.950
mean((Y - Y_pred_adenet)^2) # MSE = 5.711
pred_adenet_oob <- rep(0, 500)
for(i in 1:500) {
dat_train <- X_non0[-i,]
dat_test <- X_non0[i,]
fit_adenet <- gcdnet(dat_train, dat2[-i,1], lambda = lambda_opt_adenet, lambda2 =
lambda2_list_adenet[which.min(min_cv_adenet)], pf = weights_ad_non0,method = "ls")
beta_adenet <- coef(fit_adenet)
sum(beta_adenet!=0)
pred_adenet_oob[i] <- 1*beta_adenet[1]+(dat_test%*%as.vector(beta_adenet[-1]))
}
cor(dat2[, 1], pred_adenet_oob)^2 # OOB R^2=0.9481
1 - (1- cor(dat1[, 1], pred_adenet_oob)^2)*499/(499- 17) #0.9464
131

mean((dat1[, 1] - pred_adenet_oob)^2) # MSPE=6.101
Data 2
########################
# data#2
#Number of records:500
#Data per subject:"y" "x1" "x2" "x3" "x4" "x5" "x6" "x7"
"x8" "x9" "x10" "x11" "x12" "x13" "x14" "z1" "z2" "z3"
#y = outcome data, 1 continuous variable
#x1 - x14= exposure data, 14 variables
#z1-z3: potential confounder
########################
library(foreign)
library(Hmisc)
library(epicalc)
library(ggplot2)
library(xlsx)
library(car)
library('gcdnet')
library("microbenchmark")
library("matrixStats")
library(nlme)
library(mgcv)
setwd("C:\\Users\\ISHTAR\\Dropbox\\NIEHS\\data")
setwd("/Users/weiyewang/Dropbox/NIEHS/data")
getwd()
dat <- read.csv("DataSet2.csv")
names(dat)
#[1] "Obs" "y" "x1" "x2" "x3" "x4" "x5" "x6" "x7" "x8" "x9" "x10" "x11"
"x12" "x13" "x14" "z1" "z2" "z3"
dat1 <- dat[, -1]
# univariate analysis (before manipulation)
uni_mean <- apply(dat1, 2, mean)
uni_sd <- apply(dat1, 2, sd)
cbind(uni_mean, uni_sd) # summary for continuous variables
table(dat1$z3) # summary for binary variable
write.csv(cor(dat1[, -c(1, 18)]), "dat2_cortab.csv") # correlation among x's
cor(dat1[, -c(1, 18)], dat1[, 1]) # correlation between x's and y
# plotting Y~x1-x14
require(mgcv)
pdf('dat2YvsXorZmarginalplot.pdf')
par(mfrow = c(4, 4))
for(i in 1:16) {
dat_temp <- dat1[, c(1, i+1)]
colnames(dat_temp)[2] = "x"
132

mod <- gam(y ~ s(x), data = dat_temp)
df_temp <- round(summary(mod)$edf, 2)
ord_temp <- order(dat1[, i+1])
plot(dat1[, i+1], dat1[, 1], main = colnames(dat1)[i+1], ylab = "y", xlab = "",
pch = 20, lwd = 1)
lines(dat1[ord_temp, i+1], mod$fitted.values[ord_temp], pch = 20, type = "l",
col = 2, lwd = 2)
}
dev.off()
# plotting Y~x1-x14/z1,z2,z3
names(dat1)
require(mgcv)
pdf('dat2YvsXorZmarginalplot_z1z2z3.pdf')
par(mfrow = c(4, 4))
for(i in 1:15) {
dat_temp <- dat1[, c(1, i+1, 16:18)]
colnames(dat_temp)[2] = "x"
mod <- gam(y ~ s(x) + z1+z2+z3, data = dat_temp)
plot(mod,xlab=names(dat1)[1+i])
}
dev.off()
# data standardization
names(dat1)
X_cont <- dat1[, -c(1, 18)]
names(X_cont) #continuous variable
X_cont_scaled <- (X_cont - rep(1, 500)%*%t(apply(X_cont, 2, mean))) / (rep(1,
500)%*%t(apply(X_cont, 2, sd)))
dat2 <- cbind(y = dat1[, 1], X_cont_scaled[, c(1:3, 6:12, 14:16)], z3 = dat1[, 18])
## higher-order exploration
names(dat2)
diag(cor(dat2[, -c(1, 15)], dat2[, -c(1, 15)]^2)) # cor(x_cont,x_cont^2
nvar_cont <- 13
cor_second <- matrix(0, nvar_cont, nvar_cont) # cor(y, x_cont_i*x_cont_j)
for(i in 1:nvar_cont) {
for(j in 1:nvar_cont) {
cor_second[i, j] <- cor(dat2[, 1], dat2[, i+1]*dat2[, j+1])
}
}
cor_second
r2_partial <- matrix(0, nvar_cont, nvar_cont) # partial R^2
for(i in 1:nvar_cont) {
for(j in 1:nvar_cont) {
if(i == j) {
dat_temp <- data.frame(y = dat2[, 1], x = dat2[, i+1], xx = dat2[,
i+1]^2)
mod_full <- lm(y ~ x + xx, data = dat_temp)
mod_reduced <- lm(y ~ x, data = dat_temp)
133

r2_partial[i, j] <- (summary(mod_full)$r.squared -
summary(mod_reduced)$r.squared) / (1 - summary(mod_reduced)$r.squared)
}
if(i != j) {
dat_temp <- data.frame(y = dat2[, 1], z1 = dat2[, i+1], z2 =
dat2[, j+1])
mod_full <- lm(y ~ z1*z2, data = dat_temp)
mod_reduced <- lm(y ~ z1 + z2, data = dat_temp)
r2_partial[i, j] <- (summary(mod_full)$r.squared -
summary(mod_reduced)$r.squared) / (1 - summary(mod_reduced)$r.squared)
}
}
}
r2_partial
r2_partial_z3 <- rep(0, nvar_cont)
for(i in 1:nvar_cont) {
dat_temp <- data.frame(y = dat2[, 1], z3 = dat2[, 15], z = dat2[, i+1])
mod_full <- lm(y ~ z*z3, data = dat_temp)
mod_reduced <- lm(y ~ z + z3, data = dat_temp)
r2_partial_z3[i] <- (summary(mod_full)$r.squared -
summary(mod_reduced)$r.squared) / (1 - summary(mod_reduced)$r.squared)
}
r2_partial_z3
r2_partial_three <- matrix(0, nvar_cont, nvar_cont) # partial R^2
for(i in 1:nvar_cont) {
for(j in 1:nvar_cont) {
if(i == j) {
dat_temp <- data.frame(y = dat2[, 1], x = dat2[, i+1], xx = dat2[,
i+1]^2, z3 = dat2[, 15])
mod_full <- lm(y ~ z3*x + z3*xx, data = dat_temp)
mod_reduced <- lm(y ~ x + xx + z3*x, data = dat_temp)
r2_partial_three[i, j] <- (summary(mod_full)$r.squared -
summary(mod_reduced)$r.squared) / (1 - summary(mod_reduced)$r.squared)
}
if(i != j) {
dat_temp <- data.frame(y = dat2[, 1], x1 = dat2[, i+1], x2 =
dat2[, j+1], z3 = dat2[, 15])
mod_full <- lm(y ~ x1*x2*z3, data = dat_temp)
mod_reduced <- lm(y ~ x1*x2 + z3*x1 + z3*x2, data = dat_temp)
r2_partial_three[i, j] <- (summary(mod_full)$r.squared -
summary(mod_reduced)$r.squared) / (1 - summary(mod_reduced)$r.squared)
}
}
}
r2_partial_three
# data expansion
dat.d1 <- dat2[, -1];names(dat.d1)
#[1] "x1" "x2" "x3" "x6" "x7" "x8" "x9" "x10" "x11" "x12" "x14" "z1" "z2"
"z3"
134

dat.d2 <- data.frame(matrix(0, 500, 91))
k = 1
for(i in 1:12) {
for(j in (i+1):13) {
dat.d2[, k] <- dat.d1[, i]*dat.d1[, j]
colnames(dat.d2)[k] <- paste(colnames(dat.d1)[i], colnames(dat.d1)[j],
sep = ".")
k = k + 1
}
}
dat.d2[, 79:91] <- dat.d1[, -14]^2
colnames(dat.d2)[79:91] <- paste(colnames(dat.d1)[-14], "_2", sep = "")
z3d1 <- matrix(dat.d1[, 14], 500, 13)*dat.d1[, -14]
colnames(z3d1) <- paste(colnames(dat.d1)[-14], "z3", sep = ".")
z3d2 <- matrix(dat.d1[, 14], 500, 91)*dat.d2
colnames(z3d2) <- paste(colnames(dat.d2), "z3", sep = ".")
dat.all <- cbind(dat.d1, dat.d2, z3d1, z3d2)
names(dat.all)
#209 terms for selection totally:
#14 main terms
#13*12/2 = 78 interaction terms
#13 quardratic terms
#3rd-order terms: (91+13)=104 terms
##############################################
# main effect
##############################################
names(dat1)
Y <- dat1$y
names(dat.d1)
dat0 <-cbind(Y, dat.d1)
names(dat0)
mod_main <- lm(Y ~ ., data = dat0)
summary(mod_main)
# Multiple R-squared: 0.5117, Adjusted R-squared: 0.4976
# LOOCV
pred_main_oob <- rep(0, 500)
for(i in 1:500) {
dat_train <- dat0[-i, ]
dat_test <- dat0[i, ]
mod_main_temp <- lm(Y ~ ., data = dat_train)
pred_main_oob[i] <- predict(mod_main_temp, dat_test)
}
cor(dat0[, 1], pred_main_oob)^2 # OOB R^2=0.481
1 - (1- cor(dat0[, 1], pred_main_oob)^2)*499/(499- 14)
#OOB adj R2=0.466
#######################################################################
135

# Model selection
#######################################################################
######################################################
# backward
#######################################################
############################
# with 3rd terms
############################
names(dat1)
dat00 <-cbind(Y, dat.all)
names(dat00)
fit.ml=lm(Y~.,data=dat00)
summary(fit.ml)
fit.back=step(fit.ml,direction='backward')
summary(fit.back)
# R2=0.7133, aR2=0.6519
mean((dat00[, 1] - predict(fit.back))^2) # MSE=0.122
pred_bac_oob <- rep(0, 500)
for(i in 1:500) {
dat_train <- dat00[-i, ]
dat_test <- dat00[i, ]
mod_bac_temp <- lm(Y ~ x2 + x3 + x6 + x10 + x12 + z1 + z2 + z3 + x1.x6 +
x1.x8 + x1.x9 + x1.x11 + x1.x12 + x1.z1 + x1.z2 + x2.x3 +
x2.x8 + x2.x12 + x2.x14 + x2.z2 + x3.x9 + x3.x12 + x6.x7 +
x6.x10 + x6.x14 + x6.z1 + x7.x8 + x7.x11 + x8.x10 + x8.z1 +
x9.x12 + x9.z2 + x10.x14 + x10.z1 + x10.z2 + x11.z1 + x12.z1 +
x12.z2 + x14.z1 + x14.z2 + x2_2 + x3_2 + x8_2 + x9_2 + x12_2 +
x14_2 + z2_2 + x1.z3 + x2.z3 + x3.z3 + x6.z3 + x7.z3 + x12.z3 +
z1.z3 + z2.z3 + x1.x2.z3 + x1.x6.z3 + x1.x8.z3 + x1.x12.z3 +
x1.x14.z3 + x2.x6.z3 + x2.x8.z3 + x2.x9.z3 + x2.x12.z3 +
x2.x14.z3 + x3.x12.z3 + x3.x14.z3 + x6.x7.z3 + x6.z1.z3 +
x7.x8.z3 + x7.x14.z3 + x7.z1.z3 + x8.x10.z3 + x8.z1.z3 +
x8.z2.z3 + x9.z2.z3 + x10.z2.z3 + x11.x14.z3 + x11.z1.z3 +
x11.z2.z3 + x12.z2.z3 + x14.z1.z3 + x14.z2.z3 + x1_2.z3 +
x6_2.z3 + x7_2.z3 + x9_2.z3 + z2_2.z3, data = dat_train)
pred_bac_oob[i] <- predict(mod_bac_temp, dat_test)
}
cor(dat1[, 1], pred_bac_oob)^2 # OOB R^2=0.585
1 - (1- cor(dat1[, 1], pred_bac_oob)^2)*499/(499- 88) #adj OOB R^2 = 0.496
mean((dat1[, 1] - pred_bac_oob)^2) # MSPE=0.180
######################################################################################
#
# hiernet
######################################################################################
#
require(hierNet)
pred_temp <- rep(0, 500)
136

mod_all <- hierNet.path(dat2[, -1], dat2[, 1], minlam = 0.1, maxlam = 100, nlam =
1000)
mod_all_cv <- hierNet.cv(mod_all, dat2[, -1], dat2[, 1])
lambda.grid <- 1:50
r2_hiernet_all <- rep(0, length(lambda.grid))
for(l in 1:length(lambda.grid)) {
mod_hiernet_temp <- hierNet.path(dat2[, -1], dat2[, 1], minlam =
lambda.grid[l], maxlam = lambda.grid[l], nlam = 1)
coef_hiernet <- mod_hiernet_temp$th[,,1] + t(mod_hiernet_temp$th[,,1])
ind_int_vec <- rep(0, 105)
dat4 <- data.frame(matrix(0, 500, 105))
k = 1
for(i in 1:13) {
for(j in i:14) {
dat4[, k] <- dat2[, i+1]*dat2[, j+1]
ind_int_vec[k] <- (coef_hiernet[i, j]!=0)
k = k + 1
}
}
ind_vec <- which(mod_hiernet_temp$bp!=0 | mod_hiernet_temp$bn!=0)
dat_temp <- cbind(dat2[, c(1, ind_vec + 1)], dat4[, which(ind_int_vec==1)])
colnames(dat_temp)[1] <- "y"
for(i in 1:500) {
dat_train <- dat_temp[-i, ]
dat_test <- dat_temp[i, ]
mod_temp <- lm(y ~ ., dat_train)
pred_temp[i] <- predict(mod_temp, dat_test)
}
r2_hiernet_all[l] <- cor(pred_temp, dat2[, 1])^2
print(c(l, r2_hiernet_all[l]))
}
which.max(r2_hiernet_all) #14
mod_hiernet <- hierNet.path(dat2[, -1], dat2[, 1], minlam = 13, maxlam = 13, nlam = 1)
mod_hiernet$bp #main term with possitive beta
mod_hiernet$bn #main term with negative beta
mod_hiernet$th[,,1] + t(mod_hiernet$th[,,1])
Y_pred_hiernet <- predict(mod_hiernet, X[, 1:14])
###with quadratic terms
cor(Y_pred_hiernet, Y)^2 # R^2=0.5636
mean((Y - Y_pred_hiernet)^2) # mse=0.188
1 - (1- cor(Y_pred_hiernet, Y)^2)*499/(499- 24) #adj R^2=0.5416
pred_hier_oob <- rep(0, 500)
for(i in 1:500) {
dat_train <- dat2[-i,2:15]
dat_test <- dat2[i,2:15]
mod_hier_temp <- hierNet.path(dat_train[, 1:14], dat2[-i,1], minlam = 13, maxlam
=13, nlam = 1)
pred_hier_oob[i] <- predict(mod_hier_temp, dat_test[,1:14])
}
137

cor(dat1[, 1], pred_hier_oob)^2 # OOB R^2=0.5143
1 - (1- cor(dat1[, 1], pred_hier_oob)^2)*499/(499- 24) #0.4897
mean((dat1[, 1] - pred_hier_oob)^2) # MSPE=0.2076
################################# PART 2 #################################
y<-dat1[,1]
dat00 <-cbind(y, dat.all);names(dat00) #with 3rd-terms
dat01 <-cbind(y, dat.all[,1:118]);names(dat01) #without 3rd terms
############################################################
# LASSO & Enet
############################################################
library('gcdnet')#for lasso, adpative lasso, elastic net, adaptive elastic net
## fold ID
set.seed(0)
n <- dim(dat)[1];n
foldid_mat <- cbind(sample(n), rep(1:5, each = n / 5))
foldid_mat <- foldid_mat[order(foldid_mat[, 1]), ]
#############################################
# with 3rd terms!!
#############################################
names(dat.all)
names(dat1)
X <- data.matrix(dat.all[, 1:209])
Y <- dat1[,1]
## LASSO
par(mfrow = c(1, 1))
cv_lasso <- cv.gcdnet(X, Y, lambda2 = 0, method="ls", foldid = foldid_mat[, 2])
plot(cv_lasso)
lambda_opt_lasso <- cv_lasso$lambda.min;lambda_opt_lasso
#0.020
fit_lasso <- gcdnet(X, Y, lambda = lambda_opt_lasso, lambda2 = 0, method = "ls")
beta_lasso <- coef(fit_lasso)
sum(beta_lasso!=0) # 37
Y_pred_lasso <- cbind(1, X)%*%as.vector(beta_lasso)
cor(Y_pred_lasso, Y)^2 # 0.571
mean((Y - Y_pred_lasso)^2) # 0.183
row.names(beta_lasso)[which(beta_lasso!=0)]
# [1] "(Intercept)" "x1" "x2" "x3" "x6" "x7"
"x8"
#[8] "x9" "x10" "x11" "x12" "x14" "z2"
"z3"
#[15] "x1.z1" "x2.x8" "x2.x12" "x7.x12" "x8.z1" "x10.z1"
"x10.z2"
#[22] "x2_2" "x2.z3" "x7.z3" "x12.z3" "x1.x6.z3" "x1.x7.z3"
"x1.x9.z3"
138

#[29] "x2.x14.z3" "x3.x14.z3" "x3.z2.z3" "x7.x14.z3" "x7.z1.z3" "x8.x9.z3"
"x1_2.z3"
#[36] "x3_2.z3" "x6_2.z3"
row.names(beta_lasso)[order(abs(beta_lasso),decreasing = TRUE)][1:sum(beta_lasso!=0)]
beta_lasso
Y_pred_lasso <- cbind(1, X)%*%as.vector(beta_lasso)
cor(Y_pred_lasso, Y)^2 # R^2=0.571
1 - (1- cor(Y_pred_lasso, Y)^2)*499/(499- 36) #adj R^2=0.538
mean((Y - Y_pred_lasso)^2) # MSE = 0.185
names(dat2)
names(dat.all)
# LOOCV
pred_lasso_oob <- rep(0, 500)
for(i in 1:500) {
dat_train <- dat.all[-i,]
dat_test <- dat.all[i,]
fit_lasso <- gcdnet(dat_train, dat2[-i,1], lambda = lambda_opt_lasso, lambda2 = 0,
method = "ls")
beta_lasso <- coef(fit_lasso)
sum(beta_lasso!=0) # 21
pred_lasso_oob[i] <- cbind(1, data.matrix(dat_test))%*%as.vector(beta_lasso)
}
cor(dat2[, 1], pred_lasso_oob)^2 # OOB R^2=0.499
1 - (1- cor(dat1[, 1], pred_lasso_oob)^2)*499/(499- 36) #0.460
mean((dat1[, 1] - pred_lasso_oob)^2) # MSPE=0.2133
##############################################
## elastic-net
# with 3rd terms!!
################################################
names(dat.all)
X <- data.matrix(dat.all[, 1:209])
Y <- dat1[,1]
lambda2_list <- seq(0.00001, 0.001, 0.00001)
min_cv_enet <- numeric(length(lambda2_list))
for(i in 1:length(lambda2_list)) {
cv_enet <- cv.gcdnet(X, Y, lambda2 = lambda2_list[i], foldid = foldid_mat[, 2],
method = "ls")
min_cv_enet[i] <- min(cv_enet$cvm)
print(i)
}
plot(lambda2_list, min_cv_enet, xlab = "lambda2",ylab = "minimum CV error", type =
'l')
cv_enet <- cv.gcdnet(X, Y, foldid = foldid_mat[, 2], lambda2 =
lambda2_list[which.min(min_cv_enet)],method = "ls")
plot(cv_enet) #CV error given lambda and the optimal lambda2
lambda_opt_enet <- cv_enet$lambda.min;lambda_opt_enet
139

#lambda2 >>0, same result as LASSO
#lambda=0.02049421
fit_enet <- gcdnet(X, Y, lambda=lambda_opt_enet, lambda2 =
lambda2_list[which.min(min_cv_enet)], method="ls")
beta_enet <- coef(fit_enet)
beta_enet
sum(beta_enet!=0) # 37
row.names(beta_enet)[which(beta_enet!=0)]
# same variables selected as LASSO
Y_pred_enet <- cbind(1, X)%*%as.vector(beta_enet)
cor(Y_pred_enet, Y)^2 # R^2=0.571
1 - (1- cor(Y_pred_enet, Y)^2)*499/(499- 36) #adj R^2=0.538
mean((Y - Y_pred_enet)^2) # MSE = 0.185
names(dat2)
pred_enet_oob <- rep(0, 500)
for(i in 1:500) {
dat_train <- dat.all[-i,]
dat_test <- dat.all[i,]
fit_enet <- gcdnet(dat_train, dat2[-i,1], lambda=lambda_opt_enet, lambda2 =
lambda2_list[which.min(min_cv_enet)], method = "ls")
beta_enet <- coef(fit_enet)
sum(beta_enet!=0) # 21
pred_enet_oob[i] <- cbind(1, data.matrix(dat_test))%*%as.vector(beta_enet)
}
cor(dat2[, 1], pred_enet_oob)^2 # OOB R^2=0.499
1 - (1- cor(dat1[, 1], pred_enet_oob)^2)*499/(499-36) #0.4604
mean((dat1[, 1] - pred_enet_oob)^2) # MSPE=0.213
#################################
## adaptive LASSO with 3rd-terms
#################################
names(dat00)
n=500
colnames(X)
# calculate weight
v_star <- log(sum(beta_enet!=0)) / log(n)
gamma <- ceiling(2*v_star/(1 - v_star)) + 1;gamma #4
X_sd <- apply(X, 2, sd)
weights_ad <- (abs(beta_enet[-1]*X_sd) + 1/n)^(-gamma)
X
X_non0 <- X[, which(beta_enet[-1]!=0)]
X_non0
weights_ad_non0 <- weights_ad[which(beta_enet[-1] != 0)]
#only add weights to those beta_enet ne 0
140

cv_adlasso <- cv.gcdnet(X_non0, Y, lambda = seq(0.0000000001, 0.00000001, length.out =
1000), foldid = foldid_mat[, 2],
lambda2 = 0, pf = weights_ad_non0, method="ls")
plot(cv_adlasso)
lambda_opt_adlasso <- cv_adlasso$lambda.min;lambda_opt_adlasso #close to 0
fit_adlasso <- gcdnet(X_non0, Y, lambda = lambda_opt_adlasso, lambda2 = 0, pf =
weights_ad_non0, method="ls")
beta_adlasso <- coef(fit_adlasso)
sum(beta_adlasso!=0) # 22
Y_pred_adlasso <- cbind(1, X[, which(beta_enet[-1] != 0)])%*%as.vector(beta_adlasso)
cor(Y_pred_adlasso, Y)^2 # 0.582
mean((Y - Y_pred_adlasso)^2) # 0.178
row.names(beta_adlasso)[which(beta_adlasso!=0)]
#[1] "(Intercept)" "x1" "x3" "x6" "x8" "x10"
#[7] "x11" "x12" "x14" "z2" "z3" "x2.x8"
#[13] "x10.z1" "x10.z2" "x2_2" "x2.z3" "x7.z3" "x12.z3"
#[19] "x1.x7.z3" "x3.z2.z3" "x7.z1.z3" "x6_2.z3"
Y_pred_adlasso <- cbind(1, X[, which(beta_enet[-1] != 0)])%*%as.vector(beta_adlasso)
cor(Y_pred_adlasso, Y)^2 # 0.582
1 - (1- cor(Y_pred_adlasso, Y)^2)*499/(499- 21) #adj R^2=0.564
mean((Y - Y_pred_adlasso)^2) # MSE = 0.178
pred_adlasso_oob <- rep(0, 500)
for(i in 1:500) {
dat_train <- X_non0[-i,]
dat_test <- X_non0[i,]
fit_adlasso <- gcdnet(dat_train, dat2[-i,1], lambda = lambda_opt_adlasso, lambda2 =
0, pf = weights_ad_non0,method = "ls")
beta_adlasso <- coef(fit_adlasso)
sum(beta_adlasso!=0)
pred_adlasso_oob[i] <- 1*beta_adlasso[1]+(dat_test%*%as.vector(beta_adlasso[-1]))
}
cor(dat2[, 1], pred_adlasso_oob)^2 # OOB R^2=0.545
1 - (1- cor(dat1[, 1], pred_adlasso_oob)^2)*499/(499- 21) #0.525
mean((dat1[, 1] - pred_adlasso_oob)^2) # MSPE=0.194
beta_adlasso
#########################
#adaptive enet
#########################
lambda2_list_adenet <- seq(0.001, 1, by = 0.001)
#if wanna save time, using following:
lambda2_list_adenet <- seq(0.01, 1, by = 0.01)
min_cv_adenet <- numeric(length(lambda2_list_adenet))
for(i in 1:length(lambda2_list_adenet)) {
cv_adenet <- cv.gcdnet(X_non0, Y, foldid = foldid_mat[, 2], lambda =
seq(0.0000000000001, 0.000000001, length.out = 1000),
141

lambda2 = lambda2_list_adenet[i], pf = weights_ad_non0,
method="ls")
min_cv_adenet[i] <- min(cv_adenet$cvm)
print(i)
}
plot(lambda2_list_adenet, min_cv_adenet,xlab = "lambda2",ylab = "MSPE (5-fold CV)",
type = 'l' )
cv_adenet <- cv.gcdnet(X_non0, Y, foldid = foldid_mat[, 2], lambda =
seq(0.0000000000001, 0.000000001, length.out = 2000),
lambda2 = lambda2_list_adenet[which.min(min_cv_adenet)],method
= "ls", pf = weights_ad_non0)
plot(cv_adenet,ylab='MSPE (5-fold CV)') #CV error given lambda and the optimal lambda2
lambda_opt_adenet <- cv_adenet$lambda.min;lambda_opt_adenet #close to 0
lambda2_list_adenet[which.min(min_cv_adenet)] #0.079
fit_adenet <- gcdnet(X_non0, Y, lambda = lambda_opt_adenet, lambda2 =
lambda2_list_adenet[which.min(min_cv_adenet)],
method="ls", pf = weights_ad_non0)
beta_adenet <- coef(fit_adenet)
sum(beta_adenet!=0) # 29
# not the same result as adaptive LASSO!!!!
Y_pred_adenet <- cbind(1, X[, which(beta_enet[-1] != 0)])%*%as.vector(beta_adenet)
cor(Y_pred_adenet, Y)^2 # 0.592
mean((Y - Y_pred_adenet)^2) # 0.174
row.names(beta_adenet)[which(beta_adenet!=0)]
#[1] "(Intercept)" "x1" "x2" "x3" "x6" "x8"
#[7] "x9" "x10" "x11" "x12" "x14" "z2"
#[13] "z3" "x1.z1" "x2.x8" "x10.z1" "x10.z2" "x2_2"
#[19] "x2.z3" "x7.z3" "x12.z3" "x1.x7.z3" "x1.x9.z3"
"x2.x14.z3"
#[25] "x3.x14.z3" "x3.z2.z3" "x7.z1.z3" "x1_2.z3" "x6_2.z3"
beta_adenet
cor(Y_pred_adenet, Y)^2 # R^2=0.592
1 - (1- cor(Y_pred_adenet, Y)^2)*499/(499- 28) #adj R^2=0.568
mean((Y - Y_pred_adenet)^2) # MSE = 0.174
pred_adenet_oob <- rep(0, 500)
for(i in 1:500) {
dat_train <- X_non0[-i,]
dat_test <- X_non0[i,]
fit_adenet <- gcdnet(dat_train, dat2[-i,1], lambda = lambda_opt_adenet, lambda2 =
lambda2_list_adenet[which.min(min_cv_adenet)], pf = weights_ad_non0,method = "ls")
beta_adenet <- coef(fit_adenet)
sum(beta_adenet!=0)
pred_adenet_oob[i] <- 1*beta_adenet[1]+(dat_test%*%as.vector(beta_adenet[-1]))
}
cor(dat2[, 1], pred_adenet_oob)^2 # OOB R^2=0.550
1 - (1- cor(dat1[, 1], pred_adenet_oob)^2)*499/(499- 28) #0.523
142

mean((dat1[, 1] - pred_adenet_oob)^2) # MSPE=0.191
######################calculate error and p-values....
sigma2_adenet <- crossprod(Y - Y_pred_adenet) / (n - sum(beta_adenet!=0) - 1)
X_adenet <- X_non0[, which(beta_adenet[-1] != 0)]
X_std_adenet <- X_adenet / (rep(1, n)%*%t(apply(X_adenet, 2, sd)))
var_std_non0_adenet <- solve(crossprod(X_std_adenet))*c(sigma2_adenet)
var_non0_adenet <- diag(1 / apply(X_adenet, 2, sd))%*%var_std_non0_adenet%*%diag(1 /
apply(X_adenet, 2, sd))
var_int_adenet <- apply(X_adenet, 2, mean)%*%var_non0_adenet%*%apply(X_adenet, 2,
mean)
adenet_tab <- matrix(0, sum(beta_adenet!=0), 3)
rownames(adenet_tab) <- rownames(beta_adenet)[which(beta_adenet!=0)]
colnames(adenet_tab) <- c("beta", "sd", "p-value")
adenet_tab[, 1] <- beta_adenet[which(beta_adenet!=0), ]
adenet_tab[, 2] <- c(sqrt(var_int_adenet), sqrt(diag(var_non0_adenet)))
adenet_tab[, 3] <- sapply(abs(adenet_tab[, 1]) / adenet_tab[, 2], function(x) 2*(1 -
pnorm(x)))
adenet_tab
#compared with lm model's coefficients and sd and p-values
summary(lm(Y ~ X_adenet))$coef
143

17. Building Models to Assess the Effects of Chemical Mixtures by
Estimating Similar Modes of Action Presenting Author: Harrison Quick
Organization: CDC
Contributing Authors: Harrison Quick, Julia M. Gohlke, and Tran Huynh
Code:
##################
#Code by Harrison Quick
#Created for NIEHS Workshop
#This code will generate the exploratory results for the Mental Development Index data
rm(list=ls())
install.packages('sas7bdat')
library('sas7bdat')
##############
#Read in data
tab=read.sas7bdat("data_05182015.sas7bdat")
#names(tab)
y=(tab$mdi)
x=as.matrix(log(tab[,7:28])) #log-transform covariates
p=dim(x)[2]
#based on the literature, we consider mom’s age to be
#an important confounding variable, so we will condition our models on this
z=(tab$mom_age)
#other 0/1 variables are treated separately
z0=as.matrix(tab[,c(1,2,4,5)])
par(mfrow=c(1,3))
scor=.65 #<- we will group covariates based on being highly correlated with each other
image(x=1:p,y=1:p,cor(x)>scor)
image(x=1:p,y=1:p,cor(x[z==0,])>scor)
image(x=1:p,y=1:p,cor(x[z==1,])>scor) #use z==1 to define groups
grps=list()
grps[[1]]=1:4
grps[[2]]=c(5,6,12) #all ~independent
grps[[3]]=7:8
144

grps[[4]]=9:11
grps[[5]]=13:p
#############################################
#Z=0 Models
#############################################
####################
#Group 1
####################
mod0=lm(y~x[,grps[[1]]],subset=(z==0)) #include all group 1 covariates in model
summary(mod0)
mod1=lm(y~x[,1]+x[,2]+x[,3],subset=(z==0))
#start cutting covariates until we achieve a parsimonious model
mod1=lm(y~x[,1]+x[,2],subset=(z==0))
#while not shown here, also consider interaction terms
summary(mod1)
####################
#Group 2
####################
mod0=lm(y~x[,grps[[2]]],subset=(z==0))
summary(mod0)
mod2=lm(y~x[,5]+x[,6]+x[,12],subset=(z==0))
mod2=lm(y~x[,6]+x[,12],subset=(z==0))
mod2=lm(y~x[,12],subset=(z==0))
summary(mod2)
####################
#Group 3
####################
mod0=lm(y~x[,grps[[3]]],subset=(z==0))
summary(mod0)
mod3=lm(y~x[,7]+x[,8],subset=(z==0))
mod3=lm(y~x[,8],subset=(z==0))
summary(mod3)
145

####################
#Group 4
####################
mod0=lm(y~x[,grps[[4]]],subset=(z==0))
summary(mod0)
mod4=lm(y~x[,9]+x[,10]+x[,11],subset=(z==0))
mod4=lm(y~x[,9]:x[,10],subset=(z==0))
summary(mod4)
####################
#Group 5
####################
mod0=lm(y~x[,grps[[5]]],subset=(z==0))
summary(mod0)
mod5=lm(y~x[,13]+x[,14]+x[,15]+x[,16]+x[,17]+x[,18]+x[,19]+
x[,20]+x[,21]+x[,22],subset=(z==0))
#intermediate steps removed
mod5=lm(y~x[,15]+x[,18]+x[,19],subset=(z==0))
summary(mod5)
####################
#Group 6 (0/1 variables)
####################
mod0=lm(y~z0,subset=(z==0))
summary(mod0)
mod6=lm(y~z0[,1]+z0[,2]+z0[,3]+z0[,4],subset=(z==0))
mod6=lm(y~z0[,1]+z0[,2]+z0[,3],subset=(z==0))
summary(mod6)
####################
#Everything
####################
mod0=lm(y~x[,1]+x[,2] +
x[,12]+
x[,8]+
146

x[,9]:x[,10]+
x[,15]+x[,18]+x[,19]+
z0[,1]+z0[,2]+z0[,3],subset=(z==0))
#achieve parsimonious model using covariates
mod0=lm(y~x[,12]+
x[,8]+
x[,10]+
x[,15]+x[,18]+x[,19]+
z0[,1]+z0[,2],subset=(z==0))
summary(mod0)
#and now consider interactions between covariates, x, and 0/1 variables, z0
mod0=lm(y~x[,12]+
#x[,8]+
x[,18]+
z0[,1]+z0[,2]+z0[,1]:z0[,2]+
#x[,12]:z0[,1]+
x[,10]:z0[,1]+x[,10]:z0[,2]+x[,10]:z0[,1]:z0[,2]+
x[,15]:z0[,1]+x[,15]:z0[,2]+x[,15]:z0[,1]:z0[,2]+
x[,19]:z0[,2],
subset=(z==0))
summary(mod0)
#############################################
#Z=1 Models
#############################################
####################
#Group 1
####################
mod0=lm(y~x[,grps[[1]]],subset=(z==1))
summary(mod0)
mod1=lm(y~x[,1]+x[,2]+x[,4],subset=(z==1))
mod1=lm(y~x[,1],subset=(z==1))
summary(mod1)
####################
#Group 2
####################
mod0=lm(y~x[,grps[[2]]],subset=(z==1))
147

summary(mod0)
mod2=lm(y~x[,5]+x[,6]+x[,12],subset=(z==1))
mod2=lm(y~x[,6]+x[,12],subset=(z==1))
mod2=lm(y~1,subset=(z==1))
summary(mod2) #seriously
####################
#Group 3
####################
mod0=lm(y~x[,grps[[3]]],subset=(z==1))
summary(mod0)
mod3=lm(y~x[,7]+x[,8],subset=(z==1))
mod3=lm(y~x[,8],subset=(z==1))
summary(mod3)
####################
#Group 4
####################
mod0=lm(y~x[,grps[[4]]],subset=(z==1))
summary(mod0)
mod4=lm(y~x[,9]+x[,10]+x[,11],subset=(z==1))
mod4=lm(y~x[,9],subset=(z==1))
summary(mod4) #nothing
####################
#Group 5
####################
mod0=lm(y~x[,grps[[5]]],subset=(z==1))
summary(mod0)
mod5=lm(y~x[,13]+x[,14]+x[,15]+x[,16]+x[,17]+x[,18]+x[,19]+
x[,20]+x[,21]+x[,22],subset=(z==1))
mod5=lm(y~x[,15],subset=(z==1))
summary(mod5)
####################
148

#Group 6 (0/1 variables)
####################
mod0=lm(y~z0,subset=(z==1))
summary(mod0)
mod6=lm(y~z0[,1]+z0[,2]+z0[,3]+z0[,4],subset=(z==1))
mod6=lm(y~z0[,1]+z0[,2]+z0[,3],subset=(z==1))
summary(mod6)
####################
#Everything
####################
mod0=lm(y~x[,1]+x[,8]+x[,15]+
z0[,1]+z0[,2]+z0[,3],subset=(z==1))
mod0=lm(y~x[,1]+
z0[,1]+z0[,2]+z0[,3],subset=(z==1))
summary(mod0)
mod0=lm(y~x[,1]+
z0[,1]+z0[,2]+z0[,3], #+
#x[,1]:z0[,3]+ x[,1]:z0[,1]+x[,1]:z0[,2]+
#x[,1]:z0[,1]:z0[,2], #+x[,1]:z0[,2]:z0[,3],
subset=(z==1))
summary(mod0)
#########################################
#Exploratory results
#########################################
#Final model for moms under 29
mod0=lm(y~x[,12]+
#x[,8]+
x[,18]+
z0[,1]+z0[,2]+z0[,1]:z0[,2]+
#x[,12]:z0[,1]+
x[,10]:z0[,1]+x[,10]:z0[,2]+x[,10]:z0[,1]:z0[,2]+
x[,15]:z0[,1]+x[,15]:z0[,2]+x[,15]:z0[,1]:z0[,2]+
x[,19]:z0[,2],
subset=(z==0))
149

summary(mod0)
#Final model for moms over 29
mod1=lm(y~x[,1]+
z0[,1]+z0[,2]+z0[,3], #+
#x[,1]:z0[,3]+ x[,1]:z0[,1]+x[,1]:z0[,2]+
#x[,1]:z0[,1]:z0[,2], #+x[,1]:z0[,2]:z0[,3],
subset=(z==1))
summary(mod1)
par(mfrow=c(2,2))
hist(resid(mod0),breaks=20)
plot(resid(mod0))
hist(resid(mod1),breaks=20)
plot(resid(mod2))
150

18. Application of Principal Component Analysis and Stepwise
Regression to Identify the Exposure Variables Associated with Health
Outcome and Determine Dose-Response Relationship Presenting Author: Sheikh Rahman
Organization: Department of Civil and Environmental Engineering, Northeastern University, 400 Snell
Engineering Center, 360 Huntington Ave, Boston, MA 02115, USA
Contributing Authors: Sheikh M. Rahman1, and April Z. Gu1 1 Department of Civil and Environmental Engineering, Northeastern University, 400 Snell Engineering Center, 360 Huntington
Ave, Boston, MA 02115, USA
Code:
####################################################################################
######
# Find and Plot the correlation between variables
# real_world_dataFrame is the input dataframe contains all the variables along with the dependent
variable
####################################################################################
######
library(corrplot)
parameter_correlation <- cor(real_world_dataFrame) # find correlation among the variables
# find the significance of the correlation
cor.mtest <- function(mat, conf.level = 0.95) {
mat <- as.matrix(mat)
n <- ncol(mat)
p.mat <- lowCI.mat <- uppCI.mat <- matrix(NA, n, n)
diag(p.mat) <- 0
diag(lowCI.mat) <- diag(uppCI.mat) <- 1
for (i in 1:(n - 1)) {
for (j in (i + 1):n) {
tmp <- cor.test(mat[, i], mat[, j], conf.level = conf.level)
p.mat[i, j] <- p.mat[j, i] <- tmp$p.value
lowCI.mat[i, j] <- lowCI.mat[j, i] <- tmp$conf.int[1]
uppCI.mat[i, j] <- uppCI.mat[j, i] <- tmp$conf.int[2]
}
}
return(list(p.mat, lowCI.mat, uppCI.mat))
}
res1 <- cor.mtest(real_world_dataFrame, 0.95) # define significance level at 95%
# save the plot of the correlation with significance level as a image file in "tiff" format
tiff(file = "correlation_realWorld_with_Sig.tiff", width = 4, height = 4, units = 'in', res = 300, compression =
'lzw')
corrplot(parameter_correlation,type = 'lower', method = 'circle',
p.mat = res1[[1]],sig.level = 0.05,pch.cex = 1, diag = FALSE)
151

dev.off()
##############################################
## Stepwise Regression
##############################################
null <- lm(mdi~1, data = real_world_dataFrame)
full <- lm(mdi~., data = real_world_dataFrame)
ForwardReg <- step(null, scope=list(lower=null, upper=full), direction="forward")
####################################################################################
######
# PCA analysis
# real_world_dataFrame is the input dataframe contains all the variables along with the dependent
variable
####################################################################################
######
x <- real_world_dataFrame[,-1] # producing a variable without dependent variable
pca_x <- prcomp(x, scale = TRUE, center = TRUE) # conduct the pca analysis
pca_x$var<-(pca_x$sdev)^2
pca_x$percentVar <- (pca_x$var)/sum(pca_x$var)*100
pca_x$cumPerVar <- cumsum(pca_x$percentVar)
# Plot PCA variances and save as "tiff" file
library(ggplot2)
y <- pca_x
nVar <- length(y$var)
varPlotData <- data.frame(X = 1:nVar, Y = y$percentVar)
tiff(file = 'percent_variance_RW.tiff', width = 3.3, height = 2.6, units = 'in', res = 300, compression = 'lzw')
ggplot(varPlotData, aes(x = X, y = Y)) + geom_point() + geom_line() +
geom_hline(yintercept = 0, colour = "gray65", linetype = 'dashed') +
geom_vline(xintercept = 0, colour = "gray65", linetype = 'dashed') + theme_bw() +
labs (x = "No. of Principal Component", y = "Percent Variance" )
dev.off()
################################################
# Draw PCA loading and correlation circle
################################################
# Circle with radius 1
theta <- seq(0,2*pi,length.out = 100)
circle_2 <- data.frame(x = cos(theta), y = sin(theta))
p <- ggplot(circle_2,aes(x,y)) + geom_path()
# create data frame with correlations between variables and PCs
correlations = as.data.frame(cor(x, RW_pca$x))
152

# data frame with arrows coordinates
arrows = data.frame(x1 = rep(0,nVar), y1 = rep(0,nVar), x2 = correlations$PC1, y2 = correlations$PC2)
# save the circle of PCA loading as "tiff" file
tiff(file = 'circle_of_correlation_RW.tiff', width = 6, height = 6, units = 'in', res = 300, compression = 'lzw')
ggplot() + geom_path(data = circle_2, aes(x = x, y = y), colour = "gray65") +
geom_segment(data = arrows, aes(x = x1, y = y1, xend = x2, yend = y2), colour = "blue", width = 2) +
geom_text(data = correlations, aes(x = PC1, y = PC2, label = rownames(correlations))) +
geom_hline(yintercept = 0, colour = "gray65", linetype = 'dashed') +
geom_vline(xintercept = 0, colour = "gray65", linetype = 'dashed') +
xlim(-1.1, 1.1) + ylim(-1.1, 1.1) + theme_bw()+
labs(x = paste(c("Principal Component 1 (",round(y$percentVar[1],2),"%)"),collapse = ''),
y = paste(c("Principal Component 1 (",round(y$percentVar[2],2),"%)"),collapse = '')) +
ggtitle("Circle of correlations")
dev.off()
153

19. Identifying the Relative Importance of Multiple Correlated
Exposures in Predicting a Continuous Outcome Using the Random
Forest Ensemble Learning Method Presenting Author: Anne Starling
Organization: Department of Epidemiology, Colorado School of Public Health, Aurora, CO
Contributing Authors: Anne P Starling, Katerina Kechris, Dana Dabelea, John L Adgate
Code:
Example code demonstrating use of the R package randomForestSRC (documentation available at:
http://cran.r-project.org/web/packages/randomForestSRC/randomForestSRC.pdf)
library(randomForestSRC)
newfit.rf<-rfsrc(mdi~lip_PBDE_47+lip_PBDE_99+lip_PBDE_100+lip_PBDE_153+lip_hcb+lip_nonachlor+
lip_oxychlor+lip_pcb74+lip_pcb99+lip_pcb105+lip_pcb118+lip_pcb146+lip_pcb153+
lip_pcb156+lip_pcb170+lip_pcb180+lip_pcb187+lip_pcb194+lip_pcb199+
lip_pcb138_158+lip_pcb196_203+lip_pp_dde+child_sex+mom_educ+mom_age+
mom_race+mom_smoke,
data=realdata, ntree=1000, bootstrap="by.root", mtry=9,
nodesize=5, importance="permute", forest=TRUE)
print(newfit.rf)
print(vimp(newfit.rf)$importance)
plot.variable(newfit, partial=TRUE, show.plots=TRUE)
154

20. Improving Prediction Models by Adding Interaction Terms Using a
Feasible Solution Algorithm Presenting Author: Arnold Stromberg
Organization: Arnold Stromberg, University of Kentucky, Department of Statistics
Contributing Authors: Li Xu, Joshua Lambert, Bernhard Hannig, Arnold Stromberg
Code:
"Using Chrome, Firefox, but not Internet Explorer: http://shiny.as.uky.edu:3838/mcfsa/
A webpage maintained by the Stromberg Lab in the Department of Statistics at the University of
Kentucky which utilizes the novel feasible solution algorithm Dr. Stromberg discusses in his poster. This
webpage is a shiny application that provides a user friendly front end to the algorithm and lets users
upload their own data to find a set of feasible solutions that maybe of interest to researchers.
This application utilizes multicore processing and allows users to search their own data for statistically
significant interactions quickly. "
155

21. Factor Mixture Models for Assessing Health Effects of
Environmental Chemical Mixtures: An Application Using Simulated
Data Sets Presenting Author: Heidi Sucharew
Organization: Division of Biostatics and Epidemiology, Cincinnati Children’s Hospital Medical Center,
Cincinnati, OH
Contributing Authors: Heidi Sucharew, Patrick Ryan, Shelley Ehrlich, Erin Haynes, and Monir Hossain
Code:
Factor Mixture Model Code, Mplus
Dataset 1:
Title: Model set 1;
DATA: FILE C:\s1.dat;
type=individual;
VARIABLE: NAMES ARE obs Y X1 X2 X3 X4 X5 X6 X7 Z;
USEVARIABLES ARE y X1 X2 X3 X4 X5 X6 X7 z;
classes = c(3);
Idvariable is obs;
ANALYSIS: TYPE = Mixture;
STARTS= 100 20;
stiterations=10;
model:
%overall%
F1 BY x3 x2 x1 x4 x7;
F2 BY x6 x5 x4 x7;
F1 with F2;
F1 on z;
c#1 on z;
c#2 on z;
%c#3%
[F1@0 F2@0];
[x1 x2 x3 x4 x7];
[x5 x6 x4 x7];
F1 on z;
%c#1%
[F1*-.5 F2*.5];
[x1 x2 x3 x4 x7];
[x5 x6 x4 x7];
F1 on z;
156
%c#2%
[F1*1 F2*-1];
[x1 x2 x3 x4 x7];
[x5 x6 x4 x7];
F1 on z;
output: tech1 tech3 tech11 standardized;
SAVEDATA:
FILE IS C:\fmmc3.txt;
SAVE IS CPROB FSCORES;
Dataset 2:
Title: Model set 2;
DATA: FILE C:\s2.dat;
type=individual;
VARIABLE: NAMES ARE Obs y x1 x2 x3 x4 x5 x6
x7 x8 x9 x10 x11 x12 x13 x14 z1 z2 z3;
USEVARIABLES ARE y x1 x2 x3 x4 x5 x6
x7 x8 x9 x10 x11 x12 x13 x14 z2 z3;
classes = c(2);
Idvariable is obs;
ANALYSIS: TYPE = Mixture;
STARTS= 100 20;
stiterations=10;
model:
%overall%
F1 BY x4 x3 x5 x14 x8 x6 x2 x11 x7;
F2 BY x10 x11 x9 x7 x8 x6 x14 x2;
F3 By x13 x12 x9 x7 x2 x1 x14;
F1 with F2 F3;
F2 with F3;
F1 on z2;
F2 on z2;
F3 on z2;
c#1 on z2 z3;
%c#2%
[F1@0 F2@0 F3@0];
[x4 x3 x5 x14 x8 x6 x2 x11 x7];
[x10 x11 x9 x7 x8 x6 x14 x2];
[x13 x12 x9 x7 x2 x1 x14];
F1 on z2;
F2 on z2;
F3 on z2;
157

%c#1%
[F1*-.5 F2*.5 F3*.5];
[x4 x3 x5 x14 x8 x6 x2 x11 x7];
[x10 x11 x9 x7 x8 x6 x14 x2];
[x13 x12 x9 x7 x2 x1 x14];
F1 on z2 ;
F2 on z2;
output: tech1 tech3 tech11 standardized;
SAVEDATA:
FILE IS C:\s2fmmc2.txt;
SAVE IS CPROB FSCORES;
158
22. Dimension Reduction for Chemical Exposure Risk AssessmentPresenting Author: Jeffrey Switchenko
Organization: Emory University
Contributing Authors: Jeffrey M. Switchenko, Lance A. Waller, P. Barry Ryan
Code:
data1 <- read.csv("ReadWorld1.csv",header=T)
hist(data1$mdi)
data1A <- subset(data1,data1$child_sex == 0)
data1B <- subset(data1,data1$child_sex == 1)
data2A <- subset(data1,data1$mom_educ == 0)
data2B <- subset(data1,data1$mom_educ == 1)
data3A <- subset(data1,data1$mom_age == 0)
data3B <- subset(data1,data1$mom_age == 1)
data4A <- subset(data1,data1$mom_race == 0)
data4B <- subset(data1,data1$mom_race == 1)
data5A <- subset(data1,data1$mom_smoke == 0)
data5B <- subset(data1,data1$mom_smoke == 1)
### X-axis labels: Use when x-variable is not numeric
type1 <- c("Female","Male","GT 12 yrs","LE 12 yrs","LT 29 yrs","GE 29 yrs","White","Non-white","Non-
smoker","Smoker")
###Setting numeric location of x-axis labels on future plots
x = 1:10
pdf(file="Covariates_by_MDI.pdf",height=6, width=12)
###Create boxplot
boxplot(data1A$mdi,horizontal=FALSE, main='',
xlab="",ylab="Mental Development Index",xaxt='n',cex.main=1.5,cex.lab=1.5,
cex.axis=1.2,at=1,xlim=c(0.5,10.5),ylim=c(45,120))
boxplot(data1B$mdi,horizontal=FALSE, main='',
ylab="",xlab="",xaxt='n',cex.main=1.5,cex.lab=1.2,yaxt='n',
159

cex.axis=1.2,at=2,add=TRUE)
boxplot(data2A$mdi,horizontal=FALSE, main='',
ylab="",xlab="",xaxt='n',cex.main=1.5,cex.lab=1.2,yaxt='n',
cex.axis=1.2,at=3,add=TRUE)
boxplot(data2B$mdi,horizontal=FALSE, main='',
ylab="",xlab="",xaxt='n',cex.main=1.5,cex.lab=1.2,yaxt='n',
cex.axis=1.2,at=4,add=TRUE)
boxplot(data3A$mdi,horizontal=FALSE, main='',
ylab="",xlab="",xaxt='n',cex.main=1.5,cex.lab=1.2,yaxt='n',
cex.axis=1.2,at=5,add=TRUE)
boxplot(data3B$mdi,horizontal=FALSE, main='',
ylab="",xlab="",xaxt='n',cex.main=1.5,cex.lab=1.2,yaxt='n',
cex.axis=1.2,at=6,add=TRUE)
boxplot(data4A$mdi,horizontal=FALSE, main='',
ylab="",xlab="",xaxt='n',cex.main=1.5,cex.lab=1.2,yaxt='n',
cex.axis=1.2,at=7,add=TRUE)
boxplot(data4B$mdi,horizontal=FALSE, main='',
ylab="",xlab="",xaxt='n',cex.main=1.5,cex.lab=1.2,yaxt='n',
cex.axis=1.2,at=8,add=TRUE)
boxplot(data5A$mdi,horizontal=FALSE, main='',
ylab="",xlab="",xaxt='n',cex.main=1.5,cex.lab=1.2,yaxt='n',
cex.axis=1.2,at=9,add=TRUE)
boxplot(data5B$mdi,horizontal=FALSE, main='',
ylab="",xlab="",xaxt='n',cex.main=1.5,cex.lab=1.2,yaxt='n',
cex.axis=1.2,at=10,add=TRUE)
abline(v=c(2.5,4.5,6.5,8.5),lty=2,col="grey50",lwd=1.5)
###Label x-axis
axis(side=1,at=x,labels=type1,cex.axis=0.8)
mtext(c("Child sex","Mom education","Mom age","Race","Smoking
status"),side=1,line=3,at=c(1.5,3.5,5.5,7.5,9.5),cex=1.1)
###Add data points onto boxplots
stripchart(data1A$mdi, method='jitter', vertical=TRUE, add=TRUE, at=1,pch=0,cex=0.4,col="red")
stripchart(data1B$mdi, method='jitter', vertical=TRUE, add=TRUE, at=2,pch=0,cex=0.4,col="red")
stripchart(data2A$mdi, method='jitter', vertical=TRUE, add=TRUE, at=3,pch=0,cex=0.4,col="red")
stripchart(data2B$mdi, method='jitter', vertical=TRUE, add=TRUE, at=4,pch=0,cex=0.4,col="red")
stripchart(data3A$mdi, method='jitter', vertical=TRUE, add=TRUE, at=5,pch=0,cex=0.4,col="red")
stripchart(data3B$mdi, method='jitter', vertical=TRUE, add=TRUE, at=6,pch=0,cex=0.4,col="red")
stripchart(data4A$mdi, method='jitter', vertical=TRUE, add=TRUE, at=7,pch=0,cex=0.4,col="red")
stripchart(data4B$mdi, method='jitter', vertical=TRUE, add=TRUE, at=8,pch=0,cex=0.4,col="red")
160

stripchart(data5A$mdi, method='jitter', vertical=TRUE, add=TRUE, at=9,pch=0,cex=0.4,col="red")
stripchart(data5B$mdi, method='jitter', vertical=TRUE, add=TRUE, at=10,pch=0,cex=0.4,col="red")
t1 <- t.test(data1A$mdi,data1B$mdi)
t2 <- t.test(data2A$mdi,data2B$mdi)
t3 <- t.test(data3A$mdi,data3B$mdi)
t4 <- t.test(data4A$mdi,data4B$mdi)
t5 <- t.test(data5A$mdi,data5B$mdi)
text(x=1.5,y=120,cex=0.8,labels=paste(as.numeric(round(t1$estimate[1],1)),' vs.
',as.numeric(round(t1$estimate[2],1)),',
p=',ifelse(as.numeric(round(t1$p.value,3))==0,"<0.001",as.numeric(round(t1$p.value,3))),sep=''))
text(x=3.5,y=120,cex=0.8,labels=paste(as.numeric(round(t2$estimate[1],1)),' vs.
',as.numeric(round(t2$estimate[2],1)),',
p=',ifelse(as.numeric(round(t2$p.value,3))==0,"<0.001",as.numeric(round(t2$p.value,3))),sep=''))
text(x=5.5,y=120,cex=0.8,labels=paste(as.numeric(round(t3$estimate[1],1)),' vs.
',as.numeric(round(t3$estimate[2],1)),',
p=',ifelse(as.numeric(round(t3$p.value,3))==0,"<0.001",as.numeric(round(t3$p.value,3))),sep=''))
text(x=7.5,y=120,cex=0.8,labels=paste(as.numeric(round(t4$estimate[1],1)),' vs.
',as.numeric(round(t4$estimate[2],1)),',
p=',ifelse(as.numeric(round(t4$p.value,3))==0,"<0.001",as.numeric(round(t4$p.value,3))),sep=''))
text(x=9.5,y=120,cex=0.8,labels=paste(as.numeric(round(t5$estimate[1],1)),' vs.
',as.numeric(round(t5$estimate[2],1)),',
p=',ifelse(as.numeric(round(t5$p.value,3))==0,"<0.001",as.numeric(round(t5$p.value,3))),sep=''))
###Close out PDF output
dev.off()
exposure_plots <- function(expos1){
pdf(file=paste(expos1,".pdf",sep=''),height=6, width=10)
par(mfrow=c(2,3),mar = c(4,4,1,1))
plot(data1[,c(expos1)],data1$mdi,ylab="MDI",xlab=c(expos1),ylim=c(45,120),xlim=c(min(data1[,c(expos
1)]),max(data1[,c(expos1)])),cex.lab=1,cex=1,cex.axis=1)
lm1 <- lm(data1$mdi~data1[,c(expos1)])
abline(lm1$coef[1],lm1$coef[2],col="black",lty=2,lwd=1.2)
corr1 <- cor.test(data1[,c(expos1)],data1$mdi)
legend("topright",legend=c(paste("Corr=",round(corr1$estimate,3),',
p=',ifelse(as.numeric(round(corr1$p.value,3))==0,"<0.001",as.numeric(round(corr1$p.value,3))),sep='')),
pch=1,cex=0.8,bg="white")
161

### Child sex
plot(data1A[,c(expos1)],data1A$mdi,ylim=c(45,120),xlim=c(min(data1[,c(expos1)]),max(data1[,c(expos1
)])),ylab="MDI",xlab=c(expos1),cex.lab=1,cex=1,cex.axis=1)
points(data1B[,c(expos1)],data1B$mdi,col="red")
lm1 <- lm(data1A$mdi~data1A[,c(expos1)])
abline(lm1$coef[1],lm1$coef[2],col="black",lty=2,lwd=1.2)
lm2 <- lm(data1B$mdi~data1B[,c(expos1)])
abline(lm2$coef[1],lm2$coef[2],col="red",lty=2,lwd=1.2)
corr1 <- cor.test(data1A[,c(expos1)],data1A$mdi)
legend("topright",legend=c(paste("Child sex (Male), Corr=",round(corr1$estimate,3),',
p=',ifelse(as.numeric(round(corr1$p.value,3))==0,"<0.001",as.numeric(round(corr1$p.value,3))),sep='')),
pch=1,cex=0.8,bg="white")
corr2 <- cor.test(data1B[,c(expos1)],data1B$mdi)
legend("bottomright",legend=c(paste("Child sex (Female), Corr=",round(corr2$estimate,3),',
p=',ifelse(as.numeric(round(corr2$p.value,3))==0,"<0.001",as.numeric(round(corr2$p.value,3))),sep='')),
pch=1,cex=0.8,col="red",bg="white")
### Mom education
plot(data2A[,c(expos1)],data2A$mdi,ylim=c(45,120),xlim=c(min(data1[,c(expos1)]),max(data1[,c(expos1
)])),ylab="MDI",xlab=c(expos1),cex.lab=1,cex=1,cex.axis=1)
points(data2B[,c(expos1)],data2B$mdi,col="red")
lm1 <- lm(data2A$mdi~data2A[,c(expos1)])
abline(lm1$coef[1],lm1$coef[2],col="black",lty=2,lwd=1.2)
lm2 <- lm(data2B$mdi~data2B[,c(expos1)])
abline(lm2$coef[1],lm2$coef[2],col="red",lty=2,lwd=1.2)
corr1 <- cor.test(data2A[,c(expos1)],data2A$mdi)
legend("topright",legend=c(paste("Mom Educ (>12), Corr=",round(corr1$estimate,3),',
p=',ifelse(as.numeric(round(corr1$p.value,3))==0,"<0.001",as.numeric(round(corr1$p.value,3))),sep='')),
pch=1,cex=0.8,bg="white")
corr2 <- cor.test(data2B[,c(expos1)],data2B$mdi)
legend("bottomright",legend=c(paste("Mom Educ (<=12), Corr=",round(corr2$estimate,3),',
p=',ifelse(as.numeric(round(corr2$p.value,3))==0,"<0.001",as.numeric(round(corr2$p.value,3))),sep='')),
pch=1,cex=0.8,col="red",bg="white")
### Mom age
plot(data3A[,c(expos1)],data3A$mdi,ylim=c(45,120),xlim=c(min(data1[,c(expos1)]),max(data1[,c(expos1
)])),ylab="MDI",xlab=c(expos1),cex.lab=1,cex=1,cex.axis=1)
points(data3B[,c(expos1)],data3B$mdi,col="red")
lm1 <- lm(data3A$mdi~data3A[,c(expos1)])
abline(lm1$coef[1],lm1$coef[2],col="black",lty=2,lwd=1.2)
lm2 <- lm(data3B$mdi~data3B[,c(expos1)])
abline(lm2$coef[1],lm2$coef[2],col="red",lty=2,lwd=1.2)
162

corr1 <- cor.test(data3A[,c(expos1)],data3A$mdi)
legend("topright",legend=c(paste("Mom Age (<29), Corr=",round(corr1$estimate,3),',
p=',ifelse(as.numeric(round(corr1$p.value,3))==0,"<0.001",as.numeric(round(corr1$p.value,3))),sep='')),
pch=1,cex=0.8,bg="white")
corr2 <- cor.test(data3B[,c(expos1)],data3B$mdi)
legend("bottomright",legend=c(paste("Mom Age (29+), Corr=",round(corr2$estimate,3),',
p=',ifelse(as.numeric(round(corr2$p.value,3))==0,"<0.001",as.numeric(round(corr2$p.value,3))),sep='')),
pch=1,cex=0.8,col="red",bg="white")
### Race
plot(data4A[,c(expos1)],data4A$mdi,ylim=c(45,120),xlim=c(min(data1[,c(expos1)]),max(data1[,c(expos1
)])),ylab="MDI",xlab=c(expos1),cex.lab=1,cex=1,cex.axis=1)
points(data4B[,c(expos1)],data4B$mdi,col="red")
lm1 <- lm(data4A$mdi~data4A[,c(expos1)])
abline(lm1$coef[1],lm1$coef[2],col="black",lty=2,lwd=1.2)
lm2 <- lm(data4B$mdi~data4B[,c(expos1)])
abline(lm2$coef[1],lm2$coef[2],col="red",lty=2,lwd=1.2)
corr1 <- cor.test(data4A[,c(expos1)],data4A$mdi)
legend("topright",legend=c(paste("Race (White), Corr=",round(corr1$estimate,3),',
p=',ifelse(as.numeric(round(corr1$p.value,3))==0,"<0.001",as.numeric(round(corr1$p.value,3))),sep='')),
pch=1,cex=0.8,bg="white")
corr2 <- cor.test(data4B[,c(expos1)],data4B$mdi)
legend("bottomright",legend=c(paste("Race (Non-white), Corr=",round(corr2$estimate,3),',
p=',ifelse(as.numeric(round(corr2$p.value,3))==0,"<0.001",as.numeric(round(corr2$p.value,3))),sep='')),
pch=1,cex=0.8,col="red",bg="white")
### Smoking status
plot(data5A[,c(expos1)],data5A$mdi,ylim=c(45,120),xlim=c(min(data1[,c(expos1)]),max(data1[,c(expos1
)])),ylab="MDI",xlab=c(expos1),cex.lab=1,cex=1,cex.axis=1)
points(data5B[,c(expos1)],data5B$mdi,col="red")
lm1 <- lm(data5A$mdi~data5A[,c(expos1)])
abline(lm1$coef[1],lm1$coef[2],col="black",lty=2,lwd=1.2)
lm2 <- lm(data5B$mdi~data5B[,c(expos1)])
abline(lm2$coef[1],lm2$coef[2],col="red",lty=2,lwd=1.2)
corr1 <- cor.test(data5A[,c(expos1)],data5A$mdi)
legend("topright",legend=c(paste("Non-smoker, Corr=",round(corr1$estimate,3),',
p=',ifelse(as.numeric(round(corr1$p.value,3))==0,"<0.001",as.numeric(round(corr1$p.value,3))),sep='')),
pch=1,cex=0.8,bg="white")
corr2 <- cor.test(data5B[,c(expos1)],data5B$mdi)
legend("bottomright",legend=c(paste("Smoker, Corr=",round(corr2$estimate,3),',
p=',ifelse(as.numeric(round(corr2$p.value,3))==0,"<0.001",as.numeric(round(corr2$p.value,3))),sep='')),
pch=1,cex=0.8,col="red",bg="white")
163

dev.off()
}
exposure_plots("lip_PBDE_47")
exposure_plots("lip_PBDE_99")
exposure_plots("lip_PBDE_100")
exposure_plots("lip_PBDE_153")
exposure_plots("lip_hcb")
exposure_plots("lip_nonachlor")
exposure_plots("lip_oxychlor")
exposure_plots("lip_pp_dde")
exposure_plots("lip_pcb74")
exposure_plots("lip_pcb99")
exposure_plots("lip_pcb105")
exposure_plots("lip_pcb118")
exposure_plots("lip_pcb146")
exposure_plots("lip_pcb153")
exposure_plots("lip_pcb156")
exposure_plots("lip_pcb170")
exposure_plots("lip_pcb180")
exposure_plots("lip_pcb187")
exposure_plots("lip_pcb194")
exposure_plots("lip_pcb199")
exposure_plots("lip_pcb138_158")
exposure_plots("lip_pcb196_203")
Dataset #1 – Modeling (SAS):
data oneA;
set one;
x1_z = x1*z;
x2_z = x2*z;
x3_z = x3*z;
x4_z = x4*z;
x5_z = x5*z;
x6_z = x6*z;
x7_z = x7*z;
run;
164
proc reg data=oneA;
model Y= x1 x2 x4 x5 x7 z x1_z x5_z;
output out=WORK.PRED r=residual;
run;
data work.resid;
set work.pred;
absresid=abs(residual);
sqresid=residual**2;
proc reg data=work.resid;
model sqresid=x1 x2 x4 x5 x7 z x1_z x5_z;
output out=WORK.v_weights p=v_hat;
run;
data work.v_weights;
set work.v_weights;
v_weight=1/v_hat;
label v_weight = "Weights using squared residuals";
proc reg data=work.v_weights;
weight v_weight;
model Y = x1 x2 x4 x5 x7 z x1_z x5_z;
run;
proc genmod data=work.v_weights;
weight v_weight;
model Y = x1 x2 x4 x5 x7 z x1_z x5_z / scale=deviance;
estimate "x1 - z=0" x1 1 x2 0 x4 0 x5 0 x7 0 z 0 x1_z 0 x5_z 0;
estimate "x1 - z=1" x1 1 x2 0 x4 0 x5 0 x7 0 z 0 x1_z 1 x5_z 0;
estimate "x2" x1 0 x2 1 x4 0 x5 0 x7 0 z 0 x1_z 0 x5_z 0;
estimate "x4" x1 0 x2 0 x4 1 x5 0 x7 0 z 0 x1_z 0 x5_z 0;
estimate "x5 - z=0" x1 0 x2 0 x4 0 x5 1 x7 0 z 0 x1_z 0 x5_z 0;
estimate "x5 - z=1" x1 0 x2 0 x4 0 x5 1 x7 0 z 0 x1_z 0 x5_z 1;
estimate "x7" x1 0 x2 0 x4 0 x5 0 x7 1 z 0 x1_z 0 x5_z 0;
run;
Dataset #2 – Modeling (R):
library(tree)
data1 <- read.csv("DataSet2.csv")
fit1 <- tree(y~x1+x2+x3+x4+x5+x6+x7+x8+x9+x10+x11+x12+x13+x14+z1+z2+z3,data=data1)
summary(fit1)
tiff("CART_data2.tif",height=480,width=680)
plot(fit1)
165

text(fit1)
dev.off()
Dataset: Real world data – Modeling (R):
data1 <- read.csv("ReadWorld1.csv",header=T)
#data1A <- subset(data1,data1$id != 304)
#data1B <- subset(data1A,data1A$id != 312)
#data3 <- data1B[,c(7:28)]
data3 <- data1[,c(7:28)]
pca1 <- prcomp(data3,scale=TRUE)
#pca1 <- prcomp(data3,tol=0.4,scale=TRUE)
pdf("PCA_barplot.pdf")
barplot(pca1$sdev/pca1$sdev[1])
abline(h=0.4)
dev.off()
final_dat <-
data.frame(data1[,c("mdi","child_sex","mom_educ","mom_age","mom_race","mom_smoke")],pca1$x)
Dataset: Real world data – Modeling (SAS):
data pca2; set pca1;
int_sex_pc1 = child_sex*pc1;
int_sex_pc2 = child_sex*pc2;
int_sex_pc3 = child_sex*pc3;
int_sex_pc4 = child_sex*pc4;
int_educ_pc1 = mom_educ*pc1;
int_educ_pc2 = mom_educ*pc2;
int_educ_pc3 = mom_educ*pc3;
int_educ_pc4 = mom_educ*pc4;
int_age_pc1 = mom_age*pc1;
int_age_pc2 = mom_age*pc2;
int_age_pc3 = mom_age*pc3;
int_age_pc4 = mom_age*pc4;
int_race_pc1 = mom_race*pc1;
int_race_pc2 = mom_race*pc2;
int_race_pc3 = mom_race*pc3;
166

int_race_pc4 = mom_race*pc4;
int_smoke_pc1 = mom_smoke*pc1;
int_smoke_pc2 = mom_smoke*pc2;
int_smoke_pc3 = mom_smoke*pc3;
int_smoke_pc4 = mom_smoke*pc4;
run;
** Individual interaction regression models with PC variables and covariates
to identify significant interaction terms;
proc reg data=pca2;
model mdi = PC1 child_sex int_sex_pc1;
run;
proc reg data=pca2;
model mdi = PC2 child_sex int_sex_pc2;
run;
proc reg data=pca2;
model mdi = PC3 child_sex int_sex_pc3;
run;
proc reg data=pca2;
model mdi = PC4 child_sex int_sex_pc4;
run;
proc reg data=pca2;
model mdi = PC1 mom_educ int_educ_pc1;
run;
proc reg data=pca2;
model mdi = PC2 mom_educ int_educ_pc2;
run;
proc reg data=pca2;
model mdi = PC3 mom_educ int_educ_pc3;
run;
proc reg data=pca2;
model mdi = PC4 mom_educ int_educ_pc4;
run;
proc reg data=pca2;
model mdi = PC1 mom_race int_race_pc1;
run;
167

proc reg data=pca2;
model mdi = PC2 mom_race int_race_pc2;
run;
proc reg data=pca2;
model mdi = PC3 mom_race int_race_pc3;
run;
proc reg data=pca2;
model mdi = PC4 mom_race int_race_pc4;
run;
proc reg data=pca2;
model mdi = PC1 mom_age int_age_pc1;
run;
proc reg data=pca2;
model mdi = PC2 mom_age int_age_pc2;
run;
proc reg data=pca2;
model mdi = PC3 mom_age int_age_pc3;
run;
proc reg data=pca2;
model mdi = PC4 mom_age int_age_pc4;
run;
proc reg data=pca2;
model mdi = PC1 mom_smoke int_smoke_pc1;
run;
proc reg data=pca2;
model mdi = PC2 mom_smoke int_smoke_pc2;
run;
proc reg data=pca2;
model mdi = PC3 mom_smoke int_smoke_pc3;
run;
proc reg data=pca2;
model mdi = PC4 mom_smoke int_smoke_pc4;
run;
** Model with significant interaction – PC1-Mom_age with other significant
main effects;
168

proc reg data=pca2;
model mdi = PC1 child_sex mom_educ mom_age mom_race int_age_pc1;
run;
169

23. Set-based Interaction Tests for High-Dimensional Environmental
Exposome Data Presenting Author: Sandra Taylor
Organization: Department of Health Sciences, University of California, Davis
Contributing Authors: Sandra L. Taylor, Kyoungmi Kim, Irva Hertz-Picciotto
Code:
#######################################################################################################
# CODE TO ANALYZE SIMULATED DATA SET #1
#######################################################################################################
library(utils)
library(lmtest)
library(lattice)
source("AnalysisFunctions.r")
Data1 <- read.csv("DataSet1.csv", header=TRUE, sep=",")[,-c(1)]
# Center and Scale the predictors and Y
Scaled <- scale(Data1[,c("X1","X2","X3","X4","X5","X6","X7")])
Preds <- cbind(Z=Data1$Z, Scaled)
Outcome <- scale(Data1[,"Y",drop=FALSE])
Data1ModelLogL <- FindPredsLogL(Outcome, Preds, threshold=0.01, continuous=c("X1","X2","X3","X4","X5","X6","X7"))
write.table(Data1ModelLogL$results, file="Data1FinalModel.csv", sep=",", row.names=FALSE, col.names=TRUE)
# Get percent contribution of each term
data.frame(Predictor=Data1ModelLogL$results[,"Predictor"],
PerTerm=round(100*Data1ModelLogL$results[,"DeltaLL"]/sum(Data1ModelLogL$results[,"DeltaLL"]),2))
InFinal <- data.frame(Preds[,c("Z","X1","X5","X7")], X5.X5=Preds[,"X5"]^2, X7.X7=Preds[,"X7"]^2,
X7.X7.X7=Preds[,"X7"]^3, Z.X1=Preds[,"X1"]*Preds[,"Z"], X7.X5=Preds[,"X7"]*Preds[,"X5"])
FinalModel <- lm(Outcome~Z+X1+X5+X7+X5.X5+X7.X7+X7.X7.X7+Z.X1+X7.X5, data=InFinal)
# Get percent contribution of each variable
DropX7 <- lm(Outcome~Z+X1+X5+X5.X5+Z.X1, data=InFinal)
DropX5 <- lm(Outcome~Z+X1+X7+X7.X7+X7.X7.X7+Z.X1, data=InFinal)
DropX1 <- lm(Outcome~Z+X5+X7+X5.X5+X7.X7+X7.X7.X7+X7.X5, data=InFinal)
DropZ <- lm(Outcome~X1+X5+X7+X5.X5+X7.X7+X7.X7.X7+X7.X5, data=InFinal)
Z <- logLik(FinalModel)-logLik(DropZ)
X1 <- logLik(FinalModel)-logLik(DropX1)
X5 <- logLik(FinalModel)-logLik(DropX5)
X7 <- logLik(FinalModel)-logLik(DropX7)
Per <- c(Z, X1, X5, X7)/sum(c(Z, X1, X5, X7))
round(100*Per,2)
170

##############################################################################
# Conduct Bootstrap Analyses
##############################################################################
library(utils)
library(lmtest)
source("AnalysisFunctions.r")
Data1 <- read.csv("DataSet1.csv", header=TRUE, sep=",")[,-c(1)]
###########################
# This boostrap evaluates how often each predictor occurs in the selected model for each bootstrap and returns its delta log
# likelihood values and significance
###########################
B <- 1000
Data1.LogLBoot <- vector(mode="list", length=B)
Data1.Index <- vector(mode="list", length=B)
set.seed(9999)
for (b in 1:B){
index <- sample(1:500,500, replace=TRUE)
Boot <- Data1[index,]
# Center and Scale the predictors and Y
Scaled <- scale(Boot[,c("X1","X2","X3","X4","X5","X6","X7")])
Preds <- cbind(Z=Boot$Z, Scaled)
Outcome <- scale(Boot[,"Y",drop=FALSE])
Data1.LogLBoot[[b]] <- FindPredsLogL(Outcome, Preds, threshold=0.01, continuous=c("X1","X2","X3","X4","X5","X6","X7"))
Data1.Index[[b]] <- index
}
save(Data1.LogLBoot, file="Data1.LogLBoot.rda")
save(Data1.Index, file="Data1.Index.rda")
############################################
# This bootstrap fits the final model found in analyzing the data in order to assess variation in delta log likelihood et al for this
# specific model
B <- 1000
Data1.LogLBoot.Final <- vector(mode="list", length=B)
Data1.TotalR2Boot.Final <- NA
Data1.DeltaLLByVar.Final <- matrix(nrow=B, ncol=4, dimnames=list(c(1:B), c("Z","X1","X5","X7")))
set.seed(9999)
for (b in 1:B){
index <- sample(1:500,500, replace=TRUE)
Boot <- Data1[index,]
# Center and Scale the predictors and Y
Scaled <- scale(Boot[,c("X1","X2","X3","X4","X5","X6","X7")])
Preds <- cbind(Z=Boot$Z, Scaled)
Outcome <- scale(Boot[,"Y",drop=FALSE])
InFinal <- data.frame(Preds[,c("Z","X1","X5","X7")], X5.X5=Preds[,"X5"]^2, X7.X7=Preds[,"X7"]^2,
X7.X7.X7=Preds[,"X7"]^3, Z.X1=Preds[,"X1"]*Preds[,"Z"], X7.X5=Preds[,"X7"]*Preds[,"X5"])
Data1.TotalR2Boot.Final[b] <- summary(lm(Outcome~., data=InFinal))$r.squared
171

InModel <- colnames(InFinal)
DeltaLL <- sapply(1:length(InModel), function(x) BestLogL(InModel[x], InModel[-c(x)], InFinal, Outcome))
colnames(DeltaLL) <- InModel
Data1.LogLBoot.Final[[b]] <- DeltaLL
FinalModel <- lm(Outcome~., data=InFinal)
DropX7 <- lm(Outcome~Z+X1+X5+X5.X5+Z.X1, data=InFinal)
DropX5 <- lm(Outcome~Z+X1+X7+X7.X7+X7.X7.X7+Z.X1, data=InFinal)
DropX1 <- lm(Outcome~Z+X5+X7+X5.X5+X7.X7+X7.X7.X7+X7.X5, data=InFinal)
DropZ <- lm(Outcome~X1+X5+X7+X5.X5+X7.X7+X7.X7.X7+X7.X5, data=InFinal)
A1 <- logLik(FinalModel)-logLik(DropZ)
B1 <- logLik(FinalModel)-logLik(DropX1)
C1 <- logLik(FinalModel)-logLik(DropX5)
D1 <- logLik(FinalModel)-logLik(DropX7)
Per <- c(A1, B1, C1, D1)/sum(c(A1, B1, C1, D1))
Data1.DeltaLLByVar.Final[b,] <- Per
}
save(Data1.LogLBoot.Final, file="Data1.LogLBoot.Final.rda")
save(Data1.TotalR2Boot.Final, file="Data1.TotalR2Boot.Final.rda")
save(Data1.DeltaLLByVar.Final, file="Data1.DeltaLLByVar.Final.rda")
##############################################################################
# Load bootstrap results for evaluate frequency with which each predictor was selected
##############################################################################
B <- 1000
load("Data1.LogLBoot.rda")
# Get frequency count for each predictor
AllPreds <- unlist(sapply(1:B, function(x) Data1.LogLBoot[[x]]$results[,"Predictor"]))
PredFreq <- sort(table(AllPreds)/B, decreasing=TRUE)
write.table(PredFreq, "DataSet1PredFreqLogL.csv", sep=",", col.names=FALSE)
##############################################################################
# Load bootstrap results for evaluate variability in final model
##############################################################################
load("Data1.LogLBoot.Final.rda")
load("Data1.TotalR2Boot.Final.rda")
load("Data1.DeltaLLByVar.Final.rda")
# Calculate % contribution for term each based on delta LogL
TermPerc <- sapply(1:B, function(x) Data1.LogLBoot.Final[[x]]["deltaLL",]/sum(Data1.LogLBoot.Final[[x]]["deltaLL",]))
rownames(TermPerc) <- colnames(InFinal)
# Get 95% confidence limits for % contribution of each term on delta LogL
round(100*apply(TermPerc,1,quantile, c(0.025, 0.975)),1)
# Get 95% confidence limits for % contribution of each variable on delta LogL
round(100*apply(Data1.DeltaLLByVar.Final,2,quantile, c(0.025, 0.975)),1)
172

###############################################################################
# Confounder Analysis
# 1) Look at change in coefficients of terms in final model with dropping each predictor
# 2) Look at change in coefficients of terms in final model with adding predictors not included in the final model
###############################################################################
FinalCoef <- coef(FinalModel)
# Drop Z
DropZ <- coef(lm(Outcome~X1+X5+X7+X5.X5+X7.X7+X7.X7.X7+X7.X5, data=InFinal))
# Drop X1
DropX1 <- coef(lm(Outcome~Z+X5+X7+X5.X5+X7.X7+X7.X7.X7+X7.X5, data=InFinal))
# Drop X5
DropX5 <- coef(lm(Outcome~Z+X1+X7+X7.X7+X7.X7.X7+Z.X1, data=InFinal))
# Drop X7
DropX7 <- coef(lm(Outcome~Z+X1+X5+X5.X5+Z.X1, data=InFinal))
# Add X2
AddX2 <- coef(lm(Outcome~Z+X1+X5+X7+X5.X5+X7.X7+X7.X7.X7+Z.X1+X7.X5+X2, data=data.frame(InFinal, X2=Preds[,"X2"])))
# Add X3
AddX3 <- coef(lm(Outcome~Z+X1+X5+X7+X5.X5+X7.X7+X7.X7.X7+Z.X1+X7.X5+X3, data=data.frame(InFinal, X3=Preds[,"X3"])))
# Add X4
AddX4 <- coef(lm(Outcome~Z+X1+X5+X7+X5.X5+X7.X7+X7.X7.X7+Z.X1+X7.X5+X4, data=data.frame(InFinal, X4=Preds[,"X4"])))
# Add X6
AddX6 <- coef(lm(Outcome~Z+X1+X5+X7+X5.X5+X7.X7+X7.X7.X7+Z.X1+X7.X5+X6, data=data.frame(InFinal, X6=Preds[,"X6"])))
CoefChange <- matrix(nrow=10, ncol=9, dimnames=list(names(FinalCoef), c("FinalModel", "DropZ","DropX1","DropX5",
"DropX7", "AddX2","AddX3","AddX4","AddX6")))
CoefChange[,"FinalModel"] <- round(FinalCoef,3)
CoefChange[,"AddX2"] <- round(AddX2[1:10],3)
CoefChange[,"AddX3"] <- round(AddX3[1:10],3)
CoefChange[,"AddX4"] <- round(AddX4[1:10],3)
CoefChange[,"AddX6"] <- round(AddX6[1:10],3)
CoefChange[which(rownames(CoefChange) %in% names(DropZ)),"DropZ"] <- round(DropZ,3)
CoefChange[which(rownames(CoefChange) %in% names(DropX1)),"DropX1"] <- round(DropX1,3)
CoefChange[which(rownames(CoefChange) %in% names(DropX5)),"DropX5"] <- round(DropX5,3)
CoefChange[which(rownames(CoefChange) %in% names(DropX7)),"DropX7"] <- round(DropX7,3)
write.table(CoefChange, file="DataSet1_CoefChange.csv", col.names=TRUE, sep=",")
PerCoefChange <- matrix(nrow=10, ncol=8, dimnames=list(names(FinalCoef), c("DropZ","DropX1","DropX5", "DropX7",
"AddX2","AddX3","AddX4","AddX6")))
PerCoefChange[,"DropZ"] <- round(100*(CoefChange[,"FinalModel"]-CoefChange[,"DropZ"])/CoefChange[,"FinalModel"],2)
PerCoefChange[,"DropX1"] <- round(100*(CoefChange[,"FinalModel"]-CoefChange[,"DropX1"])/CoefChange[,"FinalModel"],2)
PerCoefChange[,"DropX5"] <- round(100*(CoefChange[,"FinalModel"]-CoefChange[,"DropX5"])/CoefChange[,"FinalModel"],2)
PerCoefChange[,"DropX7"] <- round(100*(CoefChange[,"FinalModel"]-CoefChange[,"DropX7"])/CoefChange[,"FinalModel"],2)
PerCoefChange[,"AddX2"] <- round(100*(CoefChange[,"FinalModel"]-CoefChange[,"AddX2"])/CoefChange[,"FinalModel"],2)
PerCoefChange[,"AddX3"] <- round(100*(CoefChange[,"FinalModel"]-CoefChange[,"AddX3"])/CoefChange[,"FinalModel"],2)
PerCoefChange[,"AddX4"] <- round(100*(CoefChange[,"FinalModel"]-CoefChange[,"AddX4"])/CoefChange[,"FinalModel"],2)
PerCoefChange[,"AddX6"] <- round(100*(CoefChange[,"FinalModel"]-CoefChange[,"AddX6"])/CoefChange[,"FinalModel"],2)
write.table(PerCoefChange, file="DataSet1_PerCoefChange.csv", col.names=TRUE, sep=",")
173

#######################################################################################################
# CODE TO ANALYZE SIMULATED DATA SET #2
#######################################################################################################
library(utils)
library(lmtest)
setwd("H:/Kyoungmi/NIEHS/FinalAnalyses")
source("AnalysisFunctions.r")
Data2 <- read.csv("DataSet2.csv", header=TRUE, sep=",")[,-c(1)]
# Center and Scale the predictors and Y
Scaled <- scale(Data2[,c("x1","x2","x3","x4","x5","x6","x7","x8","x9","x10","x11","x12","x13","x14","z1","z2")])
Preds <- cbind(z3=Data2$z3, Scaled)
Outcome <- scale(Data2[,"y",drop=FALSE])
Data2ModelLogL <- FindPredsLogL(Outcome, Preds, threshold=0.01,
continuous=c("x1","x2","x3","x4","x5","x6","x7","x8","x9","x10","x11","x12","x13","x14","z1","z2"))
write.table(Data2ModelLogL$results, file="Data2FinalModel.csv", sep=",", row.names=FALSE, col.names=TRUE)
InFinal <- data.frame(Preds[,c("z2","z3","x4","x12","x14")], X12_3=Preds[,"x12"]^3,
Z3.X12=Preds[,"x12"]*Preds[,"z3"])
FinalModel <- lm(Outcome~x4+x12+z2+x14+z3+X12_3+Z3.X12, data=InFinal)
# Get percent contribution of each term
data.frame(Predictor=Data2ModelLogL$results[,"Predictor"],
PerTerm=round(100*Data2ModelLogL$results[,"DeltaLL"]/sum(Data2ModelLogL$results[,"DeltaLL"]),2))
# Get percent contribution of each variable
DropZ2 <- lm(Outcome~x4+x12+x14+z3+X12_3+Z3.X12, data=InFinal)
DropZ3 <- lm(Outcome~x4+x12+z2+x14+X12_3, data=InFinal)
DropX4 <- lm(Outcome~x12+z2+x14+z3+X12_3+Z3.X12, data=InFinal)
DropX12 <- lm(Outcome~x4+z2+x14+z3, data=InFinal)
DropX14 <- lm(Outcome~x4+x12+z2+z3+X12_3+Z3.X12, data=InFinal)
Z2 <- logLik(FinalModel)-logLik(DropZ2)
Z3 <- logLik(FinalModel)-logLik(DropZ3)
X4 <- logLik(FinalModel)-logLik(DropX4)
X12 <- logLik(FinalModel)-logLik(DropX12)
X14 <- logLik(FinalModel)-logLik(DropX14)
Per <- round(100*(c(Z2, Z3, X4, X12, X14)/sum(c(Z2, Z3, X4, X12, X14))),2)
##############################################################################
# Conduct Bootstrap Analyses
##############################################################################
library(utils)
library(lmtest)
source("AnalysisFunctions.r")
Data2 <- read.csv("DataSet2.csv", header=TRUE, sep=",")[,-c(1)]
174

###########################
# This boostrap evaluates how often each predictor occurs in the selected model for each bootstrap and returns its delta log
# likelihood values and significance
###########################
B <- 1000
Data2.LogLBoot <- vector(mode="list", length=B)
Data2.Index <- vector(mode="list", length=B)
set.seed(9999)
for (b in 1:B){
index <- sample(1:500,500, replace=TRUE)
Boot <- Data2[index,]
# Center and Scale the predictors and Y
Scaled <- scale(Boot[,c("x1","x2","x3","x4","x5","x6","x7","x8","x9","x10","x11","x12","x13","x14","z1","z2")])
Preds <- cbind(z3=Boot$z3, Scaled)
Outcome <- scale(Boot[,"y",drop=FALSE])
Data2.LogLBoot[[b]] <- FindPredsLogL(Outcome, Preds, threshold=0.01,
continuous=c("x1","x2","x3","x4","x5","x6","x7","x8","x9","x10","x11","x12","x13","x14","z1","z2"))
Data2.Index[[b]] <- index
}
save(Data2.LogLBoot, file="Data2.LogLBoot.rda")
save(Data2.Index, file="Data2.Index.rda")
############################################
# This bootstrap fits the final model found in analyzing the data in order to assess variation in delta log likelihood et al for this
# specific model
B <- 1000
Data2.LogLBoot.Final <- vector(mode="list", length=B)
Data2.TotalR2Boot.Final <- NA
Data2.DeltaLLByVar.Final <- matrix(nrow=B, ncol=5, dimnames=list(c(1:B), c("Z2","Z3","X4","X12","X14")))
set.seed(9999)
for (b in 1:B){
index <- sample(1:500,500, replace=TRUE)
Boot <- Data2[index,]
# Center and Scale the predictors and Y
Scaled <- scale(Boot[,c("x1","x2","x3","x4","x5","x6","x7","x8","x9","x10","x11","x12","x13","x14","z1","z2")])
Preds <- cbind(z3=Boot$z3, Scaled)
Outcome <- scale(Boot[,"y",drop=FALSE])
InFinal <- data.frame(Preds[,c("z2","z3","x4","x12","x14")], X12_3=Preds[,"x12"]^3, Z3.X12=Preds[,"x12"]*Preds[,"z3"])
Data2.TotalR2Boot.Final[b] <- summary(lm(Outcome~., data=InFinal))$r.squared
InModel <- colnames(InFinal)
DeltaLL <- sapply(1:length(InModel), function(x) BestLogL(InModel[x], InModel[-c(x)], InFinal, Outcome))
colnames(DeltaLL) <- InModel
Data2.LogLBoot.Final[[b]] <- DeltaLL
FinalModel <- lm(Outcome~., data=InFinal)
DropZ2 <- lm(Outcome~x4+x12+x14+z3+X12_3+Z3.X12, data=InFinal)
DropZ3 <- lm(Outcome~x4+x12+z2+x14+X12_3, data=InFinal)
DropX4 <- lm(Outcome~x12+z2+x14+z3+X12_3+Z3.X12, data=InFinal)
DropX12 <- lm(Outcome~x4+z2+x14+z3, data=InFinal)
175

DropX14 <- lm(Outcome~x4+x12+z2+z3+X12_3+Z3.X12, data=InFinal)
Z2 <- logLik(FinalModel)-logLik(DropZ2)
Z3 <- logLik(FinalModel)-logLik(DropZ3)
X4 <- logLik(FinalModel)-logLik(DropX4)
X12 <- logLik(FinalModel)-logLik(DropX12)
X14 <- logLik(FinalModel)-logLik(DropX14)
Per <- c(Z2, Z3, X4, X12, X14)/sum(c(Z2, Z3, X4, X12, X14))
Data2.DeltaLLByVar.Final[b,] <- Per
}
save(Data2.LogLBoot.Final, file="Data2.LogLBoot.Final.rda")
save(Data2.TotalR2Boot.Final, file="Data2.TotalR2Boot.Final.rda")
save(Data2.DeltaLLByVar.Final, file="Data2.DeltaLLByVar.Final.rda")
##############################################################################
# Load bootstrap results for evaluate frequency with which each predictor was selected
##############################################################################
B <- 1000
load("Data2.LogLBoot.rda")
# Get frequency count for each predictor
AllPreds <- unlist(sapply(1:B, function(x) Data2.LogLBoot[[x]]$results[,"Predictor"]))
PredFreq <- sort(table(AllPreds)/B, decreasing=TRUE)
write.table(PredFreq, "DataSet2PredFreqLogL.csv", sep=",", col.names=FALSE)
##############################################################################
# Load bootstrap results for evaluate variability in final model
##############################################################################
load("Data2.LogLBoot.Final.rda")
load("Data2.TotalR2Boot.Final.rda")
load("Data2.DeltaLLByVar.Final.rda")
# Calculate % contribution for term each based on delta LogL
TermPerc <- sapply(1:B, function(x) Data2.LogLBoot.Final[[x]]["deltaLL",]/sum(Data2.LogLBoot.Final[[x]]["deltaLL",]))
# Get 95% confidence limits for % contribution of each term on delta LogL
round(100*apply(TermPerc,1,quantile, c(0.025, 0.975)),1)
# Get 95% confidence limits for % contribution of each variable on delta LogL
round(100*apply(Data2.DeltaLLByVar.Final,2,quantile, c(0.025, 0.975)),1)
# Get 95% confidence limits for total R2 of final model
100*quantile(Data2.TotalR2Boot.Final,c(0.025, 0.975))
176

###############################################################################
# Confounder Analysis
# 1) Look at change in coefficients of terms in final model with dropping each predictor
# 2) Look at change in coefficients of terms in final model with adding predictors not included in the final model
###############################################################################
FinalCoef <- coef(FinalModel)
# Drop Z2
DropZ2 <- coef(lm(Outcome~x4+x12+x14+z3+X12_3+Z3.X12, data=InFinal))
# Drop Z3
DropZ3 <- coef(lm(Outcome~x4+x12+z2+x14+X12_3, data=InFinal))
# Drop X4
DropX4 <- coef(lm(Outcome~x12+x14+z2+z3+X12_3+Z3.X12, data=InFinal))
# Drop X12
DropX12 <- coef(lm(Outcome~x4+x14+z2+z3, data=InFinal))
# Drop X14
DropX14 <- coef(lm(Outcome~x4+x12+z2+z3+X12_3+Z3.X12, data=InFinal))
# Add z1
AddZ1 <- coef(lm(Outcome~x4+x12+x14+z2+z3+X12_3+Z3.X12+z1, data=data.frame(InFinal, z1=Preds[,"z1"])))
# Add X1
AddX1 <- coef(lm(Outcome~x4+x12+x14+z2+z3+X12_3+Z3.X12+x1, data=data.frame(InFinal, x1=Preds[,"x1"])))
# Add X2
AddX2 <- coef(lm(Outcome~x4+x12+x14+z2+z3+X12_3+Z3.X12+x2, data=data.frame(InFinal, x2=Preds[,"x2"])))
# Add X3
AddX3 <- coef(lm(Outcome~x4+x12+x14+z2+z3+X12_3+Z3.X12+x3, data=data.frame(InFinal, x3=Preds[,"x3"])))
# Add X5
AddX5 <- coef(lm(Outcome~x4+x12+x14+z2+z3+X12_3+Z3.X12+x5, data=data.frame(InFinal, x5=Preds[,"x5"])))
# Add X6
AddX6 <- coef(lm(Outcome~x4+x12+x14+z2+z3+X12_3+Z3.X12+x6, data=data.frame(InFinal, x6=Preds[,"x6"])))
# Add X7
AddX7 <- coef(lm(Outcome~x4+x12+x14+z2+z3+X12_3+Z3.X12+x7, data=data.frame(InFinal, x7=Preds[,"x7"])))
# Add X8
AddX8 <- coef(lm(Outcome~x4+x12+x14+z2+z3+X12_3+Z3.X12+x8, data=data.frame(InFinal, x8=Preds[,"x8"])))
# Add X9
AddX9 <- coef(lm(Outcome~x4+x12+x14+z2+z3+X12_3+Z3.X12+x9, data=data.frame(InFinal, x9=Preds[,"x9"])))
# Add X10
AddX10 <- coef(lm(Outcome~x4+x12+x14+z2+z3+X12_3+Z3.X12+x10, data=data.frame(InFinal, x10=Preds[,"x10"])))
# Add X11
AddX11 <- coef(lm(Outcome~x4+x12+x14+z2+z3+X12_3+Z3.X12+x11, data=data.frame(InFinal, x11=Preds[,"x11"])))
# Add X13
AddX13 <- coef(lm(Outcome~x4+x12+x14+z2+z3+X12_3+Z3.X12+x13, data=data.frame(InFinal, x13=Preds[,"x13"])))
CoefChange <- matrix(nrow=8, ncol=18, dimnames=list(names(FinalCoef), c("FinalModel", "DropZ2",
"DropZ3", "DropX4","DropX12", "DropX14","AddZ1", "AddX1", "AddX2","AddX3","AddX5","AddX6",
"AddX7","AddX8","AddX9","AddX10","AddX11","AddX13")))
CoefChange[,"FinalModel"] <- round(FinalCoef,3)
CoefChange[,"AddZ1"] <- round(AddZ1[1:8],3)
CoefChange[,"AddX1"] <- round(AddX1[1:8],3)
CoefChange[,"AddX2"] <- round(AddX2[1:8],3)
CoefChange[,"AddX3"] <- round(AddX3[1:8],3)
177

CoefChange[,"AddX5"] <- round(AddX5[1:8],3)
CoefChange[,"AddX6"] <- round(AddX6[1:8],3)
CoefChange[,"AddX7"] <- round(AddX7[1:8],3)
CoefChange[,"AddX8"] <- round(AddX8[1:8],3)
CoefChange[,"AddX9"] <- round(AddX9[1:8],3)
CoefChange[,"AddX10"] <- round(AddX10[1:8],3)
CoefChange[,"AddX11"] <- round(AddX11[1:8],3)
CoefChange[,"AddX13"] <- round(AddX13[1:8],3)
CoefChange[which(rownames(CoefChange) %in% names(DropZ2)),"DropZ2"] <- round(DropZ2,3)
CoefChange[which(rownames(CoefChange) %in% names(DropZ3)),"DropZ3"] <- round(DropZ3,3)
CoefChange[which(rownames(CoefChange) %in% names(DropX4)),"DropX4"] <- round(DropX4,3)
CoefChange[which(rownames(CoefChange) %in% names(DropX12)),"DropX12"] <- round(DropX12,3)
CoefChange[which(rownames(CoefChange) %in% names(DropX14)),"DropX14"] <- round(DropX14,3)
write.table(CoefChange, file="DataSet2_CoefChange.csv", col.names=TRUE, sep=",")
PerCoefChange <- matrix(nrow=8, ncol=18, dimnames=list(names(FinalCoef), c("FinalModel", "DropZ2",
"DropZ3", "DropX4","DropX12", "DropX14","AddZ1", "AddX1", "AddX2","AddX3","AddX5","AddX6",
"AddX7","AddX8","AddX9","AddX10","AddX11","AddX13")))
PerCoefChange[,"DropZ2"] <- round(100*(CoefChange[,"FinalModel"]-CoefChange[,"DropZ2"])/CoefChange[,"FinalModel"],2)
PerCoefChange[,"DropZ3"] <- round(100*(CoefChange[,"FinalModel"]-CoefChange[,"DropZ3"])/CoefChange[,"FinalModel"],2)
PerCoefChange[,"DropX4"] <- round(100*(CoefChange[,"FinalModel"]-CoefChange[,"DropX4"])/CoefChange[,"FinalModel"],2)
PerCoefChange[,"DropX12"] <- round(100*(CoefChange[,"FinalModel"]-
CoefChange[,"DropX12"])/CoefChange[,"FinalModel"],2)
PerCoefChange[,"DropX14"] <- round(100*(CoefChange[,"FinalModel"]-
CoefChange[,"DropX14"])/CoefChange[,"FinalModel"],2)
PerCoefChange[,"AddZ1"] <- round(100*(CoefChange[,"FinalModel"]-CoefChange[,"AddZ1"])/CoefChange[,"FinalModel"],2)
PerCoefChange[,"AddX1"] <- round(100*(CoefChange[,"FinalModel"]-CoefChange[,"AddX1"])/CoefChange[,"FinalModel"],2)
PerCoefChange[,"AddX2"] <- round(100*(CoefChange[,"FinalModel"]-CoefChange[,"AddX2"])/CoefChange[,"FinalModel"],2)
PerCoefChange[,"AddX3"] <- round(100*(CoefChange[,"FinalModel"]-CoefChange[,"AddX3"])/CoefChange[,"FinalModel"],2)
PerCoefChange[,"AddX5"] <- round(100*(CoefChange[,"FinalModel"]-CoefChange[,"AddX5"])/CoefChange[,"FinalModel"],2)
PerCoefChange[,"AddX6"] <- round(100*(CoefChange[,"FinalModel"]-CoefChange[,"AddX6"])/CoefChange[,"FinalModel"],2)
PerCoefChange[,"AddX7"] <- round(100*(CoefChange[,"FinalModel"]-CoefChange[,"AddX7"])/CoefChange[,"FinalModel"],2)
PerCoefChange[,"AddX8"] <- round(100*(CoefChange[,"FinalModel"]-CoefChange[,"AddX8"])/CoefChange[,"FinalModel"],2)
PerCoefChange[,"AddX9"] <- round(100*(CoefChange[,"FinalModel"]-CoefChange[,"AddX9"])/CoefChange[,"FinalModel"],2)
PerCoefChange[,"AddX10"] <- round(100*(CoefChange[,"FinalModel"]-CoefChange[,"AddX10"])/CoefChange[,"FinalModel"],2)
PerCoefChange[,"AddX11"] <- round(100*(CoefChange[,"FinalModel"]-CoefChange[,"AddX11"])/CoefChange[,"FinalModel"],2)
PerCoefChange[,"AddX13"] <- round(100*(CoefChange[,"FinalModel"]-CoefChange[,"AddX13"])/CoefChange[,"FinalModel"],2)
write.table(PerCoefChange, file="DataSet2_PerCoefChange.csv", col.names=TRUE, sep=",")
#######################################################################################################
# CODE TO ANALYZE REAL WORLD DATA SET
#######################################################################################################
library(utils)
library(lmtest)
library(lattice)
source("AnalysisFunctions.r")
RWD <- read.csv("data_05182015.csv", header=TRUE)
178

# Log transform continuous exposures
LogCont <- log(RWD[,-c(1:6,29)])
Scaled <- data.frame(scale(LogCont))
Preds <- data.frame(RWD[,1:5], Scaled)
Outcome <- scale(RWD[,"mdi",drop=FALSE])
##############
# Analyze with significance threshold = 0.2
##############
RWDModelP2 <- FindPredsLogL(Outcome, Preds, threshold=0.2, continuous=colnames(Scaled))
# Get percent contribution of each term and output to file
write.table(data.frame(RWDModelP2$results,
PerTerm=round(100*RWDModelP2$results[,"DeltaLL"]/sum(RWDModelP2$results[,"DeltaLL"]),2)),
file="RWD_FinalModelLogP2_20May2015.csv", sep=",", row.names=FALSE, col.names=TRUE)
InFinalP2 <- data.frame(Preds[,c("mom_educ", "lip_pcb194",
"mom_race","child_sex","lip_PBDE_99","lip_pcb105","lip_pcb187","mom_age")],
"lip_pcb194:mom_age"=Preds[,"lip_pcb194"]*Preds[,"mom_age"],
"lip_pcb105:mom_race"=Preds[,"lip_pcb105"]*Preds[,"mom_race"],
"lip_pcb187.lip_pcb187.lip_pcb187"=(Preds[,"lip_pcb187"]^3))
FinalModelP2 <- lm(Outcome~., data=InFinalP2)
DropMomEduc <- lm(Outcome ~ lip_pcb194+mom_race+child_sex+lip_PBDE_99+
lip_pcb105+lip_pcb187+mom_age+lip_pcb194.mom_age+lip_pcb105.mom_race+lip_pcb187.lip_pcb187.lip_pcb187,
data=InFinalP2)
DropPCB194 <- lm(Outcome ~ mom_educ+mom_race+child_sex+lip_PBDE_99+
lip_pcb105+lip_pcb187+mom_age+lip_pcb105.mom_race+lip_pcb187.lip_pcb187.lip_pcb187, data=InFinalP2)
DropMomRace <- lm(Outcome ~ mom_educ+lip_pcb194+child_sex+lip_PBDE_99+
lip_pcb105+lip_pcb187+mom_age+lip_pcb194.mom_age+lip_pcb187.lip_pcb187.lip_pcb187, data=InFinalP2)
DropChildSex <- lm(Outcome ~ mom_educ+lip_pcb194+mom_race+lip_PBDE_99+
lip_pcb105+lip_pcb187+mom_age+lip_pcb194.mom_age+lip_pcb105.mom_race+lip_pcb187.lip_pcb187.lip_pcb187,
data=InFinalP2)
DropPBDE99 <- lm(Outcome ~ mom_educ+lip_pcb194+mom_race+child_sex+
lip_pcb105+lip_pcb187+mom_age+lip_pcb194.mom_age+lip_pcb105.mom_race+lip_pcb187.lip_pcb187.lip_pcb187,
data=InFinalP2)
DropPCB105 <- lm(Outcome ~ mom_educ+lip_pcb194+mom_race+child_sex+lip_PBDE_99+
lip_pcb187+mom_age+lip_pcb194.mom_age+lip_pcb187.lip_pcb187.lip_pcb187, data=InFinalP2)
DropPCB187 <- lm(Outcome ~ mom_educ+lip_pcb194+mom_race+child_sex+lip_PBDE_99+
lip_pcb105+mom_age+lip_pcb194.mom_age+lip_pcb105.mom_race, data=InFinalP2)
DropMomAge <- lm(Outcome ~ mom_educ+lip_pcb194+mom_race+child_sex+lip_PBDE_99+
lip_pcb105+lip_pcb187+lip_pcb105.mom_race+lip_pcb187.lip_pcb187.lip_pcb187, data=InFinalP2)
MomEduc <- logLik(FinalModelP2)-logLik(DropMomEduc)
PCB194 <- logLik(FinalModelP2)-logLik(DropPCB194)
MomRace <- logLik(FinalModelP2)-logLik(DropMomRace)
ChildSex <- logLik(FinalModelP2)-logLik(DropChildSex)
PBDE99 <- logLik(FinalModelP2)-logLik(DropPBDE99)
PCB105 <- logLik(FinalModelP2)-logLik(DropPCB105)
179

PCB187 <- logLik(FinalModelP2)-logLik(DropPCB187)
MomAge <- logLik(FinalModelP2)-logLik(DropMomAge)
Per <- c(MomEduc, PCB194, MomRace, ChildSex, PBDE99, PCB105, PCB187, MomAge)/sum(c(MomEduc, PCB194, MomRace,
ChildSex, PBDE99, PCB105, PCB187, MomAge))
round(100*Per,2)
##############################################################################
# Conduct Bootstrap Analysis
##############################################################################
library(utils)
library(lmtest)
source("AnalysisFunctions.r")
RWD <- read.csv("data_05182015.csv", header=TRUE)
###########################
# This boostrap evaluates how often each predictor occurs in the selected model for each bootstrap and returns its delta log
# likelihood values, significance
###########################
B <- 1000
n <- nrow(RWD)
RWD.BootP2 <- vector(mode="list", length=B)
RWD.Index <- vector(mode="list", length=B)
set.seed(99999)
# Generate indices
for (b in 1:B){
index <- sample(1:n,n, replace=TRUE)
RWD.Index[[b]] <- index
}
save(RWD.Index, file="RWD.Index.rda")
for (b in 1:B){
Boot <- RWD[RWD.Index[[b]],]
#Log transform and center and scale predictors
Scaled <-scale(log(Boot[,-c(1:6,29)]))
Preds <- cbind(Boot[,1:5], Scaled)
# Center and Scale outomce
Outcome <- scale(Boot[,"mdi",drop=FALSE])
RWD.BootP2[[b]] <- FindPredsLogL(Outcome, Preds, threshold=0.2, continuous=colnames(Scaled))
save(RWD.BootP2, file="RWD.BootP2.rda")
}
save(RWD.BootP2, file="RWD.BootP2.rda")
############################################
# This bootstrap fits the final model found in analyzing the data in order to assess variation in delta log likelihood et al for this
# specific model
B <- 1000
RWD.Boot.FinalLogP2 <- vector(mode="list", length=B)
RWD.TotalR2Boot.FinalLogP2 <- NA
RWD.DeltaLLByVar.FinalLogP2 <- matrix(nrow=B, ncol=8, dimnames=list(c(1:B), c("mom_educ", "lip_pcb194",
"mom_race","child_sex","lip_PBDE_99","lip_pcb105","lip_pcb187","mom_age")))
180

for (b in 1:B){
Boot <- RWD[RWD.Index[[b]],]
#Log transform and center and scale predictors
Scaled <-scale(log(Boot[,-c(1:6,29)]))
Preds <- cbind(Boot[,1:5], Scaled)
# Center and Scale outomce
Outcome <- scale(Boot[,"mdi",drop=FALSE])
InFinalP2 <- data.frame(Preds[,c("mom_educ", "lip_pcb194",
"mom_race","child_sex","lip_PBDE_99","lip_pcb105","lip_pcb187","mom_age")],
"lip_pcb194:mom_age"=Preds[,"lip_pcb194"]*Preds[,"mom_age"],
"lip_pcb105:mom_race"=Preds[,"lip_pcb105"]*Preds[,"mom_race"],
"lip_pcb187.lip_pcb187.lip_pcb187"=(Preds[,"lip_pcb187"]^3))
FinalModelP2 <- lm(Outcome~., data=InFinalP2)
RWD.TotalR2Boot.FinalLogP2[b] <- summary(FinalModelP2)$r.squared
InModel <- colnames(InFinalP2)
DeltaLL <- sapply(1:length(InModel), function(x) BestLogL(InModel[x], InModel[-c(x)], InFinalP2, Outcome))
colnames(DeltaLL) <- InModel
RWD.Boot.FinalLogP2[[b]] <- DeltaLL
DropMomEduc <- lm(Outcome ~ lip_pcb194+mom_race+child_sex+lip_PBDE_99+
lip_pcb105+lip_pcb187+mom_age+lip_pcb194.mom_age+lip_pcb105.mom_race+lip_pcb187.lip_pcb187.lip_pcb187,
data=InFinalP2)
DropPCB194 <- lm(Outcome ~ mom_educ+mom_race+child_sex+lip_PBDE_99+
lip_pcb105+lip_pcb187+mom_age+lip_pcb105.mom_race+lip_pcb187.lip_pcb187.lip_pcb187, data=InFinalP2)
DropMomRace <- lm(Outcome ~ mom_educ+lip_pcb194+child_sex+lip_PBDE_99+
lip_pcb105+lip_pcb187+mom_age+lip_pcb194.mom_age+lip_pcb187.lip_pcb187.lip_pcb187, data=InFinalP2)
DropChildSex <- lm(Outcome ~ mom_educ+lip_pcb194+mom_race+lip_PBDE_99+
lip_pcb105+lip_pcb187+mom_age+lip_pcb194.mom_age+lip_pcb105.mom_race+lip_pcb187.lip_pcb187.lip_pcb187,
data=InFinalP2)
DropPBDE99 <- lm(Outcome ~ mom_educ+lip_pcb194+mom_race+child_sex+
lip_pcb105+lip_pcb187+mom_age+lip_pcb194.mom_age+lip_pcb105.mom_race+lip_pcb187.lip_pcb187.lip_pcb187,
data=InFinalP2)
DropPCB105 <- lm(Outcome ~ mom_educ+lip_pcb194+mom_race+child_sex+lip_PBDE_99+
lip_pcb187+mom_age+lip_pcb194.mom_age+lip_pcb187.lip_pcb187.lip_pcb187, data=InFinalP2)
DropPCB187 <- lm(Outcome ~ mom_educ+lip_pcb194+mom_race+child_sex+lip_PBDE_99+
lip_pcb105+mom_age+lip_pcb194.mom_age+lip_pcb105.mom_race, data=InFinalP2)
DropMomAge <- lm(Outcome ~ mom_educ+lip_pcb194+mom_race+child_sex+lip_PBDE_99+
lip_pcb105+lip_pcb187+lip_pcb105.mom_race+lip_pcb187.lip_pcb187.lip_pcb187, data=InFinalP2)
MomEduc <- logLik(FinalModelP2)-logLik(DropMomEduc)
PCB194 <- logLik(FinalModelP2)-logLik(DropPCB194)
MomRace <- logLik(FinalModelP2)-logLik(DropMomRace)
ChildSex <- logLik(FinalModelP2)-logLik(DropChildSex)
PBDE99 <- logLik(FinalModelP2)-logLik(DropPBDE99)
PCB105 <- logLik(FinalModelP2)-logLik(DropPCB105)
PCB187 <- logLik(FinalModelP2)-logLik(DropPCB187)
MomAge <- logLik(FinalModelP2)-logLik(DropMomAge)
Per <- c(MomEduc, PCB194, MomRace, ChildSex, PBDE99, PCB105, PCB187, MomAge)/sum(c(MomEduc, PCB194, MomRace,
ChildSex, PBDE99, PCB105, PCB187, MomAge))
RWD.DeltaLLByVar.FinalLogP2[b,] <- Per
181

}
save(RWD.Boot.FinalLogP2, file="RWD.Boot.FinalLogP2.rda")
save(RWD.TotalR2Boot.FinalLogP2, file="RWD.TotalR2Boot.FinalLogP2.rda")
save(RWD.DeltaLLByVar.FinalLogP2, file="RWD.DeltaLLByVar.FinalLogP2.rda")
##############################################################################
# Load bootstrap results for evaluate frequency with which each predictor
# was selected
##############################################################################
B <- 1000
load("RWD.BootP2.rda")
# Get frequency count for each predictor
AllPreds <- unlist(sapply(1:B, function(x) RWD.BootP2[[x]]$results[,"Predictor"]))
PredFreq <- sort(table(AllPreds)/B, decreasing=TRUE)
write.table(PredFreq, "RWD_PredFreqP2.csv", sep=",", col.names=FALSE)
##############################################################################
# Load bootstrap results for evaluate variability in final model
##############################################################################
load("RWD.Boot.FinalLogP2.rda")
load("RWD.TotalR2Boot.FinalLogP2.rda")
load("RWD.DeltaLLByVar.FinalLogP2.rda")
# Calculate % contribution for term each based on delta LogL
TermPerc <- sapply(1:B, function(x) RWD.Boot.FinalLogP2[[x]]["deltaLL",]/sum(RWD.Boot.FinalLogP2[[x]]["deltaLL",]))
rownames(TermPerc) <- colnames(RWD.Boot.FinalLogP2[[1]])
# Get 95% confidence limits for % contribution of each term on delta LogL
round(100*apply(TermPerc,1,quantile, c(0.025, 0.975)),1)
# Get 95% confidence limits for % contribution of each variable on delta LogL
round(100*apply(RWD.DeltaLLByVar.FinalLogP2,2,quantile, c(0.025, 0.975)),1)
###############################################################################
# Confounder Analysis
# 1) Look at change in coefficients of terms in final model with dropping each predictor
# 2) Look at change in coefficients of terms in final model with adding predictors not included in the final model
###############################################################################
FinalCoef <- coef(FinalModelP2)[-c(1)]
n.model <- length(FinalCoef)
#####
# Evaluate all other variables as potential confounders
#####
InFinalP2 <- data.frame(Preds[,c("mom_educ", "lip_pcb194",
"mom_race","child_sex","lip_PBDE_99","lip_pcb105","lip_pcb187","mom_age")],
182

"lip_pcb194:mom_age"=Preds[,"lip_pcb194"]*Preds[,"mom_age"],
"lip_pcb105:mom_race"=Preds[,"lip_pcb105"]*Preds[,"mom_race"],
"lip_pcb187.lip_pcb187.lip_pcb187"=(Preds[,"lip_pcb187"]^3))
FinalModelP2 <- lm(Outcome~., data=InFinalP2)
NotInFinal <- Preds[,!colnames(Preds)%in% c("mom_educ", "lip_pcb194",
"mom_race","child_sex","lip_PBDE_99","lip_pcb105","lip_pcb187","mom_age")]
InModelCoefs <- NULL
NotInModelCoefs <- NULL
for (p in 1:ncol(NotInFinal)){
InModel <- c(colnames(InFinalP2), colnames(NotInFinal)[p])
Final.Form <- as.formula(paste(colnames(Outcome), paste(InModel, collapse="+"), sep="~"))
NewVar <- NotInFinal[, p, drop=FALSE]
Coefs <- coef(lm(Final.Form, data=data.frame(Outcome, InFinalP2, NewVar)))
InModelCoefs <- cbind(InModelCoefs, Coefs[2:(n.model+1)])
NotInModelCoefs <- c(NotInModelCoefs,Coefs[n.model+2])
}
colnames(InModelCoefs) <- colnames(NotInFinal)
InModelCoefChange <- InModelCoefs
CoefChange <- data.frame(Final=coef(FinalModelP2)[-c(1)],DropMomEduc=NA, DropPCB194=NA,
DropMomRace=NA, DropChildSex=NA, DropPBDE99=NA, DropPCB105=NA,DropPCB187=NA, DropMomAge=NA,
InModelCoefChange)
CoefChange[rownames(CoefChange) %in% names(coef(DropMomEduc)),"DropMomEduc"] <- coef(DropMomEduc)[-c(1)]
CoefChange[rownames(CoefChange) %in% names(coef(DropPCB194)),"DropPCB194"] <- coef(DropPCB194)[-c(1)]
CoefChange[rownames(CoefChange) %in% names(coef(DropMomRace)),"DropMomRace"] <- coef(DropMomRace)[-c(1)]
CoefChange[rownames(CoefChange) %in% names(coef(DropChildSex)),"DropChildSex"] <- coef(DropChildSex)[-c(1)]
CoefChange[rownames(CoefChange) %in% names(coef(DropPBDE99)),"DropPBDE99"] <- coef(DropPBDE99)[-c(1)]
CoefChange[rownames(CoefChange) %in% names(coef(DropPCB105)),"DropPCB105"] <- coef(DropPCB105)[-c(1)]
CoefChange[rownames(CoefChange) %in% names(coef(DropPCB187)),"DropPCB187"] <- coef(DropPCB187)[-c(1)]
CoefChange[rownames(CoefChange) %in% names(coef(DropMomAge)),"DropMomAge"] <- coef(DropMomAge)[-c(1)]
write.table(CoefChange, file="RWD_CoefChangeLogP2.csv", col.names=TRUE, sep=",")
PerCoefChange <- matrix(nrow=nrow(CoefChange), ncol=27, dimnames=list(rownames(CoefChange), colnames(CoefChange)[-
c(1)]))
PerCoefChange <- sapply(2:28, function(x) round(100*(CoefChange[,"Final"]-CoefChange[,x])/CoefChange[,"Final"],2))
rownames(PerCoefChange) <- rownames(CoefChange)
colnames(PerCoefChange) <- colnames(CoefChange)[-c(1)]
write.table(PerCoefChange, file="RWD_PerCoefChangeLogP2.csv", col.names=TRUE, sep=",")
##############
# Analyze with significance threshold = 0.05
##############
library(utils)
library(lmtest)
183
library(lattice)
source("AnalysisFunctions.r")
RWD <- read.csv("data_05182015.csv", header=TRUE)
# Log transform continuous exposures
LogCont <- log(RWD[,-c(1:6,29)])
Scaled <- data.frame(scale(LogCont))
Preds <- data.frame(RWD[,1:5], Scaled)
Outcome <- scale(RWD[,"mdi",drop=FALSE])
RWDModelP05 <- FindPredsLogL(Outcome, Preds, threshold=0.05, continuous=colnames(Scaled))
# Get percent contribution of each term and output to file
write.table(data.frame(RWDModelP05$results,
PerTerm=round(100*RWDModelP05$results[,"DeltaLL"]/sum(RWDModelP05$results[,"DeltaLL"]),2)),
file="RWD_FinalModelLogP05_20May2015.csv", sep=",", row.names=FALSE, col.names=TRUE)
InFinalP05 <- data.frame(Preds[,c("mom_educ","lip_pcb194", "mom_race","child_sex","lip_pcb187","lip_pcb105")])
FinalModelP05 <- lm(Outcome~., data=InFinalP05)
# Get percent contribution of each variable
DropMomEduc <- lm(Outcome~lip_pcb194+mom_race+child_sex+lip_pcb187+lip_pcb105,data=InFinalP05)
DropPCB194 <- lm(Outcome~mom_educ+mom_race+child_sex+lip_pcb187+lip_pcb105,data=InFinalP05)
DropMomRace <- lm(Outcome~mom_educ+lip_pcb194+child_sex+lip_pcb187+lip_pcb105,data=InFinalP05)
DropChildSex <- lm(Outcome~mom_educ+lip_pcb194+mom_race+lip_pcb187+lip_pcb105,data=InFinalP05)
DropPCB187 <- lm(Outcome~mom_educ+lip_pcb194+mom_race+child_sex+lip_pcb105,data=InFinalP05)
DropPCB105 <- lm(Outcome~mom_educ+lip_pcb194+mom_race+child_sex+lip_pcb187,data=InFinalP05)
MomEduc <- logLik(FinalModelP05)-logLik(DropMomEduc)
PCB194 <- logLik(FinalModelP05)-logLik(DropPCB194)
MomRace <- logLik(FinalModelP05)-logLik(DropMomRace)
ChildSex <- logLik(FinalModelP05)-logLik(DropChildSex)
PCB187 <- logLik(FinalModelP05)-logLik(DropPCB187)
PCB105 <- logLik(FinalModelP05)-logLik(DropPCB105)
Per <- c(MomEduc,PCB194, MomRace, ChildSex, PCB187, PCB105)/sum(c(MomEduc,PCB194, MomRace, ChildSex, PCB187,
PCB105))
round(100*Per,2)
##############################################################################
# Conduct Bootstrap Analysis
##############################################################################
library(utils)
library(lmtest)
source("AnalysisFunctions.r")
RWD <- read.csv("data_05182015.csv", header=TRUE)
###########################
# This boostrap evaluates how often each predictor occurs in the selected model for each bootstrap and returns its delta log
# likelihood values, significance
###########################
B <- 1000
n <- nrow(RWD)
184

RWD.BootP05 <- vector(mode="list", length=B)
load(file="RWD.Index.rda")
for (b in 1:B){
Boot <- RWD[RWD.Index[[b]],]
#Log transform and center and scale predictors
Scaled <-scale(log(Boot[,-c(1:6,29)]))
Preds <- cbind(Boot[,1:5], Scaled)
# Center and Scale outomce
Outcome <- scale(Boot[,"mdi",drop=FALSE])
RWD.BootP05[[b]] <- FindPredsLogL(Outcome, Preds, threshold=0.05, continuous=colnames(Scaled))
save(RWD.BootP05, file="RWD.BootP05.rda")
}
save(RWD.BootP05, file="RWD.BootP05.rda")
############################################
# This bootstrap fits the final model found in analyzing the data in order to assess variation in delta log likelihood et al for this
# specific model
B <- 1000
RWD.Boot.FinalLogP05 <- vector(mode="list", length=B)
RWD.TotalR2Boot.FinalLogP05 <- NA
RWD.DeltaLLByVar.FinalLogP05 <- matrix(nrow=B, ncol=6, dimnames=list(c(1:B), c("mom_educ","lip_pcb194",
"mom_race","child_sex","lip_pcb187","lip_pcb105")))
set.seed(99999)
for (b in 1:B){
Boot <- RWD[RWD.Index[[b]],]
#Log transform and center and scale predictors
Scaled <-scale(log(Boot[,-c(1:6,29)]))
Preds <- cbind(Boot[,1:5], Scaled)
# Center and Scale outomce
Outcome <- scale(Boot[,"mdi",drop=FALSE])
InFinalP05 <- data.frame(Preds[,c("mom_educ","lip_pcb194", "mom_race","child_sex","lip_pcb187","lip_pcb105")])
FinalModelP05 <- lm(Outcome~., data=InFinalP05)
RWD.TotalR2Boot.FinalLogP05[b] <- summary(FinalModelP05)$r.squared
InModel <- colnames(InFinalP05)
DeltaLL <- sapply(1:length(InModel), function(x) BestLogL(InModel[x], InModel[-c(x)], InFinalP05, Outcome))
colnames(DeltaLL) <- InModel
RWD.Boot.FinalLogP05[[b]] <- DeltaLL
DropMomEduc <- lm(Outcome~lip_pcb194+mom_race+child_sex+lip_pcb187+lip_pcb105,data=InFinalP05)
DropPCB194 <- lm(Outcome~mom_educ+mom_race+child_sex+lip_pcb187+lip_pcb105,data=InFinalP05)
DropMomRace <- lm(Outcome~mom_educ+lip_pcb194+child_sex+lip_pcb187+lip_pcb105,data=InFinalP05)
DropChildSex <- lm(Outcome~mom_educ+lip_pcb194+mom_race+lip_pcb187+lip_pcb105,data=InFinalP05)
DropPCB187 <- lm(Outcome~mom_educ+lip_pcb194+mom_race+child_sex+lip_pcb105,data=InFinalP05)
DropPCB105 <- lm(Outcome~mom_educ+lip_pcb194+mom_race+child_sex+lip_pcb187,data=InFinalP05)
MomEduc <- logLik(FinalModelP05)-logLik(DropMomEduc)
185

PCB194 <- logLik(FinalModelP05)-logLik(DropPCB194)
MomRace <- logLik(FinalModelP05)-logLik(DropMomRace)
ChildSex <- logLik(FinalModelP05)-logLik(DropChildSex)
PCB187 <- logLik(FinalModelP05)-logLik(DropPCB187)
PCB105 <- logLik(FinalModelP05)-logLik(DropPCB105)
Per <- c(MomEduc,PCB194, MomRace, ChildSex, PCB187, PCB105)/sum(c(MomEduc,PCB194, MomRace, ChildSex, PCB187,
PCB105))
RWD.DeltaLLByVar.FinalLogP05[b,] <- Per
}
save(RWD.Boot.FinalLogP05, file="RWD.Boot.FinalLogP05.rda")
save(RWD.TotalR2Boot.FinalLogP05, file="RWD.TotalR2Boot.FinalLogP05.rda")
save(RWD.DeltaLLByVar.FinalLogP05, file="RWD.DeltaLLByVar.FinalLogP05.rda")
##############################################################################
# Load bootstrap results for evaluate frequency with which each predictor
# was selected
##############################################################################
B <- 1000
load("RWD.BootP05.rda")
# Get frequency count for each predictor
AllPreds <- unlist(sapply(1:B, function(x) RWD.BootP05[[x]]$results[,"Predictor"]))
PredFreq <- sort(table(AllPreds)/B, decreasing=TRUE)
write.table(PredFreq, "RWD_PredFreqP05.csv", sep=",", col.names=FALSE)
##############################################################################
# Load bootstrap results for evaluate variability in final model
##############################################################################
load("RWD.Boot.FinalLogP05.rda")
load("RWD.TotalR2Boot.FinalLogP05.rda")
load("RWD.DeltaLLByVar.FinalLogP05.rda")
# Calculate % contribution for term each based on delta LogL
TermPerc <- sapply(1:B, function(x) RWD.Boot.FinalLogP05[[x]]["deltaLL",]/sum(RWD.Boot.FinalLogP05[[x]]["deltaLL",]))
rownames(TermPerc) <- colnames(RWD.Boot.FinalLogP05[[1]])
# Get 95% confidence limits for % contribution of each term on delta LogL
round(100*apply(TermPerc,1,quantile, c(0.025, 0.975)),1)
# Get 95% confidence limits for % contribution of each variable on delta LogL
round(100*apply(RWD.DeltaLLByVar.FinalLogP05,2,quantile, c(0.025, 0.975)),1)
###############################################################################
# Confounder Analysis
# 1) Look at change in coefficients of terms in final model with dropping each predictor
# 2) Look at change in coefficients of terms in final model with adding predictors
# not included in the final model
###############################################################################
186

FinalCoef <- coef(FinalModelP05)[-c(1)]
#####
# Evaluate all other variables as potential confounders
#####
NotInFinal <- Preds[,!colnames(Preds)%in% c("mom_educ","lip_pcb194", "mom_race","child_sex","lip_pcb187","lip_pcb105")]
n.model <- length(FinalCoef)
InModelCoefs <- NULL
NotInModelCoefs <- NULL
for (p in 1:ncol(NotInFinal)){
InModel <- c(colnames(InFinalP05), colnames(NotInFinal)[p])
Final.Form <- as.formula(paste(colnames(Outcome), paste(InModel, collapse="+"), sep="~"))
NewVar <- NotInFinal[, p, drop=FALSE]
Coefs <- coef(lm(Final.Form, data=data.frame(Outcome, InFinalP05, NewVar)))
InModelCoefs <- cbind(InModelCoefs, Coefs[2:(n.model+1)])
NotInModelCoefs <- c(NotInModelCoefs,Coefs[n.model+2])
}
colnames(InModelCoefs) <- colnames(NotInFinal)
InModelCoefChange <- InModelCoefs
CoefChange <- data.frame(Final=FinalCoef,DropMomEduc=NA, DropPCB194=NA,
DropMomRace=NA, DropChildSex=NA, DropPCB187=NA, DropPCB105=NA,InModelCoefChange)
CoefChange[rownames(CoefChange) %in% names(coef(DropMomEduc)),"DropMomEduc"] <- coef(DropMomEduc)[-c(1)]
CoefChange[rownames(CoefChange) %in% names(coef(DropPCB194)),"DropPCB194"] <- coef(DropPCB194)[-c(1)]
CoefChange[rownames(CoefChange) %in% names(coef(DropMomRace)),"DropMomRace"] <- coef(DropMomRace)[-c(1)]
CoefChange[rownames(CoefChange) %in% names(coef(DropChildSex)),"DropChildSex"] <- coef(DropChildSex)[-c(1)]
CoefChange[rownames(CoefChange) %in% names(coef(DropPCB187)),"DropPCB187"] <- coef(DropPCB187)[-c(1)]
CoefChange[rownames(CoefChange) %in% names(coef(DropPCB105)),"DropPCB105"] <- coef(DropPCB105)[-c(1)]
write.table(CoefChange, file="RWD_CoefChangeLogP05.csv", col.names=TRUE, sep=",")
PerCoefChange <- matrix(nrow=nrow(CoefChange), ncol=27, dimnames=list(rownames(CoefChange), colnames(CoefChange)[-
c(1)]))
PerCoefChange <- sapply(2:28, function(x) round(100*(CoefChange[,"Final"]-CoefChange[,x])/CoefChange[,"Final"],2))
rownames(PerCoefChange) <- rownames(CoefChange)
colnames(PerCoefChange) <- colnames(CoefChange)[-c(1)]
write.table(PerCoefChange, file="RWD_PerCoefChangeLogP05.csv", col.names=TRUE, sep=",")
################################################################################
# AnalysisFunctions.r
# FUNCTIONS USED TO IMPLEMENT ANALYSIS APPROACH
################################################################################
# Main function used to process the data
187

# outcome is a matrix or data.frame of the outcome. Must have a column name
# predictors is a data.frame or matrix of the predictors
# threshold is the significance level required for predictors to be included in the model
# continuous is a character vector of the continuous predictors
# include is a character vector of variables to include in every model
FindPredsLogL <- function(outcome, predictors, threshold, continuous, include=NULL){
Corr <- Correlate(outcome, predictors, include)
pos.name <- Corr$pos
neg.name <- Corr$neg
pos.main <- LinearLogL(Y=outcome, Preds=predictors, Thresh=threshold, include, consider=pos.name)
pos.main.name <- NULL
if(!is.null(pos.main)){pos.main.name <- as.character(pos.main$result[,"Predictor"])}
if (!is.null(include)){pos.main.name <- pos.main.name[!(pos.main.name %in% include)]}
if(length(pos.main.name)==0){pos.main.name <- NULL}
neg.main <- LinearLogL(outcome, predictors, Thresh=threshold, include, consider=neg.name)
neg.main.name <- NULL
if(!is.null(neg.main)){neg.main.name <- as.character(neg.main$result[,"Predictor"])}
if(!is.null(include)){neg.main.name <- neg.main.name[!(neg.main.name %in% include)]}
if(length(neg.main.name)==0){neg.main.name <- NULL}
if ((is.null(pos.main.name))&(is.null(neg.main.name))){
stop("No significant main effects. Try changing significance threshold.")
} else {
if (length(c(pos.main.name, neg.main.name, include))==1){
main.fit <- LinearLogL(Y=outcome, Preds=predictors, Thresh=threshold, include, consider=c(pos.main.name,
neg.main.name))
return(main.fit)
} else {
all.inter <- InteractLogL(outcome, predictors, Thresh=threshold, main.effects=c(pos.main.name, neg.main.name, include),
include)
all.inter.name <- as.character(all.inter$result[,"Predictor"])
current.form <- as.formula(paste(colnames(outcome), paste(all.inter.name, collapse="+"), sep="~"))
current.fit <- lm(current.form, data=data.frame(outcome, predictors))
if (summary(current.fit)$r.square==1){
return(all.inter)
} else if (any(c(pos.main.name, neg.main.name) %in% continuous)) {
higher.terms <- HigherLogL(outcome, predictors, Thresh=threshold, main.effects=c(pos.main.name, neg.main.name,
include),
include=all.inter.name, continuous)
return(higher.terms)
} else {
return(all.inter)
}
}
}
}
# Get correlations between outcome and each predictor.
# Separate into positively and negatively correlated predictors
Correlate <- function(outcome, predictors, include){
# drop include variables from correlation evaluation
predictors <- predictors[,!(colnames(predictors) %in% include)]
Corrs <- sapply(1:ncol(predictors), function(x) cor(outcome, predictors[,x], method="spearman"))
188

names(Corrs) <- colnames(predictors)
# Split predictors into two groups - positive and negative correlation
pos.pred <- names(Corrs)[Corrs > 0]
neg.pred <- names(Corrs)[Corrs < 0]
ans <- list(pos=pos.pred, neg=neg.pred)
return(ans)
}
# This function processes through all the variables in Preds or all the variables
# listed in consider and sequentially adds predictors to the model until all variables
# are added or no additional variables meet the threshold of significance.
# Y is a matrix or data.frame of the outcome. Must have a column name
# Preds is a data.frame or matrix of the predictors
# Thresh is the significance threshold required for predictors to be included in the model
# include is a character vector of variaables to include in every model
# consider is a character vector of variables to evaluate
LinearLogL <- function(Y, Preds, Thresh, include=NULL, consider=NULL){
if (is.null(consider)){
Data <- as.data.frame(Preds)
} else {
Data <- as.data.frame(Preds[ ,colnames(Preds) %in% c(consider, include), drop=FALSE])
}
InModel <- include
n.pred <- ncol(Data)
# Sequentially add predictors based on increasing the likelihood and significance of LRT tests
for (i in 1:n.pred){
PredIn <- Data[,colnames(Data) %in% InModel, drop=FALSE]
PredLeft <- Data[,!(colnames(Data) %in% InModel), drop=FALSE]
n.left <- ncol(PredLeft)
# Sequentially add each predictor and retain one with highest change in likelihood
# subject to significance less than threhold
bestLogL <- sapply(1:n.left, function(x) BestLogL(colnames(PredLeft)[x], colnames(PredIn), Data, Y))
if (min(bestLogL[1,]) < Thresh){
NextIn <- colnames(PredLeft)[which.max(bestLogL[2,])]
InModel <- c(InModel, NextIn)
Current.Form <- as.formula(paste(colnames(Y), paste(InModel, collapse="+"), sep="~"))
Current.Fit <- lm(Current.Form, data=data.frame(Y,Data))
} else {
break
}
if(summary(Current.Fit)$r.squared==1){
break
}
}
if (is.null(InModel)){
ans <- NULL
} else {
# Fit model with selected predictors
Final.Form <- as.formula(paste(colnames(Y), paste(InModel, collapse="+"), sep="~"))
Final.Fit <- lm(Final.Form, data=data.frame(Y,Data))
Int.Fit <- lm(as.formula(paste(colnames(Y), "1", sep="~")), data=data.frame(Y))
189
R.squared <- summary(Final.Fit)$r.squared
# Get change in likelihood values for each predictor in the final model, given
# other predictors in the model
DeltaLL <- sapply(1:length(InModel), function(x) BestLogL(InModel[x], InModel[-c(x)], Data, Y))
colnames(DeltaLL) <- InModel
Estimate=coef(Final.Fit)[-c(1)]
out <- data.frame(Predictor=names(Estimate), Estimate, Tstat.P=summary(Final.Fit)$coef[-c(1),"Pr(>|t|)"],
LRT.Pvalue=DeltaLL[1,match(names(Estimate), colnames(DeltaLL))], DeltaLL=DeltaLL[2,match(names(Estimate),
colnames(DeltaLL))])
ans <- list(results=out, total.r2=R.squared, Full.LogL=logLik(Final.Fit), Intercept.Logl=logLik(Int.Fit))
}
return(ans)
}
# This function returns the change in likelihood and the p-value from a likelihood ratio test for adding "target" to a model
# containing "covariate"
# target (character vector) is the name of a predictor to be tested
# covariate is a character vector of the names of predictors already in a model. Can be null
# Data is a data.frame containing the target, covariate and Response
# Response is a data.frame or matrix of the outcome. Must have column name
BestLogL <- function(target, covariate, Data, Response){
if ((length(covariate)==0)|is.null(covariate)){
One.Form <- as.formula(paste(colnames(Response), paste(target, collapse="+"), sep="~"))
Target.fit <- lm(One.Form, data=data.frame(Response,Data))
Cov.fit <- lm(as.formula(paste(colnames(Response), "1", sep="~")),data=data.frame(Response,Data))
} else {
Cov.Form <- as.formula(paste(colnames(Response), paste(covariate, collapse="+"), sep="~"))
Cov.fit <- lm(Cov.Form, data=data.frame(Response,Data))
Target.Form <- as.formula(paste(colnames(Response), paste(c(covariate, target), collapse="+"), sep="~"))
Target.fit <- lm(Target.Form, data=data.frame(Response,Data))
}
Pvalue <- lrtest(Cov.fit, Target.fit)[2,5]
deltaLL <- as.numeric(logLik(Target.fit)-logLik(Cov.fit))
ans <- c(p.value=Pvalue, deltaLL=deltaLL)
return(ans)
}
# This function evaluates all two-way interaction terms among given main effects
# Y is a data.frame or matrix of the outcome. Must have column name
# Preds is a data.frame or matrix of the predictors
# Thresh is the significance threshold required for predictors to be included in the model
# main.effects is a character vector of the main effects to be included in the
# model and evaluated for interactions
# include is a character vector of variaables to include in every model
InteractLogL <- function(Y, Preds, Thresh, main.effects, include=NULL){
InModel <- c(main.effects, include)
Data <- as.data.frame(Preds[ ,colnames(Preds) %in% InModel, drop=FALSE])
InterVar <- combn(main.effects, 2, FUN=Interact)
# drop interactions between the "include" variables if include is not null and more than 1 variable
if (!is.null(include)&(length(include) > 1)){
190

# This is how many interactions there are for the include variables
n.inc.inter <- choose(length(include),2)
# drop these from the end of the InterVar vector
InterVar <- InterVar[1:(length(InterVar)-n.inc.inter)]
}
AllVar <- c(InModel, InterVar)
n.inter <- length(InterVar)
for (i in 1:n.inter){
VarIn <- AllVar[AllVar %in% InModel]
n.left <- length(AllVar)-length(VarIn)
InterLeft <- InterVar[!(InterVar %in% VarIn)]
inner.Logl <- sapply(1:n.left, function(x) BestLogL(InterLeft[x], VarIn, Data, Y))
if (min(inner.Logl["p.value",]) < Thresh){
NextIn <- InterLeft[which.max(inner.Logl["deltaLL",])]
InModel <- c(InModel, NextIn)
Current.Form <- as.formula(paste(colnames(Y), paste(InModel, collapse="+"), sep="~"))
Current.Fit <- lm(Current.Form, data=data.frame(Y,Data))
} else {
break
}
if(summary(Current.Fit)$r.squared==1){
break
}
}
Final.Form <- as.formula(paste(colnames(Y), paste(InModel, collapse="+"), sep="~"))
Final.Fit <- lm(Final.Form, data=data.frame(Y,Data))
Int.Fit <- lm(as.formula(paste(colnames(Y), "1", sep="~")), data=data.frame(Y))
R.squared <- summary(Final.Fit)$r.squared
# Get change in likelihood values for each predictor in the final model, given
# other predictors in the model
DeltaLL <- sapply(1:length(InModel), function(x) BestLogL(InModel[x], InModel[-c(x)], Data, Y))
colnames(DeltaLL) <- InModel
Estimate=coef(Final.Fit)[-c(1)]
out <- data.frame(Predictor=names(Estimate), Estimate, Tstat.P=summary(Final.Fit)$coef[-
c(1),"Pr(>|t|)"],LRT.Pvalue=DeltaLL[1,match(names(Estimate),
colnames(DeltaLL))], DeltaLL=DeltaLL[2,match(names(Estimate), colnames(DeltaLL))])
ans <- list(results=out, total.r2=R.squared, Full.LogL=logLik(Final.Fit), Intercept.Logl=logLik(Int.Fit))
return(ans)
}
# This function will evaluate quadratic and cubic terms of continuous main effects
# Y is a data.frame or matrix of the outcome. Must have column name
# Preds is a data.frame or matrix of the predictors
# Thresh is the significance threshold required for predictors to be included in the model
# main.effects is a character vector of the main effects to be included in the model and evaluated for interactions
# include is a character vector of variables to include in every model
# continuous is a character vector indicating which predictors are continuous and that there will be evaluated for quadratic and
# cubic effects
HigherLogL <- function(Y, Preds, Thresh, main.effects, include, continuous){
InModel <- include
# Consider squared terms of continous main effects
191

ToSquare <- main.effects[main.effects %in% continuous]
SqPreds <- Preds[,colnames(Preds) %in% ToSquare, drop=FALSE]^2
SqVar <- sapply(1:ncol(SqPreds), function(x) paste(c(colnames(SqPreds)[x],colnames(SqPreds)[x]), collapse=".", sep=""))
colnames(SqPreds) <- SqVar
n.sq <- length(SqVar)
AllVar <- c(InModel, SqVar)
Data <- data.frame(Preds[,colnames(Preds) %in% InModel], SqPreds)
for (i in 1:n.sq){
VarIn <- AllVar[AllVar %in% InModel]
n.left <- length(AllVar)-length(VarIn)
SqLeft <- SqVar[!(SqVar %in% VarIn)]
inner.LogL <- sapply(1:n.left, function(x) BestLogL(SqLeft[x], VarIn, Data, Y))
if (min(inner.LogL["p.value",]) < Thresh){
NextIn <- SqLeft[which.max(inner.LogL["deltaLL",])]
InModel <- c(InModel, NextIn)
Current.Form <- as.formula(paste(colnames(Y), paste(InModel, collapse="+"), sep="~"))
Current.Fit <- lm(Current.Form, data=data.frame(Y,Data))
if(summary(Current.Fit)$r.squared==1){
break
}
} else {
Current.Form <- as.formula(paste(colnames(Y), paste(InModel, collapse="+"), sep="~"))
Current.Fit <- lm(Current.Form, data=data.frame(Y,Data))
break
}
}
# Exits function if we get to an R squared of 1 with the quadratic terms.
if(summary(Current.Fit)$r.squared==1){
Final.Form <- as.formula(paste(colnames(Y), paste(InModel, collapse="+"), sep="~"))
Final.Fit <- lm(Final.Form, data=data.frame(Y,Data))
Int.Fit <- lm(as.formula(paste(colnames(Y), "1", sep="~")), data=data.frame(Y))
R.squared <- summary(Final.Fit)$r.squared
DeltaLL <- sapply(1:length(InModel), function(x) BestLogL(InModel[x], InModel[-c(x)], Data, Y))
colnames(DeltaLL) <- InModel
Estimate=coef(Final.Fit)[-c(1)]
out <- data.frame(Predictor=names(Estimate), Estimate, Tstat.P=summary(Final.Fit)$coef[-c(1),"Pr(>|t|)"],
LRT.Pvalue=DeltaLL[1,match(names(Estimate), colnames(DeltaLL))], DeltaLL=DeltaLL[2,match(names(Estimate),
colnames(DeltaLL))])
out <- out[order(out[,"DeltaLL"], decreasing=TRUE),]
ans <- list(results=out, total.r2=R.squared, Full.LogL=logLik(Final.Fit), Intercept.Logl=logLik(Int.Fit))
return(ans)
} else {
# Consider cubic terms of continous main effects
ToCube <- main.effects[main.effects %in% continuous]
CubicPreds <- Preds[,colnames(Preds) %in% ToCube, drop=FALSE]^3
CubicVar <- sapply(1:ncol(CubicPreds), function(x)
paste(c(colnames(CubicPreds)[x],colnames(CubicPreds)[x],colnames(CubicPreds)[x]), collapse=".", sep=""))
192
colnames(CubicPreds) <- CubicVar
n.cubic <- length(CubicVar)
AllVar <- c(InModel, CubicVar)
Data <- data.frame(Data[,colnames(Data) %in% InModel], CubicPreds)
# This is currently written to allow consideration of cubic terms for all main effects regardless of whether there is a quadratic
# term
for (i in 1:n.cubic){
VarIn <- AllVar[AllVar %in% InModel]
n.left <- length(AllVar)-length(VarIn)
CubicLeft <- CubicVar[!(CubicVar %in% VarIn)]
inner.LogL <- sapply(1:n.left, function(x) BestLogL(CubicLeft[x], VarIn, Data, Y))
if (min(inner.LogL["p.value",]) < Thresh){
NextIn <- CubicLeft[which.max(inner.LogL["deltaLL",])]
InModel <- c(InModel, NextIn)
Current.Form <- as.formula(paste(colnames(Y), paste(InModel, collapse="+"), sep="~"))
Current.Fit <- lm(Current.Form, data=data.frame(Y,Data))
if(summary(Current.Fit)$r.squared==1){
break
}
} else {
break
}
}
}
Final.Form <- as.formula(paste(colnames(Y), paste(InModel, collapse="+"), sep="~"))
Final.Fit <- lm(Final.Form, data=data.frame(Y,Data))
Int.Fit <- lm(as.formula(paste(colnames(Y), "1", sep="~")), data=data.frame(Y))
R.squared <- summary(Final.Fit)$r.squared
DeltaLL <- sapply(1:length(InModel), function(x) BestLogL(InModel[x], InModel[-c(x)], Data, Y))
colnames(DeltaLL) <- InModel
Estimate=coef(Final.Fit)[-c(1)]
out <- data.frame(Predictor=names(Estimate), Estimate, Tstat.P=summary(Final.Fit)$coef[-c(1),"Pr(>|t|)"],
LRT.Pvalue=DeltaLL[1,match(names(Estimate), colnames(DeltaLL))], DeltaLL=DeltaLL[2,match(names(Estimate),
colnames(DeltaLL))])
out <- out[order(out[,"DeltaLL"], decreasing=TRUE),]
ans <- list(results=out, total.r2=R.squared, Full.LogL=logLik(Final.Fit), Intercept.Logl=logLik(Int.Fit))
return(ans)
}
# Create a character vector of 2-way interactions
Interact <- function(A){
return(paste(A, collapse=":", sep=""))
}
193

24. Analyzing Mixtures in Epidemiology Data by Smoothing in
Exposure Space Presenting Author: Veronica Vieira
Organization: Boston University
Contributing Authors: Thomas F. Webster, Veronica M. Vieira
Code:
# NIEHS synthetic data set 1
# Vieira & Webster
# model: Y~lo(X1,X5,X4,X7,span=S*0.05)+Z
# set up to plot slice X7-X1 (figure 2 of abstract)
#####################################################################################
#
##### colormap function from MapGAM package
colormap <-
function(modgamobj, map=NULL, add=F, contours="none", mapmin=NULL, mapmax=NULL,
arrow=T, axes=F, ptsize=0.9, alpha=0.05) {
if (!is.null(modgamobj$OR)) fitvals=modgamobj$OR else fitvals=modgamobj$fit
results = cbind(modgamobj$grid,fitvals)
if (!is.null(modgamobj$pointwise)) results = cbind(results,modgamobj$pointwise)
if (is.null(mapmin)) mapmin=min(results[,3])
if (is.null(mapmax)) mapmax=max(results[,3])
if (!is.null(map)) {
if (add==T) {add=F; warning("add=T ignored because the map argument was used")}
if (class(map)=="map") maprange = map$range else
if (class(map)=="SpatialPolygonsDataFrame") {
mapcenter = apply(bbox(map),1,mean)
center2edges = c(-1,1)*max(apply(bbox(map),1,diff))/2
maprange = c(mapcenter[1]+center2edges,mapcenter[2]+center2edges)
} else
maprange = c(Inf,-Inf,Inf,-Inf)
}
dataXmin=min(results[,1],if(!is.null(map)) maprange[1])
dataXmax=max(results[,1],if(!is.null(map)) maprange[2])
dataYmin=min(results[,2],if(!is.null(map)) maprange[3])
dataYmax=max(results[,2],if(!is.null(map)) maprange[4])
offsetX=(dataXmax-dataXmin)/5
offsetY=(dataYmax-dataYmin)/5
qu = seq(mapmin,mapmax,length=2251)
cp = rainbow(2252,start=0,end=0.66)
194

col.seq = rev(cp)
grad = cut(results[,3],breaks=c(0,qu,Inf),labels=F)
par(xpd=TRUE)
if (add==T) points(modgamobj$grid,col=col.seq[grad],pch=15,cex=ptsize) else
if (axes==F) {
par(mai=c(0,0.35,0.7,0.35))
plot(modgamobj$grid,col=col.seq[grad],pch=15,cex=ptsize,type="p",
xlim=c(dataXmin-0.4*offsetX,dataXmax+0.4*offsetX),
ylim=c(dataYmin-0.8*offsetY,dataYmax),ann=F,axes=F)
} else
if (axes==T) {
# par(mai=c(1.52,0.82,0.82,1.42))
par(mai=c(1,0.82,1,0.5))
plot(modgamobj$grid,col=col.seq[grad],pch=15,cex=ptsize,type="p",
xlab="", xaxt="n")
axis(3)
mtext(names(modgamobj$grid[1]), side=3, line=3)
}
if (!is.null(map)) {
if (class(map)=="SpatialPolygonsDataFrame") plot(map, border=gray(0.3), add=T) else {
if (class(map)!="map") warning("map class not recognized--attempting generic
plot")
lines(map,col=gray(0.3),type="l")
}
}
# CONTOUR LINES / ISOBOLES
if (contours=="permrank" && dim(results)[2] < 4) {
warning("permrank contours omitted because permute=0 in modgam")
contours = "none"
}
if (contours!="none") { # if contour lines should be drawn
if (contours=="response") concol=3 else
if (contours=="permrank") concol=4 else
stop("contours type not recognized")
df=cbind(results[(order(results[,2])),1:2],results[(order(results[,2])),concol])
cx=as.matrix(unique(df[(order(df[,1])),1]))
cy=as.matrix(unique(df[,2]))
cz=as.matrix(reshape(df,v.names=names(df)[3],idvar=names(df)[1],
timevar=names(df)[2],direction="wide")[,-1])
cz=cz[order(unique(df[,1])),]
if (contours=="response") contour(x=cx, y=cy, z=cz, add=TRUE)
195
if (contours=="permrank") contour(x=cx, y=cy, z=cz, add=TRUE,
levels=c(alpha/2,1-alpha/2), drawlabels=FALSE, lwd=3, lty="twodash")
}
# LEGEND
if (!is.null(modgamobj$OR)) leglab = "Odds Ratios" else leglab = "Predicted Values"
if (!is.null(modgamobj$m)) leglab = paste(modgamobj$m,leglab)
fY = 0.5 + 0.5*(axes==T)
ypos = dataYmin-fY*offsetY
len = (dataXmax-dataXmin)*7/12
points(dataXmin+(1:2252*len/2252),rep(ypos,2252),cex=1.6,col=cp[2253-1:2252],pch=15)
if (!is.null(modgamobj$OR)) points(dataXmin+len*(1-mapmin)/(mapmax-mapmin),
ypos,cex=.8,col="black", pch="|", lwd=2) # only add line at 1 for ORs
text(x=dataXmin,y=ypos,pos=1,labels=format(round(mapmin,2),digits=3),cex=.8)
text(x=dataXmin+len,y=ypos,pos=1,labels=format(round(mapmax,2),digits=3),cex=.8)
if (!is.null(modgamobj$OR)) text(x=dataXmin+len*(1-mapmin)/(mapmax-mapmin),
y=ypos,pos=1,labels="1.00",cex=.8) # only add line at 1 for ORs
text(x=dataXmin+len/2,y=ypos,pos=3,labels=leglab,cex=1)
# NORTH ARROW
if (arrow) {
points(dataXmax,dataYmin-0.65*offsetY,cex=1.2,col="black", pch="|", lwd=2)
points(dataXmax-0.01*offsetX,ypos,col="black", bg="black", pch=24)
text(x=dataXmax,y=ypos,"N",cex=1,pos=3)
}
# SCALE BAR
if (is.null(map)==F & class(map)=="SpatialPolygonsDataFrame") {
d = 0.17*(dataXmax - dataXmin)
d = signif(d,1)
leftedge = dataXmin+1.125*len
lines(c(leftedge,leftedge+d),c(ypos,ypos),col="black",lwd=3)
points(leftedge,ypos,cex=1.2,col="black", pch="|", lwd=2)
points(leftedge+d,ypos,cex=1.2,col="black",pch="|",lwd=2)
if (d>=1000) {scdist=d/1000; units="km"} else {scdist=d; units="m"}
sclab = paste(as.character(format(scdist,digits=2)),units)
text(x=leftedge+0.5*d,y=ypos,sclab,cex=0.8,pos=1)
}
}
#####################################################################################
#
# main program
196

library(gam)
# read data (need to specify name of the data file here)
datafile <-"" #insert name
d1=read.table(datafile, header=TRUE)
# estimate optimum span for gam
span.aic = matrix(ncol=1,nrow=19)
for (S in 1:19) {
fit=gam(Y~lo(X1,X5,X4,X7,span=S*0.05)+Z, data=d1)
span.aic[S,1]=fit$aic
cat(paste("The AIC for span=",format(S*0.05,nsmall=2)," is ",format(fit$aic,nsmall=2),".",
sep=""),fill=TRUE)
}
spc=which(span.aic[,1]==min(span.aic[,1]))*0.05
cat(paste("The span that minimizes the AIC is ",format(spc,nsmall=2),".", sep=""),fill=TRUE)
# use gam to estimate response surface
# set up here with sp=0.3 for these data
gm1=gam(Y~lo(X1,X4,X5,X7, span=0.3) +Z, data=d1)
# compute response surface onset on the two-dimensional slice X7-X1. Use means for other exposures.
grid=as.data.frame(expand.grid(X7=seq(min(d1$X7),max(d1$X7),len=100),X1=seq(min(d1$X1),max(d1$
X1),len=100)))
grid$X4=mean(d1$X4)
grid$X5=mean(d1$X5)
grid$Z=1
fitgm1=as.vector(predict.gam(gm1,grid))
outgm1= list(grid = grid[,1:2], fit=fitgm1)
# output "map" of X7-X1 slice, showing location of data points
colormap(outgm1,contours="response", arrow=FALSE, axes=TRUE)
points(d1$X7,d1$X1,pch=20)
# NIEHS synthetic data set 2
# Vieira & Webster
# model: Y~lo(X1,X4,X6,X10,X12,X14,Z2, span=0.95) +Z3
# set up to plot slice X1-X6 (Figure 1 of abstract)
#####################################################################################
#
197

##### colormap function from MapGAM package
colormap <-
function(modgamobj, map=NULL, add=F, contours="none", mapmin=NULL, mapmax=NULL,
arrow=T, axes=F, ptsize=0.9, alpha=0.05) {
if (!is.null(modgamobj$OR)) fitvals=modgamobj$OR else fitvals=modgamobj$fit
results = cbind(modgamobj$grid,fitvals)
if (!is.null(modgamobj$pointwise)) results = cbind(results,modgamobj$pointwise)
if (is.null(mapmin)) mapmin=min(results[,3])
if (is.null(mapmax)) mapmax=max(results[,3])
if (!is.null(map)) {
if (add==T) {add=F; warning("add=T ignored because the map argument was used")}
if (class(map)=="map") maprange = map$range else
if (class(map)=="SpatialPolygonsDataFrame") {
mapcenter = apply(bbox(map),1,mean)
center2edges = c(-1,1)*max(apply(bbox(map),1,diff))/2
maprange = c(mapcenter[1]+center2edges,mapcenter[2]+center2edges)
} else
maprange = c(Inf,-Inf,Inf,-Inf)
}
dataXmin=min(results[,1],if(!is.null(map)) maprange[1])
dataXmax=max(results[,1],if(!is.null(map)) maprange[2])
dataYmin=min(results[,2],if(!is.null(map)) maprange[3])
dataYmax=max(results[,2],if(!is.null(map)) maprange[4])
offsetX=(dataXmax-dataXmin)/5
offsetY=(dataYmax-dataYmin)/5
qu = seq(mapmin,mapmax,length=2251)
cp = rainbow(2252,start=0,end=0.66)
col.seq = rev(cp)
grad = cut(results[,3],breaks=c(0,qu,Inf),labels=F)
par(xpd=TRUE)
if (add==T) points(modgamobj$grid,col=col.seq[grad],pch=15,cex=ptsize) else
if (axes==F) {
par(mai=c(0,0.35,0.7,0.35))
plot(modgamobj$grid,col=col.seq[grad],pch=15,cex=ptsize,type="p",
xlim=c(dataXmin-0.4*offsetX,dataXmax+0.4*offsetX),
ylim=c(dataYmin-0.8*offsetY,dataYmax),ann=F,axes=F)
} else
if (axes==T) {
# par(mai=c(1.52,0.82,0.82,1.42))
par(mai=c(1,0.82,1,0.5))
plot(modgamobj$grid,col=col.seq[grad],pch=15,cex=ptsize,type="p",
xlab="", xaxt="n")
198

axis(3)
mtext(names(modgamobj$grid[1]), side=3, line=3)
}
if (!is.null(map)) {
if (class(map)=="SpatialPolygonsDataFrame") plot(map, border=gray(0.3), add=T) else {
if (class(map)!="map") warning("map class not recognized--attempting generic
plot")
lines(map,col=gray(0.3),type="l")
}
}
# CONTOUR LINES / ISOBOLES
if (contours=="permrank" && dim(results)[2] < 4) {
warning("permrank contours omitted because permute=0 in modgam")
contours = "none"
}
if (contours!="none") { # if contour lines should be drawn
if (contours=="response") concol=3 else
if (contours=="permrank") concol=4 else
stop("contours type not recognized")
df=cbind(results[(order(results[,2])),1:2],results[(order(results[,2])),concol])
cx=as.matrix(unique(df[(order(df[,1])),1]))
cy=as.matrix(unique(df[,2]))
cz=as.matrix(reshape(df,v.names=names(df)[3],idvar=names(df)[1],
timevar=names(df)[2],direction="wide")[,-1])
cz=cz[order(unique(df[,1])),]
if (contours=="response") contour(x=cx, y=cy, z=cz, add=TRUE)
if (contours=="permrank") contour(x=cx, y=cy, z=cz, add=TRUE,
levels=c(alpha/2,1-alpha/2), drawlabels=FALSE, lwd=3, lty="twodash")
}
# LEGEND
if (!is.null(modgamobj$OR)) leglab = "Odds Ratios" else leglab = "Predicted Values"
if (!is.null(modgamobj$m)) leglab = paste(modgamobj$m,leglab)
fY = 0.5 + 0.5*(axes==T)
ypos = dataYmin-fY*offsetY
len = (dataXmax-dataXmin)*7/12
points(dataXmin+(1:2252*len/2252),rep(ypos,2252),cex=1.6,col=cp[2253-1:2252],pch=15)
if (!is.null(modgamobj$OR)) points(dataXmin+len*(1-mapmin)/(mapmax-mapmin),
ypos,cex=.8,col="black", pch="|", lwd=2) # only add line at 1 for ORs
text(x=dataXmin,y=ypos,pos=1,labels=format(round(mapmin,2),digits=3),cex=.8)
text(x=dataXmin+len,y=ypos,pos=1,labels=format(round(mapmax,2),digits=3),cex=.8)
199

if (!is.null(modgamobj$OR)) text(x=dataXmin+len*(1-mapmin)/(mapmax-mapmin),
y=ypos,pos=1,labels="1.00",cex=.8) # only add line at 1 for ORs
text(x=dataXmin+len/2,y=ypos,pos=3,labels=leglab,cex=1)
# NORTH ARROW
if (arrow) {
points(dataXmax,dataYmin-0.65*offsetY,cex=1.2,col="black", pch="|", lwd=2)
points(dataXmax-0.01*offsetX,ypos,col="black", bg="black", pch=24)
text(x=dataXmax,y=ypos,"N",cex=1,pos=3)
}
# SCALE BAR
if (is.null(map)==F & class(map)=="SpatialPolygonsDataFrame") {
d = 0.17*(dataXmax - dataXmin)
d = signif(d,1)
leftedge = dataXmin+1.125*len
lines(c(leftedge,leftedge+d),c(ypos,ypos),col="black",lwd=3)
points(leftedge,ypos,cex=1.2,col="black", pch="|", lwd=2)
points(leftedge+d,ypos,cex=1.2,col="black",pch="|",lwd=2)
if (d>=1000) {scdist=d/1000; units="km"} else {scdist=d; units="m"}
sclab = paste(as.character(format(scdist,digits=2)),units)
text(x=leftedge+0.5*d,y=ypos,sclab,cex=0.8,pos=1)
}
}
#####################################################################################
#
# main program
library(gam)
# read data (need to specify name of the data file here)
datafile <-"" #insert name
d1=read.table(datafile, header=TRUE)
# estimate optimum span for gam
span.aic = matrix(ncol=1,nrow=19)
for (S in 1:19) {
fit=gam(Y~lo(X1,X4,X6,X10,X12,X14,Z2, span=S*0.05)+Z3, data=d1)
span.aic[S,1]=fit$aic
cat(paste("The AIC for span=",format(S*0.05,nsmall=2)," is ",format(fit$aic,nsmall=2),".",
sep=""),fill=TRUE)
200

}
spc=which(span.aic[,1]==min(span.aic[,1]))*0.05
cat(paste("The span that minimizes the AIC is ",format(spc,nsmall=2),".", sep=""),fill=TRUE)
# use gam to estimate response surface
# set up here with sp=0.95 for these data
gm1=gam(Y~lo(X1,X4,X6,X10,X12,X14,Z2, span=0.95) +Z3, data=d1)
# compute response surface onset on the two-dimensional slice X1-X6. Use means for other exposures.
grid=as.data.frame(
expand.grid(X1=seq(min(d1$X1),max(d1$X1),len=100),X6=seq(min(d1$X6),max(d1$X6),len=100)))
grid$X4=mean(d1$X4)
grid$X10=mean(d1$X10)
grid$X12=mean(d1$X12)
grid$X14=mean(d1$X14)
grid$Z2=mean(d1$Z2)
grid$Z3=0
fitgm1=as.vector(predict.gam(gm1,grid))
outgm1= list(grid = grid[,1:2], fit=fitgm1)
# output "map" of X1-X6 slice, showing location of data points
colormap(outgm1,contours="response", arrow=FALSE, axes=TRUE)
points(d1$X1,d1$X6,pch=20)
#### NIEHS realworld data analysis using R package MapGAM 0.7-5
# 2 dimensional smooth with optimal span
# Webster
# model: Y~lo(X1, X2,span=optimalspan)+gamma'Z
# Requires setting up a datafile (as specified below) to have
# the desired two exposures and three Z variables for adjustment
########################################################
library(MapGAM)
# DIRECTORIES & DATAFILES
mydir <-"" #insert name of directory
datafile <-"" #insert name of data file
casenumber<-"1" #insert name
# specify size of grid size
nside=100
pointsize=0.9
201

# READ DATA
# assumed to be of the form y, x1, x2, z1, z2, z3
# column 1 = outcome
# column 2 = exposure variable x1 to include in smooth
# column 3 = exposure variable x2 to include in smooth
# column 4-n = Z covariates that will be adjusted for (linearly) outside of gam
gamdata=read.table(datafile, header=TRUE)
# get names of variables
v0name=names(gamdata[1])
v1name=names(gamdata[2])
v2name=names(gamdata[3])
v0name
v1name
v2name
# plot x1-x2 data distribution
plotdistname<-paste(mydir,"CASE.",casenumber,"-datadistribution.jpg",sep="")
jpeg(plotdistname)
plot(gamdata[,2],gamdata[,3],pch=19,xlab=v1name,ylab=v2name,main="Data distribution")
dev.off()
# create grid for response surface
gamgrid <- predgrid(gamdata)
# fit gam at optimal span
gamfit <- modgam(gamdata,gamgrid,family=gaussian,m="adjusted", verbose=TRUE)
summary(gamfit$fit)
# plot response surface (for entire data set)
plotsmoothname<-paste(mydir,"CASE.",casenumber,"-smooth.jpg",sep="")
jpeg(plotsmoothname)
colormap(gamfit,contours="response", arrow=FALSE, axes=TRUE)
dev.off()
print("done")
202

25. Variable Selection and Multivariate Adaptive Spline Assessments
to Investigate Effects of Chemical Mixtures in a Prospective Cohort
Study of Mother-Child Pairs Presenting Author: Katrina Waters
Organization: Pacific Northwest National Laboratory
Contributing Authors: Lucas C Tate, Greg F Piepel, Aimee E Holmes, Dennis G Thomas, and Katrina M
Waters
Code:
#install.packages("earth")
#install.packages("caret")
library(earth)
library(caret)
#import data and trim observations column
dataSet1 <- read.csv("C:/Users/tate109/Documents/NIH/rawData/dataSet1.csv", header=TRUE)
dataSet1 <- dataSet1[,-1]
#Fit Earth Models
earthDS1 <- earth(formula=Y~., data=dataSet1, degree=1)
earthDS1 <- earth(formula=Y~., data=dataSet1, degree=2)
#Cross-Validate Models
earthDS1 <- earth(formula=Y~., data=dataSet1, degree=1, ncross=30, nfold=10)
earthDS1 <- earth(formula=Y~., data=dataSet1, degree=2, ncross=30, nfold=10)
#Used for looking at plot of cross-validation (takes time)
#earthDS1 <- earth(formula=Y~., data=dataSet1, degree=1, ncross=30, nfold=10,keepxy=T)
#Explore forcing terms to enter linearly
earthDS1.linpreds <- earth(formula=Y~., data=dataSet1, linpreds = c(1:2), degree=2)
#Summary results
summary(earthDS1)
#Diagnostic plots
plot(earthDS1, cex.legend=.7, which = 1)
203

plot(earthDS1, cex.legend=.7, which = 3)
plot(earthDS1, cex.legend=.7, which = 4)
#Examine expected effects
plotmo(earthDS1)
plotmo(earthDS1.linpreds)
#Look at variable importance
evimp(earthDS1, trim=T)
#External Cross validation
# marsGrid <- expand.grid(.degree = 1:2, .nprune = 2:20)
# set.seed(100)
#
# marsTuned <- caret::train(xDS1, yDS1,
# method = "earth",
# tuneGrid = marsGrid,
# trControl = trainControl(method = "cv"))
# marsTuned
# summary(marsTuned)
# varImp(marsTuned)
#Bagging
##Ideally would remove some of the variability in variable importance
bagEarthDS1 <- caret::bagEarth(formula=Y~., data=dataSet1, degree=2, B=10)
varImp(bagEarthDS1)
204
26. Bayesian Non-Parametric Regression for Multi-Pollutant MixturesPresenting Author: Ran Wei
Organization: North Carolina State University
Contributing Authors: Ran Wei, Subhashis Ghoshal, Brian Reich, Jane Hoppin
Code:
#mydata <- as.matrix(read.csv("~/Dropbox/PhD_Research/code/DataSet2/Sheet1-Table
1.csv"))
#Y <- mydata[,2]
#X <- mydata[,3:16]
#X <- (X - min(X))/(max(X) - min(X))
m = 5
a = 0.1
c = d = 1
sample_n = 10000
burnin = 2000
## Number of predictors and number of observations
n <- nrow(X)
p <- ncol(X)
## Create basis function expansions for X and Y
## Use B-spline basis functions for this case
Basis <- array(0,c(p,n,m))
Bmatrix <- matrix(0,n,p*m)
Brestrict <- matrix(0,p,m)
Evalues <- matrix(0,p,m)
Evector <- array(0,c(p,m,m))
for (j in 1:p){
knots <- quantile(unique(X[ ,j]), seq(0, 1, length = m)[ - c(1, m)])
Basis[j, , ] <- bs(X[ ,j], degree = 2, knots = knots)
#Basis[j, , ] <- t(t(Basis[j, , ])/sqrt(colSums(Basis[j, , ] ^ 2)))
Brestrict[j, ] <- colSums(Basis[j, , ])
Bmatrix[,((j-1)*m+1):(j*m)] <- Basis[j, , ]
eigen <- eigen(t(Basis[j, , ])%*%Basis[j, , ])
Evalues[j, ] <- eigen$values
Evector[j, , ] <- eigen$vectors
}
BasisZ <- array(0,c(p,n,m))
BmatrixZ <- matrix(0,n,p*m)
205

BrestrictZ <- matrix(0,p,m)
EvaluesZ <- matrix(0,p,m)
EvectorZ <- array(0,c(p,m,m))
for (j in 1:p){
knots <- quantile(unique(X[,j]*Z), seq(0,1,length=m)[-c(1,m)])
BasisZ[j, , ] <- bs(X[,j]*Z,degree=2,knots=knots)
#BasisZ[j, , ] <- t(t(BasisZ[j, , ])/sqrt(colSums(BasisZ[j, , ] ^ 2)))
BrestrictZ[j, ] <- colSums(BasisZ[j, , ])
BmatrixZ[,((j-1)*m+1):(j*m)] <- BasisZ[j, , ]
eigen <- eigen(t(BasisZ[j, , ])%*%BasisZ[j, , ])
EvaluesZ[j, ] <- eigen$values
EvectorZ[j, , ] <- eigen$vectors
}
# Basis expansions for interaction effect
ptotal <- p*(p-1)/2
index <- 1
Basis_inter <- array(0, c(ptotal, n, m^2))
Bmatrix_inter <- matrix(0, n, ptotal*(m^2))
Evalues_inter <- matrix(0,ptotal,m^2)
Evector_inter <- array(0,c(ptotal,m^2,m^2))
for (j in 1:(p-1)){
for (l in (j+1):p){
for (i in 1:n){
Basis_inter[index, i, ] <- as.vector(t(outer(Basis[j, i, ], Basis[l, i, ])))
#Basis_inter[index, i, ] <- Basis_inter[index, i, ] / sqrt(sum(Basis_inter[index, i, ] ^ 2))
}
Bmatrix_inter[, ((index-1)*(m^2)+1):(index*(m^2))] <- Basis_inter[index, , ]
eigen_inter <- eigen(t(Basis_inter[index, , ])%*%Basis_inter[index, , ])
Evalues_inter[index, ] <- eigen_inter$values
Evector_inter[index, , ] <- eigen_inter$vectors
index <- index +1
}
}
## Initial values for model parameters
## Initial theta is just the OLS estimator
mean_c <- mean(Y)
theta <- coef(lm(Y ~ -1 + Bmatrix))
theta <- matrix(theta, nrow = p, ncol = m, byrow = T)
delta <- theta
theta_inter <- matrix(1, nrow = ptotal, ncol = m^2 )
sigma2 <- 1
lambda2 <- rep(1, 2*p + ptotal)
206
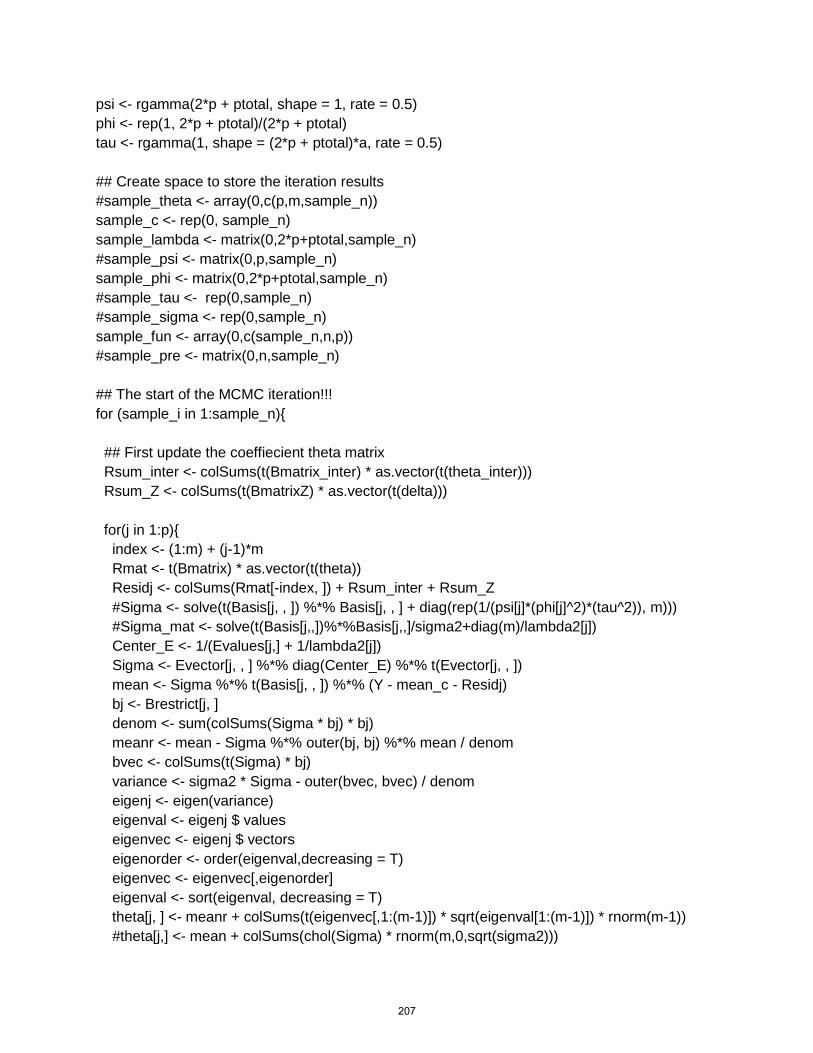
psi <- rgamma(2*p + ptotal, shape = 1, rate = 0.5)
phi <- rep(1, 2*p + ptotal)/(2*p + ptotal)
tau <- rgamma(1, shape = (2*p + ptotal)*a, rate = 0.5)
## Create space to store the iteration results
#sample_theta <- array(0,c(p,m,sample_n))
sample_c <- rep(0, sample_n)
sample_lambda <- matrix(0,2*p+ptotal,sample_n)
#sample_psi <- matrix(0,p,sample_n)
sample_phi <- matrix(0,2*p+ptotal,sample_n)
#sample_tau <- rep(0,sample_n)
#sample_sigma <- rep(0,sample_n)
sample_fun <- array(0,c(sample_n,n,p))
#sample_pre <- matrix(0,n,sample_n)
## The start of the MCMC iteration!!!
for (sample_i in 1:sample_n){
## First update the coeffiecient theta matrix
Rsum_inter <- colSums(t(Bmatrix_inter) * as.vector(t(theta_inter)))
Rsum_Z <- colSums(t(BmatrixZ) * as.vector(t(delta)))
for(j in 1:p){
index <- (1:m) + (j-1)*m
Rmat <- t(Bmatrix) * as.vector(t(theta))
Residj <- colSums(Rmat[-index, ]) + Rsum_inter + Rsum_Z
#Sigma <- solve(t(Basis[j, , ]) %*% Basis[j, , ] + diag(rep(1/(psi[j]*(phi[j]^2)*(tau^2)), m)))
#Sigma_mat <- solve(t(Basis[j,,])%*%Basis[j,,]/sigma2+diag(m)/lambda2[j])
Center_E <- 1/(Evalues[j,] + 1/lambda2[j])
Sigma <- Evector[j, , ] %*% diag(Center_E) %*% t(Evector[j, , ])
mean <- Sigma %*% t(Basis[j, , ]) %*% (Y - mean_c - Residj)
bj <- Brestrict[j, ]
denom <- sum(colSums(Sigma * bj) * bj)
meanr <- mean - Sigma %*% outer(bj, bj) %*% mean / denom
bvec <- colSums(t(Sigma) * bj)
variance <- sigma2 * Sigma - outer(bvec, bvec) / denom
eigenj <- eigen(variance)
eigenval <- eigenj $ values
eigenvec <- eigenj $ vectors
eigenorder <- order(eigenval,decreasing = T)
eigenvec <- eigenvec[,eigenorder]
eigenval <- sort(eigenval, decreasing = T)
theta[j, ] <- meanr + colSums(t(eigenvec[,1:(m-1)]) * sqrt(eigenval[1:(m-1)]) * rnorm(m-1))
#theta[j,] <- mean + colSums(chol(Sigma) * rnorm(m,0,sqrt(sigma2)))
207

}
## Then update the coefficient for confounder interaction effects
Rsum_main <- colSums(t(Bmatrix) * as.vector(t(theta)))
for(j in 1:p){
index <- (1:m) + (j-1)*m
Rmat <- t(BmatrixZ) * as.vector(t(delta))
Residj <- colSums(Rmat[-index, ]) + Rsum_inter + Rsum_main
#Sigma <- solve(t(Basis[j, , ]) %*% Basis[j, , ] + diag(rep(1/(psi[j]*(phi[j]^2)*(tau^2)), m)))
#Sigma_mat <- solve(t(Basis[j,,])%*%Basis[j,,]/sigma2+diag(m)/lambda2[j])
Center_E <- 1/(EvaluesZ[j,] + 1/lambda2[p+j])
Sigma <- EvectorZ[j, , ] %*% diag(Center_E) %*% t(EvectorZ[j, , ])
mean <- Sigma %*% t(BasisZ[j, , ]) %*% (Y - mean_c - Residj)
bj <- BrestrictZ[j, ]
denom <- sum(colSums(Sigma * bj) * bj)
meanr <- mean - Sigma %*% outer(bj, bj) %*% mean / denom
bvec <- colSums(t(Sigma) * bj)
variance <- sigma2 * Sigma - outer(bvec, bvec) / denom
eigenj <- eigen(variance)
eigenval <- eigenj $ values
eigenvec <- eigenj $ vectors
eigenorder <- order(eigenval,decreasing = T)
eigenvec <- eigenvec[,eigenorder]
eigenval <- sort(eigenval, decreasing = T)
delta[j, ] <- meanr + colSums(t(eigenvec[,1:(m-1)]) * sqrt(eigenval[1:(m-1)]) * rnorm(m-1))
#delta[j,] <- mean + colSums(chol(Sigma) * rnorm(m,0,sqrt(sigma2)))
}
## Then update the coefficient for interaction effects
Rsum_Z <- colSums(t(BmatrixZ) * as.vector(t(delta)))
time = 0
for (j in 1:(p-1)){
for (k in (j+1):p){
time = time + 1
index <- (1:m^2) + (time - 1) * (m^2)
Rmat <- t(Bmatrix_inter) * as.vector(t(theta_inter))
Residj <- colSums(Rmat[-index, ]) + Rsum_Z + Rsum_main
Center_E <- 1/(Evalues_inter[time,] + 1/lambda2[2*p+time])
Sigma <- Evector_inter[time, , ] %*% diag(Center_E) %*% t(Evector_inter[time, , ])
mean <- Sigma %*% t(Basis_inter[time, , ]) %*% (Y - mean_c - Residj)
funj <- colSums(t(Basis[j, , ]) * theta[j, ])
funk <- colSums(t(Basis[k, , ]) * theta[k, ])
208

brestr1 <- as.vector(t(t(Basis[j, , ] * funj) %*% Basis[k, , ]))
brestr2 <- as.vector(t(t(Basis[j, , ]) %*% (Basis[k, , ] * funk)))
brestr <- rbind(brestr1, brestr2)
denominv <- brestr %*% Sigma %*% t(brestr)
eigendenom <- eigen(denominv)
denom <- outer(eigendenom$vectors[,1], eigendenom$vectors[,1]) / eigendenom$values[1]
coeff <- Sigma%*%t(brestr)%*%denom%*%brestr
meanr <- mean - coeff%*%mean
variance <- Sigma - coeff%*%Sigma
eigenj <- eigen(variance)
eigenval <- eigenj $ values
eigenvec <- eigenj $ vectors
eigenorder <- order(eigenval,decreasing = T)
eigenvec <- eigenvec[,eigenorder]
eigenval <- sort(eigenval, decreasing = T)
theta_inter[time, ] <- meanr + colSums(t(eigenvec[,1:(m-2)]) * sqrt(eigenval[1:(m-2)]) *
rnorm(m-2))
#theta_inter[j, ] <- mean + colSums(chol(Sigma) * rnorm(m^2,0,sqrt(sigma2)))
}
}
Rsum_inter <- colSums(t(Bmatrix_inter) * as.vector(t(theta_inter)))
## Update the error variance term sigma2
## calculate the prediction for each observation
Smean <- Rsum_main + Rsum_Z + Rsum_inter
mean_c <- rnorm(1, sum(Y - Smean)/(sigma2 + n), 1/(1 + n/sigma2))
shape <- (2*m*p + (m^2)*ptotal + n)/2 + c
scale <- sum((Y-mean_c-Smean)^2)/2 + sum(rowSums(theta^2)/(lambda2[1:p]))/2 +
sum(rowSums(delta^2)/(lambda2[(p+1):(2*p)]))/2
+ sum(rowSums(theta_inter^2)/(lambda2[(2*p+1):(2*p+ptotal)]))/2+d
sigma2 <- 1/rgamma(1,shape=shape,rate=scale)
## Nest we update the variance term lambda2
par_lam1 <- 1/(psi * (phi^2) * (tau^2))
par_lam2 <- rowSums(theta^2)/sigma2
par_lam3 <- rowSums(delta^2)/sigma2
par_lam4 <- rowSums(theta_inter^2)/sigma2
lambda2[1:p] <- sapply(1:p, function(j) {rgig(1, 1-(m/2), par_lam2[j], par_lam1[j])})
lambda2[(p+1):(2*p)] <- sapply(1:p, function(j) {rgig(1, 1-(m/2), par_lam3[j], par_lam1[j])})
lambda2[(2*p+1):(2*p+ptotal)] <- sapply(1:ptotal, function(j) {rgig(1, 1-(m^2/2), par_lam4[j],
par_lam1[j])})
## Then update the vector psi
par_psi <- lambda2/((phi^2) * (tau^2))
209

psi <- sapply(1:(2*p+ptotal), function(j) {rgig(1, 1/2, par_psi[j], 1)})
#par_psi <- phi*tau/sqrt(lambda2)
#psi <- sapply(1:p, function(j) {rinvgauss(1, par_psi[j])})
## Also update the tuning parameter tau
par_tau <- 2 * sum(sqrt(lambda2)/phi)
tau <- rgig(1, (a-1)*(2*p+ptotal), par_tau, 1)
## Last update the vector phi
par_phi <- 2 * sqrt(lambda2)
T_vec <- sapply(1:(2*p+ptotal), function(j) {rgig(1, a-1, par_phi[j], 1)})
phi <- T_vec/sum(T_vec)
## Save the simulated MCMC values
#sample_theta[ , ,sample_i] <- theta
sample_lambda[ ,sample_i] <- lambda2
sample_c[sample_i] <- mean_c
#sample_psi[ ,sample_i] <- psi
sample_phi[ ,sample_i] <- phi
#sample_tau[sample_i] <- tau
#sample_pre[ ,sample_i] <- Smean + mean_c
#sample_sigma[sample_i] <- sigma2
## calculate the corresponding f function for each predictor
sample_fun[sample_i, , ] <- sapply((1:p),function(l){colSums(t(Basis[l, , ]) * theta[l, ])})
## keep track of the iteration steps
if (sample_i %% 500 == 0){
print(paste("Iteration",sample_i-499,"to",sample_i,sep=" "))
}
}
## Mean sqaured error
#MSE = mean((Y - apply(sample_pre[,burnin:sample_n],1,quantile,0.5))^2)
#R2 = 1 - MSE / mean((Y - mean(Y)) ^ 2)
par(mfrow=c(1,3))
## compare the MCMC samples of model parameters main effect
boxplot(t(sample_phi[1:p,burnin:sample_n]),outline=F,
main="Phi for exposure main effects",xlab="exposure",
cex.lab=2.0, cex.axis=2.0, cex.main=2.0, cex.sub=2.0)
#abline(h=0,lwd=2,col="blue")
210

## compare the MCMC samples of model confounder effect
boxplot(t(sample_phi[(p+1):(2*p),burnin:sample_n]),outline=F,
main="Phi for confounder-exposure effects",xlab="confounder*exposure",
cex.lab=2.0, cex.axis=2.0, cex.main=2.0, cex.sub=2.0)
#abline(h=0,lwd=2,col="blue")
## compare the MCMC samples of model parameters interaction effect
boxplot(t(sample_phi[(2*p+1):(2*p+ptotal),burnin:sample_n]),outline=F,
main="Phi for exposure interaction effects",xlab="exposure*exposure",
cex.lab=2.0, cex.axis=2.0, cex.main=2.0, cex.sub=2.0)
#abline(h=0,lwd=2,col="blue")
median_fun <- apply(sample_fun[burnin:sample_n, , ],c(2,3),quantile,0.50)
mean_fun <- apply(sample_fun[burnin:sample_n, , ],c(2,3),mean)
## calculate the statistics with respect to functions
lower_fun <- apply(sample_fun[burnin:sample_n, , ],c(2,3),quantile,0.025)
upper_fun <- apply(sample_fun[burnin:sample_n, , ],c(2,3),quantile,0.975)
index <- c(1,2,5,7)
## plot the curve for each of the additive main effect functions
par(mfrow=c(2,2))
for (j in 1:4){
i <- index[j]
Matrix_fun <- cbind(X[,i],mean_fun[,i],lower_fun[,i],upper_fun[,i])
Matrix_funnew <- Matrix_fun[order(Matrix_fun[,1]), ]
plot(Matrix_funnew[,1],Matrix_funnew[,2],type="l",lwd=2,
main=paste("The main effect function for exposure",i,sep=" "),
ylim=c(min(lower_fun[,i]), max(upper_fun[,i])),
xlab=paste("X",i,sep=""), ylab="",
cex.lab=2.0, cex.axis=2.0, cex.main=2.0, cex.sub=2.0)
polygon(c(rev(Matrix_funnew[,1]),Matrix_funnew[,1]),
c(rev(Matrix_funnew[,4]),Matrix_funnew[,3]),
col = 'grey80',border=NA)
lines(Matrix_funnew[,1],Matrix_funnew[,2],type="l",lwd=2)
lines(Matrix_funnew[,1],Matrix_funnew[,3],type="l",lwd=1,lty="dashed")
lines(Matrix_funnew[,1],Matrix_funnew[,4],type="l",lwd=1,lty="dashed")
#if(i==1){lines(Matrix_funnew[,1],f1(Matrix_funnew[,1]),type="l",lwd=2,col="blue")}
#else if(i==2){lines(Matrix_funnew[,1],f2(Matrix_funnew[,1]),type="l",lwd=2,col="blue")}
#else if(i==3){lines(Matrix_funnew[,1],f3(Matrix_funnew[,1]),type="l",lwd=2,col="blue")}
#else if(i==4){lines(Matrix_funnew[,1],f4(Matrix_funnew[,1]),type="l",lwd=2,col="blue")}
#else if(i==5){lines(Matrix_funnew[,1],f5(Matrix_funnew[,1]),type="l",lwd=2,col="blue")}
#else{abline(h=0,lwd=2,col="blue")}
#abline(h=0,lwd=1,col="red")}
211

27. Modeling Environmental Chemical Mixtures with Weighted
Quantile Sum Regression
Presenting Author: David Wheeler
Organization: Virginia Commonwealth University
Contributing Authors: David Wheeler, Jenna Czarnota
Code:
Not available.
212

28. Assessing Health Associations with Environmental Chemical
Mixtures using Lasso and its Generalizations Presenting Author: Changchun Xie
Organization: Department of Environmental Health, University of Cincinnati, Ohio
Contributing Authors: Changchun Xie, Aimin Chen and Susan M. Pinney
Code:
# install R packages
install.packages("glmnet")
install.packages("randomForest")
install.packages("covTest")
library(glmnet)
library(randomForest)
library(covTest)
# Simulated data set 1
DataSet1 <- read.table("K:/My projects/Aimin/NIEHS mixture workshop/DataSet1.csv", header=TRUE,sep=",")
cor(DataSet1)
pairs(DataSet1[,2:10])
NewD1<-DataSet1
NewD1[,3]<-log(DataSet1[,3])
NewD1[,4]<-log(DataSet1[,4])
NewD1[,5]<-log(DataSet1[,5])
NewD1[,9]<-log(DataSet1[,9])
pairs(NewD1[,2:10])
x<-do.call(cbind, NewD1[,3:10])
y<-DataSet1[,2]
temp<-glmnet(x,y,family="gaussian")
cvob1=cv.glmnet(x,y)
plot(cvob1)
coef(cvob1)
x12<-x[,1]*x[,2]
x14<-x[,1]*x[,4]
x15<-x[,1]*x[,5]
x17<-x[,1]*x[,7]
x1z<-x[,1]*x[,8]
x24<-x[,2]*x[,4]
x25<-x[,2]*x[,5]
x27<-x[,2]*x[,7]
x2z<-x[,2]*x[,8]
x45<-x[,4]*x[,5]
x47<-x[,4]*x[,7]
x4z<-x[,4]*x[,8]
213

x57<-x[,5]*x[,7]
x5z<-x[,5]*x[,8]
x7z<-x[,7]*x[,8]
x2x<-cbind(x, x12,x14,x15,x17,x1z,x24,x25,x27,x2z, x45,x47,x4z,x57,x5z,x7z)
temp2x<-glmnet(x2x,y,family="gaussian")
cvob2x=cv.glmnet(x2x,y)
plot(cvob2x)
coef(cvob2x)
a=lars(x2x,y)
covTest(a,x2x,y)
coef(a)
# Simulated data set 2
DataSet2 <- read.table("F:/My projects/Aimin/NIEHS mixture workshop/DataSet2.csv", header=TRUE,sep=",")
cor(DataSet2)
pairs(DataSet2[,2:19])
x<-do.call(cbind, DataSet2[,3:19])
y<-DataSet2[,2]
temp<-glmnet(x,y,family="gaussian")
cvob1=cv.glmnet(x,y)
plot(cvob1)
coef(cvob1)
temp<-glmnet(x,y,family="gaussian",lambda=0.16)
coef(temp)
temp<-glmnet(x,y,family="gaussian",lambda=0.25)
coef(temp)
x4x6<-x[,4]*x[,6]
x4x8<-x[,4]*x[,8]
x4x10<-x[,4]*x[,10]
x4x11<-x[,4]*x[,11]
x4x14<-x[,4]*x[,14]
x4z2<-x[,4]*x[,16]
x4z3<-x[,4]*x[,17]
x6x8<-x[,6]*x[,8]
x6x10<-x[,6]*x[,10]
x6x11<-x[,6]*x[,11]
x6x14<-x[,6]*x[,14]
x6z2<-x[,6]*x[,16]
x6z3<-x[,6]*x[,17]
x8x10<-x[,8]*x[,10]
x8x11<-x[,8]*x[,11]
x8x14<-x[,8]*x[,14]
x8z2<-x[,8]*x[,16]
214

x8z3<-x[,8]*x[,17]
x10x11<-x[,10]*x[,11]
x10x14<-x[,10]*x[,14]
x10z2<-x[,10]*x[,16]
x10z3<-x[,10]*x[,17]
x11x14<-x[,11]*x[,14]
x11z2<-x[,11]*x[,16]
x11z3<-x[,11]*x[,17]
x14z2<-x[,14]*x[,16]
x14z3<-x[,14]*x[,17]
xz2z3<-x[,16]*x[,17]
x2x<-
cbind(x,x4x6,x4x8,x4x10,x4x11,x4x14,x4z2,x4z3,x6x8,x6x10,x6x11,x6x14,x6z2,x6z3,x8x10,x8x11,x8x14,x8z2,x8z3,x10x11,x
10x14,x10z2,x10z3,x11x14,x11z2,x11z3,x14z2,x14z3,xz2z3)
temp2x<-glmnet(x2x,y,family="gaussian")
cvob2x=cv.glmnet(x2x,y)
plot(cvob2x)
coef(cvob2x)
a=lars(x2x,y)
covTest(a,x2x,y)
coef(a)
temp2<-randomForest(x,y)
temp2$importance
#### 3 way interaction ###
x612<-x[,6]*x[,12]
x6410<-x[,6]*x410
x6811<-x[,6]*x811
x61014<-x[,6]*x1014
x1214<-x[,12]*x[,14]
x12z3<-x[,12]*x[,17]
x2xx<-cbind(x2x, x612,x1214,x12z3)
cvob2xx=cv.glmnet(x2xx,y)
plot(cvob2xx)
coef(cvob2xx)
# Real world data set
realdata <- read.table("F:/My projects/Aimin/NIEHS mixture workshop/RealData/realdata.csv", header=TRUE,sep=",")
cor(realdata)
pairs(realdata[,1:28])
pfac<-rep(1,27)
215

pfac[1:5]<-0
x<-do.call(cbind, realdata[,1:27])
y<-realdata[,28]
cvob1=cv.glmnet(x,y, penalty.factor = pfac,family="gaussian")
plot(cvob1)
coef(cvob1)
temp<-glmnet(x,y, penalty.factor = pfac,lambda=0.1353,family="gaussian")
coef(temp)
cvob2=cv.glmnet(x,y,family="gaussian")
coef(cvob2)
ldata<-realdata
ldata[,6:27]<-log(ldata[,6:27])
cor(ldata)
pairs(ldata[,1:28])
lx<-do.call(cbind, ldata[,1:27])
lcvob1=cv.glmnet(lx,y, penalty.factor = pfac,family="gaussian")
plot(lcvob1)
coef(lcvob1)
ltemp<-glmnet(lx,y, penalty.factor = pfac,lambda=lcvob1$lambda.min,family="gaussian")
coef(ltemp)
pfac2<-rep(1,27)
pfac2[1:6]<-0
pfac2[19]<-0
lcvob2=cv.glmnet(lx,y, penalty.factor = pfac2,family="gaussian")
plot(lcvob2)
coef(lcvob2)
ltemp<-glmnet(lx,y, penalty.factor = pfac2,lambda=lcvob2$lambda.min,family="gaussian")
coef(ltemp)
pfac3<-rep(1,27)
pfac3[1:9]<-0
lcvob3=cv.glmnet(lx,y, penalty.factor = pfac3,family="gaussian")
plot(lcvob3)
216

coef(lcvob3)
ltemp<-glmnet(lx,y, penalty.factor = pfac3,lambda=0.2,family="gaussian")
coef(ltemp)
217

29. Assessing the Impact of Environmental Mixtures on Children’s
Neurodevelopment Presenting Author: Rengyi (Emily) Xu
Organization: Department of Biostatistics and Epidemiology, University of Pennsylvania, Perelman
School of Medicine
Contributing Authors: Rengyi Xu1, Michelle Ross1, Mingyao Li1, Andrew J. Worth2, Wei-Ting Hwang1 1Department of Biostatistics and Epidemiology,
2Department of Systems Pharmacology and Translational Therapeutics,
Perelman School of Medicine, University of Pennsylvania, Philadelphia, PA, USA
Code:
library(corrgram)
library(fmsb)
data<-read.csv('NIEHS_real_data.csv',header=T)
#Exploratory on outcome variable
summary(data$mdi)
sd(data$mdi)
hist(data$mdi,main="",xlab="MDI",freq=FALSE)
shapiro.test(data$mdi)
#Box-Cox transformation
library(AID)
boxcoxnc(data$mdi,lam=seq(-5,10,0.01))
y.sq=data$mdi^2
shapiro.test(y.sq)
hist(y.sq)
summary(y.sq)
sd(y.sq)
###Exploratory analysis
###subset the data into 3 groups: PBDE, PCB, and other
data_pcb<-data[,c(15:28,6)] #with mdi
names(data_pcb)
names(data_pcb)<-
c("74","99","105","118","146","153","156","170","180","187","194","199","138","196","MDI")
corrgram(data_pcb, order=TRUE, lower.panel=panel.ellipse,
upper.panel=panel.pts, text.panel=panel.txt,
diag.panel=panel.minmax)
###order with MDI in the front
names(data_pcb)
218

data_pcb_reorder<-data_pcb[,c(15,12,14,11,9,10,8,6,5,7,13,1,2,4,3)]
corrgram(data_pcb_reorder, order=FALSE, lower.panel=panel.ellipse,
upper.panel=panel.pts, text.panel=panel.txt,cex=0.9)
data_pbde<-data[,c(7,8,9,10,6)]
names(data_pbde)<-c("PBDE_47","PBDE_99","PBDE_100","PBDE_153","MDI")
names(data_pbde)
corrgram(data_pbde, order=TRUE, lower.panel=panel.ellipse,
upper.panel=panel.pts, text.panel=panel.txt,cex=0.9)
data_op<-data[,c(6,11,12,13,14)]
names(data_op)<-c("MDI","HCB","DDE","Oxychlor","Nonachlor")
corrgram(data_op, order=FALSE, lower.panel=panel.ellipse,
upper.panel=panel.pts, text.panel=panel.txt,cex=0.9)
####hist of MDI and boxplot by confounders
par(mfrow=c(2,3))
hist(data$mdi,main="",xlab="MDI",freq=FALSE)
boxplot(data$mdi~data$child_sex,xlab="Child gender")
boxplot(data$mdi~data$mom_age,xlab="Mom age")
boxplot(data$mdi~data$mom_race,xlab="Mom race")
boxplot(data$mdi~data$mom_smoke,xlab="Mom smoke")
boxplot(data$mdi~data$mom_educ,xlab="Mom education")
#correlation matrix
cor_mat<-cor(data[,-c(1:6,29)])
colnames(cor_mat)
r=length(cor_mat[abs(cor_mat>=0.7)&cor_mat!=1])
cor_mat_index<-data.frame(NA,nrow=r/2,ncol=3)
k=1
for (i in 1:dim(cor_mat)[1]){
for(j in i:dim(cor_mat)[2]){
if(abs(cor_mat[i,j])>=0.7&cor_mat[i,j]!=1){
cor_mat_index[k,1]<-cor_mat[i,j]
cor_mat_index[k,2]<-colnames(cor_mat)[i]
cor_mat_index[k,3]<-rownames(cor_mat)[j]
k=k+1
}
}
}
colnames(cor_mat_index)<-c("Correlation","Lipid","Lipid")
cor_mat_index[order(cor_mat_index[,1],decreasing=T),]
219

##univaraite analyses for each lipid and each confounder
##rank order them by p-value
m1<-lm(mdi~lip_PBDE_47,data=data)
pval1<-coef(summary(m1))[2,4]
m2<-lm(mdi~lip_PBDE_99,data=data)
pval2<-coef(summary(m2))[2,4]
m3<-lm(mdi~lip_PBDE_100,data=data)
pval3<-coef(summary(m3))[2,4]
m4<-lm(mdi~lip_PBDE_153,data=data)
pval4<-coef(summary(m4))[2,4]
m5<-lm(mdi~lip_hcb,data=data)
pval5<-coef(summary(m5))[2,4]
m6<-lm(mdi~lip_pp_dde,data=data)
pval6<-coef(summary(m6))[2,4]
m7<-lm(mdi~lip_oxychlor,data=data)
pval7<-coef(summary(m7))[2,4]
m8<-lm(mdi~lip_nonachlor,data=data)
pval8<-coef(summary(m8))[2,4]
m9<-lm(mdi~lip_pcb74,data=data)
pval9<-coef(summary(m9))[2,4]
m10<-lm(mdi~lip_pcb99,data=data)
pval10<-coef(summary(m10))[2,4]
m11<-lm(mdi~lip_pcb105,data=data)
pval11<-coef(summary(m11))[2,4]
m12<-lm(mdi~lip_pcb118,data=data)
pval12<-coef(summary(m12))[2,4]
m13<-lm(mdi~lip_pcb146,data=data)
pval13<-coef(summary(m13))[2,4]
m14<-lm(mdi~lip_pcb153,data=data)
pval14<-coef(summary(m14))[2,4]
m15<-lm(mdi~lip_pcb156,data=data)
pval15<-coef(summary(m15))[2,4]
m16<-lm(mdi~lip_pcb170,data=data)
pval16<-coef(summary(m16))[2,4]
m17<-lm(mdi~lip_pcb180,data=data)
pval17<-coef(summary(m17))[2,4]
m18<-lm(mdi~lip_pcb187,data=data)
pval18<-coef(summary(m18))[2,4]
m19<-lm(mdi~lip_pcb194,data=data)
pval19<-coef(summary(m19))[2,4]
m20<-lm(mdi~lip_pcb199,data=data)
220

pval20<-coef(summary(m20))[2,4]
m21<-lm(mdi~lip_pcb138_158,data=data)
pval21<-coef(summary(m21))[2,4]
m22<-lm(mdi~lip_pcb196_203,data=data)
pval22<-coef(summary(m22))[2,4]
pval.combined<-c(pval1,pval2,pval3,pval4,pval5,pval6,pval7,pval8,pval9,pval10,
pval11,pval12,pval13,pval14,pval15,pval16,pval17,pval18,pval19,pval20,
pval21,pval22)
pval.sorted<-sort(pval.combined,index.return=TRUE)
pval.sorted
summary(m9) #pcb74
summary(m12) #pcb118
summary(m20) #pcb199
summary(m11) #pcb105
summary(m22) #pcb196_203
summary(m3) #pbde_100
summary(m19) #pcb194
######Use the lipids with pvalue<0.1 to include in stepwise
data.step<-
data.frame(data$mdi,data$lip_pcb74,data$lip_pcb118,data$lip_pcb199,data$lip_pcb105,data$lip_pcb1
96_203,data$lip_PBDE_100,data$lip_pcb194,data[,1:5])
null.step=lm(data.mdi~1, data=data.step)
full.step=lm(data.mdi~., data=data.step)
step(null.step, scope=list(lower.sub=null.step, upper=full.step), direction="forward")
step(full.step, data=data.step, direction="backward")
step(full.step, data=data.step, direction="both")
model.step<-lm(mdi~mom_educ + mom_race + child_sex + lip_pcb118 + lip_PBDE_100,data=data)
summary(model.step)
data.sub<-
data.frame(data$mdi,data$mom_educ,data$mom_race,data$child_sex,data$lip_pcb118,data$lip_PBDE
_100)
full.step2<-lm(data.mdi~.*.,data=data.sub)
null.step2<-lm(data.mdi~1,data=data.sub)
step(null.step2, scope=list(lower.sub=null.step2, upper=full.step2), direction="forward")
step(full.step2, data=data.sub, direction="backward")
step(full.step2, data=data.sub, direction="both")
221

model.step2<-lm(mdi ~ mom_educ + mom_race + child_sex + lip_pcb118 + lip_PBDE_100 +
mom_educ*lip_pcb118,data=data)
summary(model.step2)
anova(model.step,model.step2)
plot(model.step2)
VIF(model.step2)
AIC(model.step2)
####standardized coefficient from model.step2
pcb118.stand<-(data$lip_pcb118-mean(data$lip_pcb118))/sd(data$lip_pcb118)
pbde100.stand<-(data$lip_PBDE_100-mean(data$lip_PBDE_100))/sd(data$lip_PBDE_100)
model.step2.stand<-lm(mdi ~ mom_educ + mom_race + child_sex + pcb118.stand + pbde100.stand +
mom_educ*pcb118.stand,data=data)
summary(model.step2.stand)
confint(model.step2.stand)
confint(model.step2)
par(mfrow=c(2,2))
plot(model.step2,cex=0.9)
#####3d scatterplot
library(scatterplot3d)
par(mfrow=c(1,1))
s3d <-scatterplot3d(data$lip_pcb118,data$lip_PBDE_100,data$mdi, pch=16,
highlight.3d=TRUE,type="p", main="")
#Z=1
plot3d( data$lip_pcb118, data$lip_PBDE_100, data$mdi, type = "s", col = "red", size =
1,xlab="PCB118",ylab="PBDE100",zlab="MDI")
coef.both <- coef(model.step2)
a <- coef.both["lip_pcb118"]+coef.both[7]
b <- coef.both["lip_PBDE_100"]
c <- -1
d <-
coef.both["(Intercept)"]+coef.both["mom_race"]*mean(data$mom_race)+coef.both["child_sex"]*mean
(data$child_sex)+coef.both["mom_educ"]
planes3d(a, b, c, d, alpha = 0.5)
#Z=0
a=coef.both["lip_pcb118"]
222

d <-
coef.both["(Intercept)"]+coef.both["mom_race"]*mean(data$mom_race)+coef.both["child_sex"]*mean
(data$child_sex)
plot3d(data$lip_pcb118, data$lip_PBDE_100, data$mdi, type = "s", col = "red", size =
1,xlab="PCB118",ylab="PBDE100",zlab="MDI")
planes3d(a, b, c, d, alpha = 0.5)
#PCA for the 3 groups separately
names(data_pbde)
x.matrix.pbde<-data_pbde[,-5]
pca.pbde<-prcomp(x.matrix.pbde,center=TRUE,scale=TRUE)
summary(pca.pbde)
plot(pca.pbde,type='l')
score.pbde=head(pca.pbde$x)
weights.pbde<-pca.pbde$rotation
plot3d(pca.pbde$scores[,1:3], type="n",xlim=c(-0.3,0.3),ylim=c(-0.3,0.3),zlim=c(-
0.3,0.3),xlab="PC1",ylab="PC2",zlab="PC3")
#text3d(pc$scores[,1:3],texts=rownames(data))
text3d(0.05+pca.pbde$rotation[,1:3], texts=rownames(pca.pbde$rotation), col="blue",cex=1)
coords <- NULL
for (i in 1:nrow(pca.pbde$rotation)) {
coords <- rbind(coords, rbind(c(0,0,0),pca.pbde$rotation[i,1:3]))
}
lines3d(coords, col="red", lwd=4)
x.matrix.pcb<-data_pcb[,-15]
pca.pcb<-prcomp(x.matrix.pcb,center=TRUE,scale=TRUE)
summary(pca.pcb)
plot(pca.pcb,type='l')
score.pcb=head(pca.pcb$x)
weights.pcb<-pca.pcb$rotation
plot3d(pca.pcb$scores[,1:3], type="n",xlim=c(-0.3,0.3),ylim=c(-0.3,0.3),zlim=c(-
0.3,0.3),xlab="PC1",ylab="PC2",zlab="PC3")
#text3d(pc$scores[,1:3],texts=rownames(data))
text3d(0.05+pca.pcb$rotation[,1:3], texts=rownames(pca.pcb$rotation), col="blue",cex=1)
coords <- NULL
for (i in 1:nrow(pca.pcb$rotation)) {
coords <- rbind(coords, rbind(c(0,0,0),pca.pcb$rotation[i,1:3]))
}
lines3d(coords, col="red", lwd=4)
223

x.matrix.op<-data_op[,-5]
pca.op<-prcomp(x.matrix.op,center=TRUE,scale=TRUE)
summary(pca.op)
plot(pca.op,type='l')
score.op=head(pca.op$x)
weights.op<-pca.op$rotation
plot3d(pca.op$scores[,1:3], type="n",xlim=c(-0.3,0.3),ylim=c(-0.3,0.3),zlim=c(-
0.3,0.3),xlab="PC1",ylab="PC2",zlab="PC3")
#text3d(pc$scores[,1:3],texts=rownames(data))
text3d(0.05+pca.op$rotation[,1:3], texts=rownames(pca.op$rotation), col="blue",cex=1)
coords <- NULL
for (i in 1:nrow(pca.op$rotation)) {
coords <- rbind(coords, rbind(c(0,0,0),pca.op$rotation[i,1:3]))
}
lines3d(coords, col="red", lwd=4)
####figures for PCA#####
par(mfrow=c(1,3))
plot(pca.pcb,type='l',main="PCB",cex.main=.9)
plot(pca.pbde,type='l',main="PBDE",cex.main=.9)
plot(pca.op,type='l',main="Organochlorine Pesticides",cex.main=.9)
##generate new variables
pbde1.pca<-
weights.pbde[1,1]*data$lip_PBDE_47+weights.pbde[2,1]*data$lip_PBDE_99+weights.pbde[3,1]*data$li
p_PBDE_100
pbde2.pca<-weights.pbde[4,2]*data$lip_PBDE_153
pcb1.pca<-
weights.pcb[5,1]*data$lip_pcb146+weights.pcb[6,1]*data$lip_pcb153+weights.pcb[13,1]*data$lip_pcb
138_158
pcb2.pca<-
weights.pcb[3,2]*data$lip_pcb105+weights.pcb[4,2]*data$lip_pcb118+weights.pcb[2,2]*data$lip_pcb9
9
pcb3.pca<-weights.pcb[12,3]*data$lip_pcb199+weights.pcb[14,2]*data$lip_pcb196
op1.pca<-weights.op[3,1]*data$lip_oxychlor+weights.op[4,1]*data$lip_nonachlor
op2.pca<-weights.op[1,2]*data$lip_hcb+weights.op[2,2]*data$lip_pp_dde
224

x.matrix.pca<-cbind(pbde1.pca,pbde2.pca,pcb1.pca,pcb2.pca,pcb3.pca,op1.pca,op2.pca)
#using the result from forward model
model.pca.forward=lm(data.mdi~mom_educ + mom_race + child_sex + pcb2.pca +
mom_educ*pcb2.pca,data=data.pca)
summary(model.pca.forward)
confint(model.pca.forward)
VIF(model.pca.forward)
AIC(model.pca.forward)
#standardized cofficient
pcb2.pca.stand<-(pcb2.pca-mean(pcb2.pca))/sd(pcb2.pca)
model.pca.forward.stand=lm(data.mdi~mom_educ + mom_race + child_sex + pcb2.pca.stand +
mom_educ*pcb2.pca.stand,data=data.pca)
summary(model.pca.forward.stand)
confint(model.pca.forward.stand)
VIF(model.pca.forward.stand)
AIC(model.pca.forward.stand)
225

30. Analysis of the First Simulated Dataset using Nonlinear and
Weighted Quantile Sum (WQS) Regression Presenting Author: Chris Gennings
Organization: Icahn School of Medicine at Mount Sinai
Contributing Authors: Chris Gennings
Code:
filename pic 'N:\research\NIEHS mixtures workshop 2015\analysis 1st
dataset\pic.jpg';
goptions device=jpeg gsfname=pic gsfmode=replace colors=(black)
htext=2 ftext=swiss hby=1.8;
libname datout 'N:\research\NIEHS mixtures workshop 2015\analysis 1st
dataset';
filename WQS 'N:\research\wqs\wqs macro v3.sas';
proc import out=first
file='N:\research\NIEHS mixtures workshop 2015\analysis 1st
dataset\dataset1.xls';
data first;
set first;
dummy=1;
proc sort; by z;
symbol1 v=star i=sm70s c=blue w=3 h=1;
symbol2 v=square i=sm70s c=green w=3 h=1;
proc gplot data=first;
plot y*(x1--x7)=z;
run; quit;
proc gplot data=first;
plot y*(x7)=z;
run; quit;
proc corr data=first;
var y x1--x7;
run;
proc sort data=first; by z;
proc boxplot data=first;
plot y*z; run; quit;
*******************************************************;
*******************************************************;
** center and scale xs;
proc means data=first;
226

* where z=1;
var x1 x2 x3 x4 x5 x6 x7;
output out=means mean=m1 m2 m3 m4 m5 m6 m7
std=s1 s2 s3 s4 s5 s6 s7;
id dummy;
run;
data firstsc;
merge first means; by dummy;
x1sc = (x1-m1)/s1;
x2sc = (x2-m2)/s2;
x3sc = (x3-m3)/s3;
x4sc = (x4-m4)/s4;
x5sc = (x5-m5)/s5;
x6sc = (x6-m6)/s6;
x7sc = (x7-m7)/s7;
* if z=1;
run;
*** nonlinear model to determine interaction terms to consider;
proc nlin data=firstsc noitprint;
* where z=1;
parms alpha=0
g0=20 b1=0 b2=0 b3=0 b4=0 b5=0 b6=0 b7=0
b12=0 b13=0 b14=0 b15=0 b16=0 b17=0
b23=0 b24=0 b25=0 b26=0 b27=0
b34=0 b35=0 b36=0 b37=0
b45=0 b46=0 b47=0
b56=0 b57=0
b67=0;
gamma=g0;
crossprod = b12*x1sc*x2sc+ b13*x1sc*x3sc+ b14*x1sc*x4sc+
b15*x1sc*x5sc+ b16*x1sc*x6sc+ b17*x1sc*x7sc+
b23*x2sc*x3sc+ b24*x2sc*x4sc+ b25*x2sc*x5sc+
b26*x2sc*x6sc+ b27*x2sc*x7sc+
b34*x3sc*x4sc+ b35*x3sc*x5sc+ b36*x3sc*x6sc+
b37*x3sc*x7sc+
b45*x4sc*x5sc+ b46*x4sc*x6sc+ b47*x4sc*x7sc+
b56*x5sc*x6sc+ b57*x5sc*x7sc+
b67*x6sc*x7sc;
term = b1*x1sc + b2*x2sc +b3*x3sc +b4*x4sc +b5*x5sc +b6*x6sc
+b7*x7sc + crossprod ;
mu = alpha+ gamma*(1-exp(-term));
** mu = alpha+gamma*(exp(term)); ** did not converge;
model y = mu;
227

run;
data firstsc_ validation;
set firstsc;
alpha_=0; gam_=49;
run;
**************************************************************;
%include wqs;
*%macro wtqsum( y, weightvars, num,wlincomb, sum, bounds,
wtedvar,posneg,
covariates, startcovs,
bcovs, covslincomb, signal=1);
** z=0 n=286; **z=1 n=214;
proc surveyselect data=firstsc_ method=urs
seed=50394 outhits n=500 reps=100 out=bootsamp;
run;
options nomacrogen;
** overall nonlinear;
%nlwtqsum(y,w1 w2 w3 w4 w5 w6 w7 , 7,
w1*x1sc + w2*x2sc + w3*x3sc + w4*x4sc + w5*x5sc + w6*x6sc
+ w7*x7sc ,
w1+w2+w3+w4+w5+w6+w7 ,
%str(0< w1 w2 w3 w4 w5 w6 w7 <1, beta1>0.00001,
10<gamma<50),
wqs, posbeta1, z,%str(bz=0;) ,bz ,bz*z,
signal=1, direction=1);
%nlwtqsum(y,w1 w2 w3 w4 w5 w6 w7 w13 w15 w17 w57, 11,
w1*x1sc + w2*x2sc + w3*x3sc + w4*x4sc + w5*x5sc + w6*x6sc
+ w7*x7sc
+ w13*x1sc*x3sc + w15*x1sc*x5sc+ w17*x1sc*x7sc+ w57*x5sc*x7sc,
w1+w2+w3+w4+w5+w6+w7 + w13+ w15+ w17+w57,
%str(0< w1 w2 w3 w4 w5 w6 w7 w13 w15 w17 w57<1, beta1>0.0001,
10<gamma<50),
wqs, posbeta1, z,%str(bz=0;) ,bz ,bz*z,
signal=1, direction=1);
228

%nlwtqsum(y,w1 w2 w3 w4 w5 w6 w7 w13 w15 w17 w57, 11,
w1*x1sc + w2*x2sc + w3*x3sc + w4*x4sc + w5*x5sc + w6*x6sc
+ w7*x7sc
+ w13*x1sc*x3sc + w15*x1sc*x5sc+ w17*x1sc*x7sc+ w57*x5sc*x7sc,
w1+w2+w3+w4+w5+w6+w7 + w13+ w15+ w17+w57,
%str(0< w1 w2 w3 w4 w5 w6 w7 w13 w15 w17 w57<1,
beta1<-0.00001,
-10<alpha<20, gamma>0),
wqs, negbeta1, z,%str(bz=0;) ,bz ,bz*z,
signal=1, direction=-1);
%nlwtqsum(y,w1 w2 w3 w4 w5 w6 w7 , 7,
w1*x1sc + w2*x2sc + w3*x3sc + w4*x4sc + w5*x5sc + w6*x6sc
+ w7*x7sc ,
w1+w2+w3+w4+w5+w6+w7 ,
%str(0< w1 w2 w3 w4 w5 w6 w7 <1, beta1<-0.00001,
-10<alpha<20, gamma>0),
wqs, negbeta1, z,%str(bz=0;) ,bz ,bz*z,
signal=1, direction=-1);
/* *****************************************;
proc means data=three;
var y; run;
proc genmod data=three;
model y = z;
output out=resid resraw=resid;
data resid;
set resid;
adj_y = resid+23.3;
symbol1 v=star i=sm70s c=blue;
axis1 label=(a=90);
proc gplot data=resid;
plot adj_y*wqsfinal/vaxis=axis1;
label adj_y = 'Adjusted Y'
wqsfinal = 'WQS Index';
run; quit;
*/
229

*****************************************************;
data firstsc_ validation;
set firstsc;
if z=0;
run;
** z=0 n=286; **z=1 n=214;
proc surveyselect data=firstsc_ method=urs
seed=50394 outhits n=286 reps=100 out=bootsamp;
run;
options nomacrogen;
** Z=0;
%nlwtqsum(y,w1 w2 w3 w4 w5 w6 w7 , 7,
w1*x1sc + w2*x2sc + w3*x3sc + w4*x4sc + w5*x5sc + w6*x6sc
+ w7*x7sc ,
w1+w2+w3+w4+w5+w6+w7 ,
%str(0< w1 w2 w3 w4 w5 w6 w7 <1, beta1>0.0001,
10<gamma<50),
wqs, posbeta1, , , ,0,
signal=1, direction=1);
%nlwtqsum(y,w1 w2 w3 w4 w5 w6 w7 w13 w15 w17 w57, 7,
w1*x1sc + w2*x2sc + w3*x3sc + w4*x4sc + w5*x5sc + w6*x6sc
+ w7*x7sc
+ w13*x1sc*x3sc + w15*x1sc*x5sc+ w17*x1sc*x7sc+ w57*x5sc*x7sc,
w1+w2+w3+w4+w5+w6+w7 + w13+ w15+ w17+w57,
%str(0< w1 w2 w3 w4 w5 w6 w7 w13 w15 w17 w57<1,
beta1<-0.00001,
-10<alpha<20, gamma>0),
wqs, negbeta1, , , , 0,
signal=1, direction=-1);
%nlwtqsum(y,w1 w2 w3 w4 w5 w6 w7 , 7,
w1*x1sc + w2*x2sc + w3*x3sc + w4*x4sc + w5*x5sc + w6*x6sc
+ w7*x7sc ,
w1+w2+w3+w4+w5+w6+w7 ,
%str(0< w1 w2 w3 w4 w5 w6 w7 <1, beta1<-0.00001,
-10<alpha<20, gamma>0),
wqs, negbeta1, , , ,0,
signal=1, direction=-1);
230

********************************************;
data firstsc_ validation;
set firstsc;
if z=1;
run;
** z=0 n=286; **z=1 n=214;
proc surveyselect data=firstsc_ method=urs
seed=50394 outhits n=214 reps=100 out=bootsamp;
run;
options nomacrogen;
** Z=1;
%nlwtqsum(y,w1 w2 w3 w4 w5 w6 w7 , 7,
w1*x1sc + w2*x2sc + w3*x3sc + w4*x4sc + w5*x5sc + w6*x6sc
+ w7*x7sc ,
w1+w2+w3+w4+w5+w6+w7 ,
%str(0< w1 w2 w3 w4 w5 w6 w7 <1, beta1>0.0001,
10<gamma<50),
wqs, posbeta1, , , ,0,
signal=1, direction=1);
%nlwtqsum(y,w1 w2 w3 w4 w5 w6 w7 , 7,
w1*x1sc + w2*x2sc + w3*x3sc + w4*x4sc + w5*x5sc + w6*x6sc
+ w7*x7sc ,
w1+w2+w3+w4+w5+w6+w7 ,
%str(0< w1 w2 w3 w4 w5 w6 w7 <1, beta1<-0.00001,
-10<alpha<20, gamma>0),
wqs, negbeta1, , , ,0,
signal=1, direction=-1);
****************************************************;
** sensitivity analysis using linear function;
data firstsc_ validation;
set firstsc;
run;
proc surveyselect data=firstsc_ method=urs
seed=50394 outhits n=500 reps=100 out=bootsamp;
231

run;
** overall linear function;
%wtqsum(y,w1 w2 w3 w4 w5 w6 w7 w13 w15 w17 w57, 11,
w1*x1sc + w2*x2sc + w3*x3sc + w4*x4sc + w5*x5sc + w6*x6sc
+ w7*x7sc
+ w13*x1sc*x3sc + w15*x1sc*x5sc+ w17*x1sc*x7sc+ w57*x5sc*x7sc,
w1+w2+w3+w4+w5+w6+w7 + w13+ w15+ w17+w57,
%str(0< w1 w2 w3 w4 w5 w6 w7 w13 w15 w17 w57<1,
beta1>0.0001),
wqs, posbeta1, z,%str(bz=0;) ,bz ,bz*z,
signal=1);
%wtqsum(y,w1 w2 w3 w4 w5 w6 w7 w13 w15 w17 w57, 11,
w1*x1sc + w2*x2sc + w3*x3sc + w4*x4sc + w5*x5sc + w6*x6sc
+ w7*x7sc
+ w13*x1sc*x3sc + w15*x1sc*x5sc+ w17*x1sc*x7sc+ w57*x5sc*x7sc,
w1+w2+w3+w4+w5+w6+w7 + w13+ w15+ w17+w57,
%str(0< w1 w2 w3 w4 w5 w6 w7 w13 w15 w17 w57<1,
beta1<-0.00001),
wqs, negbeta1, z,%str(bz=0;) ,bz ,bz*z,
signal=1);
MACROS
********************************************************************;
%macro wtqsum( y, weightvars, num,wlincomb, sum, bounds,
wtedvar,posneg, covariates, startcovs,
bcovs, covslincomb, signal=1);
data start;
_type_='PARMS';
alpha=-6; beta1=-0.0001; sigma=1.0; &startcovs;
array inwts &weightvars;
do over inwts;
inwts=1/#
end;
run;
proc nlp data=bootsamp technique= trureg nomiss maxiter=10000
maxfunc=10000 inest=start
outest=outstuff noprint;
232

by replicate ;
*objective function;
max logf;
*define parameters;
parms alpha beta1 &weightvars &bcovs;
*program statements;
term = alpha + beta1 * (&wlincomb ) + &covslincomb;
y = &y;
ssq = (y - term)**2;
logf= -ssq;
*linear constraints;
lincon &sum = 1;
*bounds on parameters;
bounds &bounds;
run;
data weights;
set outstuff;
where _type_='PARMS';
drop _type_;
dummy=1;
run;
*proc print data=weights;
run;
data together2;
merge bootsamp weights;
by replicate;
&wtedvar = &wlincomb;
run;
proc genmod data=together2;
by replicate;
model &y = &wtedvar &covariates/ dist=normal type3;
ods output type3=type3analysis;
* ods output parameterestimates=parameterestimates;
run;
*dm log 'clear';
*dm output 'clear';
data pvalues_;
set type3analysis;
if source="&wtedvar";
dummy=1;
proc means data=pvalues_ noprint;
var chisq;
id dummy;
233

output out=signal sum=sumsignal; run;
data pvalues;
merge pvalues_ signal; by dummy;
if &signal=1 then
signal = chisq/sumsignal; **** signal is relative test
statistic;
if &signal=2 then do;
if ProbChiSq<0.05 then signal=1; **** signal is binary ;
else signal=0;
end;
if &signal=3 then signal=1; ****** for analysis without
bootstrap step;
drop _type_;
run;
data posbeta1 negbeta1;
merge weights pvalues; by replicate;
if beta1>0 then output posbeta1;
if beta1<0 then output negbeta1;
run;
symbol1 v=none i=join c=black;
pattern1 c=green v=solid;
*%dist(posbeta1, &weightvars);
*%dist(negbeta1, &weightvars);
proc means data=&posneg ;*noprint;*negbeta1; *posbeta1;
weight signal; ******************** weighted average;
var &weightvars;
id dummy;
output out=means ;
run;
data means;
set means;
where _stat_='MEAN';
keep &weightvars dummy ;
run;
data three;
merge validation means; by dummy;
wqsfinal =&wlincomb;
run;
234

proc genmod data=three; *together2;
model &y = wqsfinal &covariates/ dist=normal type3;
run;
proc genmod data=three; *together2;
model &y = wqsfinal wqsfinal*wqsfinal &covariates/ dist=normal
type3;
contrast 'wqs' wqsfinal 1, wqsfinal*wqsfinal 1;
run;
%mend;
**************************************;
%macro nlwtqsum( y, weightvars, num,wlincomb, sum, bounds,
wtedvar,posneg, covariates, startcovs,
bcovs, covslincomb, signal=1, direction=1);
data start;
_type_='PARMS';
alpha=0; gamma=30; beta1=&direction*0.0001;
sigma=1.0; &startcovs;
array inwts &weightvars;
do over inwts;
inwts=1/#
end;
run;
proc nlp data=bootsamp technique= trureg nomiss maxiter=10000
maxfunc=10000 inest=start
outest=outstuff noprint;
by replicate ;
*objective function;
max logf;
*define parameters;
parms alpha gamma beta1 &weightvars &bcovs;
*program statements;
term = alpha + beta1 * (&wlincomb ) + &covslincomb;
%if &direction=1 %then %do;
term = alpha + beta1 * (&wlincomb ) + &covslincomb;
mu = gamma*(1-exp(-term)); %end;
%if &direction=-1 %then %do;
term = beta1 * (&wlincomb ) + &covslincomb;
235

mu = alpha+ gamma+(exp(term)); %end;
y = &y;
ssq = (y - mu)**2;
logf= -ssq;
*linear constraints;
lincon &sum = 1;
*bounds on parameters;
bounds &bounds;
run;
data weights;
set outstuff;
where _type_='PARMS';
drop _type_;
dummy=1;
run;
*proc print data=weights;
run;
data together2;
merge bootsamp weights;
by replicate;
&wtedvar = &wlincomb;
%if &direction=1 %then %do;
yy = -log(1-(&y/gamma)); %end;
%if &direction=-1 %then %do;
yy = log((&y-alpha)/gamma); %end;
run;
proc genmod data=together2;
by replicate;
model yy = &wtedvar &covariates/ dist=normal type3;
ods output type3=type3analysis;
* ods output parameterestimates=parameterestimates;
run;
*dm log 'clear';
*dm output 'clear';
data pvalues_;
set type3analysis;
if source="&wtedvar";
dummy=1;
proc means data=pvalues_ noprint;
var chisq;
id dummy;
236

output out=signal sum=sumsignal; run;
data pvalues;
merge pvalues_ signal; by dummy;
if &signal=1 then
signal = chisq/sumsignal; **** signal is relative test
statistic;
if &signal=2 then do;
if ProbChiSq<0.05 then signal=1; **** signal is binary ;
else signal=0;
end;
if &signal=3 then signal=1; ****** for analysis without
bootstrap step;
drop _type_;
run;
data posbeta1 negbeta1;
merge weights pvalues; by replicate;
if beta1>0 then output posbeta1;
if beta1<0 then output negbeta1;
run;
symbol1 v=none i=join c=black;
pattern1 c=green v=solid;
*%dist(posbeta1, &weightvars);
*%dist(negbeta1, &weightvars);
proc means data=&posneg ;*noprint;*negbeta1; *posbeta1;
weight signal; ******************** weighted average;
var &weightvars;
id dummy;
output out=means ;
run;
data means;
set means;
where _stat_='MEAN';
keep &weightvars dummy ;
run;
data three;
merge validation means; by dummy;
wqsfinal =&wlincomb;
run;
237

proc nlin data=three;
parms alpha=0 gamma=40 b1=0 bz=0;
term = b1*wqsfinal + &covslincomb ;
* mu = gamma*(exp(term));
%if &direction=1 %then %do;
mu = alpha+gamma*(1-exp(-term));
%end;
%if &direction=-1 %then %do;
mu = alpha+gamma*(exp(term));
%end;
model y = mu;
run;
%mend;
238

31. Bayesian Methods for Assessing Health Effects of Chemical
Mixtures
Presenting Author: David Dunson
Organization: Duke University
Contributing Authors: David Dunson and Amy Herring
Code:
Not available.
239

32. Assessing Health Effects of Environmental Chemical Mixtures Using
Stepwise Multiple Linear Regression Presenting Author: James Nguyen
Organization: U.S. Environmental Protection Agency, Office of Pesticide Programs
Contributing Authors: James Nguyen
Code:
*========================================================*
* Statistician: James Nguyen *
* Office of Pesticide Programs U.S. EPA *
* *
* Study/Project: Simulated datasets/NIEHS workshop *
* *
* Purpose: Analyze the simulated datasets provided by *
* NIEHS workshop *
* *
* Data Sources: *
* - Dataset1.xls provided by NIEHS *
* - Dataset2.xls provided by NIEHS *
* *
* Notes: *
* *
*=======================================================*;
options formdlim="=" nodate nonumber;
ods noproctitle;
%let dpath=F:\NIEHS workshop\simulated datasets;
%Macro reg(datain=,yvar=, xvar=, groupby=);
ods select none;
ods listing close;
title "&yvar = &xvar";
Proc reg data = &datain outest=est
(keep= _AIC_ _ADJRSQ_ _RMSE_ _MSE_ _RSQ_)
AIC ADJRSQ MSE RSQUARE;
model &yvar = &xvar;
output out = forplot p=Predicted r=residual STUDENT=STUDENT;
ods output ParameterEstimates=Parameter;
quit;title;
Data Parameter;
merge Parameter(drop=Model Dependent Label) est;
run;
ods select default;
Proc print data = Parameter noobs label;
format Estimate StdErr _ADJRSQ_ 10.4 _AIC_ 10.2;
run;
Proc SGPLOT data = ForPlot;
scatter x=predicted y=residual/group=&groupby;
240

refline 0/axis=y;
quit;
/*
Proc SGPLOT data = ForPlot;
scatter x=predicted y=STUDENT/group=&groupby ;
refline 0/axis=y;
refline -2 2/axis=y LINEATTRS=(PATTERN=2);
yaxis label = "Studentized Residuals";
quit;
*/
Proc datasets nolist; delete ForPlot Parameter; quit;
%Mend;
%Macro RegStepwise(datain=, yvar=, varin=, xvar=, plotby=);
ods rtf file="&junk\RegStepwise.rtf" startpage=no bodytitle;
ods select none;
ods listing close;
Proc Reg data = &datain outest=est0
(keep= _AIC_ _ADJRSQ_ _RMSE_ _RSQ_) AIC ADJRSQ RSQUARE;
model &yvar = &varin ;
ods output ParameterEstimates=Parameter0;
output out = forplot0 p=Predicted r=residual STUDENT=STUDENT;;
run;quit;
Data est0;
set est0;
i =0;
run;
Data Parameter0(drop=i);
merge Parameter0(drop=Model Dependent Label) est0;
run;
%let nx = 1;
%let xvar&nx =%nrbquote(%scan(&xvar,&nx, %str( )));
%do %while(&&xvar&nx ^=);
%let nx = %eval(&nx+1);
%let xvar&nx = %nrbquote(%scan(&xvar,&nx, %str( )));
%end;
%let nx = %eval(&nx-1);;
Data Fit; set _NULL_; run;
%do i = 1 %to &nx;
Proc Reg data = &datain outest=est&i
(keep= _AIC_ _ADJRSQ_ _RMSE_) AIC ADJRSQ;
model &yvar = &varin &&xvar&i;
ods output ParameterEstimates=Parameter&i ;
output out = forplot&i p=Predicted r=residual STUDENT=STUDENT;
run;quit;
Data est&i;
set est&i;
241

i =&i;
length newvar $10.;
newVar = "&&xvar&i";
run;
Data Parameter&i(drop=i newVar);
merge Parameter&i(drop=Model Dependent Label) est&i;
run;
Data Fit;
set Fit est&i;
run;
%end;
Proc SQL noprint;
select i into :n
from (select *, max(_ADJRSQ_) as MaxAdj_Rsq
from Fit
having MaxAdj_Rsq=_ADJRSQ_);
quit;
%let n = &n;
ods select default;
Proc print data = Parameter0 label noobs;
format Estimate StdErr 10.4;
run;
Proc SGPLOT data = ForPlot0;
scatter x=predicted y=residual
%if &plotby ^= %then %do;/group=&plotby %end;;
refline 0/axis=y;
quit;
/*
Proc SGPLOT data = ForPlot0;
scatter x=predicted y=STUDENT
%if &plotby ^= %then %do;/group=&plotby %end;;
refline 0/axis=y;
refline -2 2/axis=y LINEATTRS=(PATTERN=2);
yaxis label = "Studentized Residuals";
quit;
*/
Proc print data = Fit noobs; run;
Proc print data = Parameter&n label noobs;
format Estimate StdErr 10.4 ;
run;
Proc SGPLOT data = ForPlot&n;
scatter x=predicted y=residual
%if &plotby ^= %then %do;/group=&plotby %end;;
refline 0/axis=y;
quit;
/*
242

Proc SGPLOT data = ForPlot&n;
scatter x=predicted y=STUDENT
%if &plotby ^= %then %do;/group=&plotby %end;;
refline 0/axis=y;
refline -2 2/axis=y LINEATTRS=(PATTERN=2);
yaxis label = "Studentized Residuals";
quit;
*/
Proc datasets nolist;
delete Fit est0-est&nx Parameter0-Parameter&nx ForPlot0-ForPlot&nx;
quit;
ods rtf close;
%Mend;
*========================> Dataset 1 <=======================*;
*===> read data;
%let junk=C:\Users\JNguyen\Desktop\Junks;
Proc import datafile="&dpath\DataSet1.xlsx" replace dbms=xlsx
out=Dataset1;
getnames=yes;
run;quit;
*===> explore the data;
ods rtf file="&junk\NIEHS dataset1.rtf";
Proc means data = dataset1 mean STD min p25 p50 p75 max maxdec=2;
var Y X1 X2 X3 X4 X5 X6 X7;
run;
ods rtf close;
ods rtf file="&junk\NIEHS dataset1.rtf";
Proc SGSCATTER data = dataset1;
matrix Y X1 X2 X3 X4 X5 X6 X7/diagonal=(histogram) group=Z;
run;
ods rtf close;
ods rtf file="&junk\NIEHS Correlations.rtf" startpage=no bodytitle;
Proc corr data= dataset1 pearson;
var X1 X2 X3 X5 X6 X7;
with X1 X2 X3 X5 X6 X7;
run;
ods rtf close;
*===> analysis to select candidates for stepwise procedure;
title;
ods rtf file="&junk\NIEHS dataset1 Univariate Analysis.rtf" startpage=no bodytitle;
%reg(datain=dataset1,yvar=Y, xvar= Z, groupby=Z);
%reg(datain=dataset1,yvar=Y, xvar= Z X1, groupby=Z);
243

%reg(datain=dataset1,yvar=Y, xvar= Z X2, groupby=Z);
%reg(datain=dataset1,yvar=Y, xvar= Z X3, groupby=Z);
%reg(datain=dataset1,yvar=Y, xvar= Z X4, groupby=Z);
%reg(datain=dataset1,yvar=Y, xvar= Z X5, groupby=Z);
%reg(datain=dataset1,yvar=Y, xvar= Z X6, groupby=Z);
%reg(datain=dataset1,yvar=Y, xvar= Z X7, groupby=Z);
ods rtf close;
*===> Start stepwise procedure;
%RegStepwise(datain=dataset1, yvar=Y, varin= Z,
xvar=X1 X2 X3 X5 X6 X7, plotby=z);
Data dataset1;
set dataset1;
X5Z=X5*Z;
run;
%RegStepwise(datain=dataset1, yvar=Y, varin= Z X5,
xvar=X5Z X1 X2 X3 X6 X7, plotby=z);
Data dataset1;
set dataset1;
X7Z=X7*Z;
X5X7=X5*X7;
run;
%RegStepwise(datain=dataset1, yvar=Y, varin= Z X5 X7,
xvar=X5Z X7Z X5X7 X1 X2 X3 X6 , plotby=z);
Data dataset1;
set dataset1;
X1Z=X1*Z;
X1X5=X1*X5;
X1X7=X1*X7;
run;
%RegStepwise(datain=dataset1, yvar=Y, varin= Z X5 X7 X1,
xvar=X5Z X7Z X5X7 X1Z X1X5 X1X7 X2 X3 X6 , plotby=z);
Data dataset1;
set dataset1;
X2Z=X2*Z;
X2X5=X2*X5;
X2X7=X2*X7;
X1X2=X1*X2;
run;
%RegStepwise(datain=dataset1, yvar=Y, varin= Z X5 X7 X1 X2,
xvar=X5Z X7Z X5X7 X1Z X1X5 X1X7 X2Z X1X2 X2X5 X2X7 X3 X6,
plotby=z);
%RegStepwise(datain=dataset1, yvar=Y, varin= Z X5 X7 X1 X2 X5X7,
xvar=X5Z X7Z X1Z X1X5 X1X7 X2Z X1X2 X2X5 X2X7 X3 X6 ,
244

plotby=z);
%RegStepwise(datain=dataset1, yvar=Y, varin= Z X5 X7 X1 X2 X5X7 X1X2,
xvar=X5Z X7Z X1Z X1X5 X1X7 X2Z X2X5 X2X7 X3 X6 , plotby=z);
%RegStepwise(datain=dataset1, yvar=Y, varin= Z X5 X7 X1 X2 X5X7 X1X2 X5Z,
xvar= X7Z X1Z X1X5 X1X7 X2Z X2X5 X2X7 X3 X6 , plotby=z);
*===> stop the stepwise procedure;
*========================> Dataset 2 <=======================*;
*===> read data;
Proc import datafile="&dpath\DataSet2.xlsx" replace dbms=xlsx
out=Dataset2;
getnames=yes;
run;quit;
*===> explore the data;
ods rtf file="&junk\NIEHS dataset2.rtf";
Proc means data = dataset1 mean STD min p25 p50 p75 max maxdec=2;
var Y Z1 Z2 X1 X2 X3 X4 X5 X6 X7 X8 X9 X10 X11 X12 X13 X14;
run;
ods rtf close;
option orientation = landscape;
ods rtf file="&junk\NIEHS dataset2.rtf";
Proc CORR data = dataset2 ;
var Y Z1 Z2 X1 X2 X3 X4 X5 X6 X7 X8 X9 X10 X11 X12 X13 X14;
with Y Z1 Z2 X1 X2 X3 X4 X5 X6 X7 X8 X9 X10 X11 X12 X13 X14;
run;
ods rtf close;
ods rtf file="&junk\NIEHS dataset2.rtf";
Proc SGSCATTER data = dataset2;
matrix Y Z1 Z2 X1-X14/diagonal=(histogram) group=Z3;
run;
ods rtf close;
*===> univariate analysis with confounders;
ods rtf file="&junk\NIEHS dataset2 Univariate Analysis.rtf" startpage=no bodytitle;
%reg(datain=dataset2,yvar=Y, xvar= Z1);
%reg(datain=dataset2,yvar=Y, xvar= Z2);
%reg(datain=dataset2,yvar=Y, xvar= Z3);
ods rtf close;
*===> stepwise regression with selected confounders;
245

%RegStepwise(datain=dataset2, yvar=Y, varin= , xvar= Z1 Z2 Z3, plotby=);
%RegStepwise(datain=dataset2, yvar=Y, varin= Z3 , xvar= Z1 Z2 , plotby=);
%RegStepwise(datain=dataset2, yvar=Y, varin= Z3 Z2, xvar= Z1 , plotby=);
*===> the final model includes Z2 and Z3;
*===> Analyses to select candidate exposures for stepwise regression;
ods rtf file="&junk\NIEHS dataset2 Univariate Analysis.rtf" startpage=no bodytitle;
%reg(datain=dataset2,yvar=Y, xvar= Z2 Z3 X1, groupby= Z3);
%reg(datain=dataset2,yvar=Y, xvar= Z2 Z3 X2, groupby= Z3);
%reg(datain=dataset2,yvar=Y, xvar= Z2 Z3 X3, groupby= Z3);
%reg(datain=dataset2,yvar=Y, xvar= Z2 Z3 X4, groupby= Z3);
%reg(datain=dataset2,yvar=Y, xvar= Z2 Z3 X5, groupby= Z3);
%reg(datain=dataset2,yvar=Y, xvar= Z2 Z3 X6, groupby= Z3);
%reg(datain=dataset2,yvar=Y, xvar= Z2 Z3 X7, groupby= Z3);
%reg(datain=dataset2,yvar=Y, xvar= Z2 Z3 X8, groupby= Z3);
%reg(datain=dataset2,yvar=Y, xvar= Z2 Z3 X9, groupby= Z3);
%reg(datain=dataset2,yvar=Y, xvar= Z2 Z3 X10, groupby= Z3);
%reg(datain=dataset2,yvar=Y, xvar= Z2 Z3 X11, groupby= Z3);
%reg(datain=dataset2,yvar=Y, xvar= Z2 Z3 X12, groupby= Z3);
%reg(datain=dataset2,yvar=Y, xvar= Z2 Z3 X13, groupby= Z3);
%reg(datain=dataset2,yvar=Y, xvar= Z2 Z3 X14, groupby= Z3);
ods rtf close;
*===> Start stepwise regression procedure;
%RegStepwise(datain=dataset2, yvar=Y,
varin=Z2 Z3 ,
xvar= X1 X2 X3 X3 X5 X6 X7 X8 X9 X10 X11 X12 X13 X14,
plotby=Z3);
Data dataset2;
set dataset2;
Z2X6=Z2*X6;
Z3X6=Z3*X6;
run;
%RegStepwise(datain=dataset2, yvar=Y,
varin=Z2 Z3 X6,
xvar= X1 X2 X3 X3 X5 X7 X8 X9 X10 X11 X12 X13 X14 Z2X6 Z3X6,
plotby=Z3);
Data dataset2;
set dataset2;
Z2X12=Z2*X12;
Z3X12=Z3*X12;
X6X12=X6*X12;
run;
%RegStepwise(datain=dataset2, yvar=Y,
varin=Z2 Z3 X6 X12,
xvar= X1 X2 X3 X3 X5 X7 X8 X9 X10 X11 X13 X14 Z2X6 Z3X6 Z2X12
Z3X12 X6X12,
246

plotby=Z3);
%RegStepwise(datain=dataset2, yvar=Y,
varin=Z2 Z3 X6 X12 Z3X12,
xvar= X1 X2 X3 X3 X5 X7 X8 X9 X10 X11 X13 X14 Z2X6 Z3X6 Z2X12
X6X12,
plotby=Z3);
Data dataset2;
set dataset2;
Z2X10=Z2*X10;
Z3X10=Z3*X10;
X6X10=X6*X10;
X10X12=X10*X12;
run;
%RegStepwise(datain=dataset2, yvar=Y,
varin=Z2 Z3 X6 X12 Z3X12 X10,
xvar= X1 X2 X3 X3 X5 X7 X8 X9 X11 X13 X14 Z2X6 Z3X6 Z2X12 X6X12
Z2X10 Z3X10 X6X10 X10X12,
plotby=Z3);
%RegStepwise(datain=dataset2, yvar=Y,
varin=Z2 Z3 X6 X12 Z3X12 X10 Z2X10,
xvar= X1 X2 X3 X3 X5 X7 X8 X9 X11 X13 X14 Z2X6 Z3X6 Z2X12 X6X12
Z3X10 X6X10 X10X12,
plotby=Z3);
%RegStepwise(datain=dataset2, yvar=Y,
varin=Z2 Z3 X6 X12 Z3X12 X10 Z2X10 Z3X6,
xvar= X1 X2 X3 X3 X5 X7 X8 X9 X11 X13 X14 Z2X6 Z2X12 X6X12 Z3X10
X6X10 X10X12,
plotby=Z3);
Data dataset2;
set dataset2;
Z2X5=Z2*X5;
Z3X5=Z3*X5;
X5X6=X5*X6;
X5X12=X5*X12;
X5X10=X5*X10;
run;
%RegStepwise(datain=dataset2, yvar=Y,
varin=Z2 Z3 X6 X12 Z3X12 X10 Z2X10 Z3X6 X5,
xvar= X1 X2 X3 X3 X7 X8 X9 X11 X13 X14 Z2X6 Z2X12 X6X12 Z3X10
X6X10 X10X12 Z2X5 Z3X5 X5X6 X5X12 X5X10,
plotby=Z3);
Data dataset2;
set dataset2;
Z2X1=Z2*X1;
Z3X1=Z3*X1;
X1X6=X1*X6;
X1X12=X1*X12;
247

X1X10=X1*X10;
X1X5=X1*X5;
run;
%RegStepwise(datain=dataset2, yvar=Y,
varin=Z2 Z3 X6 X12 Z3X12 X10 Z2X10 Z3X6 X5 X1,
xvar= X2 X3 X3 X7 X8 X9 X11 X13 X14 Z2X6 Z2X12 X6X12 Z3X10 X6X10 X10X12
Z2X5 Z3X5 X5X6 X5X12 X5X10 Z2X1 Z3X1 X1X6 X1X12 X1X10 X1X5,
plotby=Z3);
Data dataset2;
set dataset2;
Z2X14=Z2*X14;
Z3X14=Z3*X14;
X6X14=X6*X14;
X12X14=X12*X14;
X10X14=X10*X14;
X5X14=X5*X14;
X1X14=X1*X14;
run;
%RegStepwise(datain=dataset2, yvar=Y,
varin=Z2 Z3 X6 X12 Z3X12 X10 Z2X10 Z3X6 X5 X1 X14,
xvar= X2 X3 X3 X7 X8 X9 X11 X13 Z2X6 Z2X12 X6X12 Z3X10 X6X10 X10X12
Z2X5 Z3X5 X5X6 X5X12 X5X10 Z2X1 Z3X1 X1X6 X1X12 X1X10 X1X5
Z2X14 Z3X14 X6X14 X12X14 X10X14 X5X14 X1X14,
plotby=Z3);
%RegStepwise(datain=dataset2, yvar=Y,
varin=Z2 Z3 X6 X12 Z3X12 X10 Z2X10 Z3X6 X5 X1 X14 Z2X14,
xvar= X2 X3 X3 X7 X8 X9 X11 X13 Z2X6 Z2X12 X6X12 Z3X10 X6X10 X10X12
Z2X5 Z3X5 X5X6 X5X12 X5X10 Z2X1 Z3X1 X1X6 X1X12 X1X10 X1X5
Z3X14 X6X14 X12X14 X10X14 X5X14 X1X14,
plotby=Z3);
%RegStepwise(datain=dataset2, yvar=Y,
varin=Z2 Z3 X6 X12 Z3X12 X10 Z2X10 Z3X6 X5 X1 X14 Z2X14 Z3X5,
xvar= X2 X3 X3 X7 X8 X9 X11 X13 Z2X6 Z2X12 X6X12 Z3X10 X6X10 X10X12
Z2X5 X5X6 X5X12 X5X10 Z2X1 Z3X1 X1X6 X1X12 X1X10 X1X5 Z3X14
X6X14 X12X14 X10X14 X5X14 X1X14,
plotby=Z3);
%RegStepwise(datain=dataset2, yvar=Y,
varin=Z2 Z3 X6 X12 Z3X12 X10 Z2X10 Z3X6 X5 X1 X14 Z2X14 Z3X5 Z3X14,
xvar= X2 X3 X3 X7 X8 X9 X11 X13 Z2X6 Z2X12 X6X12 Z3X10 X6X10 X10X12
Z2X5 X5X6 X5X12 X5X10 Z2X1 Z3X1 X1X6 X1X12 X1X10 X1X5 X6X14
X12X14 X10X14 X5X14 X1X14,
plotby=Z3);
*===> stop the stepwise procedure;
248

33. Traditional Epidemiological Approaches to Analyze Chemical
Mixtures and Human Health Presenting Author: Joseph M. Braun
Organization: Brown University
Contributing Authors: Joseph M. Braun
Code:
Not available.
249