NI Turning Opportunities PP 2 Into Growth 7 · ity shortfalls for paraxylene and propylene, etc....
86
Turning Opportunities Into Growth Annual Report 2007 Year Ended March 31, 2007
Transcript of NI Turning Opportunities PP 2 Into Growth 7 · ity shortfalls for paraxylene and propylene, etc....

Turning Opportunities
Into Growth
NIPPO
NO
ILCO
RPORATIO
NAnnual Report 2007
Annual Report 2007Year Ended March 31, 2007

Founded in 1888, Nippon Oil has been a leading company in the Japanese oil industry for morethan a century. We have the largest oil refining capacity and the top share of fuel sales in Japan.
The OpportunitiesNippon Oil—At a Glance
Market Sector Market Environment Market Data
Exploration &Production (E&P)
Refining andMarketing
Petrochemicals
Gas, Power andRenewables
� Historic surge in crude oil prices
� Fierce competition for natural resources with
the increasing participation of such rising eco-
nomic powers as China and India
� Japanese domestic markets: Oil still main pri-
mary energy source but demand declining
� Asian markets: Demand growing from coun-
tries centered on China
� Demand growing in Asian markets centered
on China
� Despite growth in production capacity in
Asia and the Middle East, continued capac-
ity shortfalls for paraxylene and propylene,
etc.
� Acceleration trend of electric power market
deregulation
� Rising expectations regarding the potential
of next-generation energy systems for coun-
tering global warming
04CY
80
60
40
20
005CY 06CY
Crude Oil Prices (WTI)($/Barrel)
00CY 05CY 10CY0
10
20
30
Projected Demand for Paraxylene in Asia(Millions of tons)
05CY 10CY 20CY0
3
6
9
12
Japanese Government Installation Targets of Stationary Fuel Cells(Million kW)
05CY 10CY0
10
20
30
Projected Demand forOil in Asia(Million BD)
05FY 10FY0
100
200
300
Projected Demand forPetroleum Products in Japan(Million kl)
See Pages 24-25
See Pages 26-31
See Pages 26-29
See Pages 32-35
Source: IEA Source: Ministry of Economy,Trade and Industry
Source: Ministry of Economy, Trade and Industry
A Cautionary Note on Forward-Looking StatementsThe financial forecasts, management targets, and any other estimates and projections of the Company presented in this report are based on information available to management as of the date set forth within.
Please note that actual results may vary significantly from projected forecasts due to various uncertain factors, and, as such, readers should take care when making investment decisions based solely on the forecasts herein.The factors affecting actual results include but are not limited to economic conditions, crude oil prices, demand for and market conditions of oil-related products, and exchange rate and interest rate trends.
* ”FY 2006“ refers to the fiscal year ended March 31, 2007, and other fiscal years are referred to in a corresponding manner.

Annual Report 2007 NIPPON OIL CORPORATION 1
Nippon Oil Nippon Oil Data
� Investment decisions focused on profitability
� Optimal risk-return balance combining
investment in exploration and acquisition of
production assets
� Take a long-term view to expand business
through ongoing improvement of technology
and expertise, centered on our core regions
• Marketing = Shifting Emphasis to Efficiency,Productivity and High Added Value
• Refining = Response to declining domesticdemand for petroleum products
� Growing commissioned Refining operation & Exports� Expanding Electric Power Operations� Full-conversion Strategy� Global Niche strategy for high-performance Chemical Products� Advancing CRI strategy
�Chemical Refinery Integration (CRI) Project
�• Take opportunities of surge demand for
petrochemicals in Asian market� Leveraging Japan’s largest refining capacity to
increase production of petrochemicals� Commenced commercial operation of OCT
installation to boost output of propylene� Manufacturing alliance with Mitsubishi Gas
Chemical Company for paraxylene
0
40
80
120
160
02CY 04CY 06CY
Oil/Gas Production Volume(Thousand BOED)
100
80
60
40
20
002FY 06FY
Refining Capacity UtilizationRate of Nippon Oil Group Refineries(%)
02FY 06FY0
500
1,000
1,500
2,000
2,500
0
500
1,000
1,500
02FY 04FY 06FY
Production Capacity for Paraxylene(Thousands of tons)
Installation of Fuel Cells(Units)
High-Value-AddedDr. Drive Facilities(Number of service stations)
0
200
100
300
400
04FY 05FY 06FY
• Institution of an integrated energy systemstructure to provide wide range energy cus-tomers need� Natural Gas & LNG� Electric power by leveraging the advantage of using
associated gas from refining process or infrastruc-ture of refineries
� Promoting the world's first kerosene- and LPG-powered residential-use fuel cells

NIPPON OIL CORPORATION Annual Report 20072
Fiscal 2001 Fiscal 2004
¥151 billion
¥54 billion
1st MEDIUM-TERM PLANPeriod of realizing the benefitsof the merger
2nd MEDIUM-TERM PLANPeriod of gaining footholds for newbusiness and creating strong positions
3rd MEDIUM-TERM PLANPeriod for building the foundationfor future development
Domestic demand for petroleum products
Overseas demand for petroleum andpetrochemical products
Dealing with environmental issues
Take policies of the2nd medium-term planfurther and develop� Increase earnings steadily
The Nippon Oil Group is aiming for ongoing growth until
fiscal 2010.
Through the first and second medium-term consolidated
management plans, we fundamentally improved our profit
structure. The third medium-term consolidated manage-
ment plan represents a period of building a solid founda-
tion for a future surge. As part of this, we are promoting
growth strategies aimed at establishing an integrated
energy company structure. The fourth medium-term
consolidated management plan will bring major leaps
forward as we achieve ongoing growth.
The Shape of the Nippon Oil Group in Fiscal 2010

Annual Report 2007 NIPPON OIL CORPORATION 3
Fiscal 2007 Fiscal 2010
¥190 billion
4th MEDIUM-TERM PLANPeriod for making major leaps forward
Changes in composition of demand (Ratio of heavy fuel oil C decreases, ratio of light oil rises)Demand will decline, although petroleum will continue to be the main source of energy for the long term.
Stricter environmental regulationsFirst commitment period under the Kyoto Protocol (’08 to ’12)
Growth in Asia (especially China and India)—— Demand outstrips supplyEmergence of an enormous market in Asia
Toward a sustainablegrowth path as anintegrated energycompany
Consolidate positionas an integrated energy company�Make preparations forsteady progress in imple-menting growth strategy
Ordinary income,excluding inventory valuation factors

NIPPON OIL CORPORATION Annual Report 20074
Contents
PERFORMANCE & STRATEGY . . . . . . . . . . . . . . . . . . . . . . . . . . . . . . . . . . . . 5Major Achievements & Topics . . . . . . . . . . . . . . . . . . . . . . . . . . . . . . . . . . . . . . . . . . . . 5Financial Highlights . . . . . . . . . . . . . . . . . . . . . . . . . . . . . . . . . . . . . . . . . . . . . . . . . . . . 6A Message From the Management . . . . . . . . . . . . . . . . . . . . . . . . . . . . . . . . . . . . . . . . 8Interview With the President . . . . . . . . . . . . . . . . . . . . . . . . . . . . . . . . . . . . . . . . . . . . . 10Special Feature: Nippon Oil’s Strategy in Asia . . . . . . . . . . . . . . . . . . . . . . . . . . . . . . . 18
REVIEW OF OPERATIONS . . . . . . . . . . . . . . . . . . . . . . . . . . . . . . . . . . . . . . . . 24Exploration & Production (E&P) . . . . . . . . . . . . . . . . . . . . . . . . . . . . . . . . . . . . . . . . . . 24Refining and Petrochemicals . . . . . . . . . . . . . . . . . . . . . . . . . . . . . . . . . . . . . . . . . . . . . 26Marketing . . . . . . . . . . . . . . . . . . . . . . . . . . . . . . . . . . . . . . . . . . . . . . . . . . . . . . . . . . . . 30Gas, Power and Renewables . . . . . . . . . . . . . . . . . . . . . . . . . . . . . . . . . . . . . . . . . . . . . 32Overseas Operations . . . . . . . . . . . . . . . . . . . . . . . . . . . . . . . . . . . . . . . . . . . . . . . . . . . 36Constructions . . . . . . . . . . . . . . . . . . . . . . . . . . . . . . . . . . . . . . . . . . . . . . . . . . . . . . . . . 37Research & Development . . . . . . . . . . . . . . . . . . . . . . . . . . . . . . . . . . . . . . . . . . . . . . . 38
MANAGEMENT SYSTEM . . . . . . . . . . . . . . . . . . . . . . . . . . . . . . . . . . . . . . . . 40CSR . . . . . . . . . . . . . . . . . . . . . . . . . . . . . . . . . . . . . . . . . . . . . . . . . . . . . . . . . . . . . . . 40Corporate Governance . . . . . . . . . . . . . . . . . . . . . . . . . . . . . . . . . . . . . . . . . . . . . . . . . 44
FINANCIAL SECTION . . . . . . . . . . . . . . . . . . . . . . . . . . . . . . . . . . . . . . . . . . 49Industry Trends and Nippon Oil’s Position . . . . . . . . . . . . . . . . . . . . . . . . . . . . . . . . . . 50Management’s Discussion and Analysis of Operations . . . . . . . . . . . . . . . . . . . . . . . . 56Consolidated Balance Sheets . . . . . . . . . . . . . . . . . . . . . . . . . . . . . . . . . . . . . . . . . . . . 62Consolidated Statements of Income . . . . . . . . . . . . . . . . . . . . . . . . . . . . . . . . . . . . . . . 64Consolidated Statements of Changes in Net Assets . . . . . . . . . . . . . . . . . . . . . . . . . . 65Consolidated Statements of Cash Flows . . . . . . . . . . . . . . . . . . . . . . . . . . . . . . . . . . . 66Notes to Consolidated Financial Statements . . . . . . . . . . . . . . . . . . . . . . . . . . . . . . . . 67Report of Independent Auditors . . . . . . . . . . . . . . . . . . . . . . . . . . . . . . . . . . . . . . . . . . 79
CORPORATE INFORMATION . . . . . . . . . . . . . . . . . . . . . . . . . . . . . . . . . . . . 80Principal Nippon Oil Group Companies . . . . . . . . . . . . . . . . . . . . . . . . . . . . . . . . . . . . 80Overseas Bases . . . . . . . . . . . . . . . . . . . . . . . . . . . . . . . . . . . . . . . . . . . . . . . . . . . . . . . 81Organization Chart . . . . . . . . . . . . . . . . . . . . . . . . . . . . . . . . . . . . . . . . . . . . . . . . . . . . . 82Investor Information . . . . . . . . . . . . . . . . . . . . . . . . . . . . . . . . . . . . . . . . . . . . . . . . . . . 83
NIPPON OIL CORPORATION Annual Report 20074

Annual Report 2007 NIPPON OIL CORPORATION 5
Major Achievements & Topics
Exploration & Production (E&P)■ Start of commercial production at oil field onshore Papua New Guinea (March 2006)■ Conclusion of financing agreement for Tangguh LNG project (August 2006)■ Acquisition of new exploration blocks in U.K. North Sea (February 2007)■ K2 acquisition of an oil and gas interest in the U.S. from Anadarko Petroleum Corporation (May 2007)■ Moved to development stage at Phuong Dong oil field offshore Vietnam (May 2007)
Refining and Petrochemicals■ Commenced commercial operation of Aroma Free (AF) solvent installation (June 2006)■ Completed construction of lubricants and grease manufacturing facility at Yokohama refinery (July 2006)■ Commenced commercial operation of Olefin Conversion Technology (OCT) installation boost output of propylene via
CRI (September 2006)■ Announced plan to save energy and enhance competitiveness at the Mizushima complex (December 2006)
Gas, Power and Renewables■ Launch of ESCO service in Aomori (March 2006)■ Completion of the Mizushima LNG base (April 2006)■ Commenced supply of natural gas to JR East (June 2006)■ Completion of the Hachinohe LNG base (March 2007)■ Launch of B.O.O. service to Fujifilm’s Yoshida-Minami factory (April 2007)■ Installation of residential-use fuel cells in Tokyo Disneyland and public utilities including a fire station in Nagoya (2006)
Overseas Operations■ Developed new blocks at Bulga coal mine in Australia (August 2006)■ Commenced operation of Nippon Oil (Guangzhou) Lubricants Corporation lubricating oil plant (September 2006)■ Commenced operation of lubricant oil and grease plant in the United States (October 2006)■ Formed strategic business and capital alliance with SK Corporation of Korea (January 2007)
Research & Development■ Established ENEOS Hydrogen Trust Fund (March 2006)■ Established Nippon GTL Technology Research Association (October 2006)
PERFORM
ANCE & STRATEGY

NIPPON OIL CORPORATION Annual Report 20076
2001 2002 2003 2004
Net sales . . . . . . . . . . . . . . . . . . . . . . . . . . . . . . . . . . . . . . . . . . . . . ¥4,076,890 ¥3,949,571 ¥4,187,392 ¥4,279,751Cost of sales . . . . . . . . . . . . . . . . . . . . . . . . . . . . . . . . . . . . . . . . . . 3,691,142 3,555,907 3,785,291 3,928,505Selling, general and administrative expenses . . . . . . . . . . . . . . . . 315,668 318,432 305,514 295,328Operating income . . . . . . . . . . . . . . . . . . . . . . . . . . . . . . . . . . . . . 70,079 75,231 96,586 55,918Ordinary income . . . . . . . . . . . . . . . . . . . . . . . . . . . . . . . . . . . . . . 62,929 71,023 90,796 57,089 (excluding inventory valuation factors) . . . . . . . . . . . . . . . . . . . . — 54,400 42,700 81,300Net income (loss) . . . . . . . . . . . . . . . . . . . . . . . . . . . . . . . . . . . . . 29,787 24,006 32,281 (133,526)Total shareholders’ equity . . . . . . . . . . . . . . . . . . . . . . . . . . . . . . . 898,083 924,140 929,987 821,202Total net assets . . . . . . . . . . . . . . . . . . . . . . . . . . . . . . . . . . . . . . . . — — — —Total assets . . . . . . . . . . . . . . . . . . . . . . . . . . . . . . . . . . . . . . . . . . . 3,971,252 3,444,742 3,350,237 3,265,503Total current assets . . . . . . . . . . . . . . . . . . . . . . . . . . . . . . . . . . . . 1,875,218 1,419,282 1,329,230 1,395,336Total current liabilities . . . . . . . . . . . . . . . . . . . . . . . . . . . . . . . . . . 1,807,176 1,411,434 1,388,397 1,433,424Working capital . . . . . . . . . . . . . . . . . . . . . . . . . . . . . . . . . . . . . . . 68,042 7,848 (59,167) (38,088)Capital expenditures . . . . . . . . . . . . . . . . . . . . . . . . . . . . . . . . . . . 69,200 122,500 148,500 136,900Depreciation and amortization . . . . . . . . . . . . . . . . . . . . . . . . . . . 123,367 113,461 99,358 107,045R&D expenditures . . . . . . . . . . . . . . . . . . . . . . . . . . . . . . . . . . . . . 10,218 10,449 10,037 9,685Net interest-bearing debt . . . . . . . . . . . . . . . . . . . . . . . . . . . . . . . 925,900 830,800 940,200 837,800
Amounts per share:Net income (loss) per share . . . . . . . . . . . . . . . . . . . . . . . . . . . 20.28 16.11 21.03 (88.76)Shareholders’ equity per share . . . . . . . . . . . . . . . . . . . . . . . . 611.29 610.43 615.89 544.04Cash dividends per share . . . . . . . . . . . . . . . . . . . . . . . . . . . . . 7.00 7.00 7.00 7.00
Ratio:ROA (Return on assets) . . . . . . . . . . . . . . . . . . . . . . . . . . . . . . 0.77 0.65 0.95 (4.04)ROE (Return on equity) . . . . . . . . . . . . . . . . . . . . . . . . . . . . . . 3.4 2.6 3.5 (15.2)
(excluding inventory valuation factors) . . . . . . . . . . . . . . . . . — — 0.3 (13.6)Net debt-equity ratio . . . . . . . . . . . . . . . . . . . . . . . . . . . . . . . . . 103 90 101 102
Financial Highlights (Years Ended March 31)
2003 2004 2005 2006 20070
50,000
100,000
150,000
200,000
250,000
Capital Expenditures and Depreciationand Amortization(Millions of yen)
2003 2004 2005 2006 20070
50,000
100,000
150,000
200,000
250,000
300,000
350,000
Ordinary Income (Excluding Inventory ValuationFactors) and Ordinary Income(Millions of yen)
■ Ordinary income (excluding inventory valuation factors)■ Ordinary income
■ Capital expenditures ■ Depreciation and amortization

Annual Report 2007 NIPPON OIL CORPORATION 7
Thousands ofMillions of yen U.S. dollars
2005 2006 2007 2007
¥4,924,163 ¥6,117,988 ¥6,624,256 $56,137,7634,437,411 5,521,192 6,176,656 52,344,542
285,281 292,866 287,915 2,439,958201,470 303,930 159,684 1,353,254212,435 309,088 186,611 1,581,449151,700 142,700 195,800 1,659,322131,519 166,510 70,221 595,093953,240 1,130,328 — —
— 1,259,280 1,331,981 11,287,9753,514,352 4,215,611 4,385,533 37,165,5341,569,328 2,128,558 2,262,528 19,173,9661,536,810 1,933,592 2,072,145 17,560,551
32,518 194,966 190,383 1,613,415153,000 189,800 204,800 1,735,593110,031 135,133 131,872 1,117,55911,440 10,103 12,632 107,051
820,700 997,900 1,024,700 8,683,898
Yen U.S. dollars
86.72 114.08 48.12 0.41631.77 775.62 829.64 7.0310.00 12.00 12.00 0.10
%
3.88 4.30 1.6314.8 16.0 5.910.7 6.6 6.4
86 88 84
¥5,954,390
¥407,893¥58,456
¥203,516
Net Sales(Millions of yen)
2003
15
10
5
0
–5
–10
0.3
–13.6
10.7
6.6 6.4
–152004 2005 2006 2007
Return on Equity(Excluding Inventory Valuation Factors)(%)
¥29,341
¥113,811
¥10,083¥6,448
Operating Income(Millions of yen)
■ Refining and marketing ■ Oil and natural gas E&P■ Construction ■ Other
Total¥6,624,256
Total¥159,684
2003 2004 2005 2006 20070
200,000
400,000
600,000
800,000
1,000,000
1,200,000
Net Interest-bearing Debt
(Millions of yen)
2003 2004 2005 2006 20070
200
400
600
800
1,000
Shareholders’ Equity Per Share
(Yen)
PERFORM
ANCE & STRATEGY

NIPPON OIL CORPORATION Annual Report 20078
Long-term Vision
The Nippon Oil Group is aiming to achieve its basic strategy
of becoming an integrated energy company by the end of
fiscal 2010, ending March 31, 2011. Working to realize these
goals, we formulated our third medium-term consolidated
management plan, which positions the three-year period from
fiscal 2005 to fiscal 2007 as a time when we build a solid
foundation for our business. We are executing a range of ini-
tiatives to achieve the aims of the plan.
The Group’s operating environment is undergoing signifi-
cant change, including increasingly fierce international com-
petition for resources and declining demand for petroleum
products in Japan. Seeing this change as an opportunity, we
are aiming to build a business model capable of sustaining
growth while further enhancing corporate value.
Fiscal 2006 Results
In the fiscal year under review, the second year of the third
medium-term consolidated management plan, the Group
posted consolidated net sales of ¥6,624.3 billion, an increase
of 8.3% on the previous fiscal year. Consolidated ordinary
income fell ¥122.5 billion to ¥186.6 billion. This mainly
reflected the negative impact of the inventory valuation fac-
tor, which had significantly boosted ordinary income in the
previous fiscal year. Inventory valuation using the gross aver-
age method affects the cost of goods sold due to fluctuations
in crude oil prices. Excluding this factor, consolidated ordi-
nary income actually increased ¥53.1 billion year on year, to
¥195.8 billion. This was achieved because higher income from
the E&P and petrochemicals businesses, areas we are focus-
ing on in particular as a pillar of our growth strategy, more
than offset lower sales volumes for petroleum products caused
Based on its philosophy, “Creating the energy
future and promoting prosperity and harmony
with nature,” the Nippon Oil Group will make
sustained growth possible by becoming an
integrated energy company.
A Message From the Management
Making Sustained Growth Possible

Annual Report 2007 NIPPON OIL CORPORATION 9
by a record warm winter and the growing shift to different
types of fuels by end-users. ROE was down 10.1 percentage
points at 5.9%, or 0.2 percentage points lower at 6.4%
excluding the inventory valuation factor.
As part of the third medium-term consolidated manage-
ment plan, we reviewed the past level of dividends and set a
target for the annual dividend of ¥12 per share. Accordingly,
the dividend applicable to the fiscal year under review is
unchanged from the previous fiscal year at ¥12.
Toward Sustained Growth
In April 2006, we updated our philosophy, comprising the
Group philosophy, six values we respect and standards of
conduct. As a result, we created the new Group philoso-
phy: “Creating the energy future and promoting prosperity
and harmony with nature.” This emphasizes the concepts
of responsibility for the future of energy and achieving har-
mony with the global environment. Diligently applying this
Fumiaki Watari
Representative Director, Chairman of the Board
Shinji Nishio
Representive Director, President
philosophy in practice to steadily fulfill our responsibilities
to society will play a significant role in boosting the Group’s
corporate value.
In the upcoming final year of the third medium-term
management plan, and through the fourth medium-term
management plan that starts the following fiscal year, we
will work to achieve sustained growth by becoming an inte-
grated energy company.
Fumiaki Watari Shinji Nishio
PERFORM
ANCE & STRATEGY

NIPPON OIL CORPORATION Annual Report 200710
Q1: Review of the fiscal year just ended
Q2: Outlook for refining business
Q3: Response to declining demand for petroleumproducts in Japan
Q4: Ongoing CRI initiatives
Q5: Developments regarding production volumes
Q6: Alliances and global strategy
Q7: Progress toward achieving targets of the thirdmedium-term plan
Q8: Balance between employee andshareholder needs
Q9: Key points for next medium-term plan
Interview With the President
Please review the fiscal year just ended.I can summarize by saying that it was a year in which there were signs of ourstrategies paying off handsomely, although some major issues did emerge.With the third medium-term consolidated management plan, the Nippon Oil Group is aiming to real-
ize consolidated ordinary income of ¥190 billion, excluding inventory valuation factors, in fiscal 2007,
ending March 31, 2008. During the fiscal year under review, which marks the halfway point to this goal,
we recorded ordinary income of ¥186.6 billion, down ¥122.5 billion year on year. However, if inventory
valuation factors are excluded, ordinary income totaled ¥195.8 billion, up ¥53.1 billion year on year. I
believe this indicates that income levels are at healthy levels as we approach the March 2008 target.
In 1998, the year immediately before the merger of Nippon Oil and Mitsubishi Oil, the combination
of the two companies’ results amounted to an ordinary loss of ¥2.4 billion. Subsequently, in the period
from fiscal 1999 to fiscal 2003, ordinary income exclusive of inventory valuation factors remained at low
levels in the range of ¥33.3 billion to ¥62.9 billion. This period was one in which we had to show patience,
as we set about laying the foundations to realize the benefits of the merger and taking the first steps
toward growth. Specifically, we carried out brand and system integration in a short space of time, with no
major disruption, and also made rapid progress in combining our separate corporate cultures. For these
Setting the Stage for a New Phase of Growth
Q1
Shinji Nishio Representative Director, President

Annual Report 2007 NIPPON OIL CORPORATION 11
reasons, this integration is still cited in Japan as an exemplary merger. By fiscal 2003, we had completely
succeeded in establishing systems and a culture to strictly manage return on investments. This was made
possible through achieving a sound balance sheet by fully disposing of legacy negative assets, recognizing
an impairment loss of approximately ¥170 billion in the process. We also built a firm foothold for our
growth strategies by shifting management resources—personnel, assets and funds—into our E&P, Petro-
chemicals and new business such as LNG and fuel cells. From fiscal 2004 onwards, the benefits of long-
term initiatives and the complete establishment of post-merger internal systems, including those to manage
return on investment, began to feed through to the bottom line. During this period, ordinary income
exclusive of inventory valuation factors has been in the ¥142.7 billion to ¥195.8 billion range. While we still
do not believe this is adequate, we see it as a base from which to move on to the next level in responding
to the expectations of all our shareholders.
The fiscal year under review brought major changes in the external operating environment, includ-
ing high crude oil prices and a sharp drop in demand for petroleum products in Japan. The fact that we
achieved a 37% year-on-year increase in ordinary income in real terms in such an environment is due
to the significant contribution to earnings made by the E&P and Petrochemicals businesses. I believe
this is the result of the current management plan focusing on expanding the E&P business and boost-
ing petrochemical production capacity by upgrading our CRI (Chemical Refinery Integration) initiative.
It is also a welcome validation of the plan currently under way.
Such results contrasted with our Refining business, which performed far from adequately. As a
company that operates in an extremely changeable environment, we aim for constant, stable growth
by building a business portfolio that allows other businesses to compensate when a particular business
performs badly. During the year under review, in some ways we can say that this approach was a
success, as we maintained a level of profitability on an overall basis. However, we are by no means
satisfied with this situation. Such low earnings from our core Refining and Marketing businesses, which
are significant elements of the Nippon Oil Group in terms of both assets and sales, is something that
we take very seriously. The extent to which we leverage the benefits and potential of having the top
market share in Japan to improve these businesses will be a major issue in the coming fiscal year. We
are committed to tackling and resolving this issue.
The Refining business faced the challenge of high crude oil prices in the fiscal year under review, and it seems thatsome issues still remain in terms of reducing and passing on costs. What is your outlook for this business?
Higher costs from safety measures implemented ahead of schedule will recedesomewhat. Also, we are seeking our customers’ understanding on price risesfor petroleum products as a result of rising crude oil prices.Major issues during the fiscal year ended March 31, 2007 were continuing problems at refineries and the
costs incurred by them, or by maintenance efforts aimed at preventing such problems in advance. In addition
to these safety measures, we actively brought forward as much other planned spending, including that related
to asbestos countermeasures and soil remediation. This led to an increase in costs. Since the influence of
these factors will disappear from fiscal 2007 onwards, costs will begin to return to normal levels.
Another issue we faced during the year under review was the difficulty in fully reflecting the increased
cost of petroleum products, brought about by the high price of crude oil, in market prices. Everyone
Ordinary Income (Excluding InventoryValuation Factors) and Ordinary Income(Billions of yen)
02FY
400
300
200
100
003FY 04FY 05FY 06FY
Operating Income (FY2006)
Refining andMarketing29.3
Oil and Natural Gas E&P 113.8
Construction10.1
Other 6.5
Q2
■ Ordinary income (excluding inventory valuation factors)■ Ordinary income
(Billions of yen)
PERFORM
ANCE & STRATEGY

NIPPON OIL CORPORATION Annual Report 200712
needs petroleum products, as they are essential to modern lifestyles. We thus see the stable provision
of petroleum products as an important mission to society, and one which we have continuously striven
to fulfill. Customers, though, have to play a part by bearing some of the required costs. However, we
acknowledge the idea that increases in the price of crude oil, that is to say an increase in the input cost
to our downstream operations, is something that we should absorb through our own efforts. Already,
during the past eight years we have achieved around ¥210 billion in cost reductions, reflecting a large
portion of this in the prices of our petroleum products. Of course, cost reduction is a constant theme
for any company, and we do not intend to pull back from such activities. Therefore, for our part, we
must obviously continue to robustly pursue cost cutting. However, with the current high crude oil prices,
it will become necessary to ask our customers to bear some of the burden, even though we are able to
absorb some of these costs through our own efforts. Although crude oil prices may remain high mov-
ing forward, we will work to enhance earnings in our downstream operations by reflecting changing
costs in our product prices, with the understanding of our customers.
As you mentioned, demand for petroleum products dropped sharply in Japan during the fiscal year under review.Can you tell us about your predictions for future developments and how you plan to respond?
We expect demand in Japan to continue to decline, but we are already pursu-ing countermeasures.During the fiscal year under review, demand for petroleum products in Japan fell by 5.2% compared to
the previous year. Although most of the decline in demand for heating fuel was attributable to a record
warm winter, the drop in demand for industrial fuels, gasoline, kerosene and similar fuels was due to the
large impact of end-users switching to different fuels. This trend is being driven by social changes, includ-
ing the spread of hybrid cars and other fuel-efficient vehicles, and the shift to all-electric homes. The
Japanese Government is predicting an annual drop in demand of 1.8% over the next five years, and we at
Nippon Oil feel that fuel-use patterns are currently at a turning point. We believe such developments are
inevitable amid diversification of energy sources driven by a variety of considerations including environ-
mental issues. That is not to say, however, that we are simply sitting idly by while demand for our petro-
leum products decreases. In fact, we are already implementing a range of responses.
First is the institution of an integrated energy system structure to provide energy in a range of
forms other than oil, according to the needs of our customers. However, being an integrated energy
company involves more than simply indiscriminately entering a range of non-oil energy businesses.
Rather, it means expanding our presence in fields peripheral to oil, after thoroughly researching the
fields in which we can leverage the expertise, technology and infrastructure developed through the oil
business, as well as our customer base, to establish Nippon Oil in a competitive position. For example,
in the electric and gas power businesses, we are not competing head-on with dedicated utilities com-
panies. Instead, we are pursuing a niche strategy, limiting ourselves to fields where we can put our
strengths to use. In fuel cells, drawing on the technology and distribution network that we developed in
the oil business, we are aiming to use ongoing innovation to create new markets where Nippon Oil can
capture a leading position.
I would like to introduce some of our concrete initiatives in this area. In the natural gas and LNG
business, during fiscal 2006, we began operating two LNG terminals, using idle land at refineries and
Q3

Annual Report 2007 NIPPON OIL CORPORATION 13
disused oil terminal sites. The terminals act as domestic bases for supplying gas companies and ordi-
nary households. In the electric power business, we expect to acquire generating capacity of roughly
1.8 million kW in fiscal 2008. This will be achieved using electric power generation facilities that make
use of residues generated during the refining process, and a natural gas power plant in Kawasaki that
is under construction in a joint project with Tokyo Gas Co., Ltd., which is scheduled to start operating
in 2008. We are also a pioneer in the field of fuel cells, said to be the ultimate energy system, having
developed the world’s first kerosene- and LPG-powered residential-use fuel cell systems. Although the
business is still in its infancy, based on business alliances with Japan Energy Corporation and Cosmo
Oil Co., Ltd., we are promoting future compatibility with devices of both companies as well as cost
reductions, thus promoting the early adoption of fuel cells powered by oil fuel. We are committed to
implementing these initiatives to realize our Group philosophy, “Your Choice of Energy,” as we move
toward becoming an integrated energy company providing the types of energy required by our cus-
tomers, and to become the leader in the Japanese energy industry. (See the Gas, Power and Renewables
section on page 32 for details.)
Also, despite the fact that demand will decline in Japan, oil is still expected to account for 40% of
primary energy demand in 2030, a forecast echoed by the Government’s national energy strategy.
Transport, in particular, is expected to remain heavily reliant on oil for fuels such as gasoline and jet
fuel. We therefore see a continuing need to fulfill our mission of supplying oil in the form of fuel.
Additionally, if Asia as a whole is considered, demand is actually expected to increase. To respond
flexibly to such overseas demand, we have preempted competitors in improving export facilities at
refineries and boosting our export capacity to 200,000 BD. We aim to develop our presence as an oil
company in Asia by realizing internationally competitive refineries through active efforts to reduce costs
and improve efficiency.
It seems that CRI contributed significantly to earnings in the fiscal year under review. Will this continue from fiscal2008 onwards?
I believe that acting earlier than competitors in upgrading our CRIinitiative has been the most successful strategy of the third medium-termmanagement plan.Both petroleum and petrochemical products are produced by refining crude oil. Accordingly, companies
with oil refining facilities have a distinct advantage over dedicated petrochemical product manufacturers
when it comes to manufacturing base petrochemical products. Nippon Oil has the significant added
advantages of existing expertise and high market share. Specifically, our refining capability is unrivaled in
Japan, we have the advanced technologies and facilities to make high-value-added petrochemical prod-
ucts from middle and heavy distillates, and we have a long history of manufacturing and marketing petro-
chemical products. For example, in paraxylene, one of our mainstay products, we are the world’s second
largest supplier, behind only Exxon Mobil. Additionally, we can realize beneficial synergies with our petro-
leum products business by channeling raw materials into petrochemicals production to alleviate the
problem of excess stocks of petroleum products.
We have identified propylene, paraxylene and benzene as strategic products for CRI. This is
because demand conditions for these three base petrochemical products, and their derivatives, are
Q4
■ Nippon oil sales volumes (right scale)Paraxylene (ACP*1) (left scale)Dubai crude oil (left scale)
Source: IEA
*1: ACP: Asian Contract Price
PERFORM
ANCE & STRATEGY
05CY
In Asia
10CY0
5
10
15
20
25
30
Projected Demand for Oil(Million BD)
02FY 03FY 05FY04FY 06FY0
300
600
900
1,200
0
300
600
900
1,200
Paraxylene and Dubai Crude Oil Prices(Dollars/ton) (Thousands of tons)

NIPPON OIL CORPORATION Annual Report 200714
expected to be tight due to growth and expansion in Asian markets, particularly China. The third
medium-term management plan calls for Nippon Oil to boost its annual production capacity for
propylene and paraxylene to 0.8 million tons and 1.4 million tons, respectively. The Olefin Conver-
sion Technology (OCT) installation at our Kawasaki Operations Center, completed last year, and the
paraxylene manufacturing alliance with Mitsubishi Gas Chemical Company have brought this capac-
ity in range. From fiscal 2007, these various initiatives will make contributions throughout the full
fiscal year, and we will maximize income by further optimizing the production of petroleum prod-
ucts and petrochemical products. (See the Refining and Petrochemicals section on page 26 for details.)
High crude oil prices are boosting income in the E&P business, but production volumes are not increasing. How doyou see things developing?
We do not intend to recklessly pursue production volume to the extent that weoverlook profitability.In the fiscal year under review, ordinary income in the E&P business exceeded ¥100 billion for the first
time, reaching ¥113.8 billion. This performance was helped by crude oil prices reaching record highs
during the period. Since commencing overseas upstream operations in 1968, we have built up technolo-
gies and expertise centered on the four core regions of Southeast Asia, Oceania, the U.K. North Sea and
the U.S. Gulf of Mexico. Believing that this business is the key to the Company’s growth, we have devel-
oped it from a long-term perspective, investing both funds and human resources. These efforts have
borne fruit, and production volumes have grown steadily over the last few years, reaching 153,000 BD in
2006 compared to 66,000 BD in 2003.
One of the pressing issues we face is boosting production and replenishing and expanding reserves.
Looking at the fundamentals, achieving the initial targets of the third medium-term consolidated manage-
ment plan seems challenging. Specifically, our decision to focus on profitability amid an environment of
rising asset valuations caused by high crude oil prices and fierce competition for resources has made it
difficult for us to purchase assets in production. I place greater emphasis on profitability than on simply
increasing production volumes and reserves. We operate our business with funds entrusted to us by
shareholders and this means we cannot neglect profitability for the sake of increasing assets in our upstream
operations. We are interested in long-term expansion of the business rather than achieving short-term
numerical targets. Accordingly, we do not intend to achieve the target by lowering our investment standard.
Rather, we will increase the numbers by taking a long-term view. This will involve concentrating invest-
ment in regions and projects where we can use our expertise, with the aim of minimizing risk and thus
capturing projects with an attractive risk-return ratio. Continuously enhancing our technologies and exper-
tise will also be a factor.
An example of this approach is our May 2007 acquisition of a large-scale oil field already in pro-
duction in the U.S. Gulf of Mexico. We see this oil field as highly economical, as we expect to increase
production through further exploration and development. We have also made the decision to move to
the production stage at the Phuong Dong oil field, located close to the Rang Dong field in Vietnam
where we are currently in production. Since the production, storage and shipping facilities of the Rang
Dong field can be used, this is an economical project with low investment requirements.
Q5

Annual Report 2007 NIPPON OIL CORPORATION 15
Moving forward, our basic approach for this business will be to expand over the long-term by
balancing risk and growth through a combination of asset acquisition, a low-risk activity, and relatively
higher risk exploration activities. To achieve this balance, we will take into account risks and the prices of
production assets at the relevant time. However with the prices of production assets expected to remain
at high levels, we are considering a slight shift in favor of exploration in the fourth medium-term consoli-
dated management plan. We plan to move forward to create an exploration investment portfolio with a
balanced risk profile. This will be achieved by balancing low-risk projects with high upside potential of
peripheral areas of our oil fields in production, mainly in the four core regions where we have extensive
expertise, with high-risk, high-return projects such as deep-water exploration, which offers the possibility
of yielding large-scale reserves. (See the Exploration & Production section on page 24 for details.)
In addition to your alliance with Japan Energy Corporation designed to augment refining competitiveness in theAsia region, you have formed a tie-up with SK Corporation of Korea and concluded a memorandum of understand-ing on long-term cooperation with China National Petroleum Company (CNPC). How do these alliances fit in withyour strategy to expand the business globally?
We consider the oversupply problems in Japan and our Asia strategy as one.Our alliance with Japan Energy is wide-ranging, but the most promising element of it is the integrated
operation of our adjacent refineries in the Mizushima complex. The aim is to combine the respective
strengths of the two refineries: the comprehensive petrochemical production facilities and export-focused
shipping facilities of the Nippon Oil Group, and the extensive heavy oil cracking facilities of Japan
Energy. In this way, we are aiming to develop a refinery that is competitive on an international scale to
a level that would be impossible by either company acting alone.
The tie-up with SK Corporation and long-term cooperation with CNPC are aimed at creating a
strategy for the Asia market as a whole in conjunction with the top oil companies in their respective
countries. Currently, various teams are carrying out studies, but we are confident that these alliances
will produce real results. (See the Strategy in Asia section on page 18 for details.)
As I have already mentioned, demand for petroleum products in Japan is declining. Failure to
respond to this will result in oversupply, and this is recognized as a problem throughout the industry.
At Nippon Oil, we are examining strategies to help us prevail in such an environment based on every
possible scenario.
Fiscal 2007 marks the final year of the third medium-term consolidated management plan. Can you tell us aboutthe progress made so far and your forecast for achieving your targets?
Target for ordinary incomeOrdinary income for fiscal 2008 is expected to exceed the ¥190 billion target, excluding inventory valu-
ation factors. We are also making efforts to achieve the 10% target for ROE.
Cutting costs and improving efficiencyWe are aiming to capture ¥17 billion from cost reductions and improved efficiency. In the last two
years, costs have increased by ¥6.9 billion. However this was partly attributable to changes in the operating
Q6
Q7
PERFORM
ANCE & STRATEGY
02CY 03CY 05CY04CY 06CY0
20
40
60
80
0
40
80
120
160
Nippon Oil Group’s Production Volume/Crude Oil Price(Thousand BOED) ($/Barrel)

NIPPON OIL CORPORATION Annual Report 200716
environment including the high price of crude oil and equipment and materials. Another cause was
costs associated with improving safety measures at refineries and environmental activities. In fiscal
2007, we are projecting a reverse of these costs and coupled with a range of rationalization and effi-
ciency improvement measures, including enhanced distribution efficiency, we expect to meet our tar-
get for cost reductions and improvements in efficiency.
Capital expendituresThe medium-term management plan initially called for capital expenditures of ¥500 billion over the term
of the plan, focused on growth areas. This reflected the need to earmark the majority of cash flows as a
foundation for realizing our growth strategy. However, we now expect capital expenditures over the term
to amount to ¥686 billion, due to factors including a need to build up investment aimed at strengthening
our growth strategies, such as the E&P business and petrochemical business. Specifically, we plan to use the
increase for a higher number of investment opportunities on which we expect a return than was envisaged
in the original plan. These potential investment targets have been selected based on stringent assessments.
Interest-bearing debtIt will be difficult to reduce the level of interest-bearing debt below the plan’s initial target of ¥900 billion
by March 31, 2008. This is mainly because of the impact of increased working capital caused by high
crude oil prices. However, we expect to slightly exceed the initial target of 70% for the ratio of interest-
bearing debt to equity.
As the President, how do you balance the needs of shareholders and employees, both two important stakeholder groups?We strive to meet the expectations of shareholders while also taking goodcare of our employees.Since we operate our business using funds entrusted to us by shareholders, we have a responsi-
bility to use this investment to boost income and provide returns. To achieve increased income, it
is of course essential to respect employees, business partners and customers, and comply with
laws and regulations. It is, however, also essential to conduct business activities in a fair and
honest manner and diligently fulfill our corporate social responsibility (CSR) through environ-
mental and safety initiatives.
Nippon Oil has taken the initiative in responding to the changing environment by pursuing growth.
The attitude of our employees is the driving force behind this. This attitude, which allows employees to
cope with change, stems from the corporate culture created following the 1999 merger of Nippon Oil
and Mitsubishi Oil, which combined the best aspects of our respective corporate cultures. The Com-
pany was ranked in the top 20 in the Best Companies to Work For survey conducted by the Great Place
to Work® Institute Japan in 2006. Also, a survey of the level of awareness of CSR and corporate ethics
among our corporate officers and employees found that trust in the Company, employee motivation,
and sense of involvement in CSR were all at high levels. This kind of ethical attitude and motivation is
something we must maintain and enhance by continuing to nurture our employees. However, this is
not any indication of the relative priority given to employees, nor does it mean that all our efforts are
for the benefit of employees alone.
Q8
Strategic investment464
Refining and marketing 162
Other 60
Total686
Breakdown of Capital Expenditures in ThirdMedium-term Management Plan (05FY-07FY)(Billions of yen)

Annual Report 2007 NIPPON OIL CORPORATION 17
Moving forward, in an operating environment characterized by dramatic change and intensify-
ing competition, continued growth of the Company will only be possible if we win the trust of cus-
tomers by helping to enrich their lifestyles through the ethical attitudes and high levels of CSR
awareness of our employees. It is this growth that will enhance corporate value, and ultimately re-
turn profits to our shareholders.
Finally, what do you consider the key points for the next medium-term consolidated management plan?Our operating environment has changed significantly since we formulated the last medium-term man-
agement plan. However, the changes that we face going forward will be even more dramatic, with
decreasing demand for oil in Japan, rising demand for oil and petrochemicals in Asia, higher crude oil
prices, fierce competition for natural resources, and ever more severe environmental problems.
Our fourth medium-term consolidated management plan will start in fiscal 2008. It will focus on
successfully responding to the changes in our operating environment. Nippon Oil is currently faced
with significant risks, but also significant opportunities. The main challenge of the next medium-term
management plan will be the extent to which these risks can be properly managed and the degree to
which we can tap into business opportunities through shrewd use of our resources, all with an eye on
the changing operating environment. In preparation for this, we are currently focusing our expertise on
business strategy, investment strategy, shareholder returns and other aspects of capital strategy, and
our internal systems.
Despite the significant changes in operating environment, our basic strategy of becoming an inte-
grated energy company will still form the basis of the fourth medium-term plan. With the decline in
demand for petroleum products in Japan, I believe that steadily working on this basic strategy will be
more important than ever in growing the Company and increasing corporate value. The application of
initiatives based on this basic strategy throughout the period of the first three medium-term consoli-
dated management plans has created a foundation for our future. Moving forward, we will continue to
bolster this base while reaping the benefits of business and improvement initiatives we have imple-
mented to date.
Q9
PERFORM
ANCE & STRATEGY

NIPPON OIL CORPORATION Annual Report 200718
Special Feature
Nippon Oil’s Strategy in Asia
Nippon Oil aims to be an integrated energy company. This strategy is not limited to Japan, but isessential for us to realize sustainable growth in Asia. We are steadily progressing our strategyfor Asia, centered on our Exploration & Production, Refining, and Lubricants businesses.
Exploration & Production (E&P)We consider Southeast Asia to be the mostimportant of the core regions of our E&Pbusiness. We produce oil and natural gasas an operator at fields in Vietnam and Ma-laysia, and aim to use our expertise in thisregion to expand our business.
RefiningWe expect huge growth in demand forpetroleum products and petrochemicalproducts. We will firmly seize growth op-portunities in Asia through initiatives suchas our commissioned refining operationsfor China Oil , the boost ing of ourparaxylene production capacity and theconstruction of propylene facilities focusedon exports.
Commissioned Refining for China Oil(Thousand BD)
2005 200620040
10
20,
30
40
Oil and Natural Gas in Southeast Asia(Thousand BOED)
0
30
60
90
120
2005 20062004
NIPPON OIL CORPORATION Annual Report 200718

Annual Report 2007 NIPPON OIL CORPORATION 19
LubricantsIn 2007, we will strengthen our overseassales of lubricants using our network ofbases that we spread across Asia withthe construction of a two-base manufac-turing network serving northern andsouthern China.
Exploration & Production (E&P) LubricantsVietnamMalaysiaMyanmarIndonesia
RefiningCommissioned refining operations for and long-term col-laboration with China OilComprehensive business alliance with SK CorporationIncreased export capacity of petroleum productsIncreased exports of petrochemical products
Lubricating oil operations in China (includingKaramay refrigeration lubricant)
Ove
rsea
s Bas
esBu
sines
s or P
roje
ct
NOEX (Malaysia) Ltd, Miri OfficeNOEX (Malaysia) Ltd, Kuala Lumpur OfficeJapan Vietnam Petroleum Co., Ltd
Vietnam office (Vung Tau)
Nippon Oil Corporation, Beijing OfficeNippon Oil Corporation, Jakarta OfficeNippon Oil (Thailand) Ltd.Taiwan Nisseki Co., Ltd.Nippon Oil (Shanghai) CorporationTianjin Nisseki Lubricants & Grease Co., Ltd.Nippon Oil (Guangzhou) Lubricants CorporationNippon Oil Malaysia Sdn. Bhd.
Nippon Oil’s Businesses in Asia
Lubricant Sales in Asia(Thousand kl)
2005 200620040
40
80
120
160
PERFORM
ANCE & STRATEGY
Annual Report 2007 NIPPON OIL CORPORATION 19

NIPPON OIL CORPORATION Annual Report 200720
The Nippon Oil Group’s E&P businesses in Southeast Asia comprise crude oil and natural gas
production in Vietnam, Malaysia and Myanmar. We are also involved in work to develop gas
fields and construct an LNG plant as part of the Tangguh project in Indonesia in preparation
for the 2008 launch of our new LNG business, encompassing the production of gas and
production and marketing of LNG.
VietnamThis is one of the Company’s main projects, and since the 1992 acquisition of interests in this
project, we have moved into exploration, development and production as an operator.
Cumulative production volume in the Rang Dong oil field exceeded 135 million barrels. The
oil field itself is unique in that it consists of a reservoir in a fracture within the granite bed-
rock. The Nippon Oil Group’s fracture analysis technology is highly regarded worldwide. Other
features of our operations at this oil field include the use of solar and wind power to provide
some of the power used at our offshore production facilities. Also, a project whereby associ-
ated gas generated during production is effectively used by piping it to power plants in Viet-
nam was recognized as a Clean Development Mechanism (CDM) Project under the Kyoto
protocol in February 2006. This has reduced annual emissions of greenhouse gases by annual
average 680,000 tons and demonstrates the environmentally friendly aspect of this project.
In addition to the analysis and environmental technologies introduced above, the Group
aims to use its horizontal drilling and other technologies to further increase production volumes
and enable stable operations.
MalaysiaOur Malaysian project comprises an LNG business featuring an integrated operating system cover-
ing upstream through to downstream operations. Since acquiring an interest in the SK-10 block in
1987 we have moved into exploration, development and production as an operator. In 1989, we
also acquired an interest in the SK-8 block. The natural gas produced from these blocks, located
offshore Sarawak, Malaysia, is sent via pipeline to the liquefaction plant of Malaysia LNG Tiga Sdn
Bhd, in which Nippon Oil has a 10% interest, to be processed into LNG and sold. The plant pro-
duced 6.9 million tons of LNG in fiscal 2006. The condensate produced in association with natural
gas is also sold.
MyanmarProduction of natural gas began in May 2000 in gas fields discovered in December 1992. The gas
is sold via pipeline to PTT, Thailand’s state oil company. The condensate associated with natural gas
production is also sold, as with the project in Malaysia.
IndonesiaThe Nippon Oil Group became involved in the Tangguh project at the exploration stage, earlier than
most of its partners. This is our second LNG project after the Tiga project in Malaysia, and we are
developing gas fields and constructing an LNG plant with a capacity of approximately 7.6 million
tons per year in preparation to begin LNG production at the end of 2008.
Exploration & Production (E&P)
Production Facility Oil Storage Barge
Reservoir
Reservoir
Sandstone
Granite Bedrock
Overview of Rang Dong Oil Field
Oil Storage Barge

Annual Report 2007 NIPPON OIL CORPORATION 21
Project Company
Shareholdings (Equity Interest)
Status
Interest Held
Partners (Interest Held)
Production Volume (Entitlement Basis)
Nippon Oil Exploration (Myanmar), Limited
Nippon Oil Exploration (50%)Japanese Government (50%)
Exploration/Development/Production
19.3%
*Petronas Carigali (40%)MOGE (20.5%)PTTEP (19.3%)
10,000 BOED
Blocks M-12/13/14
Gas FieldGas PipelineInterest held by Nisseki Myanmar Oil Development Co., Ltd.
M14
M12
Yadana
Yangon
Bangkok
Ratachaburi
M13
Myanmar
Thailand
Yetagun
Vietnam
Ho Chi Minh
Vung Tau
Su Tu Den Ruby
Phuong Dong
Rang Dong
Te Gioc Trang
Ca Ngu Vang
Bach HoRong
Oil FieldGas FieldOil PipelineGas PipelineInterest held by Japan Vietnam Petroleum Company, Ltd.Interest held by Nippon Oil
Dai Hung
15-2
05-1b
05-1c
Project Company
Shareholdings (Equity Interest)
Status
Interest Held
Partners (Interest Held)
Production Volume (Entitlement Basis)
*Japan Vietnam Petroleum Company, Ltd.
Nippon Oil Exploration Group (97.1%)Mitsubishi Corporation (2.9%)
Exploration/Development/Production
46.50%
PVEP (17.5%)ConocoPhillips Company (36.0%)
18,000 BOED
15-2 Block
05-1b/c BlockProject Company
Status
Interest Held
Partners (Interest Held)
Nippon Oil Exploration Limited
Exploration
35%
*Idemitsu Oil and Gas Co., Ltd. (35%)INPEX Holdings Inc. (30%)
*Denotes operator
Project Company
Shareholdings (Equity Interest)
Status
Interest Held
Production Volume (Entitlement Basis)
Nippon Oil Exploration (Malaysia), Limited
Nippon Oil Exploration Group (78.73%)INPEX Holdings Inc. (15%)Mitsubishi Corporation (6.27%)
Exploration/Development/Production
75%
32,000 BOED
Heran Gas Field etc. (SK-10)
Partners (Interest Held) Petronas Carigali Sdn. Bhd. (25%)
Project Company
Shareholdings (Equity Interest)
Status
Interest Held
Production Volume (Entitlement Basis)
Nippon Oil Exploration (Sarawak), Limited
Nippon Oil Exploration Group (76.5%)INPEX Holdings Inc. (15%)Mitsubishi Corporation (8.5%)
Exploration/Development/Production
37.50%
44,000 BOED
Serai Gas Field etc. (SK-8)
Partners (Interest Held) *Shell (37.5%)Petronas Carigali Sdn. Bhd. (25%)
*Denotes operator
Malaysia
Brunei
Helang
Layang
CilipadiBijan
Selasih
SaderiSeraiJintan
M1
M3F12
F6
E11
B11
F13
Bintulu
Miri
Oil FieldGas FieldOil PipelineGas PipelineInterest held by Nisseki Malaysia Oil Development Co., Ltd.Interest held by Nisseki Sarawak Oil Development Co., Ltd.
Project Company
Shareholdings (Equity Interest)
Status
Interest Held
Partners (Interest Held)
Gross Production Volume
Nippon Oil Exploration (Berau), Limited
Nippon Oil Exploration (51%)JOGMEC (49%)
Development
12.2%
*BP (37.2%)CNOOC (17.0%)MI Berau B.V. (16.3%)KG Berau Petroleum Ltd./
KG Wiriagar Petroleum Ltd. (10.0%)LNG Japan (7.3%)
LNG: 7.6 million tons per year (planned)
Berau, Wiriagar and Muturi Blocks
Interest Held
Partners (Interest Held)
17.1%
*BP (48.0%)MI Berau B.V. (22.9%)KG Berau Petroleum Ltd. (12.0%)
Berau Block
Mogoi DeepWiriagar Deep
Vorwata
Roabiba
Ofaweri
WosUbadari
Wiriagar Muturi
Berau
Gas FieldInterest held by Nisseki Berau Oil Development Co., Ltd.Berau, Wiriagar and Muturi blocks
*Denotes operator
Vietnam Malaysia
Indonesia Myanmar
PERFORM
ANCE & STRATEGY
Annual Report 2007 NIPPON OIL CORPORATION 21

NIPPON OIL CORPORATION Annual Report 200722
Refining
Expanding Business Opportunities in AsiaIn contrast to the expected decline in demand for petroleum products in Japan, demand in
China and other Asian countries is projected to increase. In particular, a certain level of growth
in Asia is expected for heavy fuel oil, while demand is anticipated to drop significantly in Japan.
In such circumstances, we have increased loading capacity at refineries for export prod-
ucts to 200,000 BD, and plan to increase this further to 230,000 BD during fiscal 2007.
We have also agreed to increase the volume of commissioned refining for China National
United Oil Corporation (China Oil) to 50,000 BD from April 2007. This project utilizes our
refining capacity, which is the largest in Japan, and offers the same benefits as secure ongo-
ing exports. Accordingly, the project is mutually beneficial to both companies.
Alliances to Enhance Our International CompetitivenessWe are increasing exports of petroleum products, but competition in the international market remains
fierce. Enhancing the competitiveness of our refineries is therefore a key issue. The Nippon Oil Group
has a track record of making use of outside consultants to perform comparative evaluations of refinery
competitiveness and devising strategies aimed at creating a highly competitive refining group in the
Asia region.
In June 2006, we concluded a comprehensive business alliance with Japan Energy Corporation.
The agreement aims to enhance the competitiveness of a full range of areas, including upstream
operations, refining, distribution and fuel cells, but the main focus is on integrating operations at
both companies’ Mizushima refineries. The ultimate aim is to develop refineries which are highly
competitive internationally.
Nippon Oil has also agreed to enter into a strategic business and capital alliance with SK
Corporation of Korea. Working in tandem, the companies will pursue growth strategies includ-
ing enhancing the competitiveness of our refining and petrochemicals operations in Asia, and
expanding overseas business.
In April 2007, we also concluded a memorandum of understanding regarding long-term
collaboration with China National Petroleum Corporation (CNPC), the parent company of
China Oil with which we have maintained a good relationship through commissioned refin-
ing operations. Under this agreement, the companies aim to further enhance their current
positive relationship through joint activities and cooperation in a wide range of fields cover-
ing upstream and downstream operations, and including new energy and energy-saving activi-
ties. Moving forward, the companies will grow together leveraging their respective competitive
advantages.
CRI StrategyOur Chemical Refinery Integration (CRI) strategy aims to bolster the Company’s propylene and
paraxylene operations for the rapidly growing Asian market by leveraging our strengths in refining
operations. For propylene, we constructed an Olefin Conversion Technology (OCT) installation
focused on exports at our Kawasaki Operations Center. This facility, which includes a refrigeration
tank and loading facilities for large vessels, commenced full-scale operation in September 2006.
We will also respond to future growth in paraxylene demand from Asia by working to raise
paraxylene production capacity to 1.4 million tons through the CCR-PLAT reformer installation at
the Sendai refinery and a business alliance with Mitsubishi Gas Chemical.
Long-term Collaboration
Strategic Business and Capital Alliance
Alliances With Asian Oil Companies
Signing ceremony for long-term collaboration with CNPC

Annual Report 2007 NIPPON OIL CORPORATION 23
Lubricants
Two-base Lubricant Manufacturing Network Serving Northern andSouthern ChinaIn September 2006, Nippon Oil commenced full-scale operation of a lubricant plant in
Guangzhou, China, with an annual capacity of 27,000kl. There is a growing number of
automakers and other companies expanding their manufacturing activities in Guangzhou and
the surrounding south China region, leading to soaring demand for lubricants.
Nippon Oil is putting its proprietary technologies to work at this new lubricant production
plant in the region, manufacturing and marketing products including auto engine oil that
supports high levels of fuel efficiency, and environmentally friendly lubricating oil for indus-
trial users. The plant also manufactures and markets lubricating oil for ships, taking advan-
tage of its prime location in the Pearl River delta, which is ideally located for sea transport.
This new plant joins the Tianjin Nisseki Lubricants & Grease Co., Ltd. plant, at which pro-
duction capacity was increased in May 2006. As a result, we now have a two-base manufac-
turing network serving the northern and southern regions of China, and the Nippon Oil Group
has boosted its annual production capacity for lubricants in China to 82,000kl.
We also market refrigeration oil for household appliances based on an exclusive manu-
facturing and marketing agreement with the CNPC Group. Refrigeration oil is used in com-
pressor units that drive air conditioners, refrigerators and other cooling devices, and as such,
requires high technical specifications and strict quality management. The CNPC Group has
made use of our advanced base-oil manufacturing and commercialization technologies to
produce refrigeration oil at its local refineries. We anticipate strong sales growth amid surg-
ing demand for refrigerators and air conditioners in the domestic Chinese market.
We are also rolling out our ENEOS-brand high-performance automotive oil in China. This
oil is sold at our service stations in Japan and is well supported by consumers. Going for-
ward, we will substantially strengthen our lubricants business in China as well as expanding
the marketing of ENOS-brand oil.
Nippon Oil Corporation Beijing Office
Nippon Oil Corporation Jakarta OfficeTianjin Nisseki
Nippon Oil (Shanghai)
Nippon Oil (Guangzhou)Taiwan Nisseki
Nippon Oil (Thailand)
Nippon Oil Malaysia
Nippon Oil Bases of Lubricants Business in Asia
31
4
5 6
7
8
1
2
3
4
5
6
7
Representative & Overseas Offices of
Nippon Oil Corporation
Overseas Sales of Lubricating Oil(Thousand kl)
2005 (Actual) 2006 (Actual) 2007 (Forecast)
China 49 66 84
Other Asia 75 85 94
Asia Total 124 151 178
2
8
ENEOS-brand Oil
PERFORM
ANCE & STRATEGY
Annual Report 2007 NIPPON OIL CORPORATION 23

NIPPON OIL CORPORATION Annual Report 200724
Positioning of Upstream Operations in the Nippon Oil Group
Oil and gas exploration and production (E&P) activities are an increasingly important part of
the Nippon Oil Group’s growth strategy. In its third management plan (2005–2007) the Group
has the goal of boosting its production to 180,000 BOED in 2007 on an equity basis according
to our investment in the project companies. However, achieving this within the planned time
frame now looks challenging because of difficulties in making effective asset purchases and
investment in exploration blocks. These difficulties are due to changes in the business environ-
ment since the plan was formulated, specifically, fierce competition for resources and rises in
the cost of procured equipment and materials. Despite this, the Nippon Oil Group will empha-
size profitability, as it implements strategies geared toward expanding its business while con-
stantly monitoring changes in the market.
The Nippon Oil Group focuses its management resources on its four core areas of South-
east Asia, the U.K. North Sea region, the U.S. Gulf of Mexico region, and Oceania. Additionally,
the Group is enhancing its exploration activities to further replenish reserves which are essen-
tial for E&P business continuation. We plan to move forward to create an exploration invest-
ment portfolio with a balanced risk profile. This will be achieved by combining asset acquisition
in peripheral areas of our oil fields in production, where we have extensive expertise and new
exploration activities in North Africa and the Middle East and in deep with high potential.
Also, the Nippon Oil Group is actively expanding its operations of natural gas and LNG-
related business (See page 32). We are participating in the Malaysia LNG Tiga Project and Indonesia
Tangguh LNG project, both of which are covering processes from exploration and development
to liquefaction and marketing.
Exploration & Production (E&P)Major Achievements & Topics■ Start of commercial production at oil field onshore Papua New Guinea (March 2006)
■ Conclusion of financing agreement for Tangguh LNG project (August 2006)
■ Acquisition of new exploration blocks in U.K. North Sea (February 2007)
■ K2 acquisition of an oil and gas interest in the U.S. from Anadarko Petroleum Corpora-
tion (May 2007)
■ Moved to development stage at Phuong Dong oil field offshore Vietnam (May 2007)
Review of Operations

Annual Report 2007 NIPPON OIL CORPORATION 25
04CY 05CY 06CY0
30,000
60,000
90,000
120,000
Exploration & Production Operating Profit(Millions of yen)
K2 oil field
04CY 05CY 06CY0
10
20
30
40
0
30
60
90
120
R/P and RRR(Years) (%)
Activities During Fiscal 2006 and in the Near Future
In the E&P Business, in October 2006, we began construction work to expand facilities at the Rang
Dong oil field in Vietnam, with the aim of increasing crude oil production. We are also preparing
to start production in the Blane oil field in the North Sea during 2007. Meanwhile, work to develop
gas fields and build an LNG plant are proceeding smoothly at the Tangguh LNG project in Indo-
nesia, with supplies of LNG scheduled to start at the end of 2008. Looking at the oil sand busi-
ness in Canada, completion of the Syncrude 21 Stage 3 expansion project boosted capacity to
350,000 BD, of which the Nippon Oil Group is entitled to 17,500 BD.
In Vietnam, we made the decision to move to the development stage at the Phuong Dong
oil field, located close to the Rang Dong oil field where we are engaged in production. This
enables low-cost production at the Phuong Dong field by making use of the production, stor-
age and loading facilities of the Rang Dong field. Production at the Phung Dong field is slated
to commence at the end of September 2008. Initial production volume is expected to be 23,000
BD. We have also decided to move to the development stage at the Saderi gas field in Malaysia.
In addition, the Group was awarded interests in six new exploration blocks in the U.K.
North Sea in a licensing round held by the U.K. government in 2006. The Group is operator in
four of the licenses.
Average production volumes for Group companies during the fiscal year under review
were slightly down year on year at 152,000 BD. This reflected delays to make facilities opera-
tional again in the U.S. Gulf of Mexico region, which suffered hurricane damage in August
2005, as well as difficulty in making effective investments due to intensified competition for
resources and higher prices of procured equipment and materials.
Furthermore, in May 2007, we made a joint bid with Mitsubishi Corporation to purchase a
23.2% stake in the K2 oil field from Anadarko Petroleum Corporation, a major U.S. indepen-
dent oil company, which held a total 65% stake. Of this, Nippon Oil holds an 11.6% stake in
the field. The K2 field is located in deep waters offshore the state of Louisiana and currently
produces 40,000 BD of crude oil and natural gas. Large oil and gas fields are continuing to be
discovered and developed in the area around the K2 field, and further exploration and devel-
opment is expected to yield increased oil reserves in the future. Network
■ Area of production■ Area of development■ Area of exploration■ Office
R/P (reserve-production ratio)=Confirmed and estimatedreserves at end of period/Production volume during period(left scale)RRR (reserve replenishment ratio)=Confirmed and estimatedreserves at end of period plus production volume duringperiod/production volume during period (right scale)
REVIEW O
F OPERATIO
NS

NIPPON OIL CORPORATION Annual Report 200726
Refining and PetrochemicalsMajor Achievements & Topics■ Commenced commercial operation of Aroma Free (AF) solvent installation (June 2006)
■ Completed construction of lubricants and grease manufacturing facility at Yokohama
refinery (July 2006)
■ Commenced commercial operation of Olefin Conversion Technology (OCT) installation
boost output of propylene via CRI (September 2006)
■ Announced plan to save energy and enhance competitiveness at the Mizushima com-
plex (December 2006)
Response to Declining Demand for Petroleum Products in Japan
In response to a changing operating environment due to declining demand for petroleum
products in Japan, the Nippon Oil Group is working to thoroughly reduce costs and improve
efficiency while also preempting competitors in engaging in a range of response initiatives.
Growing Commissioned Refining Operations and Exports
In 2006, demand for petroleum products in Japan fell 5.2% year on year. In particular, demand
for gasoline fell by 1.5% and demand for heavy fuel oil A and heavy fuel oil C fell significantly as
the shift to gas and coal progressed. Looking forward, no great change is expected in this trend.
In contrast, we expect demand for petroleum and petrochemical products in the Asian
region, particularly in China and India, to grow along with the region’s economic develop-
ment. Moreover, the progressive implementation of environmental regulations is boosting
demand for low-sulfur (10 to 50ppm) diesel fuel.
In response to these contrasting domestic and overseas situations, the Nippon Oil Group
intends to proactively expand its exports of jet fuel, low-sulfur diesel fuel, heavy fuel oil C, and
other petroleum products in addition to efforts to grow commissioned refining operations.
Accordingly, the Group plans to strengthen its export capacity of each of its refineries. In the
first stage of this project, we invested a total of ¥1.1 billion in fiscal 2006 to increase capacity of
the export facility to 200,000 BD. We plan to increase this further to 230,000 BD during fiscal
2007. These efforts will enable us to respond flexibly to both demand in Japan and exports
based on trends in overseas petroleum product markets.

Annual Report 2007 NIPPON OIL CORPORATION 27
Furthermore, the Group increased the volume of commissioned crude oil refining opera-
tions on behalf of China National United Oil Corporation (China Oil). Increasing demand for
petroleum products in China has steadily boosted this volume each year since we undertook the
commissioned refining of 20,000 BD in July 2004, increasing to 50,000 BD from April 2007. This
deal is one example of how we export petroleum products. It also benefits both parties by utiliz-
ing Japan’s largest refining capacity to allow both Nippon Oil and China Oil to secure ongoing
supplies of the products they require. We also concluded a memorandum of understanding with
CNPC, China Oil’s parent company, indicating the two companies’ intention to grow together by
fully leveraging their cooperative relationship and respective competitive advantages. (See the
Strategy in Asia section on page 18 for more information.)
Advancing Our CRI Strategy
Nippon Oil is implementing a strategy to use its refinery capacity in fields other than petro-
leum production. Central to these efforts is the Chemical Refinery Integration (CRI) project.
This project leverages the Company’s strength in creating petrochemical products from crude
oil using its refinery facilities. The objective is to operate an optimally efficient production sys-
tem that enables us to respond quickly and flexibly to trends in demand for petroleum and
petrochemical products. The project places particular emphasis on increasing production capacity
for paraxylene and propylene, for which rising sales volume is expected in China and other
Asian countries. During the period of the third management plan, Nippon Oil plans to increase
its annual production capacity for propylene and paraxylene to 0.8 million and 1.4 million
tons, respectively. As part of the CRI strategy, we constructed facilities for propylene produc-
tion using Olefin Conversion Technology (OCT) at the Group’s Kawasaki Operations Center,
with full-scale operation commencing in September 2006. At the Sendai refinery, we are
increasing production of xylene (a base material for paraxylene) and propylene, while also
carrying out construction of a Continuous Catalyst Regenerator (CCR) platformer and propy-
lene splitter, scheduled for completion in August 2007.
Expanding Electric Power Operations
Recently, the balance of demand for petroleum products is shifting, with declining demand for
heavy oil fractions and a greater proportion of demand for light oil fractions such as gasoline and
kerosene. As a result, making effective use of surplus heavy oil fractions is an issue in the industry.
In response to this, Nippon Oil decided to enter the IPP (independent power producer)
field. The Company has a huge refining infrastructure as well as considerable know-how re-
garding the operation of electric power plants.
LEFT:AF solvent installation
RIGHT:OCT installation
Refining Facilities ofthe Nippon Oil Group
Muroran (180)
Sendai (145)
Toyama (60)
Negishi (340)Osaka (115)
Mizushima (250)
Marifu (127)
( )=Refining capacity thousand BD
REVIEW O
F OPERATIO
NS

NIPPON OIL CORPORATION Annual Report 200728
Negishi refinery
As this initiative entails electric power generation using heavy oil, which is projected to be
produced in quantities that exceed demand, it has the twin effects of rebalancing demand for
heavy oil and stably providing competitive electric power.
Nippon Oil initiated wholesale independent power producer (IPP) operations in 1998 at
the Osaka refinery. Now, we are operating IPP facilities at five refineries (Osaka, Yokohama,
Negishi, Marifu, and Muroran). These facilities have a total power supply capability of 700,000kW,
making Nippon Oil the third-largest IPP company in Japan.
Full-conversion Strategy
As another strategy to deal with surplus heavy residues, Nippon Oil is implementing utility
integration with petrochemical companies operating in the Mizushima complex. This plan is
slated for completion in the spring of 2009 and involves the construction of a solvent
deasphalting unit. This will allow the processing of heavier grades of crude oil, boost produc-
tion of middle distillates and reduce production of heavy fuel oil C. Additionally, it is planned
to provide the residue extracted from the unit as fuel to the neighboring petrochemical
companies. This plan is aimed at achieving yet higher levels of value-add at the Mizushima
refinery while also contributing to energy-saving efforts and enhanced competitiveness in the
Mizushima complex as a whole.
05FYResults
06FYExpected results
07FYForecast
10FYForecast
0
50
100
150
200
250
■ Heavy fuel oil
■ Middle distillates
■ Naphtha
■ Gasoline Source: Ministry of Economy, Trade and Industry
Forecast Demand for Petroleum Products in Japan(Million kl)

Annual Report 2007 NIPPON OIL CORPORATION 29
Global Niche Strategy for High-performance Chemical Products
Another principal element of Nippon Oil’s petrochemical operations besides the CRI operations
described previously is the Company’s business manufacturing and marketing high-performance
petrochemical products used in diverse applications. For example, the Company has earned the
top share of the global market for ethylidene norbornene (ENB), a crosslinking agent in synthetic
rubber used to increase the resistance to heat and light (See the Overseas Operations section on
page 36 for more information). The Company also markets such products as high-boiling-point
Super Aromatic Solvent (SAS), applied to a pressure-sensitive paper solvent and synthetic insula-
tion oil, and Xydar, a liquid crystal polymer, which is marketed as a high-performance super
engineering plastic. Created by leveraging the Company’s special technologies and other capa-
bilities, these high-performance functional petrochemicals are generally characterized by high
profit margins and high global market shares, and Nippon Oil targets further expanding the scale
and profitability of functional petrochemicals business in the future as its global niche strategy.
Negishi refinery
REVIEW O
F OPERATIO
NS

NIPPON OIL CORPORATION Annual Report 200730
Thoroughly Shifting Emphasis to Efficiency, Productivity and High Added Value
The 1996 relaxation of petroleum product import restrictions halted the trend of growth in the
number of service stations in Japan. Subsequently, intensifying competition began reducing the
number, and the unprofitable facilities were progressively winnowed out by the legalization of
self-service service stations in 1998. Since then, the number has continued decreasing steadily.
Japan currently has approximately 46,000 service stations, of which the Nippon Oil Group oper-
ates about 10,400—the country’s largest service station network. As price-oriented competition
among service stations intensifies, Nippon Oil recognizes that it cannot simply take pride in the
large scale of its marketing network but must implement the following strategies for shifting its
marketing emphasis from quantity to efficiency, productivity and high added value.
The first strategy is to supply highly competitive products. One example is the Group's
environmentally friendly premium gasoline called ENEOS NEW VIGO, which reduces friction
inside engines to enhance both fuel economy and acceleration. Its improved engine-cleaning
capabilities remove grime from air valves and injectors to prevent deterioration in engine per-
formance. In addition, these capabilities generally clean up engine interiors in ways that reduce
the amount of carbon monoxide, hydrocarbons, and NOx in exhaust gases. Nippon Oil has
been a leader in marketing essentially sulfur-free (10ppm or less) gasoline products, which
lower the levels of harmful substances in exhaust emissions. As awareness of environmental
protection issues among consumers increases, products with these kinds of superior environ-
mentally friendly features are steadily growing in popularity to become more competitive in
the marketplace.
Marketing

Annual Report 2007 NIPPON OIL CORPORATION 31
ENEOS Service Station
The second strategy is to build a high value-added service station network. Most Japanese
car owners are meticulous about automobile maintenance. Noting this, the Nippon Oil Group
is seeking to increase the competitiveness of its service station network by emphasizing the
creation of high value-added Dr. Drive service stations. Dr. Drive facilities provide ordinary
vehicle-care services—including lubricant oil checks and changes, car washing and waxing, and
tire sales and changing—as well as statutory vehicle inspections (required three years after new
vehicles are purchased and every two years thereafter), car washing by hand and daily vehicle
checkup inspections, and a range of other high quality vehicle-related goods and services.
Aiming to be the starting place for safe and comfortable driving by offering services just as
dependable as those of trusted family doctors, Dr. Drive facilities always feature nationally
qualified mechanics. This allows all drivers, even those not familiar with vehicular mechanics,
to discuss their issues in comfort. Because these characteristics make Dr. Drive facilities con-
siderably more competitive than ordinary service stations, during the first year after ordinary
service stations are converted into Dr. Drive facilities, their average monthly gross profit grows
by approximately ¥200,000. The number of Dr. Drive facilities has risen rapidly since Nippon
Oil began their full-scale creation in fiscal 2000. As of March 31, 2007, the Group had a net-
work of 2,403 Dr. Drive facilities, equivalent to roughly one quarter of the overall service station
network. In January 2007, Nippon Oil used a range of media and its service stations to adver-
tise the benefits of Dr. Drive facilities as the starting place for safe and comfortable driving. We
will continue to improve quality to respond to our customers’ expectations.
The third strategy is to restructure the network of affiliated service station operators that
manage all Nippon Oil service stations. In addition to the strategies described above, Nippon
Oil is seeking to enhance the competitiveness of its service stations by providing those opera-
tors with advice and assistance related to low-cost management. Further, we consider that
some restructuring is necessary based on the business judgment of affiliated service stations,
with the aims of strengthening the management base, improving management and maintain-
ing and strengthening sales channels. We will continue to consider such steps as necessary in
the future.
02FY
3,000
2,000
1,000
003FY 04FY 05FY 06FY
Dr. Drive Facilities (Number of service stations)
02FY
50,000
40,000
30,000
20,000
10,000
003FY 04FY 05FY 06FY
Number of Service Stations —— All Japan and Nippon Oil
■ All service stations in Japan
■ Nippon Oil service stations
REVIEW O
F OPERATIO
NS
Annual Report 2007 NIPPON OIL CORPORATION 31

NIPPON OIL CORPORATION Annual Report 200732
Natural Gas and LNG
Nippon Oil is actively expanding its business with an integrated operating system covering the
whole of the natural gas business from exploration to marketing. Also, in downstream opera-
tions in Japan, the Group is proceeding with strategic infrastructure projects focused on spe-
cific regions and business partners. Those projects include constructing LNG terminals as starting
points for natural gas supply, and constructing power plants to create new demand. One example
is the use of existing infrastructure to construct a new LNG importing terminal (160,000kl
capacity) on idle land within the Mizushima refinery, which has been supplying gas to nearby
gas companies and industrial users since May 2006. Nippon Oil has also decided to construct
a new 160,000kl tank to cope with expected future increase in demand for LNG. We plan to
commence operation in fiscal 2011. In March 2007, Nippon Oil also completed construction
of a satellite LNG terminal of 4,500kl capacity for domestic marine shipments on a former
transshipment depot site in Hachinohe, Aomori Prefecture. This terminal provides local city
gas companies and industrial users with natural gas and LNG. Furthermore, we have been
supplying natural gas to JR East’s Kawasaki power plant since June 2006.
Electric Power
Deregulation of the Japanese electric power industry has encouraged a growing number of
companies to enter the electric power business from diverse industries. Wholesale power sup-
ply by independent power producers (IPPs) has been allowed since 1995, and the permitted
scope for the retail electric power supply business of power producers and suppliers (PPSs) has
been gradually broadened since 2000. The Company is well positioned to maintain strong
Gas, Power and RenewablesMajor Achievements & Topics■ Launch of ESCO*1 service in Aomori (March 2006)
■ Completion of the Mizushima LNG base (April 2006)
■ Commenced supply of natural gas to JR East (June 2006)
■ Completion of the Hachinohe LNG base (March 2007)
■ Launch of B.O.O.*2 service to Fujifilm’s Yoshida-Minami factory (April 2007)
■ Installation of residential-use fuel cells in Tokyo Disneyland and public utilities including
a fire station in Nagoya (2006)
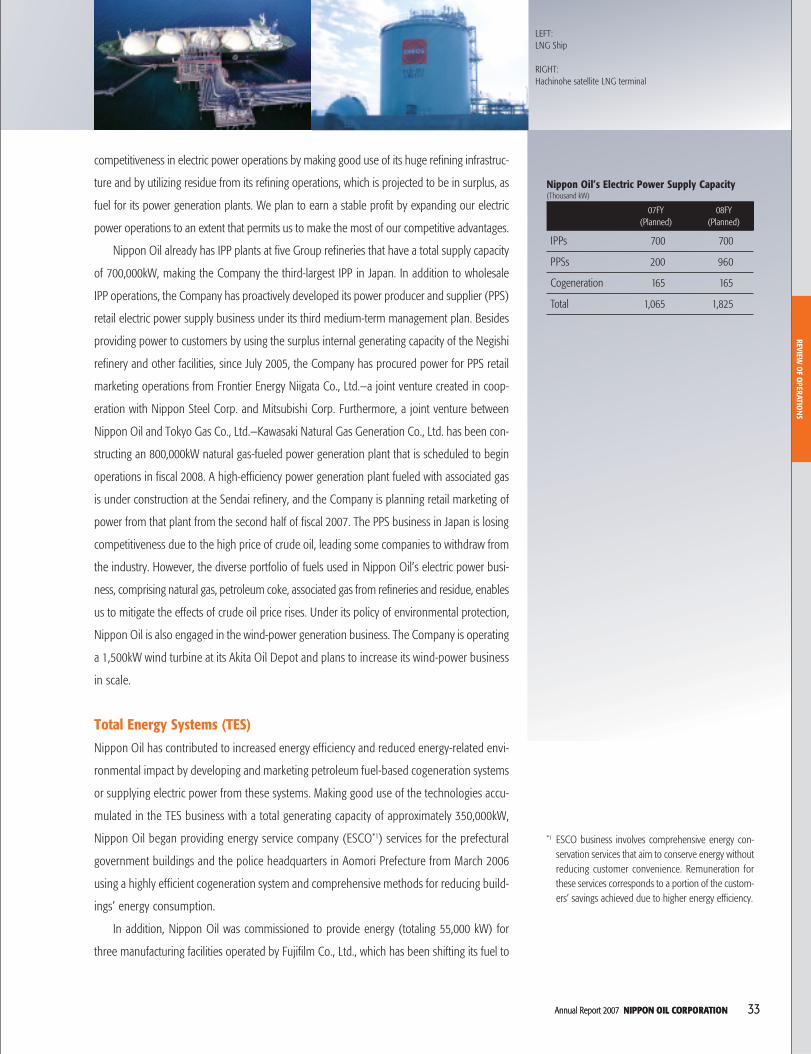
Annual Report 2007 NIPPON OIL CORPORATION 33
competitiveness in electric power operations by making good use of its huge refining infrastruc-
ture and by utilizing residue from its refining operations, which is projected to be in surplus, as
fuel for its power generation plants. We plan to earn a stable profit by expanding our electric
power operations to an extent that permits us to make the most of our competitive advantages.
Nippon Oil already has IPP plants at five Group refineries that have a total supply capacity
of 700,000kW, making the Company the third-largest IPP in Japan. In addition to wholesale
IPP operations, the Company has proactively developed its power producer and supplier (PPS)
retail electric power supply business under its third medium-term management plan. Besides
providing power to customers by using the surplus internal generating capacity of the Negishi
refinery and other facilities, since July 2005, the Company has procured power for PPS retail
marketing operations from Frontier Energy Niigata Co., Ltd.—a joint venture created in coop-
eration with Nippon Steel Corp. and Mitsubishi Corp. Furthermore, a joint venture between
Nippon Oil and Tokyo Gas Co., Ltd.—Kawasaki Natural Gas Generation Co., Ltd. has been con-
structing an 800,000kW natural gas-fueled power generation plant that is scheduled to begin
operations in fiscal 2008. A high-efficiency power generation plant fueled with associated gas
is under construction at the Sendai refinery, and the Company is planning retail marketing of
power from that plant from the second half of fiscal 2007. The PPS business in Japan is losing
competitiveness due to the high price of crude oil, leading some companies to withdraw from
the industry. However, the diverse portfolio of fuels used in Nippon Oil’s electric power busi-
ness, comprising natural gas, petroleum coke, associated gas from refineries and residue, enables
us to mitigate the effects of crude oil price rises. Under its policy of environmental protection,
Nippon Oil is also engaged in the wind-power generation business. The Company is operating
a 1,500kW wind turbine at its Akita Oil Depot and plans to increase its wind-power business
in scale.
Total Energy Systems (TES)
Nippon Oil has contributed to increased energy efficiency and reduced energy-related envi-
ronmental impact by developing and marketing petroleum fuel-based cogeneration systems
or supplying electric power from these systems. Making good use of the technologies accu-
mulated in the TES business with a total generating capacity of approximately 350,000kW,
Nippon Oil began providing energy service company (ESCO*1) services for the prefectural
government buildings and the police headquarters in Aomori Prefecture from March 2006
using a highly efficient cogeneration system and comprehensive methods for reducing build-
ings’ energy consumption.
In addition, Nippon Oil was commissioned to provide energy (totaling 55,000 kW) for
three manufacturing facilities operated by Fujifilm Co., Ltd., which has been shifting its fuel to
07FY 08FY(Planned) (Planned)
IPPs 700 700
PPSs 200 960
Cogeneration 165 165
Total 1,065 1,825
Nippon Oil’s Electric Power Supply Capacity(Thousand kW)
LEFT:LNG Ship
RIGHT:Hachinohe satellite LNG terminal
*1 ESCO business involves comprehensive energy con-servation services that aim to conserve energy withoutreducing customer convenience. Remuneration forthese services corresponds to a portion of the custom-ers’ savings achieved due to higher energy efficiency.
REVIEW O
F OPERATIO
NS
Annual Report 2007 NIPPON OIL CORPORATION 33

NIPPON OIL CORPORATION Annual Report 200734
natural gas to reduce CO2 emissions. Commercial operation began at the company’s Yoshida-
Minami factory in April 2007. This is the largest B.O.O.*2 project in Japan through which Nippon
Oil provides total services, from procuring LNG to the installation, running and management
of highly efficient cogeneration systems. We intend to develop and promote a wide variety of
energy business formats tailored to the diverse needs of customers.
The total supply capacity of all of Nippon Oil’s various electric power operations will be
approximately 1,000,000kW as of March 31, 2008. Also the Company will boost this capacity to
approximately 1,800,000kW, comprised of 700,000kW in IPP operations, 960,000kW in PPS
operations, and 165,000kW in TES operations by March 2009. This will be achieved through
such steps as the procurement of power for PPS business from the Sendai refinery and the
Kawasaki-based joint venture with Tokyo Gas.
Fuel Cells
Since 1986, the Nippon Oil Group has undertaken fuel cell R&D programs that leverage its
advanced hydrogen refining and catalyst technologies. As fuel cells are environmentally friendly,
next-generation energy systems with great potential, the Nippon Oil Group is focusing on fuel
cells as a future key business area. In March 2005, we launched the ENEOS ECO LP-1, the
world’s first residential-use fuel cell system that uses liquefied petroleum gas (LPG) as fuel,
and we had installed a total of 369 units as of March 2007. The Group plans to actively install
this efficient, environmentally friendly product with low CO2 emissions and plans to install
over 250 units during fiscal 2007.
In addition, in March 2006, Nippon Oil launched ENEOS ECOBOY, the world’s first resi-
dential-use fuel cell system that uses kerosene. This product offers a high total energy effi-
ciency level of 84% (compared with around 40% energy efficiency for conventional power
generation). Moreover, the fuel cell system’s CO2 emissions per energy unit supplied are 30%-
40% lower than those of thermal power plants. Since the ENEOS ECOBOY system is capable
of operating in temperatures as low as -10°C, together with the above ENEOS ECO LP-1 sys-
tem, we are able to provide fuel cell systems that can be used anywhere in Japan. The Com-
pany installed 76 ENEOS ECOBOY systems during fiscal 2006 and plans to install around 150
in fiscal 2007.
The Japanese Government is implementing a large-scale demonstration project to promote
the development of fuel cell technology by installing fuel cell systems and acquiring data from
real-world operation. Participants are oil and gas companies and they installed 1,257 fuel cells
over a two-year period from 2005 to 2006. We proactively took part in this project and installed
a total of 435 ENEOS ECO LP-1 and ENEOS ECOBOY systems, the highest number of any of the
participating companies at 35% of overall installations.
LEFT:Wind-power
RIGHT:Frontier Energy Niigata
*2 B.O.O. is the acronym for “build, own, operate”, whichdiffers from conventional on-site energy system servicesin that equipment operation and management servicesare also supplied as part of the overall package.

Annual Report 2007 NIPPON OIL CORPORATION 35
Fuel Cells
The fuel cell business also formed part of the business alliance with Japan Energy Corpo-
ration that we formed in June 2006. Furthermore, we formed a fuel cell business alliance with
Cosmo Oil Co., Ltd. in April 2007. With these alliances, Nippon Oil is aiming to promote early
adoption of petroleum-powered fuel cells through the ability to produce devices compatible
with those of the two alliance partners in the future and achieving a further level of cost reduc-
tions. The strategic business and capital alliance with SK Corporation of Korea also includes
fuel cells as part of its R&D alliance.
The Nippon Oil Group intends to continue its efforts to maintain the leading position in
the fuel cell field.
Plan to Install Residential-use Fuel Cells
LPG systems
Fiscal 2005: 140 units (achieved)
Fiscal 2006: 229 units (achieved)
Fiscal 2007: approx. 250 units (planned)
Kerosene systems
Fiscal 2006: 76 units (achieved)
Fiscal 2007: approx. 150 units (planned)05FY
500
400
300
200
100
006FY 07FY
(planned)
(units)
■ Kerosene ■ LPG
REVIEW O
F OPERATIO
NS

NIPPON OIL CORPORATION Annual Report 200736
With demand for petroleum products in Japan expected to decline, growing demand in China
and other Asian countries presents opportunities for Nippon Oil in commissioned refining and
exports of petroleum products and petrochemical products. Accordingly, we will adopt a flex-
ible approach to exporting with an eye on supply and demand trends and prices in Japanese
and overseas markets. (See the Strategy in Asia section on page 18 for more information.)
We are also expanding sales of lubricants overseas, in line with the overseas expansion of
Japanese automakers. This is one of the pillars of our overseas strategy.
In 1995, Nippon Oil established Tianjin Nisseki Lubricants & Grease Co., Ltd., a China-based
lubricant manufacturing and marketing company in which we have a 40% shareholding. Opera-
tions have expanded steadily, and annual production capacity was boosted by 40%, from 35,000kl
to 55,000kl in May 2006. The Company has also established a Guangzhou-based lubricant-manu-
facturing subsidiary, Nippon Oil (Guangzhou) Lubricants Corporation, which began full-scale
operation of a production plant with a capacity of 27,000kl per year in September 2006. As a
result, with this new company and Tianjin Nisseki Lubricants & Grease, Nippon Oil has created a
two-base, lubricant manufacturing network with a combined capacity of 82,000kl per year that is
well positioned to supply both the southern and northern regions of China.
Nippon Oil has also set up a lubricant manufacturing subsidiary in the U.S. state of Ala-
bama called Nippon Oil Lubricants (America) LLC. In October 2006, this subsidiary commenced
full-scale operation of a lubricant and grease production plant with a capacity of 39,000kl per
year. This is the Group’s first manufacturing base for lubricants in the U.S., where previously,
Nippon Oil marketed products manufactured on a commissioned basis.
Overseas OperationsMajor Achievements & Topics■ Developed new blocks at Bulga coal mine in Australia (August 2006)
■ Commenced operation of Nippon Oil (Guangzhou) Lubricants Corporation lubricating
oil plant (September 2006)
■ Commenced operation of lubricant oil and grease plant in the United States
(October 2006)
■ Formed strategic business and capital alliance with SK Corporation of Korea
(January 2007)
Overseas Lubricants BusinessAsiaChina:
Tianjin Nisseki Lubricants & Grease Co., Ltd.A joint venture in which Nippon Oil has a 40%shareholding
Nippon Oil (Shanghai) CorporationExclusive manufacturing and marketing agreementwith CNPC Group since 2003Nippon Oil (Guangzhou) Lubricants CorporationNippon Oil Corporation, Beijing OfficeTaiwan:
Taiwan Nisseki Co., Ltd.Nippon Oil has a 70% shareholding.Korea:
Technical alliance established with Michang OilIndustry Company since 1986Thailand & Vietnam:
Nippon Oil (Thailand) Ltd.Malaysia:
Nippon Oil Malaysia Sdn. Bhd.India:
Technical alliance with Tide Water Oil Co. (India)Ltd. since 1993Indonesia:
Nippon Oil Corporation, Jakarta Office(Assigned dedicated lubricant sales personnel from 2003.)
EuropeNippon Oil Europe Limited
United StatesNippon Oil (U.S.A.) Limited, Chicago headquartersNippon Oil Lubricants (America) LLCNippon Oil (U.S.A.) Limited, Los Angeles Branch Office

Annual Report 2007 NIPPON OIL CORPORATION 37
Constructions
Overseas Sales of Lubricants(Thousand kl)
05FY 06FY 07FY(Actual) (Actual) (Planned)
China 49 66 84
Other Asia 75 85 94
Asia Total 124 151 178
U.S. 28 29 31
Europe 7 7 8
Overseas Total 159 187 217
We are also continuing to expand our ENEOS Oil brand overseas. During 2006 we began
sales for the first time in a range of countries and regions including the west coast of North
America, the United Kingdom, Turkey and other countries.
Growth in demand for high-performance lubricants is expected to continue in China and
throughout Asia. Targeting increased demand driven by Japanese automakers expanding into
Europe and the U.S., we plan to increase overseas sales of lubricants by 16% year on year
from 187,000kl in 2006 to 217,000kl in 2007.
In terms of petrochemical products, we also supply ENB (ethylidene norbornene) to the
world market using our annual production capacity of 20,000 tons in both the U.S. and Japan.
This capacity is split evenly in a fifty-fifty joint venture with Sanyo Chemical Industries, Ltd. ENB
is mainly used for automotive rubber products and Nippon Oil has captured over 70% of the
world market due to its unique manufacturing process which allows durable products and a
high level of cost competitiveness. With demand also growing steadily, we commenced com-
mercial operation of a new 20,000 ton per year capacity plant in the U.S. in June 2007. As a
result, the level of the Nippon Oil Group’s total ENB production capacity will rise to 60,000
tons per year, thereby further consolidating the Group’s solid position as the world’s leading
ENB supplier.
Lubricant and grease production plantin the state of Alabama, U.S.A.
The Nippon Oil Group engages in the construction business primarily through NIPPO COR-
PORATION (NIPPO). Construction projects include road-paving as well as building construc-
tion, construction and engineering for oil- and other energy-related facilities, and
environmental protection.
In fiscal 2006, although Japan’s construction sector benefited from a recovery in private-
sector investment, the operating environment remained harsh due to declining public-sector
investment coupled with a continued rise in the cost of raw materials caused by a surge in crude
oil prices. In these conditions, the Nippon Oil Group’s construction units strove to obtain orders
for road-paving, civil engineering, and other construction projects, as well as promote greater
sales of products such as asphalt mixture. As a result of these activities and efforts to improve
profitability through cost-cutting and efficiency-boosting measures, the Group achieved a year-
on-year rise in its operating income in the construction sector. Looking forward, although the
environment in the construction industry remains severe, the Nippon Oil Group will continue to
enhance its competitiveness by working to strengthen its technological capabilities and operating
activities while also steadily proceeding with cost reductions and efficiency improvements.
REVIEW O
F OPERATIO
NS
Annual Report 2007 NIPPON OIL CORPORATION 37

NIPPON OIL CORPORATION Annual Report 200738
Research & Development
1. Petroleum Products
(1) Initiatives related to biomass fuel
Biomass fuel is important from the standpoint of securing an alternative source of liquid fuel
to existing oil, and in terms of preventing global warming by reducing CO2. In biomass fuel for
gasoline engines, we aim to acquire the capability to supply approximately 360,000kl of
bioethanol per year (roughly 210,000kl crude oil equivalent) by fiscal 2010, in the form of
ETBE (Ethyl Tertiary Butyl Ether). This will be achieved in collaboration with the other companies
in the Petroleum Association of Japan. Since April 2007, we have been preparing plans to begin
trial sales of biogasoline containing bioETBE to verify issues associated with its full-scale intro-
duction. Currently, agricultural produce such as maize is the main raw material for bioethanol.
There are problems, however, in that supplies are limited and there is a possibility that using
agricultural produce to make fuel could push food prices higher. Accordingly, aiming to secure
large-volume supplies of biofuel while allaying these fears, the Nippon Oil Group is develop-
ing manufacturing technology that uses cellulose biomass resources, for which there is no
competition with food applications. Achieving this goal will mean developing integrated manu-
facturing technologies covering all processes from the cultivation of plants to ethanol produc-
tion itself, so we are actively targeting technologies only available from universities and other
research organizations, including technology related to cultivation of plant resources, cellulose
saccharification, and fermentation.
In biomass fuel for diesel engines, we have teamed up with Toyota Motor Corporation to
develop bio hydrofined diesel (BHD) mainly made from vegetable oil and fat. Compared to
existing FAME (fatty acid methyl ester) biodiesel, which is subject to concerns over oxidative
Major Achievements & Topics■ Established ENEOS Hydrogen Trust Fund (March 2006)
■ Established Nippon GTL Technology Research Association (October 2006)
R&D Expenditures(Millions of yen)
04FY
15,000
10,000
5,000
005FY 06FY
Annual Report 2007 NIPPON OIL CORPORATION 39
Central Technical Research Laboratory
stability and other quality issues, the BHD under development is expected to be of a quality at
least equivalent to that of ordinary diesel. As part of a joint project to commercialize this fuel
with the Tokyo Metropolitan Government, Toyota and Hino Motors Ltd., we are planning to
conduct test runs using this fuel in Tokyo city buses from fiscal 2007.
(2) Effective use of sulfur
In fiscal 2006, we began sales of a new product called Recosul that uses technology we devel-
oped to effectively utilize the sulfur byproduct of oil refining. Recosul is a material for construc-
tion and civil engineering produced by mixing modified sulfur with industrial byproducts such
as steel slag and coal ash or marine byproducts such as scallop shells. It has superior acid
resistance and strength characteristics and is resistant to salt damage.
(3) Initiatives related to GTL
GTL (gas to liquids) technology synthesizes liquid fuel from natural gas. This process results in
clean fuel and a promising high-performance base oil for lubricants. On October 25, 2006, we
set up the Nippon GTL Technology Research Association together with INPEX CORPORATION,
Japan Petroleum Exploration Co., Ltd., Cosmo Oil Co., Ltd., NIPPON STEEL ENGINEERING Co.,
Ltd., and CHIYODA CORPORATION. The association has launched a GTL technology demon-
stration test project. The groundbreaking technology under research is the first in the world to
use unprocessed natural gas containing CO2 as an input.
2. Petrochemical Products
(1) Effective use of C4 fraction
Aiming to effectively use the C4 and C5 fractions that are a byproduct of oil refining and the
manufacture of petrochemical products, we have perfected technology to dimerize the C4 frac-
tion into isooctane using a catalyst developed in house. Full-scale production using this technol-
ogy began in September 2006. In addition to using the resulting isooctane as an octane booster
for gasoline, we are also considering its application as a highly pure isononanoic acid.
(2) Technology to convert heavy oil fractions into petrochemical products
We are researching technology that converts heavy oil, for which surpluses in the refining
process are forecast, into petrochemical products. We call this “Bottom to Chemical” technol-
ogy. One example of this technology is our own HS-FCC (High Severity Fluid Catalytic Crack-
ing). We are planning the construction and operation of a demonstration facility using this
technology. The ultimate aim is to establish commercial technology to produce high yields of
propylene from heavy oil. We are also engaged in development aimed at commercializing our
unique Z-Forming process, which produces aromatics from light naphtha and LPG.
REVIEW O
F OPERATIO
NS

NIPPON OIL CORPORATION Annual Report 200740
CSR
1. The Group’s Basic CSR PolicyHaving articulated the Group Philosophy shown to the left, the Com-
pany has drafted the Nippon Oil Corporation Group CSR Rules to clearly
define the Group’s basic CSR policy. This policy calls for every individual
employee to work sincerely to act in accordance with the “Group Phi-
losophy” and “Six Values We Respect” to ensure that the Group depend-
ably carries out its responsibilities to society and is able to earn the trust
of its stakeholders.
The Nippon Oil Group has identified and is strategically promoting
the CSR activities detailed below.
(1) CSR vital to all business activities and the source of our
competitiveness
In the course of fulfilling their assigned tasks, instill the message that
each employee can contribute to wider society through the proper
execution of the duties they perform daily.
(2) Broad spectrum of measures to enhance corporate value
Engage in investment activities, and pursue a host of measures (explain-
able to stakeholders) for yielding returns.
(3) Build win-win relationships with stakeholders
Build relationships of trust through communication with all people with
whom the Company has contact, including shareholders, employees,
clients, business partners, and local communities.
Group Philosophy
Your Choice of EnergyCreating the energy future and promoting prosperity and harmonywith nature
Six Values We Respect
EthicsNew ideasEnvironmental harmonyRelationshipsGlobal approachesYou
Six CSR Committees FY2006 ThemesCompliance Committee 1. Confirming legal compliance
of operations2. Augmenting educational and
training programs thatpromote awareness offundamental legal issues
Human Rights Committee 1. Promoting greatercommunication
2. Promoting healthy work styles
Information Security Committee Thorough protection ofinformation on individuals andother confidential information
Corporate Citizenship Committee Social contribution activitiesfollowing major disasters
Environment & Safety Committee 1. Developing environmentalprotection programs superiorto those of other industries
2. Rebuilding safety culture andpractices
Quality Assurance Committee 1. Executing thorough measuresto prevent complaints andproblems related to qualityassurance processes
2. Building quality assurancesystems focused on itemsprocured from outside
3. Increasing the quality ofservices provided
Nippon Oil Corporation General Meeting of Shareholders
Board of Directors
Executive Committee
CSR Department
Board of Corporate Auditors
Audits Audits
Reporting of internal audits and recommendations
CSR promotion instructions
Instructions Reports
CSR planning and execution
Divisions Branches Refineries Group Companies
CSR Activities Execution
Promotion of CSR Activities
CSR-centered internal audits
Nippon Oil Group CSR Meeting(Members include senior executives of
Nippon Oil Corporation and the president of each principal Group company)
Quality Assurance Committee
Compliance Committee
Human Rights Committee
Information Security Committee
Corporate Citizenship Committee
Environment & Safety Committee
The Nippon Oil Group CSR Promotion System

Annual Report 2007 NIPPON OIL CORPORATION 41
2. CSR Promotion SystemGuided by its basic CSR policy, Nippon Oil is strengthening its system
for the strategic and Groupwide promotion of CSR management. The
Group defined its six focus areas for CSR, namely “Compliance,” “Human
Rights,” “Information Security,” “Corporate Citizenship,” “Environment
& Safety,” and “Quality Assurance.” This was followed by establishment
of the Nippon Oil Group CSR Meeting, led by the president of Nippon
Oil Corporation and attended by the presidents of the Group’s principal
companies, to comprehensively supervise all CSR activities. Six special-
ized committees were also established below the CSR Meeting, result-
ing in a system for deliberation and decision-making regarding the
direction of Group CSR activities. In fiscal 2006, the Nippon Oil Group
CSR Meeting convened twice to discuss matters related to changes in
the standards of conduct and the CSR monitoring.
3. CSR Activities During Fiscal 2006CSR Monitoring
Summary and Objectives
We conduct surveys to gauge the awareness of CSR and business ethics
among executives and employees of the Nippon Oil Group. We have a
fair and neutral independent research organization collect and analyze
individual survey forms and anonymity is maintained, which allows us
to ascertain the true opinions and feelings of Group members.
The survey covers the extent to which our Group philosophy has per-
meated the organization and the extent to which it is put into practice, as
well as the state of communication at actual workplaces. The results are
analyzed and used to help promote CSR. The survey itself also constitutes
an e-learning training program on CSR and business ethics.
Analyzing the state of awareness by different attributes (affiliation,
position, and years of service) helps in the promotion of discussions at
individual organizations and worksites and in the formulation and
execution of specific improvement measures.
Results of the 2006 CSR Monitoring (Assessment & Issues)
We administered our second CSR Monitoring in November 2006. We
maintained the same high level as last year with regard to trust in the
company, employee motivation, and sense of participation (response
rate of 88%), which are all basic elements of CSR. However, we identi-
fied problems with respect to permeation and practice of our Group
philosophy, awareness of the internal reporting system, and risk identi-
fication at the worksite level.
We have made it possible for each worksite to analyze and respond
to issues by posting the details of the survey on the Group intranet.
Business Ethics Training
Case Method Training
We conduct training on business ethics designed to improve the ethical
decision-making of each and every executive and employee. As of April
2007, some 4,600 executives and employees of the Nippon Oil Group
have gone through the training.
We created an original training program with the help and coopera-
tion of Associate Professor Joji Nakaya of the community service depart-
ment at the Graduate School, Tohoku University of Community Service
and Science. Professor Nakaya is a leading proponent of management
ethics education using the case method.
The program seeks to facilitate ethically proper decisions by having
the people faced with making decisions envision beforehand how indi-
vidual day-to-day actions affect stakeholders.
The program centers on group discussions, so it also provides office
members an opportunity to have frank conversations about these issues.
Training Program Results and Future Initiatives
People that have gone through the program have commented that they
learned the importance of doing one’s job while being aware of stake-
holders and how they keenly realized that forthright discussion in the
workplace is essential to preserving the health of an organization. Oth-
ers indicated that it would be desirable to hold regular ethics training
sessions and conduct training in a cross-division, cross-office format. In
response, we are planning to continue to conduct effective training pro-
grams in this area in fiscal 2007 and beyond.
MAN
AGEM
ENT SYSTEM

NIPPON OIL CORPORATION Annual Report 200742
4. Environmental Activities“Environmental harmony” is a key element of the Nippon Oil Group
Philosophy. Accordingly, the Group is developing systems that will enable
the more effective promotion of environmental management.
Principal Theme Objectives FY2006 Achievements and Assessments FY2007 Objectives
Expand the scope of ISO 14001 certificationEstablishment ofenvironmentalmanagement systems
Expand the scope of certification at NipponOil branches and Group companies
•All Nippon Oil branches and the head offices of eightGroup companies*1 acquired certification
•Three dealerships obtained ISO14001 certificationafter taking the Nippon Oil certification course fordealerships and sales companies
Principal Objectives and Achievements under the Medium-term
Environmental Management Plan (FY2005 to FY2007)
The Nippon Oil Group has established a medium-term environmental
management plan (FY2005 to FY2007) to implement in tandem with its
third medium-term consolidated management plan. The goal of the plan
is making steady progress toward reducing greenhouse gases and the
overall environmental impact of our operations.
Complete certification for the head offices of 18 Groupcompanies
Expand sales of environmentally friendly products and services, and develop and popularize new energyEnvironmentally friendlyproducts and services
Promote sales of ENEOS NEW VIGO
Sales of residential-use LPG-powered fuelcell systems
Sales of residential-use kerosene-poweredfuel cell systems
Promote initiatives in the area of biomassfuels
Promoted sales of ENEOS NEW VIGO
Sales of residential-use LPG-powered fuel cell systems(installed 229 units)
Sales of residential-use kerosene-powered fuel cellsystems (installed 76 units)
•Prepared to begin trial sales of biogasolineformulated with bioETBE*2
•Conducted joint development of second-generationbiodiesel*3
Expand sales of ENEOS NEW VIGO
Sales of residential-use LPG-powered fuel cell systems(install 250 units)
Sales of residential-use kerosene-powered fuel cell systems(install 146 units)
Begin trial sales of biogasoline formulated with bioETBEConfirm the environmental performance of second-generation biodiesel
Assessments → �: Objective achieved �: Objective partially achieved ×: Objective not achieved
1. Global warming prevention measuresActivities to reduceenvironmental impact
Reduce specific energy consumption atrefineries
Verification for issuance of certifiedemission reductions for the Rang Dongoil field associated gas recovery andutilization CPM
Reduced 17.3% compared with FY1990 level
Conducted verification
Continue to reduce by an average of 1% per year (Goal toreduce 20% from FY1990 level by FY2010)
Issue of certified emission reductions
Completion of surveys of operatingproperties belonging to the Nippon OilGroup and conduct countermeasures
Work to make low cost soil remediationtechnology*4 practically viable
Completed surveys of operating properties belongingto the Nippon Oil Group (1,117 properties surveyed;countermeasures for 60)
Conducted verification
Conduct countermeasures based on surveys and prevailingconditions
Continue to develop the technology and run verification
3. Measures to reduce waste
Achieve zero emissions at all NPRCrefineries
•Achieved zero emissions at all NPRC refineries•Achieved zero emissions at the Nippon Oil Group*5
(waste disposal ratio of 0.9%)
Promote initiatives to achieve a waste disposal ratio of lessthan 0.5% for the Nippon Oil Group
Reduce consumption of electric power andpaper, and waste volume disposed
Reduced electric power consumption by 4%, paperconsumption by 22%, and waste volume disposed by15%
Reduce electric power consumption by 10%, paperconsumption by 30%, and waste volume disposed to zero
1. Green procurementOther environmentalactivities
Improve green purchasing ratio Green purchasing ratio increased to 99.8% Increase green procurement ratio to 100%
2. Environmental contribution activities
Donations to the National LandAfforestation Promotion Organization
Cumulative donations reached approximately¥90 million
Cumulative donations to reach approximately ¥110 million
*1 Nippon Petroleum Refining Co., Ltd., Nippon Oil Exploration Limited, Nippon Oil Real Estate Co., Ltd., Nippon Oil Trading Corporation, Nippon Oil Research Institute Co., Ltd., Nippon Oil InformationTechnology Corporation, Shibushi Oil Storage Co., Ltd., Kamigoto Oil Storage Co., Ltd.
*2 An abbreviation of ethyl tertiary butyl ether, a substance that is created by synthesizing plant-based bioethanol with isobutene from petroleum-based gas.*3 A form of diesel made by decomposing and refining a variety of fatty oils by applying hydrogenation technology originating in oil refining.*4 Purification technology for soil and groundwater that does not require excavation (conventional methods involve excavating the contaminated soil)*5 Sixteen of the Nippon Oil Group’s 18 principal companies (excludes Nippon Oil Exploration Limited and NIPPO CORPORATION)
2. Soil contamination surveys and countermeasures
4. Reduction of environmental impact in offices
�
�
�
�
�
�
�
�
Annual Report 2007 NIPPON OIL CORPORATION 43
5. Ensuring SafetyBasic Approach
We strive to ensure safe operations. In every process—from exploration
and development to distribution and sales—we make every effort to pre-
vent accidents and disasters before they occur and respond appropri-
ately if such an event occurs.
Nippon Petroleum Refining Co., Ltd. (NPRC) is working to create a
culture in which workers give ultimate priority to safety. The company
reviewed its overall safety management operations with a goal of elimi-
nating labor accidents and injuries and in January 2006 established teams
dedicated to promoting safety at its head office and refineries. Specifi-
cally, we are working to enhance safety activities and safety training not
only at operations and construction units that manage actual worksites
but also for employees of partner companies.
In April 2006 NPRC established the Refinery Project Office to insti-
tute thorough measures designed to prevent accidents at its facilities.
The office is involved in preventing accidents at refineries.
Disaster Prevention Equipment
At refineries, plants, storage terminals, oil depots and gas terminals, we
are instituting measures to prepare for the event of an accident or disas-
ter. These include setting up various disaster prevention facilities.
Countermeasures Against Oil Spills
Storage tanks are surrounded by multiple walls to prevent oil from flow-
ing outside the site in the event oil leaks from a tank. Offshore, there are
oil fences in place and oil recovery vessels at the ready to respond rap-
idly should an oil spill occur.
Countermeasures Against Fire
In readiness for a major fire, we have in place large trucks equipped
with elevated chemical cannons, foam transport vehicles, and foam can-
nons with exceptional fire fighting performance, as well as an array of
large fire extinguishers and equipment for spraying extinguishing foam
and water. For accidents and disasters that happen offshore, disaster-
response vessels with fire fighting capability are kept at the ready.
Mutual Assistance at Refineries and Other Sites
In readiness for a scenario in which a disaster occurs at a refinery or
other site due to a major earthquake and controlling the situation proves
exceedingly difficult to handle by a single site, we have established a
system related to response operations and emergency measures so that
organized assistance can be provided by other members of the Group.
The system seeks to facilitate rapid response to disasters.
Main Initiatives in Fiscal 2006
Comprehensive Disaster Prevention Drills
To be ready for the event of an accident or disaster, we run comprehen-
sive disaster prevention drills on a regular basis. The drills are led by an
internal body established specifically for disaster prevention and are
conducted to help ensure disaster prevention activities are prompt and
precisely targeted. We also conduct a number of other training exer-
cises, including joint disaster prevention drills with local fire departments
and the disaster prevention units of nearby companies.
Incidence of Labor Accidents
Data on labor accidents at the Group’s refineries are shown in the tables
below. In fiscal 2006, there was an increase in injuries that caused lost
workdays, so frequency*1 and severity*2 both worsened.
Number of Labor Accidents (NPRC)Injury with lost workdays Injury without lost workdays
FY2004 1 9
FY2005 2 6
FY2006 5 6
Ratios Indicating Frequency and Severity of Accidents (NPRC)Frequency Severity
FY2004 0.21 0.001
FY2005 0.42 0.008
FY2006 1.00 0.016
Supplementary Information: Frequency and Severity RatiosAll Industries Chemical Industry Petroleum Industry
Frequency Severity Frequency Severity Frequency Severity
FY2004 1.85 0.12 0.88 0.06 0.20 0.005
FY2005 1.95 0.12 0.90 0.07 0.61 0.010Source: Ministry of Health, Labor and Welfare, Labor Accident Survey. For petroleum refining, statistics are
from the Labor Survey issued by the Petroleum Association of Japan.
*1 This ratio indicates the frequency rate of lost work-time injuries and illnesses as a result of labor accidentsfor every one million hours worked.
*2 This ratio indicates the seriousness of labor accidents that occur.
Initiatives for the Future
In fiscal 2007, we will strive to entrench a culture that puts ultimate pri-
ority on safety and eliminate labor accidents. Specific initiatives will be
as follows.
1. Enhance safety activities aimed at preventative safety
2. Enhance safety management training
3. Enhance our system for providing safety-related instructions to part-
ner companies
We will establish priorities for each division—refineries and plants,
stockpiling bases, oil depots, gas terminals, and distribution (tanker trucks,
tanker ships, and regular trucks)—and work to faithfully carry them out.
MAN
AGEM
ENT SYSTEM

NIPPON OIL CORPORATION Annual Report 200744
Corporate Governance
Board of Directors
Fumiaki Watari Shinji Nishio
Representative Director,Chairman of the Board
Representative Director,President
Representative Directors, Executive Vice Presidents
Naokazu TsudaMarketing, Lubricants, EnergySolution & Chemicals
Makoto SataniInternational Business & Supply
Directors, Senior Vice Presidents
Ikutoshi MatsumuraExecutive Director of the Fuel Cell &Merchandise Business DivisionExecutive Director of the Research &Development Division
Masahito NakamuraExecutive Director of the SupplyDivisionExecutive Director of the Fuel RetailSales Division
Kan UenoExecutive Director of the ChemicalsDivision
Seiichi IsshikiExecutive Director of the CorporateManagement Division II
DirectorsMakoto KuramochiRepresentative and General Managerof the Beijing Office
Akira KitamuraGeneral Manager of the Secretariat
Hideo TabuchiGeneral Manager of the CorporateSocial Responsibility Department
Michio IkedaGeneral Manager of the CorporatePlanning & Management Department
Hiroshi OnoPresident and Representative Directorof Nippon Petroleum RefiningCompany, Limited
Teruo OmoriPresident and Representative Directorof Nippon Oil Exploration Limited
Toshikazu KobayashiEngineering, Technology &Environment
Executive OfficersHideaki Kobashi
Yukihiro Tabata
Jun Matsuzawa
Hajime Okazaki
Yoshiki Hirayama
Seijiro Yamazaki
Haruo Nakano
Shunsaku Miyake
Wataru Mawatari
Nobuyuki Tanahashi
Masahiro Yoshida
Michiyasu Kobayashi
Ichiro Kurata
Hirokazu Matsuo
Akira Omachi
Toru Tanaka
Yasuji Araki
Kazuyuki Tanaka
Shiro Kikkawa
Junichi Kawada
Nagayasu Matsuzawa
Yuichi Kanemaru
Shigeo HiraiExecutive Director of the CorporateManagement Division I
Yasushi KimuraExecutive Director of the EnergySolution Division
Yasuo KaminoExecutive Director of the Lubricants &Specialties Business Division
Junichi KohashiExecutive Director of the Environment,Safety & Quality Management DivisionExecutive Director of the ManufacturingTechnology & Engineering Division
Naoaki TsuchiyaExecutive Director of the OverseasBusiness Division

Annual Report 2007 NIPPON OIL CORPORATION 45
Nippon Oil Corporation recognizes that maintaining a consistent record
of ensuring that all its business activities and other corporate activities
are fair, transparent, and accountable is an extremely important means
of maximizing corporate value for the Nippon Oil Group as a whole.
Based on this thinking, the Group is working to further expand and
strengthen its corporate governance systems.
Basic Approach to Corporate GovernanceAmid an increasingly severe competitive environment for energy
companies, the Group has a strong need to upgrade its management
strategy development capabilities and establish a system for “rapid and
dynamic decision-making and operational execution” that is responsive
to changes in the business environment. At the same time, the Group
believes it must further augment its efforts to ensure the “transparency
and soundness of management” to respond to the trust and confidence
of all its stakeholders.
To respond to the changes in its operating environment just
described, Nippon Oil has established corporate governance systems with
the following features.
(1) The term of directors is one year, and directors must be approved
by the regular general meeting of shareholders each year.
(2) The presidents of principal Group companies are made members of
Nippon Oil Corporation’s Board of Directors, and management
strategy is debated and decided on a Groupwide basis.
(3) To effectively monitor and supervise management and ensure that it
is sound and transparent, the Company has selected the Board of
Corporate Auditors system, and the majority of members of that
board are outside auditors with specialized expertise.
(4) Nippon Oil is strengthening its Groupwide CSR promotion systems
centered on the Group CSR Meeting.
In April 2006, Nippon Oil established its Internal Control Project
Office, which is advancing with the rechecking and confirmation of the
appropriateness of financial reporting and the effectiveness of all the
Group’s internal control systems.
1. Operational Execution Systems
In Nippon Oil Corporation, the president is responsible for operational
execution decisions regarding items other than those that are defined
by laws, regulations, Nippon Oil Corporation’s Articles of Incorporation,
and Nippon Oil Corporation’s Board of Directors’ regulations as being
items that are to be determined by the Board of Directors. Before mak-
ing operational execution decisions, the president presents related issues
for consideration and discussion by the Executive Committee, which is
comprised of the president, executive vice presidents, senior vice presi-
dents, and other selected directors, and has the role of assisting the presi-
dent with respect to operational execution decisions. Important
operational execution decisions are reported to the Board of Directors,
while reports on the Executive Committee’s consideration and consulta-
tion processes and results are made to the Board of Corporate Auditors.
Auditors
Standing Corporate AuditorsSeiji Sakamoto
Hiroshi Maru
Corporate AuditorsMasao Fujii
Setsuo Umezawa
Koji Furukawa
From left: Koji Furukawa, Hiroshi Maru, Masao Fujii, Seiji Sakamoto, Setsuo Umezawa
MAN
AGEM
ENT SYSTEM

2. Directors
When nominating candidates for director, the Group assesses each nomi-
nee from a variety of angles, examining their occupational experience,
personality, insight, and other attributes. A list of those candidates
expected to contribute to Group management, who are deemed capable
of handling the responsibilities of director and able to meet the expecta-
tions of Group shareholders, is submitted to the Board of Directors for
further consideration. The final nominees who emerge are then put forth
as candidates for election at the regular general meeting of shareholders.
Under the leadership of the chairman of the Board, the Board of
Directors debates and decides items that are defined by laws, regula-
tions, Nippon Oil Corporation’s Articles of Incorporation, and Nippon
Oil Corporation’s Board of Directors’ regulations as being items that are
to be determined by the Board of Directors. In addition, the Board of
Directors conducts interviews regarding reporting items and monitors
and supervises the president’s operational execution measures and the
performance of duties by each director. With respect to operational ex-
ecution at Nippon Oil Group companies, the presidents of principal Group
companies are added as members of the Board of Directors with the
goal of strengthening Group management. This arrangement enables
debate and decisions regarding important business plans and other
matters at principal Group companies to be conducted by or directly
reported to the Board of Directors. Similarly, regular meetings attended
by Nippon Oil Corporation representative directors and senior vice presi-
dents, as well as by the presidents of the Group’s principal companies,
are held with the aim of maximizing the Group’s corporate value.
3. Auditors
Nippon Oil has adopted the Board of Corporate Auditors system. The
corporate auditors, including outside auditors, attend Board of Directors’
meetings, and pose questions and offer opinions as necessary to clarify
points related to the deliberation, adoption and reporting of board deci-
sions and the formulation of reports. Corporate auditors are also respon-
sible for auditing the performance of directors to ensure that activities
are not in violation of regulations, laws, or the Articles of Incorporation.
In nominating candidates for corporate auditor, Nippon Oil considers
the nominee’s ability to fulfill the duties expected of auditors, the posses-
sion of specialized expertise, a wealth of experience and an outstanding
Election and removal of directors
Audits
Audits
General Meeting of Shareholders
Board of Directors (Chaired by board chairman)
Independent Auditors
Group Companies
Election and removal of directors
Appointment
Election and removal
Monitoring and supervision
Financial audits
Financial audits
Reports
Exchanges of opinion
Interviews (Business execution divisions) and information exchange (Auditors)
Dispatch of officers/personnel
Approvals
Exchanges of opinion
Deliberation of proposed investments
Reports
Election and removal
Operational Execution
Executive Committee
Executive Vice Presidents
Senior Vice Presidents
Executive Officers = Executive Directors of DivisionsBody to assist decision-making
by the president
Director Appointed by the President
Reporting directly to the president
Representative Director, President
Internal Audit (CSR Department)
Board of Corporate Auditors
Executive Officers= Elected from among deputy directors of divisions and general managers of departments/laboratories/offices/Directors selected by the president
Diagram of Operational Execution, Audit, and Supervision
Organizational configuration: Company with Board ofCorporate Auditors System
Head of Board of Directors: Chairman (except whenserving concurrently aspresident)
Number of directors: 20
Elected outside directors: None
Number of corporate auditors: 5
Number of outside auditors: 3
NIPPON OIL CORPORATION Annual Report 200746

performance record. Beyond these basic credentials, however, candidates
must also embody the highest ethical standards and have a reputation for
impartiality, fairness, and honesty. Following consideration by the Board
of Directors and approval of the Board of Corporate Auditors, nominees
who are deemed to exemplify these qualities are put forth as candidates
for election at the regular general meeting of shareholders.
Pursuant to regulations established by the Board of Corporate
Auditors and corporate auditing standards, the corporate auditors and
the Board of Corporate Auditors have systems in place for conducting
comprehensive audits as prescribed by law. In addition to the exami-
nation of records relating to financial accounts and important meet-
ings, the auditors receive reports from directors and employees of the
Company and representative directors and officers of subsidiaries
regarding the performance of their duties. These and similar actions
comprise the audits of directors’ performance conducted by the cor-
porate auditors on an ongoing, day-to-day basis. The progress and
results of audits in the areas for which each corporate auditor is
responsible are reported by the auditors at regular meetings of the
Board of Corporate Auditors, which in principle are held twice monthly.
The sharing of results of overall audit activities also takes place at these
meetings. As needed, corporate auditors also receive reports from
directors, investigate decision-related documents, and examine records
related to financial accounts and important meetings. Furthermore, the
corporate auditors work to increase the effectiveness of audits by
receiving audit reports and other reports from the financial auditor and
the CSR Department, which is an internal audit department.
4. Reason for Selecting the Board of Corporate Auditors’ System
Nippon Oil Corporation’s Board of Directors is comprised of directors
thoroughly familiar with the Group’s operations, and they work to main-
tain and increase the efficiency and responsiveness of management. On
the other hand, Nippon Oil believes that augmenting its systems for the
performance of audits by corporate auditors, which have been given
greater authority by successive revisions of Japan’s Company Law, is a
desirable means of maintaining and strengthening management sound-
ness, and it has therefore established its Board of Corporate Auditors.
5. Outside Auditors
Three of the five members of the Company's Board of Corporate
Auditors, listed below, are full-fledged “outside auditors” unaffiliated
with the Company.
Outside auditors use their wealth of experience and knowledge to
pose questions and express opinions at Board of Directors' meetings
regarding agenda items. In fiscal 2006 these included basic policies for
establishing an internal control system, the acquisition of interests in E&P
projects, and the filing of lawsuits. Outside auditors also work together
with standing corporate auditors to further improve sound management
of the Company. To this end, the outside auditors and standing corpo-
rate auditors regularly exchange views with representative directors on
issues including protective measures against so-called hostile takeovers
and corporate governance.
Board ofBoard of CorporateDirectors’ Auditors’meeting meeting
attendance attendanceName record record Work history Reason for election Concurrent posts
Masao Fujii 11/13 19/19 Former judge in Japan’s Supreme Court Professor, Kyoto Sangyo UniversityOutside director, Marubeni Corporation
Setsuo Umezawa 13/13 18/19 Former head of Japan’s National TaxAgency and former chairman ofthe Fair Trade Commission of Japan
Koji Furukawa 13/13 14/19 Former director and vice president of Outside director, Lawson, Inc.Mitsubishi Corporation and chief Outside director, Astellas Pharma Inc.compliance officer of that company Director, Japan Post Corporation
Chairman and CEO, Japan Post Bank Co., Ltd.
Following successive judicial appointments, worked asa justice on Japan’s Supreme Court; Nippon OilCorporation believes that his lengthy experience andexpertise will enable him to monitor and supervisemanagement from an objective and fair viewpoint
Successive appointments to the National Tax Agencyand Fair Trade Commission; Nippon Oil Corporationbelieves that his lengthy experience and expertise willenable him to monitor and supervise managementfrom an objective and fair viewpoint
Career history includes responsibility for compliance ata private-sector firm; Nippon Oil Corporation believesthat his lengthy experience and expertise will enablehim to monitor and supervise management from anobjective and fair viewpoint
MAN
AGEM
ENT SYSTEM
Annual Report 2007 NIPPON OIL CORPORATION 47

NIPPON OIL CORPORATION Annual Report 200748
6. Creation of Specialized Support Staff for Auditors
To augment the auditing capabilities of all the corporate auditors,
including the outside auditors, Nippon Oil has established its Secretariat
of Corporate Auditors, which has a three-person staff that is completely
and clearly independent of the Group’s business execution departments
as well as of the Group’s command systems, including the personnel
evaluation system. The Secretariat also serves in the same support
capacity for the independent financial auditor.
7. Compensation of Directors and Corporate Auditors
The compensation of each director and corporate auditor is determined,
based on consideration of the Company’s performance as well as of the
role and contribution of each director and corporate auditor, within the
scope of the total remuneration figure authorized by the General Meet-
ing of Shareholders, in accordance with internal regulations created by a
vote of the Board of Directors in the case of directors and in accordance
with internal regulations created by a vote of the Board of Corporate
Auditors in the case of auditors.
In accordance with resolutions by the Board of Directors and the
Board of Corporate Auditors in May 2005, Nippon Oil has abolished its
system of retirement allowances for directors and corporate auditors.
This decision was made to link compensation for directors and corpo-
rate auditors more closely to their term of service and to the Company’s
business performance.
Remuneration amountNumber of recipients (¥ million)
Directors 20 851
Corporate auditors 5 104
(Outside auditors) (3) (30)
1. The total remuneration includes total bonuses of ¥202 million paid to directorsand of ¥23 million paid to corporate auditors.
2. Employee salaries and bonuses of ¥54 million paid to five employee-directors areexcluded from the total remuneration.
8. Independent Auditor
Nippon Oil has selected Ernst & Young ShinNihon as the independent
auditor to perform audits of its financial accounts. In fiscal 2007, these
audits were carried out by three certified public accountants (CPAs)
employed by Ernst & Young ShinNihon—Atsuhiro Umezawa, Kazuhiko
Umemura, and Takao Kamitani. These personnel were assisted in their
audits by a 21-member staff that included 12 CPAs and 9 CPA assistants.
Total compensation paid to the independent auditor of the Company
is as follows.
Compensation based on work covered by article 2-1 of the certified
public accountant law ¥59 million
Compensation based on work other than that mentioned above
¥147 million
9. Establishment of Internal Control System
As part of its CSR-oriented management, Nippon Oil is putting in place
a system to assure proper operations, and has implemented an internal
control system. The Company strives to further strengthen the system
through reviews in response to changes in internal and external circum-
stances and the operating environment.

Annual Report 2007 NIPPON OIL CORPORATION 49
Financial Section
Industry Trends and Nippon Oil’s Position . . . . . . . . . . . . . . . . . . . . . . . . . . . . . . . . . . . 50Management’s Discussion and Analysis of Operations . . . . . . . . . . . . . . . . . . . . . . . . . 56Consolidated Balance Sheets . . . . . . . . . . . . . . . . . . . . . . . . . . . . . . . . . . . . . . . . . . . . . 62Consolidated Statements of Income . . . . . . . . . . . . . . . . . . . . . . . . . . . . . . . . . . . . . . . . 64Consolidated Statements of Changes in Net Assets . . . . . . . . . . . . . . . . . . . . . . . . . . . 65Consolidated Statements of Cash Flows . . . . . . . . . . . . . . . . . . . . . . . . . . . . . . . . . . . . 66Notes to Consolidated Financial Statements . . . . . . . . . . . . . . . . . . . . . . . . . . . . . . . . . 67Report of Independent Auditors . . . . . . . . . . . . . . . . . . . . . . . . . . . . . . . . . . . . . . . . . . . 79
FINAN
CIAL SECTION
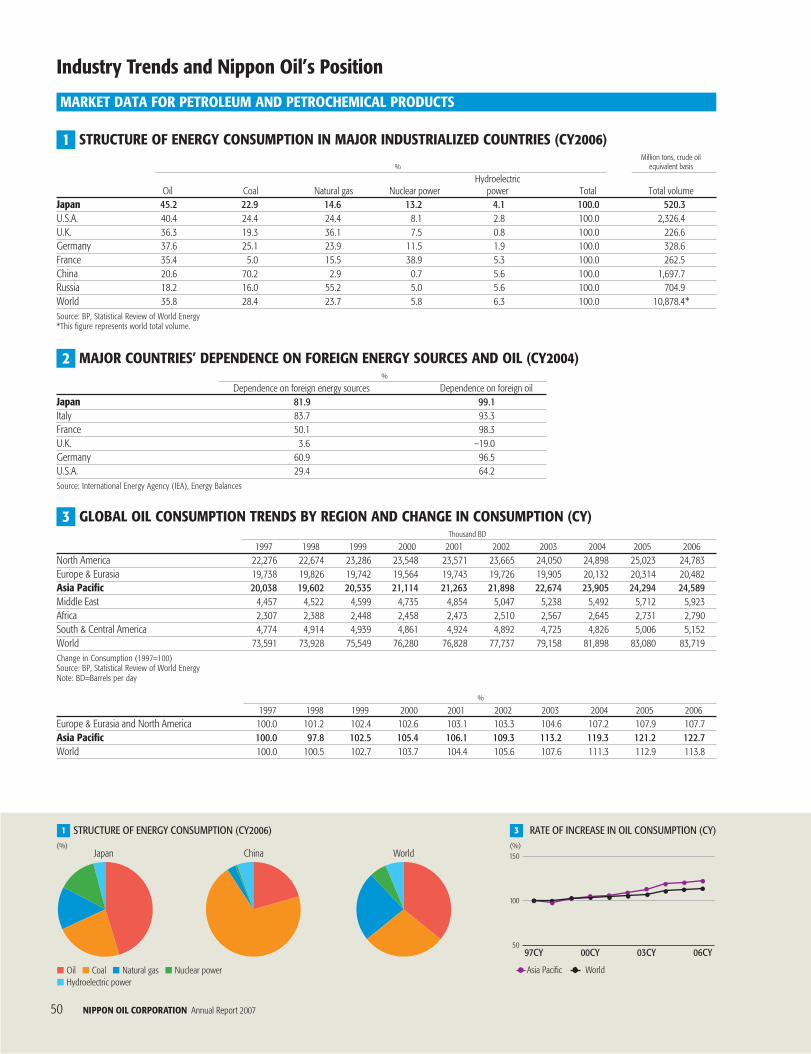
NIPPON OIL CORPORATION Annual Report 200750
1 3
MARKET DATA FOR PETROLEUM AND PETROCHEMICAL PRODUCTS
97CY
150
100
5000CY 03CY 06CY
Asia Pacific World
(%) (%)Japan China World
STRUCTURE OF ENERGY CONSUMPTION (CY2006) RATE OF INCREASE IN OIL CONSUMPTION (CY)
■ Oil ■ Coal ■ Natural gas ■ Nuclear power■ Hydroelectric power
Industry Trends and Nippon Oil’s Position
GLOBAL OIL CONSUMPTION TRENDS BY REGION AND CHANGE IN CONSUMPTION (CY)3Thousand BD
1997 1998 1999 2000 2001 2002 2003 2004 2005 2006North America 22,276 22,674 23,286 23,548 23,571 23,665 24,050 24,898 25,023 24,783Europe & Eurasia 19,738 19,826 19,742 19,564 19,743 19,726 19,905 20,132 20,314 20,482Asia Pacific 20,038 19,602 20,535 21,114 21,263 21,898 22,674 23,905 24,294 24,589Middle East 4,457 4,522 4,599 4,735 4,854 5,047 5,238 5,492 5,712 5,923Africa 2,307 2,388 2,448 2,458 2,473 2,510 2,567 2,645 2,731 2,790South & Central America 4,774 4,914 4,939 4,861 4,924 4,892 4,725 4,826 5,006 5,152World 73,591 73,928 75,549 76,280 76,828 77,737 79,158 81,898 83,080 83,719Change in Consumption (1997=100)Source: BP, Statistical Review of World EnergyNote: BD=Barrels per day
%
1997 1998 1999 2000 2001 2002 2003 2004 2005 2006Europe & Eurasia and North America 100.0 101.2 102.4 102.6 103.1 103.3 104.6 107.2 107.9 107.7Asia Pacific 100.0 97.8 102.5 105.4 106.1 109.3 113.2 119.3 121.2 122.7World 100.0 100.5 102.7 103.7 104.4 105.6 107.6 111.3 112.9 113.8
MAJOR COUNTRIES’ DEPENDENCE ON FOREIGN ENERGY SOURCES AND OIL (CY2004)2%
Dependence on foreign energy sources Dependence on foreign oilJapan 81.9 99.1Italy 83.7 93.3France 50.1 98.3U.K. 3.6 –19.0Germany 60.9 96.5U.S.A. 29.4 64.2Source: International Energy Agency (IEA), Energy Balances
Million tons, crude oil% equivalent basis
HydroelectricOil Coal Natural gas Nuclear power power Total Total volume
Japan 45.2 22.9 14.6 13.2 4.1 100.0 520.3U.S.A. 40.4 24.4 24.4 8.1 2.8 100.0 2,326.4U.K. 36.3 19.3 36.1 7.5 0.8 100.0 226.6Germany 37.6 25.1 23.9 11.5 1.9 100.0 328.6France 35.4 5.0 15.5 38.9 5.3 100.0 262.5China 20.6 70.2 2.9 0.7 5.6 100.0 1,697.7Russia 18.2 16.0 55.2 5.0 5.6 100.0 704.9World 35.8 28.4 23.7 5.8 6.3 100.0 10,878.4*Source: BP, Statistical Review of World Energy*This figure represents world total volume.
STRUCTURE OF ENERGY CONSUMPTION IN MAJOR INDUSTRIALIZED COUNTRIES (CY2006)1
NIPPON OIL CORPORATION Annual Report 200750

Annual Report 2007 NIPPON OIL CORPORATION 51
4 6
90FY
100
50
095FY 05FY04FY 10FY
Fore
cast
Addi
tiona
l mea
sure
s
01CY
20,000
15,000
10,000
5,000
002CY 04CY03CY 05CY01CY
30,000
20,000
10,000
002CY 04CY03CY 05CY
(%)
STRUCTURE OF ENERGY SUPPLY IN JAPAN (FY)
■ Oil ■ Hydroelectric and geothermal power ■ Coal■ Nuclear power ■ Natural gas ■ New energy and others
■ Demand ■ Production volume
BALANCE OF SUPPLY AND DEMAND FOR PETROCHEMICAL PRODUCTS IN ASIA (PROPYLENE, PARAXYLENE) (CY)Propylene Paraxylene
STRUCTURE OF DEMAND IN JAPAN BY TYPE OF OIL (CY)CONSUMPTION BY TYPE OF PETROLEUM PRODUCT (CY)
5
Ten thousand BD %
Japan 1996 1997 1998 1999 2000 2001 2002 2003 2004 2005 2005Gasoline 90 93 95 98 100 102 103 103 105 106 20Kerosene & Jet Fuel 72 70 71 72 71 73 73 73 70 73 14Diesel Oil 129 128 124 125 124 124 121 119 117 115 21Heavy fuel oil 75 72 71 70 65 60 57 66 59 59 11Others 203 202 186 194 189 181 176 181 178 182 34Total 569 565 547 559 549 540 530 542 529 535 100
Ten thousand BDU.S.A.* Europe* Asia*
Gasoline 918 44% 265 17% 390 17%Kerosene & Jet Fuel 171 8% 124 8% 220 9%Diesel Oil 411 20% 610 39% 660 28%Heavy fuel oil 93 4% 182 12% 362 15%Others 484 23% 367 24% 725 31%Total 2,077 100% 1,548 100% 2,357 100%Source: IEA, Oil Market Report* Figures for U.S.A. and Europe are from 2005; Figures for Asia are from 2004.
BALANCE OF SUPPLY AND DEMAND FOR PETROCHEMICAL PRODUCTS IN ASIA*(ETHYLENE, PROPYLENE, BENZENE, PARAXYLENE) (CY)
6
Thousands of tons
2001 2002 2003 2004 2005EthyleneDemand 27,302 28,955 30,764 32,303 33,614Production Volume 26,807 28,516 30,486 31,795 32,852PropyleneDemand 18,846 20,819 22,605 23,396 25,039Production Volume 18,887 20,617 22,313 23,161 24,762
Thousands of tons
2001 2002 2003 2004 2005BenzeneDemand 11,659 12,280 13,338 14,293 15,231Production Volume 11,813 12,135 13,246 14,463 15,402ParaxyleneDemand 10,817 12,156 13,588 14,461 15,611Production Volume 11,274 11,803 13,213 13,524 15,054
Source: Ministry of Economy, Trade and Industry, Current and Future Global Trends in Petrochemical Product Supply and Demand * Asia includes figures for Oceania.
STRUCTURE OF ENERGY SUPPLY IN JAPAN (FY)4%
1990 1995 2004 2005 2010Additional
Forecast measures
Oil 57.1 54.8 48.1 49.0 45.5 44.5Hydroelectric and geothermal power 4.5 3.7 3.8 3.2 3.6 3.9Coal 16.7 16.5 21.4 20.3 18.8 17.8Nuclear power 9.4 11.9 10.5 11.2 14.0 15.4Natural gas 10.2 10.9 13.9 13.8 15.2 14.3New energy and others 2.3 2.2 2.3 2.5 2.6 4.2Total 100.0 100.0 100.0 100.0 100.0 100.0
Million kl, crude oil equivalent basis
Total 521 586 611 614 605 566Source: Ministry of Economy, Trade and Industry (METI), Advisory Committee for Energy
(Thousands of tons) (Thousands of tons)
Annual Report 2007 NIPPON OIL CORPORATION 51
FINAN
CIAL SECTION

NIPPON OIL CORPORATION Annual Report 200752
NIPPON OIL OPERATING DATA
1 3
Crude oil (CIF) Regular gasoline
Group refining capacity(Thousand BD)
CRUDE OIL PRICE AND END USER GASOLINE MARKET (FY)
97FY
150
100
0
50
00FY 03FY 06FY
COMPARISON WITH OTHER MAJOR DOMESTIC OIL COMPANIES—II
■ NIPPON OIL ■ Exxon Mobil Group ■ Idemitsu Kosan ■ Cosmo Oil ■ Showa Shell Sekiyu■ Nippon Mining Holdings ■ Others
Paraxylene production capacity(Thousands of tons)
25.2%35.6%
COMPARISON WITH OTHER MAJOR DOMESTIC OIL COMPANIES—I2Millions of yen Yen
Operating Net Net incomeNet sales income income per share
NIPPON OIL 6,624,256 159,684 70,221 48.12Idemitsu Kosan 3,394,738 102,813 41,591 1,268.61Cosmo Oil 3,062,743 69,643 26,536 39.54Showa Shell Sekiyu 2,921,287 74,301 46,249 122.95Nippon Mining Holdings 3,802,447 132,258 106,430 117.98
Millions of yen % Yen
Shareholders’ Net assetsTotal assets Net assets equity ratio per share
NIPPON OIL 4,385,533 1,331,981 27.7 829.64Idemitsu Kosan 2,333,129 561,376 22.8 13,322.56Cosmo Oil 1,579,155 361,612 21.5 506.15Showa Shell Sekiyu 1,195,015 330,956 25.9 822.2Nippon Mining Holdings 2,056,407 701,064 30.3 671.56
Note: Figures represent performance in the fiscal year ended March 31, 2007. In the case of Showa Shell Sekiyu, however, figures represent performance in the fiscal year ended December 31, 2006.
1997 1998 1999 2000 2001 2002 2003 2004 2005 2006
Crude oil (CIF) price US$/barrel 18.82 12.76 20.92 28.37 23.84 27.40 29.43 38.77 55.81 63.46(Yen/kl) 14,504 10,319 14,518 19,617 18,645 21,034 20,955 26,158 39,736 46,633
Regular gasoline price (Market price) (Yen/l) 101 92 95 103 101 100 101 115 128 136Sources: Ministry of Finance, Trade Statistics and other publicationsNotes: 1. CIF=Cost, insurance, and freight.
2. Figures for regular gasoline prices are including consumption tax from April 2004.
CRUDE OIL PRICE AND END USER GASOLINE MARKET (FY)1
Group refining capacity Thousand BD
NIPPON OIL 1,217Exxon Mobil Group 936Idemitsu Kosan 640Cosmo Oil 635Showa Shell Sekiyu 515Nippon Mining Holdings 415Others 472Total 4,830
Paraxylene production capacity Thousands of tons
NIPPON OIL 1,210Nippon Mining Holdings 530Idemitsu Kosan 479Exxon Mobil Group 453Others 730Total 3,402
*Data as of December 31
Source: The Petroleum Association of Japan’s website pages as well as the association’s publication, Specified Statistics No. 51Note: Figures for Group refining capacity and Group refining capacity share are as of March 31, 2007.
COMPARISON WITH OTHER MAJOR DOMESTIC OIL COMPANIES—II3
REFINING CAPACITY AND CAPACITY UTILIZATION RATE (FY)4Thousand BD
Refining Capacity 2002 2003 2004 2005 2006Industry Total 4,977 4,890 4,770 4,770 4,830NIPPON OIL 1,217 1,272 1,217 1,217 1,217
%
Capacity Utilization Rate 2002 2003 2004 2005 2006Industry Total 81 83 84 87 83NIPPON OIL 84 83 87 88 84
Note: Figures of refining capacity represent levels as of March 31 of each year.
(¥/l)
NIPPON OIL CORPORATION Annual Report 200752

Annual Report 2007 NIPPON OIL CORPORATION 53
7 8
(Thousands of tons) (Thousand BOED)
■ Ethylene ■ Propylene ■ Benzene ■ Paraxylene
NIPPON OIL GROUP’S PRODUCTION CAPACITY BY TYPE OF PETROCHEMICAL PRODUCT (FY) NIPPON OIL GROUP’S PRODUCTION VOLUME OF CRUDE OIL AND NATURAL GAS (CY)
02FY
1,500
1,000
500
003FY 05FY04FY 06FY 02CY
180
120
60
003CY 05CY04CY 06CY
■ U.S.A. ■ Canada*1 ■ U.K. ■ Southeast Asia ■ Oceania
SALES BY TYPE OF PETROLEUM PRODUCT (FY)5Million kl
Industry Total 2002 2003 2004 2005 2006Gasoline and naphtha 108.4 108.5 110.5 110.8 110.6Middle distillates*1 104.8 101.3 100.2 98.3 90.5Heavy fuel oil*2 29.5 30.2 26.5 27.0 22.7Total 242.7 240.0 237.2 236.1 223.8
Million kl
NIPPON OIL 2002 2003 2004 2005 2006Gasoline and naphtha 19.9 20.1 21.0 21.1 20.1Middle distillates 25.6 25.2 26.5 25.7 23.1Heavy fuel oil 8.9 8.9 8.0 8.8 7.2Total 54.4 54.3 55.5 55.6 50.4
Notes: All sales volume figures represent domestic sales volumes of petroleum fuels. Figures for sales volumes of Nippon Oil represent the sales of the parent company only, including sales to consoli-dated subsidiaries of each.
*1 Total sales volume for kerosene, diesel fuel, jet fuel, and heavy fuel oil A.*2 Total sales volume for heavy fuel oil C.
NIPPON OIL GROUP’S PRODUCTION CAPACITY BY TYPE OF PETROCHEMICAL PRODUCT (FY)7
Thousands of tons
2002 2003 2004 2005 2006Ethylene 404 404 404 404 404Propylene 610 610 610 710 850
Thousands of tons
2002 2003 2004 2005 2006Benzene 930 1,022 1,127 1,119 1,147Paraxylene 960 960 1,020 1,050 1,210
*Data as of December 31US$/ton
Contract price in Asia of paraxylene 2003 2004 2005 2006 2007
I II III IV I II III IV I II III IV I II III IV I525 570 572 657 723 768 933 890 863 855 947 947 1,007 1,260 1,097 1,047 1,170
NIPPON OIL GROUP’S PRODUCTION VOLUME OF CRUDE OIL AND NATURAL GAS (CY)8Project companies’ entitlement basis, BOED Thousand BOE
Reserves as of2002 2003 2004 2005 2006 December 31, 2006
U.S.A. 6,300 9,000 7,000 9,400 10,200 32,000Canada*1 11,500 10,600 11,900 10,700 12,900 268,000U.K. 15,000 19,600 17,200 16,900 13,700 41,000Southeast Asia 14,900 24,400 73,200 104,100 102,900 454,000Oceania 2,100 2,000 2,000 15,600 12,400 13,000Total 49,800 65,600 111,300 156,700 152,100 808,000*1 Synthetic oil
NUMBER OF NIPPON OIL SERVICE STATIONS (FY)6Service Stations 2002 2003 2004 2005 2006Industry total 50,000 49,000 48,000 47,000 46,000NIPPON OIL 11,694 11,333 11,059 10,807 10,368Company-owned 2,746 2,607 2,518 2,436 2,309Parent share of Company-
owned service stations 23.5% 23.0% 22.8% 22.5% 22.3%
Self-Service Stations 2002 2003 2004 2005 2006Industry total 2,522 3,423 4,103 4,874 —NIPPON OIL 342 520 651 794 1,055Company-owned 178 304 378 455 588Parent share of Company-owned service stations 52.0% 58.5% 58.1% 57.3% 55.7%
Note: These figures are for the parent company only.*Because the Ministry of Economy, Trade and Industry eliminated the distinction between fixed and mobile service stations from 2002 and now presents the total number of registered service
stations operators, the total number of service stations for the industry as a whole is estimated by Nippon Oil Corporation.
Annual Report 2007 NIPPON OIL CORPORATION 53
FINAN
CIAL SECTION

FINANCIAL DATA (Years ended March 31)
1 5 YEAR DATA FROM STATEMENTS OF INCOMEMillions of yen
2003 2004 2005 2006 2007Net sales 4,187,392 4,279,751 4,924,163 6,117,988 6,624,256Operating income 96,586 55,918 201,470 303,930 159,684Ordinary income 90,796 57,089 212,435 309,088 186,611Income (loss) before income taxes and minority interests 64,203 (149,672) 220,958 298,332 172,205Income taxes 26,341 (7,855) 82,580 120,416 89,329Minority interests in earnings of consolidated subsidiaries 5,580 (8,291) 6,858 11,404 12,654Net income (loss) 32,281 (133,526) 131,519 166,510 70,221
2 5 YEAR DATA FROM BALANCE SHEETSMillions of yen
2003 2004 2005 2006 2007Total current assets 1,329,230 1,395,336 1,569,328 2,128,558 2,262,528
Cash and cash equivalens, TD and short-term investments 130,427 181,855 163,113 239,013 334,853Notes and accounts receivable 592,178 578,850 611,258 773,589 818,679Inventories 479,131 498,857 636,704 951,046 889,827
Total fixed assets 2,020,971 1,870,137 1,945,006 2,090,849 2,122,993Total current liabilities 1,388,397 1,433,424 1,536,810 1,933,592 2,072,145Total long-term liabilities 920,879 909,763 927,431 1,022,738 981,406Minority interests in consolidated subsidiaries 110,973 101,113 96,870 109,238 119,241Total shareholders’ equity 929,987 821,202 953,240 1,130,328 —Total net assets — — — — 1,331,981
Common stock 139,436 139,436 139,437 139,437 139,437Capital surplus 274,829 274,838 274,852 275,015 275,760Retained earnings 513,199 371,471 489,729 599,517 651,294
Total assets 3,350,237 3,265,503 3,514,352 4,215,611 4,385,533
3 PER EMPLOYEEMillions of yen
2003 2004 2005 2006 2007Net sales per employee 296.5 303.2 354.6 452.3 493.6Net income (loss) per employee 2.3 (9.5) 9.5 12.3 5.2Total number of employees 13,882 14,347 13,424 13,628 13,214Note: The figures for net sales per employee and net income (loss) per employee are calculated based on the average number of employees at the beginning and the end of each fiscal year and on net
sales and net income (loss).
4 PER SHAREMillions of shares
2003 2004 2005 2006 2007Number of shares issued 1,514.5 1,514.5 1,514.5 1,464.5 1,464.5Number of potential common shares 86.8 37.3 — — —Number of shares assuming full dilution 1,601.3 1,551.8 1,514.5 1,464.5 1,464.5Percentage of shares owned by foreign investors 17.0% 22.3% 24.6% 29.7% 29.3%
Yen2003 2004 2005 2006 2007
Net income (loss) per share 21.03 (88.76) 86.72 114.08 48.12Diluted net income per share 20.76 — — — —Shareholders’ equity per share 615.89 544.04 631.77 775.62 829.64Stock price at the end of fiscal year 499 596 761 923 956
5 DIVIDENDSYen
2003 2004 2005 2006 2007Cash dividends per share attributable to the period 7 7 10 12 12Consolidated payout ratio 33.3% (7.9)% 11.5% 10.5% 24.9%
1
(Billions of yen)
2003 2004 2005 2006 2007–200
–100
0
100
200
2003 2004 2005 2006 2007–100
–50
0
50
100
150
4
(Yen)
NET INCOME (LOSS)
2003 2004 2005 2006 2007–10
0
10
20
30
40
5
(%)
CONSOLIDATED PAYOUT RATIONET INCOME (LOSS) PER SHARE
NIPPON OIL CORPORATION Annual Report 200754

6 RATIOS2003 2004 2005 2006 2007
Return on total assets 0.95% (4.04)% 3.88% 4.30% 1.63%Return on equity 3.48% (15.25)% 14.82% 15.98% 5.94%Return on sales 0.77% (3.12)% 2.67% 2.72% 1.06%Trade receivables turnover (times) 7.29 7.31 8.28 8.84 8.32Total assets turnover (times) 1.23 1.29 1.45 1.58 1.54Inventory turnover (times) 9.76 8.75 8.67 7.71 7.20Liquidity (times) 0.69 0.44 0.42 0.39 0.52PER (times) 23.73 — 8.80 8.09 19.87PBR (times) 0.81 1.10 1.20 1.19 1.15
7 CAPITAL EXPENDITURES, DEPRECIATION AND AMORTIZATION AND R&D EXPENDITURESBillions of yen
Capital expenditures 2003 2004 2005 2006 2007Total capital expenditures 148.5 136.9 153.0 189.8 204.8
Refining and marketing 121.7 107.8 85.1 115.1 146.6Petrochemical operations 7.3 10.5 *2 *2 *2
Oil and natural gas E&P *1 *1 54.4 65.1 43.3Construction 13.0 7.4 6.8 4.7 8.9Others 6.5 11.2 6.7 4.9 6.0
Note: Figures include investments and loans.
Billions of yenDepreciation and amortization 2003 2004 2005 2006 2007Total depreciation and amortization 99.4 107.0 110.0 135.1 131.9
Refining and marketing 81.6 87.7 85.1 85.0 81.7Petrochemical operations 6.1 6.8 *2 *2 *2
Oil and natural gas E&P *1 *1 12.6 39.0 39.6Construction 5.2 5.4 5.1 4.8 4.9Others 6.5 7.1 7.2 6.3 5.7
*1 For the fiscal years ended in March 31, 2003, and March 31, 2004, figures for the “E&P of oil and natural gas” segment are included within figures for the “Petroleum fuel and crude oil” segment.*2 For the fiscal years ended March 31, 2005, March 31, 2006, and March 31, 2007 figures for the “Petrochemical operations” segment are included within figures for the “Refining and marketing” segment.
Billions of yenR&D expenditures 2003 2004 2005 2006 2007
10.0 9.7 11.4 10.1 12.6
8 DEBT RATIOSBillions of yen
2003 2004 2005 2006 2007Interest-bearing debt 1,064 946 965 1,213 1,297Funds on hand 124 108 145 215 272Net interest-bearing debt 940 838 821 998 1,025Ratio of interest-bearing debt to equity 114% 115% 101% 107% 107%Ratio of net interest-bearing debt to equity 101% 102% 86% 88% 84%Current ratio 95.74% 97.34% 102.12% 110.25% 109.19%Fixed ratio 217.31% 227.73% 204.04% 184.98% 175.06%Fixed assets/capitalization 103.01% 102.08% 98.35% 91.30% 91.77%Interest coverage (times) 3.91 2.94 11.05 13.61 7.29Notes: 1. Figures for actual interest-bearing debt represent the value of interest-bearing debt calculated from balance sheet items less the balance of CP and the balance of debt associated with deposits
made by overseas financial subsidiaries to secure loans.2. Figures for funds on hand are calculated by excluding the temporary effect stemming from the facts that the final day of the fiscal year was a banking holiday and the payment of fuel taxes was
delayed until the subsequent fiscal year.
9 RATINGSShowa Shell Cosmo Oil Nippon Mining Tonen General NIPPON OIL
R&I A BBB– BBB+ — A+Moody’s — Ba1 — Baa1 A3Note: All figures are as of June 30, 2007.
2003 2004 2005 2006 2007–20
–10
0
10
20
2001 2002 20042003 20050
50
100
150
200
250
6 7
(%) (Billions of yen)
■ Refining and marketing ■ Petrochemical operations■ Oil and natural gas E&P ■ Construction■ Others
RETURN ON EQUITY CAPITAL EXPENDITURES
2001 2002 20042003 20050
50
100
150
200
250
7
(Billions of yen)
■ Refining and marketing ■ Petrochemical operations■ Oil and natural gas E&P ■ Construction■ Others
DEPRECIATION AND AMORTIZATION
Annual Report 2007 NIPPON OIL CORPORATION 55
FINAN
CIAL SECTION

NIPPON OIL CORPORATION Annual Report 200756
PERFORMANCE DURING THE YEARConsolidated Financial ResultsOn a consolidated basis, the net sales of the Nippon Oil Group (“the Group”)
in the fiscal year under review increased 8.3% year on year, to ¥6,624.3 billion.
Cost of sales increased 11.9% to ¥6,176.6 because of higher crude oil prices,
and SG&A expenses were down 1.7% at ¥287.9 billion due to lower person-
nel expense and depreciation and amortization. Operating income decreased
by ¥144.2 billion, to ¥159.7 billion. This was due to a negative impact on
earnings of inventory valuation factors, which contributed to sharply higher
earnings in the previous fiscal year. Inventory valuation factors refer to the
effect on the cost of goods sold from the valuation of inventory using the
gross average method to reflect changes in the price of crude oil.
The total sales volume of petroleum products decreased due to a record-
breaking warm winter and fuel conversion. However, excluding inventory valu-
ation factors, operating income rose by ¥31.4 billion from the previous fiscal
year, to ¥168.9 billion, due to improved profits in the oil and natural gas
exploration and production business segment and to improved margins for
petrochemical products.
The Group also recorded non-operating income of ¥26.9 billion, an
increase of ¥21.7 billion, due principally to higher dividend income.
Consolidated ordinary income was down ¥122.5 billion, to ¥186.6 billion.
Excluding inventory valuation factors, consolidated ordinary income was ¥195.8
billion, an increase of ¥53.1 billion from the previous fiscal year.
Due primarily to losses on disposal and sales of fixed assets, other expenses
of ¥14.4 billion were recorded, ¥3.6 billion more than the previous fiscal year.
As a result of the above factors, the Group generated consolidated net
income of ¥70.2 billion, a year-on-year decline of ¥96.3 billion. Net income per
Management’s Discussion and Analysis of Operations
share was ¥48.12, a decrease of ¥65.96 year on year. ROE was 5.9%, or 6.4%
excluding inventory valuation factors.
Refining and MarketingIn the fiscal year under review, due to the tense political situation in certain
Middle Eastern and African oil producing nations and the surging global
demand for oil, the Dubai crude oil price continued its upward march from
the previous fiscal year, passing US$72 a barrel in July 2006 and setting a new
record. Thereafter, the price dropped temporarily heading into winter, but
generally traded in a high range of US$50 to US$60. The average Dubai crude
oil price throughout the fiscal year was US$60.9 a barrel, up approximately
US$7 dollars a barrel from the previous fiscal year.
Foreign exchange rates were affected by higher interest rates in the United
States and Europe, and the average yen-dollar exchange rate for the fiscal
year was ¥117, representing a depreciation of the yen versus the dollar of
around ¥4.
In terms of demand for petroleum products in Japan in the year under
review, the growing adoption of fuel-efficient vehicles led to a year-on-year
decline in domestic demand for gasoline, while a decline in the number of
diesel vehicles in use led to reduced demand for diesel oil. Moreover, demand
for heating oil declined substantially due to a record-breaking warm winter.
Demand for heavy fuel oil A and heavy fuel oil C fell substantially due to the
ongoing shift to gas and coal. As a result, domestic demand for petroleum
products was down across all types of fuel. On the other hand, demand for
petrochemical products was strong, principally for products bound for Asian
countries that recorded continued economic growth.
2003
7,000
2,000
3,000
4,000
4,187 4,280
4,924
6,118
6,624
5,000
6,000
1,000
02004 2005 2006 2007
Cost of sales SG&A expenses Operating income Net sales
2003
200,000
–50,000
0
50,000
100,000
150,000
–100,000
–150,0002004 2005 2006 2007
Net Sales, Cost of Sales, SG&A Expenses, and Operating Income (Years ended March 31) Net Income (Loss) (Years ended March 31)(Billions of yen) (Billions of yen)

Annual Report 2007 NIPPON OIL CORPORATION 57
In this environment, the Group established the management objectives
of bolstering the profitability in its core businesses—petroleum and petro-
chemicals—and developing new energy-type businesses. The Group worked
to implement the strategies outlined below.
First, in response to the decline in domestic demand for petroleum prod-
ucts and the growth in demand for petrochemical products in other Asian
markets, principally China, we continued to focus on integrating oil refining
and petrochemical operations by advancing chemical refinery integration (CRI).
The CRI initiative draws on the Group’s ability to produce base petrochemical
products—such as xylene, paraxylene, and propylene—from crude oil using
the facilities of refineries. The objective is to operate an optimally efficient
production system that enables us to respond quickly and flexibly to trends in
demand for petroleum products and petrochemical products. As one facet of
this initiative, in respect of the manufacturing of paraxylene which is in strong
demand, the Group strove to increase its paraxylene production capacity with
the April 2006 commencement of joint production at Mizushima Paraxylene
Co., Ltd., a joint venture with Mitsubishi Gas Chemical Company, Inc. Regard-
ing propylene, the September 2006 commencement of full-scale operation
of production facilities that use olefin conversion technology (OCT) to pro-
duce propylene from distillate that had previously been used as in-house fuel
at the Kawasaki Operation Center of Nippon Petrochemicals Company, Limited
resulted in higher production volume. With solid demand expected to con-
tinue going forward for these petrochemical products, our strategy will be to
focus on producing and selling these products. By increasing production
capacity at Mizushima Paraxylene Co., Ltd., and enhancing facilities at the
Sendai refinery, ongoing projects which are scheduled for completion in 2007,
we plan to further increase the Group's production capacity for paraxylene
and propylene.
In addition, to meet demand for petroleum products in Asian markets
recording continued growth, we bolstered the export capacity of our oil refin-
eries to 200,000 BD. Since July 2004, we have conducted commissioned
refining operations on behalf of China National United Oil Corporation (China
Oil). In April 2006, we raised the contracted volume to 40,000 BD, and have
agreed to increase it further to 50,000 BD from April 2007. As a result of these
measures, despite declining demand for petroleum products in the domestic
market, the Group will endeavor to maintain and raise the capacity utilization
rate of its refineries as it aims to generate and increase earnings.
In addition, we continue to aggressively expand our overseas operations.
In Guangzhou, China, we completed a lubricant plant and commenced manu-
facturing in September 2006, and in the U.S. state of Alabama, we completed
and started commercial operation of a production plant for lubricants and
grease in October 2006.
We also made progress in gas, power and renewables business. In LNG,
which is the focus of growing attention as a clean energy source, in April 2006
we started commercial operations at the Mizushima LNG base, which was
built in the Mizushima refinery to act as an LNG supply center. In March 2007,
we opened another LNG base that was built at a former transshipment depot
site in the city of Hachinohe, and we began to serve city gas companies as
well as traditional industrial users.
In addition to the above initiatives, to respond to great changes in the
operating environment such as higher crude oil prices, changes in the struc-
ture of domestic energy demand and the rapid expansion of Asian econo-
mies, and to achieve sustained growth, we have expanded strategic alliances
with both domestic and Asian companies. In addition to the existing alliance
with Idemitsu Kosan Co., Ltd. and Cosmo Oil Co., Ltd., we reached a
5,954.4
203.5407.9 58.5
Refining and marketing Oil and natural gas E&P Construction Other
29.3
113.8
10.16.5
Refining and marketing Oil and natural gas E&P Construction Other
Net Sales Operating Income(Billions of yen) (Billions of yen)
FINAN
CIAL SECTION

NIPPON OIL CORPORATION Annual Report 200758
comprehensive agreement with Japan Energy Corporation in June 2006 for a
business alliance extending to a wide range of fields. Under this agreement,
the two companies will consider and implement integrated operation of their
respective refineries in Mizushima, the provision of each other’s products and
joint efforts to rationalize distribution. Also, in January 2007, we reached an
agreement with SK Corporation, South Korea’s largest oil company, for a
business alliance in such fields as upstream operations, supply, and petro-
chemicals. Through these alliances and cooperative relationships, we are
determined to expand our business in Asia and strengthen our competitive-
ness further.
In the year under review, net sales of the Refining and Marketing busi-
ness segment rose 8.6% from the previous fiscal year to ¥5,954.4 billion.
Operating income was down ¥167.9 billion, to ¥29.3 billion. This was due to
a negative impact of ¥175.6 billion on earnings of inventory valuation factors,
which contributed to sharply higher earnings in the previous fiscal year. In-
ventory valuation factors refer to the effect on the cost of goods sold from the
valuation of inventory using the gross average method to reflect changes in
the price of crude oil. Although the total sales volume of petroleum products
decreased due to a record-breaking warm winter and fuel conversion, exclud-
ing inventory valuation factors, operating income increased ¥7.7 billion, to
¥38.5 billion, due primarily to improved margins for petrochemical products.
Details are shown in the diagram below.
Exploration and Production of Oil and Natural GasDue to the rise in crude oil prices, profitability improved in the E&P business.
Regarding measures taken by the production business in the fiscal year
under review, commercial production began at the onshore SE Mananda field
in Papua New Guinea and at the Merganser gas field in the UK North Sea. In
terms of new developments, we continued to make preparations for the com-
mencement of production in the Blane oil field in the UK North Sea. At the
same time, construction continues on an LNG plant at the Tangguh LNG
Project in Indonesia toward the commencement of supply from the end of
2008. In new exploration projects, we made preparations for trial drilling in
exploration blocks off the coast of Libya for which we acquired interests in the
previous fiscal year.
Regarding the purchase of producing assets, we looked closely at pros-
pects from a technical and an economic perspective. Although we tried to
purchase several assets we viewed as promising, ultimately we were unsuc-
cessful as a result of our uncompromising emphasis on profitability.
As a result of the above initiatives, the Group’s average production vol-
ume of crude oil and natural gas (share of production in each project, oil
equivalent basis) was 152,000 BD, 2.8% less than the previous fiscal year.
Net sales in the E&P business segment increased by 12.8%, to ¥203.5
billion, and operating income rose ¥21.7 billion, to ¥113.8 billion, mainly due
to higher crude oil prices. Details are shown in the diagram on page 59.
ConstructionAlthough private-sector capital investment increased in the year under review,
public-sector investment was generally weak, and the road-building and
–15.7 +17.0 –13.1–1.6 +3.8
+18.3 –1.029.3
–167.9
2006Operating
income
Inventoryvaluationfactors
Salesvolume
In-housefuel cost
Costreduction
Salesvolume
Profitmargin
Costreduction
Time lag
2007Operating
incomePetroleum Products –189.0 Petrochemicals +21.1
197.2–175.6
Analysis of Changes in Operating Income——Refining and Marketing (Years ended March 31)(Billions of yen)

Annual Report 2007 NIPPON OIL CORPORATION 59
construction industries continued to face a challenging demand environment.
In this setting, the Group worked to secure construction orders and to bolster
its competitiveness through cost reductions and enhanced efficiency.
Net sales in the Construction business segment rose 8.9% year on year,
to ¥407.9 billion. The segment recorded operating income of ¥10.1 billion, up
¥2.9 billion, year on year due to cost reductions and enhanced efficiency.
Other SegmentsIn the field of petroleum product distribution, the operating environment
remained challenging in the year under review. In this setting, the Group
implemented aggressive marketing activities for a wide array of automobile-
related products, with a special focus on ENEOS brand goods. In our
real-estate operations, we enhanced our management and service systems
and improved existing facilities to increase tenant satisfaction levels.
Consolidated net sales in the Other business segment declined 27.3%,
to ¥58.5 billion, and operating income was down ¥1.8 billion, to ¥4.1 billion.
This result was primarily attributable to the removal of one consolidated sub-
sidiary from the scope of consolidation.
FINANCIAL POSITIONBalance SheetAt the end of the year under review, consolidated total assets were ¥4,385.5
billion, an increase of ¥169.9 billion from the end of the previous fiscal year.
This increase was principally attributable to the effect of the last day of the
fiscal year falling on a Japanese national holiday, which caused the payment
of excise tax payable for the fiscal year to be delayed.
Total liabilities as of March 31, 2007 were ¥3,053.5, an increase of ¥97.2
billion. Interest-bearing debt increased ¥84.5 billion to ¥1,297.1 billion due to
factors including higher operating capital caused by increasing crude oil prices.
Consolidated net assets totaled ¥1,332.0 billion, an increase of ¥72.7 billion
from a year earlier. (The change is measured from the total of minority interests
in consolidated subsidiaries and shareholders’ equity at the end of the
previous fiscal year.) This gain was the result of positive factors such as
consolidated net income exceeding negative factors such as year-end divi-
dends. As a result, the equity ratio was 27.7%. Net assets per share increased
¥54.02 to ¥829.64.
The ratio of net interest-bearing debt to equity was 84%.
Cash FlowsAs of the end of the year under review, cash and cash equivalents (hereinafter
referred to as “cash”) totaled ¥321.8 billion, an increase of ¥107.3 billion. The
cash flow movements and factors influencing them during the year under
review were as follows:
Net cash provided by operating activities amounted to ¥205.9 billion as
positive factors, such as income before income taxes and minority interests
(¥172.2 billion) and non-cash expenses, such as depreciation and amortiza-
tion (¥131.9 billion), exceeded negative factors, such as an increase in work-
ing capital. Also, the effect of the last day of the fiscal year falling on a Japanese
national holiday caused the payment of excise tax payable for the fiscal year
to be delayed.
Net cash used in investing activities amounted to ¥143.5 billion. This was
mainly due to investment in petrochemical product manufacturing equipment.
2006Operating
income
Salesvolume
Salesprice
FX rateand others
2007Operating
income
92.1
–4.3
+20.7 +5.3
113.8
+21.7
Analysis of Changes in Operating Income——Exploration and Production of Oil and Natural Gas (Years ended March 31)(Billions of yen)
FINAN
CIAL SECTION

NIPPON OIL CORPORATION Annual Report 200760
Net cash provided by financing activities amounted to ¥44.4 billion as positive
factors, such as the borrowing of working capital as a result of rising crude oil prices,
exceeded negative factors, such as dividend payments.
Commitment Line ContractsTo raise working capital efficiently, Nippon Oil has concluded a commitment line
contract with a syndicate of 5 banks with which it has transaction relationships.
This commitment line provides the Company with funding up to ¥150.0 billion
and US$200 million. There were no borrowings under this commitment line
during the fiscal year under review.
Capital Expenditures and Depreciation and AmortizationCapital expenditures for the fiscal year under review was ¥204.8 billion, which
mainly comprised strategic investment in the E&P and Petrochemical
businesses.
Depreciation and amortization expenses were down ¥3.2 billion
at ¥131.9 billion.
Research & Development ActivitiesR&D expenditures for fiscal 2006 were ¥12.6 billion. This primarily comprised
spending on the E&P and marketing businesses.
DIVIDENDSWe consider the return of profits to shareholders to be an important manage-
ment priority. To maintain stable dividend payments while increasing enter-
prise value, we will take into account the need to bolster internal reserves to
provide for investments targeting the realization of our growth strategies. With
consideration for such factors as business performance and balanced fund-
ing, we will work to increase dividends over the medium to long term. More-
over, in the implementation of our capital policy, we will take a flexible approach
to share buybacks.
In accordance with these policies, in April 2005 we purchased and retired
50 million shares of common stock at a total price of ¥38.5 billion. At the
same time, under the third consolidated medium-term management plan,
started in the previous fiscal year, we reevaluated the level of our dividends
and decided to target annual cash dividends of ¥12 per share. We plan
year-end dividends for the fiscal year under review of ¥6 per share. Therefore,
including the interim dividends, dividends applicable to the year will be ¥12
per share, the same as in the previous year.
BUSINESS RISKSThe Group faces a variety of risks that may play an important role in impacting
its financial condition, managerial performance and cash flow. The main risks
are outlined below:
1. Impact of fluctuating currency exchange rates (against the U.S. dollar)
and crude oil prices.
a. Impact on Inventory Assets
The Group mainly utilizes the cost method based on the gross average method
for valuating its inventory assets. With this valuation method, when crude oil
prices (in yen) rise above the unit price of inventory, inventory assets begin
pushing down the cost of goods sold (in this instance, cost of goods sold
increases slower than crude oil prices due to the low price of inventory), thus
making it a positive profitability factor.
2003
160
40
80
120
02004 2005 2006 2007
Ratio of net interest-bearing debt to equityRatio of interest-bearing debt to equity
2003
250
50
100
150
200
02004 2005 2006 2007
Capital expenditures* Depreciation and amortization
Ratio of Interest-Bearing Debt to Equity (Years ended March 31) Capital Expenditures, and Depreciation and Amortization (Years ended March 31)
*Figures include investments and loans.
(%) (Billions of yen)

Annual Report 2007 NIPPON OIL CORPORATION 61
On the other hand, when crude oil prices (in yen) fall below the unit
price of inventory, the valuation of inventory assets pushes up the cost of
goods sold, thus making it a negative profitability factor.
b. Impact on Exploration and Production of Oil and Natural Gas (E&P)
In the area of E&P, a rise in crude oil prices (in yen) is a positive factor for
profitability because it leads to an increase in revenues. On the other hand, a
drop in crude oil prices (in yen) is a negative factor for profitability because it
leads to a decrease in revenues.
2. Impact of fluctuations in demand and market conditions for petroleum
fuel and petrochemical products
The demand for petroleum products fluctuates depending on climate condi-
tions (such as an unseasonably cool summers or warm winters) and the
economic conditions of the time. Demand for petrochemical products will
fluctuate depending on economic growth and trends in Asian markets as export
dependence on Asia, in particular China, increases. Sales for the Nippon Oil
Group’s products will also be impacted by these fluctuations and as such,
demand trends are determined to be a profitability factor.
In addition, the domestic market for petroleum fuel products will fluctu-
ate as a result of the supply and demand environment for domestic petro-
leum fuel products, local reselling conditions and movements in the overseas
market for petroleum fuel products. Similarly, the market for petrochemical
products will fluctuate depending on raw naphtha prices and market condi-
tions in East Asia. Although the Nippon Oil Group revises sale prices to reflect
these fluctuations, such changes may be considered a profitability factor de-
pending on the market environment.
3. Impact of fluctuating interest rates
An increase in interest rates is considered a negative profitability factor because
it would increase interest expense on loans and other interest-bearing liabili-
ties and consequently worsen the balance of financial expenses. On the other
hand, a fall in interest rates is considered a positive profitability factor because
it would decrease interest expense on loans and other interest-bearing liabili-
ties and consequently improve the balance of financial expenses.
4. Risks arising from overseas businesses
The Group’s procurement, production, exporting and sales activities are car-
ried out not only in Japan, but on a global scale in areas such as North America,
Europe and Asia/Oceania. The Group believes that certain risks as outlined
below exist in its overseas activities.
a. Country risks – Political and economic turmoil in foreign countries and a freez-
ing of currency exchanges, a default on loans and others triggered by them
b. Social turmoil arising from strikes, terrorist activities, war, epidemics, etc.
c. Disasters arising out of an act of god
d. Restrictions arising from new regulations, such as import restrictions and
export trade management rules
The generation of such risks will hinder the Nippon Oil Group’s overseas
business activities and consequently, may lead to worsened financial performance.
5. Impact of trends in public investments and private capital expenditures
The Group’s construction segment relies heavily on contracted paving, civil
engineering, and construction projects. The profitability of this segment there-
fore fluctuates greatly on trends in the public investment and private capital
expenditures (including private residential investments) fields.
6. Impact of stricter environmental regulations
From the standpoint of global environmental protection, new regulations on
quality or the need to blend in biomass fuels may result in cost increases to
the Group’s operations. Costs may be in the form of capital expenditures into
refineries or an increase in variable costs.
7. Risks arising from information systems
Earthquakes, floods and other natural disasters may damage information sys-
tems and cease normal business operations. In a situation such as this, pro-
duction and sales activities of the Group will not only be compromised but it
may have a major negative impact on the business of vendors.
8. Operational risks associated with production facilities
The Group operates production facilities not only in Japan but also on a glo-
bal scale. Natural disasters or unforeseen events at any of these facilities that
leads to a ceasing of production may have a negative impact on the overall
financial performance of the Group.
Please note that although these risks contain items that may be forward-
looking in nature, they are based on information available to the Group at the
end of the fiscal year under review. In addition, the risks above should be not
considered a full list of risks that the Group may face in its operations.
FINAN
CIAL SECTION

NIPPON OIL CORPORATION Annual Report 200762
Consolidated Balance SheetsNippon Oil Corporation and Consolidated Subsidiaries
Thousands ofU.S. dollars
Millions of yen (Note 2)
March 31, 2007 and 2006 2007 2006 2007
ASSETS
Current assets:Cash and cash equivalents . . . . . . . . . . . . . . . . . . . . . . . . . . . . . . . . . . . . . . . . . . . . . . . . . . . . . . ¥ 321,786 ¥ 214,476 $ 2,727,000Time deposits (Note 6) . . . . . . . . . . . . . . . . . . . . . . . . . . . . . . . . . . . . . . . . . . . . . . . . . . . . . . . . 10,327 243 87,517Short-term investments in securities (Note 3) . . . . . . . . . . . . . . . . . . . . . . . . . . . . . . . . . . . . . . 2,739 24,292 23,212Notes and accounts receivable (Note 6):
Trade . . . . . . . . . . . . . . . . . . . . . . . . . . . . . . . . . . . . . . . . . . . . . . . . . . . . . . . . . . . . . . . . . . . . . 818,679 773,589 6,937,958Other . . . . . . . . . . . . . . . . . . . . . . . . . . . . . . . . . . . . . . . . . . . . . . . . . . . . . . . . . . . . . . . . . . . . . 106,130 84,307 899,407
Less allowance for doubtful receivables . . . . . . . . . . . . . . . . . . . . . . . . . . . . . . . . . . . . . . . . . . . (2,900) (4,223) (24,576)Inventories (Note 4) . . . . . . . . . . . . . . . . . . . . . . . . . . . . . . . . . . . . . . . . . . . . . . . . . . . . . . . . . . . 889,827 951,046 7,540,907Deferred income taxes (Note 9) . . . . . . . . . . . . . . . . . . . . . . . . . . . . . . . . . . . . . . . . . . . . . . . . . 50,662 38,933 429,339Other current assets . . . . . . . . . . . . . . . . . . . . . . . . . . . . . . . . . . . . . . . . . . . . . . . . . . . . . . . . . . . 65,275 45,891 553,178
Total current assets . . . . . . . . . . . . . . . . . . . . . . . . . . . . . . . . . . . . . . . . . . . . . . . . . . . . . . . 2,262,528 2,128,558 19,173,966
Investments and long-term receivables:Investments in unconsolidated subsidiaries and affiliates . . . . . . . . . . . . . . . . . . . . . . . . . . . . . 57,200 151,151 484,746Investments in other securities (Notes 3 and 6) . . . . . . . . . . . . . . . . . . . . . . . . . . . . . . . . . . . . . 366,569 244,864 3,106,517Long-term receivables (Note 6) . . . . . . . . . . . . . . . . . . . . . . . . . . . . . . . . . . . . . . . . . . . . . . . . . . 11,514 17,073 97,576
Total investments and long-term receivables . . . . . . . . . . . . . . . . . . . . . . . . . . . . . . . . . . 435,283 413,088 3,688,839
Property, plant and equipment (Notes 5 and 6):Land . . . . . . . . . . . . . . . . . . . . . . . . . . . . . . . . . . . . . . . . . . . . . . . . . . . . . . . . . . . . . . . . . . . . . . . . 675,036 680,044 5,720,644Buildings . . . . . . . . . . . . . . . . . . . . . . . . . . . . . . . . . . . . . . . . . . . . . . . . . . . . . . . . . . . . . . . . . . . . 800,331 801,328 6,782,466Oil tanks . . . . . . . . . . . . . . . . . . . . . . . . . . . . . . . . . . . . . . . . . . . . . . . . . . . . . . . . . . . . . . . . . . . . . 261,661 262,742 2,217,466Machinery and equipment . . . . . . . . . . . . . . . . . . . . . . . . . . . . . . . . . . . . . . . . . . . . . . . . . . . . . . 1,596,089 1,562,759 13,526,178Construction in progress . . . . . . . . . . . . . . . . . . . . . . . . . . . . . . . . . . . . . . . . . . . . . . . . . . . . . . . . 62,702 77,081 531,373
3,395,820 3,383,957 28,778,136Less accumulated depreciation . . . . . . . . . . . . . . . . . . . . . . . . . . . . . . . . . . . . . . . . . . . . . . . . . . (2,030,575) (2,013,721) (17,208,263)
Property, plant and equipment, net . . . . . . . . . . . . . . . . . . . . . . . . . . . . . . . . . . . . . . . . . . 1,365,244 1,370,235 11,569,864
Deferred income taxes (Note 9) . . . . . . . . . . . . . . . . . . . . . . . . . . . . . . . . . . . . . . . . . . . . . . . . . . . . 16,200 20,685 137,288Exploration & development investment . . . . . . . . . . . . . . . . . . . . . . . . . . . . . . . . . . . . . . . . . . . . . . 180,023 157,068 1,525,619Other assets (Note 6) . . . . . . . . . . . . . . . . . . . . . . . . . . . . . . . . . . . . . . . . . . . . . . . . . . . . . . . . . . . . 126,252 125,975 1,069,932
Total assets . . . . . . . . . . . . . . . . . . . . . . . . . . . . . . . . . . . . . . . . . . . . . . . . . . . . . . . . . . . . ¥ 4,385,533 ¥ 4,215,611 $ 37,165,534See accompanying notes to consolidated financial statements.

Annual Report 2007 NIPPON OIL CORPORATION 63
Thousands ofU.S. dollars
Millions of yen (Note 2)
2007 2006 2007
LIABILITIES AND NET ASSETS
Current liabilities:Short-term loans (Note 6) . . . . . . . . . . . . . . . . . . . . . . . . . . . . . . . . . . . . . . . . . . . . . . . . . . . . . . ¥ 602,131 ¥ 513,188 $ 5,102,805Current portion of long-term debt (Note 6) . . . . . . . . . . . . . . . . . . . . . . . . . . . . . . . . . . . . . . . . 92,047 84,509 780,059Notes and accounts payable:
Trade . . . . . . . . . . . . . . . . . . . . . . . . . . . . . . . . . . . . . . . . . . . . . . . . . . . . . . . . . . . . . . . . . . . . . 515,930 580,081 4,372,288Other . . . . . . . . . . . . . . . . . . . . . . . . . . . . . . . . . . . . . . . . . . . . . . . . . . . . . . . . . . . . . . . . . . . . . 281,597 235,388 2,386,415
Excise taxes payable (Note 10) . . . . . . . . . . . . . . . . . . . . . . . . . . . . . . . . . . . . . . . . . . . . . . . . . . 308,005 227,191 2,610,212Accrued income taxes . . . . . . . . . . . . . . . . . . . . . . . . . . . . . . . . . . . . . . . . . . . . . . . . . . . . . . . . . . 45,507 65,745 385,653Accrued expenses . . . . . . . . . . . . . . . . . . . . . . . . . . . . . . . . . . . . . . . . . . . . . . . . . . . . . . . . . . . . . 46,395 49,629 393,178Deferred income taxes (Note 9) . . . . . . . . . . . . . . . . . . . . . . . . . . . . . . . . . . . . . . . . . . . . . . . . . 765 70 6,483Other current liabilities . . . . . . . . . . . . . . . . . . . . . . . . . . . . . . . . . . . . . . . . . . . . . . . . . . . . . . . . . 179,764 177,788 1,523,424
Total current liabilities . . . . . . . . . . . . . . . . . . . . . . . . . . . . . . . . . . . . . . . . . . . . . . . . . . . . . 2,072,145 1,933,592 17,560,551
Long-term liabilities:Long-term debt (Note 6) . . . . . . . . . . . . . . . . . . . . . . . . . . . . . . . . . . . . . . . . . . . . . . . . . . . . . . . 613,481 652,075 5,198,992Accrued retirement benefits (Note 7) . . . . . . . . . . . . . . . . . . . . . . . . . . . . . . . . . . . . . . . . . . . . . 84,112 98,849 712,814Reserve for inspection of oil tanks, machinery and equipment, and vessels . . . . . . . . . . . . . . 35,174 34,310 298,085Deferred income taxes (Note 9) . . . . . . . . . . . . . . . . . . . . . . . . . . . . . . . . . . . . . . . . . . . . . . . . . 177,192 176,772 1,501,627Accrued estimated cost of abandonment of wells . . . . . . . . . . . . . . . . . . . . . . . . . . . . . . . . . . . 33,276 20,716 282,000Other long-term liabilities . . . . . . . . . . . . . . . . . . . . . . . . . . . . . . . . . . . . . . . . . . . . . . . . . . . . . . . 38,167 40,015 323,449
Total long-term liabilities . . . . . . . . . . . . . . . . . . . . . . . . . . . . . . . . . . . . . . . . . . . . . . . . . . . 981,406 1,022,738 8,317,000
Net assetsShareholders’ equity:
Common stock:Authorized – 2,000,000,000 sharesIssued – 1,464,508,343 shares in 2007 . . . . . . . . . . . . . . . . . . . . . . . . . . . . . . . . . . . . . . . . . 139,437 139,437 1,181,669
Capital surplus . . . . . . . . . . . . . . . . . . . . . . . . . . . . . . . . . . . . . . . . . . . . . . . . . . . . . . . . . . . . . . . . 275,760 275,015 2,336,949Retained earnings . . . . . . . . . . . . . . . . . . . . . . . . . . . . . . . . . . . . . . . . . . . . . . . . . . . . . . . . . . . . . 651,294 599,517 5,519,441Less treasury stock, at cost: 2,742,825 shares in 2007 . . . . . . . . . . . . . . . . . . . . . . . . . . . . . . . . (2,475) (5,929) (20,975)Total shareholders’ equity . . . . . . . . . . . . . . . . . . . . . . . . . . . . . . . . . . . . . . . . . . . . . . . . . . . . . . 1,064,016 1,008,039 9,017,085
Valuation and translation adjustments:Unrealized holding gain on securities, net of deferred income taxes . . . . . . . . . . . . . . . . . . . . 121,830 122,456 1,032,458Unrealized holding gain on hedging derivatives . . . . . . . . . . . . . . . . . . . . . . . . . . . . . . . . . . . . . 19,901 19,713 168,653Translation adjustments . . . . . . . . . . . . . . . . . . . . . . . . . . . . . . . . . . . . . . . . . . . . . . . . . . . . . . . . 6,991 (167) 59,246
Total valuation and translation adjustments . . . . . . . . . . . . . . . . . . . . . . . . . . . . . . . . . . . 148,723 142,001 1,260,364
Minority interests in consolidated subsidiaries . . . . . . . . . . . . . . . . . . . . . . . . . . . . . . . . . . . 119,241 109,238 1,010,517
Total net assets . . . . . . . . . . . . . . . . . . . . . . . . . . . . . . . . . . . . . . . . . . . . . . . . . . . . . . . . . . 1,331,981 1,259,280 11,287,975Total liabilities and net assets . . . . . . . . . . . . . . . . . . . . . . . . . . . . . . . . . . . . . . . . . . . ¥4,385,533 ¥4,215,611 $37,165,534
FINAN
CIAL SECTION

NIPPON OIL CORPORATION Annual Report 200764
Consolidated Statements of IncomeNippon Oil Corporation and Consolidated Subsidiaries
Thousands ofU.S. dollars
Millions of yen (Note 2)
Years ended March 31, 2007 and 2006 2007 2006 2007
Net sales (Notes 10 and 16) . . . . . . . . . . . . . . . . . . . . . . . . . . . . . . . . . . . . . . . . . . . . . . . . . . . . . . ¥6,624,256 ¥6,117,988 $56,137,763Cost of sales (Note 10) . . . . . . . . . . . . . . . . . . . . . . . . . . . . . . . . . . . . . . . . . . . . . . . . . . . . . . . . . . 6,176,656 5,521,192 52,344,542
Gross profit . . . . . . . . . . . . . . . . . . . . . . . . . . . . . . . . . . . . . . . . . . . . . . . . . . . . . . . . . . . . . . . . . . 447,600 596,796 3,793,220Selling, general and administrative expenses (Notes 11 and 12) . . . . . . . . . . . . . . . . . . . . 287,915 292,866 2,439,958
Operating income (Note 16) . . . . . . . . . . . . . . . . . . . . . . . . . . . . . . . . . . . . . . . . . . . . . . . . . . . . 159,684 303,930 1,353,254
Non-operating income (expenses):Interest expense . . . . . . . . . . . . . . . . . . . . . . . . . . . . . . . . . . . . . . . . . . . . . . . . . . . . . . . . . . . . . . (24,789) (23,160) (210,076)Interest and dividend income . . . . . . . . . . . . . . . . . . . . . . . . . . . . . . . . . . . . . . . . . . . . . . . . . . . 21,130 11,262 179,068Foreign exchange gain . . . . . . . . . . . . . . . . . . . . . . . . . . . . . . . . . . . . . . . . . . . . . . . . . . . . . . . . . 5,214 8,426 44,186Asset rental income . . . . . . . . . . . . . . . . . . . . . . . . . . . . . . . . . . . . . . . . . . . . . . . . . . . . . . . . . . . . 10,937 10,657 92,686Equity in earnings of unconsolidated subsidiaries and affiliates . . . . . . . . . . . . . . . . . . . . . . . . 3,048 4,929 25,831Gain (loss) on valuation of derivatives . . . . . . . . . . . . . . . . . . . . . . . . . . . . . . . . . . . . . . . . . . . . 8,896 (9,575) 75,390Other, net . . . . . . . . . . . . . . . . . . . . . . . . . . . . . . . . . . . . . . . . . . . . . . . . . . . . . . . . . . . . . . . . . . . 2,487 2,618 21,076
26,926 5,158 228,186
Ordinary income . . . . . . . . . . . . . . . . . . . . . . . . . . . . . . . . . . . . . . . . . . . . . . . . . . . . . . . . . . . . . . 186,611 309,088 1,581,449
Other income (expenses):Gain on sales of property, plant and equipment . . . . . . . . . . . . . . . . . . . . . . . . . . . . . . . . . . . . 12,524 8,213 106,136Loss on disposal of property, plant and equipment . . . . . . . . . . . . . . . . . . . . . . . . . . . . . . . . . . (11,482) (12,462) (97,305)Write-downs of investments in securities and other assets . . . . . . . . . . . . . . . . . . . . . . . . . . . . (1,085) (3,414) (9,195)Gain on sales of securities . . . . . . . . . . . . . . . . . . . . . . . . . . . . . . . . . . . . . . . . . . . . . . . . . . . . . . 716 1,024 6,068Special allowance for early retirement plans . . . . . . . . . . . . . . . . . . . . . . . . . . . . . . . . . . . . . . . . (27) (1,162) (229)Write-downs of real estate for sale . . . . . . . . . . . . . . . . . . . . . . . . . . . . . . . . . . . . . . . . . . . . . . . (111) (81) (941)Loss on impairment of fixed assets (Note 5) . . . . . . . . . . . . . . . . . . . . . . . . . . . . . . . . . . . . . . . (6,872) (3,868) (58,237)Loss on redemption of bonds . . . . . . . . . . . . . . . . . . . . . . . . . . . . . . . . . . . . . . . . . . . . . . . . . . . (1,363) — (11,551)Restructuring cost for cogeneration business . . . . . . . . . . . . . . . . . . . . . . . . . . . . . . . . . . . . . . . (3,456) — (29,288)Loss on cost of elimination of asbestos . . . . . . . . . . . . . . . . . . . . . . . . . . . . . . . . . . . . . . . . . . . . (364) (1,810) (3,085)Other, net . . . . . . . . . . . . . . . . . . . . . . . . . . . . . . . . . . . . . . . . . . . . . . . . . . . . . . . . . . . . . . . . . . . (2,883) 2,805 (24,432)
(14,405) (10,756) (122,076)
Income before income taxes and minority interests . . . . . . . . . . . . . . . . . . . . . . . . . . . . . . 172,205 298,332 1,459,364Income taxes (Note 9):
Current . . . . . . . . . . . . . . . . . . . . . . . . . . . . . . . . . . . . . . . . . . . . . . . . . . . . . . . . . . . . . . . . . . . . . . 94,954 117,551 804,695Deferred . . . . . . . . . . . . . . . . . . . . . . . . . . . . . . . . . . . . . . . . . . . . . . . . . . . . . . . . . . . . . . . . . . . . (5,624) 2,865 (47,661)
Income before minority interests . . . . . . . . . . . . . . . . . . . . . . . . . . . . . . . . . . . . . . . . . . . . . . . 82,875 177,915 702,331Minority interests in earnings of consolidated subsidiaries . . . . . . . . . . . . . . . . . . . . . . . . (12,654) (11,404) (107,237)
Net income . . . . . . . . . . . . . . . . . . . . . . . . . . . . . . . . . . . . . . . . . . . . . . . . . . . . . . . . . . . . . . . . . . . . ¥ 70,221 ¥ 166,510 $ 595,093
Yen U.S. dollars (Note*)
Years ended March 31, 2007 and 2006 2007 2006 2007
Net income per share—basic . . . . . . . . . . . . . . . . . . . . . . . . . . . . . . . . . . . . . . . . . . . . . . . . . . . . ¥48.12 ¥114.08 $0.41Cash dividends per share attributable to the year . . . . . . . . . . . . . . . . . . . . . . . . . . . . . . . . 12.00 12.00 0.10See accompanying notes to consolidated financial statements.

Annual Report 2007 NIPPON OIL CORPORATION 65
Consolidated Statements of Changes in Net AssetsNippon Oil Corporation and Consolidated Subsidiaries
Millions of yen
Stockholders’ equity Valuation and translation adjustments
TotalNet Foreign valuation
Total unrealized Deferred currency andCommon Capital Retained Treasury stockholders’ holding gains gains on translation translation Minority Total net
Years ended March 31, 2007 stock surplus earnings stock equity on securities hedges adjustments adjustments interests assets
Beginning of year . . . . . . . . . . . . ¥ 139,437 ¥ 275,015 ¥ 599,517 ¥ (5,929) ¥1,008,039 ¥ 122,456 ¥ 19,713 ¥ (167) ¥ 142,001 ¥ 109,238 ¥ 1,259,280
Cash dividends . . . . . . . . . . . . . . — — (17,542) — (17,542) — — — — — (17,542)
Bonuses to directors . . . . . . . . . — — (26) — (26) — — — — — (26)
Net income . . . . . . . . . . . . . . . . — — 70,221 — 70,221 — — — — — 70,221
Acquisition of treasury stock . . . — — — (703) (703) — — — — — (703)
Disposal of treasury stock . . . . . — 745 — 4,158 4,903 — — — — — 4,903
Net decrease resulting from
inclusion of subsidiaries in
consolidation . . . . . . . . . . . . . . — — (753) — (753) — — — — — (753)
Net decrease resulting from
inclusion of affiliates in equity
method . . . . . . . . . . . . . . . . . . — — (122) — (122) — — — — — (122)
Net changes other than
stockholders’ equity . . . . . . . . — — — — — (625) 188 7,158 6,721 10,002 16,724
End of year . . . . . . . . . . . . . . . . . ¥ 139,437 ¥ 275,760 ¥ 651,294 ¥ (2,475) ¥1,064,016 ¥ 121,830 ¥ 19,901 ¥ 6,991 ¥ 148,723 ¥ 119,241 ¥ 1,331,981
Thousands of U.S. dollars
Stockholders’ equity Valuation and translation adjustments
TotalNet Foreign valuation
Total unrealized Deferred currency andCommon Capital Retained Treasury stockholders’ holding gains gains on translation translation Minority Total net
Years ended March 31, 2007 stock surplus earnings stock equity on securities hedges adjustments adjustments interests assets
Beginning of year . . . . . . . . . . . . $1,181,669 $2,330,636 $5,080,653 $(50,246) $8,542,703 $1,037,763 $167,059 $(1,415) $1,203,398 $ 925,746 $10,671,864
Cash dividends . . . . . . . . . . . . . . — — (148,661) — (148,661) — — — — — (148,661)
Bonuses to directors . . . . . . . . . — — (220) — (220) — — — — — (220)
Net income . . . . . . . . . . . . . . . . — — 595,093 — 595,093 — — — — — 595,093
Acquisition of treasury stock . . . — — — (5,958) (5,958) — — — — — (5,958)
Disposal of treasury stock . . . . . — 6,314 — 35,237 41,551 — — — — — 41,551
Net decrease resulting from
inclusion of subsidiaries in
consolidation . . . . . . . . . . . . . . — — (6,381) — (6,381) — — — — — (6,381)
Net decrease resulting from
inclusion of affiliates in equity
method . . . . . . . . . . . . . . . . . . — — (1,034) — (1,034) — — — — — (1,034)
Net changes other than
stockholders’ equity . . . . . . . . — — — — — (5,297) 1,593 60,661 56,958 84,763 141,729
End of year . . . . . . . . . . . . . . . . . $1,181,669 $2,336,949 $5,519,441 $(20,975) $9,017,085 $1,032,458 $168,653 $59,246 $1,260,364 $1,010,517 $11,287,975
FINAN
CIAL SECTION

NIPPON OIL CORPORATION Annual Report 200766
Consolidated Statements of Cash FlowsNippon Oil Corporation and Consolidated Subsidiaries
Thousands ofU.S. dollars
Millions of yen (Note 2)
Year ended March 31, 2007 and 2006 2007 2006 2007
Operating activitiesIncome before income taxes and minority interests . . . . . . . . . . . . . . . . . . . . . . . . . . . . . . . . . . . . ¥ 172,205 ¥ 298,332 $ 1,459,364Depreciation and amortization . . . . . . . . . . . . . . . . . . . . . . . . . . . . . . . . . . . . . . . . . . . . . . . . . . . . . 131,872 135,133 1,117,559Amortization of excess of cost over net assets acquired . . . . . . . . . . . . . . . . . . . . . . . . . . . . . . . . . (254) (753) (2,153)Reversal of allowance for doubtful receivables . . . . . . . . . . . . . . . . . . . . . . . . . . . . . . . . . . . . . . . . (4,777) (3,601) (40,483)Reversal of allowance for accrued retirement benefits . . . . . . . . . . . . . . . . . . . . . . . . . . . . . . . . . . (14,527) (7,635) (123,110)Provision for (reversal of) reserve for inspection of oil tanks,
machinery and equipment, and vessels . . . . . . . . . . . . . . . . . . . . . . . . . . . . . . . . . . . . . . . . . . . . 864 1,344 7,322Reversal of allowance for accrued cost of abandonment of wells . . . . . . . . . . . . . . . . . . . . . . . . . 12,560 14,153 106,441Interest and dividend income . . . . . . . . . . . . . . . . . . . . . . . . . . . . . . . . . . . . . . . . . . . . . . . . . . . . . . (21,130) (11,262) (179,068)Interest expense . . . . . . . . . . . . . . . . . . . . . . . . . . . . . . . . . . . . . . . . . . . . . . . . . . . . . . . . . . . . . . . . . 24,789 23,160 210,076Gain on sales of property, plant and equipment . . . . . . . . . . . . . . . . . . . . . . . . . . . . . . . . . . . . . . . (12,524) (8,322) (106,136)Loss on disposal of property, plant and equipment . . . . . . . . . . . . . . . . . . . . . . . . . . . . . . . . . . . . 7,254 8,851 61,475Loss on impairment of fixed assets . . . . . . . . . . . . . . . . . . . . . . . . . . . . . . . . . . . . . . . . . . . . . . . . . 6,872 3,868 58,237Gain on sales of investments in securities . . . . . . . . . . . . . . . . . . . . . . . . . . . . . . . . . . . . . . . . . . . . (722) (2,457) (6,119)Increase in notes and accounts receivable . . . . . . . . . . . . . . . . . . . . . . . . . . . . . . . . . . . . . . . . . . . . (32,641) (138,466) (276,619)Decrease (increase) in inventories . . . . . . . . . . . . . . . . . . . . . . . . . . . . . . . . . . . . . . . . . . . . . . . . . . 59,135 (317,203) 501,144Increase in notes and accounts payable and excise taxes payable . . . . . . . . . . . . . . . . . . . . . . . . . 8,975 119,627 76,059Other, net . . . . . . . . . . . . . . . . . . . . . . . . . . . . . . . . . . . . . . . . . . . . . . . . . . . . . . . . . . . . . . . . . . . . . . (3,121) 40,664 (26,449)
Subtotal . . . . . . . . . . . . . . . . . . . . . . . . . . . . . . . . . . . . . . . . . . . . . . . . . . . . . . . . . . . . . . . . . . . 334,828 155,432 2,837,525Interest and dividends received . . . . . . . . . . . . . . . . . . . . . . . . . . . . . . . . . . . . . . . . . . . . . . . . . . . . 26,090 13,037 221,102Interest paid . . . . . . . . . . . . . . . . . . . . . . . . . . . . . . . . . . . . . . . . . . . . . . . . . . . . . . . . . . . . . . . . . . . . (23,863) (22,791) (202,229)Income taxes paid . . . . . . . . . . . . . . . . . . . . . . . . . . . . . . . . . . . . . . . . . . . . . . . . . . . . . . . . . . . . . . . (116,150) (111,559) (984,322)Early retirement incentive payments . . . . . . . . . . . . . . . . . . . . . . . . . . . . . . . . . . . . . . . . . . . . . . . . (1,143) (97) (9,686)Other, net . . . . . . . . . . . . . . . . . . . . . . . . . . . . . . . . . . . . . . . . . . . . . . . . . . . . . . . . . . . . . . . . . . . . . . (13,893) — (117,737)
Net cash provided by operating activities . . . . . . . . . . . . . . . . . . . . . . . . . . . . . . . . . . . . . . . . 205,867 34,021 1,744,636Investing activities(Increase) decrease in time deposits . . . . . . . . . . . . . . . . . . . . . . . . . . . . . . . . . . . . . . . . . . . . . . . . (10,015) 561 (84,873)Increase in short-term investments in securities and investments in other securities . . . . . . . . . . (10,346) (173) (87,678)Additions to property, plant and equipment . . . . . . . . . . . . . . . . . . . . . . . . . . . . . . . . . . . . . . . . . . (113,486) (97,916) (961,746)Proceeds from sales of property, plant and equipment . . . . . . . . . . . . . . . . . . . . . . . . . . . . . . . . . 23,105 19,876 195,805Proceeds from sales of shares of consolidated subsidiaries . . . . . . . . . . . . . . . . . . . . . . . . . . . . . . 1,187 4,112 10,059Proceeds from purchases of shares of consolidated subsidiaries due to change
in scope of consolidation . . . . . . . . . . . . . . . . . . . . . . . . . . . . . . . . . . . . . . . . . . . . . . . . . . . . . . . . — 641 —Increase in cost of exploration and production of oil and related assets . . . . . . . . . . . . . . . . . . . . (33,150) (45,734) (280,932)Decrease in long-term receivables . . . . . . . . . . . . . . . . . . . . . . . . . . . . . . . . . . . . . . . . . . . . . . . . . . 6,832 10,751 57,898Other . . . . . . . . . . . . . . . . . . . . . . . . . . . . . . . . . . . . . . . . . . . . . . . . . . . . . . . . . . . . . . . . . . . . . . . . . (7,613) (7,194) (64,517)
Net cash used in investing activities . . . . . . . . . . . . . . . . . . . . . . . . . . . . . . . . . . . . . . . . . . . . (143,487) (115,073) (1,215,992)Financing activitiesIncrease in short-term loans . . . . . . . . . . . . . . . . . . . . . . . . . . . . . . . . . . . . . . . . . . . . . . . . . . . . . . . 94,411 248,488 800,093Proceeds from long-term debt . . . . . . . . . . . . . . . . . . . . . . . . . . . . . . . . . . . . . . . . . . . . . . . . . . . . . 107,330 122,437 909,576Repayment of long-term debt . . . . . . . . . . . . . . . . . . . . . . . . . . . . . . . . . . . . . . . . . . . . . . . . . . . . . . (139,840) (185,791) (1,185,085)Expenditure for purchase of treasury stock . . . . . . . . . . . . . . . . . . . . . . . . . . . . . . . . . . . . . . . . . . . (691) (39,351) (5,856)Cash dividends paid . . . . . . . . . . . . . . . . . . . . . . . . . . . . . . . . . . . . . . . . . . . . . . . . . . . . . . . . . . . . . (21,645) (19,940) (183,432)Other . . . . . . . . . . . . . . . . . . . . . . . . . . . . . . . . . . . . . . . . . . . . . . . . . . . . . . . . . . . . . . . . . . . . . . . . . 4,843 127 41,042
Net cash provided by (used in) financing activities . . . . . . . . . . . . . . . . . . . . . . . . . . . . . . . . 44,408 125,969 376,339Effect of exchange rate changes on cash and cash equivalents . . . . . . . . . . . . . . . . . . . . . 308 9,660 2,610Increase in cash and cash equivalents . . . . . . . . . . . . . . . . . . . . . . . . . . . . . . . . . . . . . . . . . . . 107,096 54,577 907,593Cash and cash equivalents at beginning of year . . . . . . . . . . . . . . . . . . . . . . . . . . . . . . . . . . 214,476 140,478 1,817,593Increase in cash and cash equivalents resulting from inclusion ofconsolidated subsidiaries . . . . . . . . . . . . . . . . . . . . . . . . . . . . . . . . . . . . . . . . . . . . . . . . . . . . . 212 19,409 1,797
Increase in cash and cash equivalents resulting from merger in consolidation . . . . . . — 10 —Cash and cash equivalents at end of year . . . . . . . . . . . . . . . . . . . . . . . . . . . . . . . . . . . . . . . . ¥ 321,786 ¥ 214,476 $ 2,727,000See accompanying notes to consolidated financial statements.

Annual Report 2007 NIPPON OIL CORPORATION 67
Notes to Consolidated Financial StatementsNippon Oil Corporation and Consolidated SubsidiariesMarch 31, 2007
1 Significant Accounting Policies
(a) Basis of preparation
The Company and its domestic consolidated subsidiaries maintain their accounting records and prepare their financial statements in accordance with accounting
principles generally accepted in Japan, and its overseas consolidated subsidiaries maintain their books of account in conformity with those of their countries of
domicile. The accompanying consolidated financial statements have been compiled from the accounts prepared by the Company in accordance with the provi-
sions set forth in the Securities and Exchange Law of Japan and in conformity with accounting principles generally accepted in Japan, which are different in certain
respects as to the application and disclosure requirements of International Financial Reporting Standards.
In addition, the notes to the consolidated financial statements include information which is not required under accounting principles generally accepted in
Japan but is presented herein as additional information.
As permitted under the Securities and Exchange Law of Japan, amounts of less than one million yen have been omitted. As a result, the totals shown in the
accompanying consolidated financial statements (both in yen and in U.S. dollars) do not necessarily agree with the sums of the individual amounts.
Certain amounts in the prior year’s financial statements have been reclassified to conform to the current year’s presentation.
(b) Principles of consolidation and accounting for investments in unconsolidated subsidiaries and affiliates
The accompanying consolidated financial statements include the accounts of the Company and all its significant subsidiaries. Investments in certain unconsoli-
dated subsidiaries and significant affiliates are accounted for by the equity method. All significant intercompany balances and transactions have been eliminated
in consolidation.
The excess of cost over the underlying equity in net assets at the dates of acquisition of the major consolidated subsidiaries is amortized by the straight-line
method over 5 years.
Investments in unconsolidated subsidiaries and affiliates not accounted for by the equity method are stated at cost or less. Where there has been a permanent
decline in the value of the investments, the Company has written them down to reflect the impairment.
(c) Foreign currency translation
Monetary assets and liabilities denominated in foreign currencies included in the current and noncurrent foreign currency accounts of the Company, of its
domestic consolidated subsidiaries and of its affiliates accounted for by the equity method have been translated into yen at the rates of exchange in effect at the
year end. Translation differences are charged or credited to income.
The accounts of the overseas consolidated subsidiaries are translated into yen as follows: all assets, liabilities and retained earnings at the end of the year and
items in the consolidated statements of income including net income, at the rate of exchange in effect at the year end; capital stock, at historical rates; and cash
dividends paid, at the rate of exchange in effect when paid. Translation differences arising from the balance sheet items are included in shareholders’ equity, and
those arising from minority interests in consolidated subsidiaries are reflected as translation adjustments.
(d) Cash equivalents
The Company and its consolidated subsidiaries substantially consider all highly liquid investments with a maturity of three months or less when purchased to be
cash equivalents.
(e) Securities
The accounting standard applicable to securities requires that all securities be classified into three categories: trading, held-to-maturity securities or other. Held-to-
maturity securities have been stated at their amortized cost. Marketable securities classified as other securities have been stated at fair value with any changes in
unrealized holding gain or loss, net of the applicable income taxes, included directly in shareholders’ equity. Non-marketable securities classified as other securities
have been stated at cost. Cost of securities sold has been determined by the moving average method.
(f) Property, plant and equipment and depreciation
Property, plant and equipment is stated at cost.
Depreciation of property, plant and equipment is computed principally by the straight-line method for buildings, and by the declining-balance method for
other property, plant and equipment, over the estimated useful lives of the respective assets.
Significant renewals and improvements are capitalized at cost. Maintenance and repairs are charged to income.
FINAN
CIAL SECTION

NIPPON OIL CORPORATION Annual Report 200768
(g) Inventories
Inventories are stated mainly at cost determined principally by the average method.
(h) Accounting procedure for exploration and development investments
Expenditures relating to exploration and development under certain agreements are capitalized as assets and recovered in accordance with the terms of the
respective agreements.
(i) Leases
Noncancelable leases are accounted for primarily as operating leases (whether such leases are classified as operating or finance leases) except that leases which
stipulate the transfer of ownership of the leased assets to the lessee are accounted for as finance leases.
(j) Retirement benefits
Accrued retirement benefits are stated principally at the amount calculated based on the present value of the retirement benefit obligation and the fair value of the
pension plan assets, as adjusted for unrecognized actuarial gain or loss, and unrecognized prior service cost. Prior service cost is amortized as incurred by the
straight-line method, principally over 5 years. Actuarial gain or loss is amortized commencing in the subsequent period by the straight-line method, principally over
5 years.
(k) Income taxes
Deferred income taxes are determined based on the differences between the amounts determined for financial reporting purposes and the tax bases of the assets
and liabilities and are measured using the enacted tax rates and laws which will be in effect when the differences are expected to reverse.
(l) Reserve for inspection of oil tanks, machinery and equipment, and vessels
The Company and its domestic consolidated subsidiaries are required periodically to inspect their oil tanks, the machinery and equipment of their oil refineries,
and their vessels. A reserve for the inspection of oil tanks, machinery and equipment, and vessels is provided for the current portion of the estimated total cost for
such work.
(m) Accrued estimated cost for abandonment of wells
The accrued estimated cost of abandonment of wells is provided to cover the costs to be incurred upon the abandonment of wells at an estimated amount
allocated over a scheduled period based on consolidated subsidiaries’ plans for the abandonment of such wells.
(n) Accounting standard for presentation of net assets in the balance sheet
Effective the year ended March 31, 2007, the Company and its domestic consolidated subsidiaries adopted new accounting standards, “Accounting Standard for
Presentation of Net Assets in the Balance Sheet” (“Statement No. 5” issued by the Accounting Standards Board of Japan on December 9, 2005), and “the
Implementation Guidance for the Accounting Standard for Presentation of Net Assets in the Balance Sheet” (“the Financial Accounting Standard Implementation
Guidance No. 8” issued by the Accounting Standards Board of Japan on December 9, 2005), (collectively, the “New Accounting Standards”).
In addition, effective the year ended March 31, 2007, the Company and its domestic consolidated subsidiaries are required to prepare consolidated state-
ments of changes in net assets instead of consolidated statements of shareholders’ equity. In this connection, the previously reported consolidated balance sheet
as of March 31, 2006 has been restated to conform to the presentation and disclosure of the consolidated financial statements for the year ended March 31, 2007.
Total shareholders’ equity under the previous method of presentation at March 31, 2007, which comprised common stock, capital surplus, retained earnings,
unrealized gain on securities, net of deferred income taxes, and translation adjustments, amounted to ¥1,192,838 million ($10,108,797 thousand).
(o) Research and development costs
Research and development costs are charged to income when incurred.
(p) Derivatives
Derivatives are stated at fair value with any changes in unrealized gain or loss charged or credited to income, except for those which meet the criteria for deferral
hedge accounting under which unrealized gain or loss is deferred as an asset or a liability. Receivables and payables hedged by qualified forward foreign exchange
contracts and currency swaps are translated at the corresponding contract rates.

Annual Report 2007 NIPPON OIL CORPORATION 69
(q) Amounts per share
Basic net income per share for the years ended March 31, 2007 and 2006 has been computed based on the net income attributable to shareholders of common
stock and the weighted-average number of shares of common stock outstanding during the year.
2 U.S. Dollar Amounts
The translation of yen amounts into U.S. dollar amounts is included solely for convenience and has been made, as a matter of arithmetic computation only, at
¥118=U.S.$1.00, the approximate rate of exchange in effect on March 31, 2007. The translation should not be construed as a representation that yen have been,
could have been, or could in the future be, converted into U.S. dollars at that or any other rate.
3 Securities
a) Marketable securities classified as held-to-maturity securities at March 31, 2007 and 2006 were as follows:Thousands of
Millions of yen U.S. dollars
March 31, 2007 2006 2007
Carrying value . . . . . . . . . . . . . . . . . . . . . . . . . . . . . . . . . . . . . . . . . . . . . . . . . . . . . . . . . . . . . . . . . . . . . . . . . . . . . ¥64 ¥64 $542Aggregate market value . . . . . . . . . . . . . . . . . . . . . . . . . . . . . . . . . . . . . . . . . . . . . . . . . . . . . . . . . . . . . . . . . . . . . . 64 63 542
Net unrealized holding gain . . . . . . . . . . . . . . . . . . . . . . . . . . . . . . . . . . . . . . . . . . . . . . . . . . . . . . . . . . . . . . . . . . ¥ (0) ¥ (0) $ (0)
b) Marketable securities classified as other securities at March 31, 2007 and 2006 were as follows:Millions of yen Thousands of U.S. dollars
Net Netunrealized unrealized
Acquisition Carrying holding Acquisition Carrying holdingMarch 31, 2007 cost amount gain cost amount gain
Stocks . . . . . . . . . . . . . . . . . . . . . . . . . . . . . . . . . . . . . . . . . . . . . . . ¥124,539 ¥339,352 ¥214,812 $1,055,415 $2,875,864 $1,820,441Debt securities . . . . . . . . . . . . . . . . . . . . . . . . . . . . . . . . . . . . . . . . — — — — — —
¥124,539 ¥339,352 ¥214,812 $1,055,415 $2,875,864 $1,820,441
Millions of yen
Netunrealized
Acquisition Carrying holdingMarch 31, 2006 cost amount gain
Stocks . . . . . . . . . . . . . . . . . . . . . . . . . . . . . . . . . . . . . . . . . . . . . . . ¥54,548 ¥215,689 ¥161,141Debt securities . . . . . . . . . . . . . . . . . . . . . . . . . . . . . . . . . . . . . . . . 17 18 —
¥54,566 ¥215,707 ¥161,141
c) Sales of securities classified as other securities amounted to ¥497 million ($4,212 thousand) and ¥2,277 million, with a net aggregate gain of ¥338 million
($2,864 thousand) and ¥1,488 million for the years ended March 31, 2007 and 2006, respectively.
d) The redemption schedule at March 31, 2007 for securities with maturity dates is summarized as follows:Millions of Thousands of
March 31, 2007 yen U.S. dollars
Due in one year or less . . . . . . . . . . . . . . . . . . . . . . . . . . . . . . . . . . . . . . . . . . . . . . . . . . . . . . . . . . . . . . . . . . . . . . . . . . . . . . . . . . . ¥2,739 $23,212Due after one year through five years . . . . . . . . . . . . . . . . . . . . . . . . . . . . . . . . . . . . . . . . . . . . . . . . . . . . . . . . . . . . . . . . . . . . . . . — —Due after five years through ten years . . . . . . . . . . . . . . . . . . . . . . . . . . . . . . . . . . . . . . . . . . . . . . . . . . . . . . . . . . . . . . . . . . . . . . . 6,101 51,703Due after ten years . . . . . . . . . . . . . . . . . . . . . . . . . . . . . . . . . . . . . . . . . . . . . . . . . . . . . . . . . . . . . . . . . . . . . . . . . . . . . . . . . . . . . . — —
FINAN
CIAL SECTION

NIPPON OIL CORPORATION Annual Report 200770
4 Inventories
Inventories at March 31, 2007 and 2006 consisted of the following:Thousands of
Millions of yen U.S. dollars
March 31, 2007 2006 2007
Merchandise and finished products . . . . . . . . . . . . . . . . . . . . . . . . . . . . . . . . . . . . . . . . . . . . . . . . . . . . . . . . . . . . ¥184,901 ¥189,436 $1,566,958Crude oil . . . . . . . . . . . . . . . . . . . . . . . . . . . . . . . . . . . . . . . . . . . . . . . . . . . . . . . . . . . . . . . . . . . . . . . . . . . . . . . . . . 236,490 264,378 2,004,153Crude oil and others in transit . . . . . . . . . . . . . . . . . . . . . . . . . . . . . . . . . . . . . . . . . . . . . . . . . . . . . . . . . . . . . . . . 184,529 230,149 1,563,805Work in process . . . . . . . . . . . . . . . . . . . . . . . . . . . . . . . . . . . . . . . . . . . . . . . . . . . . . . . . . . . . . . . . . . . . . . . . . . . . 212,706 210,044 1,802,593Containers and supplies . . . . . . . . . . . . . . . . . . . . . . . . . . . . . . . . . . . . . . . . . . . . . . . . . . . . . . . . . . . . . . . . . . . . . 48,497 41,016 410,992Real estate for sale . . . . . . . . . . . . . . . . . . . . . . . . . . . . . . . . . . . . . . . . . . . . . . . . . . . . . . . . . . . . . . . . . . . . . . . . . . 22,701 16,020 192,381
¥889,827 ¥951,046 $7,540,907
5 Loss on Impairment of Fixed Assets
Recognition of impairment losses on fixed assets for the years ended March 31, 2007 and 2006 resulted primarily from a significant decrease in the market value
of the Company’s land as well as from the overall deterioration of its business environment.
Loss on impairment of fixed assets for the years ended March 31, 2007 and 2006 consisted of the following:Thousands of
Millions of yen U.S. dollars
March 31, 2007 2006 2007
Service stations Land . . . . . . . . . . . . . . . . . . . . . . . . . . . . . . . . . . . . . . . . . . . . . . . . . . . . . . . . . . . ¥ 159 ¥1,183 $ 1,347
Plants Other . . . . . . . . . . . . . . . . . . . . . . . . . . . . . . . . . . . . . . . . . . . . . . . . . . . . . . . . . . 303 424 2,568
Offices Land . . . . . . . . . . . . . . . . . . . . . . . . . . . . . . . . . . . . . . . . . . . . . . . . . . . . . . . . . . . 175 — 1,483Other . . . . . . . . . . . . . . . . . . . . . . . . . . . . . . . . . . . . . . . . . . . . . . . . . . . . . . . . . . 8 — 68
183 — 1,551Real estate for rent Land . . . . . . . . . . . . . . . . . . . . . . . . . . . . . . . . . . . . . . . . . . . . . . . . . . . . . . . . . . . 177 — 1,500
Idle properties and others Land . . . . . . . . . . . . . . . . . . . . . . . . . . . . . . . . . . . . . . . . . . . . . . . . . . . . . . . . . . . 3,808 1,867 32,271Buildings . . . . . . . . . . . . . . . . . . . . . . . . . . . . . . . . . . . . . . . . . . . . . . . . . . . . . . . 1,332 226 11,288Other . . . . . . . . . . . . . . . . . . . . . . . . . . . . . . . . . . . . . . . . . . . . . . . . . . . . . . . . . . 908 166 7,695
6,049 2,260 51,263
Total . . . . . . . . . . . . . . . . . . . . . . . . . . . . . . . . . . . . . . . . . . . . . . . . . . . . . . . . . . . . . . . . . . . . . . . . . . . . . . . . . . . . . ¥6,872 ¥3,868 $58,237
Other than the above, loss on impairment of ¥3,760 million ($31,864 thousand) is included in “restructuring cost for cogeneration business” on consolidated
statements of income for the year ended at March 31, 2007.
An impairment loss on service stations, offices and real estate for rent was recorded at the total of the amount by which the acquisition cost of each asset group
exceeded its future cash flows, discounted at 4.5%.
An impairment loss on plants, other businesses and certain idle properties and others was recorded at the total of the amount by which the acquisition cost of each
asset exceeded its estimated fair value. The estimated fair value of these assets, if material, was determined in accordance with real estate appraisal standards.

Annual Report 2007 NIPPON OIL CORPORATION 71
6 Short-Term Loans and Long-Term Debt
Short-term loans are principally unsecured and generally represent bank overdrafts, commercial paper and notes maturing within one year. The weighted-average
interest rates for the years ended March 31, 2007 and 2006 were approximately 0.6% and 0.4%, respectively.
Long-term debt at March 31, 2007 and 2006 is summarized as follows:Thousands of
Millions of yen U.S. dollars
March 31, 2007 2006 2007
Unsecured Eurobonds in U.S. dollars, due through February 2007,at interest rates ranging from 4.45% to 5.92% . . . . . . . . . . . . . . . . . . . . . . . . . . . . . . . . . . . . . . . . . . . . . . . . . . ¥ 2,739 ¥ 12,810 $ 23,212
Unsecured bonds in yen, due through June 2016, at interest rates ranging from 0.61% to 2.48% . . . . . . . . . 140,000 160,000 1,186,441Unsecured Eurobonds in yen, due through April 2013, at interest rates ranging from 0.30% to 1.62% . . . . . 7,796 24,368 66,068Loans from banks, life insurance companies and government agencies, due through March 2022,
at interest rates ranging from 0.65% to 6.00%:Secured . . . . . . . . . . . . . . . . . . . . . . . . . . . . . . . . . . . . . . . . . . . . . . . . . . . . . . . . . . . . . . . . . . . . . . . . . . . . . . . . 90,572 91,254 767,559Unsecured . . . . . . . . . . . . . . . . . . . . . . . . . . . . . . . . . . . . . . . . . . . . . . . . . . . . . . . . . . . . . . . . . . . . . . . . . . . . . . 464,420 448,151 3,935,763
705,529 736,584 5,979,059Less current portion . . . . . . . . . . . . . . . . . . . . . . . . . . . . . . . . . . . . . . . . . . . . . . . . . . . . . . . . . . . . . . . . . . . . . . . . . (92,047) (84,509) (780,059)
¥613,481 ¥652,075 $5,198,992
Assets pledged at March 31, 2007 and 2006 as collateral for long-term debt or other debt were as follows:Thousands of
Millions of yen U.S. dollars
March 31, 2007 2006 2007
Time deposits . . . . . . . . . . . . . . . . . . . . . . . . . . . . . . . . . . . . . . . . . . . . . . . . . . . . . . . . . . . . . . . . . . . . . . . . . . . . . . ¥ — ¥ 49 $ —Notes and accounts receivable . . . . . . . . . . . . . . . . . . . . . . . . . . . . . . . . . . . . . . . . . . . . . . . . . . . . . . . . . . . . . . . . 129 297 1,093Land . . . . . . . . . . . . . . . . . . . . . . . . . . . . . . . . . . . . . . . . . . . . . . . . . . . . . . . . . . . . . . . . . . . . . . . . . . . . . . . . . . . . . 217,317 217,821 1,841,669Other property, plant and equipment, net . . . . . . . . . . . . . . . . . . . . . . . . . . . . . . . . . . . . . . . . . . . . . . . . . . . . . . . 210,381 229,950 1,782,890Investments in other securities . . . . . . . . . . . . . . . . . . . . . . . . . . . . . . . . . . . . . . . . . . . . . . . . . . . . . . . . . . . . . . . . 1 73,416 8Long-term receivables . . . . . . . . . . . . . . . . . . . . . . . . . . . . . . . . . . . . . . . . . . . . . . . . . . . . . . . . . . . . . . . . . . . . . . . 2,106 2,624 17,847
The aggregate annual maturities of long-term debt subsequent to March 31, 2007 are summarized as follows:Thousands of
Year ending March 31, Millions of yen U.S. dollars
2008 . . . . . . . . . . . . . . . . . . . . . . . . . . . . . . . . . . . . . . . . . . . . . . . . . . . . . . . . . . . . . . . . . . . . . . . . . . . . . . . . . . . . . . . . . . . . . . . . . . ¥ 92,047 $ 780,0592009 . . . . . . . . . . . . . . . . . . . . . . . . . . . . . . . . . . . . . . . . . . . . . . . . . . . . . . . . . . . . . . . . . . . . . . . . . . . . . . . . . . . . . . . . . . . . . . . . . . 55,643 471,5512010 . . . . . . . . . . . . . . . . . . . . . . . . . . . . . . . . . . . . . . . . . . . . . . . . . . . . . . . . . . . . . . . . . . . . . . . . . . . . . . . . . . . . . . . . . . . . . . . . . . 12,896 109,2882011 . . . . . . . . . . . . . . . . . . . . . . . . . . . . . . . . . . . . . . . . . . . . . . . . . . . . . . . . . . . . . . . . . . . . . . . . . . . . . . . . . . . . . . . . . . . . . . . . . . 68,098 577,1022012 and thereafter . . . . . . . . . . . . . . . . . . . . . . . . . . . . . . . . . . . . . . . . . . . . . . . . . . . . . . . . . . . . . . . . . . . . . . . . . . . . . . . . . . . . . . 476,842 4,041,034
¥705,529 $5,979,059
FINAN
CIAL SECTION

NIPPON OIL CORPORATION Annual Report 200772
7 Retirement Benefits
The Company and its major consolidated subsidiaries have defined benefit pension plans for their employees who are covered by non-contributory plans which
fall under the Welfare Pension Fund Plan of Japan.
Accrued retirement benefits at March 31, 2007 and 2006 consisted of the following:Thousands of
Millions of yen U.S. dollars
March 31, 2007 2006 2007
Retirement benefit obligation . . . . . . . . . . . . . . . . . . . . . . . . . . . . . . . . . . . . . . . . . . . . . . . . . . . . . . . . . . . . . . . . . ¥(263,729) ¥(265,103) $(2,234,992)Plan assets at fair value . . . . . . . . . . . . . . . . . . . . . . . . . . . . . . . . . . . . . . . . . . . . . . . . . . . . . . . . . . . . . . . . . . . . . . 212,469 200,193 1,800,585
Unfunded retirement benefit obligation . . . . . . . . . . . . . . . . . . . . . . . . . . . . . . . . . . . . . . . . . . . . . . . . . . . . . . . . (51,260) (64,909) (434,407)Unrecognized actuarial (loss) gain . . . . . . . . . . . . . . . . . . . . . . . . . . . . . . . . . . . . . . . . . . . . . . . . . . . . . . . . . . . . . (25,330) (24,463) (214,661)Unrecognized prior service cost . . . . . . . . . . . . . . . . . . . . . . . . . . . . . . . . . . . . . . . . . . . . . . . . . . . . . . . . . . . . . . . (7,397) (9,476) (62,686)Prepaid pension cost . . . . . . . . . . . . . . . . . . . . . . . . . . . . . . . . . . . . . . . . . . . . . . . . . . . . . . . . . . . . . . . . . . . . . . . . (123) — (1,042)
Accrued retirement benefits . . . . . . . . . . . . . . . . . . . . . . . . . . . . . . . . . . . . . . . . . . . . . . . . . . . . . . . . . . . . . . . . . . ¥ (84,112) ¥ (98,849) $ (712,814)
Retirement benefit expenses for the years ended March 31, 2007 and 2006 are outlined as follows:Thousands of
Millions of yen U.S. dollars
March 31, 2007 2006 2007
Service cost . . . . . . . . . . . . . . . . . . . . . . . . . . . . . . . . . . . . . . . . . . . . . . . . . . . . . . . . . . . . . . . . . . . . . . . . . . . . . . . . ¥ 6,916 ¥ 7,746 $ 58,610Interest cost . . . . . . . . . . . . . . . . . . . . . . . . . . . . . . . . . . . . . . . . . . . . . . . . . . . . . . . . . . . . . . . . . . . . . . . . . . . . . . . 5,123 5,023 43,415Expected return on plan assets . . . . . . . . . . . . . . . . . . . . . . . . . . . . . . . . . . . . . . . . . . . . . . . . . . . . . . . . . . . . . . . . (3,850) (3,832) (32,627)Amortization of actuarial loss (gain) . . . . . . . . . . . . . . . . . . . . . . . . . . . . . . . . . . . . . . . . . . . . . . . . . . . . . . . . . . . . (1,930) 4,226 (16,356)Amortization of prior service cost . . . . . . . . . . . . . . . . . . . . . . . . . . . . . . . . . . . . . . . . . . . . . . . . . . . . . . . . . . . . . . (2,069) (2,049) (17,534)
¥ 4,189 ¥11,115 $ 35,500
The assumptions used in accounting for the above plans were as follows:As of March 31, 2007 2006
Discount rate . . . . . . . . . . . . . . . . . . . . . . . . . . . . . . . . . . . . . . . . . . . . . . . . . . . . . . . . . . . . . . . . . . . . . . . . . . . . . . . . . . . . . . . . . . . Mainly 2.0% Mainly 2.0%Expected rate of return on plan assets . . . . . . . . . . . . . . . . . . . . . . . . . . . . . . . . . . . . . . . . . . . . . . . . . . . . . . . . . . . . . . . . . . . . . . . Mainly 2.0% Mainly 2.0%
8 Shareholders’ Equity
The new Corporation Law of Japan (the “Law”), which superseded most of the provisions of the Commercial Code of Japan, went into effect on May 1, 2006. The
Law provides that an amount equal to 10% of the amount to be disbursed as distributions of capital surplus (other than the capital reserve) and retained earnings
(other than the legal reserve) be transferred to the capital reserve and the legal reserve, respectively, until the sum of the capital reserve and the legal reserve
equals 25% of the capital stock account. Such distributions can be made at any time by resolution of the shareholders, or by the Board of Directors if certain
conditions are met.

Annual Report 2007 NIPPON OIL CORPORATION 73
9 Income Taxes
Income taxes applicable to the Company and its domestic consolidated subsidiaries comprise corporation, enterprise and inhabitants’ taxes which, in the aggre-
gate, resulted in a statutory tax rate of approximately 41% for the year ended March 31, 2007.
An analysis of the difference between the statutory tax rate and the effective tax rate for the year ended March 31, 2007 was as follows:Year ended March 31, 2007
Statutory tax rate . . . . . . . . . . . . . . . . . . . . . . . . . . . . . . . . . . . . . . . . . . . . . . . . . . . . . . . . . . . . . . . . . . . . . . . . . . . . . . . . . . . . . . . . . . . . . . . . . . . . . . . . . . . . 40.7%Adjustments:
Non-deductible expenses . . . . . . . . . . . . . . . . . . . . . . . . . . . . . . . . . . . . . . . . . . . . . . . . . . . . . . . . . . . . . . . . . . . . . . . . . . . . . . . . . . . . . . . . . . . . . . . . . . . 1.0Non-taxable dividend income . . . . . . . . . . . . . . . . . . . . . . . . . . . . . . . . . . . . . . . . . . . . . . . . . . . . . . . . . . . . . . . . . . . . . . . . . . . . . . . . . . . . . . . . . . . . . . . (1.2)Different tax rates applied to income of consolidated subsidiaries . . . . . . . . . . . . . . . . . . . . . . . . . . . . . . . . . . . . . . . . . . . . . . . . . . . . . . . . . . . . . . . . . . 4.3Equity in earnings of unconsolidated subsidiaries and affiliates . . . . . . . . . . . . . . . . . . . . . . . . . . . . . . . . . . . . . . . . . . . . . . . . . . . . . . . . . . . . . . . . . . . . (0.7)Inhabitants’ per capita taxes . . . . . . . . . . . . . . . . . . . . . . . . . . . . . . . . . . . . . . . . . . . . . . . . . . . . . . . . . . . . . . . . . . . . . . . . . . . . . . . . . . . . . . . . . . . . . . . . . 0.3Adjustment to valuation allowance . . . . . . . . . . . . . . . . . . . . . . . . . . . . . . . . . . . . . . . . . . . . . . . . . . . . . . . . . . . . . . . . . . . . . . . . . . . . . . . . . . . . . . . . . . . 4.8Other . . . . . . . . . . . . . . . . . . . . . . . . . . . . . . . . . . . . . . . . . . . . . . . . . . . . . . . . . . . . . . . . . . . . . . . . . . . . . . . . . . . . . . . . . . . . . . . . . . . . . . . . . . . . . . . . . . . 2.7
Effective tax rate . . . . . . . . . . . . . . . . . . . . . . . . . . . . . . . . . . . . . . . . . . . . . . . . . . . . . . . . . . . . . . . . . . . . . . . . . . . . . . . . . . . . . . . . . . . . . . . . . . . . . . . . . . . . . 51.9%
A corresponding analysis for the year ended March 31, 2006 has been omitted due to the immaterial difference between the statutory and effective tax rates
for the year then ended.
The significant components of deferred tax assets and liabilities at March 31, 2007 and 2006 were as follows:Thousands of
Millions of yen U.S. dollars
March 31, 2007 2006 2007
Deferred tax assets:Property, plant and equipment . . . . . . . . . . . . . . . . . . . . . . . . . . . . . . . . . . . . . . . . . . . . . . . . . . . . . . . . . . . . . ¥ 15,971 ¥ 16,232 $ 135,347Accrued retirement benefits . . . . . . . . . . . . . . . . . . . . . . . . . . . . . . . . . . . . . . . . . . . . . . . . . . . . . . . . . . . . . . . . 34,563 39,977 292,907Depreciation . . . . . . . . . . . . . . . . . . . . . . . . . . . . . . . . . . . . . . . . . . . . . . . . . . . . . . . . . . . . . . . . . . . . . . . . . . . . 13,440 13,314 113,898Net operating loss carryforwards . . . . . . . . . . . . . . . . . . . . . . . . . . . . . . . . . . . . . . . . . . . . . . . . . . . . . . . . . . . . 19,937 14,875 168,958Loss on revaluation of securities . . . . . . . . . . . . . . . . . . . . . . . . . . . . . . . . . . . . . . . . . . . . . . . . . . . . . . . . . . . . 20,480 20,324 173,559Loss on impairment of assets . . . . . . . . . . . . . . . . . . . . . . . . . . . . . . . . . . . . . . . . . . . . . . . . . . . . . . . . . . . . . . . 54,372 52,802 460,780Other . . . . . . . . . . . . . . . . . . . . . . . . . . . . . . . . . . . . . . . . . . . . . . . . . . . . . . . . . . . . . . . . . . . . . . . . . . . . . . . . . . 95,892 74,851 812,644Valuation allowance . . . . . . . . . . . . . . . . . . . . . . . . . . . . . . . . . . . . . . . . . . . . . . . . . . . . . . . . . . . . . . . . . . . . . . (100,512) (91,647) (851,797)
Total deferred tax assets . . . . . . . . . . . . . . . . . . . . . . . . . . . . . . . . . . . . . . . . . . . . . . . . . . . . . . . . . . . . . . 154,145 140,730 1,306,314Deferred tax liabilities:
Fair value of subsidiaries on consolidation . . . . . . . . . . . . . . . . . . . . . . . . . . . . . . . . . . . . . . . . . . . . . . . . . . . . 70,610 70,303 598,390Reserves under Special Taxation Measures Law . . . . . . . . . . . . . . . . . . . . . . . . . . . . . . . . . . . . . . . . . . . . . . . . 39,504 39,421 334,780Net unrealized holding gain on securities . . . . . . . . . . . . . . . . . . . . . . . . . . . . . . . . . . . . . . . . . . . . . . . . . . . . . 85,545 87,146 724,958Other . . . . . . . . . . . . . . . . . . . . . . . . . . . . . . . . . . . . . . . . . . . . . . . . . . . . . . . . . . . . . . . . . . . . . . . . . . . . . . . . . . 69,579 61,082 589,653
Total deferred tax liabilities . . . . . . . . . . . . . . . . . . . . . . . . . . . . . . . . . . . . . . . . . . . . . . . . . . . . . . . . . . . . 265,240 257,954 2,247,797
Net deferred tax liabilities . . . . . . . . . . . . . . . . . . . . . . . . . . . . . . . . . . . . . . . . . . . . . . . . . . . . . . . . . . . . . . . . . . . . ¥(111,094) ¥(117,223) $ (941,475)
10 Excise Taxes
Excise taxes are levied on gasoline and diesel fuel when delivered to the customers and are included under net sales and cost of sales in the consolidated
statements of income. Excise taxes amounted to ¥1,008,477 million ($8,546,415 thousand) and ¥1,015,013 million for the years ended March 31, 2007 and 2006,
respectively, and represented approximately 15% and 17% of net sales for the respective years.
FINAN
CIAL SECTION

NIPPON OIL CORPORATION Annual Report 200774
11 Selling, General and Administrative Expenses
Selling, general and administrative expenses at March 31, 2007 and 2006 consisted of the following:Thousands of
Millions of yen U.S. dollars
March 31, 2007 2006 2007
Freight . . . . . . . . . . . . . . . . . . . . . . . . . . . . . . . . . . . . . . . . . . . . . . . . . . . . . . . . . . . . . . . . . . . . . . . . . . . . . . . . . . . . ¥107,329 ¥107,112 $ 909,568Personnel expenses . . . . . . . . . . . . . . . . . . . . . . . . . . . . . . . . . . . . . . . . . . . . . . . . . . . . . . . . . . . . . . . . . . . . . . . . . 69,291 72,011 587,212Retirement benefits . . . . . . . . . . . . . . . . . . . . . . . . . . . . . . . . . . . . . . . . . . . . . . . . . . . . . . . . . . . . . . . . . . . . . . . . . 1,376 5,544 11,661Repair and inspection costs . . . . . . . . . . . . . . . . . . . . . . . . . . . . . . . . . . . . . . . . . . . . . . . . . . . . . . . . . . . . . . . . . . . 11,774 10,205 99,780Rental expenses . . . . . . . . . . . . . . . . . . . . . . . . . . . . . . . . . . . . . . . . . . . . . . . . . . . . . . . . . . . . . . . . . . . . . . . . . . . . 14,914 15,899 126,390Depreciation and amortization . . . . . . . . . . . . . . . . . . . . . . . . . . . . . . . . . . . . . . . . . . . . . . . . . . . . . . . . . . . . . . . . 21,771 23,918 184,500Other . . . . . . . . . . . . . . . . . . . . . . . . . . . . . . . . . . . . . . . . . . . . . . . . . . . . . . . . . . . . . . . . . . . . . . . . . . . . . . . . . . . . 61,456 58,175 520,814
¥287,915 ¥292,866 $2,439,958
12 Research and Development Expenses
Research and development expenses of ¥12,632 million ($107,051 thousand) and ¥10,103 million were charged to income as incurred for the years ended March
31, 2007 and 2006, respectively.
13 Contingent Liabilities
(a) The Company and its consolidated subsidiaries had the following contingent liabilities at March 31, 2007 and 2006:Thousands of
Millions of yen U.S. dollars
March 31, 2007 2006 2007
As guarantors of indebtedness of:Unconsolidated subsidiaries and affiliates . . . . . . . . . . . . . . . . . . . . . . . . . . . . . . . . . . . . . . . . . . . . . . . . . . . . . ¥24,575 ¥16,730 $208,263Other . . . . . . . . . . . . . . . . . . . . . . . . . . . . . . . . . . . . . . . . . . . . . . . . . . . . . . . . . . . . . . . . . . . . . . . . . . . . . . . . . . 28,806 21,513 244,119
¥53,381 ¥38,243 $452,381
(b) Based on debt assumption agreements with financial institutions, the Company has transferred the debt repayment obligation for certain bonds to such
financial institutions. As of March 31, 2007, the Company had contingent obligations of ¥40,000 million ($338,983 thousand) in respect of these bonds.
14 Leases
Lessee
(a) Finance leases
The following pro forma amounts represent the acquisition costs, accumulated depreciation, accumulated loss on impairment and net book value of the leased
buildings and machinery and equipment at March 31, 2007 and 2006, which would have been reflected in the consolidated balance sheets if finance lease
accounting had been applied to the finance leases currently accounted for as operating leases:Thousands of
Millions of yen U.S. dollars
March 31, 2007 2006 2007
Acquisition costs . . . . . . . . . . . . . . . . . . . . . . . . . . . . . . . . . . . . . . . . . . . . . . . . . . . . . . . . . . . . . . . . . . . . . . . . . . . . . . ¥9,621 ¥9,572 $81,534Accumulated depreciation . . . . . . . . . . . . . . . . . . . . . . . . . . . . . . . . . . . . . . . . . . . . . . . . . . . . . . . . . . . . . . . . . . . . . . . 4,221 3,858 35,771Accumulated loss on impairment . . . . . . . . . . . . . . . . . . . . . . . . . . . . . . . . . . . . . . . . . . . . . . . . . . . . . . . . . . . . . . . . . 1,165 — 9,873
Net book value . . . . . . . . . . . . . . . . . . . . . . . . . . . . . . . . . . . . . . . . . . . . . . . . . . . . . . . . . . . . . . . . . . . . . . . . . . . . . . . . ¥4,234 ¥5,713 $35,881

Annual Report 2007 NIPPON OIL CORPORATION 75
The following amounts represent the lease payments relating to finance leases accounted for as operating leases, the pro forma depreciation expense of the
leased assets (calculated by the straight-line method over the lease terms), the pro forma interest portion of the lease payments (calculated by the interest
method) and loss on impairment at March 31, 2007 and 2006:Thousands of
Millions of yen U.S. dollars
March 31, 2007 2006 2007
Lease payments . . . . . . . . . . . . . . . . . . . . . . . . . . . . . . . . . . . . . . . . . . . . . . . . . . . . . . . . . . . . . . . . . . . . . . . . . . . . ¥1,848 ¥1,999 $15,661Depreciation . . . . . . . . . . . . . . . . . . . . . . . . . . . . . . . . . . . . . . . . . . . . . . . . . . . . . . . . . . . . . . . . . . . . . . . . . . . . . . . 1,683 1,818 14,263Interest expense . . . . . . . . . . . . . . . . . . . . . . . . . . . . . . . . . . . . . . . . . . . . . . . . . . . . . . . . . . . . . . . . . . . . . . . . . . . . 142 175 1,203Loss on impairment . . . . . . . . . . . . . . . . . . . . . . . . . . . . . . . . . . . . . . . . . . . . . . . . . . . . . . . . . . . . . . . . . . . . . . . . . 1,165 — 9,873
Future minimum lease payments (exclusive of the interest portion thereon) subsequent to March 31,2007 for finance leases accounted for as operating leases
are summarized as follows:Thousands of
Year ending March 31, Millions of yen U.S. dollars
2008 . . . . . . . . . . . . . . . . . . . . . . . . . . . . . . . . . . . . . . . . . . . . . . . . . . . . . . . . . . . . . . . . . . . . . . . . . . . . . . . . . . . . . . . . . . . . . . . . . . ¥1,538 $13,0342009 and thereafter . . . . . . . . . . . . . . . . . . . . . . . . . . . . . . . . . . . . . . . . . . . . . . . . . . . . . . . . . . . . . . . . . . . . . . . . . . . . . . . . . . . . . . 4,186 35,475
Total . . . . . . . . . . . . . . . . . . . . . . . . . . . . . . . . . . . . . . . . . . . . . . . . . . . . . . . . . . . . . . . . . . . . . . . . . . . . . . . . . . . . . . . . . . . . . ¥5,724 $48,508
(b) Operating leases
Future minimum lease payments subsequent to March 31, 2007 for noncancelable operating leases are summarized as follows:Thousands of
Year ending March 31, Millions of yen U.S. dollars
2008 . . . . . . . . . . . . . . . . . . . . . . . . . . . . . . . . . . . . . . . . . . . . . . . . . . . . . . . . . . . . . . . . . . . . . . . . . . . . . . . . . . . . . . . . . . . . . . . . . . ¥150 $1,2712009 and thereafter . . . . . . . . . . . . . . . . . . . . . . . . . . . . . . . . . . . . . . . . . . . . . . . . . . . . . . . . . . . . . . . . . . . . . . . . . . . . . . . . . . . . . . 345 2,924
Total . . . . . . . . . . . . . . . . . . . . . . . . . . . . . . . . . . . . . . . . . . . . . . . . . . . . . . . . . . . . . . . . . . . . . . . . . . . . . . . . . . . . . . . . . . . . . ¥496 $4,203
Lessor
(a) Finance leases
The following amounts represent the acquisition costs, accumulated depreciation and net book value of machinery and equipment leased out at March 31, 2007
and 2006:Thousands of
Millions of yen U.S. dollars
March 31, 2007 2006 2007
Acquisition costs . . . . . . . . . . . . . . . . . . . . . . . . . . . . . . . . . . . . . . . . . . . . . . . . . . . . . . . . . . . . . . . . . . . . . . . . . . . ¥17,924 ¥18,058 $151,898Accumulated depreciation . . . . . . . . . . . . . . . . . . . . . . . . . . . . . . . . . . . . . . . . . . . . . . . . . . . . . . . . . . . . . . . . . . . . 10,093 9,061 85,534
Net book value . . . . . . . . . . . . . . . . . . . . . . . . . . . . . . . . . . . . . . . . . . . . . . . . . . . . . . . . . . . . . . . . . . . . . . . . . . . . . ¥ 7,831 ¥ 8,996 $ 66,364
The following amounts represent lease revenues relating to finance leases accounted for as operating leases, the pro forma depreciation expense of the
leased assets and the pro forma interest income on lease revenues (calculated by the interest method) at March 31, 2007 and 2006:Thousands of
Millions of yen U.S. dollars
March 31, 2007 2006 2007
Lease revenues . . . . . . . . . . . . . . . . . . . . . . . . . . . . . . . . . . . . . . . . . . . . . . . . . . . . . . . . . . . . . . . . . . . . . . . . . . . . ¥4,002 ¥4,041 $33,915Depreciation . . . . . . . . . . . . . . . . . . . . . . . . . . . . . . . . . . . . . . . . . . . . . . . . . . . . . . . . . . . . . . . . . . . . . . . . . . . . . . . 3,611 3,639 30,602Interest income . . . . . . . . . . . . . . . . . . . . . . . . . . . . . . . . . . . . . . . . . . . . . . . . . . . . . . . . . . . . . . . . . . . . . . . . . . . . 361 440 3,059
FINAN
CIAL SECTION

NIPPON OIL CORPORATION Annual Report 200776
Future minimum lease revenues (exclusive of the interest portion thereon) subsequent to March 31, 2007 for finance leases accounted for as operating leases
are summarized as follows:Thousands of
Year ending March 31, Millions of yen U.S. dollars
2008 . . . . . . . . . . . . . . . . . . . . . . . . . . . . . . . . . . . . . . . . . . . . . . . . . . . . . . . . . . . . . . . . . . . . . . . . . . . . . . . . . . . . . . . . . . . . . . . . . . ¥3,453 $29,2632009 and thereafter . . . . . . . . . . . . . . . . . . . . . . . . . . . . . . . . . . . . . . . . . . . . . . . . . . . . . . . . . . . . . . . . . . . . . . . . . . . . . . . . . . . . . . 4,782 40,525
Total . . . . . . . . . . . . . . . . . . . . . . . . . . . . . . . . . . . . . . . . . . . . . . . . . . . . . . . . . . . . . . . . . . . . . . . . . . . . . . . . . . . . . . . . . . . . . ¥8,235 $69,788
(b) Operating leases
Future minimum lease revenues subsequent to March 31, 2007 for noncancelable operating leases are immaterial.
15 Derivatives
The Company and its consolidated subsidiaries utilize forward foreign exchange contracts, currency options, currency swaps, interest-rate swaps, interest-rate caps,
commodity swaps and commodity collars in order to manage the risk arising from adverse fluctuation in foreign currency exchange rates, interest rates and
commodity prices.
The notional amounts, fair value and unrealized gain or loss on open derivatives positions at March 31, 2007 and 2006 are summarized as follows:Millions of yen Thousands of U.S. dollars
Notional Fair Unrealized Notional Fair Unrealized2007 amount value gain (loss) amount value gain (loss)
Currency:Forward foreign exchange contracts . . . . . . . . . . . . . . . . . . . . ¥17,375 ¥17,329 ¥ (41) $147,246 $146,856 $ (347)
Interest-rate contracts:Swaps . . . . . . . . . . . . . . . . . . . . . . . . . . . . . . . . . . . . . . . . . . . . . ¥ 2,800 ¥ 7 ¥ 7 $ 23,729 $ 59 $ 59
Commodity swaps . . . . . . . . . . . . . . . . . . . . . . . . . . . . . . . . . . . . . ¥11,067 ¥11,712 ¥11,712 $ 93,788 $ 99,254 $99,254
Commodity options:Collars . . . . . . . . . . . . . . . . . . . . . . . . . . . . . . . . . . . . . . . . . . . . ¥11,303 ¥ 709 ¥ 709 $ 95,788 $ 6,008 $ 6,008
Millions of yen
Notional Fair Unrealized2006 amount value gain (loss)
Currency:Forward foreign exchange contracts . . . . . . . . . . . . . . . . . . . . ¥62,889 ¥63,045 ¥ 111
Interest-rate contracts:Swaps . . . . . . . . . . . . . . . . . . . . . . . . . . . . . . . . . . . . . . . . . . . . . ¥ 5,161 ¥ 161 ¥ 161
Commodity swaps . . . . . . . . . . . . . . . . . . . . . . . . . . . . . . . . . . . . . ¥ 7,202 ¥ (1,592) ¥(1,592)
Commodity options:Collars . . . . . . . . . . . . . . . . . . . . . . . . . . . . . . . . . . . . . . . . . . . . ¥28,349 ¥ (5,527) ¥(5,527)
Note: The above information is presented exclusive of derivatives utilized in hedging transactions.
16 Segment Information
The business of the Company and its consolidated subsidiaries is divided into the following four categories: Refining and Marketing, Oil and Natural Gas E&P*,
Construction, and Other. The Refining and Marketing segment comprises gasoline, naphtha, kerosene, diesel fuel, heavy fuels, petrochemical products (paraxylene,
benzene), plastics and others; the Oil and Natural Gas E&P segment comprises exploration for, and production of, oil and natural gas; the Construction segment
comprises paving, civil engineering and construction; and the Other segment comprises leasing, finance, insurance, data processing and other businesses.
*Exploration and Production

Annual Report 2007 NIPPON OIL CORPORATION 77
The business and geographical segment information of the Company and its consolidated subsidiaries for the years ended March 31, 2007 and 2006 is
summarized as follows:
Business segmentsMillions of yen
Refining Oil andand Natural
Year ended March 31, 2007 Marketing Gas E&P Construction Other Total Eliminations Consolidated
Sales to third parties . . . . . . . . . . . . . . . . . . . . . . . . . . ¥5,954,390 ¥203,516 ¥407,893 ¥ 58,456 ¥6,624,256 ¥ — ¥6,624,256Intergroup sales and transfers . . . . . . . . . . . . . . . . . . . 9,259 — 1,371 17,369 28,000 (28,000) —
Total sales . . . . . . . . . . . . . . . . . . . . . . . . . . . . . . . . . . . 5,963,649 203,516 409,265 75,826 6,652,257 (28,000) 6,624,256Operating expenses . . . . . . . . . . . . . . . . . . . . . . . . . . . 5,934,308 89,704 399,181 71,762 6,494,956 (30,384) 6,464,571
Operating income . . . . . . . . . . . . . . . . . . . . . . . . . . . . ¥ 29,341 ¥113,811 ¥ 10,083 ¥ 4,064 ¥ 157,300 ¥2,384 ¥ 159,684
Assets . . . . . . . . . . . . . . . . . . . . . . . . . . . . . . . . . . . . . . ¥3,542,084 ¥441,442 ¥428,095 ¥116,197 ¥4,527,820 ¥(142,287) ¥4,385,533
Depreciation and amortization . . . . . . . . . . . . . . . . . . ¥ 81,694 ¥ 39,625 ¥ 4,861 ¥ 5,758 ¥ 131,939 ¥ (67) ¥ 131,872
Loss on impairment of fixed assets . . . . . . . . . . . . . . ¥ 5,943 ¥ 430 ¥ 496 ¥ 2 ¥ 6,872 ¥ — ¥ 6,872
Capital expenditures . . . . . . . . . . . . . . . . . . . . . . . . . . ¥ 107,438 ¥ 43,246 ¥ 8,496 ¥ 6,036 ¥ 165,219 ¥ — ¥ 165,219
Millions of yen
Refining Oil andand Natural
Year ended March 31, 2006 Marketing Gas E&P Construction Other Total Eliminations Consolidated
Sales to third parties . . . . . . . . . . . . . . . . . . . . . . . . . . ¥5,482,648 ¥180,503 ¥374,482 ¥ 80,353 ¥6,117,988 ¥ — ¥6,117,988Intergroup sales and transfers . . . . . . . . . . . . . . . . . . . 9,285 — 1,285 15,285 25,856 (25,856) —
Total sales . . . . . . . . . . . . . . . . . . . . . . . . . . . . . . . . . . . 5,491,933 180,503 375,768 95,638 6,143,844 (25,856) 6,117,988Operating expenses . . . . . . . . . . . . . . . . . . . . . . . . . . . 5,294,753 88,412 368,607 89,785 5,841,559 (27,501) 5,814,058
Operating income . . . . . . . . . . . . . . . . . . . . . . . . . . . . ¥ 197,180 ¥ 92,090 ¥ 7,160 ¥ 5,853 ¥ 302,285 ¥ 1,645 ¥ 303,930
Assets . . . . . . . . . . . . . . . . . . . . . . . . . . . . . . . . . . . . . . ¥3,412,601 ¥404,078 ¥391,319 ¥135,765 ¥4,343,765 ¥(111,950) ¥4,231,814
Depreciation and amortization . . . . . . . . . . . . . . . . . . ¥ 85,026 ¥ 38,946 ¥ 4,792 ¥ 6,374 ¥ 135,139 ¥ (5) ¥ 135,133
Loss on impairment of fixed assets . . . . . . . . . . . . . . ¥ 3,834 ¥ — ¥ 34 ¥ — ¥ 3,868 ¥ — ¥ 3,868
Capital expenditures . . . . . . . . . . . . . . . . . . . . . . . . . . ¥ 84,892 ¥ 63,903 ¥ 4,628 ¥ 4,985 ¥ 158,411 ¥ — ¥ 158,411
Thousands of U.S. dollars
Oil andRefining and Natural
Year ended March 31, 2007 Marketing Gas E&P Construction Other Total Eliminations Consolidated
Sales to third parties . . . . . . . . . . . . . . . . . . . . . . . . . . $50,460,932 $1,724,712 $3,456,720 $495,390 $56,137,763 $ — $56,137,763Intergroup sales and transfers . . . . . . . . . . . . . . . . . . . 78,466 — 11,619 147,195 237,288 (237,288) —
Total sales . . . . . . . . . . . . . . . . . . . . . . . . . . . . . . . . . . . 50,539,398 1,724,712 3,468,347 642,593 56,375,059 (237,288) 56,137,763Operating expenses . . . . . . . . . . . . . . . . . . . . . . . . . . . 50,290,746 760,203 3,382,890 608,153 55,042,000 (257,492) 54,784,500
Operating income . . . . . . . . . . . . . . . . . . . . . . . . . . . . $ 248,653 $ 964,500 $ 85,449 $ 34,441 $ 1,333,051 $ 20,203 $ 1,353,254
Assets . . . . . . . . . . . . . . . . . . . . . . . . . . . . . . . . . . . . . . $30,017,661 $3,741,034 $3,627,924 $984,720 $38,371,356 $(1,205,822) $37,165,534
Depreciation and amortization . . . . . . . . . . . . . . . . . . $ 692,322 $ 335,805 $ 41,195 $ 48,797 $ 1,118,127 $ (568) $ 1,117,559
Loss on impairment of fixed assets . . . . . . . . . . . . . . $ 50,364 $ 3,644 $ 4,203 $ 17 $ 58,237 $ — $ 58,237
Capital expenditures . . . . . . . . . . . . . . . . . . . . . . . . . . $ 910,492 $ 366,492 $ 72,000 $ 51,153 $ 1,400,161 $ — $ 1,400,161
FINAN
CIAL SECTION

NIPPON OIL CORPORATION Annual Report 200778
Geographical segmentsMillions of yen
Asia and NorthYear ended March 31, 2007 Japan Oceania America Europe Total Eliminations Consolidated
Sales to third parties . . . . . . . . . . . . . . . . . . . . . ¥ 6,338,227 ¥ 196,709 ¥ 53,497 ¥ 35,821 ¥ 6,624,256 ¥ — ¥ 6,624,256Intergroup sales and transfers . . . . . . . . . . . . . . 53,830 900,513 286,483 1,138,583 2,379,411 (2,379,411) —
Total sales . . . . . . . . . . . . . . . . . . . . . . . . . . . . . . 6,392,057 1,097,223 339,981 1,174,405 9,003,668 (2,379,411) 6,624,256Operating expenses . . . . . . . . . . . . . . . . . . . . . . 6,348,195 1,003,789 339,490 1,152,748 8,844,223 (2,379,651) 6,464,571
Operating income . . . . . . . . . . . . . . . . . . . . . . . ¥ 43,862 ¥ 93,433 ¥ 491 ¥ 21,657 ¥ 159,444 ¥ 240 ¥ 159,684
Total assets . . . . . . . . . . . . . . . . . . . . . . . . . . . . . ¥ 4,018,433 ¥ 283,994 ¥ 160,557 ¥ 135,920 ¥ 4,598,906 ¥ (213,373) ¥ 4,385,533
Millions of yen
Asia and NorthYear ended March 31, 2006 Japan Oceania America Europe Total Eliminations Consolidated
Sales to third parties . . . . . . . . . . . . . . . . . . . . . ¥ 5,828,966 ¥ 206,108 ¥ 49,037 ¥ 33,876 ¥ 6,117,988 ¥ — ¥ 6,117,988Intergroup sales and transfers . . . . . . . . . . . . . . 63,146 810,379 268,824 1,077,332 2,219,683 (2,219,683) —
Total sales . . . . . . . . . . . . . . . . . . . . . . . . . . . . . . 5,892,113 1,016,487 317,861 1,111,209 8,337,671 (2,219,683) 6,117,988Operating expenses . . . . . . . . . . . . . . . . . . . . . . 5,684,900 946,112 309,329 1,093,595 8,033,937 (2,219,879) 5,814,058
Operating income . . . . . . . . . . . . . . . . . . . . . . . ¥ 207,212 ¥ 70,375 ¥ 8,532 ¥ 17,613 ¥ 303,737 ¥ 196 ¥ 303,930
Total assets . . . . . . . . . . . . . . . . . . . . . . . . . . . . . ¥ 3,832,876 ¥ 313,095 ¥ 198,036 ¥ 243,490 ¥ 4,587,498 ¥ (355,683) ¥ 4,231,814
Thousands of U.S. dollars
Asia and NorthYear ended March 31, 2007 Japan Oceania America Europe Total Eliminations Consolidated
Sales to third parties . . . . . . . . . . . . . . . . . . . . . $53,713,788 $1,667,025 $ 453,364 $ 303,568 $56,137,763 $ — $56,137,763Intergroup sales and transfers . . . . . . . . . . . . . . 456,186 7,631,466 2,427,822 9,649,008 20,164,500 (20,164,500) —
Total sales . . . . . . . . . . . . . . . . . . . . . . . . . . . . . . 54,169,975 9,298,500 2,881,195 9,952,585 76,302,271 (20,164,500) 56,137,763Operating expenses . . . . . . . . . . . . . . . . . . . . . . 53,798,263 8,506,686 2,877,034 9,769,051 74,951,042 (20,166,534) 54,784,500
Operating income . . . . . . . . . . . . . . . . . . . . . . . $ 371,712 $ 791,805 $ 4,161 $ 183,534 $ 1,351,220 $ 2,034 $ 1,353,254
Total assets . . . . . . . . . . . . . . . . . . . . . . . . . . . . . $34,054,517 $2,406,729 $1,360,653 $1,151,864 $38,973,780 $ (1,808,246) $37,165,534
17 Subsequent Events
The following appropriations of retained earnings, which have not been reflected in the accompanying consolidated financial statements for the year ended March
31, 2007, were approved at a meeting of the shareholders of the Company held on June 28, 2007:Millions of Thousands of
yen U.S. dollars
Year-end cash dividends (¥6=$0.05 per share) . . . . . . . . . . . . . . . . . . . . . . . . . . . . . . . . . . . . . . . . . . . . . . . . . . . . . . . . . . . . . . . . . . ¥8,783 $74,432

Annual Report 2007 NIPPON OIL CORPORATION 79
Report of Independent Auditors
The Board of Directors
Nippon Oil Corporation
We have audited the accompanying consolidated balance sheets of Nippon Oil Corporation and consolidated subsidiaries as of March 31, 2007 and 2006, and the
related consolidated statements of income, shareholders’ equity, and cash flows for the years then ended, all expressed in yen. These financial statements are the
responsibility of the Company's management. Our responsibility is to express an opinion on these financial statements based on our audits.
We conducted our audits in accordance with auditing standards generally accepted in Japan. Those standards require that we plan and perform the audit to obtain
reasonable assurance about whether the financial statements are free of material misstatement. An audit includes examining, on a test basis, evidence supporting
the amounts and disclosures in the financial statements. An audit also includes assessing the accounting principles used and significant estimates made by
management, as well as evaluating the overall financial statement presentation. We believe that our audits provide a reasonable basis for our opinion.
In our opinion, the financial statements referred to above present fairly, in all material respects, the consolidated financial position of Nippon Oil Corporation and
consolidated subsidiaries at March 31, 2007 and 2006, and the consolidated results of their operations and their cash flows for the years then ended in conformity
with accounting principles generally accepted in Japan.
The U.S. dollar amounts in the accompanying consolidated financial statements with respect to the year ended March 31, 2007 are presented solely for
convenience. Our audit also included the translation of yen amounts into U.S. dollar amounts and, in our opinion, such translation has been made on the
basis described in Note 2.
June 28, 2007
FINAN
CIAL SECTION

NIPPON OIL CORPORATION Annual Report 200780
Principal Nippon Oil Group Companies(As of July 1, 2007)
OIL REFINING AND MARKETINGNippon Petroleum Refining Company, LimitedCapital: ¥5,000 million (100%)Business: Refining and processing
of petroleum products andpetrochemical products
Nippon Petrochemicals Company, LimitedCapital: ¥5,000 million (100%)Business: Manufacture, processing, and
sale of petrochemical products
Wakayama Petroleum Refining Co., Ltd.Capital: ¥4,420 million (99.0%)Business: Manufacture of lubricants
Nihonkai Oil Co., Ltd.Capital: ¥4,000 million (66%)Business: Refining and processing
of petroleum products
ENEOS Frontier Company, LimitedCapital: ¥495 million (100%)Business: Sale of petroleum products
Nisseki Plasto Company, LimitedCapital: ¥200 million (100%)Business: Manufacture and sale of processed synthetic
resin products including nonwoven materials
Nippon Oil Europe LimitedCapital: $6 million (100%)Business: Purchase, sale, import, and export
of crude oil and petroleum products
Nippon Oil (U.S.A.) LimitedCapital: $3 million (100%)Business: Purchase, sale, import, and export
of crude oil and petroleum products
Nippon Oil Lubricants (America) LLCCapital: $23 million (100%)Business: Manufacture of lubricants
Nisseki Chemical Texas Inc.Capital: $30 million (100%)Business: Manufacture of ENB
Atlanta Nisseki CLAF, Inc.Capital: $8.9 million (100%)Business: Manufacture and sale of nonwoven materials
Nippon Oil (Guangzhou) Lubricants CorporationCapital: $17 million (90%)Business: Manufacture of lubricants
Nippon Oil LC Film (Suzhou) CorporationCapital: $25 million (100%)Business: Manufacture of Liquid Crystal Films
Nippon Oil (Asia) Pte. Ltd.Capital: S$300,000 (100%)Business: Purchase, sale, import, and export
of crude oil and petroleum products
OIL STORAGE AND TRANSPORTNippon Oil Staging Terminal Company, LimitedCapital: ¥6,000 million (100%)*1
Business: Operation of petroleum storageand terminal facilities
Nippon Oil Tanker CorporationCapital: ¥4,000 million (100%)*2
Business: Ocean transport of crude oiland petroleum products
Okinawa CTS CorporationCapital: ¥495 million (65%)Business: Crude oil stockpiling
EXPLORATION AND PRODUCTIONNippon Oil Exploration LimitedCapital: ¥9,815 million (100%)Business: Exploration and production
of oil and natural gas
Japan Vietnam Petroleum Company, LimitedCapital: ¥22,530 million (97.1%)*3
Business: Exploration and productionof oil and natural gas
Nippon Oil Exploration (Sarawak) LimitedCapital: ¥14,880 million (76.5%)*3
Business: Exploration and productionof natural gas
CONSTRUCTION AND ENGINEERINGNIPPO CORPORATIONCapital: ¥15,325 million (57.2%)Business: Road paving, civil engineering,
and construction
OTHERNippon Oil Real Estate Company, LimitedCapital: ¥500 million (100%)Business: Sale, purchase, leasing, and
management of real estate
Nippon Oil Trading CorporationCapital: ¥330 million (100%)Business: Planning of marketing and promotional
campaigns for service stations, developmentand marketing of products forsuch campaigns, travel agency business,and operation of sports facilities
Nippon Oil Information Technology CorporationCapital: ¥300 million (51%)Business: Commissioned development and operation
of computer and communications system
Nippon Oil (Australia) Pty. LimitedCapital: A$77 million (100%)Business: Purchase, sale, import, and export
of coal and LNG
Nippon Oil Business Services Co., Ltd.Capital: ¥50 million (100%)Business: Provision of accounting, payroll and
welfare services for Nippon Oil Group
Nippon Oil Research Institute Co., Ltd.Capital: ¥30 million (100%)Business: Research and consulting concerning
petroleum and petrochemical products
*1 Includes the shares owned by Nippon PetroleumRefining Company, Limited (50.0%)
*2 Includes the shares owned by Nippon PetroleumRefining Company, Limited (96.0%)
*3 The shares owned by Nippon Oil Exploration LimitedNote: Figures in parentheses indicate percentage of
equity ownership.

Annual Report 2007 NIPPON OIL CORPORATION 81
Overseas Bases(As of July 1, 2007)
Abu Dhabi OfficeAl Masaood Tower, Suite No. 503 (5th Floor),Sheikh Hamdan Street, P.O. Box 43212, Abu Dhabi,United Arab EmiratesPhone: 2631-4991Fax: 2631-0151
Jakarta OfficeMidPlaza 2, 22nd Floor, Jl Jend. Sudirman Kav. 10-11,Jakarta 10220, IndonesiaPhone: (21) 573-1234Fax: (21) 574-2275
Beijing OfficeRoom 1918, China World Tower 1,China World Trade Center No. 1,Jian Guo Men Wai Avenue, Beijing 100004, P.R. ChinaPhone: (10) 5866-9700Fax: (10) 5866-9704
Nippon Oil Exploration LimitedTripoli OfficeYousaf Ben Tashifian Street Hai Al Andalus, Tripoli,Great Socialist People’s Libyan Arab JamahiriyaPhone: (21) 335-1294Fax: (21) 335-1296
Nippon Oil Exploration U.S.A. Limited5847 San Felipe, Suite 2800,Houston, Texas 77057, U.S.A.Phone: (713) 260-7400Fax: (713) 978-7800
Japan Vietnam Petroleum Company, LimitedVietnam OfficePetro Vietnam Towers 7th Floor, No. 8,Hoang Dieu St., Vung Tau, S.R. VietnamPhone: (64) 856937Fax: (64) 856943
Nippon Oil Exploration (Malaysia), LimitedMiri OfficeLot 1168, 3rd Floor, Wisma Interhill Building,Miri Waterfront Commercial Center,98008 Miri, Sarawak, MalaysiaPhone: (85) 444111Fax: (85) 419036
Kuala Lumpur OfficeLevel 10, Tower 2,MNI Twins, 11, Jalan Pinang,50450 Kuala Lumpur, MalaysiaPhone: (3) 2168-3838Fax: (3) 2078-7680
Nippon Oil Exploration andProduction U.K. Limited4th Floor, 1 Finsbury Square, London EC2A 1AE, U.K.Phone: (20) 7309-7650Fax: (20) 7309-7676
Nippon Oil (U.S.A.) LimitedChicago Headquarters300 Park Blvd., #105, Itasca, Illinois 60143, U.S.A.Phone: (630) 875-9701Fax: (630) 875-9702www.eneos.us
Houston Branch Office5847 San Felipe, Suite 2850,Houston, Texas 77057, U.S.A.Phone: (713) 781-1300Fax: (713) 781-1329
Los Angeles Branch Office3625 Del Amo Boulevard, Suite 385,Torrance, CA 90503, U.S.A.Phone: (310) 214-2050Fax: (310) 214-2090
Nippon Oil Lubricants (America) LLC100 Nippon Drive, Childersburg, AL 35044 U.S.A.Phone: (256) 378-0131Fax: (256) 378-0169
Nippon Oil Europe Limited2nd Floor, New Liverpool House,15 Eldon Street, London EC2M 7LD, U.K.Phone: (20) 7309-6960Fax: (20) 7309-6969www.eneos.eu
Nippon Oil (Asia) Pte. Ltd.6 Battery Road, #29-02, Singapore 049909Phone: 6223-6732Fax: 6224-8921
Nippon Oil (Australia) Pty. LimitedLevel 32, Chifley Tower, 2 Chifley Square,Sydney, N.S.W. 2000, AustraliaPhone: (2) 9221-3366Fax: (2) 9221-9462
Taiwan Nisseki Co., Ltd.Siwei Street 6 24F A1, Linya Area,Kaohsiung City, TaiwanPhone: (7) 535-7458Fax: (7) 535-7819
Nippon Oil (Shanghai) CorporationShanghai Office27F, HSBC Tower, 1000 Lu-jia-zui,Ring Road, Pudong New Area,Shanghai 200120, P.R. ChinaPhone: (21) 6841-2008Fax: (21) 6841-2010
Guangzhou OfficeRoom 2312, Dongshan Plaza, No. 69 Xian LieRoad (C), Guangzhou 510095, P.R. ChinaPhone: (20) 8732-4035/4036Fax: (20) 8732-4050
Tianjin Nisseki Lubricants &Grease Company, LimitedHangu, Tianjin 300480, P.R. ChinaPhone: (22) 6716-1115/1116Fax: (22) 6716-1119
Nippon Oil (Guangzhou) Lubricants Corporation38 Yue Hai Road, Xiao Hu Cun,Huang Ge Zheng, Nan Sha Qu, Guangzhou,Guangdong, 511455, P.R. ChinaPhone: (20) 3497-3928Fax: (20) 3497-3925
Nippon Oil LC Film (Suzhou) Corporation555 Jin Feng Road, Suzhou,Jiangsu 215129, P.R. ChinaPhone: (512) 6701-5588Fax: (512) 6701-5589
Nippon Oil (Thailand) Ltd.Q. House Ploenjit (14A),598 Ploenchit Rd., Lumpini,Pathumwan, Bangkok 10300, ThailandPhone: 2627-3971~6Fax: 2627-3980
Nippon Oil Malaysia Sdn. Bhd.G17, Jusco Metro Prima, 1 Jalan Metro Prima,52100 Kepong, Kuala Lumpur, MalaysiaPhone: (3) 6250-8853Fax: (3) 6250-8851
Nisseki Chemical Texas Inc.10500 Bay Area Blvd.,Pasadena, Texas 77507, U.S.A.Phone: (713) 754-1000Fax: (713) 754-1001
Atlanta Nisseki CLAF, Inc., Head Office600 Town Park Lane Suite 075, Kennesaw,GA 30144, U.S.A.Phone: (770) 859-9885Fax: (770) 859-0515
European Office4 Avenue Jean Giono, F-13090 Aix-en-Provence,FrancePhone: (442) 277-624Fax: (442) 275-472
CORPO
RATE INFO
RMATIO
N

NIPPON OIL CORPORATION Annual Report 200782
Organization Chart(As of July 1, 2007)
Departments marked* deal with both Nippon Oil Corporation’s business and Nippon Petroleum Refining Co., Limited’s.
Executive Committee
Secretariat
Corporate Social Responsibility Dept.
Corporate Planning & Management Dept.
Internal Control Project Office
Comptrollers Dept.
Investor Relations Dept.
Human Resources Dept.
Public Relations Dept.
Information Systems Dept.
General Administration Dept.
Purchasing Dept.
Environment & Safety Dept.*
Quality Assurance Dept.*
Technical Service Dept.*
Engineering Dept.*
Petroleum Trading & Shipping Dept.
Overseas Business Dept.
Supply & Manufacturing Dept.
Distribution Dept.
Marketing Planning Dept.
Retail Marketing Dept.
Home Energy Dept.
Lubricants & Specialties Business Coordination Dept.
Lubricants & Specialties Sales Dept.
Energy Solution Planning & Coordination Dept.
Energy Solution Dept. I
Energy Solution Dept. II
Energy Solution Dept. III
Chemicals Planning & Coordination Dept.
Olefins Dept.
Aromatics Dept.
Specialty & Performance Chemicals Dept.
Fuel Cell Business Dept.
Merchandise Business Dept.
Research & Development Planning Dept.
Research & Development Dept.
Central Technical Research Laboratory
Corporate ManagementDivision I
Corporate ManagementDivision II
Environment, Safety & QualityManagement Division
Lubricants & SpecialtiesBusiness Division
Fuel Cell & MerchandiseBusiness Division
Research & DevelopmentDivision
Manufacturing Technology& Engineering Division
Overseas Business Division
Supply Division
Fuel Retail Sales Division
Energy Solution Division
Chemicals Division
Chairman ofthe Board
GeneralMeeting of
Shareholders
Board ofCorporateAuditors
Secretariat ofCorporateAuditors
DirectorsAppointed by the President
President
Executive VicePresidents
Senior VicePresidents
Board ofDirectors

Investor Information(As of July 1, 2007)
Date of EstablishmentMay 10, 1888
Paid-in Capital¥139,437 million
Head Office3-12, Nishi Shimbashi 1-chome,Minato-ku, Tokyo 105-8412, JapanPhone: +81-3-3502-1184 (IR Department)Fax: +81-3-3502-9862Website: http://www.eneos.co.jp
Securities TradedCommon stock listed on the Tokyo, Osaka,Nagoya, Fukuoka, and Sapporo exchanges
Transfer AgentThe Chuo Mitsui Trust and Banking Co., Ltd.
Other PublicationThis Nippon Oil Corporation publication can be obtained from our website.
CSR Report 2007http://www.eneos.co.jp/english/index.htmlNippon Oil Group activities for CSR
02FY 06FY05FY04FY03FY
200,000
150,000
100,000
50,000
0
Trading volume (Thousands of shares/months)
1,200
900
600
300
Trading volume (Thousands of shares/months)
Stock Price Range and Trading Volume
Major Shareholders (as of March 31, 2007)
Number of shares held(thousands of shares) (%)
Japan Trustee Services Bank, Ltd. (Trust Unit) 74,061 5.1The Master Trust Bank of Japan, Ltd. (Trust Unit) 72,171 4.9Mizuho Corporate Bank, Ltd. 47,298 3.2Mitsubishi Corporation 45,435 3.1Sumitomo Mitsui Banking Corporation 40,398 2.8The Bank of Tokyo-Mitsubishi UFJ, Ltd. 30,617 2.1Tokio Marine & Nichido Fire Insurance Co., Ltd. 29,323 2.0State Street Bank and Trust Company 505103 23,441 1.6Morgan Stanley and Company Inc. 22,043 1.5Mitsui Sumitomo Insurance Co., Limited 16,722 1.1
Note: Trading volume figures represent the average trading volumes for each quarter.
Annual Report 2007 NIPPON OIL CORPORATION 83
CORPO
RATE INFO
RMATIO
N

NIPPO
N O
IL CORPO
RATION
Annual Report 2 007
Printed in JapanCert no. SGS-COC-2053