NI 43-101 Technical Report Latitude 52° 18' N, Longitude ... · IPL analyses of original sample...
178
Eureka Resources Inc. Frasergold Project ___________________________________________________________________________________ ___________________________________________________________________________________ ERSi Earth Resource Surveys Inc. Giroux Consultants Ltd. NI 43-101 Technical Report Frasergold Exploration Project Cariboo Mining Division, B.C. Latitude 52° 18' N, Longitude 120° 35' W for Eureka Resources Inc. 1100 - 1111 Melville Street Vancouver, B.C. V6E 3V6 by K.V. Campbell, Ph.D., P.Geo. ERSi Earth Resource Surveys Inc. 6599 Millar Road, P.O. Box 271 Horsefly, B.C., Canada V0L 1L0 and G. H. Giroux, MA.Sc., P.Eng. Giroux Consultants Ltd. 1215-675 West Hastings St. Vancouver, B.C., Canada V6B 1N2 July 20th, 2015 Amended July 27, 2015
Transcript of NI 43-101 Technical Report Latitude 52° 18' N, Longitude ... · IPL analyses of original sample...

Eureka Resources Inc. Frasergold Project ___________________________________________________________________________________
___________________________________________________________________________________
ERSi Earth Resource Surveys Inc. Giroux Consultants Ltd.
NI 43-101 Technical Report
Frasergold Exploration Project
Cariboo Mining Division, B.C.
Latitude 52° 18' N, Longitude 120° 35' W
for
Eureka Resources Inc.
1100 - 1111 Melville Street Vancouver, B.C. V6E 3V6
by
K.V. Campbell, Ph.D., P.Geo. ERSi Earth Resource Surveys Inc.
6599 Millar Road, P.O. Box 271 Horsefly, B.C., Canada V0L 1L0
and
G. H. Giroux, MA.Sc., P.Eng. Giroux Consultants Ltd.
1215-675 West Hastings St. Vancouver, B.C., Canada V6B 1N2
July 20th, 2015
Amended July 27, 2015

Eureka Resources Inc. Frasergold Project ___________________________________________________________________________________
___________________________________________________________________________________
ERSi Earth Resource Surveys Inc. Giroux Consultants Ltd.
Table of Contents
1. Summary .......................................................................................................................................... 1
2. Introduction ...................................................................................................................................... 3
2.1. Background ...................................................................................................................................... 3
2.2. Qualified Persons ............................................................................................................................. 4
2.3. Definitions, Abbreviations and Conversions .................................................................................... 5
3. Reliance on Other Experts ............................................................................................................... 5
4. Property Description and Location ................................................................................................... 6
5. Accessibility, Climate, Local Resources, Infrastructure and Physiography ..................................... 7
6. History .............................................................................................................................................. 9
6.1. Prior to 2007 ..................................................................................................................................... 9
6.2. Historical Drill Results .................................................................................................................... 12
6.3. Recent Programs ........................................................................................................................... 13
6.3.1 2007 to 2008 .................................................................................................................................. 13
6.3.2 2011 ............................................................................................................................................... 14
6.3.3 2015 ............................................................................................................................................... 14
7. Geological Setting and Mineralization ............................................................................................ 14
7.1. Regional Geology ........................................................................................................................... 14
7.2. Property Geology ........................................................................................................................... 15
7.2.1 Silty limestone ................................................................................................................................ 16
7.2.2 Siliceous siltstone ........................................................................................................................... 16
7.2.3 Grey phyllite ................................................................................................................................... 16
7.2.4 Knotted phyllite ............................................................................................................................... 16
7.2.5 Carbonate-quartz-sericite-chlorite schist ....................................................................................... 17
7.2.6 Silty, calcareous phyllite ................................................................................................................. 17
7.3. Structural Geology ......................................................................................................................... 17
7.4. Quartz Veins and Gold Mineralization ........................................................................................... 18
8. Deposit type ................................................................................................................................... 19
9. Exploration ..................................................................................................................................... 21
9.1. 2007 Program ................................................................................................................................ 21
9.2. Results of 2007 Programs ............................................................................................................. 22
9.2.1 Surface Rock Sampling .................................................................................................................. 22
9.2.2 Trenching ....................................................................................................................................... 22
9.2.3 Underground Channel Sampling .................................................................................................... 23
9.2.4 Underground Bulk Sampling .......................................................................................................... 25
9.3. 2008 Program ................................................................................................................................ 29

Eureka Resources Inc. Frasergold Project ii ___________________________________________________________________________________
___________________________________________________________________________________
ERSi Earth Resource Surveys Inc. Giroux Consultants Ltd.
9.4. Results of 2008 Programs ............................................................................................................. 30
9.4.1 Soil Sampling ................................................................................................................................. 30
9.4.2 Silt Sampling .................................................................................................................................. 30
9.4.3 Rock Sampling ............................................................................................................................... 30
9.5. Results of 2011 Program ............................................................................................................... 30
9.6. Results of 2015 Program ............................................................................................................... 30
10. Drilling ............................................................................................................................................ 31
11. Sample Preparation, Analyses and Security.................................................................................. 33
11.1. 1984 to 1994 Programs .................................................................................................................. 33
11.1.2 Reverse Circulation Drilling ............................................................................................................ 33
11.1.3 Underground Channel Samples ..................................................................................................... 34
11.1.4 Underground Bulk Sampling .......................................................................................................... 34
11.1.5 Diamond Drilling ............................................................................................................................. 34
11.1.6 Security .......................................................................................................................................... 35
11.1.7 Drill Sample Analyses .................................................................................................................... 35
11.1.8 Analytical Quality Control Procedures ........................................................................................... 35
11.2. 2007 Program ................................................................................................................................ 36
11.2.1 Rock Outcrop Sampling ................................................................................................................. 36
11.2.2 Trench Sampling ............................................................................................................................ 36
11.2.3 Underground Channel Sampling .................................................................................................... 37
11.2.4 Underground Bulk Sampling .......................................................................................................... 37
11.2.5 Diamond Drilling and Sampling ...................................................................................................... 38
11.3. 2008 Exploration Program ............................................................................................................. 40
11.3.1 Soil Sampling ................................................................................................................................. 40
11.3.2 Silt Sampling .................................................................................................................................. 40
11.3.3 Rock Sampling ............................................................................................................................... 40
11.3.4 Diamond Drilling ............................................................................................................................. 40
12. Data Verification ............................................................................................................................. 41
12.1. 2007 Program ................................................................................................................................ 41
12.1.1 2007 Standards, Blanks and Duplicate Samples ........................................................................... 41
12.1.2 Results of 2007 Blanks and Standard Analyses ............................................................................ 43
12.1.3 2007 IPL Original Analyses versus ALS Chemex Check Analyses ............................................... 45
12.1.4 Field Duplicate Analyses, 2007 ...................................................................................................... 46
12.1.5 Preparation Duplicate Analyses, 2007 ........................................................................................... 47
12.1.6 IPL Reproducibility of Pulp Analyses, 2007 ................................................................................... 48
12.1.7 Sources of Errors, 2007 ................................................................................................................. 49

Eureka Resources Inc. Frasergold Project iii ___________________________________________________________________________________
___________________________________________________________________________________
ERSi Earth Resource Surveys Inc. Giroux Consultants Ltd.
12.2. 2008 Program ................................................................................................................................ 49
12.2.1 2008 Standards, Blanks and Duplicate Sample Preparation ......................................................... 49
12.2.2 Results of 2008 Blanks and Standard Analyses ............................................................................ 50
12.2.3 2008 IPL Analyses versus Check Analyses by ALS Chemex ....................................................... 51
12.2.4 2008 Field Duplicates ..................................................................................................................... 52
12.2.5 2008 Preparation Duplicates .......................................................................................................... 53
12.3. Quality Assurance and Quality Control Conclusions ..................................................................... 55
13. Mineral Processing And Metallurgical Testing ............................................................................... 56
13.1. 1984 to 1993 Programs .................................................................................................................. 56
13.2. 2007 and 2008 Programs............................................................................................................... 57
14. Mineral Resource Estimates .......................................................................................................... 57
14.1. Mineral Resource And Mineral Reserve Estimates ....................................................................... 57
14.2. Data Analysis ................................................................................................................................. 58
14.3. Geologic Model .............................................................................................................................. 60
14.4. Diamond Drilling versus RC Drilling ............................................................................................... 61
14.5. Composites .................................................................................................................................... 65
14.6. Variography .................................................................................................................................... 66
14.7. Block Model .................................................................................................................................... 67
14.8. Bulk Density ................................................................................................................................... 68
14.9. Grade Interpolation ........................................................................................................................ 69
14.10. Classification .................................................................................................................................. 70
23. Adjacent Properties ........................................................................................................................ 75
24. Other Relevant Data And Information ............................................................................................ 76
25. Interpretations And Conclusions .................................................................................................... 76
26. Recommendations ......................................................................................................................... 77
27. References ..................................................................................................................................... 78
28. Certificates and Consent of Authors .............................................................................................. 84
Figures
Figure 1. Property location ...................................................................................................... follows page 6
Figure 2. Frasergold claim plan .............................................................................................. follows page 6
Figure 3. Mineralized zones ................................................................................................. follows page 12
Figure 4. Regional geology ................................................................................................... follows page 14
Figure 5. Property geology ................................................................................................... follows page 15
Figure 6. 2007 surface rock samples .................................................................................... follows page 22
Figure 7. Location of 2007 trenches and anomalous gold values ........................................ follows page 22

Eureka Resources Inc. Frasergold Project iv ___________________________________________________________________________________
___________________________________________________________________________________
ERSi Earth Resource Surveys Inc. Giroux Consultants Ltd.
Figure 8. 2007 Underground work ........................................................................................ follows page 24
Figure 9. Underground channel samples; average fire assay vs screened total metallic assay, Au g/t .... 24
Figure 10. Location of 2008 geochemical sampling grids .................................................... follows page 30
Figure 11. 2008 silt samples ................................................................................................ follows page 30
Figure 12. 2008 rock sample locations - 1 ........................................................................... follows page 30
Figure 13. 2008 rock sample locations - 2 ........................................................................... follows page 30
Figure 14. 2011 geochemical sampling on Kusk grid .......................................................... follows page 30
Figure 15. 2011 geochemical sampling on Eureka Bowl and 18 ppm grids ........................ follows page 30
Figure 16. 2015 geochemical sampling on 18 ppm grid extension .................................... follows page 30
Figure 17. Historical drill hole plan ....................................................................................... follows page 31
Figure 18. 2007, 2008 diamond drill holes ........................................................................... follows page 31
Figure 19. Successive analyses by IPL of low grade standard, GS-P7A, obtained during the 2007
sampling/assaying program ..................................................................................................... 44
Figure 20. Successive analyses by IPL of medium grade standard, GS-2B, obtained during the 2007
sampling/assaying program ..................................................................................................... 44
Figure 21. Successive analyses by IPL of high grade standard, GS-3C, obtained during the 2007
sampling/assaying program ..................................................................................................... 45
Figure 22. IPL original gold value (Au ppm) versus ALS Chemex corresponding check value
(CHEMAU) for 2007 data .......................................................................................................... 45
Figure 23. IPL analyses of original sample (AU_PPM) versus “field duplicate” (FD12A3) ..................... .47
Figure 24. IPL analyses of first pulp (from ‘field duplicate’) versus third analysis representing
separate reject material .......................................................................................................... 48
Figure 25. IPL duplicate analyses of same pulp (from ‘field duplicate’ data). Data in “g/t Au” ................ 48
Figure 26. Plot of 523 paired analyses by IPL and ALS Chemex for the 2008
sampling/assaying program for values less than 2 g/t ............................................................. 51
Figure 27. Plot of 9 paired values greater than 2 g/t Au, analyzed by both IPL and ALS Chemex .......... 52
Figure 28. Plot of 503 IPL ‘field duplicate’ values for the 2008 sampling/assaying program ................... 53
Figure 29. Plot of IPL field duplicate data values less than 2 g/t Au, 2008 data ...................................... 53
Figure 30. Sample preparation duplicate analyses by IPL for data less than 2.0 g/t Au ......................... 54
Figure 31. Sample preparation duplicate analyses greater than 2.0 g/t Au by IPL .................................. 54
Figure 32. Scatter plot showing screen fire assay and regular fire assay Au values ............................... 59
Figure 33. Lognormal scatter plot showing screen fire assay and regular fire assay Au values ............. 60
Figure 34. Isometric view looking north showing the High grade core zone in red with the dark
grey lower grade envelope around it and the light gray showing surface topography ............ 61
Figure 35. Location of assays in the low-grade envelope and high-grade core
of the Main Zone ................................................................................................ follows page 61

Eureka Resources Inc. Frasergold Project v ___________________________________________________________________________________
___________________________________________________________________________________
ERSi Earth Resource Surveys Inc. Giroux Consultants Ltd.
Figure 36. Lognormal cumulative distribution of gold within low grade envelope,
RC vs DDH results .................................................................................................................. 62
Figure 37. Lognormal Cumulative Frequency Plots for Gold in High Grade and Low Grade Zones
showing results from RC and Diamond Drilling ...................................................................... 62
Figure 38. Isometric view of the three estimated block models ................................................................ 68
Tables
Table 4.1 Frasergold claim list ............................................................................................................ 6
Table 6.2.1 Extent of mineralized zones in relation to local mine grid ................................................ 13
Table 8.1 Characteristics of the Frasergold property ........................................................................ 20
Table 9.3.4a Assay results of 2007 bulk sampling - head grade by cyanide leaching method ............. 25
Table 9.3.4b Assay results of 2007 bulk sampling - head grade by metallic assay .............................. 27
Table 10.1 2007 and 2008 drill hole data ............................................................................................ 31
Table 14.2 Summary of drilling on Frasergold property ...................................................................... 58
Table 14.4.1 Summary of Au assay statistics sorted by domain ........................................................... 63
Table 14.4.2 Summary of gold populations present in high-grade core domain ................................... 64
Table 14.4.3 Summary of gold populations present in low grade envelope domain ............................. 65
Table 14.4.4 Summary of capped Au assay statistics sorted by domain .............................................. 65
Table 14.5.1 Summary of gold composite statistics sorted by domain .................................................. 66
Table 14.6.1 Summary of semivariogram parameters for gold .............................................................. 66
Table 14.8.1 Average specific gravity of Frasergold rock types ............................................................ 69
Table 14.10.1 Measured resource, Frasergold Main Zone ...................................................................... 73
Table 14.10.2 Indicated resource, Frasergold Main Zone ....................................................................... 73
Table 14.10.3 Measured plus indicated resource, Frasergold Main Zone............................................... 74
Table 14.10.4 Inferred resource, Frasergold Main Zone ......................................................................... 74
Table 14.10.5 Inferred resource, Frasergold NW Extension ................................................................... 75
Table 14.10.6 Inferred resource, Frasergold Southeast Extension ......................................................... 75
Table 14.10.7 Summary of Frasergold resource at a 0.50 g/t Au Cutoff ................................................. 75
Photos
Photo 1. View from underground of the mineralized vein swarms.............................................................. 64
Appendices
Appendix I. 2007 rock sample site locations and assay values
Appendix II. Frasergold trench sampling program 2007, locations of samples and sample descriptions
Appendix III. Fire assay and screened metallic assay values of 2007 underground channel samples

Eureka Resources Inc. Frasergold Project vi ___________________________________________________________________________________
___________________________________________________________________________________
ERSi Earth Resource Surveys Inc. Giroux Consultants Ltd.
Appendix IV. Drill holes used in resource estimate
Appendix V. Lognormal cumulative frequency plots for au in high grade core and low grade envelope
Appendix VI. Specific gravity results

Eureka Resources Inc. Frasergold Project ___________________________________________________________________________________
___________________________________________________________________________________
ERSi Earth Resource Surveys Inc. Giroux Consultants Ltd.
1. Summary
The purpose of this report is to update relevant geological and technical information on the Frasergold
property, such as additional and sampling conducted by Teslin River Resources Corp. (“Teslin” or the
“Company”) during the 2011 exploration season and by Eureka Resources Inc. in the spring of 2015.
For purposes of clarification, much of the data in this current report comes from the March 20, 2007
technical report titled, “Summary Report and Exploration Proposal on the Frasergold Project, Cariboo
Mining Division, B.C.”, by authors Geoffrey Goodall, P. Geo. and K.V. Campbell, Ph. D., P.Geo.
Additional data has been incorporated from the January 31, 2008 NI 43-101 technical report “Summary
Report and Exploration Proposal on the Frasergold Project, Cariboo Mining Division, B.C.” by authors J.
Sparling, P.Geo. and K.V. Campbell, Ph.D., P.Geo. and the November 15, 2009 NI 43-101 technical
report "Report on the 2007 and 2008 drill programs on the Frasergold Project, Cariboo Mining Division,
B.C." by authors K.V. Campbell, Ph.D., P.Geo. and G.H. Giroux, MA.Sc., P.Eng.
The current report was prepared by the Qualified Persons K.V. Campbell, Ph. D., P.Geo. and G.H.
Giroux, MA.Sc, P.Eng. as a technical report meeting NI 43-101 requirements. This report will be posted
on SEDAR.
The Frasergold Property claims are located approximately 50 kilometers east of the village of Horsefly,
B.C. and 100 kilometers east northeast of city of Williams Lake, B.C. located on NTS map sheets 093A02
and 093A07 at approximately 52° 18’ 17.62” North latitude and 120° 35’ 16.14” West longitude. The
property consists of 25 contiguous mineral claims covering approximately 3,616.89 hectares within the
MacKay River valley, a tributary to the Horsefly River.
This report summarizes the geology, mineralization, resources and exploration potential of the Frasergold
property located in the Cariboo Mining Division of central British Columbia and makes recommendations
for additional exploration to define further zones of mineralization on the property.
The Frasergold property straddles the boundary between two major tectonic belts of the Canadian
Cordillera; the Omineca Tectonic belt lies on the east side of the property while the Intermontane Belt
occupies the west and central portions of the property. Three regional tectonostratigraphic terranes are
present; Kootenay, Slide Mountain and Quesnellia terranes. The Slide Mountain and Quesnellia terranes
are part of the Intermontane Belt which has been accreted eastward onto the Kootenay terrane of the
Omineca Belt. The Eureka Thrust forms the tectonic boundary between these two Belts.
In the project area the Omineca Tectonic Belt is represented by Hadrynian to early Paleozoic quartz-mica
schists and gneisses of the Snowshoe Group. These make up part of the Kootenay terrane; pericratonic,
intensely deformed, variably metamorphosed rocks which appear to be stratigraphically related to
ancestral North America. The Omineca Tectonic Belt is known for its prevalence of gold and tungsten
mineral occurrences, such as those in the Barkerville gold mining camp to the north. The Quesnellia

Eureka Resources Inc. Frasergold Project 2 ___________________________________________________________________________________
___________________________________________________________________________________
ERSi Earth Resource Surveys Inc. Giroux Consultants Ltd.
Terrane is composed of metavolcanic and phyllitic rocks of Permian to Jurassic age. Numerous copper
and gold deposits occur within this package of rocks, including the Mt. Polley mine 40 kilometers north of
Frasergold. The Frasergold mineralization appears to fit the orogenic lode-gold deposit type; gold tends to
occur in quartz veins with coarse particulate gold occurring in segregations of stringers, veins, boudins
and mullions. Pervasive low grade gold mineralization is also found within the knotted phyllite strata
where quartz is absent.
Exploration activities completed on the Frasergold property during the period 1981 through 1994 by the
companies Amoco, Eureka and Asarco identified an area of gold mineralization that extends along a
strike length of approximately 10 kilometers. Within this area are five mineralized zones that have been
partially delineated by drilling and underground sampling. With further exploration, these zones may be
determined to be continuous. Historic resource estimates of the Main Zone were completed in 1991 by
Campbell et al (3,396,970 tons at 0.05 oz/T Au) and James Askew and Associates (6,612,675 tons at
0.055 oz/T Au). These estimations are not compliant with the Canadian Institute of Mining, Metallurgy and
Petroleum (“CIM”) standards of definition, and therefore do not fulfill NI 43-101 reporting standards, and
should not be relied upon. However, this information provides a relevant indication of the level of
exploration conducted and the tenor of mineralization identified at the Frasergold property.
In the 2006 Hawthorne Gold Corp. ("Hawthorne") optioned the Frasergold property from Eureka and in
2007 completed minor trenching programs, oversaw rehabilitation of historical underground workings on
the Main Zone, including rock bolting to allow detailed channel sampling throughout the workings, and
conducted a diamond drill program consisting of sixteen (16) HQ holes totalling 3,615 meters. Aeroquest
International Advanced Airborne Geophysics completed a helicopter-borne geophysical survey on the
property during the 2007 field season. The approximate cost of the Hawthorne 2007 program was $5.1
million (Sparling, 2008).
During the 2008 season Hawthorne completed 10,414 meters of NQ2 diamond drilling, regional mapping
and several soil sampling programs. The approximate cost of the Hawthorne 2008 program was $3.7
million (Whitehead, 2009).

Eureka Resources Inc. Frasergold Project 3 ___________________________________________________________________________________
___________________________________________________________________________________
ERSi Earth Resource Surveys Inc. Giroux Consultants Ltd.
The 2009 resource estimate is summarized below for a cut-off value of 0.50 g/t Au. All of the resources
described are located on the Frasergold property owned by Eureka Resources Inc.
Zone Class Au Cut-off
(g/t)
Tonnes > Cut-
off (tonnes)
Grade > Cut-off
Au (g/t) Au (grams) Au (ounces)
Main Measured 0.50 5,600,000 0.812 4,500,000 145,000
Main Indicated 0.50 9,570,000 0.755 7,200,000 231,000
Main M+I 0.50 15,170,000 0.776 11,800,000 376,000
Main Inferred 0.50 8,270,000 0.670 5,500,000 177,000
NW Inferred 0.50 19,180,000 0.740 14,200,000 457,000
SE Inferred 0.50 43,000 0.632 27,000 900
Total Inferred 0.50 27,493,000 0.718 19,727,000 634,900
Hawthorne's interest in the Frasergold property expired in 2010 and the claims were returned to Eureka
with no encumbrances. The property was then optioned to Teslin River Resources Corp. ("Teslin") in
2011 who completed a limited geochemical soil survey on the property. In December, 2013 Teslin's
option agreement expired and the Frasergold property was returned to Eureka.
In late April, 2015, Eureka conducted a geochemical soil survey in order to maintain the claims in good
standing through to April and October, 2016.
A two stage program is recommended. Additional resource may be developed along the southeast and
northwest projections of the main zone and within the 18ppm and Eureka Bowl grid areas. The first stage
is continued soil sampling, road and drill site construction, and a 6,000m diamond drill program at an
estimated cost of $2,000,000. 1,500m of this drilling could be conducted in 2015, the remaining 4,500m
completed in 2016. Contingent upon favorable results from the Stage I drilling, additional drilling would be
recommended at a cost of about $2,500,000.
2. Introduction
2.1. Background
This report summarizes the geology, mineralization, historic gold resources and exploration potential of
the Frasergold project area located in the Cariboo Mining Division of central British Columbia and makes
recommendations for exploration to define further zones of mineralization on the property. The report has
been prepared at the request of Mr. Michael D. Sweatman, President of Eureka Resources Inc.
("Eureka").

Eureka Resources Inc. Frasergold Project 4 ___________________________________________________________________________________
___________________________________________________________________________________
ERSi Earth Resource Surveys Inc. Giroux Consultants Ltd.
This document is a technical report outlining the geological setting, results of exploration and the
exploration potential of the Frasergold property. The report is compliant with Canadian Securities
Administrators' ("CSA") National Instrument 43-101 (“NI 43-101") requirements and satisfies independent
“Qualified Person” requirements under Part 4 of the instrument.
Sources of information for this report are referenced in Section 20 (References). No independent
verification of the historical geological, geochemical or geophysical data was undertaken. However, there
is no reason not to rely on the sources of this data and nothing has come to the attention of the authors
which would cause them not to rely on such data. The authors have no reason to believe that any
material facts have been withheld.
2.2. Qualified Persons
The Qualified Persons ("QP"), as defined by NI 43-101, responsible for preparation of this Technical
Report are:
K. Vincent Campbell, Ph.D., P..Geo. - Executive Consultant and President of ERSi Earth
Resource Surveys Inc., ("ERSi") and
Gary H. Giroux, MA.Sc, P.eng. - Executive Consultant and President of Giroux Consultants Ltd.
The primary author of this report, K. Vincent Campbell, is a Professional Geoscientist registered with the
Association of Professional Engineers and Geoscientists of British Columbia. He is a Qualified Person as
defined by NI 43-101 and has extensive knowledge of the Frasergold property through his involvement of
exploration programs during the periods 1984 to 1991 and 2007 to 2009. He co-authored the preparation
of the March 20, 2007, January 31, 2008 and November 15, 2009 technical reports. His most recent visit
to the property was on June 13, 2015 in order to assess access conditions and the current state of
logging and other activities in the MacKay River valley.
Gary Giroux, the co-author of this report, is a Professional Geoscientist registered with the Association of
Professional Engineers and Geoscientists of British Columbia. He is a Qualified Person as defined by
NI 43-101 and was responsible for the current resource estimation of the Frasergold project. He co-
authored the preparation of the November 15, 2009 technical report. He last visited the property on
September 10-11th, 2008.
All currency referred to in this report is in Canadian dollars. This report draws largely on information that
was originally reported in Imperial measurements. Conversion to metric measurements is included where
appropriate, in addition to reporting the Imperial measurements. Historic resource estimations were left in
their original context.
All map coordinates in this report are based on Universal Transverse Mercator (UTM) Zone 10 projection
in North American Datum 1983 (NAD83).

Eureka Resources Inc. Frasergold Project 5 ___________________________________________________________________________________
___________________________________________________________________________________
ERSi Earth Resource Surveys Inc. Giroux Consultants Ltd.
The Technical Report is intended to be read as a whole and sections or parts should not be read or relied
upon out of context.
The effective date of this Technical Report is July 20th, 2015.
2.3. Definitions, Abbreviations and Conversions
asl above sea level mm millimeter(s) ARIS Assessment Report Indexing System MEM Ministry Energy and Mines (B.C.) BCFS British Columbia Forest Service MTO Mineral Titles Online (B.C. MEM) BCGS British Columbia Geographic System NAD North American Datum NI 43-101 Canadian National Instrument 43-101 n.a. not available/applicable DDH diamond drill hole NQ diamond drill inside diameter of 47.6mm cm centimeter(s) NTS National Topographic Service ° degree(s) NOWR Notice of Work and Reclamation °C degrees Celsius nT nano Tesla DEM digital elevation model oz troy ounce g or gm gram(s) ppb parts per billion g/t grams per metric tonne ppm parts per million > greater than % percent(age) ha hectare(s) TRIM Terrain Resource Information
Management NSR Net Smelter Return GPS Global Positioning System VLF-EM Very Low Frequency Electro Magnetic kg kilogram(s) T ton (2000 pounds or 977.2 kg) km kilometer(s) QA quality assurance < less than QC quality control m meter(s) t tonne (1000 kg or 2,204.6 pounds) Ma million years 1 gram 0.3215 troy oz mg milligram(s) 1 oz/Ton 28.22 gm/tonne CIM Canadian Institute of Mining and Metallurgy 1 troy oz 31.104 gm CSA Canadian Securities Administrators RC reverse circulation drill hole
3. Reliance on Other Experts
The B.C. Ministry of Mines and Energy's Mineral Titles Online ("MTO") facility has been relied upon to
verify the tenure and status of the mineral claims held by Eureka. The author undertook a search on June
5, and June 24, 2015 of the tenure data on the British Columbia government's Mineral Titles Online
website which confirms the geospatial locations of the claims boundaries. This is common practice in the
mineral exploration industry in British Columbia to locate claim boundaries, since the advent of internet
staking.
As of the date of this report, the authors are not aware of any material fact or material change with
respect to the subject matter of this Technical Report that is not presented herein, or which the omission
to disclose could make this report misleading.
All maps were made by ERSi Earth Resource Surveys Inc. ("ERSi") unless otherwise stated.

Eureka Resources Inc. Frasergold Project 6 ___________________________________________________________________________________
___________________________________________________________________________________
ERSi Earth Resource Surveys Inc. Giroux Consultants Ltd.
4. Property Description and Location
The Frasergold Property lies in the eastern Cariboo region of central British Columbia (Figure 1),
approximately 100 km east of Williams Lake in the Cariboo Mining Division. The claims straddle the
MacKay River valley and are centered at approximately 52° 18’N and 120° 35’ W on National
Topographic System (NTS) map sheet 093A07 (1:20,000 BCGS map sheets 093A027, 093A028, 093037
and 093A038) as shown on Figure 2.
The 25 claims included in the property are listed in Table 4.1. All of the claims are owned 100% by
Eureka Resources Inc.
Table 4.1. Frasergold claim list.
Tenure Claim Name Issue Date Good To Date Area (ha)
204214 MAC 1979/Oct/19 2016/Oct/15 225.00
204347 KAY #10 1980/Sep/25 2016/Oct/15 150
204348 KAY #11 1980/Sep/25 2016/Oct/15 50
204887 MAC 9 FR. 1984/Jul/16 2016/Oct/15 25
204896 MAC 11 FR 1984/Jul/27 2016/Oct/15 25
378209 L-1 2000/Jun/18 2018/Aug/30 25
402366 KAY #10 2003/May/09 2016/Oct/15 375
402367 KAY #11 2003/May/09 2016/Oct/15 450
405520 J#1 2003/Oct/04 2016/Oct/15 100
405682 KAY #9 2003/Sep/26 2016/Oct/15 500
413226 J#2 2004/Aug/17 2016/Oct/15 150
517995 NUGGET 2005/Jul/18 2016/Oct/15 59.312
517996 IMPERIAL 2005/Jul/18 2016/Oct/15 494.312
524992 EUREKA 2006/Jan/10 2016/Oct/15 296.515
544763 EUREKA 2006/Nov/01 2016/Oct/15 98.8078
544765 MISSING 2006/Nov/01 2016/Oct/15 59.2926
544767 ADD ON 2006/Nov/01 2016/Oct/15 19.7624
544769 ANOTHER 2006/Nov/01 2016/Oct/15 19.755
547367 H#1 2006/Dec/14 2016/Oct/15 19.7712
547369 H#2 2006/Dec/14 2016/Oct/15 59.3169
547372 H#3 2006/Dec/14 2016/Oct/15 79.1099
547374 H#4 2006/Dec/14 2016/Oct/15 59.3374
548514 EUR #1 2007/Jan/03 2016/Oct/15 19.769
1035771 KK 2015/Apr/29 2016/Apr/29 138.3224
1035812 EXT 2015/Apr/30 2016/Apr/30 118.5019
Total: 3616.89
In British Columbia, the owner of a mineral claim acquires the right to the minerals that were available at
the time of the claim and location and as defined in the Mineral Tenure Act of British Columbia. Surface
rights and placer rights are not included. Claims are valid for one year and the anniversary date is the
annual occurrence of the date of record (the staking completion date of the claim). To maintain a claim in
good standing the claim holder must, on or before the anniversary date of the claim, pay the prescribed

DWG: 521-15-1 Figure: 1
Eureka Resources Inc.
Frasergold Project
Cariboo Mining Divison, B.C.
Scale 1:200,000June 10, 2015
Property Location
UTM 10 NAD83
FrasergoldProperty
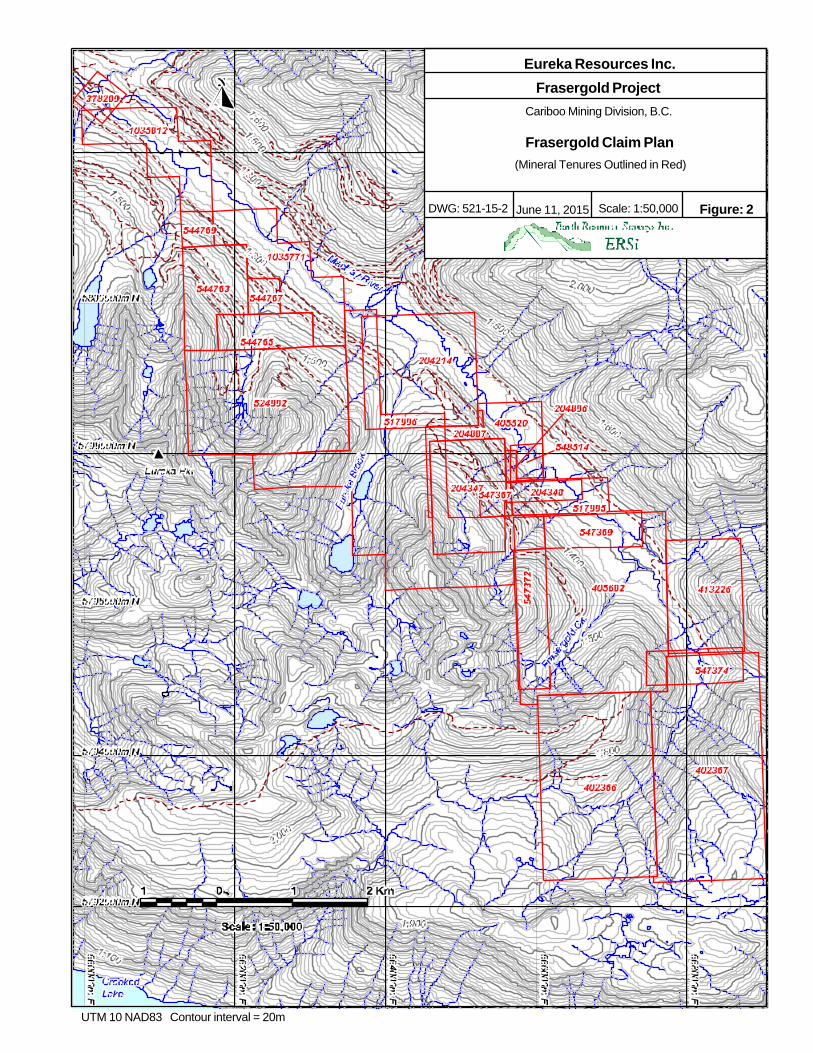
DWG: 521-15-2 Scale: 1:50,000 Figure: 2
Eureka Resources Inc.
Frasergold Project
Cariboo Mining Division, B.C.
UTM 10 NAD83 Contour interval = 20m
June 11, 2015
Frasergold Claim Plan
(Mineral Tenures Outlined in Red)

Eureka Resources Inc. Frasergold Project 7 ___________________________________________________________________________________
___________________________________________________________________________________
ERSi Earth Resource Surveys Inc. Giroux Consultants Ltd.
recording fee and either: (a) record the exploration and development work carried out on that claim during
the current anniversary year; or (b) pay cash in lieu of work which is double the dollar value. The amount
of work required in the first 2 years is $5 per hectare, years 3 and 4 are $10 per hectare, years 5 and 6
are $15 per hectare, year 7 and beyond is $20 per hectare. Only work and associated costs for the
current anniversary year of the mineral claim may be applied toward that claim unit. If the value of work
performed in a year exceeds the required minimum, the value of the excess work, in full year multiples
can be applied to cover work requirements for that claim for additional years (subject to the regulations).
A report detailing work done and expenditures must be filed with and approved by, the B.C. Ministry of
Energy and Mines.
The Province of British Columbia owns surface rights over the property. Exploration permits must be
obtained from the British Columbia Ministry of Energy, Mines and Petroleum Resources prior to carrying
out mechanized exploration on the property. No such permit was required for the geochemical surveys
completed in 2011 and 2015. Eureka's Exploration Permit MX-10-216 has been extended to April 14,
2017.
The author accessed British Columbia Mineral Titles Online on June 5th, and June 24th, 2015 to collect the
claim information presented in Table 4.1.
There are no royalties, back in rights, environmental liabilities, and no known risks to undertake
exploration, except for a 3% NSR to Southlands Mining Corp., dated September 22, 1989. The NSR can
be purchased for $2.6 Million (adjusted annually to reflect changes in the Consumer Price Index) and is
only payable after a mining operation has recovered 100% of its capital costs.
5. Accessibility, Climate, Local Resources, Infrastructure and Physiography
The Frasergold property is accessed by road from highway 97 near 150 Mile House to the village of
Horsefly. All weather gravel and logging roads extend 55 kilometers to the east along the Horsefly River
to MacKay River. A branch logging road to the southeast enters the MacKay River valley and reaches the
central area of the property after a distance of approximately 10 km. Large areas of the northeastern and
eastern claims have been logged, providing improved outcrop exposure and a network of access trails,
most of which have been decommissioned. Access to other areas of the property is very limited.
The upland area along the Eureka Peak ridge is an environmentally sensitive alpine region and with
restricted access requiring permission from the Ministry of Environment. In February of 2009 the area was
placed within the B.C. Government’s Mountain Caribou Recovery Implementation Plan and is off-limits for
logging and road building.
Eureka Resources Inc. Frasergold Project 8 ___________________________________________________________________________________
___________________________________________________________________________________
ERSi Earth Resource Surveys Inc. Giroux Consultants Ltd.
The area lies within the Columbia Highland ecoregion, specifically the Quesnel Highland Ecosection
(Ecosystem Information Section, B.C. Ministry of Environment1 ).
This is a transitional highland area, intermediate between the lower level plateaus to the west and the higher rugged mountains to the east. Here there are remnants of a highly dissected plateau of moderate relief, which rise gradually from west to east. Glaciers covered all of this area moving north-westward to coalesce with north flowing ice from the Fraser Plateau. The glaciers resulted in greatly rounded summits, but cirque basins have developed on north sides. In this area the ecosection is drained to the west: via the Fraser River by the, Cariboo, Matthew, Little, Roaring and upper Horsefly streams.
Precipitation is higher here than in the Shuswap Highland Ecosection to the south. Easterly flowing moist Pacific air rising over this area drops considerable moisture as rain in the summer and snow in the winter. In addition cold, dense Arctic air can build up against the western margin or invade into the valleys and mountains giving intense cold for extended periods. Wet Interior Cedar – Hemlock forests dominate all the valleys and lower slopes; colder Engelmann Spruce – Subalpine Fir forest dominate the upper slopes including the lower mountain summits. Alpine occurs on the highest ridges and mountains in the middle and eastern sections of this ecosection.
The Frasergold property occurs on the western flank of the Cariboo Mountain Range. Topography is
moderately steep in the northwest portion of the property and steeper in the southeast portion. Elevations
range from approximately 1,200 to 2,100 meters. Vegetation along the MacKay River valley consists of
commercial spruce and balsam with thick underbrush. Rock exposure is sparse, being limited to steep
and deeply incised creek gullies. Above 1,600 meters, forest cover becomes less dense and alpine
vegetation is encountered at approximately 1,800 meter elevation. Large areas of the property have been
logged within the past 20 years and second growth forests are maturing.
Climatic conditions are typical of the central interior of British Columbia. Average minimum low
temperatures for January are -18°C and average maximum highs for July are +24°C. Frost free days last
on average from mid-May to mid-August. Between May and September, precipitation at a low-elevation
station is about 400 millimeters, almost twice that of Williams Lake, 100 kilometers to the west. During
April, snow depths in the Quesnel Plateau (approximately 700 meters above sea level) are typically one
to two meters.
The village of Horsefly is a supply centre for the local logging and ranching population and has readily
available skilled labour, as well as board, lodging, fuel and other supply outlets. Field operations are
generally conducted with crews lodged in Horsefly or in nearby fishing lodges. The electrical power grid
does not currently extend east onto the Frasergold property. Year round work conditions for exploration
activities are hampered only by snow accumulation, requiring snow clearing on the access roads and
avalanche control along the steep terrain.
1 http://www.env.gov.bc.ca/ecology/ecoregions/index.html

Eureka Resources Inc. Frasergold Project 9 ___________________________________________________________________________________
___________________________________________________________________________________
ERSi Earth Resource Surveys Inc. Giroux Consultants Ltd.
6. History
6.1. Prior to 2007
The first record of work being conducted in the vicinity of the Frasergold property for gold is in the late
1970s when Clifford E. Gunn began prospecting the area. He was attracted to the Frasergold Creek area
by historic references to the placer gold potential of the region. In 1979 he staked the original claims in
the area to cover a panned gold anomaly discovered in Frasergold Creek. Prospecting was completed in
1979 and from 1980 to 1982 the ground was optioned by Keron Holdings Ltd. and NCL Resources Ltd. A
preliminary soil and rock geochemical survey was completed over the property and a geology map was
produced. Results revealed a 10 kilometer long zone containing anomalous gold values from soil samples
that was thought to have a stratigraphic control.
In 1983 Eureka acquired the property and optioned it to Amoco Canada Petroleum Co. Ltd. (“Amoco”).
During 1983 and 1984 Amoco collected rock and soil geochemical samples, conducted limited
electromagnetic and magnetic surveys, and drilled 14 diamond drill holes totalling 4,519 meters. Coarse
visible gold was noted in 12 of the 14 drill holes and anomalous intersections had values ranging from
0.023 oz/T Au over 7.5 meters to 0.342 oz/T Au over 1.5 meters. Amoco terminated the option agreement
at the end of these programs and returned the property to Eureka.
Eureka continued exploring the Frasergold property in 1985 and 1986 and completed further soil and rock
chip geochemical sampling, trenching and bulk sampling, an I.P. survey, reverse circulation, diamond
drilling and metallurgical testing. Limited reverse circulation drilling was completed in four holes totalling
406.5 meters, and eighteen diamond drill holes, totalling 2,021 meters were completed in three areas.
Twelve of the 18 holes had sections with visible gold and anomalous values ranged from 0.057 oz/T over
39.0 meters (drill hole 86-2) to 1.311 oz/T Au over 1.5 meters (drill hole 86-18).
A surface bulk sampling program completed in 1985 consisted of selecting eight sites for excavation. A
total of 56 samples were collected and analyzed for gold content by fire assay. One sample, 86-12-2A
from the Jay Zone, was submitted to Coastech Research Inc. which milled the material and completed
cyanidation testing on the sample. Results from the cyanidation work were compared to the standard fire
assay analyses. The mean fire assay (FA) values from the 56 samples varied from 0.06 oz/T Au to 0.128
oz/T Au. Coastech split bulk sample 86-12-2A into 24 composites and completed cyanidation leach
metallurgical work on the samples. Leishman and Campbell (1986) report that the results varied from
0.150 oz/T Au to 1.021 oz/T Au, with a weighted average of 0.479 oz/T Au. The gold content of bulk
sample 86-12-2A was determined to be 0.137 oz/T Au (Marchant, 1985).
In 1987 Southlands Mining Corporation (“Southlands”) undertook an option on the Frasergold property,
with Eureka as operator. Southlands constructed and sampled eight trenches totalling 660 meters, and
completed 21 reverse circulation holes totalling 1,710 meters.

Eureka Resources Inc. Frasergold Project 10 ___________________________________________________________________________________
___________________________________________________________________________________
ERSi Earth Resource Surveys Inc. Giroux Consultants Ltd.
In late 1987, Southlands optioned a portion of their interest to Sirius Resources Corp. (“Sirius”). Sirius
completed 17 diamond drill holes totalling 1,536 meters, drilled 37 reverse circulation holes totalling 2,456
meters, and excavated 184 meters of underground workings to provide 524 tonnes of material for bulk
sampling.
In the fall of 1988 Sirius completed work in the Eureka Peak zone, collecting 478 soil samples over a
closely spaced grid, collecting 27 rock chip samples from hand trenches and drilling six diamond drill
holes totalling 862 meters. Several short intervals of approximately one meter in length returned assays
to 0.255 oz/T Au (Campbell, 1989).
In August 1989 a legal dispute between Eureka and Southlands over the validity of the option and joint
venture agreement was resolved. During September, 1989, Eureka completed a program of underground
channel sampling (284 samples), muck sampling (74 samples) from untested rounds, drill core sampling
(297 samples) and re-logging of drill core and geological mapping of underground workings.
In 1990, Eureka entered into a joint venture agreement with Asarco Company of Canada Ltd. (Asarco).
During the period 1990 and 1991, Asarco drilled 25 diamond drill holes totalling 4,687.2 meters, and 156
reverse circulation holes totalling 15,720 meters. Four 1.25 ton bulk samples were collected in 1990 for
metallurgical testing by Bacon, Donaldson and Associates. The average composite grade of these bulks
samples is 0.068 oz/T Au while preliminary tests indicated gold recoveries ranging from 87 to 92%.
The underground workings were lengthened by 114 meters in 1991. These workings produced 1,591 tons
of material that was divided into nine lots for off-site milling. The estimated average grade of this material
was 0.027 oz/T Au. Utilizing the drill hole and underground sample data, Campbell, et al (1991) state
there is an “in-situ resource” of 3,396,970 tons at an average grade of 0.05 oz/T Au within the Main Zone
portion of the Frasergold property. These estimations are not CIM compliant and therefore do not fulfill NI
43-101 reporting standards and should not be relied upon.
In their report, Campbell et al (1991) use the historic category of geological reserves which were
developed based on sampling, assaying and geological interpretation with some constraints imposed by
engineering considerations of minimum mining width and grade. They emphasize that this is not an
estimate of “ore reserves”, which require detailed engineering and cost estimation. The exploration work
completed to provide data for the above resource estimation was conducted using then acceptable
industry best practices by professional people and recognized laboratories. This work would require
confirmation testing to determine the validity of the results reported. These estimations are not CIM
compliant and therefore do not fulfill NI 43-101 reporting standards, and should not be relied upon.
However the work provides relevant data on the Frasergold project and is provided from sources believed
to be reliable.

Eureka Resources Inc. Frasergold Project 11 ___________________________________________________________________________________
___________________________________________________________________________________
ERSi Earth Resource Surveys Inc. Giroux Consultants Ltd.
The key parameters used by Campbell et al (1991) in their estimate include:
establishing cross sections at 1:500 scale at 25 meter intervals through the zones of mineralization, with sections spaced 12.5 meters apart on the key workings of the Main Zone. All sections presented assays, geology and quartz content from each piercing drill hole from all drill campaigns;
geological interpretation based on surface mapping and drill hole data to establish a geological framework and distribution of veins;
zones of anomalous mineralization were interpreted from drill assays and quartz-rich zones of configurations on a hole to hole and section to section comparison basis;
mineralized envelopes were then overlaid on the interpreted geology and mineralization sections.
Further key elements of the historical evaluation of Frasergold mineralization included:
a cut-off grade of 0.02 oz/T Au was used in compositing assays within mineralized envelopes. A cutting factor of 0.30 oz/T Au was applied to all drill sample results prior to estimations;
drill orientation was approximately perpendicular to the dip of the mineralized zone in the majority of drill holes. A minimum drill intersected width of 3 meters was used;
mineralized envelopes were constructed to an elevation of 1425 meters, which is approximately 100 meters vertically below the depth of a majority of the drill holes;
mineralized envelopes were drawn half the distance between holes when the holes were spaced less than 30 meters apart. With holes spaced greater than 30 meters apart, a maximum distance of 25 meters was used;
volume estimations were based on lateral projection of the envelopes half the distance to the adjacent section with a specific gravity of 2.70 used for conversion to weight. The area of each mineralized envelope was digitized and the area Estimated electronically. The average grade based on the arithmetic mean of the cut assays weighted by length of sample was then applied to the individual envelopes.
The figures presented above for historical context do not conform to currently accepted CIM standards or
NI 43-101 Standards of Disclosure for mineral exploration projects and should not be relied upon.
In January 1991, the mining, geological and geotechnical engineering firm James Askew Associates, Inc.
of Englewood, Colorado was commissioned by Asarco to conduct a pre-feasibility study of the Frasergold
project. This study does not conform to the current usage of a pre-feasibility study as defined by NI 43-
101 and should not be relied upon. The Askew report does not take into account economic, mining,
metallurgical, environmental, social or governmental factors. As part of this study, Askew completed “In-
situ Reserves/Resources” for the project using hand drawn polygonal methods. The basis for drawing
these mineralized envelopes was data collected by Asarco and others, which is believed to be reliable.
Askew used a 0.03 oz/T Au cut-off with a minimum true width thickness of three meters. Assays greater
than 0.60 oz/T Au were cut to 0.60 oz/T Au. Zones of gold mineralization were extended half-way to the
adjacent section and were extended 75 meters down-dip. A specific gravity of 2.7 was used in the
estimations.

Eureka Resources Inc. Frasergold Project 12 ___________________________________________________________________________________
___________________________________________________________________________________
ERSi Earth Resource Surveys Inc. Giroux Consultants Ltd.
Based on these parameters Askew (1991) summarized the gold mineralization at the Frasergold property
as 6,612,675 tons of mineralized material at an average grade of 0.055 oz/T Au to represent 362,825
ounces of gold. Askew (1991) does not categorize the mineralized material due to “the comparatively
small amount of geological and assay data for such a long strike length”. The volume and gold content
estimates used by Askew (1991) do not conform to the “CIM Standards on Mineral Resources and
Reserves, Definitions and Guidelines”, issued in 2000 and modified with adoption of the “CIM Definition
Standards – For Mineral Resources and Mineral Reserves” in 2005. The resource estimate provided by
Askew (1991) does not use CIM compliant estimations and therefore do not fulfill NI 43-101 reporting
standards and should not be relied upon.
Askew (1991) recommended the following: 1) that drilling be conducted on 25 meter sections with a fan of
holes drilled on each section; 2) downhole surveys be conducted; 3) use of flocculent on the RC cuttings;
4) select two or three sites for underground exploration; and 5) provide on-site rock crushing facilities to
reduce the handling of mineralized material. The Askew report is relevant to the current understanding of
the Frasergold project as it indicates the extent of advanced exploration being conducted by Asarco on
the project.
The above-mentioned resource calculation by James Askew Associates Ltd. for the Frasergold property
was conducted by mining engineers, however the estimations were not conducted according to CIM
standards and the resource was not signed by the engineer. The conclusions drawn in this report are
reasonable for the level of exploration conducted on the Frasergold property and compare favourably with
those of Campbell, et al (1990) for the Main Zone area. The Askew (1991) report is relevant to the current
review of the Frasergold property as it provides an indication of the scope and depth of exploration
conducted on the project.
The historic estimations are presented here for historic purposes only to provide the reader with a full
understanding of the extent of previous exploration conducted on the property.
Between 1980 and 1994 it is estimated that $8 million had been expended on the exploration of the
Frasergold property. A total of 39,582 meters of drilling in 344 holes had been completed on the property,
along with 294 meters of underground drifts to provide access for bulk sampling and metallurgical testing.
6.2. Historical Drill Results
Five key zones of mineralization have been identified along a 10 kilometer strike length of the
sedimentary horizon, as shown in Figure 3 and summarized in Table 6.2.1 in relation to the local mine
grid. Gold mineralization within these zones ranges from a minimum value of 0.005 oz/T Au to an arbitrary
established upper level of 1.00 oz/T Au, with the highest reported gold grade being 7.35 oz/T Au. The
zones are described as follows:

DWG: 521-15-7 Scale: 1:50,000 Figure: 3
Eureka Resources Inc.
Frasergold Project
Cariboo Mining Division, B.C.
UTM 10 NAD83 Contour interval = 20m
June 15, 2015
Mineralized Zones andPotential Zones indicated by Geochemistry
Eureka Resources Inc. Frasergold Project 13 ___________________________________________________________________________________
___________________________________________________________________________________
ERSi Earth Resource Surveys Inc. Giroux Consultants Ltd.
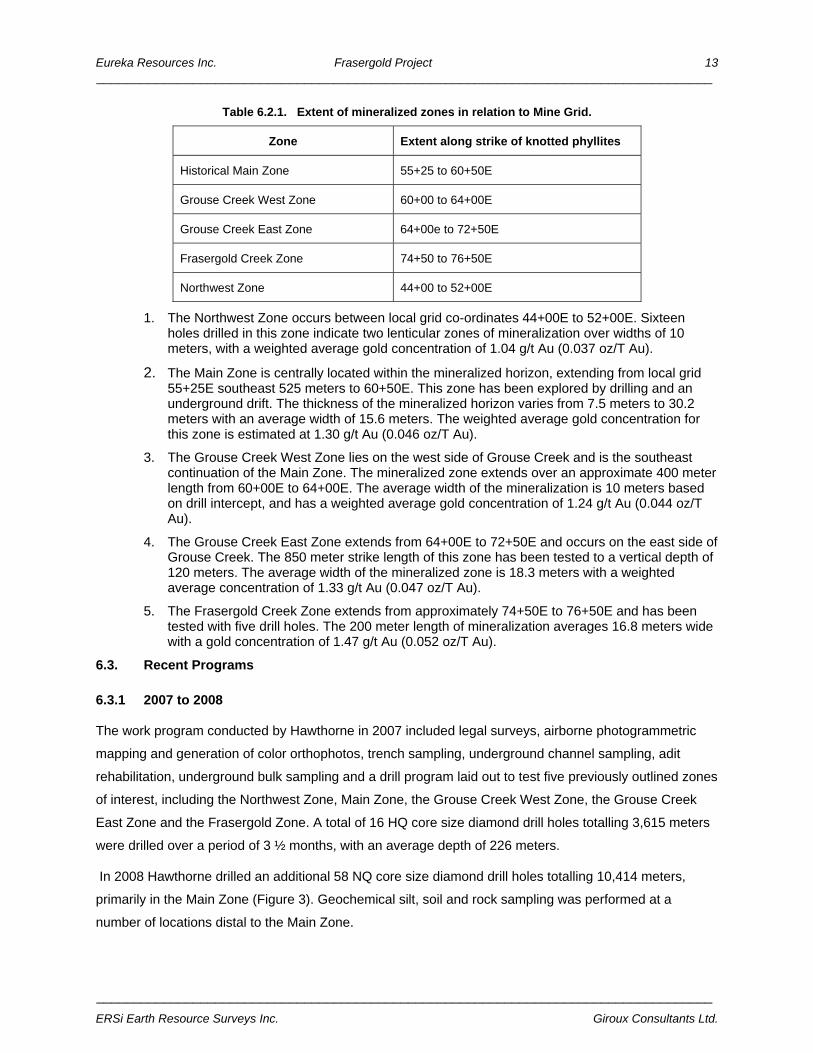
Table 6.2.1. Extent of mineralized zones in relation to Mine Grid.
Zone Extent along strike of knotted phyllites
Historical Main Zone 55+25 to 60+50E
Grouse Creek West Zone 60+00 to 64+00E
Grouse Creek East Zone 64+00e to 72+50E
Frasergold Creek Zone 74+50 to 76+50E
Northwest Zone 44+00 to 52+00E
1. The Northwest Zone occurs between local grid co-ordinates 44+00E to 52+00E. Sixteen holes drilled in this zone indicate two lenticular zones of mineralization over widths of 10 meters, with a weighted average gold concentration of 1.04 g/t Au (0.037 oz/T Au).
2. The Main Zone is centrally located within the mineralized horizon, extending from local grid 55+25E southeast 525 meters to 60+50E. This zone has been explored by drilling and an underground drift. The thickness of the mineralized horizon varies from 7.5 meters to 30.2 meters with an average width of 15.6 meters. The weighted average gold concentration for this zone is estimated at 1.30 g/t Au (0.046 oz/T Au).
3. The Grouse Creek West Zone lies on the west side of Grouse Creek and is the southeast continuation of the Main Zone. The mineralized zone extends over an approximate 400 meter length from 60+00E to 64+00E. The average width of the mineralization is 10 meters based on drill intercept, and has a weighted average gold concentration of 1.24 g/t Au (0.044 oz/T Au).
4. The Grouse Creek East Zone extends from 64+00E to 72+50E and occurs on the east side of Grouse Creek. The 850 meter strike length of this zone has been tested to a vertical depth of 120 meters. The average width of the mineralized zone is 18.3 meters with a weighted average concentration of 1.33 g/t Au (0.047 oz/T Au).
5. The Frasergold Creek Zone extends from approximately 74+50E to 76+50E and has been tested with five drill holes. The 200 meter length of mineralization averages 16.8 meters wide with a gold concentration of 1.47 g/t Au (0.052 oz/T Au).
6.3. Recent Programs
6.3.1 2007 to 2008
The work program conducted by Hawthorne in 2007 included legal surveys, airborne photogrammetric
mapping and generation of color orthophotos, trench sampling, underground channel sampling, adit
rehabilitation, underground bulk sampling and a drill program laid out to test five previously outlined zones
of interest, including the Northwest Zone, Main Zone, the Grouse Creek West Zone, the Grouse Creek
East Zone and the Frasergold Zone. A total of 16 HQ core size diamond drill holes totalling 3,615 meters
were drilled over a period of 3 ½ months, with an average depth of 226 meters.
In 2008 Hawthorne drilled an additional 58 NQ core size diamond drill holes totalling 10,414 meters,
primarily in the Main Zone (Figure 3). Geochemical silt, soil and rock sampling was performed at a
number of locations distal to the Main Zone.

Eureka Resources Inc. Frasergold Project 14 ___________________________________________________________________________________
___________________________________________________________________________________
ERSi Earth Resource Surveys Inc. Giroux Consultants Ltd.
The results of these recent programs completed by Hawthorne are summarized in Section 9.2 (Results of
2007 Programs) and Section 9.4 (Results of 2008 Programs).
6.3.2 2011
In 2011 Teslin undertook a geochemical sampling program over three gridded areas; the Kusk Grid
between Frasergold Ck. and the upper MacKay River, Eureka Bowl Grid in the vicinity of the Northwest
Zone and the 18ppm Au Grid in the lower section of Eureka Brook. In total 27 line km were sampled
resulting in 565 soil samples, 7 rock grab samples and 6 silt samples. The results are summarized in
Section 9.5 (Results of 2011 Program).
6.3.3 2015
In the spring of 2015 Eureka completed 4 line km of geochemical soil sampling in the area of the 18ppm
Au Grid resulting in 77 soil samples. The results are also summarized in Section 9.6 (Results of 2015
Program).
7. Geological Setting and Mineralization
7.1. Regional Geology
The Frasergold property straddles the boundary between two major tectonic belts of the Canadian
Cordillera: the Omineca Tectonic Belt lies to the east of the property and the Intermontane Belt on the
west and central portions of the property. Three regional tectonostratigraphic terranes are present;
Kootenay, Slide Mountain and Quesnellia terranes. The Slide Mountain and Quesnellia terranes form part
of the Intermontane Belt which has been accreted eastward onto the Kootenay terrane of the Omineca
Belt. The Eureka Thrust makes the tectonic boundary between these two Belts.
In the project area, Figure 4, the Omineca Tectonic Belt is represented by Hadrynian to early Paleozoic
quartz-mica schists and gneisses of the Snowshoe Group. These make up part of the Kootenay terrane;
pericratonic, intensely deformed, variably metamorphosed rocks which appear to be stratigraphically
related to ancestral North America. The Omineca Tectonic Belt is noted for its prevalence of gold and
tungsten mineral occurrences such as the Barkerville gold mining camp to the north.
Pennsylvanian and Permian amphibolite, chlorite schist and chlorite-epidote schist make up the Crooked
Amphibolite which structurally overlies the Snowshoe Group metasedimentary rocks above the Eureka
Thrust. The Crooked Amphibolite is part of the Slide Mountain terrane of the Intermontane Belt. In
general, rocks of the Slide Mountain terrane are oceanic marginal basin volcanics and sediments of
Devonian to late Triassic age.
Overlying the Crooked Amphibolite are sediments of the middle to late Triassic Quesnel River Group and
volcanics of the late to middle Triassic Takla Group. The Quesnel River and Takla Groups make up part
of the Quesnellia terrane of the Intermontane Belt. Rocks of the Quesnel River Group are upper Triassic
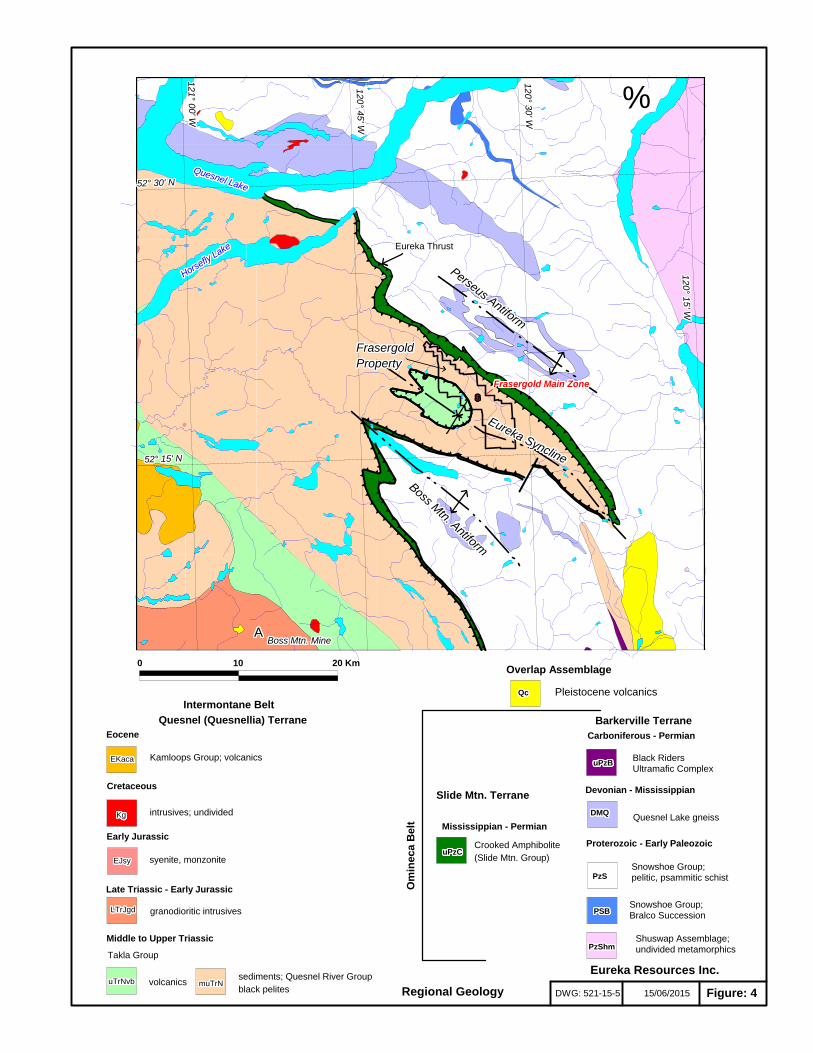
DWG: 521-15-5 15/06/2015 Figure: 4
AAAAAAAAAAAAAAAAAAAAAAAAAAAAAAAAAAAAAAAAAAAAAAAAA
$$$$$$$$$$$$$$$$$$$$$$$$$$$$$$$$$$$$$$$$$$$$$$$$$
Frasergold Main ZoneFrasergold Main ZoneFrasergold Main ZoneFrasergold Main ZoneFrasergold Main ZoneFrasergold Main ZoneFrasergold Main ZoneFrasergold Main ZoneFrasergold Main ZoneFrasergold Main ZoneFrasergold Main ZoneFrasergold Main ZoneFrasergold Main ZoneFrasergold Main ZoneFrasergold Main ZoneFrasergold Main ZoneFrasergold Main ZoneFrasergold Main ZoneFrasergold Main ZoneFrasergold Main ZoneFrasergold Main ZoneFrasergold Main ZoneFrasergold Main ZoneFrasergold Main ZoneFrasergold Main ZoneFrasergold Main ZoneFrasergold Main ZoneFrasergold Main ZoneFrasergold Main ZoneFrasergold Main ZoneFrasergold Main ZoneFrasergold Main ZoneFrasergold Main ZoneFrasergold Main ZoneFrasergold Main ZoneFrasergold Main ZoneFrasergold Main ZoneFrasergold Main ZoneFrasergold Main ZoneFrasergold Main ZoneFrasergold Main ZoneFrasergold Main ZoneFrasergold Main ZoneFrasergold Main ZoneFrasergold Main ZoneFrasergold Main ZoneFrasergold Main ZoneFrasergold Main ZoneFrasergold Main Zone
Boss Mtn. Antiform
Boss Mtn. Antiform
Boss Mtn. Antiform
Boss Mtn. Antiform
Boss Mtn. Antiform
Boss Mtn. Antiform
Boss Mtn. Antiform
Boss Mtn. Antiform
Boss Mtn. Antiform
Boss Mtn. Antiform
Boss Mtn. Antiform
Boss Mtn. Antiform
Boss Mtn. Antiform
Boss Mtn. Antiform
Boss Mtn. Antiform
Boss Mtn. Antiform
Boss Mtn. Antiform
Boss Mtn. Antiform
Boss Mtn. Antiform
Boss Mtn. Antiform
Boss Mtn. Antiform
Boss Mtn. Antiform
Boss Mtn. Antiform
Boss Mtn. Antiform
Boss Mtn. Antiform
Boss Mtn. Antiform
Boss Mtn. Antiform
Boss Mtn. Antiform
Boss Mtn. Antiform
Boss Mtn. Antiform
Boss Mtn. Antiform
Boss Mtn. Antiform
Boss Mtn. Antiform
Boss Mtn. Antiform
Boss Mtn. Antiform
Boss Mtn. Antiform
Boss Mtn. Antiform
Boss Mtn. Antiform
Boss Mtn. Antiform
Boss Mtn. Antiform
Boss Mtn. Antiform
Boss Mtn. Antiform
Boss Mtn. Antiform
Boss Mtn. Antiform
Boss Mtn. Antiform
Boss Mtn. Antiform
Boss Mtn. Antiform
Boss Mtn. Antiform
Boss Mtn. Antiform
Eureka Syncline
Eureka Syncline
Eureka Syncline
Eureka Syncline
Eureka Syncline
Eureka Syncline
Eureka Syncline
Eureka Syncline
Eureka Syncline
Eureka Syncline
Eureka Syncline
Eureka Syncline
Eureka Syncline
Eureka Syncline
Eureka Syncline
Eureka Syncline
Eureka Syncline
Eureka Syncline
Eureka Syncline
Eureka Syncline
Eureka Syncline
Eureka Syncline
Eureka Syncline
Eureka Syncline
Eureka Syncline
Eureka Syncline
Eureka Syncline
Eureka Syncline
Eureka Syncline
Eureka Syncline
Eureka Syncline
Eureka Syncline
Eureka Syncline
Eureka Syncline
Eureka Syncline
Eureka Syncline
Eureka Syncline
Eureka Syncline
Eureka Syncline
Eureka Syncline
Eureka Syncline
Eureka Syncline
Eureka Syncline
Eureka Syncline
Eureka Syncline
Eureka Syncline
Eureka Syncline
Eureka Syncline
Eureka Syncline
Perseus Antiform
Perseus Antiform
Perseus Antiform
Perseus Antiform
Perseus Antiform
Perseus Antiform
Perseus Antiform
Perseus Antiform
Perseus Antiform
Perseus Antiform
Perseus Antiform
Perseus Antiform
Perseus Antiform
Perseus Antiform
Perseus Antiform
Perseus Antiform
Perseus Antiform
Perseus Antiform
Perseus Antiform
Perseus Antiform
Perseus Antiform
Perseus Antiform
Perseus Antiform
Perseus Antiform
Perseus Antiform
Perseus Antiform
Perseus Antiform
Perseus Antiform
Perseus Antiform
Perseus Antiform
Perseus Antiform
Perseus Antiform
Perseus Antiform
Perseus Antiform
Perseus Antiform
Perseus Antiform
Perseus Antiform
Perseus Antiform
Perseus Antiform
Perseus Antiform
Perseus Antiform
Perseus Antiform
Perseus Antiform
Perseus Antiform
Perseus Antiform
Perseus Antiform
Perseus Antiform
Perseus Antiform
Perseus Antiform
Horsefly Lake
Horsefly Lake
Horsefly Lake
Horsefly Lake
Horsefly Lake
Horsefly Lake
Horsefly Lake
Horsefly Lake
Horsefly Lake
Horsefly Lake
Horsefly Lake
Horsefly Lake
Horsefly Lake
Horsefly Lake
Horsefly Lake
Horsefly Lake
Horsefly Lake
Horsefly Lake
Horsefly Lake
Horsefly Lake
Horsefly Lake
Horsefly Lake
Horsefly Lake
Horsefly Lake
Horsefly Lake
Horsefly Lake
Horsefly Lake
Horsefly Lake
Horsefly Lake
Horsefly Lake
Horsefly Lake
Horsefly Lake
Horsefly Lake
Horsefly Lake
Horsefly Lake
Horsefly Lake
Horsefly Lake
Horsefly Lake
Horsefly Lake
Horsefly Lake
Horsefly Lake
Horsefly Lake
Horsefly Lake
Horsefly Lake
Horsefly Lake
Horsefly Lake
Horsefly Lake
Horsefly Lake
Horsefly Lake Eureka ThrustEureka ThrustEureka ThrustEureka ThrustEureka ThrustEureka ThrustEureka ThrustEureka ThrustEureka ThrustEureka ThrustEureka ThrustEureka ThrustEureka ThrustEureka ThrustEureka ThrustEureka ThrustEureka ThrustEureka ThrustEureka ThrustEureka ThrustEureka ThrustEureka ThrustEureka ThrustEureka ThrustEureka ThrustEureka ThrustEureka ThrustEureka ThrustEureka ThrustEureka ThrustEureka ThrustEureka ThrustEureka ThrustEureka ThrustEureka ThrustEureka ThrustEureka ThrustEureka ThrustEureka ThrustEureka ThrustEureka ThrustEureka ThrustEureka ThrustEureka ThrustEureka ThrustEureka ThrustEureka ThrustEureka ThrustEureka Thrust
FrasergoldFrasergoldFrasergoldFrasergoldFrasergoldFrasergoldFrasergoldFrasergoldFrasergoldFrasergoldFrasergoldFrasergoldFrasergoldFrasergoldFrasergoldFrasergoldFrasergoldFrasergoldFrasergoldFrasergoldFrasergoldFrasergoldFrasergoldFrasergoldFrasergoldFrasergoldFrasergoldFrasergoldFrasergoldFrasergoldFrasergoldFrasergoldFrasergoldFrasergoldFrasergoldFrasergoldFrasergoldFrasergoldFrasergoldFrasergoldFrasergoldFrasergoldFrasergoldFrasergoldFrasergoldFrasergoldFrasergoldFrasergoldFrasergoldPropertyPropertyPropertyPropertyPropertyPropertyPropertyPropertyPropertyPropertyPropertyPropertyPropertyPropertyPropertyPropertyPropertyPropertyPropertyPropertyPropertyPropertyPropertyPropertyPropertyPropertyPropertyPropertyPropertyPropertyPropertyPropertyPropertyPropertyPropertyPropertyPropertyPropertyPropertyPropertyPropertyPropertyPropertyPropertyPropertyPropertyPropertyPropertyProperty
Quesnel Lake
Quesnel Lake
Quesnel Lake
Quesnel Lake
Quesnel Lake
Quesnel Lake
Quesnel Lake
Quesnel Lake
Quesnel Lake
Quesnel Lake
Quesnel Lake
Quesnel Lake
Quesnel Lake
Quesnel Lake
Quesnel Lake
Quesnel Lake
Quesnel Lake
Quesnel Lake
Quesnel Lake
Quesnel Lake
Quesnel Lake
Quesnel Lake
Quesnel Lake
Quesnel Lake
Quesnel Lake
Quesnel Lake
Quesnel Lake
Quesnel Lake
Quesnel Lake
Quesnel Lake
Quesnel Lake
Quesnel Lake
Quesnel Lake
Quesnel Lake
Quesnel Lake
Quesnel Lake
Quesnel Lake
Quesnel Lake
Quesnel Lake
Quesnel Lake
Quesnel Lake
Quesnel Lake
Quesnel Lake
Quesnel Lake
Quesnel Lake
Quesnel Lake
Quesnel Lake
Quesnel Lake
Quesnel Lake
Boss Mtn. MineBoss Mtn. MineBoss Mtn. MineBoss Mtn. MineBoss Mtn. MineBoss Mtn. MineBoss Mtn. MineBoss Mtn. MineBoss Mtn. MineBoss Mtn. MineBoss Mtn. MineBoss Mtn. MineBoss Mtn. MineBoss Mtn. MineBoss Mtn. MineBoss Mtn. MineBoss Mtn. MineBoss Mtn. MineBoss Mtn. MineBoss Mtn. MineBoss Mtn. MineBoss Mtn. MineBoss Mtn. MineBoss Mtn. MineBoss Mtn. MineBoss Mtn. MineBoss Mtn. MineBoss Mtn. MineBoss Mtn. MineBoss Mtn. MineBoss Mtn. MineBoss Mtn. MineBoss Mtn. MineBoss Mtn. MineBoss Mtn. MineBoss Mtn. MineBoss Mtn. MineBoss Mtn. MineBoss Mtn. MineBoss Mtn. MineBoss Mtn. MineBoss Mtn. MineBoss Mtn. MineBoss Mtn. MineBoss Mtn. MineBoss Mtn. MineBoss Mtn. MineBoss Mtn. MineBoss Mtn. Mine
120° 1
5' W
120° 1
5' W
120° 1
5' W
120° 1
5' W
120° 1
5' W
120° 1
5' W
120° 1
5' W
120° 1
5' W
120° 1
5' W
120° 1
5' W
120° 1
5' W
120° 1
5' W
120° 1
5' W
120° 1
5' W
120° 1
5' W
120° 1
5' W
120° 1
5' W
120° 1
5' W
120° 1
5' W
120° 1
5' W
120° 1
5' W
120° 1
5' W
120° 1
5' W
120° 1
5' W
120° 1
5' W
120° 1
5' W
120° 1
5' W
120° 1
5' W
120° 1
5' W
120° 1
5' W
120° 1
5' W
120° 1
5' W
120° 1
5' W
120° 1
5' W
120° 1
5' W
120° 1
5' W
120° 1
5' W
120° 1
5' W
120° 1
5' W
120° 1
5' W
120° 1
5' W
120° 1
5' W
120° 1
5' W
120° 1
5' W
120° 1
5' W
120° 1
5' W
120° 1
5' W
120° 1
5' W
120° 1
5' W
52° 15' N52° 15' N52° 15' N52° 15' N52° 15' N52° 15' N52° 15' N52° 15' N52° 15' N52° 15' N52° 15' N52° 15' N52° 15' N52° 15' N52° 15' N52° 15' N52° 15' N52° 15' N52° 15' N52° 15' N52° 15' N52° 15' N52° 15' N52° 15' N52° 15' N52° 15' N52° 15' N52° 15' N52° 15' N52° 15' N52° 15' N52° 15' N52° 15' N52° 15' N52° 15' N52° 15' N52° 15' N52° 15' N52° 15' N52° 15' N52° 15' N52° 15' N52° 15' N52° 15' N52° 15' N52° 15' N52° 15' N52° 15' N52° 15' N
121° 0
0' W
121° 0
0' W
121° 0
0' W
121° 0
0' W
121° 0
0' W
121° 0
0' W
121° 0
0' W
121° 0
0' W
121° 0
0' W
121° 0
0' W
121° 0
0' W
121° 0
0' W
121° 0
0' W
121° 0
0' W
121° 0
0' W
121° 0
0' W
121° 0
0' W
121° 0
0' W
121° 0
0' W
121° 0
0' W
121° 0
0' W
121° 0
0' W
121° 0
0' W
121° 0
0' W
121° 0
0' W
121° 0
0' W
121° 0
0' W
121° 0
0' W
121° 0
0' W
121° 0
0' W
121° 0
0' W
121° 0
0' W
121° 0
0' W
121° 0
0' W
121° 0
0' W
121° 0
0' W
121° 0
0' W
121° 0
0' W
121° 0
0' W
121° 0
0' W
121° 0
0' W
121° 0
0' W
121° 0
0' W
121° 0
0' W
121° 0
0' W
121° 0
0' W
121° 0
0' W
121° 0
0' W
121° 0
0' W
52° 30' N52° 30' N52° 30' N52° 30' N52° 30' N52° 30' N52° 30' N52° 30' N52° 30' N52° 30' N52° 30' N52° 30' N52° 30' N52° 30' N52° 30' N52° 30' N52° 30' N52° 30' N52° 30' N52° 30' N52° 30' N52° 30' N52° 30' N52° 30' N52° 30' N52° 30' N52° 30' N52° 30' N52° 30' N52° 30' N52° 30' N52° 30' N52° 30' N52° 30' N52° 30' N52° 30' N52° 30' N52° 30' N52° 30' N52° 30' N52° 30' N52° 30' N52° 30' N52° 30' N52° 30' N52° 30' N52° 30' N52° 30' N52° 30' N
12
0° 3
0' W
12
0° 3
0' W
12
0° 3
0' W
12
0° 3
0' W
12
0° 3
0' W
12
0° 3
0' W
12
0° 3
0' W
12
0° 3
0' W
12
0° 3
0' W
12
0° 3
0' W
12
0° 3
0' W
12
0° 3
0' W
12
0° 3
0' W
12
0° 3
0' W
12
0° 3
0' W
12
0° 3
0' W
12
0° 3
0' W
12
0° 3
0' W
12
0° 3
0' W
12
0° 3
0' W
12
0° 3
0' W
12
0° 3
0' W
12
0° 3
0' W
12
0° 3
0' W
12
0° 3
0' W
12
0° 3
0' W
12
0° 3
0' W
12
0° 3
0' W
12
0° 3
0' W
12
0° 3
0' W
12
0° 3
0' W
12
0° 3
0' W
12
0° 3
0' W
12
0° 3
0' W
12
0° 3
0' W
12
0° 3
0' W
12
0° 3
0' W
12
0° 3
0' W
12
0° 3
0' W
12
0° 3
0' W
12
0° 3
0' W
12
0° 3
0' W
12
0° 3
0' W
12
0° 3
0' W
12
0° 3
0' W
12
0° 3
0' W
12
0° 3
0' W
12
0° 3
0' W
12
0° 3
0' W
120
° 45' W
120
° 45' W
120
° 45' W
120
° 45' W
120
° 45' W
120
° 45' W
120
° 45' W
120
° 45' W
120
° 45' W
120
° 45' W
120
° 45' W
120
° 45' W
120
° 45' W
120
° 45' W
120
° 45' W
120
° 45' W
120
° 45' W
120
° 45' W
120
° 45' W
120
° 45' W
120
° 45' W
120
° 45' W
120
° 45' W
120
° 45' W
120
° 45' W
120
° 45' W
120
° 45' W
120
° 45' W
120
° 45' W
120
° 45' W
120
° 45' W
120
° 45' W
120
° 45' W
120
° 45' W
120
° 45' W
120
° 45' W
120
° 45' W
120
° 45' W
120
° 45' W
120
° 45' W
120
° 45' W
120
° 45' W
120
° 45' W
120
° 45' W
120
° 45' W
120
° 45' W
120
° 45' W
120
° 45' W
120
° 45' W
Crooked AmphiboliteCrooked AmphiboliteCrooked AmphiboliteCrooked AmphiboliteCrooked AmphiboliteCrooked AmphiboliteCrooked AmphiboliteCrooked AmphiboliteCrooked AmphiboliteCrooked AmphiboliteCrooked AmphiboliteCrooked AmphiboliteCrooked AmphiboliteCrooked AmphiboliteCrooked AmphiboliteCrooked AmphiboliteCrooked AmphiboliteCrooked AmphiboliteCrooked AmphiboliteCrooked AmphiboliteCrooked AmphiboliteCrooked AmphiboliteCrooked AmphiboliteCrooked AmphiboliteCrooked AmphiboliteCrooked AmphiboliteCrooked AmphiboliteCrooked AmphiboliteCrooked AmphiboliteCrooked AmphiboliteCrooked AmphiboliteCrooked AmphiboliteCrooked AmphiboliteCrooked AmphiboliteCrooked AmphiboliteCrooked AmphiboliteCrooked AmphiboliteCrooked AmphiboliteCrooked AmphiboliteCrooked AmphiboliteCrooked AmphiboliteCrooked AmphiboliteCrooked AmphiboliteCrooked AmphiboliteCrooked AmphiboliteCrooked AmphiboliteCrooked AmphiboliteCrooked AmphiboliteCrooked Amphibolite
(Slide Mtn. Group)(Slide Mtn. Group)(Slide Mtn. Group)(Slide Mtn. Group)(Slide Mtn. Group)(Slide Mtn. Group)(Slide Mtn. Group)(Slide Mtn. Group)(Slide Mtn. Group)(Slide Mtn. Group)(Slide Mtn. Group)(Slide Mtn. Group)(Slide Mtn. Group)(Slide Mtn. Group)(Slide Mtn. Group)(Slide Mtn. Group)(Slide Mtn. Group)(Slide Mtn. Group)(Slide Mtn. Group)(Slide Mtn. Group)(Slide Mtn. Group)(Slide Mtn. Group)(Slide Mtn. Group)(Slide Mtn. Group)(Slide Mtn. Group)(Slide Mtn. Group)(Slide Mtn. Group)(Slide Mtn. Group)(Slide Mtn. Group)(Slide Mtn. Group)(Slide Mtn. Group)(Slide Mtn. Group)(Slide Mtn. Group)(Slide Mtn. Group)(Slide Mtn. Group)(Slide Mtn. Group)(Slide Mtn. Group)(Slide Mtn. Group)(Slide Mtn. Group)(Slide Mtn. Group)(Slide Mtn. Group)(Slide Mtn. Group)(Slide Mtn. Group)(Slide Mtn. Group)(Slide Mtn. Group)(Slide Mtn. Group)(Slide Mtn. Group)(Slide Mtn. Group)(Slide Mtn. Group)
Intermontane Belt
Om
ineca B
elt
Quesnel (Quesnellia) Terrane
Eocene
Kamloops Group; volcanicsKamloops Group; volcanicsKamloops Group; volcanicsKamloops Group; volcanicsKamloops Group; volcanicsKamloops Group; volcanicsKamloops Group; volcanicsKamloops Group; volcanicsKamloops Group; volcanicsKamloops Group; volcanicsKamloops Group; volcanicsKamloops Group; volcanicsKamloops Group; volcanicsKamloops Group; volcanicsKamloops Group; volcanicsKamloops Group; volcanicsKamloops Group; volcanicsKamloops Group; volcanicsKamloops Group; volcanicsKamloops Group; volcanicsKamloops Group; volcanicsKamloops Group; volcanicsKamloops Group; volcanicsKamloops Group; volcanicsKamloops Group; volcanicsKamloops Group; volcanicsKamloops Group; volcanicsKamloops Group; volcanicsKamloops Group; volcanicsKamloops Group; volcanicsKamloops Group; volcanicsKamloops Group; volcanicsKamloops Group; volcanicsKamloops Group; volcanicsKamloops Group; volcanicsKamloops Group; volcanicsKamloops Group; volcanicsKamloops Group; volcanicsKamloops Group; volcanicsKamloops Group; volcanicsKamloops Group; volcanicsKamloops Group; volcanicsKamloops Group; volcanicsKamloops Group; volcanicsKamloops Group; volcanicsKamloops Group; volcanicsKamloops Group; volcanicsKamloops Group; volcanicsKamloops Group; volcanics
Cretaceous
intrusives; undivided
Early Jurassic
syenite, monzonite
Late Triassic - Early Jurassic
granodioritic intrusives
Middle to Upper Triassic
Takla Group
volcanics
Mississippian - Permian
Slide Mtn. Terrane
Barkerville Terrane
Proterozoic - Early Paleozoic
Snowshoe Group; pelitic, psammitic schist
Devonian - Mississippian
Quesnel Lake gneiss
Carboniferous - Permian
Black RidersUltramafic Complex
Overlap Assemblage
sediments; Quesnel River Groupsediments; Quesnel River Groupsediments; Quesnel River Groupsediments; Quesnel River Groupsediments; Quesnel River Groupsediments; Quesnel River Groupsediments; Quesnel River Groupsediments; Quesnel River Groupsediments; Quesnel River Groupsediments; Quesnel River Groupsediments; Quesnel River Groupsediments; Quesnel River Groupsediments; Quesnel River Groupsediments; Quesnel River Groupsediments; Quesnel River Groupsediments; Quesnel River Groupsediments; Quesnel River Groupsediments; Quesnel River Groupsediments; Quesnel River Groupsediments; Quesnel River Groupsediments; Quesnel River Groupsediments; Quesnel River Groupsediments; Quesnel River Groupsediments; Quesnel River Groupsediments; Quesnel River Groupsediments; Quesnel River Groupsediments; Quesnel River Groupsediments; Quesnel River Groupsediments; Quesnel River Groupsediments; Quesnel River Groupsediments; Quesnel River Groupsediments; Quesnel River Groupsediments; Quesnel River Groupsediments; Quesnel River Groupsediments; Quesnel River Groupsediments; Quesnel River Groupsediments; Quesnel River Groupsediments; Quesnel River Groupsediments; Quesnel River Groupsediments; Quesnel River Groupsediments; Quesnel River Groupsediments; Quesnel River Groupsediments; Quesnel River Groupsediments; Quesnel River Groupsediments; Quesnel River Groupsediments; Quesnel River Groupsediments; Quesnel River Groupsediments; Quesnel River Groupsediments; Quesnel River Group
black pelitesblack pelitesblack pelitesblack pelitesblack pelitesblack pelitesblack pelitesblack pelitesblack pelitesblack pelitesblack pelitesblack pelitesblack pelitesblack pelitesblack pelitesblack pelitesblack pelitesblack pelitesblack pelitesblack pelitesblack pelitesblack pelitesblack pelitesblack pelitesblack pelitesblack pelitesblack pelitesblack pelitesblack pelitesblack pelitesblack pelitesblack pelitesblack pelitesblack pelitesblack pelitesblack pelitesblack pelitesblack pelitesblack pelitesblack pelitesblack pelitesblack pelitesblack pelitesblack pelitesblack pelitesblack pelitesblack pelitesblack pelitesblack pelites
EKacaEKacaEKacaEKacaEKacaEKacaEKacaEKacaEKacaEKacaEKacaEKacaEKacaEKacaEKacaEKacaEKacaEKacaEKacaEKacaEKacaEKacaEKacaEKacaEKacaEKacaEKacaEKacaEKacaEKacaEKacaEKacaEKacaEKacaEKacaEKacaEKacaEKacaEKacaEKacaEKacaEKacaEKacaEKacaEKacaEKacaEKacaEKacaEKaca
KgKgKgKgKgKgKgKgKgKgKgKgKgKgKgKgKgKgKgKgKgKgKgKgKgKgKgKgKgKgKgKgKgKgKgKgKgKgKgKgKgKgKgKgKgKgKgKgKg
muTrNmuTrNmuTrNmuTrNmuTrNmuTrNmuTrNmuTrNmuTrNmuTrNmuTrNmuTrNmuTrNmuTrNmuTrNmuTrNmuTrNmuTrNmuTrNmuTrNmuTrNmuTrNmuTrNmuTrNmuTrNmuTrNmuTrNmuTrNmuTrNmuTrNmuTrNmuTrNmuTrNmuTrNmuTrNmuTrNmuTrNmuTrNmuTrNmuTrNmuTrNmuTrNmuTrNmuTrNmuTrNmuTrNmuTrNmuTrNmuTrNuTrNvbuTrNvbuTrNvbuTrNvbuTrNvbuTrNvbuTrNvbuTrNvbuTrNvbuTrNvbuTrNvbuTrNvbuTrNvbuTrNvbuTrNvbuTrNvbuTrNvbuTrNvbuTrNvbuTrNvbuTrNvbuTrNvbuTrNvbuTrNvbuTrNvbuTrNvbuTrNvbuTrNvbuTrNvbuTrNvbuTrNvbuTrNvbuTrNvbuTrNvbuTrNvbuTrNvbuTrNvbuTrNvbuTrNvbuTrNvbuTrNvbuTrNvbuTrNvbuTrNvbuTrNvbuTrNvbuTrNvbuTrNvbuTrNvb
LTrJgdLTrJgdLTrJgdLTrJgdLTrJgdLTrJgdLTrJgdLTrJgdLTrJgdLTrJgdLTrJgdLTrJgdLTrJgdLTrJgdLTrJgdLTrJgdLTrJgdLTrJgdLTrJgdLTrJgdLTrJgdLTrJgdLTrJgdLTrJgdLTrJgdLTrJgdLTrJgdLTrJgdLTrJgdLTrJgdLTrJgdLTrJgdLTrJgdLTrJgdLTrJgdLTrJgdLTrJgdLTrJgdLTrJgdLTrJgdLTrJgdLTrJgdLTrJgdLTrJgdLTrJgdLTrJgdLTrJgdLTrJgdLTrJgd
EJsyEJsyEJsyEJsyEJsyEJsyEJsyEJsyEJsyEJsyEJsyEJsyEJsyEJsyEJsyEJsyEJsyEJsyEJsyEJsyEJsyEJsyEJsyEJsyEJsyEJsyEJsyEJsyEJsyEJsyEJsyEJsyEJsyEJsyEJsyEJsyEJsyEJsyEJsyEJsyEJsyEJsyEJsyEJsyEJsyEJsyEJsyEJsyEJsy
Pleistocene volcanics
uPzCuPzCuPzCuPzCuPzCuPzCuPzCuPzCuPzCuPzCuPzCuPzCuPzCuPzCuPzCuPzCuPzCuPzCuPzCuPzCuPzCuPzCuPzCuPzCuPzCuPzCuPzCuPzCuPzCuPzCuPzCuPzCuPzCuPzCuPzCuPzCuPzCuPzCuPzCuPzCuPzCuPzCuPzCuPzCuPzCuPzCuPzCuPzCuPzC
DMQDMQDMQDMQDMQDMQDMQDMQDMQDMQDMQDMQDMQDMQDMQDMQDMQDMQDMQDMQDMQDMQDMQDMQDMQDMQDMQDMQDMQDMQDMQDMQDMQDMQDMQDMQDMQDMQDMQDMQDMQDMQDMQDMQDMQDMQDMQDMQDMQ
PzSPzSPzSPzSPzSPzSPzSPzSPzSPzSPzSPzSPzSPzSPzSPzSPzSPzSPzSPzSPzSPzSPzSPzSPzSPzSPzSPzSPzSPzSPzSPzSPzSPzSPzSPzSPzSPzSPzSPzSPzSPzSPzSPzSPzSPzSPzSPzSPzS
QcQcQcQcQcQcQcQcQcQcQcQcQcQcQcQcQcQcQcQcQcQcQcQcQcQcQcQcQcQcQcQcQcQcQcQcQcQcQcQcQcQcQcQcQcQcQcQcQc
PzShmPzShmPzShmPzShmPzShmPzShmPzShmPzShmPzShmPzShmPzShmPzShmPzShmPzShmPzShmPzShmPzShmPzShmPzShmPzShmPzShmPzShmPzShmPzShmPzShmPzShmPzShmPzShmPzShmPzShmPzShmPzShmPzShmPzShmPzShmPzShmPzShmPzShmPzShmPzShmPzShmPzShmPzShmPzShmPzShmPzShmPzShmPzShmPzShmShuswap Assemblage; undivided metamorphics
uPzBuPzBuPzBuPzBuPzBuPzBuPzBuPzBuPzBuPzBuPzBuPzBuPzBuPzBuPzBuPzBuPzBuPzBuPzBuPzBuPzBuPzBuPzBuPzBuPzBuPzBuPzBuPzBuPzBuPzBuPzBuPzBuPzBuPzBuPzBuPzBuPzBuPzBuPzBuPzBuPzBuPzBuPzBuPzBuPzBuPzBuPzBuPzBuPzB
PSBPSBPSBPSBPSBPSBPSBPSBPSBPSBPSBPSBPSBPSBPSBPSBPSBPSBPSBPSBPSBPSBPSBPSBPSBPSBPSBPSBPSBPSBPSBPSBPSBPSBPSBPSBPSBPSBPSBPSBPSBPSBPSBPSBPSBPSBPSBPSBPSBSnowshoe Group; Bralco Succession
0 10 20 Km
%%%%%%%%%%%%%%%%%%%%%%%%%%%%%%%%%%%%%%%%%%%%%%%%%%
Regional Geology
Eureka Resources Inc.

Eureka Resources Inc. Frasergold Project 15 ___________________________________________________________________________________
___________________________________________________________________________________
ERSi Earth Resource Surveys Inc. Giroux Consultants Ltd.
and lower Jurassic arc volcanics, volcaniclastics and comagmatic intrusive rocks overlain by Jurassic arc-
derived clastics (Monger et al, 1982). The Quesnellia terrane is noted for a prevalence of copper, gold
and molybdenum mines and showings, such as those at Highland Valley, Boss Mountain, QR and
Cariboo Bell - Mt. Polley (Panteleyev et al, 1996).
Jurassic and Cretaceous granite, granodiorite, quartz monzonite, syenodiorite and diorite intrude into
rocks of the Omineca and Intermontane Belts. Small exposures of Tertiary and recent olivine basalt are
also present in the region.
The dominant structures in the region are the northwest trending, shallowly plunging, Eureka Syncline
and Perseus Anticline (Campbell, 1971). South of the Eureka Syncline lies the Boss Mountain anticline,
which is similar in many respects to the Perseus anticline (Campbell, 1989). The Eureka syncline displays
well developed, northeast striking, near vertical extension joints clearly manifested in the drainage
pattern. Southeast of the project area, towards the nose of the syncline, the syncline becomes overturned
to the southwest with axial planes dipping steeply northeast. In addition, northeast of the MacKay River
the northeast limb is overturned to the southwest, although the syncline is upright in the area of the
property.
Basic volcanic rocks of the Takla Group occupy the core of the Eureka Syncline where basalt, augite
porphyry flows, tuffs and volcanic breccias have been metamorphosed to a low grade. The contact with
the underlying sediments of the Quesnel River Group has been described as a fault (Bloodgood, 1987).
Regional dynamothermal metamorphism affected all of the pre-Tertiary rocks in the area. The lowest
grades are seen along the Horsefly River road where clastic textures are preserved. In the Eureka
Syncline, the metamorphic grade of all units increases towards the Perseus and Boss Mountain
anticlines. Large areas reach medium grades of metamorphism (amphibolite facies) and some rocks in
the cores of the anticlines reach the kyanite-staurolite-fibrolite zone and are associated with pegmatites
(Campbell, 1971). The age of the folding and metamorphism is considered to be Jurassic to early
Cretaceous.
The northwest trending MacKay River valley marks a major zone of vertical or near vertical fracturing.
Here the upper Triassic Quesnel River Group is sandwiched between two more competent units; younger
intrusives and volcaniclastics to the south and older amphibolites, schists and gneisses to the north and
east. In order to accommodate the transition from upright to overturned limb, shearing and faulting have
been concentrated in the incompetent phyllite units striking along the valley (Campbell, 1989).
7.2. Property Geology
The geology of the Frasergold property has been mapped in by Kerr Dawson & Associates (1981), G.
Belik & Associates, 1984, Read (1988), Campbell (1989), Kerr and Campbell (1990) and Campbell et al
(1991) and is shown in Figure 5. The following discussion is based on this information.

DWG: 521-15-6 Scale 1:20,000 Figure: 5
Eureka Resources Inc.
Frasergold Project
Cariboo Mining Division, B.C.
June 15, 2015
Property Geology
Geology by Kerr Dawson & Assoc. (1981)
KP - knotted phyllite, black phyllite with abundant carbonate porphyryroblastsuTRai - black phyllite, greenschist, quartz sericite schistMub - coarse grained pyroxene plagioclase sillMsub - highly sheared, marginal phase of sill
Geology by G.Belik & Assoc. (1984)
TRv - greenstone, breccia tuffTRvs - interbedded greenschist, black phyllite and quartziteTRs - black phyllite with minor limestone and sandstoneTRSi - black phyllite with abundant iron carbonate knots

Eureka Resources Inc. Frasergold Project 16 ___________________________________________________________________________________
___________________________________________________________________________________
ERSi Earth Resource Surveys Inc. Giroux Consultants Ltd.
The property is located within the middle to upper Triassic Quesnel River Group and is underlain by a
thick sequence of dark grey to black; lustrous phyllites with iron-bearing carbonate porphyoblasts, locally
referred to as the “knotted phyllite”. The knotted phyllite contains minor intercalations of grey phyllite, thin
lenses and layers of light grey massive to phyllitic siltstone and thin lenses of grey silty limestone.
Underlying this sequence is a grey silty and locally calcareous phyllite. At the base of the knotted phyllite
unit in the Northwest extension area of the Frasergold property lies a unit of pale carbonate-quartz-
sericite-chlorite schist which are possibly metavolcaniclastics. The rock units described below occur in
descending stratigraphic order.
7.2.1 Silty limestone
Medium grey, vaguely bedded silty limestone occurs as lenses in all rock types except the silty
calcareous phyllite where it lies within a few meters of the top. Lenses of the grey silty limestone are
generally less than one meter thick. The medium grey color and weakly bedded nature distinguish this
unit from the silty calcareous phyllite.
7.2.2 Siliceous siltstone
These rocks are distinguished from other units by their light grey color and coarse sandy texture. Thin
sections have determined that the protolith was most likely a quartz-rich sandstone or quartzite. The
original bedding features are distinct, defined by thin grey porphyroblastic and non-porphyroblastic
phyllite partings. Carbonate is commonly absent. The main horizons occur as erratic lenses within the
knotted phyllite with thicknesses ranging from one to 25 meters.
7.2.3 Grey phyllite
Medium to dark grey in color, this unit is distinguished from the knotted phyllite by the lack of carbonate
porphyroblasts. In drill core the apparent thickness ranges from one to 23 meters but averages less than
five meters. The thinness and lenticular nature of this unit have resulted in an apparent lack of continuity
even between closely space drill holes. The distribution of this unit, combined with that of the siliceous
sediment, divides the knotted phyllite into upper and lower packages.
7.2.4 Knotted phyllite
This unit is medium to dark grey, weakly to moderately laminated phyllite with 10 to 20% Fe-carbonate
porphyroblasts varying in size from two millimeters to two centimeters. The porphyroblasts are elongated
within the foliation planes and lie in a groundmass of muscovite, quartz, colorless carbonate, minor albite
and graphite. This unit is at least 200 meters thick and has been divided by Read (1988) into two
packages: a lower package, 40 to 75 meters thick, which lies between the silty calcareous phyllite and a
zone rich in lenses and layers of grey phyllite and siliceous metasediment; and an upper package of more
than 75 meters thickness which lies above the zone rich in lenses and layers of grey phyllite and siliceous

Eureka Resources Inc. Frasergold Project 17 ___________________________________________________________________________________
___________________________________________________________________________________
ERSi Earth Resource Surveys Inc. Giroux Consultants Ltd.
metasediment. Surface weathering gives this rock unit a distinct brown mottling texture. In fresh rock the
texture is recognized but is not as easily distinguished as it is on a weathering surface.
7.2.5 Carbonate-quartz-sericite-chlorite schist
About 30 to 40 meters of carbonate-quartz-sericite-chlorite schist lie between the knotted phyllite and
silty, calcareous phyllite in the Northwest Extension. The rock unit is light green in color, is well banded to
finely laminated and has a coarse granular aspect, locally resembling quartz pebble tuffs. White coarse
grain clasts of carbonate, probably dolomite, are present in a matrix of sericite and clinochlore and quartz
is present as fine grain inclusions in the carbonate grains and also in fine laminations. These rocks are
considered by Campbell (AR 15715) to be the metamorphosed product of impure calcareous sediments
and by others to be metamorphosed volcaniclastics.
7.2.6 Silty, calcareous phyllite
This rock is typically a light grey to dark grey color, is well-laminated and has calcareous horizons to 30
centimeters in thickness. The calcareous sections which comprise a quarter to a third of the unit
distinguish this unit from the grey phyllite. Drill core and surface exposures indicate a thickness of at least
25 meters with no base exposed.
7.3. Structural Geology
Gold mineralization at the Frasergold property is hosted by a fine-grained turbiditic sequence that is
dominated by black carbonaceous phyllite with local thin interbeds of metasiltstone, and more rarely, fine
grained metasandstone. The sequence forms part of the Middle to Late Triassic age Nicola Group of the
Quesnel Terrane that lies directly on the Crooked Amphibolite, which in turn is structurally emplaced on
the underlying Barkerville Terrane by the Eureka Thrust (Panteleyev et al., 1996; Bloodgood, 1987,
1990). All of these features are affected by the regional, northwest trending Eureka syncline, an open,
structurally late fold, the axis of which passes beneath Eureka Peak to the southwest of the deposit. The
deposit lies on the northeast limb of the syncline. Bedding (S0) in the Frasergold deposit area dips mainly
moderately to shallowly to the southwest, although varies locally to northeast dips due to the effects of D2
folds (Rhys, 2007). Regional mapping indicates that the overall sequence is upright, although some early,
relatively minor isoclinal folds are present. The Frasergold deposit occurs on the northeast limb of the
regional Eureka Syncline (Bloodgood, 1987, 1990).
Regionally, two dominant phases of deformation affect rocks in the Quesnel Terrane. These are
equivalent to the principal D1 and D2 deformation events recognized at Frasergold . Phase 1 structures
(D1 ) produced a penetrative slaty to phyllitic cleavage (S1 ) that is axial planar to generally east to
northeast verging , tight to isoclinal, generally northwest trending F1 folds and shear zones. The phase 1
(D1) event is associated with emplacement of the Nicola Group rocks in the Quesnel Terrane onto the
Barkerville Terrane along the Eureka Thrust (Panteleyev et al., 1996; Rees; 1987; Bloodgood, 1987). D1
Eureka Resources Inc. Frasergold Project 18 ___________________________________________________________________________________
___________________________________________________________________________________
ERSi Earth Resource Surveys Inc. Giroux Consultants Ltd.
was accompanied by, and locally outlasted by, peak regional metamorphism. Phase 2 structures
regionally include the Eureka Peak syncline, which openly refolds both the earlier S1 foliation and
associated folds and the D1 Eureka Thrust (Bloodgood, 1987). Phase 2 structures regionally correspond
with the D2 event documented here, and the associated S2 foliation at Frasergold, which is axial planar to
the Eureka Syncline (Bloodgood, 1987, 1990, Rhys, 2007). Late north to northeast trending crenulation
cleavage (S3) and kink bands formed later and are also locally evident in outcrops at Frasergold.
7.4. Quartz Veins and Gold Mineralization
Gold mineralization on the Frasergold property occurs within, or is spatially associated with, sets of white
quartz + Fe-carbonate + muscovite + pyrite veins that are developed in the knotted Fe-carbonate
porphyroblastic carbonaceous phyllite unit. The veins form complex sets and networks that are developed
in concentrated zones several meters to tens of meters wide. Zones of veining are generally stratabound
and overall have shallow to moderate westerly dips which are usually parallel to S0/S1. Apart from the
presence of the carbonate porphyroblasts in the knotted phyllite unit and widespread Fe-carbonate
alteration of siltstone and sandstone lamina which extend well outside the immediate areas of veining, no
visually obvious alteration affects the host phyllitic sediments at Frasergold in areas of gold
mineralization, although slightly elevated disseminated pyrite content was observed near some veins
(Rhys, 2007).
Two general styles of veining are recognized in mineralized areas at Frasergold; ribbon veins and
dilational veins (Rhys, 2007).
Ribbon veins refer to sets of approximately S0/S1 parallel quartz veins and veinlets which vary in width
between stringers to veins up to 0.3 m thick that area traceable generally in crosscuts for several meters.
These are by far the most abundant style of veining in the underground workings and surface exposures.
They comprise blocky, recrystallized white quartz with minor Fe-carbonate. Muscovite may form narrow
silver to grey colored selvages on vein margins. These veins form subparallel sets that are affected both
by D1 and D2 strain. The veins are often transposed and boudinaged in the plane of S1, locally with the
development of internal S1-parallel stylolites. Like S1, the veins are affected by F2 folds, and vary in
orientation across F2 fold limbs.
Dilation veins refer to larger, 15-50 cm thick quartz-carbonate veins that are developed at moderate to
high angles to S0/S1. These veins generally have higher Fe-carbonate content than the smaller
concordant ribbon veins but contain the same blocky recrystallized white quartz fill. Yellow-brown, coarse,
blocky Fe-carbonate typically occurs as clots, bands and selvages on veins and contains disseminated
pyrite. Although thicker than the narrower and more abundant concordant veins, these veins are also
discontinuous and may terminate laterally or vertically. Rare fibrous quartz-Fe-carbonate textures on vein
margins that are indicative of dilational carbonate-quartz growth at high angles to vein walls and sharp
vein contacts with wall rock suggest dilational opening (Rhys, 2007), not replacement of wall rock textures

Eureka Resources Inc. Frasergold Project 19 ___________________________________________________________________________________
___________________________________________________________________________________
ERSi Earth Resource Surveys Inc. Giroux Consultants Ltd.
as has previously been suggested (Campbell et al, 1991). These thicker veins are openly folded by folds
with S2 foliation axial planar. Veins of this style are reported by Campbell et al. (1991) to be of higher
grade than the S1 foliation parallel veins, probably due to their generally higher Fe-carbonate-pyrite
content.
The concordant S0/S1 ribbon veins and the thicker, discordant veins join one another without crosscutting
relationships, have the same mineralogy and are equally as deformed, suggesting that they are all part of
a single vein generation resulting from a single veining episode (Rhys et al, 2009). Studies are currently
ongoing to further elucidate the structural controls of the vein system and its gold mineralization.
8. Deposit type
Gold mineralization at the Frasergold property is classified as an orogenic lode-gold deposit type. Lode-
gold deposits generally occur in metamorphic terranes delineated by a regional fault system. The
deposits are often regularly spaced along a zone hundreds of kilometers long, although economic ores
may only be present over a short distance. Many of the most productive ore bodies of this type exceed
one kilometer in vertical extent with little change in gold grade with depth (Goldfarb et al, 1986).
There is a spatial association of this type of gold deposit with greenschist grade of metamorphism,
possibly due to the large fluid volume required during the amphibolite and/or greenschist transition
(Goldfarb et al, 2005). First order faults provide conduits for massive volumes of auriferous fluids to
migrate through the rocks while second and third order faults are the sites of mineral deposition. World-
class gold deposits in metamorphic terranes are generally 2 to 10 kilometers long, contain 2 - 5%
sulphide minerals and have gold to silver ratios from approximately 5:1 to 10:1. Examples of this deposit
type include Kirkland Lake, Hollinger-McIntyre, Campbell-Red Lake and Bralorne-Pioneer camps.
Table 7.1 outlines the characteristics of the Frasergold deposits as well as they are known. These
characteristics place the Frasergold mineralization in the class of orogenic gold deposits as defined by
Groves et al (1998) and reviewed by Goldfarb et al (2001 and 2005) and Groves et al (2003). This class
of gold deposits has been described and reported on at length by numerous authors. The deposit type
has worldwide significance, accounting for 12 of the 32 gold camps in the world having production or
resources exceeding 600 tonnes of gold or approximately 19 million ounces (Rhys and Lewis, 2004).
There are at least two other similar gold occurrences along the eastern margin of the Quesnellia terrane
in central British Columbia; at Spanish Mountain (Minfile No. 093A043), about 54 km to the northwest,
and at Hixon, (MEMPR Minfile Nos. 093G014 and 093G015), about 180 km northwest of the Frasergold
property.
The Spanish Mountain occurrence is currently being explored and developed by Spanish Mountain Gold
Ltd. The main mineralized zones consist of gold-bearing veins and stockworks in a pyritic and graphitic
shaley siltstone. This occurrence differs in at least two respects from that at Frasergold; one, is that

Eureka Resources Inc. Frasergold Project 20 ___________________________________________________________________________________
___________________________________________________________________________________
ERSi Earth Resource Surveys Inc. Giroux Consultants Ltd.
strong carbonate-silica-pyrite alteration, described as listwanitic by Bloodgood (1990), is pervasive. The
second is that mineralization probably post-dated the regional metamorphism (Bloodgood, 1990).
The occurrences at Hixon consist of gold-bearing quartz veins and stringers cutting highly altered quartz-
sericite schist. The Minfile No. 093G015 occurrence, known as 'Quesnel Quartz', produced 6,438 grams
gold and 8,553 grams silver from 2,048 tonnes mined in the period 1932 to 1939 (MEMPR Minfile
database). This deposit is associated with a highly sheared and hydrothermally altered, northwest
trending zone in which greenstones are in contact with quartz-sericite schists of the Upper Triassic to
Lower Jurassic Takla Group. The alteration is described as carbonatization (MEMPR Minfile database).
Table 8.1 Characteristics of the Frasergold Property
Parameter or Feature Characteristics of Frasergold gold mineralization
host rocks turbidite with minor volcaniclastic component (Quesnel River Group)
age of host rocks Upper Triassic
metamorphism greenschist facies of classic Barrovian-type facies series (argillite, phyllite,
siltite, fine grained psammite)
age of metamorphism Jurassic - early Cretaceous
tectonic setting within Quesnellia terrane proximal to boundary with Omineca terrane
local structure situated on upright limb of regional syncline (Eureka syncline)
tectonics predominant structure, the Eureka syncline, is compressive with interformational
slip, shear and boudinage subparallel to the compositional and/or penetrative
foliation evident on its limb. This is manifested in the ribbon-vein zone(s) that
comprise the Frasergold zone of mineralization.
spatially associated
intrusive rocks
no intrusive units that are spatially related to the Frasergold mineralized belt are
recognized. The nearest intrusive is a small stock of granodioritic composition of
possible Cretaceous age in the core of the Eureka syncline, ~ 1 to 2 km
southwest of the Frasergold zone
deposit mineralogy quartz-dominant vein sets or system with ~2 - 7% predominantly iron sulphides
(mainly pyrite with subordinate pyrrhotite) and up to 20% carbonate minerals.
The sulphides and carbonates are commonly segregated on the margins of
quartz veins. Native gold is not uncommon. Lack of association of gold with
other precious, base or toxic (As, Sb, Hg) metals.
deposit structure vein sets are controlled by structures developed largely contemporaneous to
the regional metamorphism and deformation
alteration hydrothermal alteration adjacent to the mineralized vein sets in the form of
bleaching or development of phyllosilicates is not recognized

Eureka Resources Inc. Frasergold Project 21 ___________________________________________________________________________________
___________________________________________________________________________________
ERSi Earth Resource Surveys Inc. Giroux Consultants Ltd.
9. Exploration
Exploration activities conducted by other companies are described in detail in Section 6.1, Prior to 2007
and Section 6.2, Historical Drill Results. In October, 2006 Hawthorne entered into an Option Agreement
with Eureka on the Frasergold property and undertook two exploration programs in 2007 and 2008.
Details of the sampling method and approach are contained in Section 11 (Sample Preparation, Analyses
and Security).
9.1. 2007 Program
From January to April, Hawthorne management began planning for completion of an airborne magnetic,
electromagnetic and radiometric geophysical survey over the Frasergold property by reviewing property
boundaries, geological structure and potential geophysical survey companies.
During the spring of 2007, Hawthorne began construction of a large 30-person exploration camp, utilizing
a compound of trailers for accommodation, drilling a water well for drinking and camp water, constructing
a sewage field, and water lines from the well. The sewage system included a septic system for all waste
water. The camp facility consisted of accommodations for up to 30 people within a trailer unit. Other
buildings included a large core logging and core cutting facility with the geology office attached, generator
buildings to house two large generators, a large garage for heavy equipment, and smaller ancillary
buildings to store tools and equipment. A large fuel system consisted of a series of above ground fuel
storage tanks with concrete berms in place for safety.
Hawthorne exploration crews and geologists first arrived on site in mid June 2007 and worked throughout
the season until mid December. Their initial work entailed a physical review of the property and ground-
truthing historical drill holes, along with reconnaissance soil and rock sampling and completion of minor
trenching programs. The crew also reviewed the historical underground workings of the Main Zone and
oversaw the rehabilitation of the workings, including rock bolting. Rehabilitation of the adit was performed
by D.R. Gunning, P.Eng. of D.R. Gunning Consulting, Langley, B.C. and C. Blagdon (miner/shiftboss) of
Goldbridge, B.C.
On completion of the rehabilitation work, the crews took channel samples throughout the workings and
supervised underground bulk sampling. The bulk samples were collected in large pails and sent to
Process Research Associates (PRA), while channel samples were sent to International Plasma Labs Ltd.
(IPL) in Richmond, B.C.
In addition to the support staff, four heavy equipment contracting companies were used at various times
throughout the exploration program, including:
1. G. & S. Logging Co. Ltd., which supplied a 2054 Excavator and 850j Caterpillar.

Eureka Resources Inc. Frasergold Project 22 ___________________________________________________________________________________
___________________________________________________________________________________
ERSi Earth Resource Surveys Inc. Giroux Consultants Ltd.
2. Harpers Lake Development Ltd., which assisted with building drill access roads, hauling fill for the roads and digging trenches.
3. Can-Co Contracting, which hauled gravel and rock for road construction.
4. Horsefly Bay Construction Ltd., which provided a CAT 312 Excavator, D7 CAT and Dump Truck for drill access road construction, drill pad construction, hauling fill for the roads and snow clearing late in the year.
In early September SCS Diamond Drilling of Merritt, B.C. used one diamond drill to conduct a drill
program on the property with the program running from September 3 through to December 10 and
consisting of sixteen (16) HQ diamond drill holes.
In conjunction with the drilling, Aeroquest International Advanced Airborne Geophysics completed a
helicopter-borne geophysical survey on the property, with the program running from September 6 through
to the 13.
Rathbone & Goodrich, B.C.& Canada Land Surveyors (“Rathbone”), based in Williams Lake, performed a
number of survey related tasks. This included establishing sufficient ground control to convert the historic
work in the local Mine Grid and in NAD27 to NAD83 coordinates, and establishing ground control points
and aerial photo target points for a subsequent aerial topographic survey.
Eagle Mapping Services Ltd. of Port Coquitlam, B.C. acquired high resolution aerial photographs and
generated orthophotos and a topographic map with 5m contour interval over most of the property, and 1m
contour interval over the primary exploration area of the known mineralized zones.
9.2. Results of 2007 Programs
9.2.1 Surface Rock Sampling
Figure 6 is a plot of gold values (ppm) in the surface rock samples which are described in Appendix I. Of
the 198 rock samples, only 10 reported in excess of 0.20 g/t Au. All of these were knotted phyllites with
quartz veining. The maximum value reported was sample 135844 located at the northwest end of the
known limits of the knotted phyllite unit and which reported 5.17 g/t Au.
9.2.2 Trenching
Seven trenches, totaling 345 meters in length, were selected based on historical drill hole data and slope
stability. These were dug to identify structure and lithology, with the view of replicating or verifying
historical drill data, as well as to provide for new potential areas for diamond drill hole exploration. The
trench locations are shown Figure 7. The trench sample descriptions and assay results of these trench
samples are listed in Appendix II.
The trenches were dug to varying depths of 0.5 ‐ 1.5 meters, depending on local overburden thickness.
The location, elevation, length, depth, width, approximate material removed from each trench, as well as
total number of channel samples collected from each trench is as follows:

Frasergold Property Boundary
DWG: 521-15-8 Figure: 6
Eureka Resources Inc.
Frasergold Project
Cariboo Mining Divison, B.C.
Scale 1:30,000
Au (ppm)
0.5 to 5.17 (3)
0.05to 0.5 (17)
0.02to 0.05 (23)
0.01to 0.02 (73)
0 to 0.01 (82)
2007 Surface Rock SamplesAu (ppm)
June 16, 2015
500 0 500 1000 1500 m
Scale: 1:30,000
known gold mineralization
UTM 10 NAD83 Contour interval = 20m

5300
Bot
tom
Above
Adi
t 1
5450
Bot
tom
5450
Top
Above
Adi
t 2
5300
Top
T100
DWG: 521-15-9 Figure: 7
Eureka Resources Inc.
Frasergold Project
Cariboo Mining Divison, B.C.
Scale 1:2,500June 16 , 2015
Channel samples with0.02 ppm or more Au
5 to 8.14 (3)
2 to 5 (3)0.2 to 2 (23)
Location of 2007 Trenchesand Anomalous Gold Values
underground workings
trench
UTM 10 NAD83 Contour interval = 20m
50 0 50 100 150 m
Scale: 1:2,500
Trench channel sampleswith > 0.2 ppm Au
known gold mineralization

Eureka Resources Inc. Frasergold Project 23 ___________________________________________________________________________________
___________________________________________________________________________________
ERSi Earth Resource Surveys Inc. Giroux Consultants Ltd.
Trench 53+00 (Top), located from 5797566m N and 664975m E, elevation 1619.597m to 5797625m N
and 665019m E, elevation 1594.017m, total length of 75 meters, average depth of 1.5 meters, average
width of 5m, approximately 562.5 m3 of material removed, total number of channel samples collected was
74.
Trench 53+00 (Bottom), located from 5797805m N and 665154.4m E, elevation 1523.053m to 5797860m
N and 665198.1m E, elevation 1502.73m, total length of 70 meters, average depth of 1.5 meters, and
average width of 5m, approximately 525m3 of material removed, total number of channel samples
collected was 57.
Trench Above Adit 1, located from 5797726m N and 665232m E, elevation 1519.689m to 5797736m N
and 665243.5m E, elevation 1515.907m, total length of 30 meters, average depth of 0.5 meters, and
average width of 35 meters, approximately 212.5m3 of material removed, total number of channel
samples collected was 16.
Trench Above Adit 2, located from 5797710m N and 665236m E, elevation 1522.376m to 5797729m N
and 665256.9m E, elevation 1513.976m, total length of 30 meters, average depth of 0.5 meters, and
average width of 35 meters, approximately 212.5m3 of material removed, total number of channel
samples collected was 29.
Trench 54+50 (Top), located from 5797462m N and 665134m E, elevation 1607.143 to 5797535m N and
665180.8m E, elevation 1581.312m, total length of 90 meters, average depth of 1.5 meters, and average
width of 5m, approximately 675m3 of material removed, total number of channel samples collected was
45.
Trench 54+50 (Bottom), located from 5797657m N and 665254m E, elevation 1532.644m to 5797680m N
and 665273m E, elevation 1519.563m, total length of 35 meters, average depth of 1.5 meters, and
average width of 5m, approximately 262.5m3 of material removed, total number of channel samples
collected was 31.
Trench T100, located from 5797237m N and 665584m E, elevation 1524.633m to 5797244m N and
665593m E, elevation 1519.976m, total length of 15 meters, average depth of 0.5 meters, average width
of 3m, approximately 22.5m3 of material removed, total number of channel samples collected was 16.
All of the samples were of knotted phyllite. Of the 269 samples 29 reported in excess of 0.20 g/t Au and
these are highlighted in Figure 7. The highest value reported was 8.13 g/t Au collected in the trench
above the adit entrance.
9.2.3 Underground Channel Sampling
Following the initial rehabilitation of the underground workings, the exploration crew laid out a well defined
underground sampling site program, using a predetermined location at the portal entrance to begin
measurements from. From this predetermined measured location, a total of 115 sample sites were

Eureka Resources Inc. Frasergold Project 24 ___________________________________________________________________________________
___________________________________________________________________________________
ERSi Earth Resource Surveys Inc. Giroux Consultants Ltd.
chained off along the walls of the workings at approximately every two meters, depending on safety and
underground conditions as well as access. A total of 211 underground channel samples were collected
from the 115 sites, located in Figure 8.
Appendix III lists the assay results of these samples. Two conventional fire assays and a single screened
total metallic assay procedures were performed on each of the samples. Figure 9 compares the average
of the two fire assays versus the screened total metallic assay. Except for one high grade sample
(average fire assay 95.305 g/t Au vs screened total metallic assay 37.77 g/t Au) the assay results
approach a 1:1 relationship.
The results of the channel sampling within the underground workings to validate the results obtained from
surface drilling, including a number of high grade gold samples. The results indicate good continuity of
gold mineralization along strike to the northwest on an azimuth of approximately 310°, with the width of
the zone of interest being approximately 30 meters.
Screened total metallic assay – Au g/t
Ave
rage
fire
ass
ay –
Au
g/t
Figure 9. Underground channel samples; average fire assay vs screened total metallic assay, Au g/t

665260m
E
665240m
E
665220m
E
665200m
E
5797640m N
DWG: 521-15-10 Figure: 8
Eureka Resources Inc.
Frasergold Project
Cariboo Mining Divison, B.C.
Scale 1:500June 17, 2015
2007 Underground WorkBulk Sampling and Channel Sampling
underground adit outline
2007 bulk sample
2007 channel sample

Eureka Resources Inc. Frasergold Project 25 ___________________________________________________________________________________
___________________________________________________________________________________
ERSi Earth Resource Surveys Inc. Giroux Consultants Ltd.
9.2.4 Underground Bulk Sampling
Eleven bulk samples were collected from the underground workings, distributed throughout the
underground workings and recorded as BS‐1 through BS‐11. The location of the bulk sample sites were
recorded with regard to adit reference, as well as in NAD83 coordinates and shown in Figure 8.
The objective of the bulk sampling analysis was to determine the average head grade through the
mineralized zone exposed in the Main Zone adit. Two analytical techniques were used; cyanide leach
assays performed on 8 samples (Table 9.3.4a) and metallic Au assaying performed on 11 samples (Table
9.3.4b).
Table 9.3.4a Assay Results of 2007 Bulk Sampling - Head Grade by Cyanide Leaching Method
Sample
Sub-sample
Weight Slurry Au Assay Head Grade (Au g/t)
Slurry (g)
Solids (g)
Density % solid
PLS (mg/L) mg
Solids (g/t)
BS1
CutA 732 291 39.73 0.02 0.0088 0.04 0.07
CutB 733.41 288 39.26 0.02 0.0089 0.04 0.07
CutC 757.89 300 39.64 0.02 0.0091 0.04 0.07
Subtotal 879 0.02 0.0269
Total 126700 50099 39.54 0.07
BS2
CutA 743.94 353 47.45 1.14 0.4457 0.10 1.36
CutB 729.75 346 47.37 1.15 0.4417 0.11 1.39
CutC 770.71 362 46.91 1.16 0.4746 0.14 1.45
Subtotal 1060 1.15 1.3620
Total 103300 48804 47.24 1.40
BS3
CutA 716.88 220 30.75 0.1 0.0496 0.38 0.61
CutB 682.1 211 30.86 0.1 0.0472 0.39 0.61
CutC 739.78 228 30.85 0.11 0.0563 0.43 0.68
Subtotal 659 0.10 0.1531
Total 127100 39172 30.82 0.63
BS4
CutA 790.94 341 43.07 2.84 1.2789 0.99 4.74
CutB 796.68 343 43.05 2.86 1.2976 1.00 4.78
CutC 761.93 328 43.11 3.04 1.3178 1.00 5.01
Subtotal 1012 2.91 3.8943
Total 112500 48459 43.07 4.84
BS5
CutA 769.12 288 37.49 0.59 0.2837 4.61 5.59
CutB 801.65 301 37.59 0.64 0.3202 4.34 5.40
CutC 790.28 296 37.50 0.65 0.3210 4.23 5.31
Subtotal 886 0.63 0.9249
Total 129600 48635 37.53 5.43
BS6 CutA 738.25 294 39.79 0.24 0.1067 0.42 0.78
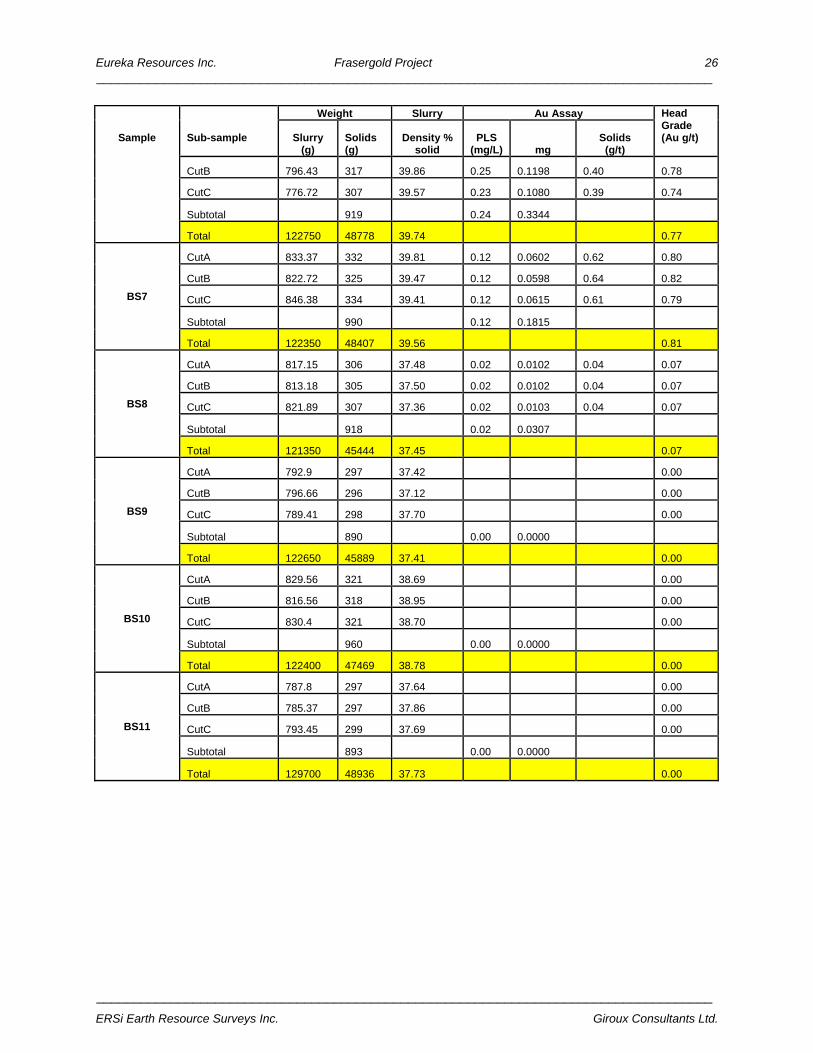
Eureka Resources Inc. Frasergold Project 26 ___________________________________________________________________________________
___________________________________________________________________________________
ERSi Earth Resource Surveys Inc. Giroux Consultants Ltd.
Sample
Sub-sample
Weight Slurry Au Assay Head Grade (Au g/t)
Slurry (g)
Solids (g)
Density % solid
PLS (mg/L) mg
Solids (g/t)
CutB 796.43 317 39.86 0.25 0.1198 0.40 0.78
CutC 776.72 307 39.57 0.23 0.1080 0.39 0.74
Subtotal 919 0.24 0.3344
Total 122750 48778 39.74 0.77
BS7
CutA 833.37 332 39.81 0.12 0.0602 0.62 0.80
CutB 822.72 325 39.47 0.12 0.0598 0.64 0.82
CutC 846.38 334 39.41 0.12 0.0615 0.61 0.79
Subtotal 990 0.12 0.1815
Total 122350 48407 39.56 0.81
BS8
CutA 817.15 306 37.48 0.02 0.0102 0.04 0.07
CutB 813.18 305 37.50 0.02 0.0102 0.04 0.07
CutC 821.89 307 37.36 0.02 0.0103 0.04 0.07
Subtotal 918 0.02 0.0307
Total 121350 45444 37.45 0.07
BS9
CutA 792.9 297 37.42 0.00
CutB 796.66 296 37.12 0.00
CutC 789.41 298 37.70 0.00
Subtotal 890 0.00 0.0000
Total 122650 45889 37.41 0.00
BS10
CutA 829.56 321 38.69 0.00
CutB 816.56 318 38.95 0.00
CutC 830.4 321 38.70 0.00
Subtotal 960 0.00 0.0000
Total 122400 47469 38.78 0.00
BS11
CutA 787.8 297 37.64 0.00
CutB 785.37 297 37.86 0.00
CutC 793.45 299 37.69 0.00
Subtotal 893 0.00 0.0000
Total 129700 48936 37.73 0.00

Eureka Resources Inc. Frasergold Project 27 ___________________________________________________________________________________
___________________________________________________________________________________
ERSi Earth Resource Surveys Inc. Giroux Consultants Ltd.
Table 9.3.4b Assay Results of 2007 Bulk Sampling - Head Grade by Metallic Assay
Sample Screen
Tyler Mesh Weight
(g)
Au
g/t mg
BS1
+150 2.60 0.01 0.000
-150A 302.56 0.07 0.021
-150B 355.01 0.03 0.011
-150C 329.78 0.06 0.020
-150 subtotal 987.35 0.05 0.052
Total 989.95 0.05 0.052
BS2
+150 2.85 7.12 0.020
-150A 293.50 0.64 0.188
-150B 302.75 1.00 0.303
-150C 381.15 0.95 0.362
-150 subtotal 977.40 0.87 0.853
Total 980.25 0.89 0.873
BS3
+150 18.66 2.02 0.038
-150A 258.88 1.95 0.505
-150B 313.65 1.56 0.489
-150C 397.63 1.93 0.767
-150 subtotal 970.16 1.82 1.762
Total 988.82 1.82 1.799
BS4
+150 5.86 211.32 1.238
-150A 336.77 5.06 1.704
-150B 318.77 5.18 1.651
-150C 287.76 4.78 1.375
-150 subtotal 943.30 5.02 4.731
Total 949.16 6.29 5.969
BS5
+150 4.74 115.77 0.549
-150A 328.34 7.34 2.410
-150B 353.80 8.88 3.142
-150C 290.44 6.53 1.897
-150 subtotal 972.58 7.66 7.448
Total 977.32 8.18 7.997
BS6
+150 19.30 6.46 0.125
-150A 286.90 0.49 0.141
-150B 309.57 0.53 0.164
-150C 340.80 0.52 0.177
-150 subtotal 937.27 0.51 0.482
Total 956.57 0.63 0.607
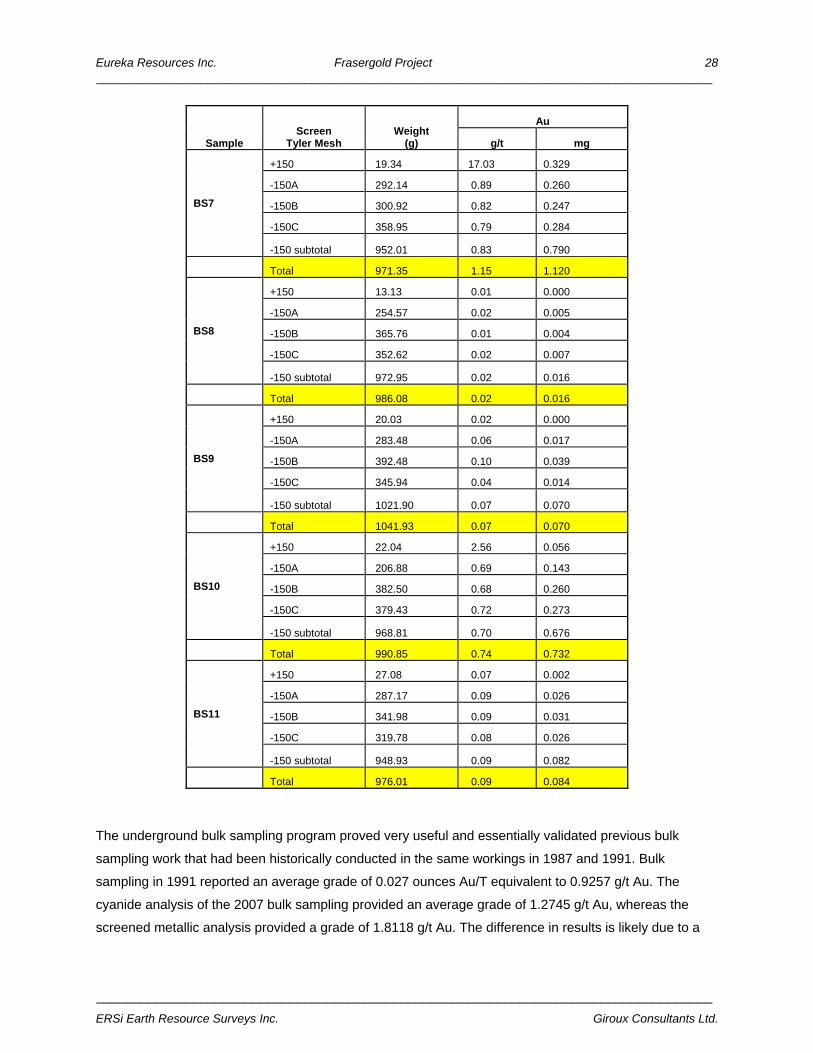
Eureka Resources Inc. Frasergold Project 28 ___________________________________________________________________________________
___________________________________________________________________________________
ERSi Earth Resource Surveys Inc. Giroux Consultants Ltd.
Sample Screen
Tyler Mesh Weight
(g)
Au
g/t mg
BS7
+150 19.34 17.03 0.329
-150A 292.14 0.89 0.260
-150B 300.92 0.82 0.247
-150C 358.95 0.79 0.284
-150 subtotal 952.01 0.83 0.790
Total 971.35 1.15 1.120
BS8
+150 13.13 0.01 0.000
-150A 254.57 0.02 0.005
-150B 365.76 0.01 0.004
-150C 352.62 0.02 0.007
-150 subtotal 972.95 0.02 0.016
Total 986.08 0.02 0.016
BS9
+150 20.03 0.02 0.000
-150A 283.48 0.06 0.017
-150B 392.48 0.10 0.039
-150C 345.94 0.04 0.014
-150 subtotal 1021.90 0.07 0.070
Total 1041.93 0.07 0.070
BS10
+150 22.04 2.56 0.056
-150A 206.88 0.69 0.143
-150B 382.50 0.68 0.260
-150C 379.43 0.72 0.273
-150 subtotal 968.81 0.70 0.676
Total 990.85 0.74 0.732
BS11
+150 27.08 0.07 0.002
-150A 287.17 0.09 0.026
-150B 341.98 0.09 0.031
-150C 319.78 0.08 0.026
-150 subtotal 948.93 0.09 0.082
Total 976.01 0.09 0.084
The underground bulk sampling program proved very useful and essentially validated previous bulk
sampling work that had been historically conducted in the same workings in 1987 and 1991. Bulk
sampling in 1991 reported an average grade of 0.027 ounces Au/T equivalent to 0.9257 g/t Au. The
cyanide analysis of the 2007 bulk sampling provided an average grade of 1.2745 g/t Au, whereas the
screened metallic analysis provided a grade of 1.8118 g/t Au. The difference in results is likely due to a

Eureka Resources Inc. Frasergold Project 29 ___________________________________________________________________________________
___________________________________________________________________________________
ERSi Earth Resource Surveys Inc. Giroux Consultants Ltd.
number of factors, including the different analytical techniques, the ‘nugget’ effect within the veins and
wall rock material collected, as well as the sample size used to complete the two different analytical
techniques.
9.3. 2008 Program
The 2008 year began the compilation and digitally archiving all formerly collected data. Reviews of the
data demonstrated that it would be prudent to conduct an assay result confirmation study to determine if
there was a benefit in conducting full screen metallic assays on formerly fire assayed samples and, if so,
what procedure should be invoked. The study was conducted on small, specific mineralized intersections
within drill holes where mineralization would be expected. A total of 213 samples were re‐run using a
screen metallic fire assay technique. The study confirmed that gold values were accurately represented
by previous sampling procedures and determined there was minimal benefit in re-assaying specific
intervals using a screen fire assay method.
The 2008 field program was initiated on May 15, 2008 with the crew mobilizing into camp and preparing
for the drill program. SCS Drilling Ltd. of Merritt, B.C. mobilized two diamond drills onto the property on
May 28 and began drilling shortly thereafter. The two drills operated until July 17, while only a single
drilled continued until program completion on August 6. SCS demobilized both drills and ancillary
equipment on August 8. In addition to the drill program, soil sampling was undertaken in five areas. The
trailer camp was demobilized in early September, 2009. Split core from both the 2007 and 2008 programs
was labeled and stacked within a large metal storage shed on the property and secured.
In addition to Hawthorne’s geological staff contracting companies were used at various times throughout
the exploration program, including:
G. & S. Logging Co. Ltd. provided a 2054 Excavator, Packer and 850j CAT for snowplowing and road clearing
Rathbone and Goodrich
EBA Environmental
Early in March 2008 Rathbone & Goodrich (“Rathbone”) of Williams Lake were contracted to assist
Hawthorne with correcting several inconsistencies in the historical data for Frasergold. A preliminary field
trip was conducted on May 7 to located 2007 drill collars which were not surveyed in the 2007 field
season due to heavy snowfall. On June 8 Rathbone & Goodrich surveyed several 2007 drill collars
allowing access to the Main Zone for future drilling. They also surveyed three 2008 drill holes and
attempted to establish some baseline points within the Main Zone area which were used to assist with
locating future 2008 drill targets. On June 15, Rathbone returned to survey several additional grid points
as well as update any completed 2008 drill holes. On July 9, 10 and 14, Rathbone & Goodrich returned to
camp and surveyed approximately forty 2008 drill holes and placed pickets as collar markers for

Eureka Resources Inc. Frasergold Project 30 ___________________________________________________________________________________
___________________________________________________________________________________
ERSi Earth Resource Surveys Inc. Giroux Consultants Ltd.
proposed 2008 drill hole locations. August 24 was the final field visit by Rathbone & Goodrich for the 2008
season in which they completed surveying on all remaining 2008 drill hole collars.
9.4. Results of 2008 Programs
9.4.1 Soil Sampling
The locations of the 2008 soil sampling grids are shown in Figure 10. Five areas were sampled; a single
line along the upper margin of a clear-cut on the north side of the MacKay River in the southeast part of
the property, three areas to the northwest of the Main Zone (Eureka Bowl 1, Eureka Bowl 2 and the NW
Extension) and the alpine meadows northeast of Crooked Lake.
The only area where soil sampling returned with Au values of interest lay within the NW Extension grid
directly northwest of the known mineralized zone. Here four samples reported more than 1 ppm Au. This
area is interpreted to be underlain by the knotted phyllite unit.
9.4.2 Silt Sampling
The locations of silt samples collected in 2008 are shown in Figure 11. The only silts reporting values
more than the 0.30 ppm Au were those proximal to the known mineralized zone and from two unnamed
creeks northwest of the property (Campbell, 2009).
9.4.3 Rock Sampling
A number of samples of black phyllite with quartz veining were collected in 2008, located in Figures 12
and 13. With a few exceptions the only samples reporting more than 0.05 ppm Au were proximal to the
known surface mineralization shown in Figure 13 (Campbell, 2009).
9.5. Results of 2011 Program
Gold analyses for soil, silt and rocks collected from the three grids Teslin sampled in 2011 are shown in
Figure 14 (Kusk grid) and Figure 15 (Eureka Bowl and 18ppm Au grids) from Whitehead (2011).
In the central part of the Kusk grid, on the easterly facing slopes above the MacKay River, lies an area
with anomalous gold values in soils warranting further exploration.
The gold in soils anomaly on the upper part of the Eureka Bowl grid is considered to be related to copper-
gold mineralization identified in earlier exploration programs. The elevated gold in soil values in the
central part of the 18 ppm grid are thought to be indicative of the mineralization in the knotted phyllite unit
that lies directly to the southeast; i.e. in the NW Extension Zone.
9.6. Results of 2015 Program
Figure 16 shows the 18 ppm grid extension and the results of the gold in soils from Whitehead (2015).
The 18 ppm grid to the south is also shown with the same graduated symbols as those in Figure 15 for

DWG: 521-15-11 Scale: 1:50,000 Figure: 10
Eureka Resources Inc.
Frasergold Project
Cariboo Mining Division, B.C.
UTM 10 NAD83 Contour interval = 20m
June 17, 2015
Location of 2008 Geochemical Sampling Grids

################################################# 0.25 to 0.49 (4)
################################################# 0.06 to 0.25 (5)
################################################# 0.04 to 0.06 (5)################################################# 0.02 to 0.04 (11)################################################# 0.01 to 0.02 (21)
all others (3)
DWG: 521-15-12 June 18, 2015 Figure: 11
Eureka Resources Inc.
Frasergold Project
Cariboo Mining Divison, B.C.
Crooked Lake
Crooked Lake
Crooked Lake
Crooked Lake
Crooked Lake
Crooked Lake
Crooked Lake
Crooked Lake
Crooked Lake
Crooked Lake
Crooked Lake
Crooked Lake
Crooked Lake
Crooked Lake
Crooked Lake
Crooked Lake
Crooked Lake
Crooked Lake
Crooked Lake
Crooked Lake
Crooked Lake
Crooked Lake
Crooked Lake
Crooked Lake
Crooked Lake
Crooked Lake
Crooked Lake
Crooked Lake
Crooked Lake
Crooked Lake
Crooked Lake
Crooked Lake
Crooked Lake
Crooked Lake
Crooked Lake
Crooked Lake
Crooked Lake
Crooked Lake
Crooked Lake
Crooked Lake
Crooked Lake
Crooked Lake
Crooked Lake
Crooked Lake
Crooked Lake
Crooked Lake
Crooked Lake
Crooked Lake
Crooked Lake
goldgoldgoldgoldgoldgoldgoldgoldgoldgoldgoldgoldgoldgoldgoldgoldgoldgoldgoldgoldgoldgoldgoldgoldgoldgoldgoldgoldgoldgoldgoldgoldgoldgoldgoldgoldgoldgoldgoldgoldgoldgoldgoldgoldgoldgoldgoldgoldgold
Mac
Kay
R.
Mac
Kay
R.
Mac
Kay
R.
Mac
Kay
R.
Mac
Kay
R.
Mac
Kay
R.
Mac
Kay
R.
Mac
Kay
R.
Mac
Kay
R.
Mac
Kay
R.
Mac
Kay
R.
Mac
Kay
R.
Mac
Kay
R.
Mac
Kay
R.
Mac
Kay
R.
Mac
Kay
R.
Mac
Kay
R.
Mac
Kay
R.
Mac
Kay
R.
Mac
Kay
R.
Mac
Kay
R.
Mac
Kay
R.
Mac
Kay
R.
Mac
Kay
R.
Mac
Kay
R.
Mac
Kay
R.
Mac
Kay
R.
Mac
Kay
R.
Mac
Kay
R.
Mac
Kay
R.
Mac
Kay
R.
Mac
Kay
R.
Mac
Kay
R.
Mac
Kay
R.
Mac
Kay
R.
Mac
Kay
R.
Mac
Kay
R.
Mac
Kay
R.
Mac
Kay
R.
Mac
Kay
R.
Mac
Kay
R.
Mac
Kay
R.
Mac
Kay
R.
Mac
Kay
R.
Mac
Kay
R.
Mac
Kay
R.
Mac
Kay
R.
Mac
Kay
R.
Mac
Kay
R.
FraserFraserFraserFraserFraserFraserFraserFraserFraserFraserFraserFraserFraserFraserFraserFraserFraserFraserFraserFraserFraserFraserFraserFraserFraserFraserFraserFraserFraserFraserFraserFraserFraserFraserFraserFraserFraserFraserFraserFraserFraserFraserFraserFraserFraserFraserFraserFraserFraser
Ck.
Ck.
Ck.
Ck.
Ck.
Ck.
Ck.Ck.
Ck.
Ck.
Ck.
Ck.
Ck.
Ck.Ck.
Ck.
Ck.
Ck.
Ck.
Ck.
Ck.Ck.
Ck.
Ck.
Ck.
Ck.
Ck.Ck.
Ck.
Ck.
Ck.
Ck.
Ck.
Ck.Ck.
Ck.
Ck.
Ck.
Ck.
Ck.
Ck.Ck.
Ck.
Ck.
Ck.
Ck.
Ck.
Ck.Ck.
#################################################
#################################################
MacKay R.
MacKay R.
MacKay R.
MacKay R.
MacKay R.
MacKay R.
MacKay R.
MacKay R.
MacKay R.
MacKay R.
MacKay R.
MacKay R.
MacKay R.
MacKay R.
MacKay R.
MacKay R.
MacKay R.
MacKay R.
MacKay R.
MacKay R.
MacKay R.
MacKay R.
MacKay R.
MacKay R.
MacKay R.
MacKay R.
MacKay R.
MacKay R.
MacKay R.
MacKay R.
MacKay R.
MacKay R.
MacKay R.
MacKay R.
MacKay R.
MacKay R.
MacKay R.
MacKay R.
MacKay R.
MacKay R.
MacKay R.
MacKay R.
MacKay R.
MacKay R.
MacKay R.
MacKay R.
MacKay R.
MacKay R.
MacKay R.
%Eureka Pk.Eureka Pk.Eureka Pk.Eureka Pk.Eureka Pk.Eureka Pk.Eureka Pk.Eureka Pk.Eureka Pk.Eureka Pk.Eureka Pk.Eureka Pk.Eureka Pk.Eureka Pk.Eureka Pk.Eureka Pk.Eureka Pk.Eureka Pk.Eureka Pk.Eureka Pk.Eureka Pk.Eureka Pk.Eureka Pk.Eureka Pk.Eureka Pk.Eureka Pk.Eureka Pk.Eureka Pk.Eureka Pk.Eureka Pk.Eureka Pk.Eureka Pk.Eureka Pk.Eureka Pk.Eureka Pk.Eureka Pk.Eureka Pk.Eureka Pk.Eureka Pk.Eureka Pk.Eureka Pk.Eureka Pk.Eureka Pk.Eureka Pk.Eureka Pk.Eureka Pk.Eureka Pk.Eureka Pk.Eureka Pk.
Eure
ka B
rook
Eure
ka B
rook
Eure
ka B
rook
Eure
ka B
rook
Eure
ka B
rook
Eure
ka B
rook
Eure
ka B
rook
Eure
ka B
rook
Eure
ka B
rook
Eure
ka B
rook
Eure
ka B
rook
Eure
ka B
rook
Eure
ka B
rook
Eure
ka B
rook
Eure
ka B
rook
Eure
ka B
rook
Eure
ka B
rook
Eure
ka B
rook
Eure
ka B
rook
Eure
ka B
rook
Eure
ka B
rook
Eure
ka B
rook
Eure
ka B
rook
Eure
ka B
rook
Eure
ka B
rook
Eure
ka B
rook
Eure
ka B
rook
Eure
ka B
rook
Eure
ka B
rook
Eure
ka B
rook
Eure
ka B
rook
Eure
ka B
rook
Eure
ka B
rook
Eure
ka B
rook
Eure
ka B
rook
Eure
ka B
rook
Eure
ka B
rook
Eure
ka B
rook
Eure
ka B
rook
Eure
ka B
rook
Eure
ka B
rook
Eure
ka B
rook
Eure
ka B
rook
Eure
ka B
rook
Eure
ka B
rook
Eure
ka B
rook
Eure
ka B
rook
Eure
ka B
rook
Eure
ka B
rook
#################################################
Horsefly R.
Horsefly R.
Horsefly R.
Horsefly R.
Horsefly R.
Horsefly R.
Horsefly R.
Horsefly R.
Horsefly R.
Horsefly R.
Horsefly R.
Horsefly R.
Horsefly R.
Horsefly R.
Horsefly R.
Horsefly R.
Horsefly R.
Horsefly R.
Horsefly R.
Horsefly R.
Horsefly R.
Horsefly R.
Horsefly R.
Horsefly R.
Horsefly R.
Horsefly R.
Horsefly R.
Horsefly R.
Horsefly R.
Horsefly R.
Horsefly R.
Horsefly R.
Horsefly R.
Horsefly R.
Horsefly R.
Horsefly R.
Horsefly R.
Horsefly R.
Horsefly R.
Horsefly R.
Horsefly R.
Horsefly R.
Horsefly R.
Horsefly R.
Horsefly R.
Horsefly R.
Horsefly R.
Horsefly R.
Horsefly R.
Horsefly LakeHorsefly LakeHorsefly LakeHorsefly LakeHorsefly LakeHorsefly LakeHorsefly LakeHorsefly LakeHorsefly LakeHorsefly LakeHorsefly LakeHorsefly LakeHorsefly LakeHorsefly LakeHorsefly LakeHorsefly LakeHorsefly LakeHorsefly LakeHorsefly LakeHorsefly LakeHorsefly LakeHorsefly LakeHorsefly LakeHorsefly LakeHorsefly LakeHorsefly LakeHorsefly LakeHorsefly LakeHorsefly LakeHorsefly LakeHorsefly LakeHorsefly LakeHorsefly LakeHorsefly LakeHorsefly LakeHorsefly LakeHorsefly LakeHorsefly LakeHorsefly LakeHorsefly LakeHorsefly LakeHorsefly LakeHorsefly LakeHorsefly LakeHorsefly LakeHorsefly LakeHorsefly LakeHorsefly LakeHorsefly Lake
Quesnel LakeQuesnel LakeQuesnel LakeQuesnel LakeQuesnel LakeQuesnel LakeQuesnel LakeQuesnel LakeQuesnel LakeQuesnel LakeQuesnel LakeQuesnel LakeQuesnel LakeQuesnel LakeQuesnel LakeQuesnel LakeQuesnel LakeQuesnel LakeQuesnel LakeQuesnel LakeQuesnel LakeQuesnel LakeQuesnel LakeQuesnel LakeQuesnel LakeQuesnel LakeQuesnel LakeQuesnel LakeQuesnel LakeQuesnel LakeQuesnel LakeQuesnel LakeQuesnel LakeQuesnel LakeQuesnel LakeQuesnel LakeQuesnel LakeQuesnel LakeQuesnel LakeQuesnel LakeQuesnel LakeQuesnel LakeQuesnel LakeQuesnel LakeQuesnel LakeQuesnel LakeQuesnel LakeQuesnel LakeQuesnel Lake
McK
usky Ck.
McK
usky Ck.
McK
usky Ck.
McK
usky Ck.
McK
usky Ck.
McK
usky Ck.
McK
usky Ck.
McK
usky Ck.
McK
usky Ck.
McK
usky Ck.
McK
usky Ck.
McK
usky Ck.
McK
usky Ck.
McK
usky Ck.
McK
usky Ck.
McK
usky Ck.
McK
usky Ck.
McK
usky Ck.
McK
usky Ck.
McK
usky Ck.
McK
usky Ck.
McK
usky Ck.
McK
usky Ck.
McK
usky Ck.
McK
usky Ck.
McK
usky Ck.
McK
usky Ck.
McK
usky Ck.
McK
usky Ck.
McK
usky Ck.
McK
usky Ck.
McK
usky Ck.
McK
usky Ck.
McK
usky Ck.
McK
usky Ck.
McK
usky Ck.
McK
usky Ck.
McK
usky Ck.
McK
usky Ck.
McK
usky Ck.
McK
usky Ck.
McK
usky Ck.
McK
usky Ck.
McK
usky Ck.
McK
usky Ck.
McK
usky Ck.
McK
usky Ck.
McK
usky Ck.
McK
usky Ck.
#################################################
#################################################
#################################################
#################################################
#################################################
#################################################
#################################################
#################################################
####################################################################################################################################################################################################
#################################################
#################################################
#################################################
#################################################
##################################################################################################
##################################################################################################
#################################################
##################################################################################################
#################################################
##################################################################################################
##################################################################################################
#################################################
####################################################################################################################################################################################################
#################################################
#################################################
#################################################
#################################################
##################################################################################################
##################################################################################################
#################################################
#################################################
#################################################
#################################################
##################################################################################################
#################################################
#################################################
#################################################
#################################################
#################################################
#################################################
#################################################
#################################################
#################################################
#################################################
####################################################################################################################################################################################################
#################################################
#################################################
#################################################
##################################################################################################
##################################################################################################
#################################################
##################################################################################################
#################################################
##################################################################################################
##################################################################################################
#################################################
###################################################################################################################################################
#################################################
#################################################
#################################################
#################################################
#################################################
##################################################################################################
#################################################
#################################################
#################################################
#################################################
##################################################################################################
#################################################
#################################################
PSBPSBPSBPSBPSBPSBPSBPSBPSBPSBPSBPSBPSBPSBPSBPSBPSBPSBPSBPSBPSBPSBPSBPSBPSBPSBPSBPSBPSBPSBPSBPSBPSBPSBPSBPSBPSBPSBPSBPSBPSBPSBPSBPSBPSBPSBPSBPSBPSB
DMQDMQDMQDMQDMQDMQDMQDMQDMQDMQDMQDMQDMQDMQDMQDMQDMQDMQDMQDMQDMQDMQDMQDMQDMQDMQDMQDMQDMQDMQDMQDMQDMQDMQDMQDMQDMQDMQDMQDMQDMQDMQDMQDMQDMQDMQDMQDMQDMQ
DMQDMQDMQDMQDMQDMQDMQDMQDMQDMQDMQDMQDMQDMQDMQDMQDMQDMQDMQDMQDMQDMQDMQDMQDMQDMQDMQDMQDMQDMQDMQDMQDMQDMQDMQDMQDMQDMQDMQDMQDMQDMQDMQDMQDMQDMQDMQDMQDMQ
uPrPzSuPrPzSuPrPzSuPrPzSuPrPzSuPrPzSuPrPzSuPrPzSuPrPzSuPrPzSuPrPzSuPrPzSuPrPzSuPrPzSuPrPzSuPrPzSuPrPzSuPrPzSuPrPzSuPrPzSuPrPzSuPrPzSuPrPzSuPrPzSuPrPzSuPrPzSuPrPzSuPrPzSuPrPzSuPrPzSuPrPzSuPrPzSuPrPzSuPrPzSuPrPzSuPrPzSuPrPzSuPrPzSuPrPzSuPrPzSuPrPzSuPrPzSuPrPzSuPrPzSuPrPzSuPrPzSuPrPzSuPrPzSuPrPzS
DMQDMQDMQDMQDMQDMQDMQDMQDMQDMQDMQDMQDMQDMQDMQDMQDMQDMQDMQDMQDMQDMQDMQDMQDMQDMQDMQDMQDMQDMQDMQDMQDMQDMQDMQDMQDMQDMQDMQDMQDMQDMQDMQDMQDMQDMQDMQDMQDMQ
uPzCuPzCuPzCuPzCuPzCuPzCuPzCuPzCuPzCuPzCuPzCuPzCuPzCuPzCuPzCuPzCuPzCuPzCuPzCuPzCuPzCuPzCuPzCuPzCuPzCuPzCuPzCuPzCuPzCuPzCuPzCuPzCuPzCuPzCuPzCuPzCuPzCuPzCuPzCuPzCuPzCuPzCuPzCuPzCuPzCuPzCuPzCuPzCuPzC
KgKgKgKgKgKgKgKgKgKgKgKgKgKgKgKgKgKgKgKgKgKgKgKgKgKgKgKgKgKgKgKgKgKgKgKgKgKgKgKgKgKgKgKgKgKgKgKgKg
uTrNvbuTrNvbuTrNvbuTrNvbuTrNvbuTrNvbuTrNvbuTrNvbuTrNvbuTrNvbuTrNvbuTrNvbuTrNvbuTrNvbuTrNvbuTrNvbuTrNvbuTrNvbuTrNvbuTrNvbuTrNvbuTrNvbuTrNvbuTrNvbuTrNvbuTrNvbuTrNvbuTrNvbuTrNvbuTrNvbuTrNvbuTrNvbuTrNvbuTrNvbuTrNvbuTrNvbuTrNvbuTrNvbuTrNvbuTrNvbuTrNvbuTrNvbuTrNvbuTrNvbuTrNvbuTrNvbuTrNvbuTrNvbuTrNvb
DMQDMQDMQDMQDMQDMQDMQDMQDMQDMQDMQDMQDMQDMQDMQDMQDMQDMQDMQDMQDMQDMQDMQDMQDMQDMQDMQDMQDMQDMQDMQDMQDMQDMQDMQDMQDMQDMQDMQDMQDMQDMQDMQDMQDMQDMQDMQDMQDMQ
uPzCuPzCuPzCuPzCuPzCuPzCuPzCuPzCuPzCuPzCuPzCuPzCuPzCuPzCuPzCuPzCuPzCuPzCuPzCuPzCuPzCuPzCuPzCuPzCuPzCuPzCuPzCuPzCuPzCuPzCuPzCuPzCuPzCuPzCuPzCuPzCuPzCuPzCuPzCuPzCuPzCuPzCuPzCuPzCuPzCuPzCuPzCuPzCuPzC
uTrNvbuTrNvbuTrNvbuTrNvbuTrNvbuTrNvbuTrNvbuTrNvbuTrNvbuTrNvbuTrNvbuTrNvbuTrNvbuTrNvbuTrNvbuTrNvbuTrNvbuTrNvbuTrNvbuTrNvbuTrNvbuTrNvbuTrNvbuTrNvbuTrNvbuTrNvbuTrNvbuTrNvbuTrNvbuTrNvbuTrNvbuTrNvbuTrNvbuTrNvbuTrNvbuTrNvbuTrNvbuTrNvbuTrNvbuTrNvbuTrNvbuTrNvbuTrNvbuTrNvbuTrNvbuTrNvbuTrNvbuTrNvbuTrNvb
EKacaEKacaEKacaEKacaEKacaEKacaEKacaEKacaEKacaEKacaEKacaEKacaEKacaEKacaEKacaEKacaEKacaEKacaEKacaEKacaEKacaEKacaEKacaEKacaEKacaEKacaEKacaEKacaEKacaEKacaEKacaEKacaEKacaEKacaEKacaEKacaEKacaEKacaEKacaEKacaEKacaEKacaEKacaEKacaEKacaEKacaEKacaEKacaEKaca
muTrNmuTrNmuTrNmuTrNmuTrNmuTrNmuTrNmuTrNmuTrNmuTrNmuTrNmuTrNmuTrNmuTrNmuTrNmuTrNmuTrNmuTrNmuTrNmuTrNmuTrNmuTrNmuTrNmuTrNmuTrNmuTrNmuTrNmuTrNmuTrNmuTrNmuTrNmuTrNmuTrNmuTrNmuTrNmuTrNmuTrNmuTrNmuTrNmuTrNmuTrNmuTrNmuTrNmuTrNmuTrNmuTrNmuTrNmuTrNmuTrN
670000m
E670000m
E670000m
E670000m
E670000m
E670000m
E670000m
E670000m
E670000m
E670000m
E670000m
E670000m
E670000m
E670000m
E670000m
E670000m
E670000m
E670000m
E670000m
E670000m
E670000m
E670000m
E670000m
E670000m
E670000m
E670000m
E670000m
E670000m
E670000m
E670000m
E670000m
E670000m
E670000m
E670000m
E670000m
E670000m
E670000m
E670000m
E670000m
E670000m
E670000m
E670000m
E670000m
E670000m
E670000m
E670000m
E670000m
E670000m
E670000m
E
5790000m N5790000m N5790000m N5790000m N5790000m N5790000m N5790000m N5790000m N5790000m N5790000m N5790000m N5790000m N5790000m N5790000m N5790000m N5790000m N5790000m N5790000m N5790000m N5790000m N5790000m N5790000m N5790000m N5790000m N5790000m N5790000m N5790000m N5790000m N5790000m N5790000m N5790000m N5790000m N5790000m N5790000m N5790000m N5790000m N5790000m N5790000m N5790000m N5790000m N5790000m N5790000m N5790000m N5790000m N5790000m N5790000m N5790000m N5790000m N5790000m N
5800000m N5800000m N5800000m N5800000m N5800000m N5800000m N5800000m N5800000m N5800000m N5800000m N5800000m N5800000m N5800000m N5800000m N5800000m N5800000m N5800000m N5800000m N5800000m N5800000m N5800000m N5800000m N5800000m N5800000m N5800000m N5800000m N5800000m N5800000m N5800000m N5800000m N5800000m N5800000m N5800000m N5800000m N5800000m N5800000m N5800000m N5800000m N5800000m N5800000m N5800000m N5800000m N5800000m N5800000m N5800000m N5800000m N5800000m N5800000m N5800000m N
5810000m N5810000m N5810000m N5810000m N5810000m N5810000m N5810000m N5810000m N5810000m N5810000m N5810000m N5810000m N5810000m N5810000m N5810000m N5810000m N5810000m N5810000m N5810000m N5810000m N5810000m N5810000m N5810000m N5810000m N5810000m N5810000m N5810000m N5810000m N5810000m N5810000m N5810000m N5810000m N5810000m N5810000m N5810000m N5810000m N5810000m N5810000m N5810000m N5810000m N5810000m N5810000m N5810000m N5810000m N5810000m N5810000m N5810000m N5810000m N5810000m N
660000m
E660000m
E660000m
E660000m
E660000m
E660000m
E660000m
E660000m
E660000m
E660000m
E660000m
E660000m
E660000m
E660000m
E660000m
E660000m
E660000m
E660000m
E660000m
E660000m
E660000m
E660000m
E660000m
E660000m
E660000m
E660000m
E660000m
E660000m
E660000m
E660000m
E660000m
E660000m
E660000m
E660000m
E660000m
E660000m
E660000m
E660000m
E660000m
E660000m
E660000m
E660000m
E660000m
E660000m
E660000m
E660000m
E660000m
E660000m
E660000m
E
650000m
E650000m
E650000m
E650000m
E650000m
E650000m
E650000m
E650000m
E650000m
E650000m
E650000m
E650000m
E650000m
E650000m
E650000m
E650000m
E650000m
E650000m
E650000m
E650000m
E650000m
E650000m
E650000m
E650000m
E650000m
E650000m
E650000m
E650000m
E650000m
E650000m
E650000m
E650000m
E650000m
E650000m
E650000m
E650000m
E650000m
E650000m
E650000m
E650000m
E650000m
E650000m
E650000m
E650000m
E650000m
E650000m
E650000m
E650000m
E650000m
E
640000m
E640000m
E640000m
E640000m
E640000m
E640000m
E640000m
E640000m
E640000m
E640000m
E640000m
E640000m
E640000m
E640000m
E640000m
E640000m
E640000m
E640000m
E640000m
E640000m
E640000m
E640000m
E640000m
E640000m
E640000m
E640000m
E640000m
E640000m
E640000m
E640000m
E640000m
E640000m
E640000m
E640000m
E640000m
E640000m
E640000m
E640000m
E640000m
E640000m
E640000m
E640000m
E640000m
E640000m
E640000m
E640000m
E640000m
E640000m
E640000m
E
0.40.40.40.40.40.40.40.40.40.40.40.40.40.40.40.40.40.40.40.40.40.40.40.40.40.40.40.40.40.40.40.40.40.40.40.40.40.40.40.40.40.40.40.40.40.40.40.40.4
0.330.330.330.330.330.330.330.330.330.330.330.330.330.330.330.330.330.330.330.330.330.330.330.330.330.330.330.330.330.330.330.330.330.330.330.330.330.330.330.330.330.330.330.330.330.330.330.330.33
0.320.320.320.320.320.320.320.320.320.320.320.320.320.320.320.320.320.320.320.320.320.320.320.320.320.320.320.320.320.320.320.320.320.320.320.320.320.320.320.320.320.320.320.320.320.320.320.320.320.490.490.490.490.490.490.490.490.490.490.490.490.490.490.490.490.490.490.490.490.490.490.490.490.490.490.490.490.490.490.490.490.490.490.490.490.490.490.490.490.490.490.490.490.490.490.490.490.49
DMQDMQDMQDMQDMQDMQDMQDMQDMQDMQDMQDMQDMQDMQDMQDMQDMQDMQDMQDMQDMQDMQDMQDMQDMQDMQDMQDMQDMQDMQDMQDMQDMQDMQDMQDMQDMQDMQDMQDMQDMQDMQDMQDMQDMQDMQDMQDMQDMQ
KgKgKgKgKgKgKgKgKgKgKgKgKgKgKgKgKgKgKgKgKgKgKgKgKgKgKgKgKgKgKgKgKgKgKgKgKgKgKgKgKgKgKgKgKgKgKgKgKg
uPrPzSuPrPzSuPrPzSuPrPzSuPrPzSuPrPzSuPrPzSuPrPzSuPrPzSuPrPzSuPrPzSuPrPzSuPrPzSuPrPzSuPrPzSuPrPzSuPrPzSuPrPzSuPrPzSuPrPzSuPrPzSuPrPzSuPrPzSuPrPzSuPrPzSuPrPzSuPrPzSuPrPzSuPrPzSuPrPzSuPrPzSuPrPzSuPrPzSuPrPzSuPrPzSuPrPzSuPrPzSuPrPzSuPrPzSuPrPzSuPrPzSuPrPzSuPrPzSuPrPzSuPrPzSuPrPzSuPrPzSuPrPzSuPrPzS
uPzCuPzCuPzCuPzCuPzCuPzCuPzCuPzCuPzCuPzCuPzCuPzCuPzCuPzCuPzCuPzCuPzCuPzCuPzCuPzCuPzCuPzCuPzCuPzCuPzCuPzCuPzCuPzCuPzCuPzCuPzCuPzCuPzCuPzCuPzCuPzCuPzCuPzCuPzCuPzCuPzCuPzCuPzCuPzCuPzCuPzCuPzCuPzCuPzC
uPzCuPzCuPzCuPzCuPzCuPzCuPzCuPzCuPzCuPzCuPzCuPzCuPzCuPzCuPzCuPzCuPzCuPzCuPzCuPzCuPzCuPzCuPzCuPzCuPzCuPzCuPzCuPzCuPzCuPzCuPzCuPzCuPzCuPzCuPzCuPzCuPzCuPzCuPzCuPzCuPzCuPzCuPzCuPzCuPzCuPzCuPzCuPzCuPzC
UTM 10 NAD83Contour interval = 200m
%%%%%%%%%%%%%%%%%%%%%%%%%%%%%%%%%%%%%%%%%%%%%%%%%%%%%%%%%%%%%%%%%
Scale 1:150,000
Quesnel Lake Gneiss
Upper Proterozoic to PaleozoicSnowshoe Group
EoceneKamloops Group
Cretaceous
Devonian to Mississippian
Upper PaleozoicCrooked Amphibolite
PermianSnowshoe Group - Bralco Succession
intrusives, undivided
Upper Triassic
Middle Triassic to Upper Triassic
Nicola Group; volcanics
Nicola Group; sediments
EKacaEKacaEKacaEKacaEKacaEKacaEKacaEKacaEKacaEKacaEKacaEKacaEKacaEKacaEKacaEKacaEKacaEKacaEKacaEKacaEKacaEKacaEKacaEKacaEKacaEKacaEKacaEKacaEKacaEKacaEKacaEKacaEKacaEKacaEKacaEKacaEKacaEKacaEKacaEKacaEKacaEKacaEKacaEKacaEKacaEKacaEKacaEKacaEKaca
KgKgKgKgKgKgKgKgKgKgKgKgKgKgKgKgKgKgKgKgKgKgKgKgKgKgKgKgKgKgKgKgKgKgKgKgKgKgKgKgKgKgKgKgKgKgKgKgKg
uTrNvbuTrNvbuTrNvbuTrNvbuTrNvbuTrNvbuTrNvbuTrNvbuTrNvbuTrNvbuTrNvbuTrNvbuTrNvbuTrNvbuTrNvbuTrNvbuTrNvbuTrNvbuTrNvbuTrNvbuTrNvbuTrNvbuTrNvbuTrNvbuTrNvbuTrNvbuTrNvbuTrNvbuTrNvbuTrNvbuTrNvbuTrNvbuTrNvbuTrNvbuTrNvbuTrNvbuTrNvbuTrNvbuTrNvbuTrNvbuTrNvbuTrNvbuTrNvbuTrNvbuTrNvbuTrNvbuTrNvbuTrNvbuTrNvb
muTrNmuTrNmuTrNmuTrNmuTrNmuTrNmuTrNmuTrNmuTrNmuTrNmuTrNmuTrNmuTrNmuTrNmuTrNmuTrNmuTrNmuTrNmuTrNmuTrNmuTrNmuTrNmuTrNmuTrNmuTrNmuTrNmuTrNmuTrNmuTrNmuTrNmuTrNmuTrNmuTrNmuTrNmuTrNmuTrNmuTrNmuTrNmuTrNmuTrNmuTrNmuTrNmuTrNmuTrNmuTrNmuTrNmuTrNmuTrNmuTrN
Rock Units
uPzCuPzCuPzCuPzCuPzCuPzCuPzCuPzCuPzCuPzCuPzCuPzCuPzCuPzCuPzCuPzCuPzCuPzCuPzCuPzCuPzCuPzCuPzCuPzCuPzCuPzCuPzCuPzCuPzCuPzCuPzCuPzCuPzCuPzCuPzCuPzCuPzCuPzCuPzCuPzCuPzCuPzCuPzCuPzCuPzCuPzCuPzCuPzCuPzC
PSBPSBPSBPSBPSBPSBPSBPSBPSBPSBPSBPSBPSBPSBPSBPSBPSBPSBPSBPSBPSBPSBPSBPSBPSBPSBPSBPSBPSBPSBPSBPSBPSBPSBPSBPSBPSBPSBPSBPSBPSBPSBPSBPSBPSBPSBPSBPSBPSB
DMQDMQDMQDMQDMQDMQDMQDMQDMQDMQDMQDMQDMQDMQDMQDMQDMQDMQDMQDMQDMQDMQDMQDMQDMQDMQDMQDMQDMQDMQDMQDMQDMQDMQDMQDMQDMQDMQDMQDMQDMQDMQDMQDMQDMQDMQDMQDMQDMQ
uPrPzSuPrPzSuPrPzSuPrPzSuPrPzSuPrPzSuPrPzSuPrPzSuPrPzSuPrPzSuPrPzSuPrPzSuPrPzSuPrPzSuPrPzSuPrPzSuPrPzSuPrPzSuPrPzSuPrPzSuPrPzSuPrPzSuPrPzSuPrPzSuPrPzSuPrPzSuPrPzSuPrPzSuPrPzSuPrPzSuPrPzSuPrPzSuPrPzSuPrPzSuPrPzSuPrPzSuPrPzSuPrPzSuPrPzSuPrPzSuPrPzSuPrPzSuPrPzSuPrPzSuPrPzSuPrPzSuPrPzSuPrPzSuPrPzS
2008 Silt SamplesAu (ppm)
Outline of Frasergold Claims
underground Frasergold mineralizationprojected to surface
2 0 2 4 Km
Scale: 1:150,000
#################################################
Au in silts (ppm)

DWG: 521-15-13 June 18, 2015 Figure: 12
Eureka Resources Inc.
Frasergold Project
Cariboo Mining Divison, B.C.
Ck.
Ck.
Ck.
Ck.
Ck.
Ck.
Ck.Ck.
Ck.
Ck.
Ck.
Ck.
Ck.
Ck.Ck.
Ck.
Ck.
Ck.
Ck.
Ck.
Ck.Ck.
Ck.
Ck.
Ck.
Ck.
Ck.Ck.
Ck.
Ck.
Ck.
Ck.
Ck.
Ck.Ck.
Ck.
Ck.
Ck.
Ck.
Ck.
Ck.Ck.
Ck.
Ck.
Ck.
Ck.
Ck.
Ck.Ck.
Crooked Lake
Crooked Lake
Crooked Lake
Crooked Lake
Crooked Lake
Crooked Lake
Crooked Lake
Crooked Lake
Crooked Lake
Crooked Lake
Crooked Lake
Crooked Lake
Crooked Lake
Crooked Lake
Crooked Lake
Crooked Lake
Crooked Lake
Crooked Lake
Crooked Lake
Crooked Lake
Crooked Lake
Crooked Lake
Crooked Lake
Crooked Lake
Crooked Lake
Crooked Lake
Crooked Lake
Crooked Lake
Crooked Lake
Crooked Lake
Crooked Lake
Crooked Lake
Crooked Lake
Crooked Lake
Crooked Lake
Crooked Lake
Crooked Lake
Crooked Lake
Crooked Lake
Crooked Lake
Crooked Lake
Crooked Lake
Crooked Lake
Crooked Lake
Crooked Lake
Crooked Lake
Crooked Lake
Crooked Lake
Crooked Lake
FraserFraserFraserFraserFraserFraserFraserFraserFraserFraserFraserFraserFraserFraserFraserFraserFraserFraserFraserFraserFraserFraserFraserFraserFraserFraserFraserFraserFraserFraserFraserFraserFraserFraserFraserFraserFraserFraserFraserFraserFraserFraserFraserFraserFraserFraserFraserFraserFraser goldgoldgoldgoldgoldgoldgoldgoldgoldgoldgoldgoldgoldgoldgoldgoldgoldgoldgoldgoldgoldgoldgoldgoldgoldgoldgoldgoldgoldgoldgoldgoldgoldgoldgoldgoldgoldgoldgoldgoldgoldgoldgoldgoldgoldgoldgoldgoldgold
Mac
Kay
R.
Mac
Kay
R.
Mac
Kay
R.
Mac
Kay
R.
Mac
Kay
R.
Mac
Kay
R.
Mac
Kay
R.
Mac
Kay
R.
Mac
Kay
R.
Mac
Kay
R.
Mac
Kay
R.
Mac
Kay
R.
Mac
Kay
R.
Mac
Kay
R.
Mac
Kay
R.
Mac
Kay
R.
Mac
Kay
R.
Mac
Kay
R.
Mac
Kay
R.
Mac
Kay
R.
Mac
Kay
R.
Mac
Kay
R.
Mac
Kay
R.
Mac
Kay
R.
Mac
Kay
R.
Mac
Kay
R.
Mac
Kay
R.
Mac
Kay
R.
Mac
Kay
R.
Mac
Kay
R.
Mac
Kay
R.
Mac
Kay
R.
Mac
Kay
R.
Mac
Kay
R.
Mac
Kay
R.
Mac
Kay
R.
Mac
Kay
R.
Mac
Kay
R.
Mac
Kay
R.
Mac
Kay
R.
Mac
Kay
R.
Mac
Kay
R.
Mac
Kay
R.
Mac
Kay
R.
Mac
Kay
R.
Mac
Kay
R.
Mac
Kay
R.
Mac
Kay
R.
Mac
Kay
R.
MacKay R.
MacKay R.
MacKay R.
MacKay R.
MacKay R.
MacKay R.
MacKay R.
MacKay R.
MacKay R.
MacKay R.
MacKay R.
MacKay R.
MacKay R.
MacKay R.
MacKay R.
MacKay R.
MacKay R.
MacKay R.
MacKay R.
MacKay R.
MacKay R.
MacKay R.
MacKay R.
MacKay R.
MacKay R.
MacKay R.
MacKay R.
MacKay R.
MacKay R.
MacKay R.
MacKay R.
MacKay R.
MacKay R.
MacKay R.
MacKay R.
MacKay R.
MacKay R.
MacKay R.
MacKay R.
MacKay R.
MacKay R.
MacKay R.
MacKay R.
MacKay R.
MacKay R.
MacKay R.
MacKay R.
MacKay R.
MacKay R.
%Eureka Pk.Eureka Pk.Eureka Pk.Eureka Pk.Eureka Pk.Eureka Pk.Eureka Pk.Eureka Pk.Eureka Pk.Eureka Pk.Eureka Pk.Eureka Pk.Eureka Pk.Eureka Pk.Eureka Pk.Eureka Pk.Eureka Pk.Eureka Pk.Eureka Pk.Eureka Pk.Eureka Pk.Eureka Pk.Eureka Pk.Eureka Pk.Eureka Pk.Eureka Pk.Eureka Pk.Eureka Pk.Eureka Pk.Eureka Pk.Eureka Pk.Eureka Pk.Eureka Pk.Eureka Pk.Eureka Pk.Eureka Pk.Eureka Pk.Eureka Pk.Eureka Pk.Eureka Pk.Eureka Pk.Eureka Pk.Eureka Pk.Eureka Pk.Eureka Pk.Eureka Pk.Eureka Pk.Eureka Pk.Eureka Pk.
Eure
ka B
rook
Eure
ka B
rook
Eure
ka B
rook
Eure
ka B
rook
Eure
ka B
rook
Eure
ka B
rook
Eure
ka B
rook
Eure
ka B
rook
Eure
ka B
rook
Eure
ka B
rook
Eure
ka B
rook
Eure
ka B
rook
Eure
ka B
rook
Eure
ka B
rook
Eure
ka B
rook
Eure
ka B
rook
Eure
ka B
rook
Eure
ka B
rook
Eure
ka B
rook
Eure
ka B
rook
Eure
ka B
rook
Eure
ka B
rook
Eure
ka B
rook
Eure
ka B
rook
Eure
ka B
rook
Eure
ka B
rook
Eure
ka B
rook
Eure
ka B
rook
Eure
ka B
rook
Eure
ka B
rook
Eure
ka B
rook
Eure
ka B
rook
Eure
ka B
rook
Eure
ka B
rook
Eure
ka B
rook
Eure
ka B
rook
Eure
ka B
rook
Eure
ka B
rook
Eure
ka B
rook
Eure
ka B
rook
Eure
ka B
rook
Eure
ka B
rook
Eure
ka B
rook
Eure
ka B
rook
Eure
ka B
rook
Eure
ka B
rook
Eure
ka B
rook
Eure
ka B
rook
Eure
ka B
rook
Horsefly R.
Horsefly R.
Horsefly R.
Horsefly R.
Horsefly R.
Horsefly R.
Horsefly R.
Horsefly R.
Horsefly R.
Horsefly R.
Horsefly R.
Horsefly R.
Horsefly R.
Horsefly R.
Horsefly R.
Horsefly R.
Horsefly R.
Horsefly R.
Horsefly R.
Horsefly R.
Horsefly R.
Horsefly R.
Horsefly R.
Horsefly R.
Horsefly R.
Horsefly R.
Horsefly R.
Horsefly R.
Horsefly R.
Horsefly R.
Horsefly R.
Horsefly R.
Horsefly R.
Horsefly R.
Horsefly R.
Horsefly R.
Horsefly R.
Horsefly R.
Horsefly R.
Horsefly R.
Horsefly R.
Horsefly R.
Horsefly R.
Horsefly R.
Horsefly R.
Horsefly R.
Horsefly R.
Horsefly R.
Horsefly R.
Horsefly LakeHorsefly LakeHorsefly LakeHorsefly LakeHorsefly LakeHorsefly LakeHorsefly LakeHorsefly LakeHorsefly LakeHorsefly LakeHorsefly LakeHorsefly LakeHorsefly LakeHorsefly LakeHorsefly LakeHorsefly LakeHorsefly LakeHorsefly LakeHorsefly LakeHorsefly LakeHorsefly LakeHorsefly LakeHorsefly LakeHorsefly LakeHorsefly LakeHorsefly LakeHorsefly LakeHorsefly LakeHorsefly LakeHorsefly LakeHorsefly LakeHorsefly LakeHorsefly LakeHorsefly LakeHorsefly LakeHorsefly LakeHorsefly LakeHorsefly LakeHorsefly LakeHorsefly LakeHorsefly LakeHorsefly LakeHorsefly LakeHorsefly LakeHorsefly LakeHorsefly LakeHorsefly LakeHorsefly LakeHorsefly Lake
Quesnel LakeQuesnel LakeQuesnel LakeQuesnel LakeQuesnel LakeQuesnel LakeQuesnel LakeQuesnel LakeQuesnel LakeQuesnel LakeQuesnel LakeQuesnel LakeQuesnel LakeQuesnel LakeQuesnel LakeQuesnel LakeQuesnel LakeQuesnel LakeQuesnel LakeQuesnel LakeQuesnel LakeQuesnel LakeQuesnel LakeQuesnel LakeQuesnel LakeQuesnel LakeQuesnel LakeQuesnel LakeQuesnel LakeQuesnel LakeQuesnel LakeQuesnel LakeQuesnel LakeQuesnel LakeQuesnel LakeQuesnel LakeQuesnel LakeQuesnel LakeQuesnel LakeQuesnel LakeQuesnel LakeQuesnel LakeQuesnel LakeQuesnel LakeQuesnel LakeQuesnel LakeQuesnel LakeQuesnel LakeQuesnel Lake
McK
usky Ck.
McK
usky Ck.
McK
usky Ck.
McK
usky Ck.
McK
usky Ck.
McK
usky Ck.
McK
usky Ck.
McK
usky Ck.
McK
usky Ck.
McK
usky Ck.
McK
usky Ck.
McK
usky Ck.
McK
usky Ck.
McK
usky Ck.
McK
usky Ck.
McK
usky Ck.
McK
usky Ck.
McK
usky Ck.
McK
usky Ck.
McK
usky Ck.
McK
usky Ck.
McK
usky Ck.
McK
usky Ck.
McK
usky Ck.
McK
usky Ck.
McK
usky Ck.
McK
usky Ck.
McK
usky Ck.
McK
usky Ck.
McK
usky Ck.
McK
usky Ck.
McK
usky Ck.
McK
usky Ck.
McK
usky Ck.
McK
usky Ck.
McK
usky Ck.
McK
usky Ck.
McK
usky Ck.
McK
usky Ck.
McK
usky Ck.
McK
usky Ck.
McK
usky Ck.
McK
usky Ck.
McK
usky Ck.
McK
usky Ck.
McK
usky Ck.
McK
usky Ck.
McK
usky Ck.
McK
usky Ck.
DMQDMQDMQDMQDMQDMQDMQDMQDMQDMQDMQDMQDMQDMQDMQDMQDMQDMQDMQDMQDMQDMQDMQDMQDMQDMQDMQDMQDMQDMQDMQDMQDMQDMQDMQDMQDMQDMQDMQDMQDMQDMQDMQDMQDMQDMQDMQDMQDMQ
uTrNvbuTrNvbuTrNvbuTrNvbuTrNvbuTrNvbuTrNvbuTrNvbuTrNvbuTrNvbuTrNvbuTrNvbuTrNvbuTrNvbuTrNvbuTrNvbuTrNvbuTrNvbuTrNvbuTrNvbuTrNvbuTrNvbuTrNvbuTrNvbuTrNvbuTrNvbuTrNvbuTrNvbuTrNvbuTrNvbuTrNvbuTrNvbuTrNvbuTrNvbuTrNvbuTrNvbuTrNvbuTrNvbuTrNvbuTrNvbuTrNvbuTrNvbuTrNvbuTrNvbuTrNvbuTrNvbuTrNvbuTrNvbuTrNvb
PSBPSBPSBPSBPSBPSBPSBPSBPSBPSBPSBPSBPSBPSBPSBPSBPSBPSBPSBPSBPSBPSBPSBPSBPSBPSBPSBPSBPSBPSBPSBPSBPSBPSBPSBPSBPSBPSBPSBPSBPSBPSBPSBPSBPSBPSBPSBPSBPSB
DMQDMQDMQDMQDMQDMQDMQDMQDMQDMQDMQDMQDMQDMQDMQDMQDMQDMQDMQDMQDMQDMQDMQDMQDMQDMQDMQDMQDMQDMQDMQDMQDMQDMQDMQDMQDMQDMQDMQDMQDMQDMQDMQDMQDMQDMQDMQDMQDMQ
uPrPzSuPrPzSuPrPzSuPrPzSuPrPzSuPrPzSuPrPzSuPrPzSuPrPzSuPrPzSuPrPzSuPrPzSuPrPzSuPrPzSuPrPzSuPrPzSuPrPzSuPrPzSuPrPzSuPrPzSuPrPzSuPrPzSuPrPzSuPrPzSuPrPzSuPrPzSuPrPzSuPrPzSuPrPzSuPrPzSuPrPzSuPrPzSuPrPzSuPrPzSuPrPzSuPrPzSuPrPzSuPrPzSuPrPzSuPrPzSuPrPzSuPrPzSuPrPzSuPrPzSuPrPzSuPrPzSuPrPzSuPrPzSuPrPzS
DMQDMQDMQDMQDMQDMQDMQDMQDMQDMQDMQDMQDMQDMQDMQDMQDMQDMQDMQDMQDMQDMQDMQDMQDMQDMQDMQDMQDMQDMQDMQDMQDMQDMQDMQDMQDMQDMQDMQDMQDMQDMQDMQDMQDMQDMQDMQDMQDMQ
uPzCuPzCuPzCuPzCuPzCuPzCuPzCuPzCuPzCuPzCuPzCuPzCuPzCuPzCuPzCuPzCuPzCuPzCuPzCuPzCuPzCuPzCuPzCuPzCuPzCuPzCuPzCuPzCuPzCuPzCuPzCuPzCuPzCuPzCuPzCuPzCuPzCuPzCuPzCuPzCuPzCuPzCuPzCuPzCuPzCuPzCuPzCuPzCuPzC
KgKgKgKgKgKgKgKgKgKgKgKgKgKgKgKgKgKgKgKgKgKgKgKgKgKgKgKgKgKgKgKgKgKgKgKgKgKgKgKgKgKgKgKgKgKgKgKgKg
DMQDMQDMQDMQDMQDMQDMQDMQDMQDMQDMQDMQDMQDMQDMQDMQDMQDMQDMQDMQDMQDMQDMQDMQDMQDMQDMQDMQDMQDMQDMQDMQDMQDMQDMQDMQDMQDMQDMQDMQDMQDMQDMQDMQDMQDMQDMQDMQDMQ
uPzCuPzCuPzCuPzCuPzCuPzCuPzCuPzCuPzCuPzCuPzCuPzCuPzCuPzCuPzCuPzCuPzCuPzCuPzCuPzCuPzCuPzCuPzCuPzCuPzCuPzCuPzCuPzCuPzCuPzCuPzCuPzCuPzCuPzCuPzCuPzCuPzCuPzCuPzCuPzCuPzCuPzCuPzCuPzCuPzCuPzCuPzCuPzCuPzC
uTrNvbuTrNvbuTrNvbuTrNvbuTrNvbuTrNvbuTrNvbuTrNvbuTrNvbuTrNvbuTrNvbuTrNvbuTrNvbuTrNvbuTrNvbuTrNvbuTrNvbuTrNvbuTrNvbuTrNvbuTrNvbuTrNvbuTrNvbuTrNvbuTrNvbuTrNvbuTrNvbuTrNvbuTrNvbuTrNvbuTrNvbuTrNvbuTrNvbuTrNvbuTrNvbuTrNvbuTrNvbuTrNvbuTrNvbuTrNvbuTrNvbuTrNvbuTrNvbuTrNvbuTrNvbuTrNvbuTrNvbuTrNvbuTrNvb
EKacaEKacaEKacaEKacaEKacaEKacaEKacaEKacaEKacaEKacaEKacaEKacaEKacaEKacaEKacaEKacaEKacaEKacaEKacaEKacaEKacaEKacaEKacaEKacaEKacaEKacaEKacaEKacaEKacaEKacaEKacaEKacaEKacaEKacaEKacaEKacaEKacaEKacaEKacaEKacaEKacaEKacaEKacaEKacaEKacaEKacaEKacaEKacaEKaca
muTrNmuTrNmuTrNmuTrNmuTrNmuTrNmuTrNmuTrNmuTrNmuTrNmuTrNmuTrNmuTrNmuTrNmuTrNmuTrNmuTrNmuTrNmuTrNmuTrNmuTrNmuTrNmuTrNmuTrNmuTrNmuTrNmuTrNmuTrNmuTrNmuTrNmuTrNmuTrNmuTrNmuTrNmuTrNmuTrNmuTrNmuTrNmuTrNmuTrNmuTrNmuTrNmuTrNmuTrNmuTrNmuTrNmuTrNmuTrNmuTrN1,
800
1,80
0
1,80
0
1,80
0
1,80
0
1,80
0
1,80
0
1,80
0
1,80
0
1,80
0
1,80
0
1,80
0
1,80
0
1,80
0
1,80
0
1,80
0
1,80
0
1,80
0
1,80
0
1,80
0
1,80
0
1,80
0
1,80
0
1,80
0
1,80
0
1,80
0
1,80
0
1,80
0
1,80
0
1,80
0
1,80
0
1,80
0
1,80
0
1,80
0
1,80
0
1,80
0
1,80
0
1,80
0
1,80
0
1,80
0
1,80
0
1,80
0
1,80
0
1,80
0
1,80
0
1,80
0
1,80
0
1,80
0
1,80
0
1,6001,6001,6001,6001,6001,6001,6001,6001,6001,6001,6001,6001,6001,6001,6001,6001,6001,6001,6001,6001,6001,6001,6001,6001,6001,6001,6001,6001,6001,6001,6001,6001,6001,6001,6001,6001,6001,6001,6001,6001,6001,6001,6001,6001,6001,6001,6001,6001,600
1,8001,8001,8001,8001,8001,8001,8001,8001,8001,8001,8001,8001,8001,8001,8001,8001,8001,8001,8001,8001,8001,8001,8001,8001,8001,8001,8001,8001,8001,8001,8001,8001,8001,8001,8001,8001,8001,8001,8001,8001,8001,8001,8001,8001,8001,8001,8001,8001,800
1,00
0
1,00
0
1,00
0
1,00
0
1,00
0
1,00
0
1,00
01,
000
1,00
0
1,00
0
1,00
0
1,00
0
1,00
0
1,00
01,
000
1,00
0
1,00
0
1,00
0
1,00
0
1,00
0
1,00
01,
000
1,00
0
1,00
0
1,00
0
1,00
0
1,00
01,
000
1,00
0
1,00
0
1,00
0
1,00
0
1,00
0
1,00
01,
000
1,00
0
1,00
0
1,00
0
1,00
0
1,00
0
1,00
01,
000
1,00
0
1,00
0
1,00
0
1,00
0
1,00
0
1,00
0
1,00
0
1,000
1,000
1,000
1,000
1,000
1,000
1,000
1,000
1,000
1,000
1,000
1,000
1,000
1,000
1,000
1,000
1,000
1,000
1,000
1,000
1,000
1,000
1,000
1,000
1,000
1,000
1,000
1,000
1,000
1,000
1,000
1,000
1,000
1,000
1,000
1,000
1,000
1,000
1,000
1,000
1,000
1,000
1,000
1,000
1,000
1,000
1,000
1,000
1,000
1,2001,2001,2001,2001,2001,2001,2001,2001,2001,2001,2001,2001,2001,2001,2001,2001,2001,2001,2001,2001,2001,2001,2001,2001,2001,2001,2001,2001,2001,2001,2001,2001,2001,2001,2001,2001,2001,2001,2001,2001,2001,2001,2001,2001,2001,2001,2001,2001,200
1,8001,8001,8001,8001,8001,8001,8001,8001,8001,8001,8001,8001,8001,8001,8001,8001,8001,8001,8001,8001,8001,8001,8001,8001,8001,8001,8001,8001,8001,8001,8001,8001,8001,8001,8001,8001,8001,8001,8001,8001,8001,8001,8001,8001,8001,8001,8001,8001,800
1,0001,0001,0001,0001,0001,0001,0001,0001,0001,0001,0001,0001,0001,0001,0001,0001,0001,0001,0001,0001,0001,0001,0001,0001,0001,0001,0001,0001,0001,0001,0001,0001,0001,0001,0001,0001,0001,0001,0001,0001,0001,0001,0001,0001,0001,0001,0001,0001,000
1,8001,8001,8001,8001,8001,8001,8001,8001,8001,8001,8001,8001,8001,8001,8001,8001,8001,8001,8001,8001,8001,8001,8001,8001,8001,8001,8001,8001,8001,8001,8001,8001,8001,8001,8001,8001,8001,8001,8001,8001,8001,8001,8001,8001,8001,8001,8001,8001,800
1,40
0
1,40
0
1,40
0
1,40
0
1,40
0
1,40
0
1,40
01,
400
1,40
0
1,40
0
1,40
0
1,40
0
1,40
0
1,40
01,
400
1,40
0
1,40
0
1,40
0
1,40
0
1,40
0
1,40
01,
400
1,40
0
1,40
0
1,40
0
1,40
0
1,40
01,
400
1,40
0
1,40
0
1,40
0
1,40
0
1,40
0
1,40
01,
400
1,40
0
1,40
0
1,40
0
1,40
0
1,40
0
1,40
01,
400
1,40
0
1,40
0
1,40
0
1,40
0
1,40
0
1,40
0
1,40
0
1,00
01,
000
1,00
01,
000
1,00
01,
000
1,00
01,
000
1,00
01,
000
1,00
01,
000
1,00
01,
000
1,00
01,
000
1,00
01,
000
1,00
01,
000
1,00
01,
000
1,00
01,
000
1,00
01,
000
1,00
01,
000
1,00
01,
000
1,00
01,
000
1,00
01,
000
1,00
01,
000
1,00
01,
000
1,00
01,
000
1,00
01,
000
1,00
01,
000
1,00
01,
000
1,00
01,
000
1,00
0
5810000m N5810000m N5810000m N5810000m N5810000m N5810000m N5810000m N5810000m N5810000m N5810000m N5810000m N5810000m N5810000m N5810000m N5810000m N5810000m N5810000m N5810000m N5810000m N5810000m N5810000m N5810000m N5810000m N5810000m N5810000m N5810000m N5810000m N5810000m N5810000m N5810000m N5810000m N5810000m N5810000m N5810000m N5810000m N5810000m N5810000m N5810000m N5810000m N5810000m N5810000m N5810000m N5810000m N5810000m N5810000m N5810000m N5810000m N5810000m N5810000m N
670000m
E670000m
E670000m
E670000m
E670000m
E670000m
E670000m
E670000m
E670000m
E670000m
E670000m
E670000m
E670000m
E670000m
E670000m
E670000m
E670000m
E670000m
E670000m
E670000m
E670000m
E670000m
E670000m
E670000m
E670000m
E670000m
E670000m
E670000m
E670000m
E670000m
E670000m
E670000m
E670000m
E670000m
E670000m
E670000m
E670000m
E670000m
E670000m
E670000m
E670000m
E670000m
E670000m
E670000m
E670000m
E670000m
E670000m
E670000m
E670000m
E
5790000m N5790000m N5790000m N5790000m N5790000m N5790000m N5790000m N5790000m N5790000m N5790000m N5790000m N5790000m N5790000m N5790000m N5790000m N5790000m N5790000m N5790000m N5790000m N5790000m N5790000m N5790000m N5790000m N5790000m N5790000m N5790000m N5790000m N5790000m N5790000m N5790000m N5790000m N5790000m N5790000m N5790000m N5790000m N5790000m N5790000m N5790000m N5790000m N5790000m N5790000m N5790000m N5790000m N5790000m N5790000m N5790000m N5790000m N5790000m N5790000m N
5800000m N5800000m N5800000m N5800000m N5800000m N5800000m N5800000m N5800000m N5800000m N5800000m N5800000m N5800000m N5800000m N5800000m N5800000m N5800000m N5800000m N5800000m N5800000m N5800000m N5800000m N5800000m N5800000m N5800000m N5800000m N5800000m N5800000m N5800000m N5800000m N5800000m N5800000m N5800000m N5800000m N5800000m N5800000m N5800000m N5800000m N5800000m N5800000m N5800000m N5800000m N5800000m N5800000m N5800000m N5800000m N5800000m N5800000m N5800000m N5800000m N
660000m
E660000m
E660000m
E660000m
E660000m
E660000m
E660000m
E660000m
E660000m
E660000m
E660000m
E660000m
E660000m
E660000m
E660000m
E660000m
E660000m
E660000m
E660000m
E660000m
E660000m
E660000m
E660000m
E660000m
E660000m
E660000m
E660000m
E660000m
E660000m
E660000m
E660000m
E660000m
E660000m
E660000m
E660000m
E660000m
E660000m
E660000m
E660000m
E660000m
E660000m
E660000m
E660000m
E660000m
E660000m
E660000m
E660000m
E660000m
E660000m
E
650000m
E650000m
E650000m
E650000m
E650000m
E650000m
E650000m
E650000m
E650000m
E650000m
E650000m
E650000m
E650000m
E650000m
E650000m
E650000m
E650000m
E650000m
E650000m
E650000m
E650000m
E650000m
E650000m
E650000m
E650000m
E650000m
E650000m
E650000m
E650000m
E650000m
E650000m
E650000m
E650000m
E650000m
E650000m
E650000m
E650000m
E650000m
E650000m
E650000m
E650000m
E650000m
E650000m
E650000m
E650000m
E650000m
E650000m
E650000m
E650000m
E
640000m
E640000m
E640000m
E640000m
E640000m
E640000m
E640000m
E640000m
E640000m
E640000m
E640000m
E640000m
E640000m
E640000m
E640000m
E640000m
E640000m
E640000m
E640000m
E640000m
E640000m
E640000m
E640000m
E640000m
E640000m
E640000m
E640000m
E640000m
E640000m
E640000m
E640000m
E640000m
E640000m
E640000m
E640000m
E640000m
E640000m
E640000m
E640000m
E640000m
E640000m
E640000m
E640000m
E640000m
E640000m
E640000m
E640000m
E640000m
E640000m
E
DMQDMQDMQDMQDMQDMQDMQDMQDMQDMQDMQDMQDMQDMQDMQDMQDMQDMQDMQDMQDMQDMQDMQDMQDMQDMQDMQDMQDMQDMQDMQDMQDMQDMQDMQDMQDMQDMQDMQDMQDMQDMQDMQDMQDMQDMQDMQDMQDMQ
KgKgKgKgKgKgKgKgKgKgKgKgKgKgKgKgKgKgKgKgKgKgKgKgKgKgKgKgKgKgKgKgKgKgKgKgKgKgKgKgKgKgKgKgKgKgKgKgKg
uPrPzSuPrPzSuPrPzSuPrPzSuPrPzSuPrPzSuPrPzSuPrPzSuPrPzSuPrPzSuPrPzSuPrPzSuPrPzSuPrPzSuPrPzSuPrPzSuPrPzSuPrPzSuPrPzSuPrPzSuPrPzSuPrPzSuPrPzSuPrPzSuPrPzSuPrPzSuPrPzSuPrPzSuPrPzSuPrPzSuPrPzSuPrPzSuPrPzSuPrPzSuPrPzSuPrPzSuPrPzSuPrPzSuPrPzSuPrPzSuPrPzSuPrPzSuPrPzSuPrPzSuPrPzSuPrPzSuPrPzSuPrPzSuPrPzS
uPzCuPzCuPzCuPzCuPzCuPzCuPzCuPzCuPzCuPzCuPzCuPzCuPzCuPzCuPzCuPzCuPzCuPzCuPzCuPzCuPzCuPzCuPzCuPzCuPzCuPzCuPzCuPzCuPzCuPzCuPzCuPzCuPzCuPzCuPzCuPzCuPzCuPzCuPzCuPzCuPzCuPzCuPzCuPzCuPzCuPzCuPzCuPzCuPzC
uPzCuPzCuPzCuPzCuPzCuPzCuPzCuPzCuPzCuPzCuPzCuPzCuPzCuPzCuPzCuPzCuPzCuPzCuPzCuPzCuPzCuPzCuPzCuPzCuPzCuPzCuPzCuPzCuPzCuPzCuPzCuPzCuPzCuPzCuPzCuPzCuPzCuPzCuPzCuPzCuPzCuPzCuPzCuPzCuPzCuPzCuPzCuPzCuPzC
UTM 10 NAD83Contour interval = 200m
%%%%%%%%%%%%%%%%%%%%%%%%%%%%%%%%%%%%%%%%%%%%%%%%%%%%%%%%%%%%%%%%%
Scale 1:150,000
Quesnel Lake Gneiss
Upper Proterozoic to PaleozoicSnowshoe Group
EoceneKamloops Group
Cretaceous
Devonian to Mississippian
Upper PaleozoicCrooked Amphibolite
PermianSnowshoe Group - Bralco Succession
intrusives, undivided
Upper Triassic
Middle Triassic to Upper Triassic
Nicola Group; volcanics
Nicola Group; sediments
EKacaEKacaEKacaEKacaEKacaEKacaEKacaEKacaEKacaEKacaEKacaEKacaEKacaEKacaEKacaEKacaEKacaEKacaEKacaEKacaEKacaEKacaEKacaEKacaEKacaEKacaEKacaEKacaEKacaEKacaEKacaEKacaEKacaEKacaEKacaEKacaEKacaEKacaEKacaEKacaEKacaEKacaEKacaEKacaEKacaEKacaEKacaEKacaEKaca
KgKgKgKgKgKgKgKgKgKgKgKgKgKgKgKgKgKgKgKgKgKgKgKgKgKgKgKgKgKgKgKgKgKgKgKgKgKgKgKgKgKgKgKgKgKgKgKgKg
uTrNvbuTrNvbuTrNvbuTrNvbuTrNvbuTrNvbuTrNvbuTrNvbuTrNvbuTrNvbuTrNvbuTrNvbuTrNvbuTrNvbuTrNvbuTrNvbuTrNvbuTrNvbuTrNvbuTrNvbuTrNvbuTrNvbuTrNvbuTrNvbuTrNvbuTrNvbuTrNvbuTrNvbuTrNvbuTrNvbuTrNvbuTrNvbuTrNvbuTrNvbuTrNvbuTrNvbuTrNvbuTrNvbuTrNvbuTrNvbuTrNvbuTrNvbuTrNvbuTrNvbuTrNvbuTrNvbuTrNvbuTrNvbuTrNvb
muTrNmuTrNmuTrNmuTrNmuTrNmuTrNmuTrNmuTrNmuTrNmuTrNmuTrNmuTrNmuTrNmuTrNmuTrNmuTrNmuTrNmuTrNmuTrNmuTrNmuTrNmuTrNmuTrNmuTrNmuTrNmuTrNmuTrNmuTrNmuTrNmuTrNmuTrNmuTrNmuTrNmuTrNmuTrNmuTrNmuTrNmuTrNmuTrNmuTrNmuTrNmuTrNmuTrNmuTrNmuTrNmuTrNmuTrNmuTrNmuTrN
Rock Units
uPzCuPzCuPzCuPzCuPzCuPzCuPzCuPzCuPzCuPzCuPzCuPzCuPzCuPzCuPzCuPzCuPzCuPzCuPzCuPzCuPzCuPzCuPzCuPzCuPzCuPzCuPzCuPzCuPzCuPzCuPzCuPzCuPzCuPzCuPzCuPzCuPzCuPzCuPzCuPzCuPzCuPzCuPzCuPzCuPzCuPzCuPzCuPzCuPzC
PSBPSBPSBPSBPSBPSBPSBPSBPSBPSBPSBPSBPSBPSBPSBPSBPSBPSBPSBPSBPSBPSBPSBPSBPSBPSBPSBPSBPSBPSBPSBPSBPSBPSBPSBPSBPSBPSBPSBPSBPSBPSBPSBPSBPSBPSBPSBPSBPSB
DMQDMQDMQDMQDMQDMQDMQDMQDMQDMQDMQDMQDMQDMQDMQDMQDMQDMQDMQDMQDMQDMQDMQDMQDMQDMQDMQDMQDMQDMQDMQDMQDMQDMQDMQDMQDMQDMQDMQDMQDMQDMQDMQDMQDMQDMQDMQDMQDMQ
uPrPzSuPrPzSuPrPzSuPrPzSuPrPzSuPrPzSuPrPzSuPrPzSuPrPzSuPrPzSuPrPzSuPrPzSuPrPzSuPrPzSuPrPzSuPrPzSuPrPzSuPrPzSuPrPzSuPrPzSuPrPzSuPrPzSuPrPzSuPrPzSuPrPzSuPrPzSuPrPzSuPrPzSuPrPzSuPrPzSuPrPzSuPrPzSuPrPzSuPrPzSuPrPzSuPrPzSuPrPzSuPrPzSuPrPzSuPrPzSuPrPzSuPrPzSuPrPzSuPrPzSuPrPzSuPrPzSuPrPzSuPrPzSuPrPzS
2008 Rock Sample Locations - 1
Outline of Frasergold property
2 0 2 4 Km
Scale: 1:150,000
################################################# 2008 rock sample location

Frasergold Property Boundary
DWG: 521-15-14 Figure: 13
Eureka Resources Inc.
Frasergold Project
Cariboo Mining Divison, B.C.
Scale 1:30,000
0.5 to 1.48 (3)
0.05 to 0.5 (11)
0.01 to 0.05 (86)-0.01 to 0.01 (63)
2008 Surface Rock Samples - 2Au (ppm)
June 18, 2015
500 0 500 1000 1500 m
Scale: 1:30,000
known gold mineralization
UTM 10 NAD83 Contour interval = 20m
2008 Rock SamplesAu (ppm)

2.32.7
DWG: 521-15-15 Scale: 1:15,000 Figure: 14
Eureka Resources Inc.
Frasergold Project
Cariboo Mining Division, B.C.
June 19, 2015
2011 Geochemical Sampling on Kusk GridAu (ppb)
Au (ppb) in Soils
200 to 701 (4)
50 to 200 (8)
10 to 50 (111)-1 to 10 (194)
rock sample
silt sample
UTM 10 NAD83 Contour interval = 20m

66
20
00m
E
66
50
00
m E
5798000m N
5799000m N
66
40
00
m E
66
30
00
m E
DWG: 521-15-16 Figure: 15
Eureka Resources Inc.
Frasergold Project
Cariboo Mining Division, B.C.
Scale 1:15,000
2011 Geochemical Sampling on Eureka Bowland 18 ppm Grids - Au (ppb)
June 19, 2015
rock sample
silt sample
UTM 10 NAD83 Contour interval = 20m
Au (ppb) in Soils
250 to 2,240 (1)
100 to 250 (15)
25 to 100 (65)1 to 25 (167)

DWG: 521-15-17 Scale: 1:10,000 Figure: 16
Eureka Resources Inc.
Frasergold Project
Cariboo Mining Division, B.C.
June 19, 2015
2015 Geochemical Sampling on 18 ppmGrid Extension - Au (ppb)
UTM 10 NAD83 Contour interval = 20m
Au (ppb) in Soils
250 to 2240 (4)
100 to 250 (0)
25 to 100 (3)
1 to 25 (69)

Eureka Resources Inc. Frasergold Project 31 ___________________________________________________________________________________
___________________________________________________________________________________
ERSi Earth Resource Surveys Inc. Giroux Consultants Ltd.
reference. Three of the four soil samples with anomalous gold values in excess of 250 ppb are proximal
to outcrops along Imperial Ck.
10. Drilling
A total of 328 drill holes and 35,967 meters were drilled on the Frasergold property between 1981 and
1994 (Figure 17). Most of the holes were shallow and concentrated on defining the known mineralized
areas. Drilling has been conducted along the known 10 kilometer strike length of the mineralized zone,
but drill hole density is sparse outward from the key zones.
In 2007, Hawthorne conducted a major exploration program on the property. The 2007 drill program was
laid out to test four previously defined zones of interest; including the Main Zone, the Grouse Creek West
Zone, the Grouse Creek East Zone and the Frasergold Zone. A total of 16 HQ core size diamond drill
holes totalling 3,615 meters were drilled over a period of three and a half months, with an average depth
of 226 meters. For due diligence purposes ten drill holes were drilled with the remaining six drill holes
completed as in-fill holes on the Main Zone. All drill holes were drilled to greater depths than historical drill
holes to test potential for additional zones and horizons of interest. A total of 12 holes were drilled on the
Main Zone: one drill hole was completed on the Grouse Creek West Zone, one drill hole was completed
on the Grouse Creek East Zone and two drill holes were completed on the Frasergold Zone.
The 2008 drill program included 58 NQ diameter diamond drill holes for a total of 10,413.29 meters. The
objective of the drill program was focussed on adding resources within the Main zone of the property.
Drilling within this zone has specific objectives, those being to test for mineralization down dip, up dip and
along strike in both directions as well as tightening spacing between former drilling to add confidence
when modelling the deposit for resource estimate purposes.
Table 10.1 lists the drill holes completed in 2007 and 2008 by Hawthorne which are located in Figure 18.
Table 10.1 2007 and 2008 Drill Hole Data
Zone Drill Hole
Type Easting Northing Elev (m) Dip Azimuth TotalDepth (m)
Main 07295 DDH 665123.512 5797758.32 1541.336 -62 45 227.38
Main 07296 DDH 665234.225 5797656.93 1537.503 -55 45 215.19
Main 07297 DDH 665287.188 5797548.34 1545.377 -62 45 218.23
Main 07298 DDH 665308.459 5797507.77 1549.58 -61 45 227.38
Main 07299 DDH 665505.705 5797344.65 1522.901 -61 45 212.45
Main 07300 DDH 665522.564 5797212.7 1556.203 -65 42 216.15
Grouse West 07301 DDH 665619.131 5797209.39 1517.378 -61 45 209.09
Main 07302 DDH 665491.239 5797243.87 1557.418 -60 40 233.78
Grouse East 07303 DDH 666258.663 5796412.66 1574.646 -66 45 236.83
Frasergold 07304A DDH 666505.13 5795990.07 1564.51 -59 45 154.84

DWG: 521-15-3 Scale: 1:50,000 Figure: 17
Eureka Resources Inc.
Frasergold Project
Cariboo Mining Division, B.C.
UTM 10 NAD83 Contour interval = 20m
June 15, 2015
Historical Drill Hole Plan(1983 to 1993)
diamonddrill hole
reverse circulationdrill hole

DWG: 521-15-4 Scale: 1:20,000 Figure: 18
Eureka Resources Inc.
Frasergold Project
Cariboo Mining Division, B.C.
UTM 10 NAD83 Contour interval = 20m
June 22, 2015
2007, 2008 Diamond Drill Holes
2007drill hole
2008drill hole

Eureka Resources Inc. Frasergold Project 32 ___________________________________________________________________________________
___________________________________________________________________________________
ERSi Earth Resource Surveys Inc. Giroux Consultants Ltd.
Zone Drill Hole
Type Easting Northing Elev (m) Dip Azimuth Total Depth (m)
Frasergold 07304B DDH 666504.094 5795989.19 1564.446 -59 45 262.43
Main 07305 DDH 665272.159 5797496.88 1563.44 -59 45 244.75
Main 07306 DDH 665226.265 5797546.58 1565.213 -65 45 267.31
Main 07307 DDH 665431.421 5797284.59 1564.37 -54 40 248.72
Main 07308 DDH 665172.04 5797625.64 1561.978 -65 45 239.88
Main 07309 DDH 665172.04 5797625.64 1561.978 -50 45 200.56
Main 08310 DDH 665147.644 5797663 1558.954 -60 38 53.95
Main 08311 DDH 665054.052 5797790.56 1555.643 -50 42 273.41
Main 08312 DDH 665145.587 5797661.57 1559.272 -60 38 255.12
Main 08313 DDH 665035.267 5797809.33 1555.104 -50 42 288.65
Main 08314 DDH 665079.487 5797679.73 1571.337 -65 40 233.79
Main 08315 DDH 665139.163 5797812.38 1525.509 -60 40 178.61
Main 08316 DDH 665170.015 5797814.74 1518.391 -60 40 130.30
Main 08317 DDH 665263.128 5797510.51 1563.614 -62 42 251.76
Main 08318 DDH 665181.49 5797646.96 1554.449 -50 43 224.33
Main 08319 DDH 665386.641 5797347.24 1561.309 -64 40 203.30
Main 08320 DDH 665320.993 5797462.52 1555.361 -56 40 239.57
Main 08321 DDH 665370.08 5797369.13 1560.11 -62 40 203.30
Main 08322 DDH 665355.01 5797389 1559.716 -62 40 252.07
Main 08323 DDH 665196.521 5797586.32 1565.28 -60 41 233.78
Main 08324 DDH 665475.677 5797258.59 1558.653 -59 38 196.90
Main 08325 DDH 665064.958 5797701.67 1571.487 -65 38 267.00
Main 08326 DDH 665553.542 5797192.22 1550.511 -64 36 195.68
Main 08327 DDH 665617.894 5797141.32 1538.631 -55 36 224.33
Main 08328 DDH 665060.513 5797839.37 1538.594 -50 45 206.40
Main 08329 DDH 665294.577 5797472.46 1561.868 -60 36 230.79
Main 08330 DDH 665084.032 5797871.72 1525.079 -50 38 200.25
Main 08331 DDH 665322.669 5797435.29 1561.701 -58 36 226.16
Main 08332 DDH 665417.79 5797305.75 1563.047 -58 36 206.04
Main 08333 DDH 665121.261 5797896.76 1510.92 -50 38 129.89
Main 08334 DDH 665321.556 5797589.69 1525.528 -55 38 193.85
NW Ext. 08335 DDH 665050.987 5797907.24 1524.749 -50 38 203.00
Main 08336 DDH 665216.683 5797772.74 1515.883 -60 37 81.38
Main 08337 DDH 665257.19 5797709.54 1517.622 -50 35 129.54
Main 08338 DDH 665231.585 5797734.65 1519.827 -50 35 127.10
Main 08339 DDH 665173.754 5797782.18 1523.672 -45 35 108.81
West Grouse 08340 DDH 665684.948 5797204.8 1493.802 -55 35 145.08
Main 08341 DDH 665102.454 5797794.08 1538.095 -62 35 51.21
West Grouse 08342 DDH 665543.589 5797119.93 1571.546 -60 35 199.95

Eureka Resources Inc. Frasergold Project 33 ___________________________________________________________________________________
___________________________________________________________________________________
ERSi Earth Resource Surveys Inc. Giroux Consultants Ltd.
Zone Drill Hole
Type Easting Northing Elev (m) Dip Azimuth Total Depth (m)
Main 08343 DDH 665102.253 5797793.47 1538.222 -62 35 148.13
Main 08344 DDH 665443.464 5797457.33 1512.014 -49 35 126.19
NW Ext. 08345 DDH 664988.91 5797769.06 1569.43 -50 35 291.69
Main 08346 DDH 665409.937 5797459.05 1523.72 -53 37 169.77
Main 08347 DDH 665398.097 5797478.46 1523.465 -48 37 145.39
NW Ext. 08348 DDH 665005.114 5797854.23 1547.574 -51 34 69.19
Main 08349 DDH 665413.497 5797403.39 1538.172 -57 35 172.51
NW Ext. 08350 DDH 665005.108 5797854.15 1547.56 -51 34 230.43
Main 08351 DDH 665460.117 5797359.21 1532.972 -58 35 157.28
Main 08352 DDH 665477.491 5797423.15 1505.924 -57 35 111.56
NW Ext. 08353 DDH 664974.369 5797894.97 1543.312 -50 35 200.25
Main 08354 DDH 665528.442 5797366.26 1508.385 -50 35 151.18
Main 08355 DDH 665531.554 5797401.05 1494.808 -50 35 102.72
Main 08356 DDH 665600.034 5797337.85 1493.531 -65 36 96.62
Main 08357 DDH 665259.673 5797672.57 1524.772 -50 35 154.53
Main 08358 DDH 665638.159 5797292.7 1492.277 -57 36 99.36
West Grouse 08359 DDH 665674.025 5797262.27 1484.348 -52 36 84.43
Main 08360 DDH 665620.012 5797324.22 1490.09 -60 36 141.43
Main 08361 DDH 665475.312 5797339.83 1536.17 -60 35 145.08
Main 08362 DDH 665509.897 5797302.01 1533.619 -60 35 151.18
NW Ext. 08363 DDH 665025.823 5797878.81 1536.92 -50 35 221.28
NW Ext. 08364 DDH 664961.325 5797796.31 1569.022 -50 35 282.55
NW Ext. 08365 DDH 664962.369 5797955.67 1531.543 -50 35 206.35
NW Ext. 08366 DDH 664908.992 5797971.98 1533.888 -50 35 206.35
NW Ext. 08367 DDH 664994.225 5797921.13 1534.798 -50 35 203.00
11. Sample Preparation, Analyses and Security
11.1. 1984 to 1994 Programs
No sample material from the previous programs is available to conduct check or confirmation assays.
Sample preparation, quality control measures, sample splitting, analytical procedures, security measures
for exploration programs during this period are summarized below, from Campbell et al, 1991 in a report
for Asarco Inc. and Eureka Resources Inc.
11.1.2 Reverse Circulation Drilling
The reverse circulation drilling on the Frasergold property utilized a technique whereby compressed air
was injected down the hole through the outer circumference of the drill pipe to the hammer which
transmitted a high energy shock to the bit face. The resulting chips were carried into an inner sample

Eureka Resources Inc. Frasergold Project 34 ___________________________________________________________________________________
___________________________________________________________________________________
ERSi Earth Resource Surveys Inc. Giroux Consultants Ltd.
recovery tube, thereby avoiding any sample contamination from cuttings uphole. At the end of every 10ft
(3.1m) drill rod the hole was flushed out.
A sample interval is 1.5m long from a 5.5" diameter hole having a theoretical weight of 61.6kg. Two
opposing chambers in a rotary splitter provided a 1/8 split which was collected for assay. The assay
sample (1/8 split) was collected in a specially treated, 13" x 26", 400 mesh Bone Velour Micro Por bag
held in place under the splitter. The seams on the bag are double stitched with a polyester lock stitch. The
bags have a rolled seam with a nylon draw cord for closure and hanging.
The entire sample (cuttings and water) was contained in the Micro Por bag under ideal conditions.
Specially designed drying racks at the drill site were used to hang the assay bags for periods of up to 24
hours. When the assay samples were adequately drained at the drill site they were transported to camp
where they were hung again to drip dry before placing in 100lb rice bags for transport. Samples were
shipped on a weekly basis to the laboratory of Bondar-Clegg in North Vancouver, B.C. in a chartered 5
ton truck.
11.1.3 Underground Channel Samples
Sampling was carried out with electric chisels producing channels averaging 3-5cm wide and 1-4cm
deep. The samples weighed between 3 and 15kg with an average weight of about 10kg. Wherever
possible the samples were taken perpendicular to veins or vein zones. Where this was not possible, due
to complexity or lack of veining, the samples were taken horizontally or vertically.
Individual samples were placed in heavy duty poly bags, sealed with twist ties before being placed in
100lb rice bags for transport to Bondar-Clegg.
11.1.4 Underground Bulk Sampling
In 1990 Asarco Inc. supervised the collection of four bulk samples, each about 1 metric tonne, from the
main drift and crosscut. The samples were shipped to Bacon Donaldson and Associates Ltd. for
preliminary metallurgical testing.
The mining program in 1991 was contracted to Beaton Engineering Ltd. and Vicore Mining
Developments Ltd. of Vancouver, B.C. Drifts and crosscuts totalling 114m in length were mined resulting
in 9 "Lots" which were then shipped on B-train transport trucks to Nesmont Precious Metals Corp. in
Vancouver, B.C. by Kootenay Machinery and Transport Ltd. All shipments were weighed on certified
scales upon arrival at the mill site.
11.1.5 Diamond Drilling
All core was cut in half with a rock saw or hand splitter. Half of each cut sample was placed in a plastic
sample bag with an assay tag and stored in 100lb rice bags for transport to Bondar-Clegg.

Eureka Resources Inc. Frasergold Project 35 ___________________________________________________________________________________
___________________________________________________________________________________
ERSi Earth Resource Surveys Inc. Giroux Consultants Ltd.
11.1.6 Security
At no time did the primary author of this report, who was on site for many of the programs during this
period, ever have any doubt as to the integrity of the sampling, sample preparation, sample storage, note
keeping and the competence of those people involved in the exploration activities. This author has
participated in all programs on the Frasergold property since 1984 and has had full confidence in the data
collection and processing during these programs.
11.1.7 Drill Sample Analyses
The great majority of drill samples were analyzed by Bondar-Clegg in North Vancouver, B.C. Both fire
assays and metallic sieve analyses were performed by this very well known, established and certified
laboratory.
The procedure for the fire assay was as follows:
6. one assay ton (29.166 grams) of homogenous pulp is weighed into a fireclay crucible and fluxed with lead oxide, litharge, soda, silica, borax glass and flour
7. the samples are fused at 1950°F until a clear melt is obtained
8. the 30-40 gram button that is produced is then separated from the slag and heated in a cupellation furnace to separate the lead from the noble metals.
9. the precious metal beads are then dissolved in agua-regia which is then analyzed using atomic absorption
10. in the case of high grade samples, greater than 0.2 oz per ton, the precious metal bead is parted in dilute HNO3 acid to dissolve the silver and the remaining gold is weighed.
The procedure for metallic sieve analysis was as follows:
1. the entire sample is crushed to 10 mesh
2. a representative split, weighing 200-300 grams, of the minus -10 mesh material is taken with a Jones riffle splitter
3. the minus -10 mesh split is pulverized with a ring puck type pulverizer and classified with a 150 mesh screen
4. coarse particulate gold is physically concentrated into one size fraction, the + 150 mesh fraction.
5. the gold content of the +150 mesh fraction is determined by the fire assay procedure outlined above
6. the gold content of the minus - 150 mesh fraction is determined by routine atomic absorption analysis
7. the gold content of the +150 mesh fraction is then mathematically redistributed over the original sample using a weighted average calculation
11.1.8 Analytical Quality Control Procedures
Bondar-Clegg routinely ran a duplicate analysis for 2 out of each batch of 24 samples as well as a
standard sample analysis. All samples that were analyzed over 0.2 oz per ton on the original fusion were

Eureka Resources Inc. Frasergold Project 36 ___________________________________________________________________________________
___________________________________________________________________________________
ERSi Earth Resource Surveys Inc. Giroux Consultants Ltd.
run again to verify the results. Certified standards and in-house pulp standards as well as synthetic
solution standards were run with each report or batch of samples.
11.2. 2007 Program
11.2.1 Rock Outcrop Sampling
During the surface geological mapping and sampling program geologists described rock samples in as
much detail as possible. The location of the sample sites was determined with hand-held GPS units and
reference to topographical maps or orthophotos. Sample sites were recorded and samples weighing
approximately 4 kg were placed in individual plastic sample bags along with their corresponding sample
tag. The notes and data in the field were then transferred from the paper records into a digital database.
Sample preparation and analyses of rock outcrop samples was as follows:
8. crush entire sample to minus (-)10 mesh, mix and riffle out 1.0 kg
9. pulverize the 1.0 kg sample to minus (-)150 mesh and screen
10. weigh and fire assay (FA/AAS) the entire +150 fraction
11. mix and split three identical 1 assay-tonne samples from the minus (-)150 fraction for fire assay
12. all Au assays to be 1 assay-tonne fire assay followed by gravimetric finish
13. average the three minus (-)150 mesh assays, combine with +150 mesh assay on a weighted basis to determine Estimated average gold value
14. report all four assays and weighted average gold value
11.2.2 Trench Sampling
In the course of the trench sampling exploration crews cut two narrow parallel channels with a portable
diamond saw along the bottom of the sill of the trench. Each narrow channel was approximately 2‐4 mm
wide, the two parallel channels were spaced equally apart (approximately 2.5” or 63.5mm) along the
entire length of the channels, with the material between each channel meant to represent the width of an
HQ diamond drill hole. The intervening rock sample material between the two narrow channels was then
carefully and entirely chipped out in 1 to 1.5 meter interval lengths, with the chipped material carefully
bagged and marked for assaying. The approximate weight of the trench samples was 4 kg. All trench
channel samples were sent to IPL.
Sample preparation and analyses of trench samples was as follows:
1. crush entire sample to minus (-)10 mesh, mix and riffle out 1.0 kg
2. pulverize the 1.0 kg sample to minus (-)150 mesh and screen
3. weigh and fire assay (FA/AAS) the entire +150 fraction.
4. mix and split three identical 1 assay-tonne samples from the minus (-)150 fraction for fire assay
5. all Au assays to be 1 assay-tonne fire assay followed by gravimetric finish

Eureka Resources Inc. Frasergold Project 37 ___________________________________________________________________________________
___________________________________________________________________________________
ERSi Earth Resource Surveys Inc. Giroux Consultants Ltd.
6. average the three minus (-)150 mesh assays, combine with +150 mesh assay on a weighted basis to determine Estimated average Au value
7. report all four assays and weighted average gold value
11.2.3 Underground Channel Sampling
At each predetermined channel sample site the exploration crews used portable rotary saws with
diamond blades to cut two narrow parallel channels starting from near the sill and cut to near the back.
Each cut channel ranged from approximately one to two meters in total length. Each narrow cut channel
measured approximately 2‐4 mm in width, with the two parallel channels spaced equally apart
(approximately 2.5” or 63.5mm) along the entire length of the channels, with the material between each
channel meant to represent the width of an HQ diamond drill hole. The intervening rock sample material
between the two narrow channels was carefully and entirely chipped out in 0.38m to 1.14 meter interval
lengths starting at the top of the 1 to 2 meter interval, with the chipped material carefully collected on
plastic tarps placed on the sill of the workings. On average, each sample was 0.8m in length. At sites
where the channel was two meters in length, the bottom one meter was chipped out separately after the
first one meter had been collected. At 96 of the 115 sample sites two samples were collected. The
remaining 19 channels sample sites were less than 1 meter in length and only one sample was collected.
At each site the chip material was carefully bagged and marked for assaying; all channel samples were
sent to IPL.
Sample preparation and analyses of the underground channel samples was as follows:
1. crush entire sample to minus (-)10 mesh, mix and riffle out 1.0 kg
2. pulverize the 1.0 kg sample to minus (-)150 mesh and screen
3. weigh and fire assay (FA/AAS) the entire +150 fraction
4. mix and split three identical 1 assay-tonne samples from the minus (-)150 fraction for fire assay
5. all Au assays to be 1 assay tonne fire assay followed by gravimetric finish
6. average the three minus (-)150 mesh assays, combine with +150 mesh assay on a weighted basis to determine Estimated average Au value
7. report all four assays and weighted average gold value
11.2.4 Underground Bulk Sampling
The location of the underground bulk sample sites were recorded with regard to adit reference, as well as
in NAD83 coordinates and elevation. The samples were carefully identified lithologically and where
possible structural notes were also taken. The samples were acquired by chipping from the walls over an
approximate area of 1.5 m x 1 m, using a stopper or small chipping hammer. The sample material at
each site was collected in 6 to 10 rice bags and removed from the workings using a wheelbarrow. It was
then transferred to white 20 liter pails with each pail numbered and marked with respect to the bulk

Eureka Resources Inc. Frasergold Project 38 ___________________________________________________________________________________
___________________________________________________________________________________
ERSi Earth Resource Surveys Inc. Giroux Consultants Ltd.
sample site; each site bulk sample weighed approximately 200 kg in the pails. The samples were then
shipped to Process Research Associates ("PRA") in Richmond, British Columbia for analysis.
Analysis of the underground bulk samples by PRA followed their recommended procedures for
determining the head grade. Two procedures were followed for each bulk sample; a cyanide leaching
method and a metallic gold assay procedure.
The cyanide leach process involved:
1. splitting out a 50 kg sample from each individual bulk sample which was then ground, crushed and heavily cyanided
2. the cyanide liquid, which is estimated by PRA to recover 95-97% of the gold, was then fire assayed
3. the residue from the leaching process, which is estimated by PRA to recover 3 - 5% of the gold, was then filtered, dried, well mixed and assayed in duplicate
4. the average weighted head grade was then estimated
The metallic sieve procedure involved:
1. splitting out a 50.0 kg sample from each individual bulk sample
2. crush the entire sample to minus (-)10 mesh, mix and riffle out 1.0 kg
3. pulverizing the 1.0 kg sample to minus (-)150 mesh and screening
4. weigh and fire assay the entire +150 fraction
5. mix and split out three identical 1 assay-tonne samples from the minus (‐ 150 fraction for fire assay
6. all gold assays were for 1 assay-tonne followed by gravimetric finish
7. average the three minus (-)150 mesh assays, combine with the +150 mesh assay on a weighted basis to determine estimated head grade
8. report all four (4) assays and the weighted head grade
11.2.5 Diamond Drilling and Sampling
The core sampling protocol followed in the 2007 and 2008 programs were as follows:
1. convert all drilling blocks from Imperial to metric
2. label each box with drillhole number, box number and the contained core interval using a 1”x 4” buttersoft tag or Dymo aluminum tapewriter
3. calculate core recoveries and rock‐quotient‐density measurements (RQD)
4. log core for rock type, alteration, structure and mineralization
5. Lay out sample intervals using a 1”x 3” buttersoft with colored tagging and sample tag
6. with a black felt marker, write on the top left‐hand corner of each box, the hole number, box number and starting interval
7. on the bottom right corner, mark the finishing interval. This was in large, clear letters for photographing
8. photograph the core, with all tags, markers, etc. in place before splitting

Eureka Resources Inc. Frasergold Project 39 ___________________________________________________________________________________
___________________________________________________________________________________
ERSi Earth Resource Surveys Inc. Giroux Consultants Ltd.
9. mark the cut lines on the core with a felt marker
10. split core using the diamond saw and assemble samples according to the intervals
11. write sample number on inner bag, double bag all samples, and place the sample tag between the two bags
12. place up to five consecutively numbered samples in a white ‘rice sack’
13. each ‘rice sack’ is to be consecutively numbered and sealed with a randomly numbered security tag
14. the last ‘rice sack’ in the shipment is to contain copy No.1 of the IPL sample submission form
15. the ‘rice sacks’ were transported to Williams Lake where they are placed on pallets, shrink wrapped and stored until being shipped to Vancouver to International Plasma Lab Ltd.
16. specific gravity determinations were run on approximately 100 representative whole core samples by the Mining Engineering Department at UBC. These 8” to 10” cores were collected throughout the drilling program, identified, tagged and held until the end of the drilling season
Sample preparation and analysis of the core samples collected in 2007 was as follows:
1. dry sample
2. crush entire sample to minus (‐ 10 mesh, mix and riffle out 1.0 kg
3. pulverize the 1.0 kg sample to minus (-)150 mesh and screen
4. weigh and fire assay the entire +150 mesh fraction
5. mix and split three identical 1 assay-tonne samples from the minus (-)150 m fraction for fire assay
6. all gold assays were for 1 assay-tonne followed by gravimetric finish
7. average the three minus (-)150 mesh assays, combine with the +150 mesh assay on a weighted basis to determine Estimated head grade
8. report all four assays and the weighted head grade
Due to the slow process of completing the screened metallic analysis on all core samples, a review of the
procedures was undertaken by management and IPL, and a decision was made to modify the core
sample analysis in order to speed up the assaying process without materially affecting the overall results.
Consequently starting in late October 2007 all core samples submitted to IPL were first assayed by
conventional fire assay procedures prior to having screened metallic analysis completed on all samples.
Starting in early November a new protocol was enacted whereby a threshold was set for fire assay values
at which time the IPL automatically completed screened metallic assays on all samples where the original
fire assay were equal to or greater than 0.1 ppm (1 gm/Tonne – I prefer using 1.0 g/t Au). Any samples
less than 0.1 ppm did not have screened metallic analysis completed.
Core samples collected during the 2008 program were prepared and analysed by IPL as follows:
1. the entire 1.0 to 5.0 kg core samples were crushed with >85% passing -2mm or minus (-) 10 mesh
2. a 1000 gram sample was then ‘riffle split’ from the crushed sample
3. 1000 gram split sample was then pulverized to >85% passing 75 microns or minus (-)200 mesh

Eureka Resources Inc. Frasergold Project 40 ___________________________________________________________________________________
___________________________________________________________________________________
ERSi Earth Resource Surveys Inc. Giroux Consultants Ltd.
4. the 1000 gram pulverized sample was weighed and a 150 gram representative sub-sample pulp was collected by taking a number of scoops at right angles through the homogenized 1000 gram split sample and leaving behind an 850 gram bulk Master Pulp/Fine Reject fraction to be stored at IPL
5. the 150 gram representative sub-sample, referred to as the working pulp and was placed in a small envelope for analysis
6. the 150 gram sub-sample was sub-sampled for analysis by taking 2 to 3 scoops from different places in the small envelope containing the sample
7. 50 gram samples were used for each Au analysis by fire assay and AAS. The same 50 gram sample was used for 30 element ICP analysis. This consisted of four acid “near total” digestion by HF-HNO3-HClO4 digestion, HCl leach and ICPAES
8. all samples reporting more than 0.10 ppm Au by fire assay were re-assayed using the screened metallics procedure described above for the 2007 core samples
11.3. 2008 Exploration Program
11.3.1 Soil Sampling
Soil samples, weighing approximately 1 kg, were collected primarily from the B Horizon and placed into
Kraft paper bags together with a sample tag. Brief description notes were made and locations determined
with hand-held GPS units.
11.3.2 Silt Sampling
Conventional silt sampling practices were followed. Approximately 1 kg of fine grained material was
placed into Kraft paper bags which were then air dried. Brief description notes were made and locations
determined with a hand-held GPS.
11.3.3 Rock Sampling
One to two kilograms of fresh rock was sampled and placed into a plastic sample bag together with a
sample tag. Brief description notes were made and locations determined with a hand-held GPS.
11.3.4 Diamond Drilling
The 2008 drill program included 58 NQ2 diameter diamond drill holes for a total of 10,413.29 meters. The
objective of the drill program was focussed on adding resources within the Main zone of the property.
Drilling within this zone has specific objectives, those being to test for mineralization down dip, up dip and
along strike in both directions as well as tightening spacing between former drilling to add confidence
when modelling the deposit for resource estimate purposes.
The core sampling protocol followed in the 2008 program was the same as that described for the 2007
program (Section 11.2.5).

Eureka Resources Inc. Frasergold Project 41 ___________________________________________________________________________________
___________________________________________________________________________________
ERSi Earth Resource Surveys Inc. Giroux Consultants Ltd.
12. Data Verification
This report draws much information from work completed prior to the implementation of National
Instrument 43-101. In the opinion of the authors, the exploration programs as described in the reviewed
reports were conducted to then-accepted industry standards.
The authors were provided unencumbered access to all available data known for the Frasergold property.
The majority of the data was in paper format and included copies of reports prepared by the geological
consultants and company representatives that oversaw the exploration work on the property. Included in
this data were some, but not all, of the original signed analytical certificates. A comparison of the
geochemical database with the certificates did not identify any data input errors.
Digital data provided for the Frasergold property consisted primarily of drill collar survey co-ordinates.
These points were shown to correspond accurately with the hand drafted drill plans. A total 35,967 meters
in 328 drill holes were completed on the Frasergold property between 1981 and 1994, with an additional
16 drill holes completed and totalling 3,615 meters in 2007, and 58 drill holes completed and totalling
10,414m in 2008.
No new check assay or sample evaluation work was conducted by the authors on the historic drill
samples due to their lack of availability. No historic samples exist on which to perform this work. However,
the specific companies involved at Frasergold and the number of companies involved adds confidence to
this database.
12.1. 2007 Program
12.1.1 2007 Standards, Blanks and Duplicate Samples
The accepted analytical values for blanks and low, - medium- and high grade standards used in the 2007
quality control program are as follows:
Low 0.77 ± 0.06 g/t Au GS-P7A
Medium 2.03 ± 0.12 g/t Au GS-2B
High 3.58 ± 0.31 g/t Au GS-3C
Blank <0.01 g/t Au
The +/- error quoted is the “between lab” two standard deviations. All the standards were prepared by
CDN Resource Laboratories Ltd. of Delta, B.C. according to a well defined, rigorous procedure. The
quoted errors for the standards are very different from those quoted for the wide variety of internationally
available standards and are described as follows:
“The mean and standard deviation for all data was calculated. Outliers were defined as samples beyond the mean +2 standard deviations from all the data. These outliers were removed from the data and a new mean

Eureka Resources Inc. Frasergold Project 42 ___________________________________________________________________________________
___________________________________________________________________________________
ERSi Earth Resource Surveys Inc. Giroux Consultants Ltd.
and standard deviation was determined. This method is different from that used by Government agencies in that the actual ‘between-laboratory” standard deviation is used in the estimations. This produces upper and lower limits that reflect actual individual analyses rather than a grouped set of analyses. The limits can therefore be used to monitor accuracy from individual analyses, unlike the Certified Limits published on other standards.”
A standard or blank sample was inserted into the drill core samples according to the following:
Every 20th sample – standard sample (one low, medium or high in random order)
Every 80th sample – blank sample
Every 30th sample – duplicate core sample (see below for description)
Based on this methodology, it was important to physically count 20 actual core samples before inserting
the next standard, and to physically count all core samples before inserting the next standard and/or
blank.
At the point standards were inserted, core logging geologists used a 1”x 3” buttersoft and a different
colored piece of tagging, and placed the small standard sample bag and sample tag in the core box.
The ‘duplicate core sample’ process was done in conjunction with the various QA/QC standards and
blanks inserted. In the case of the ‘duplicate core sample’, a second 1”x 3” buttersoft, tagging and sample
tag illustrating the same interval on it was placed in the core box. For this ‘duplicate sample’, the original
split half and corresponding ¼ split were used to make up two identical samples in sequence. All three
‘duplicate’ sequential sample tags and an explanatory sheet (with filled-in sample numbers) were placed
in with the bag of the 1/4 of the split core. By placing them all together, it alerted the sample preparation
person at IPL that something quite different was required for that sample.
The following outlines the numbering sequence and required analyses to be used for the duplicate core
sample, using an actual example. It should be noted that, in this particular set of duplicate samples, 3/4 of
the core is used.
1. First half of core: crush, prepare and assay as routine: Sample No. 32
2. Second half of core: diamond saw in half to produce two ¼ core sections. Place the first part of the ¼ core back in core box.
3. Second part (1/4) of core: crush and split
4. First half of crushed sample is split into Parts A and B.
5. Part A of pulverized pulp for analysis: Sample No. 33
6. Part B of pulverized pulp for analysis: Sample No. 34
7. Second half of crushed sample for analysis: Sample No. 35

Eureka Resources Inc. Frasergold Project 43 ___________________________________________________________________________________
___________________________________________________________________________________
ERSi Earth Resource Surveys Inc. Giroux Consultants Ltd.
This is shown schematically as:
Second Part (1/4) of Split Drill Core ----------- → Crush & Split
|
Split 1 Split 2
Pulverize Pulverize
Sub-split Analysis Sample No.35
Analysis Sample No.33 Analysis Sample No. 34
32
33, 34 stays in
35 core box
The QA/QC Check Assay portion of the 2007 program was performed once all assay samples had been
finished by IPL. On completion of the assay program, Hawthorne Gold sent a list of specific samples (1 in
every 20 core samples) in which IPL split out a 2 kg subsample from the original crushed reject and sent
this to ALS Chemex for Metallic Sieve Au analysis. ALS Chemex split the sample and returned one half to
IPL for blind sample re-assay.
12.1.2 Results of 2007 Blanks and Standard Analyses
Results of 42 consecutive analyses of blank material were documented in an in-house account of QC
results for the 2007 sampling/analytical work. Forty-one of these analyses are near or below the detection
limit as expected. A single value returned as 3.8 g/t Au, a value that is close to the high standard used. It
is likely that a high grade standard was inadvertently tagged as a ‘blank’.
Plots of successive analyses for the three standards are shown in Figures 19, 20 and 21. Results for the
41 low-grade standard values are reasonable and acceptable (Figure 19). The single low outlier value on
the plot for GS-2B (Figure 20) is likely a result of mislabelling of a low-grade standard as a medium grade
standard. The two low outlier values on the diagram for GS-3C (Figure 21) appear to represent two
blanks that were inadvertently labelled as high-grade standards.
Part B Part

Eureka Resources Inc. Frasergold Project 44 ___________________________________________________________________________________
___________________________________________________________________________________
ERSi Earth Resource Surveys Inc. Giroux Consultants Ltd.
Figure 19. Successive analyses by IPL of low grade standard, GS-P7A, obtained during the 2007 sampling/assaying program. Extreme dashed lines mark 95% error range quoted by CDN Resource Laboratories Ltd.
Figure 20. Successive analyses by IPL of medium grade standard, GS-2B, obtained during the 2007 sampling/assaying program. Extreme dashed lines mark 95% error range quoted by CDN Resource Laboratories Ltd.
The analytical data for the blank and standards shows acceptable analytical quality and absence of bias.
Four of the 167 analyses (2.4%) appear to represent mislabelling when blanks and standards were
inserted into the analytical sequence.

Eureka Resources Inc. Frasergold Project 45 ___________________________________________________________________________________
___________________________________________________________________________________
ERSi Earth Resource Surveys Inc. Giroux Consultants Ltd.
Figure 21. Successive analyses by IPL of high-grade standard, GS-3C, obtained during the 2007 sampling/assaying program. Extreme dashed lines mark 95% error range quoted by CDN Resource Laboratories Ltd.
12.1.3 2007 IPL Original Analyses versus ALS Chemex Check Analyses
Check analyses were obtained for 202 original samples through re-analysis of pulps by ALS Chemex.
One of these samples produced an obvious outlier that was removed from the data. The remaining 201
pairs of data are plotted on Figure 22.
Figure 22. IPL original gold value (Au ppm) versus ALS Chemex corresponding check value (CHEMAU) for 2007 data. Values in ppm (g/t). N = 201. The upper line is y = x; the lower line is the reduced major axis fit to the data (RMA), the parameters of which are given in the diagram.

Eureka Resources Inc. Frasergold Project 46 ___________________________________________________________________________________
___________________________________________________________________________________
ERSi Earth Resource Surveys Inc. Giroux Consultants Ltd.
There are two important features shown in Figure 22. The first is that there is a consistent 10 percent
proportional bias between the results from the two labs, with IPL averaging high relative to ALS Chemex.
This is evident in the slope value of 0.90 for the RMA line. The available data do not make evident if one
or both labs are in significant error. This result is surprising because of acceptable results reported by IPL
for the three standards throughout the period of their analyses. It is possible that during the short period
when ALS Chemex did their analyses, the lab was reporting values slightly too low. These results should
be rechecked.
The second important feature of the diagram is the relatively limited scatter about the RMA line and the
uniformity of dispersion for values higher than about 0.5 g/t Au. Of course, none of the check values are
for original data greater than 2 g/t Au, a limitation of the data, and no information exists concerning
possible bias of values greater than 2.0 g/t. Considering the somewhat poorer internal repeatability for
pulps shown by IPL (see discussion of field duplicates), the limited dispersion of Figure 11 is surprising,
particularly since the IPL analyses were done intermittently over a long period of time whereas the ALS
Chemex analyses were done over a relatively short time interval after the main sampling/analytical
program. In general, monitoring by an external lab should be done concurrent with the main analyses of
the sampling/analytical program.
12.1.4 Field Duplicate Analyses, 2007
The ‘field duplicates’ for the 2007 program are not strictly field duplicates because the original values are
half-core and the ‘duplicates’ are quarter-core. Consequently, a comparison will overestimate the average
total error in the data. In order to make a fairer comparison a single value for the three values for each
quarter-core ‘duplicate’ has been generated. This procedure to some extent counteracts the increased
dispersion of values to be expected from quarter-core data. The average was derived by first averaging
the two values obtained on the same pulp and then combining that average with the third value obtained
for a separate prep sample.
A plot of ‘field duplicate’ values is shown in Figure 23, which displays very wide dispersion (expected in
gold deposits with a high nugget effect) and a superficial bias.
The bias is minimal if only data less than 2.0 g/t Au are considered. Difficulty in reproducing high values is
characteristic of deposits with a high nugget effect and can arise in part because the figure compares
half-core data with quarter-core data. Consequently, the bias is considered to be more apparent than real
and to be superficial, related to the general difficulty in reproducing high grade samples in a high nugget
effect gold deposit.
The wide dispersion of values shown in Figure 23 reflects total error in the data, that is the sum of
sampling error, preparation error and analytical error, and provides insight into the quality of individual
analyses that will eventually be used for resource estimation purposes. The value for dispersion about the
RMA line allows an estimation of the average error (standard deviation) in the data, 0.59 g/t Au in this

Eureka Resources Inc. Frasergold Project 47 ___________________________________________________________________________________
___________________________________________________________________________________
ERSi Earth Resource Surveys Inc. Giroux Consultants Ltd.
case. If five samples are combined into a single composite, the error is reduced substantially to 0.264 g/t
Au. Similarly, if four such composites are used to estimate a block, the error is further reduced to 0.13 g/t
Au. Of course these estimates are based on idealized estimations and are possibly overestimated
because they are based on a half-core to quarter-core comparison. Nevertheless, the results give a
guideline to the minimum amount of data required to obtain acceptable quality in block estimation.
Figure 23. IPL analyses of original sample (AU_PPM) versus “field duplicate” (FD12A3). Upper line is y = x; lower line is reduced major axis best fit to data. Apparent bias is reduced if values greater than 2 g/t (open squares) are removed.
12.1.5 Preparation Duplicate Analyses, 2007
Two comparisons of preparation duplicates can be made with the available data, each of the two pulp
analyses (from ‘field duplicate’) can be compared with the third analysis of the quarter-core which is
based on reject material. One of these comparisons is shown in Figure 24. Comparable results were
obtained for the other comparison. If two values greater than 4.0 g/t Au are removed, the RMA line and
the y = x line are essentially coincident. The dispersion of values is significantly less than in the case of
total error (Figure 23) and is substantially more than for analytical error (Figure 25).

Eureka Resources Inc. Frasergold Project 48 ___________________________________________________________________________________
___________________________________________________________________________________
ERSi Earth Resource Surveys Inc. Giroux Consultants Ltd.
Figure 24. IPL analyses of first pulp (from ‘field duplicate’) versus third analysis representing separate reject material. Upper line is y = x; lower line is RMA fit to the data. With two values greater than 4.0 g/t Au removed, the RMA and y = x lines are essentially coincident.
12.1.6 IPL Reproducibility of Pulp Analyses, 2007
Duplicate pulp analyses were done by IPL as part of the analytical program dealing with ‘field duplicates’.
These are shown in Figure 25. The data have a relatively large dispersion for repeat pulp analyses for
various subsets, indicating problems with reproducibility over the entire range of values. The spread of
data points is also large relative to the plot of Figure 22 comparing IPL analyses and those by ALS
Chemex on the same pulps.
Figure 25. IPL duplicate analyses of same pulp (from ‘field duplicate’ data). Data in “g/t Au”. Upper line is RMA line, greatly influenced by two values greater than 4.0 g/t Au. With those two values removed the RMA line essentially coincides with the lower line y = x.

Eureka Resources Inc. Frasergold Project 49 ___________________________________________________________________________________
___________________________________________________________________________________
ERSi Earth Resource Surveys Inc. Giroux Consultants Ltd.
12.1.7 Sources of Errors, 2007
The available data allows a very crude assessment of the magnitude of errors from various sources. In
general, errors are additive as variances (squares of standard deviations) as follows:
st2 = ss
2 + sp2 + sa
2
where st2 = total error
ss2 = sampling error
sp2 =sample preparation error, and
sa2 = analytical error
Error Source Dispersion Std. Deviation (Std.
Devation)2
Analytical 0.2353 0.1793 0.03213
Preparation plus
average analytical
error
0.4403 0.3113 0.09693
Total Error 0.8287 0.586 0.3434
From the above listing, a rough estimate of the magnitude of various errors can be determined as follows:
(Analytical error)2 = 0.3213 or 9.4%
(Preparation error)2 = .09693 - .03213 = .06480 or 18.9%
(Sampling error)2 = 0.3434 – 0.09693 = 0.24647 or 71.7%
The various absolute errors are high because the deposit has a high nugget effect. Relative magnitude of
errors (roughly 10% for analysis, 20% for preparation and 70% for sampling) is typical of high nugget
effect gold deposits.
12.2. 2008 Program
12.2.1 2008 Standards, Blanks and Duplicate Sample Preparation
Duplicate samples were collected every 20 samples. The following sample bag was left empty but with a
designated sample number and known as the check assay sample. At IPL the designated preparation
duplicate sample was crushed into three samples; two were retained by IPL for pulverizing and duplicate
assaying, while the third crushed sample was sent to ALS Chemex Laboratories (ALS Chemex) in North

Eureka Resources Inc. Frasergold Project 50 ___________________________________________________________________________________
___________________________________________________________________________________
ERSi Earth Resource Surveys Inc. Giroux Consultants Ltd.
Vancouver. The third crushed sample was pulverized at ALS Chemex and assayed as the check assay
sample.
The preparation duplicate and check assay samples were prepared during milling at IPL. During the
crushing stage, the duplicate sample was riffle or rotary split into three (3) 1000 gram crushed sub-
sample portions. Two of the three (3) crushed 1000 gram samples were pulverized and homogenized at
IPL as above, while the third (3rd) 1000 gram crushed sample was be sent to ALS without being
pulverized. The first two (2) samples were analyzed as above as the ‘preparation original’ and the
‘preparation duplicate’. The third (3rd) of the three (3) crushed samples , the check assay sample, was
sent to the ALS Chemex for similar analysis.
1. At the crushing stage, the sample is riffle or rotary split into three (3) 1000 gram crushed sub-sample portions.
2. Two of the three (3) crushed 500 gram samples are then pulverized and homogenized at IPL as above, while the third (3rd) crushed sample was sent to ALS Chemex without being pulverized.
3. The first two (2) samples are analyzed as above as the ‘preparation original’ and the ‘preparation duplicate’.
4. The third (3rd) of the three (3) crushed samples are sent to the ALS Chemex for similar analysis and is defined as the ‘check assay’.
5. The crusher is cleaned after every batch using barren material.
6. The pulverizer is cleaned after every batch using barren material.
Where field duplicates are taken, each represents ¼ core; where duplicate and check assay samples
were taken, they represent crushed material that is riffled to three samples, two for analyses by IPL and
one for analysis by ALS Chemex.
The field duplicates will over estimate the total error in the non-duplicated data because the field
duplicates are ¼-core rather than ½-core for the great bulk of analyses. The preparation duplicates will
permit an evaluation of the combined preparation and assaying error by IPL. Check assays by ALS
Chemex can be compared with the IPL preparation duplicates to monitor for bias. No data exist from the
QC protocol to provide an independent monitor of IPL analytical precision for the 2008 program.
12.2.2 Results of 2008 Blanks and Standard Analyses
Blanks and standards used for quality control in 2008 are listed below. A change in standards was
necessitated part way through the program because of depletion of standards. Quoted limits are two
interlab standard deviations according to CDN Resource Laboratories Ltd., who prepared the standards.

Eureka Resources Inc. Frasergold Project 51 ___________________________________________________________________________________
___________________________________________________________________________________
ERSi Earth Resource Surveys Inc. Giroux Consultants Ltd.
Reference # Standard Au g/t
CDN-GS-P7A Low 0.77 +/- 0.06 Hole 08310 to 08356 used the first group of Standards.
CDN-GS-2B Medium 2.03 +/- 0.12
CDN-GS-3C High 3.58 +/- 0.31
CDN-CGS-11 Low2 0.73 +/- 0.068 Hole 08357 to 08367 used the second group of Standards.
CDN-GS-2C Medium2 2.06 +/- 0.15
CDN-GS-3D High2 3.41 +/- 0.25
CDN-BL-3 Blank <0.01
12.2.3 2008 IPL Analyses versus Check Analyses by ALS Chemex
Approximately every 20th sample analyzed by IPL was also sent to ALS Chemex as a monitor on bias.
Check samples are separates from the initially crushed sample so represent preparation duplicates. The
results are plotted in Figure 26 (522 lower grade values) and Figure 27 (9 higher grade values). For the
lower grade values (less than 2 g/t) the data indicate a slight bias with ALS Chemex reporting about 8
percent higher, on average, than IPL. Note the very large dispersion of data for higher grade
Figure 26. Plot of 523 paired analyses by IPL and ALS Chemex for the 2008 sampling/assaying program for values less than 2 g/t. The RMA line shown is essentially coincident with the y = x line.

Eureka Resources Inc. Frasergold Project 52 ___________________________________________________________________________________
___________________________________________________________________________________
ERSi Earth Resource Surveys Inc. Giroux Consultants Ltd.
relative to the dispersion for lower grade values, an indication of the relative difficulty of reproducing high
grade values. The dispersion of lower grade values is substantially more than for the 2007 data.
Figure 27. Plot of 9 paired values greater than 2 g/t Au, analyzed by both IPL and ALS Chemex. The upper line is y = x; the lower line is the RMA fit to the data. The large scatter is typical of high nugget effect gold.
12.2.4 2008 Field Duplicates
Approximately every 20th half core sample assay was paired with a facing quarter core sample assay and
referred to as a field duplicate. The two are rough duplicates because the original value is based on ½-
core whereas the ‘duplicate’ is based on ¼-core. The data are plotted on Figure 28, minus three very high
values (greater than 15.0 g/t Au). This plot of 531 data pairs suggests significant bias between the two
sets of data. However, if only data below 2.0 g/t Au are considered, as illustrated in Figure 29, the results
below 2.0 g/t Au are seen to be unbiased. Values greater than 2.0 g/t Au are difficult to reproduce.
This plot represents total error in the data and even though it is probably somewhat of an overestimate, it
is less than the total error contained in the 2007 data.

Eureka Resources Inc. Frasergold Project 53 ___________________________________________________________________________________
___________________________________________________________________________________
ERSi Earth Resource Surveys Inc. Giroux Consultants Ltd.
Figure 28. Plot of 503 IPL ‘field duplicate’ values for the 2008 sampling/assaying program. Top line is y = x; bottom line is RMA fitted to the data. See text for explanation.
Figure 29. Plot of IPL field duplicate data values less than 2 g/t Au, 2008 data. Scatter is unbiased and is much less than for comparable 2007 data.
12.2.5 2008 Preparation Duplicates
Preparation duplicates by IPL are plotted on Figures 30 and 31 for lower (<2.0 g/t Au) and higher (>2.0 g/t
Au) grades respectively. The data demonstrate the unbiased nature of the lower grade values (Figure 30)
and the difficulty in reproducing higher grade values (Figure 31).

Eureka Resources Inc. Frasergold Project 54 ___________________________________________________________________________________
___________________________________________________________________________________
ERSi Earth Resource Surveys Inc. Giroux Consultants Ltd.
Figure 30. Sample preparation duplicate analyses by IPL for data less than 2.0 g/t Au. Lower line is y = x; upper line is RMA line fitted to the data. The two lines are statistically equivalent. Dispersion about the line is substantially less than for corresponding 2007 data.
Figure 31. Sample preparation duplicate analyses greater than 2.0 g/t Au by IPL. Upper line is y = x; lower line is RMA fit to the data. The disposition of values to the right of the y = x line indicates the difficulty of reproducing higher grades, even within the same lab.
Eureka Resources Inc. Frasergold Project 55 ___________________________________________________________________________________
___________________________________________________________________________________
ERSi Earth Resource Surveys Inc. Giroux Consultants Ltd.
12.3. Quality Assurance and Quality Control Conclusions
Quality control data for the 2007 and 2008 drilling programs on the Frasergold property show that the
data are of adequate quality upon which to base a resource estimate. The bulk of the analyses are below
2.0 g/t Au and show no significant global bias. These lower grade values have a moderately large
dispersion characteristic of gold deposits with a high nugget effect. Values in excess of about 2.0g/t Au
are reproduced poorly, perhaps in part because the duplicates are based on ¼ core samples rather than
½ core samples like the original analyses.
Monitoring analyses by ALS Chemex show small proportional departures from IPL data but are
compensating over the two years. IPL replicate analyses of standards and blanks indicates an acceptable
level of accuracy. Nevertheless, field duplicates and check samples with values greater than 2.0 g/t Au
should be repeated because in general, original analyses are higher than those obtained from the
duplicated samples.
The distribution of errors is roughly 10% analytical error, 20% sample preparation error and 70%
sampling error based on 2007 data. Absolute values of each of these sources of error are relatively high
and all could probably be reduced somewhat by taking larger samples, refining the sample reduction
protocol and more care in preparation and sampling of pulps. Nevertheless, errors in analyses for
samples from a high nugget effect deposit, such as Frasergold, will still be relatively high. Consequently,
block estimates will require a substantial number of such samples in order to provide estimates of
reasonable quality. For example, if 5.0 m composites are used for block estimation, then several such
composites will be required for a block estimate.
Future work should use a sampling protocol patterned after that used in 2007, with the exception that
somewhat fewer field duplicate samples are required than were taken. Both years and field duplicates
should be equivalent to original samples. Moreover, it is particularly useful if preparation duplicates are
taken from a sample duplicate and duplicate pulps from one of the preparation duplicates are also
analyzed. This produces a coherent data set with which to evaluate sources of error. All sampling
involved in the protocol should be analyzed in the normal routine of analytical work rather than having
some of the analyses done months later. This will ensure that the quality control data reflect the operating
conditions by samplers and lab personnel at the time the majority of data are obtained.

Eureka Resources Inc. Frasergold Project 56 ___________________________________________________________________________________
___________________________________________________________________________________
ERSi Earth Resource Surveys Inc. Giroux Consultants Ltd.
13. Mineral Processing And Metallurgical Testing
13.1. 1984 to 1993 Programs
Previous operators had conducted preliminary test work in order to determine general sampling and gold
measurement methods. The following discussion is based on historical metallurgical work conducted on
the Frasergold mineralization.
In 1985, Eureka provided Coastech Research Inc. (“Coastech”) with a 700 kg bulk sample to determine
the gold content of the sample and a reasonable extraction method for preliminary metallurgical
evaluation (Marchant, 1985). Coastech crushed the entire bulk sample to less than 1.3 cm and following a
procedure of crushing, riffle splitting and quartering to ensure proper mixing., An approximate 500 kg
subsample was extracted. This sample was subjected to gravity separation methods of jigging and tabling
in order to concentrate gold and gold-bearing rock. The concentrate was then cyanide leached in a stirred
reactor and the gold content determined. Composites of the sample were prepared and submitted to
three independent analytical laboratories and analyzed for gold content by fire assay. A metallic
screening process was applied at one laboratory (Min-En Labs).
The 510 kg bulk sample produced 8.5 kg of concentrate. The concentrate was leached in cyanide with a
pH of 11.0 for 48 hours. The leach solution was then placed in activated charcoal, dried and the gold
content measured by fire assay techniques. Marchant, 1985 reports, “The results of this work indicated
that the gold content of the bulk sample as received is 4.70 g/t Au (0.137 oz/T Au).” The primary author
considers the information provided accurately represents the preliminary study of mineralized material
from the Frasergold property.
In June, 1990, Asarco submitted approximately 4,500 kg of mineralized material to Bacon, Donaldson
and Associates Ltd. of Richmond, B.C. in order to conduct preliminary metallurgical testing of Frasergold
mineralization. The sample material was supplied as four composite samples with gold grades of 1.62,
2.53, 2.15 and 2.90 g/t Au, resulting in a estimated average grade of 2.16 g/t Au.
Three primary testing methods were employed by Bacon, Donaldson and Associates Ltd. on the material:
whole ore cyanidation, gravity concentration, and flotation.
Coarse material (minus 3/8” and minus 1 ½”) bottle roll cyanide tests yielded 22 to 40% gold recovery
after 96 hours with high cyanide consumption rates of 2.2 kg NaCN/tonne of material. Fine grind (66%
passing 200 mesh) cyanide tests resulted in gold extractions of 79% and 82% after 48 hours of leaching
with cyanide consumption of 3.5 kg/tonne of mineralized material.
Gravity concentration tests were conducted using four 45 kg samples. Jigging of the material resulted in 7
- 20% of the measured gold recovered in the concentrate, with gold observed in the jig concentrates.

Eureka Resources Inc. Frasergold Project 57 ___________________________________________________________________________________
___________________________________________________________________________________
ERSi Earth Resource Surveys Inc. Giroux Consultants Ltd.
Five 45 kg batch flotation tests were conducted with gold recovery ranging from 87 to 92%. The flotation
tests were conducted at the same grind as the fine leach tests (66% passing 200 mesh). Bacon,
Donaldson and Associates concluded that the higher gold recoveries indicate the gold is associated with
sulphide mineralization and that the gold is sufficiently coarse to require a gravity concentration stage
prior to flotation.
In addition, Bacon, Donaldson and Associates Ltd. determined a Bond Work Index of 11.4 kwh/tonne
The primary author has reviewed copies of the original reports and test data for the 1985 and 1990 test
work completed for Eureka and Asarco. This information is historical in nature and is provided to indicate
the advanced level of exploration conducted on the Frasergold property.
13.2. 2007 and 2008 Programs
Hawthorne did not conduct any metallurgical testing of mineralized material on the Frasergold property
during their exploration programs.
14. Mineral Resource Estimates
14.1. Mineral Resource And Mineral Reserve Estimates
Historically, at least three estimations of gold content have been made by engineering firms for previous
operators of the project. This information is presented in Sections 4 (History) and 14 (Mineral Processing
and Metallurgical Testing). These historic estimates do not conform to the current “CIM Estimation of
Mineral Resources and Reserves Best Practices Guidelines”, issued in 2003 and modified last with
adoption of the “CIM Definition - Standards for Mineral Resources and Mineral Reserves” in 2014 and
therefore are not in compliance with Canadian National Instrument 43-101 standards for disclosure, and
should not be relied upon. However, the authors believe that sufficient original data of acceptable quality
exists and based on underground channel sampling, underground bulk sampling and 74 surface
diamond drill holes completed in 2007 and 2008 (see Sections 11.2.3 to 11.2.5), this historic data could
be utilized in the preparation of a mineral resource estimate. Drilling to date is insufficient to adequately
assess the entire 10 kilometer strike length of the Frasergold mineralized zone.
In the spring of 2009 G. Giroux completed a resource estimation of the Frasergold property based on the
historical and recent 2007-08 drilling in the Main Zone. Appendix IV lists the drill holes used in the
estimate. Trench data and underground channel samples were not used in the estimation.
As no further drilling has been completed since this 2009 estimate was completed it is still current and
valid.
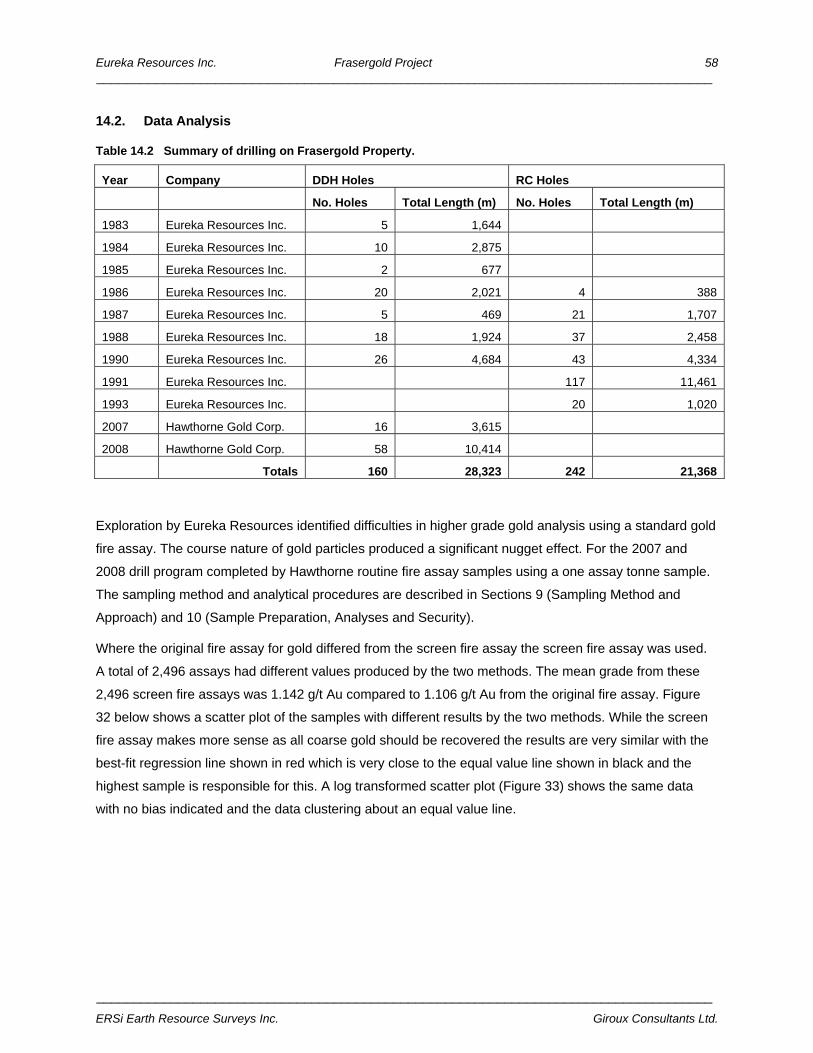
Eureka Resources Inc. Frasergold Project 58 ___________________________________________________________________________________
___________________________________________________________________________________
ERSi Earth Resource Surveys Inc. Giroux Consultants Ltd.
14.2. Data Analysis
Table 14.2 Summary of drilling on Frasergold Property.
Year Company DDH Holes RC Holes
No. Holes Total Length (m) No. Holes Total Length (m)
1983 Eureka Resources Inc. 5 1,644
1984 Eureka Resources Inc. 10 2,875
1985 Eureka Resources Inc. 2 677
1986 Eureka Resources Inc. 20 2,021 4 388
1987 Eureka Resources Inc. 5 469 21 1,707
1988 Eureka Resources Inc. 18 1,924 37 2,458
1990 Eureka Resources Inc. 26 4,684 43 4,334
1991 Eureka Resources Inc. 117 11,461
1993 Eureka Resources Inc. 20 1,020
2007 Hawthorne Gold Corp. 16 3,615
2008 Hawthorne Gold Corp. 58 10,414
Totals 160 28,323 242 21,368
Exploration by Eureka Resources identified difficulties in higher grade gold analysis using a standard gold
fire assay. The course nature of gold particles produced a significant nugget effect. For the 2007 and
2008 drill program completed by Hawthorne routine fire assay samples using a one assay tonne sample.
The sampling method and analytical procedures are described in Sections 9 (Sampling Method and
Approach) and 10 (Sample Preparation, Analyses and Security).
Where the original fire assay for gold differed from the screen fire assay the screen fire assay was used.
A total of 2,496 assays had different values produced by the two methods. The mean grade from these
2,496 screen fire assays was 1.142 g/t Au compared to 1.106 g/t Au from the original fire assay. Figure
32 below shows a scatter plot of the samples with different results by the two methods. While the screen
fire assay makes more sense as all coarse gold should be recovered the results are very similar with the
best-fit regression line shown in red which is very close to the equal value line shown in black and the
highest sample is responsible for this. A log transformed scatter plot (Figure 33) shows the same data
with no bias indicated and the data clustering about an equal value line.

Eureka Resources Inc. Frasergold Project 59 ___________________________________________________________________________________
___________________________________________________________________________________
ERSi Earth Resource Surveys Inc. Giroux Consultants Ltd.
Figure 32. Scatter plot showing screen fire assay and regular fire assay Au values.
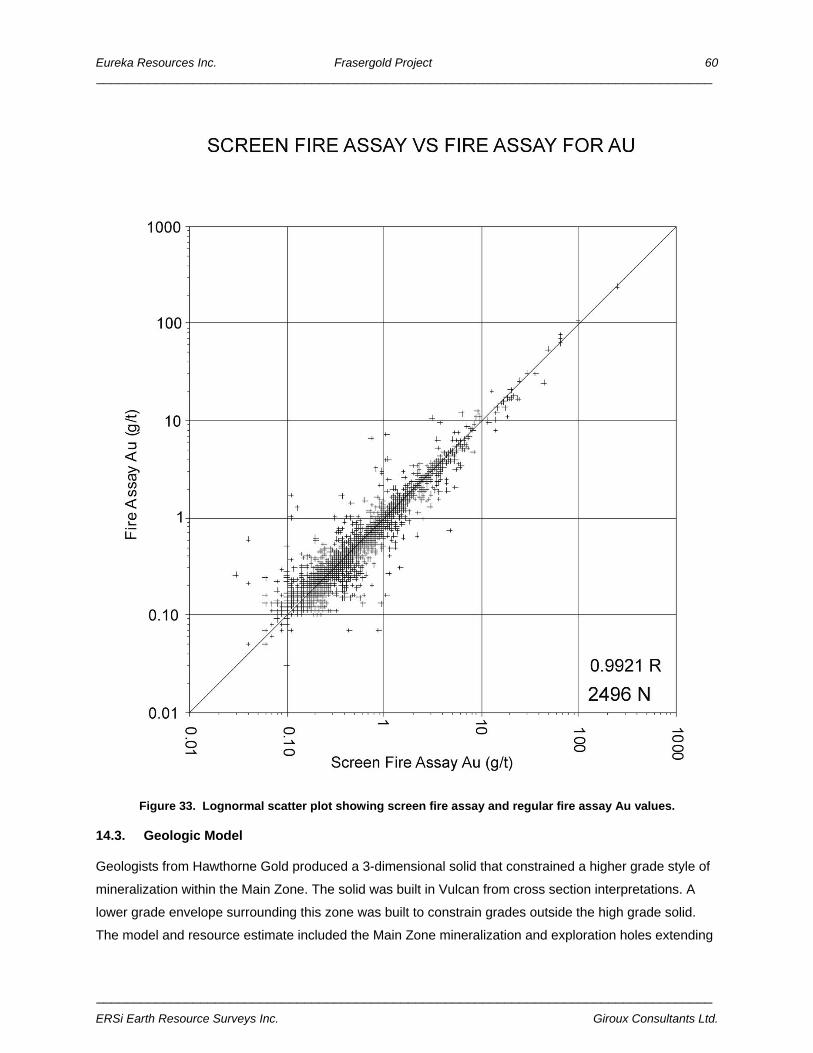
Eureka Resources Inc. Frasergold Project 60 ___________________________________________________________________________________
___________________________________________________________________________________
ERSi Earth Resource Surveys Inc. Giroux Consultants Ltd.
Figure 33. Lognormal scatter plot showing screen fire assay and regular fire assay Au values.
14.3. Geologic Model
Geologists from Hawthorne Gold produced a 3-dimensional solid that constrained a higher grade style of
mineralization within the Main Zone. The solid was built in Vulcan from cross section interpretations. A
lower grade envelope surrounding this zone was built to constrain grades outside the high grade solid.
The model and resource estimate included the Main Zone mineralization and exploration holes extending

Eureka Resources Inc. Frasergold Project 61 ___________________________________________________________________________________
___________________________________________________________________________________
ERSi Earth Resource Surveys Inc. Giroux Consultants Ltd.
to the north-west (NW Zone) along strike and to the south (SE Zone). Figure 34 below shows the Main
Zone with the higher grade core in red, the lower grade envelope in dark grey and the surface topography
in light grey.
Figure 34. Isometric view looking north showing the High grade core zone in red with the dark grey lower grade envelope around it and the light gray showing surface topography.
14.4. Diamond Drilling versus RC Drilling
Due to the different drilling techniques and the coarse nature of the gold the RC results are compared to
the diamond drill results within similar volumes. The comparison was made within the higher grade solid
and within the surrounding lower grade envelope.
Figure 35 shows the location of assays in both the low grade envelope and high grade core of the Main
Zone. Samples in the high grade zone are colour coded in red and magenta for diamond drill samples
and RC samples respectively while samples in the low grade zone are coloured green and blue.
Figures 36 and 37 show log-normal cumulative distribution curves for gold within the low and high grade
areas colour coded by drill type. Within the low grade envelope there appears to be a slight bias with RC

130
01
400
15
00
m a
sl
666600E665800E 666000E 666200E 666400E665200E 665400E 665600E664800E 665000E
DWG: 521-15-18 Scale: 1:12,500 Figure: 35
Eureka Resources Inc.
Frasergold Project
Cariboo Mining Division, B.C.
Location of assays in the low-grade envelopeand high-grade core of the Main Zone
June 23, 2015
Scale: 1:12,500
UTM 10 NAD83 Contour interval = 20m
Low Grade RC - blueLow Grade DDH - greenHigh Grade RC - magentaHigh Grade DDH - red
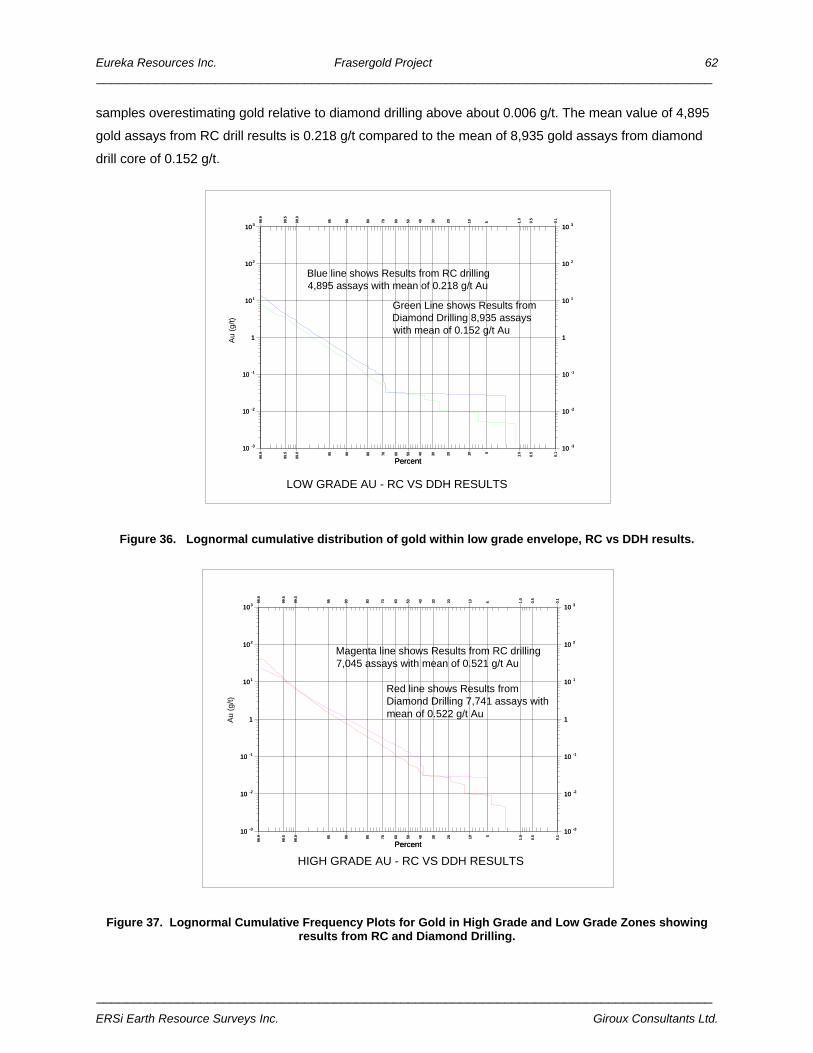
Eureka Resources Inc. Frasergold Project 62 ___________________________________________________________________________________
___________________________________________________________________________________
ERSi Earth Resource Surveys Inc. Giroux Consultants Ltd.
samples overestimating gold relative to diamond drilling above about 0.006 g/t. The mean value of 4,895
gold assays from RC drill results is 0.218 g/t compared to the mean of 8,935 gold assays from diamond
drill core of 0.152 g/t.
Figure 36. Lognormal cumulative distribution of gold within low grade envelope, RC vs DDH results.
Figure 37. Lognormal Cumulative Frequency Plots for Gold in High Grade and Low Grade Zones showing results from RC and Diamond Drilling.
LOW GRADE AU - RC VS DDH RESULTS
10 -3
10 -2
10 -1
1
10 1
10 2
10 3
Au
(g/t)
Percent
10 -3
10 -2
10 -1
1
101
102
103
0.1
0.5
1.0510203040506070809095
99.0
99.5
99.9
0.1
0.5
1.0
51020304050607080909599.
0
99.
5
99.
9
10 -3
10 -2
10 -1
1
10 1
10 2
10 3
Percent
10 -3
10 -2
10 -1
1
101
102
103
0.1
0.5
1.0510203040506070809095
99.0
99.5
99.9
0.1
0.5
1.0
51020304050607080909599.
0
99.
5
99.
9
Blue line shows Results from RC drilling4,895 assays with mean of 0.218 g/t Au
Green Line shows Results from Diamond Drilling 8,935 assays with mean of 0.152 g/t Au
HIGH GRADE AU - RC VS DDH RESULTS
10 -3
10 -2
10 -1
1
10 1
10 2
10 3
Au
(g/
t)
Percent
10 -3
10 -2
10 -1
1
101
102
103
0.1
0.5
1.0510203040506070809095
99.
0
99.
5
99.
9
0.1
0.5
1.0
51020304050607080909599.0
99.5
99.9
10 -3
10 -2
10 -1
1
10 1
10 2
10 3
Percent
10 -3
10 -2
10 -1
1
101
102
103
0.1
0.5
1.0510203040506070809095
99.
0
99.
5
99.
9
0.1
0.5
1.0
51020304050607080909599.0
99.5
99.9
Magenta line shows Results from RC drilling7,045 assays with mean of 0.521 g/t Au
Red line shows Results from Diamond Drilling 7,741 assays with mean of 0.522 g/t Au

Eureka Resources Inc. Frasergold Project 63 ___________________________________________________________________________________
___________________________________________________________________________________
ERSi Earth Resource Surveys Inc. Giroux Consultants Ltd.
Within the high grade core zone the comparison is better with no bias indicated and the mean values
much closer with 7,045 RC assays at 0.521 g/t Au compared to 7,741 DDH assays at 0.522 g/t Au. In
general the bias on low grade is small and the data is sufficiently similar to use both styles of drill results
in the resource estimation.
Using the geologic 3D solid model, drill holes were compared to the solid shapes and then point at which
the drill holes entered and left each solid was recorded. Based on these intersections individual assays
were tagged with a code LG or HG for low grade envelope and high grade core respectively. The
statistics for gold within the two domains are tabulated below.
Table 14.4.1 Summary of Au assay statistics sorted by Domain
Low Grade Envelope High Grade Core
Number of Assays 15,896 14,947
Mean Value Au (g/t) 0.163 0.517
Standard Deviation Au (g/t) 1.420 3.558
Minimum Value Au (g/t) 0.001 0.001
Maximum Value Au (g/t) 116.88 252.00
Coefficient of Variation 8.69 6.88
Both domains have erratic high values resulting in high standard deviations and resulting high coefficients
of variation. Both domains showed highly skewed gold distributions and lognormal cumulative distribution
plots were used to partition out multiple overlapping lognormal populations.
Lognormal cumulative probability plots were produced for Au in both the mineralized zones and the
individual plots are shown in Appendix V. Each variable showed multiple overlapping lognormal
populations. In each case the individual populations were partitioned out with the mean grade and
proportion of the total population summarized in the following tables (individual populations shown on
plots as open circles). The multiple overlapping populations for each variable result in different grade
distributions and capping should be applied at different levels in each case. In most cases a small
proportion of high grades are present and could, at this level of drill information, be considered erratic.

Eureka Resources Inc. Frasergold Project 64 ___________________________________________________________________________________
___________________________________________________________________________________
ERSi Earth Resource Surveys Inc. Giroux Consultants Ltd.
Table 14.4.2 Summary of gold populations present in High Grade Core Domain
Population Mean Au (g/t) Percentage of Total Data Number of Assays
1 250.80 0.01 % 2
2 34.42 0.17 % 25
3 16.35 0.37 % 55
4 7.26 0.75 % 112
5 2.96 2.09 % 312
6 0.49 25.23 % 3,771
7 0.05 71.38 % 10,670
Within the high grade core domain population 1 is clearly erratic and should be capped at 2 standard
deviations above the mean of population 2. A total of 2 assays were capped at 70 g/t. Populations 2, 3
and 4 represent mineralized vein material that is very difficult to model and predict. This material is not
considered erratic outliers based on the amount of samples present (1.3% of total). To avoid undue
smearing of these populations, however, an Indicator Kriging approach was employed. The photograph
below, taken from the underground workings, shows the problems attached to estimating high grades. A
drill hole could pass through this zone and depending on location could give many different estimations of
grade in this area. Populations 5 and 6 represent the wider spread low grade mineralization present
between the veins perhaps. Finally, population 7 represents the background mineralization within the
zone.
Photo 1. View from underground of the mineralized vein swarms

Eureka Resources Inc. Frasergold Project 65 ___________________________________________________________________________________
___________________________________________________________________________________
ERSi Earth Resource Surveys Inc. Giroux Consultants Ltd.
Within the lower grade envelope the top 3 populations, representing a combined 0.12% of the total
samples, are considered erratic, isolated high grades and are capped at 2 standard deviations above the
mean of population 4. A total of 21 gold assays are capped at 7.9 g/t.
Table 14.4.3 Summary of gold populations present in Low Grade Envelope Domain
Population Mean Au (g/t) Percentage of Total Data Number of Assays
1 102.4 0.02 % 3
2 19.74 0.05 % 8
3 13.04 0.05 % 8
4 3.02 1.19 % 189
5 0.31 13.86 % 2,203
6 0.07 14.02 % 2,229
7 0.02 70.87 % 11,256
The results of capping are shown below in Table 14.4.4.
Table 14.4.4 Summary of capped Au assay statistics sorted by Domain
Low Grade Envelope High Grade Core
Number of Assays 15,896 14,947
Mean Value Au (g/t) 0.141 0.493
Standard Deviation Au (g/t) 0.506 2.218
Minimum Value Au (g/t) 0.001 0.001
Maximum Value Au (g/t) 7.90 70.00
Coefficient of Variation 3.59 4.50
14.5. Composites
Uniform downhole composites 5 m in length were produced to honour the domain boundaries. Intervals at
domain boundaries less than 2.5 m were combined with adjoining samples while those greater than or
equal to 2.5 m were left. This produced a composite file of uniform support 5 ± 2.5 m.
The distribution of gold composites within the higher grade core zone indicated multiple populations (see
Appendix V). The 3 highest grade populations were assumed to represent the vein style mineralization
while the lower three populations represented the more prevalent disseminated style mineralization. A
threshold of 1.6 g/t would separate these two groups. The strategy for modeling and estimation was to
model the highest three populations using an indicator approach.
IND = 0 if comp Au < 1.6 g/t. Disseminated Au
= 1 if comp Au ≥ 1.6 g/t. Vein Style Au
The approach was to model the outer envelope separately from the inner core zone for gold. The inner
higher grade core zone was then modeled in two stages. Material less than 1.6 g/t was modeled and

Eureka Resources Inc. Frasergold Project 66 ___________________________________________________________________________________
___________________________________________________________________________________
ERSi Earth Resource Surveys Inc. Giroux Consultants Ltd.
estimated as disseminated style mineralization while material greater than or equal to 1.6 g/t Au was
modeled and estimated using an indicator approach.
Table 14.5.1 Summary of Au composite statistics sorted by Domain
Low Grade Envelope Au (g/t)
High Grade Core
Vein Style
Au (g/t)
Disseminated Style
Au (g/t)
Number of Assays 4,722 207 3,865
Mean Value Au (g/t) 0.126 3.686 0.272
Standard Deviation Au (g/t) 0.296 2.426 0.316
Minimum Value Au (g/t) 0.001 1.603 0.001
Maximum Value Au (g/t) 3.65 14.009 1.598
Coefficient of Variation 2.35 0.66 1.16
14.6. Variography
Pairwise relative semivariograms were produced for gold within the outer envelope, inner core
background and inner core high grade. Gold within the outer envelope showed a geometric anisotropy
with longest continuity of 180 m along azimuth 135° and second longest continuity along azimuth 45°
dipping -45° to the northeast. Gold within the inner core representing the background mineralization
showed longest continuity of 160 m also along azimuth 135° with the second longest continuity of 60 m
along azimuth 225° dipping -45° to the southwest. Finally the zero/one indicator was modeled within the
inner core zone with the longest direction of continuity found along azimuth 135°. In all cases nested
spherical models were fit to the data.
The models are included as Appendix V and the parameters of the models are tabulated below.
Table 14.6.1 Summary of semivariogram parameters for Au
Domain Azimuth Dip C0 C1 C2 Short Range
(m)
Long Range
(m)
Low Grade Envelope Au 135 0 0.30 0.32 0.33 12.0 180.0
45 -45 0.30 0.32 0.33 25.0 100.0
225 -45 0.30 0.32 0.33 5.0 40.0
Core Zone Background Au
135 0 0.40 0.22 0.20 20.0 160.0
45 -45 0.40 0.22 0.20 10.0 30.0
225 -45 0.40 0.22 0.20 8.0 60.0
Core Zone High Grade Indicator
135 0 1.70 0.13 0.12 10.0 100.0
45 0 1.70 0.13 0.12 20.0 40.0
0 -90 1.70 0.13 0.12 5.0 40.0

Eureka Resources Inc. Frasergold Project 67 ___________________________________________________________________________________
___________________________________________________________________________________
ERSi Earth Resource Surveys Inc. Giroux Consultants Ltd.
14.7. Block Model
A rotated block model with block dimensions of 10 x 10 x 5 m was built to cover the mineralized zone
solids. The block model origin is as follows:
Lower Left Corner
666489.63 East Column Size – 10 m 70 columns
5795666.996 North Row Size – 10 m 340 rows
Top of Model
1740 Elevation Level Size – 5 m 95 levels
Rotation – x axis rotated 40 degrees counter clockwise
The northwest and southeast extensions of the main zone were also estimated and two additional models
were created to cover these areas. These block models had the following origins.
Lower Left Corner of NW Extension
663614.713 East Column Size – 10 m 160 columns
5797693.039 North Row Size – 10 m 460 rows
Top of Model
2050 Elevation Level Size – 5 m 196 levels
Rotation – X axis rotated 40 degrees counter clockwise
Lower Left Corner of SE Extension
665940.131 East Column Size – 10 m 300 columns
5792741.553 North Row Size – 10 m 189 rows
Top of Model
2050 Elevation Level Size – 5 m 196 levels
Rotation – X axis rotated 40 degrees counter clockwise
For each block, the percentage of the block below surface topography and the percentage within each of
the solids were recorded. The topography used was provided by Eagle Mapping Ltd. and had 1 m
contours.
An isometric view of the three estimated block models is shown in Figure 38.

Eureka Resources Inc. Frasergold Project 68 ___________________________________________________________________________________
___________________________________________________________________________________
ERSi Earth Resource Surveys Inc. Giroux Consultants Ltd.
Figure 38. Isometric view of the three estimated block models.
14.8. Bulk Density
A total of 128 specific gravity determinations were made in 2007 from pieces of drill core in a variety of
rock types. The method used was as follows:
Specific Gravity = Weight of Sample in air (g) (Weight in Air (g) – Weight in Water (g))
The results are presented in Appendix VI and summarized below. There appears to be no correlation
between high grades and high specific gravities and very little difference within the various rock types, so
for this resource estimation the average of the 128 measurements, a value of 2.82 was used.

Eureka Resources Inc. Frasergold Project 69 ___________________________________________________________________________________
___________________________________________________________________________________
ERSi Earth Resource Surveys Inc. Giroux Consultants Ltd.
Table 14.8.1 Average specific gravity of Frasergold rock types
Lithology Code
Lithology Number of
Samples
Average
SG
CBP carbonaceous black phyllite 10 2.76
KP knotted phyllite 72 2.83
SLST siltstone 3 2.77
BBP black banded phyllite 40 2.81
QV quartz vein 1 2.63
LS limestone 1 2.77
P phyllite 1 2.81
Average 128 2.82
14.9. Grade Interpolation
Gold grades were interpolated into blocks using ordinary kriging in a number of steps. First a grade for
the low grade envelope mineralization was estimated into all blocks with some percentage within the low
grade envelope using composites outside the higher grade core.
For blocks with some percentage within the higher grade core zone, a three step procedure was
completed. The first step involved kriging the 0-1 indicator to determine the percentage of high grade that
might be present within any block in the core zone. The next step was to estimate the grade of this high
grade component by kriging all composites greater than or equal to 1.6 g/t Au within the high grade core
(HG-AU). Finally the grade for the disseminated mineralization within the high grade core (DISS-AU) was
estimated by kriging all composites within the high grade core less than 1.6 g/t Au. A weighted average
was produced to represent the grade of the portion of each block within the high grade core.
HG Core Au = (KRIGED IND * HG_AU) + ((1 – KRIGED IND) * DISS AU)
A gold grade for the block was then a weighted average of the two zones.
TOT_AU = (%LG * LG_AU) + (%HG * HG Core Au) / (%LG+%HG)
In all cases ordinary kriging was completed in a series of passes with expanding search ellipses. The first
pass used ellipse dimensions equal to ¼ of the semivariogram range in each of the three principal
directions. A minimum of 4 composites were required within this ellipse centered on the block to estimate
a given block. For blocks not estimated in Pass 1 a second pass using ½ the range of the semivariogram
was completed. A third pass using the full range and a fourth pass using twice the range were completed
on un-estimated blocks. In all cases if more than 12 composites were found in any given search, the
closest 12 were used.

Eureka Resources Inc. Frasergold Project 70 ___________________________________________________________________________________
___________________________________________________________________________________
ERSi Earth Resource Surveys Inc. Giroux Consultants Ltd.
Due to different search ellipses, blocks within the HG Core zone not estimated for the Indicator were
assigned a zero value. Blocks with a HG Indicator estimated but not estimated for HG_Au were assigned
the average of the HG population, a value of 3.69 g/t Au.
For the estimation of the NW and SE extensions only the low grade envelope composites were used. The
area to the northwest of the main mineralized zone was estimated by ordinary kriging using the low grade
envelope semivariogram and search ellipses in a similar manner to the main zone estimate. The
southeast extension was estimated in three stages varying the strike of the search ellipse and
semivariogram to fit the bend around the fold nose. Again only low grade envelope composites were used
and the kriging method was as described above.
14.10. Classification
Based on the study herein reported, delineated mineralization of the Frasergold Deposit is classified as a
resource according to the following definitions from National Instrument 43-101 and from CIM (2014):
“In this Instrument, the terms "mineral resource", "inferred mineral resource", "indicated mineral resource"
and "measured mineral resource" have the meanings ascribed to those terms by the Canadian Institute of
Mining, Metallurgy and Petroleum, as the CIM Definition Standards on Mineral Resources and Mineral
Reserves adopted by CIM Council on May 10, 2014, as those definitions may be amended.”
Mineral Resources are sub-divided, in order of increasing geological confidence, into Inferred, Indicated
and Measured categories. An Inferred Mineral Resource has a lower level of confidence than that applied
to an Indicated Mineral Resource. An Indicated Mineral Resource has a higher level of confidence than
an Inferred Mineral Resource but has a lower level of confidence than a Measured Mineral Resource.
A Mineral Resource is a concentration or occurrence of solid material of economic interest in or on the
Earth’s crust in such form, grade or quality and quantity that there are reasonable prospects for eventual
economic extraction. The location, quantity, grade or quality, continuity and other geological
characteristics of a Mineral Resource are known, estimated or interpreted from specific geological
evidence and knowledge, including sampling.
Material of economic interest refers to diamonds, natural solid inorganic material, or natural solid
fossilized organic material including base and precious metals, coal and industrial minerals.
The term Mineral Resource covers mineralization and natural material of intrinsic economic interest which
has been identified and estimated through exploration and sampling and within which Mineral Reserves
may subsequently be defined by the consideration and application of Modifying Factors. The phrase
“reasonable prospects for economic extraction” implies a judgement by the Qualified Person in respect of
the technical and economic factors likely to influence the prospect of economic extraction. The Qualified
Person should consider and clearly state the basis for determining that the material has reasonable
prospects for eventual economic extraction. Assumptions should include estimates of cut-off grade and

Eureka Resources Inc. Frasergold Project 71 ___________________________________________________________________________________
___________________________________________________________________________________
ERSi Earth Resource Surveys Inc. Giroux Consultants Ltd.
geological continuity at the selected cut-off, metallurgical recovery, smelter payments, commodity price or
product value, mining and processing method and mining, processing and general and administrative
costs. The Qualified Person should state if the assessment is based on any direct evidence and testing.
Interpretation of the word ‘eventual’ in this context may vary depending on the commodity or mineral
involved. For example, some coal, iron, potash deposits and other bulk minerals or commodities, it may
be reasonable to envisage ‘eventual economic extraction’ as covering time periods in excess of 50 years.
However, for many gold deposits, application of the concept would normally be restricted to perhaps 10 to
15 years, and frequently to much shorter periods of time.
The terms Measured, Indicated and Inferred are defined by CIM (2014) as follows:
Inferred Mineral Resource
An Inferred Mineral Resource is that part of a Mineral Resource for which quantity and grade or quality
are estimated on the basis of limited geological evidence and sampling. Geological evidence is sufficient
to imply but not verify geological and grade or quality continuity.
An Inferred Mineral Resource has a lower level of confidence than that applying to an Indicated Mineral
Resource and must not be converted to a Mineral Reserve. It is reasonably expected that the majority of
Inferred Mineral Resources could be upgraded to Indicated Mineral Resources with continued
exploration.
An Inferred Mineral Resource is based on limited information and sampling gathered through appropriate
sampling techniques from locations such as outcrops, trenches, pits, workings and drill holes. Inferred
Mineral Resources must not be included in the economic analysis, production schedules, or estimated
mine life in publicly disclosed Pre-Feasibility or Feasibility Studies, or in the Life of Mine plans and cash
flow models of developed mines. Inferred Mineral Resources can only be used in economic studies as
provided under NI 43-101.
There may be circumstances, where appropriate sampling, testing, and other measurements are
sufficient to demonstrate data integrity, geological and grade/quality continuity of a Measured or Indicated
Mineral Resource, however, quality assurance and quality control, or other information may not meet all
industry norms for the disclosure of an Indicated or Measured Mineral Resource. Under these
circumstances, it may be reasonable for the Qualified Person to report an Inferred Mineral Resource if the
Qualified Person has taken steps to verify the information meets the requirements of an Inferred Mineral
Resource.
Indicated Mineral Resource
An Indicated Mineral Resource is that part of a Mineral Resource for which quantity, grade or quality,
densities, shape and physical characteristics are estimated with sufficient confidence to allow the

Eureka Resources Inc. Frasergold Project 72 ___________________________________________________________________________________
___________________________________________________________________________________
ERSi Earth Resource Surveys Inc. Giroux Consultants Ltd.
application of Modifying Factors in sufficient detail to support mine planning and evaluation of the
economic viability of the deposit.
Geological evidence is derived from adequately detailed and reliable exploration, sampling and testing
and is sufficient to assume geological and grade or quality continuity between points of observation.
An Indicated Mineral Resource has a lower level of confidence than that applying to a Measured Mineral
Resource and may only be converted to a Probable Mineral Reserve.
Mineralization may be classified as an Indicated Mineral Resource by the Qualified Person when the
nature, quality, quantity and distribution of data are such as to allow confident interpretation of the
geological framework and to reasonably assume the continuity of mineralization. The Qualified Person
must recognize the importance of the Indicated Mineral Resource category to the advancement of the
feasibility of the project. An Indicated Mineral Resource estimate is of sufficient quality to support a Pre-
Feasibility Study which can serve as the basis for major development decisions.
Measured Mineral Resource
A Measured Mineral Resource is that part of a Mineral Resource for which quantity, grade or quality,
densities, shape, and physical characteristics are estimated with confidence sufficient to allow the
application of Modifying Factors to support detailed mine planning and final evaluation of the economic
viability of the deposit.
Geological evidence is derived from detailed and reliable exploration, sampling and testing and is
sufficient to confirm geological and grade or quality continuity between points of observation.
A Measured Mineral Resource has a higher level of confidence than that applying to either an Indicated
Mineral Resource or an Inferred Mineral Resource. It may be converted to a Proven Mineral Reserve or to
a Probable Mineral Reserve.
Mineralization or other natural material of economic interest may be classified as a Measured Mineral
Resource by the Qualified Person when the nature, quality, quantity and distribution of data are such that
the tonnage and grade of the mineralization can be estimated to within close limits and that variation from
the estimate would not significantly affect potential economic viability. This category requires a high level
of confidence in, and understanding of, the geology and controls of the mineral deposit.
Modifying Factors
Modifying Factors are considerations used to convert Mineral Resources to Mineral Reserves. These
include, but are not restricted to, mining, processing, metallurgical, infrastructure, economic, marketing,
legal, environmental, social and governmental factors.
Geologic continuity is not easily quantified. It is based on confidence determined from surface mapping,
drill hole logging and underground mapping that a reasonable understanding of what constrains

Eureka Resources Inc. Frasergold Project 73 ___________________________________________________________________________________
___________________________________________________________________________________
ERSi Earth Resource Surveys Inc. Giroux Consultants Ltd.
mineralization exists. Grade continuity can be quantified by the semivariogram. Blocks within the well
drilled central portion of the deposit and estimated during Pass 1 (1/4 the range of the semivariogram)
were classified as measured. Blocks estimated in Pass 2 were classified as Indicated. All other blocks
estimated were classified as Inferred. The results are tabulated by class below. At this time no
economic studies have been completed and as a result the economic cut-off for this deposit is
unknown. The nearest analogous deposit with an economic study completed is Spanish Mt. Gold
(Koffybert et al, Tetra Tech PEA, 2012). A gold cut-off of 0.20 g/t Au for Spanish Mt. was determined as
the minimum grade of mineralized material within the pit that is sufficient to cover the cost of mining and
milling, G & A, stockpile handling, stockpile maintenance and the incremental haul costs from the waste
dump to the crusher. A base case gold price of $1,350 per oz. was used in this study. Within the
designed pit at Spanish Mt. a total of 167 million tonnes averaging .48 g/t were classified as M+I while an
additional 3.7 million tonnes averaging 0.49 g/t Au were classified Inferred.
A cut-off of 0.5 g/t is highlighted as a possible cut-off at Frasergold for extraction by open pit methods,
considering the smaller tonnage and lower current gold price of $1,100 per oz.
Table 14.10.1 Measured resource, Frasergold Main Zone
Au Cut-off Tonnes> Cut-off Grade > Cut-off
(g/t) (tonnes) Au (g/t) Au (grams) Au Ounces
0.30 11,470,000 0.595 6,800,000 219,000
0.40 7,980,000 0.703 5,600,000 180,000
0.50 5,600,000 0.812 4,500,000 145,000
0.60 4,130,000 0.907 3,700,000 119,000
0.70 3,020,000 1.003 3,000,000 96,000
0.80 2,240,000 1.093 2,400,000 77,000
0.90 1,650,000 1.181 1,900,000 61,000
1.00 1,160,000 1.279 1,500,000 48,000
Table 14.10.2 Indicated resource, Frasergold Main Zone
Au Cut-off Tonnes> Cut-off Grade > Cut-off
(g/t) (tonnes) Au (g/t) Au (grams) Au Ounces
0.30 22,610,000 0.540 12,200,000 392,000
0.40 14,310,000 0.653 9,300,000 299,000
0.50 9,570,000 0.755 7,200,000 231,000
0.60 6,530,000 0.852 5,600,000 180,000
0.70 4,450,000 0.948 4,200,000 135,000
0.80 2,910,000 1.055 3,100,000 100,000
0.90 1,910,000 1.164 2,200,000 71,000
1.00 1,270,000 1.274 1,600,000 51,000

Eureka Resources Inc. Frasergold Project 74 ___________________________________________________________________________________
___________________________________________________________________________________
ERSi Earth Resource Surveys Inc. Giroux Consultants Ltd.
Table 14.10.3 Measured plus Indicated resource, Frasergold Main Zone
Au Cut-off Tonnes> Cut-off Grade > Cut-off
(g/t) (tonnes) Au (g/t) Au (grams) Au Ounces
0.30 34,080,000 0.559 19,100,000 614,000
0.40 22,290,000 0.671 15,000,000 482,000
0.50 15,170,000 0.776 11,800,000 379,000
0.60 10,660,000 0.874 9,300,000 299,000
0.70 7,470,000 0.970 7,200,000 231,000
0.80 5,150,000 1.071 5,500,000 177,000
0.90 3,560,000 1.172 4,200,000 135,000
1.00 2,420,000 1.277 3,100,000 100,000
Table 14.10.4 Inferred resource, Frasergold Main Zone
Au Cut-off
(g/t)
Tonnes> Cut-off
(tonnes)
Grade > Cut-off
Au (g/t) Au (grams) Au Ounces
0.30 26,530,000 0.473 12,500,000 402,000
0.40 14,940,000 0.571 8,500,000 273,000
0.50 8,270,000 0.670 5,500,000 177,000
0.60 4,510,000 0.774 3,500,000 113,000
0.70 2,580,000 0.874 2,300,000 74,000
0.80 1,260,000 1.005 1,300,000 42,000
0.90 790,000 1.098 900,000 29,000
1.00 440,000 1.225 500,000 16,000

Eureka Resources Inc. Frasergold Project 75 ___________________________________________________________________________________
___________________________________________________________________________________
ERSi Earth Resource Surveys Inc. Giroux Consultants Ltd.
Table 14.10.5 Inferred resource, Frasergold NW Extension
Au Cut-off
(g/t)
Tonnes> Cut-off
(tonnes)
Grade > Cut-off
Au (g/t) Au (grams) Au Ounces
0.30 45,790,000 0.538 24,600,000 791,000
0.40 30,850,000 0.629 19,400,000 624,000
0.50 19,180,000 0.740 14,200,000 457,000
0.60 14,200,000 0.813 11,500,000 370,000
0.70 10,360,000 0.873 9,000,000 289,000
0.80 8,840,000 0.894 7,900,000 254,000
0.90 210,000 0.947 200,000 6,000
1.00 10,000 1.194 10,000 300
Table 14.10.6 Inferred resource, Frasergold SE Extension
Au Cut-off
(g/t)
Tonnes> Cut-off
(tonnes)
Grade > Cut-off
Au (g/t) Au (grams) Au Ounces
0.40 77,000 0.546 42,000 1,400
0.50 43,000 0.632 27,000 900
0.60 41,000 0.635 26,000 800
0.70 1,000 0.704 1,000 30
Table 14.10.7 Summary of Frasergold resource at a 0.5 g/t Au cut-off
Zone
Class
Au Cut-off
(g/t)
Tonnes> Cut-off
(tonnes)
Grade > Cut-off
Au (g/t) Au (grams) Au Ounces
Main Measured 0.50 5,600,000 0.812 4,500,000 145,000
Main Indicated 0.50 9,570,000 0.755 7,200,000 231,000
Main M+I 0.50 15,170,000 0.776 11,800,000 376,000
Main Inferred 0.50 8,270,000 0.670 5,500,000 177,000
NW Inferred 0.50 19,180,000 0.740 14,200,000 457,000
SE Inferred 0.50 43,000 0.632 27,000 900
Total Inferred 0.50 27,493,000 0.718 19,727,000 634,900
23. Adjacent Properties
There are no mines in the immediate vicinity of the Frasergold property. The closest operating mine is
Imperial Metal’s Mount Polley copper-gold porphyry deposit located 84 kilometers to the northwest.
Numerous gold and copper prospects are located throughout the region, including the Woodjam property
15 kilometers south of Horsefly, Spanish Mountain 60 kilometers to the northwest and the QR past
producing mine site 90 kilometers to the northwest. None are immediately adjacent to the property but
occur within a similar geologic setting and share some mineralogical attributes with Frasergold.

Eureka Resources Inc. Frasergold Project 76 ___________________________________________________________________________________
___________________________________________________________________________________
ERSi Earth Resource Surveys Inc. Giroux Consultants Ltd.
24. Other Relevant Data And Information
The authors of this report were provided with free and clear access to all data pertaining to the Frasergold
property. The authors are not aware of any other relevant data or information pertaining to the Frasergold
property that should be included in this report.
25. Interpretations And Conclusions
The results from the 2008 soil and silt sampling program demonstrated the best potential northwest of the
mineralized Main zone. The anomalous gold values are interpreted to be derived from upslope in that
area thus adding credence to gold mineralization continuing along strike towards the northwest of the
main zone.
The results of the channel sampling within the underground working validated and verified results
obtained from historical surface drilling, including a number of high grade gold samples. The results
indicated good continuity of gold mineralization along strike to the northwest at approximately 310°
azimuth, with the width of the zone of interest being approximately 30 meters. As a result further drilling
and sampling is recommended to potentially prove up a resource for the Frasergold zone, and further
exploration work should be planned to follow-up on the high grade samples encountered in the
underground workings that may be correlated along strike with surface drilling intercepts. Because the
quartz veins frequently boudinage as noted from underground observations and historical mapping, some
veins can expand substantially in size. Consequently there is potential that high grade intercepts of
mineable widths underground could be intercepted and proven with additional close spaced surface
drilling.
Drilling was conducted at a density with the Main zone as recommended by Gary Giroux with the aim to
bring the current drilling towards indicated and inferred status. The results of the diamond drill program
continued to demonstrate the structurally complex nature of the deposit. Results of the 2008 drilling
indicate the following:
1. Gold mineralization appears to be more continuous along strike than downdip or between
drillholes on the same cross section.
2. Gold mineralization appears partially be controlled by S0 and S1 structures.
3. Weak gold mineralized ribbon veins interspersed with sporadic high grade gold ribbon
veins are possibly due to intersection of fold noses.
4. Continuity along strike can be seen more consistently with high grade intersections
whereas the low grade typically demonstrates continuity less consistently.
5. Weaker gold grades may be due to drillholes intersecting veins along fold limbs and not
within fold nose regions.

Eureka Resources Inc. Frasergold Project 77 ___________________________________________________________________________________
___________________________________________________________________________________
ERSi Earth Resource Surveys Inc. Giroux Consultants Ltd.
6. There may possibly be more than one controlling mineralizing structural event other than
S1.
7. Mineralization is observed to be contained within “stacked” zones; some of the zones are
defined by ribbon veining while others are devoid of ribbon veining.
26. Recommendations
The previous geochemical sampling and drilling programs on the property have demonstrated
mineralization continues to depth thus increasing the previous defined width of the Main Zone. Drilling
has also demonstrated mineralization continues down dip in particular areas along the strike of the Main
zone and that potential continues to exist along strike which is further demonstrated by soil grid results
emanating from a soil sampling program conducted over 1 km from the Main Zone along strike towards
Northwest. This combined with the fact that Main zone is the only area within the property that has had
been drill tested the following exploration program work is recommended:
Additional drilling is recommended, targeting step out regions along strike of the Frasergold Main zone at
tighter spacing in order to potentially assist with the structural interpretation of the zone and add resource.
Additional drilling will assist with understanding the structural controls which are currently poorly
understood. Continued detailed and consistent logging is required in order to capture as much structural
information as possible, such as vein density, overall quartz percentage and structural measurements,
which may assist with future exploration programs and understanding the complex structural controls
within this region.
Additional soil sampling should be conducted along both the strike of the Main zone and of areas within
the property demonstrating prospective geophysical anomalies. It would also be advised that increased
sampling density would be prudent on some low sample density historical grids as well as complimenting
this sampling with ICP analysis which was not conducted in the past.
A two stage program is recommended. Additional resource may be developed along the southeast and
northwest projections of the main zone and within the 18ppm and Eureka Bowl grid areas. The first stage
is continued soil sampling, road and drill site construction, and a 6,000m diamond drill program at an
estimated cost of $2,000,000. 1,500m of this drilling could be conducted in 2015, the remaining 4,500m
completed in 2016. Contingent upon favorable results from the Stage I drilling, additional drilling would be
recommended at a cost of about $2,500,000.

Eureka Resources Inc. Frasergold Project 78 ___________________________________________________________________________________
___________________________________________________________________________________
ERSi Earth Resource Surveys Inc. Giroux Consultants Ltd.
27. References
Aeroquest International, Report on a helicopter-borne AeroTEM system electromagnetic, magnetic and radiometric survey; unpublished report for Hawthorne Gold Corp.; dated November 2007; 35pp.
Austin, J.B., 1988, ‘Frasergold project’: prepared for 1257 Geological Ltd., Coastech Research Inc.
Belik, G.D., 1981, ‘Frasergold property, property evaluation report’: Kerr, Dawson and Associates Ltd.
Belik, G.D., 1981, ‘Geological and Geochemical Report on the Frasergold Property’: prepared for Keron Holdings Ltd., Kerr, Dawson and Associates Ltd.
Belik, G.D., 1982, ‘Summary Report on the Frasergold property’: prepared for Eureka Resources Ltd., G. Belik and Associates Ltd.
Belik, G.D., 1984, ‘Geochemical and Geological report on the Kusk 1 and Kusk 3-7 mineral claims’: prepared for Nirvana Oil and Gas Ltd., G. Belik and Associates Ltd.
Belik, G.D., 1985, ‘Trenching and diamond drilling report on the Kusk property’: prepared for Nirvana Oil and Gas Ltd., G. Belik and Associates Ltd.
Belik, G.D., 1985, ‘Summary report on the Kusk property’: prepared for Roddy Resources Inc., G. Belik and Associates Ltd.
Bird, H.H. 1986, ‘Dealing with the Nugget Effect in Practice’: Proceedings of Practice Prospectors and Developers Association of Canada, 1986
Bird, H.H., 1991, ‘Dealing with Coarse Gold and Cutting Factors or Dealing with Nugget Effect in Practice’: Proceedings of Seminar - Sampling and Ore Reserves, Prospectors and Developers Association of Canada, March 23, 1991
Bloodgood, M.A., 1987, ‘Geology of the Triassic black phyllite in the Eureka Peak area, central British Columbia’: BC Ministry of Energy, Mines and Petroleum Resources, Geological Fieldwork 1986, Paper 1987-1, pp 135-142
Bloodgood, M.A., 1987, ‘Geology of Eureka Peak River - MacKay River (93A/7)’, BC Ministry of Energy, Mines and Petroleum Resources, Open File 1987-9.
Bloodgood, M.A., 1987, ‘Geology of the Quesnel Terrane in the Spanish Lake area, Central British Columbia’: BC Ministry of Energy, Mines and Petroleum Resources, Geological Fieldwork 1987, Paper 1988-1, pp 139-145
Bloodgood, M.A., 1987, ‘Deformational history, stratigraphic correlations and geochemistry of Eastern Quesnel terrane rocks in the Crooked Lake area, Central British Columbia’: Masters Thesis, University of British Columbia
Bloodgood, M.A., 1990, ‘Geology of the Eureka Peak and Spanish Lake map areas, British Columbia’: BC Ministry of Energy, Mines and Petroleum Resources , Geological Survey Branch, Paper 1990-3
Boronowski, A. and Serbert, C., 2003, ‘Recommendations for further exploration on the Frasergold property, South Central British Columbia: prepared for J.J. O’Neill
Brown, P., 1983, ‘Diamond drilling and geochemical report on the Mac 1-9, Kay 1-12 and Alpha 2 claims’: Amoco Canada Petroleum Co. Ltd.
Brown, P., 1983, ‘Summary report, Frasergold project, British Columbia’: Amoco Canada Petroleum Co. Ltd.
Brown, P., 1984, ‘Summary report, Frasergold project, British Columbia’: Amoco Canada Petroleum Co. Ltd.
Brown, P., 1984, ‘Property evaluation and diamond drilling report, 1983, Frasergold project’: Amoco Canada Petroleum Co. Ltd.

Eureka Resources Inc. Frasergold Project 79 ___________________________________________________________________________________
___________________________________________________________________________________
ERSi Earth Resource Surveys Inc. Giroux Consultants Ltd.
Brown, P., 1985, ‘Property evaluation and diamond drilling report, 1984, Frasergold project’: Amoco Canada Petroleum Co. Ltd.
Brownlow, Harry, 1991, ‘Frasergold Project – Baseline Environmental Studies’, letter from Norecol Environmental Consultants Ltd. to Eureka Resources, Inc. dated October 30, 1991
Bysouth, G.D., 1987, ‘Exploration feasibility study – Frasergold deposit’: Gibraltar Mines Ltd.
Caelles, J.C. and Rowan, L.G., 1988, ‘Geological report on the 1987/88 exploration work, Frasergold property’: prepared for Sirius Resource Corporation., 1257 Geological Ltd.
Campbell, K.V., 1971, ‘Metamorphic petrology and structural geology of the Crooked Lake area, Cariboo Mountains, B.C.’: unpublished Ph.D. thesis, University of Washington.
Campbell, K.V., 1984, ‘Brief report on the structural geology at the Frasergold project, MacKay River area, central British Columbia’: prepared for Amoco Canada Petroleum Co. Ltd.
Campbell, K.V., 1984, ‘Brief report on the MacKay River pelitic suite’: for Amoco Canada Petroleum Co. Ltd.
Campbell, K.V., 1989, ‘Review of exploration programs on Frasergold property of Eureka Resources, Inc., winter 1987/88 to spring 1989’: prepared for Eureka Resources, Inc., K.V. Campbell and Associates Ltd.
Campbell, K.V., 1989, ‘Summary report on the Frasergold project’ for Eureka Resources, Inc., K.V. Campbell and Associates Ltd.
Campbell, K.V., 1989, ‘Project review and proposal for further exploration and development’: prepared for Eureka Resources, K.V. Campbell and Associates Ltd.
Campbell, K.V., 2009; 'Results of 2008 silt and rock sampling program', for Hawthorne Gold Corp., March 30, 2008; 38pp.
Campbell, K.V., MacKean, B.E. and Leishman, D.A., 1987, ‘Report on the geology and results of the 1987 exploration program on the Frasergold property’: prepared for Eureka Resources, Inc., K.V. Campbell and Associates Ltd.
Campbell, K.V., Gruenwald, W., Walters, L. and Schatten, M.., 1991; ‘Results of the 1991 exploration program’, prepared for Asarco Inc. and Eureka Resources Inc., K.V. Campbell and Associates Ltd.
Campbell, K.V. and Giroux, G.H., 2009; 'Report on the 2007 and 2008 drill programs on the Frasergold project'; for Hawthorne Gold Corp.; November 15, 2009; 116 pp.
Campbell, R.B., 1978, ‘Geology, Quesnel Lake map-area’: Geological Survey of Canada, Open File 574.
Campbell, R.B., Mountjoy, E.W. and Young, F.G., 1973, ‘Geology of the McBride map area, British Columbia’: Geological Survey of Canada, Paper 72-35
Cartwright, P., 1985, ‘Report on the induced polarization and resistivity surveys on the Frasergold property’: prepared for Eureka Resources Inc., Phoenix Geophysics Ltd.
Chevalier, A., 1982, ‘Eureka project – Report on the 1981 exploration program’: prepared for UMEX Inc.
Coates, J.A., 1967; ‘Eureka Mountain’, internal report for Chapman, Wood and Griswold Ltd.
Duba, D., 1986, ‘Eureka Peak project’: prepared for UMEX Inc.
Fletcher, D.M., 1990, ‘Reverse circulation sampling’: prepared for ASARCO Inc.
Goldfarb, R.J., Leach, D.L., Miller, M.L., and Pickthorn, W.J., 1986, Geology, metamorphic setting, and genetic constraints of epigenetic lode-gold mineralization within the Cretaceous Valdez Group, south-central Alaska: Geological Association of Canada Special Paper 32
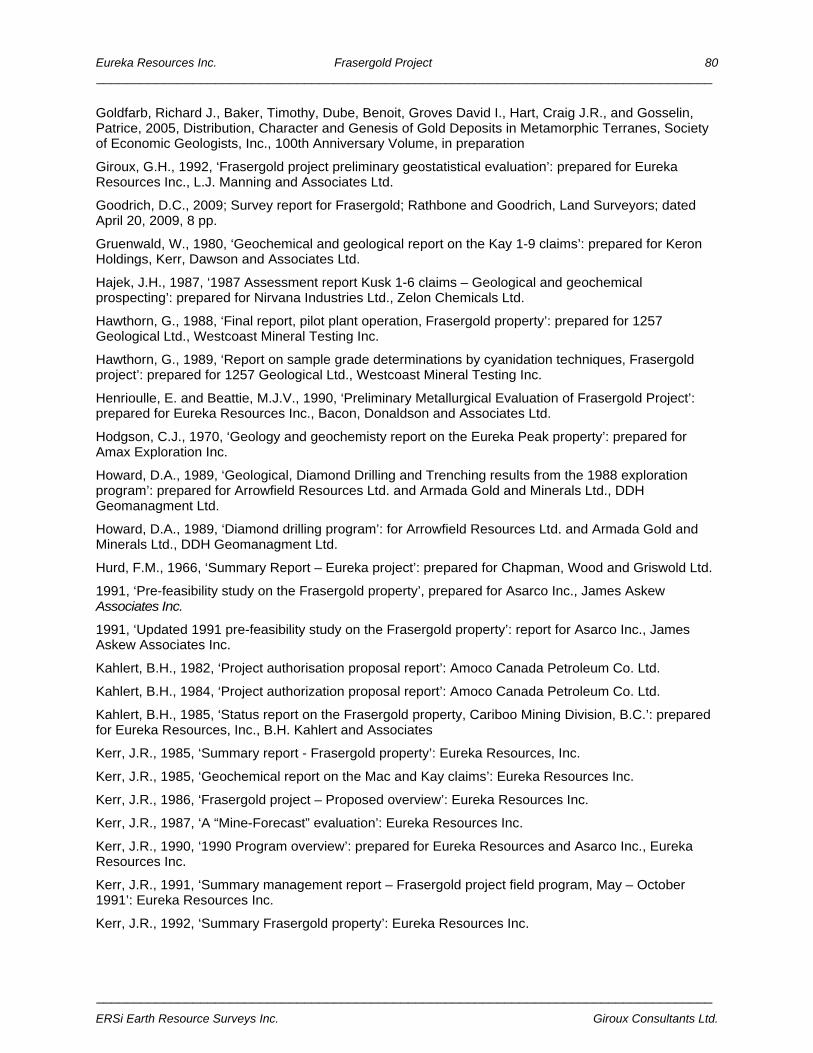
Eureka Resources Inc. Frasergold Project 80 ___________________________________________________________________________________
___________________________________________________________________________________
ERSi Earth Resource Surveys Inc. Giroux Consultants Ltd.
Goldfarb, Richard J., Baker, Timothy, Dube, Benoit, Groves David I., Hart, Craig J.R., and Gosselin, Patrice, 2005, Distribution, Character and Genesis of Gold Deposits in Metamorphic Terranes, Society of Economic Geologists, Inc., 100th Anniversary Volume, in preparation
Giroux, G.H., 1992, ‘Frasergold project preliminary geostatistical evaluation’: prepared for Eureka Resources Inc., L.J. Manning and Associates Ltd.
Goodrich, D.C., 2009; Survey report for Frasergold; Rathbone and Goodrich, Land Surveyors; dated April 20, 2009, 8 pp.
Gruenwald, W., 1980, ‘Geochemical and geological report on the Kay 1-9 claims’: prepared for Keron Holdings, Kerr, Dawson and Associates Ltd.
Hajek, J.H., 1987, ‘1987 Assessment report Kusk 1-6 claims – Geological and geochemical prospecting’: prepared for Nirvana Industries Ltd., Zelon Chemicals Ltd.
Hawthorn, G., 1988, ‘Final report, pilot plant operation, Frasergold property’: prepared for 1257 Geological Ltd., Westcoast Mineral Testing Inc.
Hawthorn, G., 1989, ‘Report on sample grade determinations by cyanidation techniques, Frasergold project’: prepared for 1257 Geological Ltd., Westcoast Mineral Testing Inc.
Henrioulle, E. and Beattie, M.J.V., 1990, ‘Preliminary Metallurgical Evaluation of Frasergold Project’: prepared for Eureka Resources Inc., Bacon, Donaldson and Associates Ltd.
Hodgson, C.J., 1970, ‘Geology and geochemisty report on the Eureka Peak property’: prepared for Amax Exploration Inc.
Howard, D.A., 1989, ‘Geological, Diamond Drilling and Trenching results from the 1988 exploration program’: prepared for Arrowfield Resources Ltd. and Armada Gold and Minerals Ltd., DDH Geomanagment Ltd.
Howard, D.A., 1989, ‘Diamond drilling program’: for Arrowfield Resources Ltd. and Armada Gold and Minerals Ltd., DDH Geomanagment Ltd.
Hurd, F.M., 1966, ‘Summary Report – Eureka project’: prepared for Chapman, Wood and Griswold Ltd.
1991, ‘Pre-feasibility study on the Frasergold property’, prepared for Asarco Inc., James Askew Associates Inc.
1991, ‘Updated 1991 pre-feasibility study on the Frasergold property’: report for Asarco Inc., James Askew Associates Inc.
Kahlert, B.H., 1982, ‘Project authorisation proposal report’: Amoco Canada Petroleum Co. Ltd.
Kahlert, B.H., 1984, ‘Project authorization proposal report’: Amoco Canada Petroleum Co. Ltd.
Kahlert, B.H., 1985, ‘Status report on the Frasergold property, Cariboo Mining Division, B.C.’: prepared for Eureka Resources, Inc., B.H. Kahlert and Associates
Kerr, J.R., 1985, ‘Summary report - Frasergold property’: Eureka Resources, Inc.
Kerr, J.R., 1985, ‘Geochemical report on the Mac and Kay claims’: Eureka Resources Inc.
Kerr, J.R., 1986, ‘Frasergold project – Proposed overview’: Eureka Resources Inc.
Kerr, J.R., 1987, ‘A “Mine-Forecast” evaluation’: Eureka Resources Inc.
Kerr, J.R., 1990, ‘1990 Program overview’: prepared for Eureka Resources and Asarco Inc., Eureka Resources Inc.
Kerr, J.R., 1991, ‘Summary management report – Frasergold project field program, May – October 1991’: Eureka Resources Inc.
Kerr, J.R., 1992, ‘Summary Frasergold property’: Eureka Resources Inc.

Eureka Resources Inc. Frasergold Project 81 ___________________________________________________________________________________
___________________________________________________________________________________
ERSi Earth Resource Surveys Inc. Giroux Consultants Ltd.
Kerr, J.R., 1994, ‘Proposed preliminary feasibility study of the Frasergold project’: Eureka Resources Inc.
Kerr, J.R., 1995, ‘Summary Frasergold property’: Eureka Resources Inc.
Kerr, J.R. and Campbell, K.V., 1990, ‘Results of the 1990 exploration program and proposal for further exploration and development’: for Eureka Resources and Asarco Inc., Eureka Resources Inc.
Koffybert, A. M., et. al. 2012; ‘Technical Report and Preliminary Economic Assessment of the Spanish Mountain Gold Project, Likely, B.C.’ Tetra Tech PEA., 258 pp.
Kolbe, P. and Taylor, S.R., 1966; ‘Geochemical investigation of the granitic rocks of the Snowy Mountains area, NSW’: Journal of the Geological Society of Australia, vol 13, pp 1-25
Lakefield Research, 1985; ‘Determination of the gold content of core reject samples’: prepared for Amoco Canada Petroleum Company Ltd. by Lakefield Research.
Leishman, D.A., 1985; ‘Summary report on the DOR claims’, prepared for Eureka Resources Inc.
Leishman, D.A. and Campbell, K.V., 1986, ‘Results of 1986 trenching and drilling program on the Frasergold property’: prepared for Eureka Resources, Inc.
Leishman, D.A., 1987, ‘Geochemical report on the Mac 10 claim group’: prepared for Eureka Resources, Inc.
Lindinger, J.E.L., 2004, ‘Geochemical assessment report on the Frasergold property’: prepared for Eureka Resources Inc.
Manning, L.J., 1992, ‘Frasergold property 1988 and 1991 bulk testing comparison of returns from milling with returns from drilling’: prepared for Eureka Resources Inc., L.J. Manning and Associates Ltd.
Manning, L.J., 1992, ‘Frasergold property 1988 and 1991 bulk test grades with pertinent drill hole grades’: prepared for Eureka Resources, L.J. Manning and Associates Ltd.
Manning, L.J., 1992, ‘Proposed bulk testing of the Frasergold deposit’: for Eureka Resources Inc., L.J. Manning and Associates Ltd.
Marchant, P.B., 1985, ‘Frasergold property, interim summary’: prepared for Eureka Resources Inc., Coastech Research Inc.
Monger, J.W.H., Price, R.A. and Tempelman-Kluit, D.J., 1982, ‘Tectonic accretion and the origin of the two major metamorphic and plutonic belts in the Canadian Cordillera’: Geology, vol 10, pp 70-75
Mountford, B., 1988, ‘A report discussing the work completed during the 1987/88 winter program at the Frasergold project’: prepared for Eureka Resources, Inc., Brian Mountford and Associates Ltd.
Mountford, B., 1989, ‘A report discussing the work completed during the 1988 summer program at the Frasergold project’: prepared for Eureka Resources, Inc., Brian Mountford and Associates Ltd.
Nevin, A.E., 1981, ‘Report on the Kay large tonnage, low-grade gold prospect’: prepared for Keron Holdings Ltd., Nevin, Sadlier-Brown and Goodbrand Ltd.
1990, ‘Frasergold project – Environmental status report’: prepared for Eureka Resources Inc., Norecol Environmental Consultants Ltd.
Orchard, M.J. and Struik, L.C., 1985, ‘Conodonts and stratigraphy of Upper Paleozoic limestones of the Cariboo gold belt, Central British Columbia’: Canadian Journal of Earth Sciences, vol 22, pp 538-552
Panteleyev, A., 1986, ‘Quesnel Gold Belt – Alkaic volcanic terrane between Horsefly and Quesnel Lakes’: BC Ministry of Energy, Mines and Petroleum Resources, Paper 1987-1, pp 125-133
Panteleyev, A., 1987, ‘Quesnel Mineral Belt – The central volcanic axis between Horsefly and Quesnel Lakes’: BC Ministry of Energy, Mines and Petroleum Resources, Paper 1988-1, pp 131-137

Eureka Resources Inc. Frasergold Project 82 ___________________________________________________________________________________
___________________________________________________________________________________
ERSi Earth Resource Surveys Inc. Giroux Consultants Ltd.
Panteleyev, A. and Hancock, K.D., 1988, ‘Quesnel Mineral Belt: Summary of the geology of the Beaver Creek – Horsefly River map area’: BC Ministry of Energy, Mines and Petroleum Resources, Paper 1989-1, pp159-166
Panteleyev, A., Bailey, D.G., Bloodgood, M.A. and Hancock, K.D., 1996, ‘Geology and mineral deposits of the Quesnel River – Horsefly map area, Central Quesnel trough, British Columbia’: BC Ministry of Employment and Investment, Geological Survey Branch, Bulletin 97
Read, P.B., 1983, ‘Petrography of drill core samples’: prepared for Amoco Canada Petroleum Co. Ltd., Geotex Consultants Ltd.
Read, P.B., 1984, ‘Petrography of drill core samples’: prepared for Amoco Canada Petroleum Co. Ltd., Geotex Consultants Ltd.
Read, P.B., 1988, ‘Aspects of structure and stratigraphy relevant to gold mineralization, Frasergold property’: prepared for 1257 Geological Ltd., Geotex Consultants Ltd.
Read, P.B., 1989, ‘Petrography of samples from Eureka Peak Cu-Au deposit’: prepared for 1257 Geological Ltd., Geotex Consultants Ltd.
Rebagliati, C.M., 1989, ‘Summary report 1988 exploration program on the Frasergold property main zone’: prepared for 1257 Geological Ltd., Rebagliati Geological Consulting Ltd.
Rebagliati, C.M., 1989, ‘Summary report Eureka Peak gold prospect, Frasergold property’: prepared for Sirius Resource Corporation., Rebagliati Geological Consulting Ltd.
Rees, C.J., 1981, ‘Western margin of the Omineca Belt at Quesnel Lake, B.C.’: Geological Survey of Canada, Paper 81-1A, pp 223-226
Rhys, D. and Lewis, P., 2004, ‘Gold Vein Deposits: Turning Geology into Discovery’, short course presented at BC & Yukon Chamber of Mines Cordilleran Exploration Roundup, 2004
Rhys, D. A. and Ross, K. V., 2001, ‘Evaluation of the Geology and Exploration Potential of the Bonanza Ledge Zone, and Adjacent Areas between Wells and Barkerville, East Central British Columbia’, technical report prepared for International Wayside Gold Mines Ltd., Panterra Geoservices Inc.
Rhys, D.A., 2007; Frasergold property field observations and report review; memo prepared for Hawthorne Gold Corp., September 10, 2007; 21 pp.
Rhys, D.A., Mortensen, J.K. and Ross, K., 2009; Investigations of orogenic gold deposits in the Cariboo gold district, east-central British Columbia (parts of NTS 093A, H): progress report; in Geoscience BC Summary of Activities 2008, Geoscience BC, Report 2009-1, p.49-74.
Richards, B.G., 1989, ‘Report on the mineral inventory study, Frasergold property - main zone’: prepared for Sirius Resource Corporation.
Roberts, P.L., 1988, ‘Frasergold project’: for Eureka Resources Inc., Kilborn Engineering Ltd.
Rogers, D.S., 1982, ‘Diamond drilling as an aid in ore definition at the Dome mine’: Canadian Institute of Mining and Metallurgy, vol 75, no. 842
Ross, J.V., Bloodgood, M., Fillipone, J., Montgomery, J.R., and Elsby, D.C., 1985, ‘Geometry of a convergent zone, central British Columbia’, Tectonophysics, vol 119, pp 285-297.
Rowan, L.G., 1989, ‘Drilling report on reverse circulation drill holes: RS-88-104 and RS-88-105, Mac claim, Frasergold property’: prepared for Sirius Resource Corporation., 1257 Geological Ltd.
Rowan, L.G., 1989, ‘Geological report on the 1988 exploration program for the Frasergold property main zone’: for Sirius Resource Corporation., 1257 Geological Ltd.
Rowan, L.G., 1989, ‘Geological report on the 1988 exploration program for the Eureka Peak prospect’: for Sirius Resource Corporation., 1257 Geological Ltd.
Rowan, L.G., 1989, ‘Summary report of June 1988 program on the Mac 10 claim’: 1257 Geological Ltd.

Eureka Resources Inc. Frasergold Project 83 ___________________________________________________________________________________
___________________________________________________________________________________
ERSi Earth Resource Surveys Inc. Giroux Consultants Ltd.
Saleken, L.W., 1982, ‘A geochemical interpretation of the Frasergold prospect’: E&B Explorations
Schatten, M., 1990, ‘Assessment report on the Frasergold 1990 drill program’: prepared for Asarco Exploration Company of Canada, Ltd. and Eureka Resources, Inc.
Schatten, M., 1991, ‘Assessment report on the Frasergold 1991 drill program’: prepared for Asarco Exploration Company of Canada, Ltd. and Eureka Resources, Inc.
Schaubs, P.M. and Wilson, C.J.L., 2002; ‘The relative roles of folding and faulting in controlling gold mineralization along the Deborah anticline, Bendigo, Victoria, Australia’, Economic Geology, vol. 97, pp 351-370
Sparling, J., 2008; Geochemical sampling, trenching and diamond drilling assessment report for 2007, Frasergold property, Williams Lake area, British Columbia; prepared for Hawthorne Gold Corp., 904 pp.
Struik, L.C., 1986, ‘Imbricated terranes of the Cariboo gold belt with correlations and implications in southeastern British Columbia’: Canadian Journal of Earth Sciences, v.23, pp 1047-1231
Summers, L.M. and Marchant, P.B., 1986, ‘EUK 86 bulk sample exploratory metallurgical test summary, Frasergold project – Diamond drill hole logs DDH 87-52 to 88-68’: prepared for Eureka Resources Inc.
Whitehead, K., 2009; Geochemical sampling, regional mapping and diamond drilling assessment report for 2008, Frasergold property, Williams Lake area, British Columbia; prepared for Hawthorne Gold Corp., 1527 pp.
Whitehead, K., 2011; 'Regional geochemical sampling program Assessment Report for 2011, Frasergold property'; for Teslin River Resources Corporation; December 29, 2011; 34 pp.
Whitehead, K., 2015; 'Regional geochemical sampling program Assessment Report for Spring 2015, Frasergold property'; for Eureka Resources Inc.; June 5, 2015; 22 pp.

Eureka Resources Inc. Frasergold Project 84 ___________________________________________________________________________________
___________________________________________________________________________________
ERSi Earth Resource Surveys Inc. Giroux Consultants Ltd.
28. Certificates and Consent of Authors
These certificates apply to the technical report entitled ‘Frasergold Exploration Project, Cariboo
Mining Division, B.C. Latitude 52° 18'N Longitude 120° 35' W.
I, K. Vincent Campbell, Ph.D., P.Geo. of 6599 Millar Road, Horsefly BC V0L 1L0 (PO Box 271) do hereby certify that I am responsible for the preparation of the technical report titled ‘Frasergold Exploration Project, Cariboo Mining Division’ dated July 20th, 2015 and amended July 27, 2015.
I am a independent consulting geologist.
I graduated with a degree of Bachelor of Science, Honours Geology, from the University of British Columbia in 1966, a degree of Master of Science, Geology, from the University of Washington in 1969 and a degree of Doctor of Philosophy, Geology, from the University of Washington in 1971.
I have worked as a geologist for over 46 years since my graduation from university.
I am a member of the Association of Professional Engineers and Geoscientists of B.C. (Registration #19411).
I have read the definition of a "qualified person" set out in National Instrument 43-101 (NI 43-101) and certify that by reason of my education, affiliation with a professional association (as defined in NI 43-101), and past relevant work experience, I fulfill the requirements to be a "qualified person" for the purpose of NI-43-101.
My relevant experience with respect to the Frasergold exploration project includes over 33 years in mineral exploration and geological mapping in North America, South America and Africa. Over my working career I have carried out over 500 exploration projects ranging from “grass-roots” projects to well advanced drilling projects and am well versed in geochemical exploration techniques, photo interpretation and remote sensing, structural analysis, interpretation of geophysics and geological mapping both on a highly detailed scale and on a regional scale. I undertook regional mapping of the Crooked Lake and Eureka Peak area of the Cariboo Mountains over the period 1963 to 1971 during summer field programs for the Geological Survey of Canada. From 1984 to 1991 I was involved in various geological investigations of the Frasergold property for Amoco Petroleum and Eureka Resources, Inc. I visited the Frasergold property a number of times during the 2008 field season and conducted a property-wide rock and silt sampling program during the 2009 field season.
I last visited the property on June 13th, 2015 to assess road conditions.
I am responsible for Sections 1 to 13 inclusive and Sections 23 to 27 inclusive of this report including the title of this technical report dated July 20, 2015 and amended July 27, 2015.
I am independent of Eureka Resources Inc. as defined by Section 1.5 of the Instrument. I have read National Instrument 43-101 and the sections for which I am responsible in this Technical Report have been prepared in compliance with National Instrument 43-101 and Form 43-101F1. My relationship to Eureka Resources Inc. is as a geological consultant. I have no anticipation of acquiring or receiving any shares or interest in the company.
As of the date of this certificate, to the best of my knowledge, information and belief, the technical report contains all scientific and technical information that is required to be disclosed to make the technical report not misleading.
I consent to the filing of the Technical Report with any stock exchange or other regulatory authority and any publication by them, including electronic publication in the public company files on their websites accessible to the public.

Eureka Resources Inc. Frasergold Project 85 ___________________________________________________________________________________
___________________________________________________________________________________
ERSi Earth Resource Surveys Inc. Giroux Consultants Ltd.
I am not aware of any information or omission of such information that would make this Technical Report misleading. This Technical Report contains available scientific and technical information that is required to be disclosed to make the technical report not misleading.
Dated this 27t h day of July, 2015.
_____________________________________________
K. Vincent Campbell, Ph.D., P.Geo.
Signature of Qualified Person


Eureka Resources Inc. Frasergold Project ___________________________________________________________________________________
APPENDIX I
2007 Rock Sample Locations and Assay Values

Eureka Resources Inc. Frasergold Project 2 ___________________________________________________________________________________
___________________________________________________________________________________
ERSi Earth Resource Surveys Inc. Giroux Consultants Ltd.
Appendix I. 2007 Rock Sample Locations and Assay Values
Sample ID UTME UTMN Elevation (m) Au (ppm) Description
135782 665651 5796648 1574 0.005 No major quartz veins, outcrop approximately 3m in height and 3m wide. Sample taken along and perpendicular to strike
135783 665617 5796621 1601 0.005
20m long outcrop (up creek) that looks like volcanics. Massive, greenish, very siliceous, anhedral to subhedral, 1-2% disseminated pyrite visible. Quartz veins cutting through along similar orientation as KP strike (130 degrees) up to 30cm thick. Possible intrusive sill or dyke, resembles dyke from FG56
135784 665578 5796581 1611 0.010 Knotted Phyllite. Approximately 30% Quartz.
135772 664905 5797648 1621 0.010 Knotted Phyllite. Slightly graphitic with 10-15% Quartz. Abundant Chlorite
135764 665460 5797735 1435 0.010 Knotted Phyllite. <1% Quartz.
135765 665397 5797847 1428 0.005 Knotted Phyllite. Approximately 15% Quartz.
135766 665354 5797911 1437 0.005 Grey Phyllite
135767 665288 5798003 1435 0.005 Grey Phyllite. Millimeter laminations of whitish carbonate.
135768 665231 5798069 1434 0.005 Grey Phyllite. Grapitic with occasional knots.
135769 665199 5798135 1432 0.010 Knotted Phyllite
135770 665109 5798272 1410 0.010 Knotted Phyllite. Graphitic with occasional pyrite stringer
135771 664726 5797736 0 0.005 Grey Phyllite
135773 665133 5797487 1605 0.010 Knotted Phyllite. <1% Quartz.
135774 665471 5797169 1590 0.005 Knotted Phyllite. Slightly graphitic with approximately 15% Quartz.
135775 665608 5797201 1526 0.030 Knotted Phyllite. Slight graphitic with <1% Quartz.
135776 665551 5797295 1522 0.210 Knotted Phyllite. Approximately 15-20% Quartz.
135777 664920 5796966 1803 0.005 Knotted Phyllite, Grey Phyllite, Siltstone with 30% Quartz
135778 664864 5796917 1824 0.010 Knotted Phyllite, Grey Phyllite, Siltstone with 30% Quartz
135779 664867 5796899 1854 0.020 Metavolcanics
135780 664836 5796834 1840 0.005 Knotted and Grey Phyllite. Approximately 25% Quartz.
135796 665417 5797812 1429 0.005 Grey Phyllite. Approximately 5% quartz. Graphitic at quartz margins. Minor sulphides.
135797 665378 5797885 1432 0.010 Grey Phyllite. <2% Quartz. Sulphides occuring in deformed areas. Haematite weathering.
135798 665326 5797957 1439 0.010 Grey phyllite with some weathered carbonates. Graphitic sheen. Quartz veining ~10% outcrop. Veins mm to 5cm.
135799 665255 5798049 1437 0.020 Grey Phyllite. Graphitic. Approximately 25% quartz.
135800 665219 5798094 1433 0.010 Knotted Phyllite. Sulphide stringers. <5% quartz. Haematite weathering.
135801 665149 5798194 1435 0.010 Knotted Phyllite. Approximately 20% quartz.
135804 664648 5797789 1626 0.005 Knotted Phyllite with approximately 10% quartz
135805 664766 5797684 1641 0.005 Knotted Phyllite with approximately 15% quartz veins and boudins. Sulphides in quartz margins
135806 664866 5797603 1638 0.005 Knotted Phyllite with approximately 10% quartz
135807 664975 5797572 1628 0.005 Knotted Phyllite with approximately < 5% quartz
135808 665107 5797468 1618 0.005 Knotted Phyllite with approximately 15% quartz

Eureka Resources Inc. Frasergold Project 3 ___________________________________________________________________________________
___________________________________________________________________________________
ERSi Earth Resource Surveys Inc. Giroux Consultants Ltd.
Sample ID UTME UTMN Elevation (m) Au (ppm) Description
135809 665294 5797234 1613 0.005 Knotted Phyllite with approximately 30% quartz. Sulphides in quartz margins
135810 665390 5797167 1622 0.010 Knotted Phyllite with approximately 20% quartz. Some hematite weathering
135811 665468 5797099 1613 0.005 Knotted Phyllite with approximately < 2% quartz
135812 665542 5797021 1601 0.050 Knotted Phyllite with approximately 30% quartz. Chlorite weathering on quartz veins
135813 665589 5796985 1595 0.010 Knotted Phyllite with approximately < 5% quartz
135814 665593 5796933 1604 0.010 Knotted Phyllite with approximately 50% quartz, more graphitic near vein margins. Chlorite weathering on quartz veins.
135815 665597 5796924 1606 0.010 Knotted Phyllite with approximately < 1% quartz
135816 665599 5796896 1603 0.005 Knotted Phyllite with approximately 25% quartz
135817 665588 5796855 1598 0.010 Knotted Phyllite with approximately 30% quartz, very graphitic in quartz fold margins
135818 661875 5798597 1610 0.010 Volcanics. Green siliceous matrix with some feldspar clasts, unknown black mineral, some sulphides (bornite?)
135819 664063 5798477 1366 0.005 Knotted Phyllite
135820 664025 5798435 1388 0.005 Knotted Phyllite with approximately < 5% quartz
135821 663959 5798200 1448 0.010 Siliceous Siltstone, some quartz veining, chlorite alteration, sulphide stringers
135822 663980 5798163 1410 0.010 Metavolcanics? Large phenocrysts, greenish matrix, calcite veining
135859 664068 5797956 1423 0.010 Siliceous siltstone. Highly weathered. 15% quartz veining. Chloride in quartz veining.
135860 664027 5797967 1411 0.005 Green siliceous metavolcanics. Disseminated, cubes, pyrite.
135861 663909 5797928 1443 0.010 Green siliceous metavolcanics. Disseminated, cubes, pyrite.
135862 663895 5797855 1546 0.005 Volcanics. Green matrix with hornblende phenocrysts. Some quartz. Disseminated sulphides. Massive, some jointing.
135863 663673 5797233 1463 0.010 Green (chlorite?) siliceous unit. 5% pyrite, stringers and cubes. Apple green in places.
135880 664257 5799070 1326 0.050 Grey phyllite. O/C is rusty and shiny on weathered surface. Fresh surface is grey with no sulphides. O/C continues down creek for 10-15m.
135881 664262 5799112 1302 0.005 Grey phyllite with disseminated sulphides and quartz veins (2-15 cm) along bedding.
135882 664525 5798861 1388 0.005 Grey phyllite. Minor knots/carbonates that are heavily weathered with a pink/green tarnish on some surfaces. Minor sulphide stringers.
135883 664505 5798876 1378 0.005 Grey phyllite similar to last o/c except sulphides are more abundant (2-3%) and appear disseminated and as stringers.
135884 664591 5798803 1394 0.005 Grey phyllite appears siliceous in some areas, heavily weathered, and have minor sulphides (disseminated)
135885 665312 5797750 1491 0.010 Knotted Phyllite. No quartz or sulphides.
135886 665330 5797726 1492 0.030 KP with quartz veins. Veins are ~2cm - 4 cm thick, milky white with orange oxidation, and no sulphides apparent.
135887 665345 5797617 1544 0.005 Knotted Phyllite. Minor quartz (veinlets) and no sulphides.
135888 665430 5797600 1476 0.320 KP with quartz veins that are 15 cm tick, appears along bedding, milky white with orange oxidation. No apparent

Eureka Resources Inc. Frasergold Project 4 ___________________________________________________________________________________
___________________________________________________________________________________
ERSi Earth Resource Surveys Inc. Giroux Consultants Ltd.
Sample ID UTME UTMN Elevation (m) Au (ppm) Description sulphides.
135889 665545 5797444 1459 2.440 Knotted Phyllite. No quartz and sulphides.
135890 665624 5797379 1459 0.030 Knotted Phyllite. No quartz and sulphides.
135891 665452 5796322 1782 0.005 Grey Phyllite. Abundant quartz (along bedding & crosscutting) and no sulphides
135892 665472 5796229 1737 0.020
KP appears shaley with mm scale carbonates and a sleek graphiti surface. Quartz laminae along bedding that are sometimes microfolded, quartz is creamy with orange oxidation. Weathered surface of KP is rusty. Also, phyllite as a wavy appearance and there are quartz veins that crosscut the unit.
135893 665641 5796027 1828 0.010
Knotted phyllite ( looks like shaley grey phyllite) with small carbonates. O/C is masive. Quartz is milky white with orange oxidation and range mm to 3 cm. Occasional quartz is along bedding and crosscuts, also appears as microfolds.
135876 663757 5799153 0 0.020 KP with abundant knots. Quartz veins (~2cm) along bedding that are creamy white and as orange oxidation. Minor sulphides. KP continues up creek 20m.
135877 663629 5798730 0 0.005 KP. No apparent quartz veins, however there are quartz laminations on fresh surface. No apparent sulphides.
135878 663523 5798657 1532 0.005 Feldspar Porphyry. No quartz or sulphides.
135879 664127 5799074 0 0.010 Grey phyllite. Weathered surface is rusty and apears shiny. Quartz veins present are milky white. Sulphides (py) are present
135894 666998 5796109 1754 0.005 Grey Phyllite. 3-5% sulphides (py, stringers & disseminated) & no quartz.
135895 667022 5796131 1336 0.005 Grey Phyllite. Minor quartz and 1% sulphides (py)
135896 666941 5796091 1347 0.010 Knotted Phyllite. 2% sulphides (disseminated py)
135897 666982 5796023 1417 0.005 Knotted Phyllite. 15-20% quartz and 1-2% sulphides (disseminated py)
135898 666914 5795967 1417 0.010 Knotted Phyllite. 30% quartz and no sulphides.
135912 666729 5795738 1444 1.290 Knotted Phyllite. No quartz and <1% sulphides (disseminated py)
135913 666691 5795677 1447 0.050 70% quartz (massive) and 5% sulphides (py, patchy & disseminated)
135914 666691 5795677 1447 0.005 Knotted Phyllite. 20% quartz (along bedding) and 1% quartz.
135915 666338 5795242 1512 0.005 Knotted Phyllite. Quartz veins (15 cm) and no sulphides.
135916 666475 5796045 1567 0.010 Knotted Phyllite. Minor quartz & no sulphides.
135917 666347 5795913 0 0.005 Knotted Phyllite. No quartz or sulphides.
135918 666161 5796505 1603 0.010 Knotted Phyllite. <1% quartz & no sulphides.
135919 666089 5796571 1600 0.005 Knotted phyllite. No quartz or sulphides.
135920 665985 5796613 1597 0.010 Knotted Phyllite. No quartz or sulphides.
135921 661448 5802015 1253 0.005 Grey Phyllite. Minor quartz (along bedding) & 1% sulphides (py). CHANGE CO-ORDINATES - INCORRECT
135781 662005 5798554 1524 0.010 Augite Porphyry
135899 664116 5800446 1347 0.010 Grey Phyllite. < 10% Quartz. Pyrite up to 5% disseminated and in mm stringers.
135900 666635 5795639 1466 0.030 Knotted Phyllite. Slightly graphitic with approximately 25% Quartz.

Eureka Resources Inc. Frasergold Project 5 ___________________________________________________________________________________
___________________________________________________________________________________
ERSi Earth Resource Surveys Inc. Giroux Consultants Ltd.
Sample ID UTME UTMN Elevation (m) Au (ppm) Description
135901 666613 5795564 1470 0.060 Knotted Phyllite. <10% Quartz. Slightly graphitic.
135902 666538 5795510 1478 0.010 Knotted Phyllite
135903 666364 5795269 1488 0.010 Grey Phyllite, slightly graphitic. Pyrite cubes up to 5%.
135904 666510 5795923 1563 0.010 Knotted Phyllite
135905 666413 5796140 1593 0.010 Knotted Phyllite
135906 666295 5796321 1618 0.005 Knotted Phyllite. < 5% Quartz.
135907 666264 5796397 1607 0.005 Knotted Phyllite. Approximately 30% Quartz.
135908 666036 5796602 1598 0.030 Knotted Phyllite. Approximately 20% Quartz.
135864 665412 5797615 1481 0.280 Knotted phyllite. 10% quartz veining. Veins approx. 5cm thick. Pyrite stringers in margins.
135865 665456 5797572 1481 0.270 Knotted phyllite. 5% quartz as boudin <15cm.
135866 665647 5797372 1467 0.070 Knotted phyllite. Deformed with quartz veining. 20% quartz.
135867 665483 5796238 1760 0.005 Siliceous siltstone. Small lens, 1.5x1.5m exposed, surrounded by grey phyllite. 5% quartz veining.
135868 665485 5796262 1769 0.005 Knotted phyllite, small porphyroblasts (knots). Graphitic. 20-30% quartz veining.
135869 665607 5796184 1779 0.005 Black phyllite. 35-45% quartz. Quartz boudins.
135870 667143 5796280 1326 0.010 Grey phyllite. Small, dirty quartz veins, with phyllite material. Pyrite stringers, minor.
135871 667015 5796101 1364 0.010 Grey phyllite. Dark grey. 2% pyrite, stringers and cubes.
135872 666973 5796218 1418 0.005 Siltstone, siliceous. Pyrite, 1-2%, stringers and disseminated. Location +/- 90m
135873 666946 5796035 1422 0.010 Knotted phyllite. 5-10% quartz., as narrow quartz veins. 5-10%
135874 666855 5795892 1420 0.010 Knotted phyllite. 10% quartz veining. Veins mm scale to 5cm. 2% pyrite, disseminated.
135875 666819 5795809 1414 0.010 Knotted phyllite. 10-15% quartz, approx 20cm wide. 2-3% disseminated pyrite.
135922 666803 5795800 1423 0.005
Knotted phyllite. Quartz veining; large (50-100cm) veins showing pinch and swell, veining filling jointing, thin veining parallel to bedding. 1% pyrite disseminated near quartz margins.
135923 666783 5795784 1454 0.010 Siliceous siltstone. 20% quartz veining, mm scale, parallel to bedding. Disseminated pyrite 2-3%. Chlorite.
135924 666620 5795928 1540 0.005 Knotted phyllite. Weathered knots. <5% quartz veining.
135925 666580 5795904 1530 0.005 Knotted phyllite. <5% quartz veining.
135926 666517 5795840 1538 0.020 Knotted phyllite. 50% quartz veining. Veins 2-10cm wide. Weathered.
135927 664697 5801476 1629 0.005 Siliceous biotite shist. 10% quartz veining, 1-5cm wide. Some larger qtz veins with internal shist material.
135928 668477 5795160 1390 0.020 Grey phyllite. Very hard to break, very blocky. O/C is siliceous, 3-5% sulphides that appear silver and they are finely disseminated.
135929 668682 5795269 1355 0.010 Very siliceous grey phyllite with finely disseminated sulphides as well as stringers, 5-7%. 10% quartz veinlets throughout. Also some minor orange carbonates apparent.
135930 665953 5796668 1542 0.020 Knotted Phyllite, approximately 1% quartz, no sulphides
135932 666222 5796469 1525 0.270 Knotted Phyllite/Grey Phyllite with 20% quartz

Eureka Resources Inc. Frasergold Project 6 ___________________________________________________________________________________
___________________________________________________________________________________
ERSi Earth Resource Surveys Inc. Giroux Consultants Ltd.
Sample ID UTME UTMN Elevation (m) Au (ppm) Description
135933 666289 5796441 1550 0.050 Knotted Phyllite, approximately 10% quartz
135935 666375 5796329 1563 0.010 Knotted Phyllite
135937 666330 5796301 1587 0.005 Knotted Phyllite. <1% Quartz.
135938 660368 5801246 1559 0.005 Phyllite with banded appearance. Minor quartz (< 1%)
135939 660216 5801303 1575 0.005 Volcanics. Massive, greenish grey, very siliceous, minor calcite, some areas with 10-15% biotite, minor quartz
135940 659954 5801612 1497 0.005 Grey Phyllite with 1% finely disseminated sulphides
135941 662733 5799092 1612 0.005 Vocanics? Mafic, very dark green and black minerals
135942 662755 5798996 1637 0.005 Volcanic Tuff. Massive, grey, mineralized sections cross cutting light green tuff with black crystals
135943 662755 5798996 1637 0.005 Vocanics? Mafic, very dark green and black minerals. Appears to be a flow later than tuff above
135944 662606 5799052 1670 0.005 Volcanics. Mafic, very fine grained
135945 662572 5799053 1670 0.005 Volcanics. Possibly Amphibolite. Massive, dark grey, very fine grained, mafic
135946 662591 5799014 1674 0.005 Volcanics? Abundant mica (biotite), occasional deformed quartz veins, green and black
135947 668709 5795212 1389 0.005 Grey Phyllite/Siltstone. Dark grey to black, thin millimeter stringers of sulphides (5%), siliceous
135948 668799 5795146 1454 0.000 Grey Phyllite/Siltstone with approximately 20% quartz. Dark grey to black, thin millimeter stringers of sulphides (5%), siliceous
135931 666105 5796770 1540 0.050 Knotted Phyllite with approximately 15% quartz
135934 666340 5796390 1557 0.210 Knotted Phyllite with approximately 15% quartz
135936 666350 5796315 1570 0.005 Knotted Phyllite with approximately 10% quartz
135802 664763 5799664 1271 0.005 Grey Phyllite. Disseminated sulphides. Approximately 10% quartz.
135803 664763 5799664 1271 0.005 Grey Phyllite. Disseminated sulphides. Approximately 10% quartz.
135850 667021 5796284 NR 0.005 Milky to white colored massive quartz flow, 2-5% limonite along fractures, fractured, grey phyllite in-filled, no sulphides
135849 665472 5798084 1337 0.010 Knotted Phyllite with trace pyrite, chalcopyrite and malachite
135823 665855 5797548 1343 0.010 Knotted Phyllite with Grey Phyllite. < 1% Sulphides
135824 665848 5797555 1343 0.010 Knotted Phyllite/Grey Phyllite, massive milky colored quartz veins. < 2% Sulphides with euhedral pyrite
135825 665844 5797563 1344 0.010 Knotted Phyllite predominately with trace sulphides
135826 665835 5797570 1345 0.010 Knotted Phyllite, no quartz veining, trace sulphides
135827 665753 5797639 1348 0.005 Knotted Phyllite with trace sulphides
135828 665726 5797720 1342 0.180 Knotted Phyllite, moderately silicified, 30% quartz, < 1% sulphides
135829 665726 5797720 1342 0.010 Knotted Phyllite with trace sulphides
135830 665717 5797746 1339 0.005 Knotted Phyllite, laminated/banded, 1-2% sulphides, 2% quartz veins, hematite and chlorite alteration
135831 665717 5797746 1339 0.020 Knotted Phyllite and calcareous Grey Phyllite, no quartz veins
135851 667048 5796255 NR 0.010 Grey Phyllite, no sulphides, strong limonite coating

Eureka Resources Inc. Frasergold Project 7 ___________________________________________________________________________________
___________________________________________________________________________________
ERSi Earth Resource Surveys Inc. Giroux Consultants Ltd.
Sample ID UTME UTMN Elevation (m) Au (ppm) Description
135832 665648 5797853 1335 0.020 Knotted Phyllite, dark grey, moderately silicified, 10% quartz veining, 1% sulphides
135833 665596 5797939 1332 0.010 Knotted Phyllite, 2-5% quartz veins, < 1% sulphides
135834 665594 5797944 1340 0.010 Knotted Phyllite, moderately silicified, moderatly folded, < 1% quartz, < 1% sulphides
135835 665589 5797951 1331 0.020 Knotted Phyllite, hematite < 5%, limonite 2%, 1-2% pyrite, malachite < 1% and several massive quartz veins
135836 665580 5797956 1329 0.005 Knotted Phyllite/Grey Phyllite with 50% quartz
135837 665578 5797959 1332 0.010 Knotted Phyllite with quartz and sulphides in trace up to 1%
135838 665275 5798376 1327 0.020 Knotted Phyllite with < 1% sulphides
135839 665078 5798645 1308 0.210 Knotted Phyllite with < 1% sulphides
135840 665068 5798659 1308 0.005 Knotted Phyllite with < 0.5% sulphides
135841 665610 5797921 1330 0.010 Knotted Phyllite with < 0.5% sulphides
135852 667506 5796253 NR 0.010 Grey Phyllite and quartz, no sulphides
135842 664976 5798457 1504 0.010 Knotted Phyllite/calcareous Grey Phyllite with 50% quartz
135843 665146 5797987 1490 0.010 Grey Phyllite/Knotted Phyllite with trace sulphides
135844 665164 5797955 1492 5.170 Grey Phyllite/Knotted Phyllite with trace sulphides
135845 661259 5801419 1286 0.030 Grey Phyllite with scattered pyrite throughout
135846 661259 5801419 1286 0.005 Grey Phyllite with scattered pyrite throughout, massive quartz veins
135847 659921 5802523 1402 0.020 Knotted Phyllite
135853 667042 5796203 NR 0.010 Massive quartz, some phyllite, no sulphides
135854 667027 5796185 NR 0.010 Quartz with some grey phyllite
135855 668153 5795316 NR 0.010 Quartz with some grey phyllite, no sulphides
135856 668158 5795316 NR 0.010 Quartz with some grey phyllite, some limonite staining
135857 668163 5795316 NR 0.010 Quartz and grey phyllite, no suphides
135848 665607 5797943 1332 0.030 Knotted Phyllite with trace pyrite, chalcopyrite and malachite
135751 665656 5796821 1566 0.010 Knotted Phyllite. Shear zone, broken KP with <5% Quartz.
135760 665167 5797620 1566 0.020 Knotted Phyllite. < 5% Quartz.
135761 664978 5797819 1557 0.005 Knotted Phyllite.
135762 664818 5797911 1567 0.005 Knotted Phyllite.
135763 664774 5797940 1564 0.005 Knotted Phyllite. Approximately 50% Quartz.
135752 665657 5796871 1563 0.020 Knotted Phyllite. Slightly graphitic with abundant Quartz up to 65%.
135753 665658 5796923 1562 0.010 Knotted Phyllite. Approximately 40% Quartz.
135754 665657 5796952 1561 0.020 Knotted Phyllite. Appoximately 50% Quartz.
135755 665642 5796987 1567 0.005 Knotted Phyllite
135756 665626 5797055 1557 0.010 Knotted Phyllite. <1% Quartz.
135757 665558 5797167 1556 0.005 Knotted Phyllite with high graphite content. Approximately 50% Quartz.
135758 665498 5797228 1560 0.010 Knotted Phyllite. Approximately 60% Quartz
135759 665309 5797438 1562 0.005 Knotted Phyllite

Eureka Resources Inc. Frasergold Project 8 ___________________________________________________________________________________
___________________________________________________________________________________
ERSi Earth Resource Surveys Inc. Giroux Consultants Ltd.
Sample ID UTME UTMN Elevation (m) Au (ppm) Description
135791 665604 5797089 1565 0.005 Knotted Phyllite. Graphitic with chlorite in quartz and quartz margins. Approximately
135792 665532 5797199 1557 0.010 Knotted Phyllite. Approximately 20% quartz, 2-5cm veins. Graphitic with chlorite in quartz.
135858 665294 5797452 1562 0.040 Knotted Phyllite with approximately 30% quartz
135793 665107 5797679 1568 0.005 Knotted Phyllite. <5% Quartz.
135794 664870 5797890 1561 0.005 Knotted Phyllite. Approximately 20% quartz. Pyrite in quartz margins. Haematite weathering.
135795 664656 5798022 1562 0.010 Knotted Phyllite. <5% Quartz. Pyrite in quartz margin.
135785 665653 5796786 1575 0.060 Knotted Phyllite. Approximately 20% Quartz.
135786 665653 5796799 1569 0.005 Knotted Phyllite. Approximately 10-20% Quartz.
135787 665660 5796822 1563 0.005 Knotted Phyllite. Quartz veins <5cm. Pyrite stringers.
135788 665659 5796903 1580 0.005 Knotted Phyllite. Quartz veins cutting bedding. Approximately 5% Quartz.
135789 665659 5796935 1562 0.010 Knotted Phyllite. Folded Quartz vein. Pyrite cubes, disseminated.
135790 665646 5797017 1566 0.010 Knotted Phyllite. Graphitic between Quartz veins. Veins 5-60cm
136363 661210 5799468 1774 0.060
136364 661028 5799181 1886 0.010
136365 661028 5799181 1886 0.010

Eureka Resources Inc. Frasergold Project 9 ___________________________________________________________________________________
___________________________________________________________________________________
ERSi Earth Resource Surveys Inc. Giroux Consultants Ltd.
APPENDIX II
Frasergold Trench Sampling Program 2007
Locations of Samples and Sample Descriptions
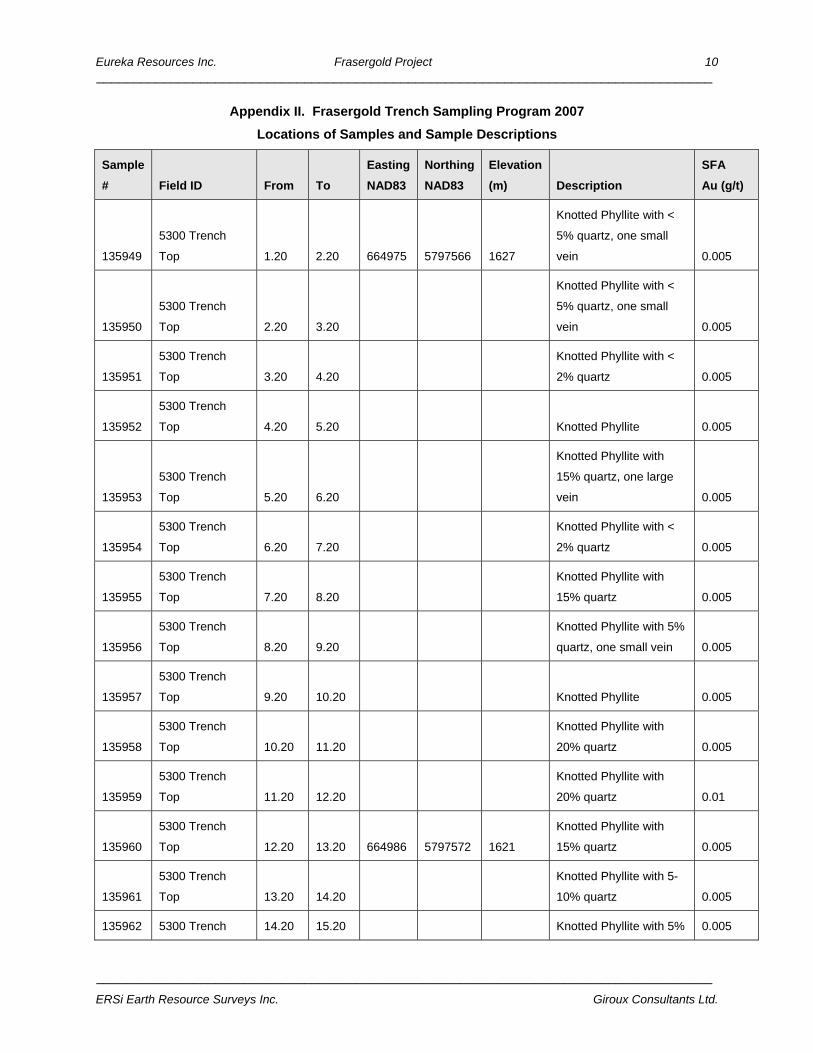
Eureka Resources Inc. Frasergold Project 10 ___________________________________________________________________________________
___________________________________________________________________________________
ERSi Earth Resource Surveys Inc. Giroux Consultants Ltd.
Appendix II. Frasergold Trench Sampling Program 2007
Locations of Samples and Sample Descriptions
Sample
# Field ID From To
Easting
NAD83
Northing
NAD83
Elevation
(m) Description
SFA
Au (g/t)
135949
5300 Trench
Top 1.20 2.20 664975 5797566 1627
Knotted Phyllite with <
5% quartz, one small
vein 0.005
135950
5300 Trench
Top 2.20 3.20
Knotted Phyllite with <
5% quartz, one small
vein 0.005
135951
5300 Trench
Top 3.20 4.20
Knotted Phyllite with <
2% quartz 0.005
135952
5300 Trench
Top 4.20 5.20 Knotted Phyllite 0.005
135953
5300 Trench
Top 5.20 6.20
Knotted Phyllite with
15% quartz, one large
vein 0.005
135954
5300 Trench
Top 6.20 7.20
Knotted Phyllite with <
2% quartz 0.005
135955
5300 Trench
Top 7.20 8.20
Knotted Phyllite with
15% quartz 0.005
135956
5300 Trench
Top 8.20 9.20
Knotted Phyllite with 5%
quartz, one small vein 0.005
135957
5300 Trench
Top 9.20 10.20 Knotted Phyllite 0.005
135958
5300 Trench
Top 10.20 11.20
Knotted Phyllite with
20% quartz 0.005
135959
5300 Trench
Top 11.20 12.20
Knotted Phyllite with
20% quartz 0.01
135960
5300 Trench
Top 12.20 13.20 664986 5797572 1621
Knotted Phyllite with
15% quartz 0.005
135961
5300 Trench
Top 13.20 14.20
Knotted Phyllite with 5-
10% quartz 0.005
135962 5300 Trench 14.20 15.20 Knotted Phyllite with 5% 0.005
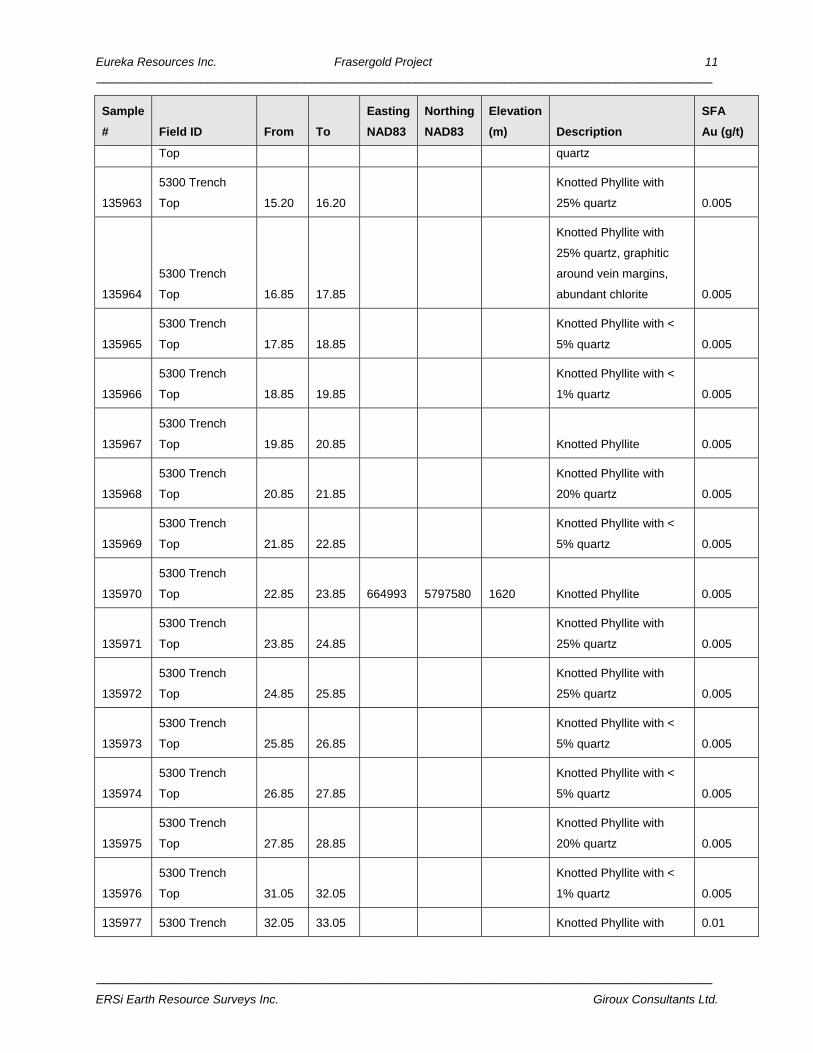
Eureka Resources Inc. Frasergold Project 11 ___________________________________________________________________________________
___________________________________________________________________________________
ERSi Earth Resource Surveys Inc. Giroux Consultants Ltd.
Sample
# Field ID From To
Easting
NAD83
Northing
NAD83
Elevation
(m) Description
SFA
Au (g/t)
Top quartz
135963
5300 Trench
Top 15.20 16.20
Knotted Phyllite with
25% quartz 0.005
135964
5300 Trench
Top 16.85 17.85
Knotted Phyllite with
25% quartz, graphitic
around vein margins,
abundant chlorite 0.005
135965
5300 Trench
Top 17.85 18.85
Knotted Phyllite with <
5% quartz 0.005
135966
5300 Trench
Top 18.85 19.85
Knotted Phyllite with <
1% quartz 0.005
135967
5300 Trench
Top 19.85 20.85 Knotted Phyllite 0.005
135968
5300 Trench
Top 20.85 21.85
Knotted Phyllite with
20% quartz 0.005
135969
5300 Trench
Top 21.85 22.85
Knotted Phyllite with <
5% quartz 0.005
135970
5300 Trench
Top 22.85 23.85 664993 5797580 1620 Knotted Phyllite 0.005
135971
5300 Trench
Top 23.85 24.85
Knotted Phyllite with
25% quartz 0.005
135972
5300 Trench
Top 24.85 25.85
Knotted Phyllite with
25% quartz 0.005
135973
5300 Trench
Top 25.85 26.85
Knotted Phyllite with <
5% quartz 0.005
135974
5300 Trench
Top 26.85 27.85
Knotted Phyllite with <
5% quartz 0.005
135975
5300 Trench
Top 27.85 28.85
Knotted Phyllite with
20% quartz 0.005
135976
5300 Trench
Top 31.05 32.05
Knotted Phyllite with <
1% quartz 0.005
135977 5300 Trench 32.05 33.05 Knotted Phyllite with 0.01
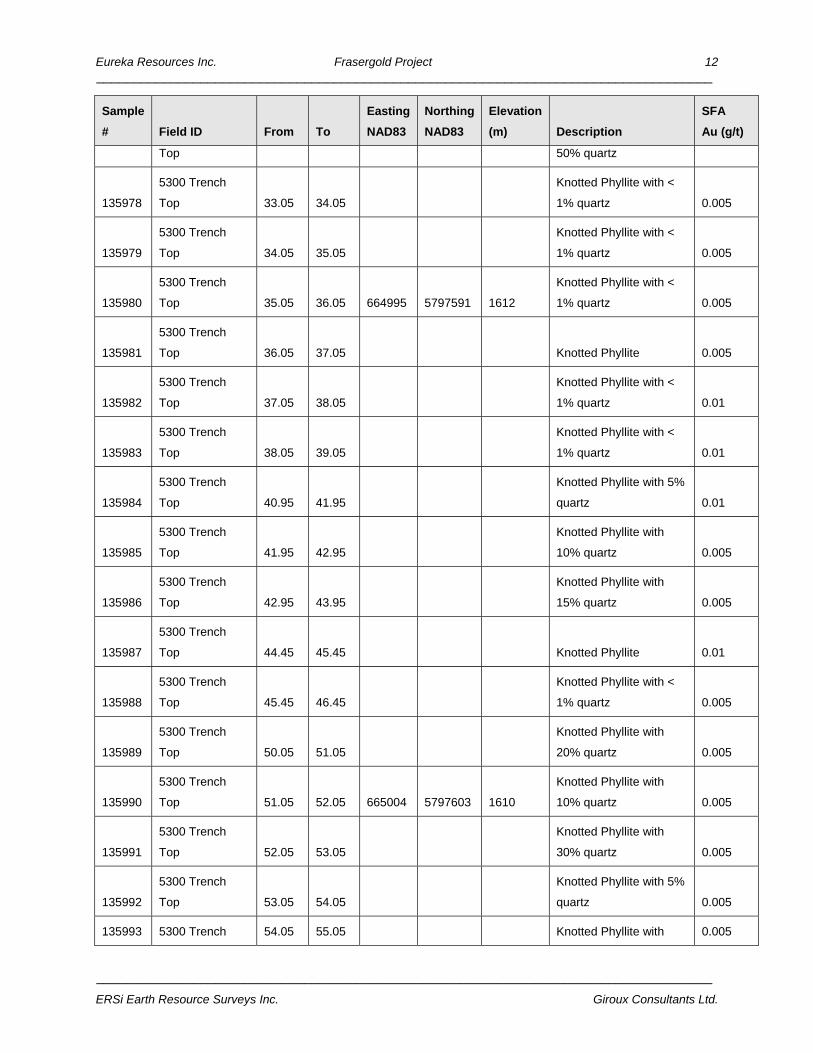
Eureka Resources Inc. Frasergold Project 12 ___________________________________________________________________________________
___________________________________________________________________________________
ERSi Earth Resource Surveys Inc. Giroux Consultants Ltd.
Sample
# Field ID From To
Easting
NAD83
Northing
NAD83
Elevation
(m) Description
SFA
Au (g/t)
Top 50% quartz
135978
5300 Trench
Top 33.05 34.05
Knotted Phyllite with <
1% quartz 0.005
135979
5300 Trench
Top 34.05 35.05
Knotted Phyllite with <
1% quartz 0.005
135980
5300 Trench
Top 35.05 36.05 664995 5797591 1612
Knotted Phyllite with <
1% quartz 0.005
135981
5300 Trench
Top 36.05 37.05 Knotted Phyllite 0.005
135982
5300 Trench
Top 37.05 38.05
Knotted Phyllite with <
1% quartz 0.01
135983
5300 Trench
Top 38.05 39.05
Knotted Phyllite with <
1% quartz 0.01
135984
5300 Trench
Top 40.95 41.95
Knotted Phyllite with 5%
quartz 0.01
135985
5300 Trench
Top 41.95 42.95
Knotted Phyllite with
10% quartz 0.005
135986
5300 Trench
Top 42.95 43.95
Knotted Phyllite with
15% quartz 0.005
135987
5300 Trench
Top 44.45 45.45 Knotted Phyllite 0.01
135988
5300 Trench
Top 45.45 46.45
Knotted Phyllite with <
1% quartz 0.005
135989
5300 Trench
Top 50.05 51.05
Knotted Phyllite with
20% quartz 0.005
135990
5300 Trench
Top 51.05 52.05 665004 5797603 1610
Knotted Phyllite with
10% quartz 0.005
135991
5300 Trench
Top 52.05 53.05
Knotted Phyllite with
30% quartz 0.005
135992
5300 Trench
Top 53.05 54.05
Knotted Phyllite with 5%
quartz 0.005
135993 5300 Trench 54.05 55.05 Knotted Phyllite with 0.005

Eureka Resources Inc. Frasergold Project 13 ___________________________________________________________________________________
___________________________________________________________________________________
ERSi Earth Resource Surveys Inc. Giroux Consultants Ltd.
Sample
# Field ID From To
Easting
NAD83
Northing
NAD83
Elevation
(m) Description
SFA
Au (g/t)
Top 10% quartz
135994
5300 Trench
Top 55.05 56.05
Knotted Phyllite with <
1% quartz 0.005
135995
5300 Trench
Top 56.05 57.05
Knotted Phyllite with <
3% quartz 0.005
135996
5300 Trench
Top 57.05 58.05
Knotted Phyllite with <
1% quartz 0.005
135997
5300 Trench
Top 58.65 59.65
Knotted Phyllite with
35% quartz 0.005
135998
5300 Trench
Top 59.65 60.65
Knotted Phyllite with
35% quartz, abundant
chlorite within quartz
veins. Some hematite
replacing carbonate
knots 0.005
135999
5300 Trench
Top 63.95 64.95
Knotted Phyllite with
50% quartz 0.01
136000
5300 Trench
Top 64.95 65.95 665008 5797609 1597
Knotted Phyllite with
50% quartz 0.005
136001
5300 Trench
Top 67.95 68.95
Knotted Phyllite with
70% quartz 0.005
136002
5300 Trench
Top 70.30 71.30
Knotted Phyllite with
15% quartz 0.005
136003
5300 Trench
Top 71.30 72.30
Knotted Phyllite with
15% quartz 0.01
136004
5300 Trench
Top 72.30 73.30
Knotted Phyllite with
40% quartz 0.005
136005
5300 Trench
Top 73.30 74.30
Knotted Phyllite with
40% quartz 0.01
136006
5300 Trench
Top 74.30 75.30
Knotted Phyllite with
25% quartz 0.005
136007
5300 Trench
Top 76.60 77.60
Knotted Phyllite with
50% quartz 0.005

Eureka Resources Inc. Frasergold Project 14 ___________________________________________________________________________________
___________________________________________________________________________________
ERSi Earth Resource Surveys Inc. Giroux Consultants Ltd.
Sample
# Field ID From To
Easting
NAD83
Northing
NAD83
Elevation
(m) Description
SFA
Au (g/t)
136008
5300 Trench
Top 77.60 78.60
Knotted Phyllite with
50% quartz 0.005
136009
5300 Trench
Top 78.60 79.60
Knotted Phyllite with <
5% quartz 0.005
136010
5300 Trench
Top 79.60 80.60 665017 5797624 1591
Knotted Phyllite with 5%
quartz 0.005
136011
5300 Trench
Top 80.60 81.60
Knotted Phyllite with <
1% quartz 0.005
136012
5300 Trench
Top 81.60 82.60
Knotted Phyllite with <
1% quartz 0.005
136013
5300 Trench
Top 82.60 83.60
Knotted Phyllite with <
1% quartz 0.005
136014
5300 Trench
Top 83.60 84.60
Knotted Phyllite with <
1% quartz 0.005
136015
5300 Trench
Top 84.60 85.60
Knotted Phyllite with 5-
10% quartz 0.005
136016
5300 Trench
Top 85.60 86.60
Knotted Phyllite with 15-
20% quartz 0.005
136017
5300 Trench
Top 86.60 87.60
Knotted Phyllite with <
1% quartz 0.005
136018
5300 Trench
Top 87.60 88.60
Knotted Phyllite with <
1% quartz 0.005
136019
5300 Trench
Top 88.60 89.60
Knotted Phyllite with <
1% quartz 0.005
136020
5300 Trench
Top 89.60 90.60
Knotted Phyllite with <
1% quartz 0.005
136021
5300 Trench
Top 90.60 91.60
Knotted Phyllite with <
1% quartz 0.005
136022
5300 Trench
Top 99.00 100.00 665028 5797637 1585
Knotted Phyllite with <
5% quartz 0.005
136023 Above Adit 1 0.00 1.00 665232 5797726 1527
Knotted Phyllite with
20% quartz; vein 0.34

Eureka Resources Inc. Frasergold Project 15 ___________________________________________________________________________________
___________________________________________________________________________________
ERSi Earth Resource Surveys Inc. Giroux Consultants Ltd.
Sample
# Field ID From To
Easting
NAD83
Northing
NAD83
Elevation
(m) Description
SFA
Au (g/t)
margins more graphitic
136024 Above Adit 1 1.00 2.00
Knotted Phyllite with
<15% quartz; chlorite in
quartz vein margins 0.02
136025 Above Adit 1 2.00 3.00
Knotted Phyllite with <
1% quartz 0.02
136026 Above Adit 1 3.00 4.00
Knotted Phyllite with
<35% quartz boudins
and veinlets 0.03
136027 Above Adit 1 4.00 5.00
Knotted Phyllite with
10% quartz 0.04
136028 Above Adit 1 5.00 6.00
Knotted Phyllite with
50% quartz; some
chlorite 0.02
136029 Above Adit 1 6.00 7.00
Knotted Phyllite with
40% quartz 0.01
136030 Above Adit 1 7.00 8.00
Knotted Phyllite with
10% quartz; chlorite in
quartz; graphitic along
vein margins 0.02
136031 Above Adit 1 8.00 9.00
Knotted Phyllite with <
1% quartz 0.01
136032 Above Adit 1 9.00 10.00
Knotted Phyllite with <
1% quartz 0.01
136033 Above Adit 1 10.00 11.00
Knotted Phyllite with
15% quartz 0.01
136034 Above Adit 1 11.00 12.00
Knotted Phyllite with
10% quartz 0.01
136035 Above Adit 1 12.00 13.00
Knotted Phyllite with <
1% quartz 0.03
136036 Above Adit 1 13.00 14.00
Knotted Phyllite with 10-
15% quartz 2.14

Eureka Resources Inc. Frasergold Project 16 ___________________________________________________________________________________
___________________________________________________________________________________
ERSi Earth Resource Surveys Inc. Giroux Consultants Ltd.
Sample
# Field ID From To
Easting
NAD83
Northing
NAD83
Elevation
(m) Description
SFA
Au (g/t)
136037 Above Adit 1 14.00 15.00
Knotted Phyllite with 50-
60% quartz 0.48
136038 Above Adit 1 15.00 16.00 665250 5797733 1520
Knotted Phyllite with <
1% quartz 0.01
136039
5450 Trench
Bottom 0.00 1.00 665254 5797657 1535 Knotted Phyllite 0.01
136040
5450 Trench
Bottom 1.00 2.00
Knotted Phyllite with <
1% quartz 0.01
136041
5450 Trench
Bottom 2.00 3.00
Knotted Phyllite with <
1% quartz 0.01
136042
5450 Trench
Bottom 3.00 4.00
Knotted Phyllite with <
1% quartz 0.01
136043
5450 Trench
Bottom 4.00 5.00
Knotted Phyllite with <
1% quartz 0.01
136044
5450 Trench
Bottom 5.00 6.00 Knotted Phyllite 0.11
136045
5450 Trench
Bottom 6.00 7.00 Knotted Phyllite 0.04
136046
5450 Trench
Bottom 7.00 8.00 Knotted Phyllite 0.2
136047
5450 Trench
Bottom 8.00 9.00
Knotted Phyllite with <
1% quartz 0.38
136048
5450 Trench
Bottom 9.00 10.00
Knotted Phyllite with <
1% quartz 0.64
136049
5450 Trench
Bottom 10.00 11.00
Knotted Phyllite with <
3% quartz 1.08
136050
5450 Trench
Bottom 11.00 12.00 665261 5797663 1528 Knotted Phyllite 0.04
136051
5450 Trench
Bottom 12.00 13.00 Knotted Phyllite 0.04
136052
5450 Trench
Bottom 13.00 14.00 Knotted Phyllite 0.09

Eureka Resources Inc. Frasergold Project 17 ___________________________________________________________________________________
___________________________________________________________________________________
ERSi Earth Resource Surveys Inc. Giroux Consultants Ltd.
Sample
# Field ID From To
Easting
NAD83
Northing
NAD83
Elevation
(m) Description
SFA
Au (g/t)
136053
5450 Trench
Bottom 14.00 15.00 Knotted Phyllite 0.08
136054
5450 Trench
Bottom 15.00 16.00
Knotted Phyllite with <
1% quartz 0.07
136055
5450 Trench
Bottom 16.00 17.00 Knotted Phyllite 0.05
136056
5450 Trench
Bottom 17.00 18.00 Knotted Phyllite 0.05
136057
5450 Trench
Bottom 18.00 19.00 Knotted Phyllite 0.03
136058
5450 Trench
Bottom 19.00 20.00
Knotted Phyllite with 5%
quartz 0.01
136059
5450 Trench
Bottom 20.00 21.00
Knotted Phyllite with 50-
60% quartz 3.28
136060
5450 Trench
Bottom 21.00 22.00 665266 5797673 1526
Knotted Phyllite with <
1% quartz 0.41
136061
5450 Trench
Bottom 22.00 23.00
Knotted Phyllite with <
1% quartz 0.06
136062
5450 Trench
Bottom 23.00 24.00
Knotted Phyllite with
25% quartz 0.15
136063
5450 Trench
Bottom 24.00 25.00
Knotted Phyllite with
50% quartz 0.43
136064
5450 Trench
Bottom 25.00 26.00
Knotted Phyllite with
25% quartz 4.12
136065
5450 Trench
Bottom 26.00 27.00
Knotted Phyllite with
30% quartz 0.7
136066
5450 Trench
Bottom 27.00 28.00
Knotted Phyllite with <
5% quartz 0.91
136067
5450 Trench
Bottom 28.00 29.00
Knotted Phyllite with
45% quartz 0.47
136068
5450 Trench
Bottom 29.00 30.00
Knotted Phyllite with
25% quartz 7.04

Eureka Resources Inc. Frasergold Project 18 ___________________________________________________________________________________
___________________________________________________________________________________
ERSi Earth Resource Surveys Inc. Giroux Consultants Ltd.
Sample
# Field ID From To
Easting
NAD83
Northing
NAD83
Elevation
(m) Description
SFA
Au (g/t)
136069
5450 Trench
Bottom 30.00 31.00 665273 5797680 1522
Knotted Phyllite with <
1% quartz 7.15
136070 Above Adit 2 0.00 1.00 665236 5797710 1528 Knotted Phyllite 0.03
136071 Above Adit 2 1.00 2.00 Knotted Phyllite 0.01
136072 Above Adit 2 2.00 3.00 Knotted Phyllite 0.14
136073 Above Adit 2 3.00 4.00
Knotted Phyllite with <
3% quartz 1.28
136074 Above Adit 2 4.00 5.00
Knotted Phyllite with
60% quartz 8.13
136075 Above Adit 2 5.00 6.00
Knotted Phyllite with
40% quartz 0.09
136076 Above Adit 2 6.00 7.00
Knotted Phyllite with <
5% quartz 0.58
136077 Above Adit 2 7.00 8.00 Knotted Phyllite 0.52
136078 Above Adit 2 8.00 9.00
Knotted Phyllite with 5%
quartz 0.07
136079 Above Adit 2 9.00 10.00 Knotted Phyllite 0.04
136080 Above Adit 2 10.00 11.00
Knotted Phyllite with
30% quartz 0.01
136081 Above Adit 2 11.00 12.00
Knotted Phyllite with
25% quartz 0.03
136082 Above Adit 2 12.00 13.00
Knotted Phyllite with
20% quartz 0.08
136083 Above Adit 2 13.00 14.00
Knotted Phyllite with <
5% quartz 0.23
136084 Above Adit 2 14.00 15.00
Knotted Phyllite with 15-
20% quartz 0.54
136085 Above Adit 2 15.00 16.00 Knotted Phyllite 0.17
136086 Above Adit 2 16.00 17.00 Knotted Phyllite 0.02
136087 Above Adit 2 17.00 18.00 Knotted Phyllite 0.01

Eureka Resources Inc. Frasergold Project 19 ___________________________________________________________________________________
___________________________________________________________________________________
ERSi Earth Resource Surveys Inc. Giroux Consultants Ltd.
Sample
# Field ID From To
Easting
NAD83
Northing
NAD83
Elevation
(m) Description
SFA
Au (g/t)
136088 Above Adit 2 18.00 19.00 Knotted Phyllite 0.01
136089 Above Adit 2 19.00 20.00
Knotted Phyllite with
50% quartz 0.1
136090 Above Adit 2 20.00 21.00
Knotted Phyllite with
50% quartz 0.01
136091 Above Adit 2 21.00 22.00 Knotted Phyllite 0.01
136092 Above Adit 2 22.00 23.00
Knotted Phyllite with <
1% quartz 0.02
136093 Above Adit 2 23.00 24.00
Knotted Phyllite with
10% quartz 0.58
136094 Above Adit 2 24.00 25.00 Knotted Phyllite 0.21
136095 Above Adit 2 25.00 26.00
Knotted Phyllite with 5-
10% quartz 0.13
136096 Above Adit 2 26.00 27.00 Knotted Phyllite 0.01
136097 Above Adit 2 27.00 28.00 Knotted Phyllite 0.005
136098 Above Adit 2 28.00 29.00 665255 5797727 1517 Knotted Phyllite 0.01
136099
5450 Trench
Top 0.00 1.00 665134 5797462 1610
Knotted Phyllite with
20% quartz 0.01
136100
5450 Trench
Top 1.00 2.00
Knotted Phyllite with
20% quartz 0.005
136101
5450 Trench
Top 2.00 3.00 Knotted Phyllite 0.005
136102
5450 Trench
Top 3.00 4.00
Knotted Phyllite with
10% quartz, siltstone
lenses 0.005
136103
5450 Trench
Top 4.00 5.00
Knotted Phyllite with 5%
quartz, pyrite 0.01
136104
5450 Trench
Top 5.00 6.00
Knotted Phyllite with
25% quartz, pyrite 0.01
136105
5450 Trench
Top 6.00 7.00
Knotted Phyllite with
10% quartz 0.005

Eureka Resources Inc. Frasergold Project 20 ___________________________________________________________________________________
___________________________________________________________________________________
ERSi Earth Resource Surveys Inc. Giroux Consultants Ltd.
Sample
# Field ID From To
Easting
NAD83
Northing
NAD83
Elevation
(m) Description
SFA
Au (g/t)
136106
5450 Trench
Top 7.00 8.00
Knotted Phyllite with
50% quartz 0.01
136107
5450 Trench
Top 8.00 9.00
Knotted Phyllite with
15% quartz 0.005
136108
5450 Trench
Top 9.00 10.00
Knotted Phyllite with
10% quartz 0.01
136109
5450 Trench
Top 10.00 11.00 665148 5797475 1610 Knotted Phyllite 0.005
136110
5450 Trench
Top 11.00 12.00 Knotted Phyllite 0.02
136111
5450 Trench
Top 12.00 13.00 Knotted Phyllite 0.01
136112
5450 Trench
Top 13.00 14.00 Knotted Phyllite 0.01
136113
5450 Trench
Top 14.00 15.00 Knotted Phyllite 0.01
136114
5450 Trench
Top 15.00 16.00 Knotted Phyllite 0.005
136115
5450 Trench
Top 16.00 17.00 Knotted Phyllite 0.005
136116
5450 Trench
Top 17.00 18.00 Knotted Phyllite 0.01
136117
5450 Trench
Top 18.00 19.00 Knotted Phyllite 0.01
136118
5450 Trench
Top 19.00 20.00 Knotted Phyllite 0.005
136119
5450 Trench
Top 20.00 21.00 665153 5797487 1600 Knotted Phyllite 0.005
136120
5450 Trench
Top 21.00 22.00 Knotted Phyllite 0.01
136121
5450 Trench
Top 22.00 23.00 Knotted Phyllite 0.01

Eureka Resources Inc. Frasergold Project 21 ___________________________________________________________________________________
___________________________________________________________________________________
ERSi Earth Resource Surveys Inc. Giroux Consultants Ltd.
Sample
# Field ID From To
Easting
NAD83
Northing
NAD83
Elevation
(m) Description
SFA
Au (g/t)
136122
5450 Trench
Top 23.00 24.00 Knotted Phyllite 0.005
136123
5450 Trench
Top 24.00 25.00 Knotted Phyllite 0.01
136124
5450 Trench
Top 25.00 26.00 Knotted Phyllite 0.01
136125
5450 Trench
Top 26.00 27.00 Knotted Phyllite 0.005
136126
5450 Trench
Top 27.00 28.00 Knotted Phyllite 0.01
136127
5450 Trench
Top 28.00 29.00 Knotted Phyllite 0.01
136128
5450 Trench
Top 29.00 30.00 Knotted Phyllite 0.005
136129
5450 Trench
Top 30.00 31.00 665172 5797517 1594 Knotted Phyllite 0.005
136130
5450 Trench
Top 31.00 32.00 Knotted Phyllite 0.005
136131
5450 Trench
Top 32.00 33.00 Knotted Phyllite 0.005
136132
5450 Trench
Top 33.00 34.00
Knotted Phyllite with 1%
quartz 0.005
136133
5450 Trench
Top 34.00 35.00
Knotted Phyllite with
15% quartz 0.005
136134
5450 Trench
Top 35.00 36.00 Knotted Phyllite 0.005
136135
5450 Trench
Top 36.00 37.00 Knotted Phyllite 0.005
136136
5450 Trench
Top 37.00 38.00 Knotted Phyllite 0.005
136137
5450 Trench
Top 38.00 39.00 Knotted Phyllite 0.005

Eureka Resources Inc. Frasergold Project 22 ___________________________________________________________________________________
___________________________________________________________________________________
ERSi Earth Resource Surveys Inc. Giroux Consultants Ltd.
Sample
# Field ID From To
Easting
NAD83
Northing
NAD83
Elevation
(m) Description
SFA
Au (g/t)
136138
5450 Trench
Top 39.00 40.00 Knotted Phyllite 0.005
136139
5450 Trench
Top 40.00 41.00 665181 5797530 1588
Knotted Phyllite with
10% quartz, pyrite 0.01
136140
5450 Trench
Top 41.00 42.00 Knotted Phyllite 0.01
136141
5450 Trench
Top 42.00 43.00
Knotted Phyllite with
20% quartz 0.005
136142
5450 Trench
Top 43.00 44.00
Knotted Phyllite with
15% quartz, pyrite 0.01
136143
5450 Trench
Top 44.00 45.00 665181 5797535 1584
Knotted Phyllite with
15% quartz 0.02
136151
5300 Trench
Bottom 0.00 1.00 665163 5797804 1527 Knotted Phyllite 0.39
136152
5300 Trench
Bottom 1.00 2.00 Knotted Phyllite 0.02
136153
5300 Trench
Bottom 2.00 3.00 Knotted Phyllite 0.04
136154
5300 Trench
Bottom 3.00 4.00 Knotted Phyllite 0.01
136155
5300 Trench
Bottom 4.00 5.00 665163 5797808 1525 Knotted Phyllite 0.05
136156
5300 Trench
Bottom 5.00 6.00 Knotted Phyllite 0.06
136157
5300 Trench
Bottom 6.00 7.00
Knotted Phyllite with 5%
quartz 0.05
136158
5300 Trench
Bottom 7.00 8.00 Knotted Phyllite 0.01
136159
5300 Trench
Bottom 8.00 9.00 Knotted Phyllite 0.02
136160
5300 Trench
Bottom 9.00 10.00 665162 5797818 1520
Knotted Phyllite with
10% quartz 0.03

Eureka Resources Inc. Frasergold Project 23 ___________________________________________________________________________________
___________________________________________________________________________________
ERSi Earth Resource Surveys Inc. Giroux Consultants Ltd.
Sample
# Field ID From To
Easting
NAD83
Northing
NAD83
Elevation
(m) Description
SFA
Au (g/t)
136161
5300 Trench
Bottom 10.00 11.00 Knotted Phyllite 0.005
136162
5300 Trench
Bottom 11.00 12.00 Knotted Phyllite 0.01
136163
5300 Trench
Bottom 12.00 13.00 Knotted Phyllite 0.005
136164
5300 Trench
Bottom 13.00 14.00 Knotted Phyllite 0.04
136165
5300 Trench
Bottom 14.00 15.00 665172 5797835 1537 Knotted Phyllite 0.01
136166
5300 Trench
Bottom 15.00 16.00 Knotted Phyllite 0.04
136167
5300 Trench
Bottom 16.00 17.00 Knotted Phyllite 0.01
136168
5300 Trench
Bottom 17.00 18.00 Knotted Phyllite 0.05
136169
5300 Trench
Bottom 18.00 19.00 Knotted Phyllite 0.01
136170
5300 Trench
Bottom 19.00 20.00 665172 5797824 1516 Knotted Phyllite 0.005
136171
5300 Trench
Bottom 20.00 21.00 Knotted Phyllite 0.01
136172
5300 Trench
Bottom 21.00 22.00 Knotted Phyllite 0.01
136173
5300 Trench
Bottom 22.00 23.00 Knotted Phyllite 0.02
136174
5300 Trench
Bottom 23.00 24.00 Knotted Phyllite 0.02
136175
5300 Trench
Bottom 24.00 25.00 665171 5797828 1516 Knotted Phyllite 0.03
136176
5300 Trench
Bottom 25.00 26.00 Knotted Phyllite 0.02

Eureka Resources Inc. Frasergold Project 24 ___________________________________________________________________________________
___________________________________________________________________________________
ERSi Earth Resource Surveys Inc. Giroux Consultants Ltd.
Sample
# Field ID From To
Easting
NAD83
Northing
NAD83
Elevation
(m) Description
SFA
Au (g/t)
136177
5300 Trench
Bottom 26.00 27.00 Knotted Phyllite 0.04
136178
5300 Trench
Bottom 27.00 28.00 Knotted Phyllite 0.16
136179
5300 Trench
Bottom 28.00 29.00
Knotted Phyllite with
15% quartz 0.06
136180
5300 Trench
Bottom 29.00 30.00 665173 5797833 1516
Knotted Phyllite with 5%
quartz 0.07
136181
5300 Trench
Bottom 34.00 35.00 Knotted Phyllite 0.01
136182
5300 Trench
Bottom 35.00 36.00
Knotted Phyllite with
10% quartz 0.03
136183
5300 Trench
Bottom 36.00 37.00
Knotted Phyllite with
15% quartz 0.08
136184
5300 Trench
Bottom 37.00 38.00 Knotted Phyllite 0.06
136185
5300 Trench
Bottom 38.00 39.00 665182 5797841 1515 Knotted Phyllite 0.005
136186
5300 Trench
Bottom 39.00 40.00
Knotted Phyllite with 5%
quartz 0.005
136187
5300 Trench
Bottom 40.00 41.00
Knotted Phyllite with
50% quartz 0.005
136188
5300 Trench
Bottom 41.00 42.00
Knotted Phyllite with
10% quartz 0.005
136189
5300 Trench
Bottom 42.00 43.00
Knotted Phyllite with
20% quartz 0.005
136190
5300 Trench
Bottom 43.00 44.00 665176 5797844 1508 Knotted Phyllite 0.02
136191
5300 Trench
Bottom 44.00 45.00 Knotted Phyllite 0.005
136192
5300 Trench
Bottom 45.00 46.00 Knotted Phyllite 0.005

Eureka Resources Inc. Frasergold Project 25 ___________________________________________________________________________________
___________________________________________________________________________________
ERSi Earth Resource Surveys Inc. Giroux Consultants Ltd.
Sample
# Field ID From To
Easting
NAD83
Northing
NAD83
Elevation
(m) Description
SFA
Au (g/t)
136193
5300 Trench
Bottom 46.00 47.00 Knotted Phyllite 0.01
136194
5300 Trench
Bottom 50.00 51.00 Knotted Phyllite 0.04
136195
5300 Trench
Bottom 51.00 52.00 665186 5797850 1513 Knotted Phyllite 0.06
136196
5300 Trench
Bottom 52.00 53.00 Knotted Phyllite 0.01
136197
5300 Trench
Bottom 53.00 54.00 Knotted Phyllite 0.02
136198
5300 Trench
Bottom 54.00 55.00 Knotted Phyllite 0.06
136199
5300 Trench
Bottom 55.00 56.00
Knotted Phyllite with
25% quartz 0.23
136200
5300 Trench
Bottom 56.00 57.00 665191 5797853 1509 Knotted Phyllite 0.23
136201
5300 Trench
Bottom 57.00 58.00
Knotted Phyllite with 5%
quartz 0.29
136202
5300 Trench
Bottom 58.00 59.00
Knotted Phyllite with
25% quartz 0.005
136203
5300 Trench
Bottom 59.00 60.00
Knotted Phyllite with
20% quartz 0.005
136204
5300 Trench
Bottom 60.00 61.00
Knotted Phyllite with
10% quartz 0.01
136205
5300 Trench
Bottom 61.00 62.00 665198 5797860 1513 Knotted Phyllite 0.06
136206
5300 Trench
Bottom 62.00 63.00
Knotted Phyllite with
15% quartz 0.09
136207
5300 Trench
Bottom 63.00 64.00
Knotted Phyllite with 5%
quartz 0.02
136208 T100 Trench 0.00 1.00 665584 5797237 1529 Knotted Phyllite 0.01
136209 T100 Trench 1.00 2.00 Knotted Phyllite with 0.01

Eureka Resources Inc. Frasergold Project 26 ___________________________________________________________________________________
___________________________________________________________________________________
ERSi Earth Resource Surveys Inc. Giroux Consultants Ltd.
Sample
# Field ID From To
Easting
NAD83
Northing
NAD83
Elevation
(m) Description
SFA
Au (g/t)
<1% quartz
136210 T100 Trench 2.00 3.00 Knotted Phyllite 0.01
136211 T100 Trench 3.00 4.00 Knotted Phyllite 0.01
136212 T100 Trench 4.00 5.00 Knotted Phyllite 0.01
136213 T100 Trench 5.00 6.00 665587 5797242 1529 Knotted Phyllite 0.01
136214 T100 Trench 6.00 7.00
Knotted Phyllite with
<2% quartz 0.01
136215 T100 Trench 7.00 8.00 Knotted Phyllite 0.01
136216 T100 Trench 8.00 9.00 Knotted Phyllite 0.01
136217 T100 Trench 9.00 10.00 Knotted Phyllite 0.01
136218 T100 Trench 10.00 11.00 665593 5797244 1525 Knotted Phyllite 0.01
136219 T100 Trench 11.00 12.00 Knotted Phyllite 0.01
136220 T100 Trench 12.00 13.00
Knotted Phyllite with
10% quartz 0.01
136221 T100 Trench 13.00 14.00 Knotted Phyllite 0.09
136222 T100 Trench 14.00 15.00 Knotted Phyllite 0.23
136223 T100 Trench 15.00 16.00 665593 5797244 1522 Knotted Phyllite 0.01

Eureka Resources Inc. Frasergold Project 27 ___________________________________________________________________________________
___________________________________________________________________________________
ERSi Earth Resource Surveys Inc. Giroux Consultants Ltd.
APPENDIX III
Fire Assay and Screened Metallic Assay Values of 2007 Underground Channel Samples

Eureka Resources Inc. Frasergold Project 28 ___________________________________________________________________________________
___________________________________________________________________________________
ERSi Earth Resource Surveys Inc. Giroux Consultants Ltd.
Appendix III. Fire Assay and Screened Metallic Assay Values of 2007 Underground Channel Samples
Fire Assay Screened
Metallic Au
Total (g/t) Sample Type Wt (kg) Au (g/t) Au (g/t) Avg FA (g/t)
136293 Rock 4.9 0.50 0.54 0.52 0.45
136294 Rock 2.3 0.20 0.18 0.19 0.34
136295 Rock 4.7 0.41 0.43 0.42 0.36
136296 Rock 2.5 2.53 2.77 2.65 3.33
136297 Rock 3.6 0.10 0.08 0.09 0.07
136298 Rock 3.3 0.33 0.32 0.325 0.34
136299 Rock 3.4 0.16 0.20 0.18 0.16
136300 Rock 2.9 0.08 0.06 0.07
136301 Rock 4.8 0.06 0.07 0.065
136302 Rock 3.8 0.08 0.09 0.085
136303 Rock 2.3 0.34 0.27 0.305 0.20
136304 Rock 2.9 0.34 0.33 0.335 0.34
136305 Rock 2.5 0.05 0.05 0.05
136306 Rock 3.2 0.02 0.02 0.02
136307 Rock 3.9 0.12 0.15 0.135 0.12
136308 Rock 4.1 0.03 0.04 0.035
136309 Rock 3.0 0.04 0.03 0.035
136310 Rock 1.6 0.03 0.04 0.035
136311 Rock 4.2 0.28 0.24 0.26 0.39
136312 Rock 2.4 0.03 0.03 0.03
136313 Rock 3.7 0.02 0.02 0.02
136314 Rock 2.8 0.02 0.02 0.02
136315 Rock 2.9 0.19 0.19 0.19 0.16
136316 Rock 2.6 1.79 1.21 1.5 1.87
136317 Rock 5.2 0.18 0.18 0.18 0.19
136318 Rock 1.5 0.92 0.87 0.895 0.76
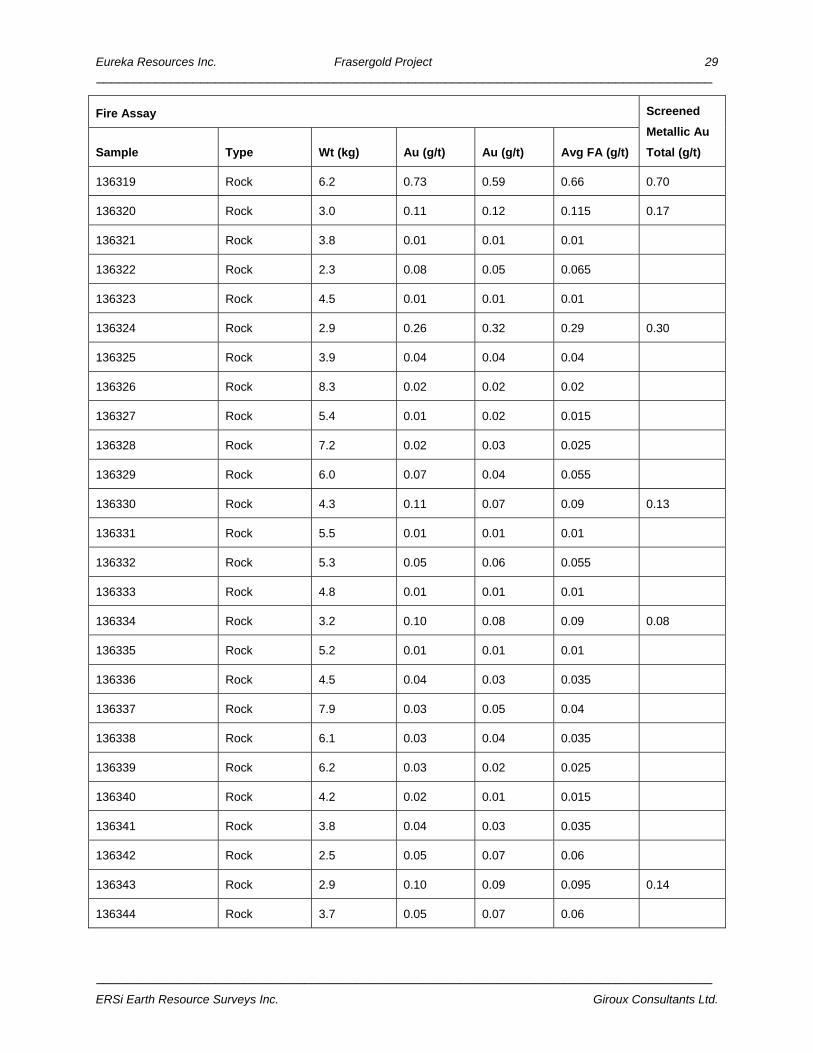
Eureka Resources Inc. Frasergold Project 29 ___________________________________________________________________________________
___________________________________________________________________________________
ERSi Earth Resource Surveys Inc. Giroux Consultants Ltd.
Fire Assay Screened
Metallic Au
Total (g/t) Sample Type Wt (kg) Au (g/t) Au (g/t) Avg FA (g/t)
136319 Rock 6.2 0.73 0.59 0.66 0.70
136320 Rock 3.0 0.11 0.12 0.115 0.17
136321 Rock 3.8 0.01 0.01 0.01
136322 Rock 2.3 0.08 0.05 0.065
136323 Rock 4.5 0.01 0.01 0.01
136324 Rock 2.9 0.26 0.32 0.29 0.30
136325 Rock 3.9 0.04 0.04 0.04
136326 Rock 8.3 0.02 0.02 0.02
136327 Rock 5.4 0.01 0.02 0.015
136328 Rock 7.2 0.02 0.03 0.025
136329 Rock 6.0 0.07 0.04 0.055
136330 Rock 4.3 0.11 0.07 0.09 0.13
136331 Rock 5.5 0.01 0.01 0.01
136332 Rock 5.3 0.05 0.06 0.055
136333 Rock 4.8 0.01 0.01 0.01
136334 Rock 3.2 0.10 0.08 0.09 0.08
136335 Rock 5.2 0.01 0.01 0.01
136336 Rock 4.5 0.04 0.03 0.035
136337 Rock 7.9 0.03 0.05 0.04
136338 Rock 6.1 0.03 0.04 0.035
136339 Rock 6.2 0.03 0.02 0.025
136340 Rock 4.2 0.02 0.01 0.015
136341 Rock 3.8 0.04 0.03 0.035
136342 Rock 2.5 0.05 0.07 0.06
136343 Rock 2.9 0.10 0.09 0.095 0.14
136344 Rock 3.7 0.05 0.07 0.06

Eureka Resources Inc. Frasergold Project 30 ___________________________________________________________________________________
___________________________________________________________________________________
ERSi Earth Resource Surveys Inc. Giroux Consultants Ltd.
Fire Assay Screened
Metallic Au
Total (g/t) Sample Type Wt (kg) Au (g/t) Au (g/t) Avg FA (g/t)
136345 Rock 3.9 0.03 0.02 0.025
136346 Rock 3.7 0.05 0.06 0.055
136347 Rock 5.4 0.03 0.04 0.035
136348 Rock 1.8 0.02 0.01 0.015
136349 Rock 6.5 0.04 0.04 0.04
136350 Rock 5.6 0.02 0.04 0.03
136401 Rock 2.1 0.02 0.04 0.03
136402 Rock 2.8 0.01 0.01 0.005
136403 Rock 5.2 0.44 0.70 0.57 0.41
136404 Rock 2.7 0.03 0.04 0.035
136405 Rock 3.9 0.05 0.03 0.04
136406 Rock 3.7 0.02 0.02 0.02 0.08 - 2.77
136407 Rock 4.0 0.09 0.10 0.095
136408 Rock 3.0 0.09 0.07 0.08
136409 Rock 5.2 5.40 6.75 6.075 6.37
136410 Rock 4.1 1.49 1.95 1.72 2.33
136411 Rock 4.9 1.85 1.85 1.85 1.82
136412 Rock 4.4 0.67 0.70 0.685 0.71
136413 Rock 5.8 0.21 0.21 0.21 0.21
136414 Rock 1.4 0.65 0.34 0.495 0.36
136415 Rock 6.3 0.07 0.11 0.09
136416 Rock 4.6 0.06 0.11 0.085
136417 Rock 4.0 0.06 0.07 0.065
136418 Rock 2.3 1.97 1.59 1.78 2.08
136419 Rock 3.6 0.25 0.25 0.25 0.31
136420 Rock 3.8 0.32 0.29 0.305 0.36

Eureka Resources Inc. Frasergold Project 31 ___________________________________________________________________________________
___________________________________________________________________________________
ERSi Earth Resource Surveys Inc. Giroux Consultants Ltd.
Fire Assay Screened
Metallic Au
Total (g/t) Sample Type Wt (kg) Au (g/t) Au (g/t) Avg FA (g/t)
136421 Rock 4.5 0.34 0.44 0.39 0.43
136422 Rock 1.5 0.51 0.37 0.44 0.51
136423 Rock 4.7 1.13 0.67 0.9 1.23
136424 Rock 2.7 0.24 0.42 0.33 0.67
136425 Rock 5.7 0.56 0.47 0.515 0.73
136426 Rock 4.7 0.24 0.30 0.27 0.28
136427 Rock 6.3 0.91 1.02 0.965 1.39
136428 Rock 3.0 0.40 0.42 0.41 0.45
136429 Rock 7.4 1.77 1.50 1.635 2.27
136430 Rock 3.3 1.00 0.84 0.92 1.22
136431 Rock 2.0 0.29 0.30 0.295 0.32
136432 Rock 2.5 1.13 0.98 1.055 1.20
136433 Rock 6.6 0.29 0.30 0.295 0.39
136434 Rock 4.1 0.11 0.14 0.125 0.10
136435 Rock 4.0 1.17 1.19 1.18 1.62
136436 Rock 4.6 0.16 0.16 0.16 0.25
136437 Rock 6.4 0.93 0.41 0.67 0.50
136438 Rock 5.6 0.03 0.05 0.04
136439 Rock 2.3 1.11 0.42 0.765 0.51
136440 Rock 1.6 0.18 0.13 0.155 0.20
136441 Rock 5.9 1.22 1.12 1.17 1.76
136442 Rock 6.3 0.54 0.51 0.525 0.58
136443 Rock 6.6 0.09 0.05 0.07
136444 Rock 5.3 0.04 0.04 0.04
136445 Rock 5.7 1.47 1.45 1.46 2.41
136446 Rock 3.5 0.22 0.14 0.18 0.18

Eureka Resources Inc. Frasergold Project 32 ___________________________________________________________________________________
___________________________________________________________________________________
ERSi Earth Resource Surveys Inc. Giroux Consultants Ltd.
Fire Assay Screened
Metallic Au
Total (g/t) Sample Type Wt (kg) Au (g/t) Au (g/t) Avg FA (g/t)
136447 Rock 5.5 0.31 0.34 0.325 0.32
136448 Rock 5.2 0.06 0.06 0.06
136449 Rock 3.5 0.06 0.05 0.055
136450 Rock 5.2 0.02 0.02 0.02
136451 Rock 6.3 0.13 0.16 0.145 0.15
136452 Rock 4.9 0.11 0.10 0.105 0.23
136453 Rock 5.3 0.02 0.01 0.015
136454 Rock 3.6 0.08 0.06 0.07
136455 Rock 5.4 0.11 0.12 0.115 0.15
136456 Rock 3.2 0.24 0.15 0.195 0.14
136457 Rock 4.6 0.16 0.35 0.255 0.17
136458 Rock 4.3 0.37 0.35 0.36 0.58
136459 Rock 9.1 0.49 0.45 0.47 0.52
136460 Rock 4.8 0.95 0.70 0.825 0.94
136461 Rock 6.6 0.29 0.25 0.27 0.29
136462 Rock 3.4 0.25 0.28 0.265 0.27
136463 Rock 4.0 0.51 0.45 0.48 0.54
136464 Rock 3.0 0.19 0.18 0.185 0.20
136465 Rock 6.5 1.57 1.50 1.535 1.64
136466 Rock 5.7 0.09 0.10 0.095
136467 Rock 5.0 0.54 0.45 0.495 0.58
136468 Rock 5.1 0.76 0.75 0.755 0.73
136469 Rock 7.0 0.23 0.24 0.235 0.18
136470 Rock 6.1 0.29 0.24 0.265 0.25
136471 Rock 8.3 0.39 0.31 0.35 0.45
136472 Rock 5.8 0.34 0.26 0.3 0.21

Eureka Resources Inc. Frasergold Project 33 ___________________________________________________________________________________
___________________________________________________________________________________
ERSi Earth Resource Surveys Inc. Giroux Consultants Ltd.
Fire Assay Screened
Metallic Au
Total (g/t) Sample Type Wt (kg) Au (g/t) Au (g/t) Avg FA (g/t)
136473 Rock 5.3 0.21 0.18 0.195 0.18
136474 Rock 2.7 0.02 0.02 0.02
136475 Rock 8.1 0.17 0.19 0.18 0.25
136476 Rock 6.4 0.53 0.65 0.59 0.56
136477 Rock 6.2 0.15 0.16 0.155 0.16
136478 Rock 2.6 0.11 0.12 0.115 0.14
136479 Rock 4.9 0.18 0.20 0.19 0.22
136480 Rock 2.6 0.54 0.57 0.555 0.78
136481 Rock 4.6 0.30 0.31 0.305 0.32
136482 Rock 4.1 2.03 3.02 2.525 1.77
136483 Rock 5.0 18.98 26.61 22.795 23.20
136484 Rock 5.0 1.00 1.02 1.01 1.04
136485 Rock 7.0 0.42 0.63 0.525 0.55
136486 Rock 2.1 0.55 0.56 0.555 0.76
136487 Rock 3.0 0.77 0.95 0.86 0.85
136488 Rock -- 0.04 0.05 0.045
136489 Rock 4.2 0.61 0.52 0.565 0.72
136490 Rock 4.7 0.34 0.25 0.295 0.30
136491 Rock 2.6 0.44 0.35 0.395 0.49
136492 Rock -- 0.10 0.11 0.105
136493 Rock 4.8 0.57 0.48 0.525 0.47
136494 Rock 3.6 1.43 2.29 1.86 2.25
136495 Rock 4.8 0.48 0.45 0.465 0.43
136496 Rock 5.9 0.30 0.34 0.32 0.48
136497 Rock 3.6 0.09 0.05 0.07
136498 Rock 2.1 0.17 0.13 0.15 0.15

Eureka Resources Inc. Frasergold Project 34 ___________________________________________________________________________________
___________________________________________________________________________________
ERSi Earth Resource Surveys Inc. Giroux Consultants Ltd.
Fire Assay Screened
Metallic Au
Total (g/t) Sample Type Wt (kg) Au (g/t) Au (g/t) Avg FA (g/t)
136499 Rock 3.1 0.01 0.01 0.01
136500 Rock 1.6 0.02 0.01 0.015
136501 Rock 5.0 0.01 0.01 0.01
136502 Rock 2.8 0.01 0.01 0.01
136503 Rock 4.5 0.02 0.02 0.02
136504 Rock 4.8 0.05 0.08 0.065
136505 Rock 1.9 0.11 0.14 0.125 0.18
136506 Rock 6.7 0.03 0.05 0.04
136507 Rock 4.0 0.19 0.29 0.24 0.30
136508 Rock 2.4 0.29 0.31 0.3 0.51
136509 Rock 3.4 0.33 0.42 0.375 0.46
136510 Rock 4.5 0.08 0.08 0.08
136511 Rock -- 0.13 0.12 0.125
136512 Rock 3.4 0.13 0.06 0.095 0.19
136513 Rock 9.4 1.59 1.64 1.615 2.02
136514 Rock 4.0 7.56 3.64 5.6 6.91
136515 Rock 2.9 16.14 11.09 13.615 12.83
136516 Rock 5.1 0.19 0.20 0.195 0.22
136517 Rock 1.5 0.27 0.24 0.255 0.44
136518 Rock 5.5 0.07 0.03 0.05
136519 Rock 4.8 0.09 0.10 0.095
136520 Rock 5.1 0.09 0.11 0.1
136521 Rock 3.4 0.02 0.02 0.02
136522 Rock 6.3 0.26 0.37 0.315 0.32
136523 Rock 3.3 0.10 0.10 0.1
136524 Rock 4.5 0.74 0.71 0.725 0.85

Eureka Resources Inc. Frasergold Project 35 ___________________________________________________________________________________
___________________________________________________________________________________
ERSi Earth Resource Surveys Inc. Giroux Consultants Ltd.
Fire Assay Screened
Metallic Au
Total (g/t) Sample Type Wt (kg) Au (g/t) Au (g/t) Avg FA (g/t)
136525 Rock 2.8 0.63 0.74 0.685 0.76
136526 Rock 4.9 0.37 0.43 0.4 0.39
136527 Rock 6.4 1.12 1.31 1.215 1.20
136528 Rock 4.0 86.85 103.76 95.305 37.77
136529 Rock 3.0 0.20 0.15 0.175 0.31
136530 Rock 2.3 0.08 0.09 0.085
136531 Rock 4.9 0.27 0.37 0.32 0.36
136532 Rock 2.3 0.03 0.03 0.03
136533 Rock 5.9 0.23 0.21 0.22 0.28
136534 Rock 2.5 0.03 0.03 0.03
136535 Rock 3.7 0.06 0.06 0.06
136536 Rock 2.4 0.09 0.07 0.08
136537 Rock 2.1 0.06 0.06 0.06
136538 Rock 2.0 0.08 0.10 0.09
136539 Rock 5.0 0.01 0.02 0.015
136540 Rock 2.4 0.02 0.02 0.02
136541 Rock 3.3 0.02 0.02 0.02
136542 Rock 2.9 0.02 0.01 0.015
136543 Rock 4.6 0.01 0.01 0.01
136544 Rock 3.1 0.01 0.01 0.01
136545 Rock 5.2 0.02 0.03 0.025
136546 Rock 4.2 0.01 0.01 0.01
136547 Rock 4.9 0.01 0.01 0.01
136548 Rock 2.2 0.01 0.01 0.0075
136549 Rock 3.4 0.01 0.01 0.01
136550 Rock 5.6 0.08 0.07 0.075

Eureka Resources Inc. Frasergold Project 36 ___________________________________________________________________________________
___________________________________________________________________________________
ERSi Earth Resource Surveys Inc. Giroux Consultants Ltd.
Fire Assay Screened
Metallic Au
Total (g/t) Sample Type Wt (kg) Au (g/t) Au (g/t) Avg FA (g/t)
136551 Rock 4.5 0.03 0.02 0.025
136552 Rock 1.4 0.04 0.04 0.04
136553 Rock 4.9 0.02 0.01 0.015
RE 136293 Repeat -- 0.55 0.55
RE 136312 Repeat -- 0.04 0.03
RE 136332 Repeat -- 0.05 0.06
RE 136401 Repeat -- 0.01 0.01
RE 136421 Repeat -- 0.36 0.38
RE 136440 Repeat -- 0.16 0.09
RE 136460 Repeat -- 0.72 0.61
RE 136479 Repeat -- 0.20 0.17
RE 136499 Repeat -- 0.01 0.01
RE 136518 Repeat -- 0.04 0.04
RE 136538 Repeat -- 0.06 0.06
Blank IPL Blk IPL -- <0.01 <0.01
GS-1P5B STD IPL -- 1.48 1.49
GS-1P5B REF STD IPL -- 1.46 1.46
Minimum detection 0.1 0.01 0.01 0.01
Maximum detection 9999 5000 5000 5000
Method Spec FA/AAS FA/AAS FA/AAS

Eureka Resources Inc. Frasergold Project 37 ___________________________________________________________________________________
___________________________________________________________________________________
ERSi Earth Resource Surveys Inc. Giroux Consultants Ltd.
APPENDIX IV
DRILL HOLES USED IN RESOURCE ESTIMATE

Eureka Resources Inc. Frasergold Project 38 ___________________________________________________________________________________
___________________________________________________________________________________
ERSi Earth Resource Surveys Inc. Giroux Consultants Ltd.
Appendix IV Drill Holes Used In Resource Estimate
HOLE
EASTING NORTHING ELEVATION Hole Length (m) TYPE
07304A 666505.13 5795990.07 1564.51 154.84 DDH
07304B 666504.09 5795989.19 1564.44 262.43 DDH
07295 665123.51 5797758.32 1541.33 227.38 DDH
07296 665234.22 5797656.93 1537.50 215.19 DDH
07297 665287.18 5797548.34 1545.37 218.23 DDH
07298 665308.45 5797507.77 1549.58 227.38 DDH
07299 665505.70 5797344.64 1522.90 212.45 DDH
07300 665522.56 5797212.70 1556.20 216.15 DDH
07301 665619.13 5797209.38 1517.37 209.09 DDH
07302 665491.23 5797243.86 1557.41 233.78 DDH
07303 666258.66 5796412.65 1574.64 236.83 DDH
07305 665272.15 5797496.87 1563.43 244.75 DDH
07306 665226.26 5797546.57 1565.21 267.31 DDH
07307 665431.42 5797284.59 1564.36 248.72 DDH
07308 665172.03 5797625.64 1561.97 239.88 DDH
07309 665172.03 5797625.64 1561.97 200.56 DDH
83001 665525.35 5797208.69 1555.87 328.30 DDH
83002 665211.58 5797566.60 1566.27 322.20 DDH
83003 665346.56 5797407.22 1559.97 324.90 DDH
83004 665017.63 5797791.90 1555.17 239.90 DDH
83005 665143.92 5797493.70 1597.77 428.90 DDH
08310 665147.64 5797663.00 1558.95 53.95 DDH
08311 665054.05 5797790.55 1555.64 273.41 DDH
08312 665145.58 5797661.56 1559.27 255.12 DDH
08313 665035.26 5797809.33 1555.10 288.65 DDH
08314 665079.48 5797679.73 1571.33 233.79 DDH

Eureka Resources Inc. Frasergold Project 39 ___________________________________________________________________________________
___________________________________________________________________________________
ERSi Earth Resource Surveys Inc. Giroux Consultants Ltd.
HOLE
EASTING NORTHING ELEVATION Hole Length (m) TYPE
08315 665139.16 5797812.38 1525.50 178.61 DDH
08316 665170.01 5797814.74 1518.39 130.30 DDH
08317 665263.12 5797510.50 1563.61 251.76 DDH
08318 665181.49 5797646.96 1554.44 224.33 DDH
08319 665386.64 5797347.24 1561.30 203.30 DDH
08320 665320.99 5797462.51 1555.36 239.57 DDH
08321 665370.08 5797369.13 1560.11 203.30 DDH
08322 665355.01 5797389.00 1559.71 252.07 DDH
08323 665196.52 5797586.32 1565.28 233.78 DDH
08324 665475.67 5797258.59 1558.65 196.90 DDH
08325 665064.95 5797701.66 1571.48 267.00 DDH
08326 665553.54 5797192.22 1550.51 195.68 DDH
08327 665617.89 5797141.31 1538.63 224.33 DDH
08328 665060.51 5797839.36 1538.59 206.40 DDH
08329 665294.57 5797472.46 1561.86 230.79 DDH
08330 665084.03 5797871.72 1525.07 200.25 DDH
08331 665322.66 5797435.28 1561.70 226.16 DDH
08332 665417.79 5797305.74 1563.04 206.04 DDH
08333 665121.26 5797896.75 1510.91 129.80 DDH
08334 665321.55 5797589.68 1525.52 193.85 DDH
08335 665050.98 5797907.24 1524.74 203.00 DDH
08336 665216.68 5797772.74 1515.88 81.38 DDH
08337 665257.18 5797709.53 1517.62 129.54 DDH
08338 665231.58 5797734.65 1519.82 127.10 DDH
08339 665173.75 5797782.17 1523.67 108.81 DDH
08340 665684.94 5797204.79 1493.80 145.08 DDH
08341 665102.45 5797794.08 1538.09 51.21 DDH

Eureka Resources Inc. Frasergold Project 40 ___________________________________________________________________________________
___________________________________________________________________________________
ERSi Earth Resource Surveys Inc. Giroux Consultants Ltd.
HOLE
EASTING NORTHING ELEVATION Hole Length (m) TYPE
08342 665543.58 5797119.93 1571.54 199.95 DDH
08343 665102.25 5797793.46 1538.22 148.13 DDH
08344 665443.46 5797457.32 1512.01 126.19 DDH
08345 664988.90 5797769.06 1569.43 291.69 DDH
08346 665409.93 5797459.05 1523.71 169.77 DDH
08347 665398.09 5797478.46 1523.46 145.39 DDH
08348 665005.11 5797854.22 1547.57 69.19 DDH
08349 665413.49 5797403.38 1538.17 172.51 DDH
08350 665005.10 5797854.14 1547.56 230.43 DDH
08351 665460.11 5797359.20 1532.97 157.28 DDH
08352 665477.49 5797423.15 1505.92 111.56 DDH
08353 664974.36 5797894.97 1543.31 200.25 DDH
08354 665528.44 5797366.25 1508.38 151.18 DDH
08355 665531.55 5797401.04 1494.80 102.72 DDH
08356 665600.03 5797337.84 1493.53 96.62 DDH
08357 665259.67 5797672.57 1524.77 154.53 DDH
08358 665638.15 5797292.70 1492.27 99.36 DDH
08359 665674.02 5797262.27 1484.34 84.43 DDH
08360 665620.01 5797324.21 1490.09 141.43 DDH
08361 665475.31 5797339.82 1536.17 145.08 DDH
08362 665509.89 5797302.00 1533.61 151.18 DDH
08363 665025.82 5797878.80 1536.92 221.28 DDH
08364 664961.32 5797796.30 1569.02 282.55 DDH
08365 664962.36 5797955.66 1531.54 206.35 DDH
08366 664908.99 5797971.98 1533.88 206.35 DDH
08367 664994.22 5797921.12 1534.79 203.00 DDH
84006 665608.81 5797104.52 1538.55 56.70 DDH

Eureka Resources Inc. Frasergold Project 41 ___________________________________________________________________________________
___________________________________________________________________________________
ERSi Earth Resource Surveys Inc. Giroux Consultants Ltd.
HOLE
EASTING NORTHING ELEVATION Hole Length (m) TYPE
84006A 665637.29 5797123.06 1534.77 260.90 DDH
84007 665478.55 5797315.53 1541.87 275.80 DDH
84008 665276.92 5797495.41 1563.57 300.80 DDH
84009 665155.13 5797646.76 1560.47 484.60 DDH
84010 665771.48 5796933.47 1512.47 245.70 DDH
84011 665383.96 5797213.90 1612.97 412.40 DDH
84012 665984.15 5796676.07 1542.47 286.10 DDH
84013 665867.45 5796687.26 1564.95 312.70 DDH
84014 665652.91 5796998.00 1562.67 239.00 DDH
85DDH-1 667132.22 5794440.30 1782.98 446.54 DDH
85DDH-2 667245.21 5794965.73 1770.79 230.13 DDH
86002 665211.52 5797566.47 1566.05 148.50 RC
86002B 665211.52 5797566.47 1566.05 81.00 RC
86009 665155.08 5797646.62 1560.25 70.50 RC
86009B 665155.08 5797646.62 1560.25 88.00 RC
86015 665264.08 5797638.93 1533.77 78.60 DDH
86016 665303.81 5797606.01 1527.87 72.50 DDH
86017 665224.15 5797669.78 1535.65 106.30 DDH
86018 665224.15 5797669.78 1535.65 69.50 DDH
86019 665198.31 5797708.48 1535.27 75.50 DDH
86020 665152.79 5797738.58 1544.17 72.50 DDH
86021 665634.02 5797315.03 1489.67 87.80 DDH
86022 665603.84 5797362.95 1483.07 69.40 DDH
86023 665183.72 5797723.41 1535.05 90.80 DDH
86024 665206.69 5797687.35 1534.65 69.40 DDH
86025 665134.20 5797754.54 1544.17 42.00 DDH
86026 665134.20 5797754.54 1544.17 102.10 DDH

Eureka Resources Inc. Frasergold Project 42 ___________________________________________________________________________________
___________________________________________________________________________________
ERSi Earth Resource Surveys Inc. Giroux Consultants Ltd.
HOLE
EASTING NORTHING ELEVATION Hole Length (m) TYPE
86027 665171.79 5797722.96 1536.87 69.40 DDH
86028 664274.90 5798586.51 1375.27 185.90 DDH
86029 663458.27 5799299.62 1392.17 19.20 DDH
86029A 663460.56 5799310.75 1391.95 200.20 DDH
86030 663891.80 5799023.82 1382.07 163.70 DDH
86031 663750.63 5799085.11 1395.27 185.30 DDH
86032 663589.34 5799210.90 1394.47 48.20 DDH
86032A 663589.37 5799210.86 1394.25 212.70 DDH
87024 665214.81 5797690.99 1534.87 72.00 RC
87033 665208.27 5797700.16 1535.27 73.00 RC
87034 665115.96 5797779.20 1539.17 70.50 RC
87035 665221.07 5797680.56 1535.57 72.00 RC
87036 665246.09 5797651.24 1536.67 69.00 RC
87037 665370.09 5797532.97 1522.77 82.50 RC
87038 665426.29 5797449.80 1520.77 91.50 RC
87039 665483.90 5797363.94 1524.67 79.50 RC
87040 665560.40 5797294.77 1519.57 81.00 RC
87041 665619.53 5797223.79 1514.87 90.00 RC
87042 665042.43 5797846.11 1542.97 98.00 RC
87043 664999.63 5797956.59 1525.87 93.00 RC
87044 664914.76 5798010.64 1524.57 70.50 RC
87045 665590.93 5797263.03 1516.57 81.00 RC
87046 665527.46 5797326.51 1522.07 90.00 RC
87047 665415.88 5797384.47 1541.37 15.00 RC
87047A 665420.32 5797380.57 1541.37 27.00 RC
87048 665370.28 5797463.91 1539.97 109.50 RC
87049 665308.23 5797556.21 1539.17 111.00 RC

Eureka Resources Inc. Frasergold Project 43 ___________________________________________________________________________________
___________________________________________________________________________________
ERSi Earth Resource Surveys Inc. Giroux Consultants Ltd.
HOLE
EASTING NORTHING ELEVATION Hole Length (m) TYPE
87050 665267.58 5797614.44 1540.07 111.00 RC
87051 665399.52 5797413.44 1540.87 120.00 RC
87052 665335.35 5797509.24 1539.45 111.60 DDH
87053 665335.35 5797509.24 1539.45 99.40 DDH
87054 665560.40 5797294.77 1519.57 81.10 DDH
87055 665253.42 5797624.03 1539.45 85.30 DDH
87056 665253.42 5797624.03 1539.45 92.00 DDH
88001 662668.85 5798915.36 1684.87 160.93 DDH
88002 662668.85 5798915.36 1684.87 192.94 DDH
88003 662632.88 5798939.72 1687.07 153.31 DDH
88004 662632.88 5798939.72 1687.07 176.17 DDH
88005 662711.65 5798890.48 1682.57 98.45 DDH
88006 662711.65 5798890.48 1682.57 74.79 DDH
88057 665253.42 5797624.03 1539.45 88.70 DDH
88058 665287.44 5797576.56 1538.95 91.40 DDH
88059 665287.44 5797576.56 1538.95 87.20 DDH
88060 665321.11 5797533.82 1538.95 88.10 DDH
88061 665321.11 5797533.82 1538.95 90.20 DDH
88062 665269.67 5797604.40 1539.45 93.00 DDH
88063 665269.67 5797604.40 1539.45 72.50 DDH
88064 665448.72 5797392.76 1526.55 75.00 DDH
88065 665448.72 5797392.76 1526.55 74.70 DDH
88066 665427.00 5797442.43 1520.95 77.70 DDH
88067 665427.00 5797442.43 1520.95 75.30 DDH
88068 665248.74 5797526.77 1563.67 153.90 DDH
88069 665235.01 5797725.39 1519.97 76.20 RC
88070 665227.87 5797717.68 1523.27 38.10 RC

Eureka Resources Inc. Frasergold Project 44 ___________________________________________________________________________________
___________________________________________________________________________________
ERSi Earth Resource Surveys Inc. Giroux Consultants Ltd.
HOLE
EASTING NORTHING ELEVATION Hole Length (m) TYPE
88071 665224.64 5797710.72 1525.17 89.90 RC
88072 665212.56 5797711.37 1528.17 97.50 RC
88073 665203.43 5797762.33 1521.77 97.50 RC
88074 665197.71 5797757.32 1523.67 96.00 RC
88075 665189.41 5797751.51 1526.47 97.50 RC
88076 665183.17 5797746.65 1528.67 94.50 RC
88077 665162.95 5797736.93 1537.87 96.00 RC
88078 665242.84 5797658.63 1536.47 74.70 RC
88079 665276.04 5797621.68 1541.07 72.50 RC
88080 665267.99 5797612.16 1539.77 105.20 RC
88081 665250.88 5797668.40 1527.27 56.40 RC
88082 665257.65 5797671.38 1526.17 47.20 RC
88083 665289.46 5797634.50 1524.77 59.47 RC
88084 665282.18 5797625.58 1531.87 74.70 RC
88085 665291.63 5797567.70 1539.37 73.20 RC
88086 665295.98 5797573.12 1539.07 67.10 RC
88087 665300.00 5797577.49 1537.77 62.50 RC
88088 665320.16 5797525.64 1541.27 80.70 RC
88089 665325.16 5797530.72 1539.37 64.00 RC
88090 665335.60 5797533.27 1534.67 47.20 RC
88091 665338.10 5797545.44 1531.77 30.50 RC
88092 665310.86 5797587.57 1529.87 22.90 RC
88093 665214.83 5797690.97 1534.97 24.40 RC
88094 665111.10 5797772.14 1540.67 70.10 RC
88095 665117.58 5797778.80 1539.37 56.40 RC
88096 665221.17 5797673.62 1536.07 83.80 RC
88097 665238.60 5797693.34 1526.87 47.20 RC

Eureka Resources Inc. Frasergold Project 45 ___________________________________________________________________________________
___________________________________________________________________________________
ERSi Earth Resource Surveys Inc. Giroux Consultants Ltd.
HOLE
EASTING NORTHING ELEVATION Hole Length (m) TYPE
88098 665246.42 5797702.55 1522.57 17.70 RC
88099 665275.77 5797656.62 1524.57 36.60 RC
88100 665271.08 5797652.95 1525.37 48.80 RC
88101 665293.70 5797604.94 1529.67 38.10 RC
88102 665255.82 5797636.15 1534.27 80.70 RC
88103 665281.80 5797592.24 1539.57 64.00 RC
88104 664795.23 5798440.67 1419.17 84.70 RC
88105 664874.37 5798410.82 1420.27 83.80 RC
90007 662730.37 5798887.44 1682.67 58.50 RC
90008 662692.01 5798860.58 1698.77 46.50 RC
90106 664943.35 5797993.35 1525.57 178.30 DDH
90107 664781.65 5798100.66 1518.07 224.90 DDH
90108 664662.17 5798245.20 1489.37 190.20 DDH
90109 664507.06 5798368.32 1456.07 178.40 DDH
90110 665600.93 5797150.28 1541.37 149.70 DDH
90110A 665588.30 5797155.19 1541.16 16.80 DDH
90111 665732.76 5797015.93 1524.77 150.60 DDH
90112 666141.68 5796604.98 1534.97 102.10 DDH
90113 666256.73 5796413.50 1573.97 55.10 DDH
90114 666358.95 5796214.29 1598.57 180.70 DDH
90115 666481.45 5796054.79 1574.27 149.40 DDH
90116 666589.83 5795928.59 1523.37 108.20 DDH
90117 666290.67 5796352.72 1586.67 161.50 DDH
90118 665855.29 5796811.70 1505.57 130.30 DDH
90118T 665858.69 5796812.09 1505.57 133.50 RC
90119 665953.59 5796717.61 1529.97 150.90 DDH
90119T 665957.24 5796717.15 1529.67 141.70 DDH

Eureka Resources Inc. Frasergold Project 46 ___________________________________________________________________________________
___________________________________________________________________________________
ERSi Earth Resource Surveys Inc. Giroux Consultants Ltd.
HOLE
EASTING NORTHING ELEVATION Hole Length (m) TYPE
90120 662635.34 5799931.25 1364.27 236.20 DDH
90121 664617.61 5798311.86 1476.07 120.35 RC
90122 664718.12 5798186.37 1502.97 150.00 RC
90123 664740.42 5798293.35 1468.47 75.00 RC
90124 664804.74 5798211.16 1484.97 75.00 RC
90125 664841.87 5798167.20 1491.67 81.00 RC
90126 664899.81 5798100.34 1502.77 81.00 RC
90127 664996.76 5798025.16 1508.07 81.00 RC
90127A 664989.35 5798030.81 1508.27 79.50 RC
90128 665025.31 5797939.62 1525.17 124.50 RC
90129 665084.80 5797827.98 1536.77 148.50 RC
90130 665648.62 5797184.14 1514.07 90.00 RC
90131 665681.63 5797136.06 1517.87 52.50 RC
90132 665744.79 5797052.16 1515.57 75.00 RC
90133 665777.44 5796977.40 1507.77 100.50 RC
90134 665813.11 5796940.63 1499.27 109.50 RC
90135 665815.11 5796938.54 1499.17 136.50 RC
90136 665691.59 5797072.61 1532.37 85.50 RC
90137 666015.81 5796680.87 1533.07 120.00 RC
90138 666112.46 5796659.54 1521.07 64.50 RC
90139 666184.29 5796558.89 1542.27 89.50 RC
90140 666342.45 5796379.77 1559.07 89.00 RC
90141 666216.59 5796466.31 1569.38 127.50 RC
90142 666215.83 5796466.04 1569.92 139.50 RC
90143 666213.51 5796465.58 1570.67 151.50 RC
90144 666258.07 5796416.99 1574.47 126.00 RC
90145 666309.07 5796305.84 1595.47 76.50 RC

Eureka Resources Inc. Frasergold Project 47 ___________________________________________________________________________________
___________________________________________________________________________________
ERSi Earth Resource Surveys Inc. Giroux Consultants Ltd.
HOLE
EASTING NORTHING ELEVATION Hole Length (m) TYPE
90146 666331.01 5796272.93 1597.67 121.50 RC
90147 666391.93 5796177.98 1592.87 121.50 RC
90147A 666392.59 5796178.56 1592.97 30.00 RC
90148 666449.04 5796109.96 1583.17 130.50 RC
90149 666417.57 5796152.24 1588.47 123.00 RC
90150 666506.95 5795989.15 1564.87 130.50 RC
90151 661962.02 5800511.01 1391.77 186.20 DDH
90152 661045.16 5801340.98 1363.97 352.40 DDH
90153 661573.69 5800746.17 1436.67 336.80 DDH
90154 660979.63 5801226.79 1384.87 263.30 DDH
90155 663149.24 5799654.98 1347.47 242.30 DDH
90156 662386.62 5800487.22 1294.77 218.50 DDH
90157 665696.00 5796835.87 1546.17 237.70 DDH
90158 665697.37 5797061.11 1532.37 144.80 DDH
90159 664046.78 5799226.41 1319.47 196.60 DDH
90160 666507.68 5795989.02 1564.87 118.50 RC
90161 666568.38 5795887.12 1523.67 130.50 RC
90161A 666568.38 5795887.12 1523.67 34.50 RC
90162 666589.36 5795925.98 1523.45 90.00 RC
90163 665879.57 5796791.15 1512.57 88.50 RC
90164 665913.06 5796759.09 1523.57 141.00 RC
90165 665975.49 5796702.16 1533.47 141.50 RC
90165A 665936.65 5796734.42 1527.87 45.00 RC
91019T 665195.01 5797711.73 1535.47 63.00 RC
91050T 665264.43 5797617.43 1539.67 105.00 RC
91166 665160.67 5797646.79 1560.57 145.50 RC
91167 665249.74 5797600.61 1548.77 114.00 RC

Eureka Resources Inc. Frasergold Project 48 ___________________________________________________________________________________
___________________________________________________________________________________
ERSi Earth Resource Surveys Inc. Giroux Consultants Ltd.
HOLE
EASTING NORTHING ELEVATION Hole Length (m) TYPE
91167A 665250.79 5797600.09 1548.87 47.50 RC
91168 665274.50 5797630.86 1532.87 90.00 RC
91169 665285.65 5797644.00 1524.17 66.00 RC
91170 665209.32 5797730.84 1526.67 37.50 RC
91171 665166.18 5797675.15 1553.47 115.00 RC
91172 665295.02 5797657.62 1517.97 41.50 RC
91173 665182.26 5797695.24 1543.37 87.00 RC
91174 665230.71 5797614.93 1550.17 114.75 RC
91175 665213.13 5797632.84 1551.27 132.00 RC
91176 665196.31 5797652.53 1551.77 118.50 RC
91177 665195.73 5797651.65 1552.17 125.00 RC
91178 665177.16 5797667.67 1552.47 105.00 RC
91179 665077.35 5797784.29 1551.37 82.50 RC
91180 665095.48 5797766.85 1550.57 90.00 RC
91181 665110.39 5797748.78 1549.37 108.00 RC
91182 665127.13 5797725.97 1552.77 99.00 RC
91183 665142.00 5797704.71 1552.17 96.00 RC
91184 665159.53 5797686.29 1553.77 108.00 RC
91185 665215.55 5797595.76 1558.37 157.50 RC
91186 665189.31 5797602.67 1564.97 162.00 RC
91187 665125.43 5797683.99 1559.57 132.00 RC
91187A 665125.99 5797684.71 1559.77 66.00 RC
91188 665110.94 5797705.65 1560.27 122.00 RC
91188A 665110.65 5797705.22 1560.17 33.50 RC
91189 665110.24 5797704.71 1560.37 138.00 RC
91190 665094.67 5797725.16 1560.07 141.00 RC
91191 665080.86 5797748.22 1558.87 115.00 RC

Eureka Resources Inc. Frasergold Project 49 ___________________________________________________________________________________
___________________________________________________________________________________
ERSi Earth Resource Surveys Inc. Giroux Consultants Ltd.
HOLE
EASTING NORTHING ELEVATION Hole Length (m) TYPE
91192 665063.66 5797769.20 1558.27 105.80 RC
91193 665108.49 5797823.70 1532.37 27.00 RC
91194 665150.82 5797796.90 1526.47 60.00 RC
91195 665183.66 5797756.98 1526.97 34.50 RC
91196 665252.82 5797683.28 1525.57 45.00 RC
91197 665164.38 5797732.89 1538.37 69.00 RC
91198 665155.43 5797762.13 1535.17 57.00 RC
91199 665128.24 5797767.83 1539.47 81.00 RC
91200 665097.11 5797807.98 1537.67 96.00 RC
91201 665268.22 5797581.80 1547.27 119.00 RC
91202 665299.51 5797541.27 1544.97 121.50 RC
91203 665336.42 5797547.09 1534.27 81.00 RC
91204 665353.79 5797488.62 1540.67 87.00 RC
91205 665381.82 5797443.16 1540.87 105.00 RC
91206 665396.58 5797421.40 1541.17 117.00 RC
91207 665440.50 5797355.75 1543.97 111.00 RC
91208 665237.00 5797542.13 1565.07 114.00 RC
91209 665264.45 5797536.55 1558.67 150.00 RC
91210 665287.60 5797484.82 1563.17 132.00 RC
91211 665302.86 5797463.55 1562.77 147.00 RC
91212 665335.64 5797424.73 1560.97 145.50 RC
91213 665334.85 5797423.77 1560.97 158.00 RC
91214 665326.69 5797453.68 1556.97 127.50 RC
91215 665326.21 5797453.12 1557.17 121.50 RC
91216 665378.61 5797399.20 1552.67 140.00 RC
91217 665391.60 5797374.74 1552.27 140.00 RC
91218 665409.07 5797356.47 1552.07 152.00 RC

Eureka Resources Inc. Frasergold Project 50 ___________________________________________________________________________________
___________________________________________________________________________________
ERSi Earth Resource Surveys Inc. Giroux Consultants Ltd.
HOLE
EASTING NORTHING ELEVATION Hole Length (m) TYPE
91219 665429.38 5797341.14 1551.37 146.50 RC
91220 665249.07 5797553.34 1560.57 147.50 RC
91221 665314.53 5797600.32 1527.47 63.30 RC
91222 665334.21 5797585.02 1523.67 60.00 RC
91223 665395.49 5797500.10 1521.47 51.00 RC
91224 665435.47 5797472.49 1512.77 45.00 RC
91225 665449.65 5797447.98 1512.67 54.00 RC
91226A 665462.55 5797424.33 1511.77 29.00 RC
91227A 665482.36 5797409.21 1508.07 16.50 RC
91228 665408.25 5797476.86 1521.07 66.00 RC
91229 665501.89 5797352.55 1523.17 84.00 RC
91230 665523.88 5797300.13 1530.47 100.50 RC
91231 665538.44 5797277.38 1531.27 108.00 RC
91232 665554.09 5797257.53 1531.27 115.50 RC
91233 665571.54 5797238.98 1529.77 119.00 RC
91234 665582.34 5797212.45 1532.07 120.00 RC
91235 665597.00 5797190.77 1532.07 118.50 RC
91236 665595.92 5797230.27 1523.97 91.50 RC
91237 665630.37 5797192.41 1519.17 105.00 RC
91238 665615.42 5797253.60 1512.67 56.00 RC
91239 665574.49 5797283.46 1518.77 91.50 RC
91240 665480.61 5797366.10 1525.27 106.50 RC
91241 665502.00 5797393.48 1505.67 63.00 RC
91242 665503.00 5797392.72 1506.37 76.00 RC
91243 665539.53 5797360.58 1508.07 44.50 RC
91244 665555.90 5797340.51 1508.57 59.50 RC
91245 665573.29 5797322.52 1507.75 41.00 RC

Eureka Resources Inc. Frasergold Project 51 ___________________________________________________________________________________
___________________________________________________________________________________
ERSi Earth Resource Surveys Inc. Giroux Consultants Ltd.
HOLE
EASTING NORTHING ELEVATION Hole Length (m) TYPE
91246 665592.20 5797299.07 1509.87 57.00 RC
91247 665606.15 5797283.15 1509.17 61.50 RC
91248 665640.80 5797245.56 1503.17 44.50 RC
91249 665649.88 5797217.55 1505.47 58.50 RC
91249A 665649.80 5797217.39 1505.25 20.00 RC
91250 665523.42 5797259.44 1543.67 130.50 RC
91251 665507.97 5797280.63 1542.17 130.50 RC
91252 665496.47 5797304.49 1540.37 127.50 RC
91253 665496.24 5797304.24 1540.37 133.50 RC
91254 665478.21 5797323.86 1541.97 140.00 RC
91255 665452.37 5797330.63 1546.77 143.00 RC
91256 665219.94 5797522.67 1574.07 109.00 RC
91257 665578.72 5797166.90 1546.37 152.00 RC
91258 665539.98 5797199.58 1554.27 152.00 RC
91259 666076.60 5796586.37 1570.47 145.50 RC
91260 666029.83 5796611.48 1572.37 148.50 RC
91261 665980.05 5796632.27 1572.47 42.00 RC
91261A 665979.77 5796632.06 1572.37 32.50 RC
91262 665980.23 5796631.13 1572.37 151.50 RC
91263 665827.85 5796836.33 1502.27 142.50 RC
91264 665828.71 5796835.74 1502.27 97.50 RC
91265A 665811.59 5796834.55 1502.67 76.00 RC
91266A 665851.48 5796826.03 1504.27 72.00 RC
91267A 665902.65 5796770.22 1502.95 25.90 RC
91268 665972.34 5796680.64 1542.67 160.50 RC
91269 666132.18 5796534.27 1577.67 161.00 RC
91270 665454.92 5797281.27 1562.67 127.50 RC

Eureka Resources Inc. Frasergold Project 52 ___________________________________________________________________________________
___________________________________________________________________________________
ERSi Earth Resource Surveys Inc. Giroux Consultants Ltd.
HOLE
EASTING NORTHING ELEVATION Hole Length (m) TYPE
91271 665395.14 5797338.84 1562.27 139.50 RC
91272 665220.80 5797561.67 1566.57 130.50 RC
91273 665449.10 5797394.88 1526.47 100.00 RC
91273A 665437.14 5797417.51 1525.27 26.00 RC
91274 665107.06 5797821.98 1532.37 41.70 RC
93275 665269.74 5797611.18 1540.64 60.00 RC
93276 665268.62 5797609.87 1540.63 60.00 RC
93277 665267.67 5797608.47 1540.52 60.00 RC
93278 665266.83 5797607.59 1540.54 52.50 RC
93279 665271.81 5797607.26 1540.74 60.00 RC
93280 665270.30 5797605.55 1540.73 60.00 RC
93281 665269.34 5797604.43 1540.74 60.00 RC
93282 665266.94 5797613.91 1540.61 60.00 RC
93283 665265.47 5797612.22 1540.57 60.00 RC
93284 665264.59 5797611.12 1540.63 60.00 RC
93285 665565.63 5797291.50 1520.56 45.00 RC
93286 665564.69 5797290.47 1520.46 45.00 RC
93287 665563.50 5797288.72 1520.44 40.50 RC
93288 665560.66 5797291.81 1520.21 40.50 RC
93289 665560.93 5797292.14 1520.49 45.00 RC
93290 665562.21 5797293.72 1520.61 42.00 RC
93291 665562.40 5797294.06 1520.67 42.00 RC
93292 665559.58 5797296.90 1520.53 45.00 RC
93293 665559.25 5797296.49 1520.17 42.00 RC
93294 665559.65 5797295.75 1520.20 40.50 RC
HK-1 666964.77 5793761.53 1660.01 32.00 RC
HK-2 666936.64 5793759.19 1662.68 118.26 RC

Eureka Resources Inc. Frasergold Project 53 ___________________________________________________________________________________
___________________________________________________________________________________
ERSi Earth Resource Surveys Inc. Giroux Consultants Ltd.
HOLE
EASTING NORTHING ELEVATION Hole Length (m) TYPE
HK-3 665947.40 5793663.08 1726.08 6.10 RC
HK-4 665580.54 5793708.79 1773.49 12.19 RC
HK-5 666152.52 5793654.87 1679.18 121.01 RC
HK-6 666702.70 5794125.00 1855.52 121.92 RC
HK-7 666647.32 5793751.02 1692.59 112.78 RC
HK-8 666564.90 5793725.42 1686.12 85.35 RC

Eureka Resources Inc. Frasergold Project 54 ___________________________________________________________________________________
___________________________________________________________________________________
ERSi Earth Resource Surveys Inc. Giroux Consultants Ltd.
APPENDIX V
LOGNORMAL CUMULATIVE FREQUENCY PLOTS FOR
AU IN HIGH GRADE CORE AND LOW GRADE ENVELOPE

Eureka Resources Inc. Frasergold Project 55 ___________________________________________________________________________________
___________________________________________________________________________________
ERSi Earth Resource Surveys Inc. Giroux Consultants Ltd.
APPENDIX V Lognormal Cumulative Frequency Plots For
Au In High Grade Core And Low Grade Envelope

Eureka Resources Inc. Frasergold Project 56 ___________________________________________________________________________________
___________________________________________________________________________________
ERSi Earth Resource Surveys Inc. Giroux Consultants Ltd.

Eureka Resources Inc. Frasergold Project 57 ___________________________________________________________________________________
___________________________________________________________________________________
ERSi Earth Resource Surveys Inc. Giroux Consultants Ltd.

Eureka Resources Inc. Frasergold Project 58 ___________________________________________________________________________________
___________________________________________________________________________________
ERSi Earth Resource Surveys Inc. Giroux Consultants Ltd.
APPENDIX VI
Specific Gravity Results
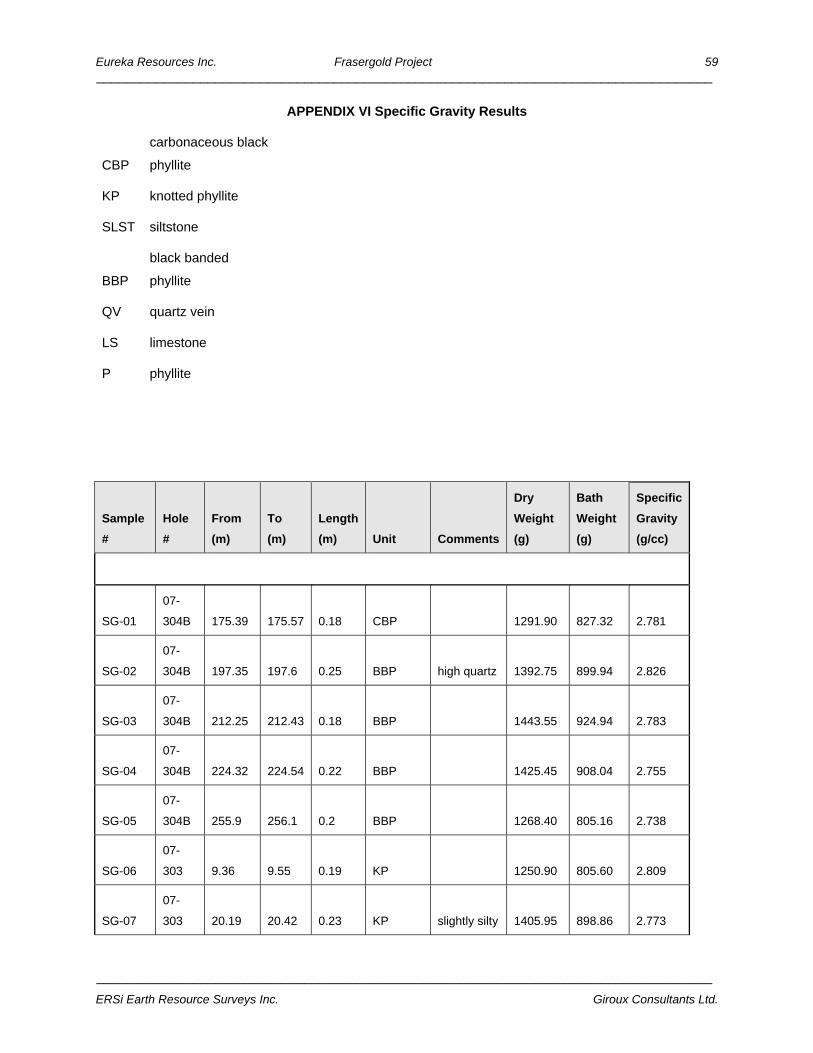
Eureka Resources Inc. Frasergold Project 59 ___________________________________________________________________________________
___________________________________________________________________________________
ERSi Earth Resource Surveys Inc. Giroux Consultants Ltd.
APPENDIX VI Specific Gravity Results
CBP
carbonaceous black
phyllite
KP knotted phyllite
SLST siltstone
BBP
black banded
phyllite
QV quartz vein
LS limestone
P phyllite
Sample
#
Hole
#
From
(m)
To
(m)
Length
(m) Unit Comments
Dry
Weight
(g)
Bath
Weight
(g)
Specific
Gravity
(g/cc)
SG-01
07-
304B 175.39 175.57 0.18 CBP 1291.90 827.32 2.781
SG-02
07-
304B 197.35 197.6 0.25 BBP high quartz 1392.75 899.94 2.826
SG-03
07-
304B 212.25 212.43 0.18 BBP 1443.55 924.94 2.783
SG-04
07-
304B 224.32 224.54 0.22 BBP 1425.45 908.04 2.755
SG-05
07-
304B 255.9 256.1 0.2 BBP 1268.40 805.16 2.738
SG-06
07-
303 9.36 9.55 0.19 KP 1250.90 805.60 2.809
SG-07
07-
303 20.19 20.42 0.23 KP slightly silty 1405.95 898.86 2.773

Eureka Resources Inc. Frasergold Project 60 ___________________________________________________________________________________
___________________________________________________________________________________
ERSi Earth Resource Surveys Inc. Giroux Consultants Ltd.
Sample
#
Hole
#
From
(m)
To
(m)
Length
(m) Unit Comments
Dry
Weight
(g)
Bath
Weight
(g)
Specific
Gravity
(g/cc)
SG-08
07-
303 30 30.2 0.2 KP 870.78 555.70 2.764
SG-09
07-
303 39.55 39.73 0.18 KP 1030.86 643.68 2.662
SG-10
07-
303 47.64 47.85 0.21 KP 1077.32 696.90 2.832
SG-11
07-
303 55.85 56.08 0.23 KP 1336.75 865.28 2.835
SG-12
07-
303 66.71 66.89 0.18 KP 1609.00 1043.52 2.845
SG-13
07-
303 75.44 75.68 0.24 KP 1618.60 1049.37 2.843
SG-14
07-
303 83.05 83.24 0.19 KP 1350.70 874.40 2.836
SG-15
07-
303 91.74 91.93 0.19 KP 1332.85 860.56 2.822
SG-16
07-
303 101.99 102.21 0.22 KP 1366.85 884.28 2.832
SG-17
07-
303 108.45 108.65 0.2 KP 1347.60 874.68 2.850
SG-18
07-
303 116.16 116.38 0.22 KP 1396.65 904.80 2.840
SG-19
07-
303 126.54 126.78 0.24 CBP 1441.25 920.09 2.765
SG-20
07-
303 139.37 139.61 0.24 CBP 1489.50 946.70 2.744
SG-21
07-
303 150.02 150.24 0.22 CBP 1297.85 828.76 2.767
SG-22
07-
303 158.2 158.38 0.18 CBP 1657.40 1056.58 2.759
SG-23 07- 165.72 165.93 0.21 CBP 1356.05 868.24 2.780

Eureka Resources Inc. Frasergold Project 61 ___________________________________________________________________________________
___________________________________________________________________________________
ERSi Earth Resource Surveys Inc. Giroux Consultants Ltd.
Sample
#
Hole
#
From
(m)
To
(m)
Length
(m) Unit Comments
Dry
Weight
(g)
Bath
Weight
(g)
Specific
Gravity
(g/cc)
303
SG-24
07-
303 176.4 176.59 0.19 CBP 1191.48 758.38 2.751
SG-25
07-
303 185.13 185.35 0.22 CBP 1417.90 904.64 2.763
SG-26
07-
303 192.72 192.87 0.15 BBP 938.52 596.75 2.746
SG-27
07-
303 201.52 201.72 0.2 BBP 40% quartz 1401.80 890.92 2.744
SG-28
07-
303 210.73 210.89 0.16 BBP 971.28 616.58 2.738
SG-29
07-
303 218.54 218.71 0.17 BBP 956.78 610.52 2.763
SG-30
07-
303 227.29 227.51 0.22 BBP 1483.05 943.40 2.748
SG-31
07-
303 236.45 236.61 0.16 BBP 1064.54 676.90 2.746
SG-32
07-
297 6.95 7.17 0.22 KP 1043.76 669.98 2.792
SG-33
07-
297 18.48 18.69 0.21 KP 1261.95 815.74 2.828
SG-34
07-
297 26.87 27.05 0.18 KP 25% quartz 1196.10 775.34 2.843
SG-35
07-
297 35.98 36.18 0.2 KP
high
graphite;
30% quartz 1428.70 937.64 2.909
SG-36
07-
297 45.29 45.43 0.14 KP 1129.10 732.04 2.844
SG-37
07-
297 51.05 51.23 0.18 KP 1365.65 884.38 2.838
SG-38 07- 65.67 65.84 0.17 KP 1273.75 822.66 2.824

Eureka Resources Inc. Frasergold Project 62 ___________________________________________________________________________________
___________________________________________________________________________________
ERSi Earth Resource Surveys Inc. Giroux Consultants Ltd.
Sample
#
Hole
#
From
(m)
To
(m)
Length
(m) Unit Comments
Dry
Weight
(g)
Bath
Weight
(g)
Specific
Gravity
(g/cc)
297
SG-39
07-
297 85.23 85.4 0.17 KP 1235.05 803.84 2.864
SG-40
07-
297 108.51 108.67 0.16 KP 1274.80 820.94 2.809
SG-41
07-
297 123.75 123.91 0.16 BBP/KP
high silt
content 1072.52 690.78 2.810
SG-42
07-
297 138.12 138.29 0.17 BBP 40% quartz 1260.40 806.06 2.774
SG-43
07-
297 153.22 153.36 0.14 KP 1102.56 714.82 2.844
SG-44
07-
297 166.27 166.42 0.15 BBP 990.70 644.06 2.858
SG-45
07-
297 182.26 182.4 0.14 BBP 1124.20 731.74 2.864
SG-46
07-
297 200.25 200.4 0.15 CBP 1146.62 732.16 2.767
SG-47
07-
301 14.82 14.98 0.16 KP 1227.20 794.30 2.835
SG-48
07-
301 30.38 30.54 0.16 KP 1224.55 793.36 2.840
SG-49
07-
301 45.79 45.99 0.2 KP 1360.45 875.04 2.803
SG-50
07-
301 59.58 59.74 0.16 SLST 836.96 536.39 2.785
SG-51
07-
301 76.48 76.64 0.16 KP 1327.90 870.64 2.904
SG-52
07-
301 93.91 94.07 0.16 KP 1250.20 805.94 2.814
SG-53
07-
301 106.21 106.39 0.18 KP 1386.85 898.58 2.840

Eureka Resources Inc. Frasergold Project 63 ___________________________________________________________________________________
___________________________________________________________________________________
ERSi Earth Resource Surveys Inc. Giroux Consultants Ltd.
Sample
#
Hole
#
From
(m)
To
(m)
Length
(m) Unit Comments
Dry
Weight
(g)
Bath
Weight
(g)
Specific
Gravity
(g/cc)
SG-54
07-
301 120.7 120.84 0.14 KP 1125.64 729.96 2.845
SG-55
07-
301 139.12 139.29 0.17 BBP 1386.55 898.48 2.841
SG-56
07-
301 161.94 162.14 0.2 BBP 1260.15 808.42 2.790
SG-57
07-
301 170.71 170.89 0.18 BBP 1436.00 917.22 2.768
SG-58
07-
301 178.61 178.77 0.16 CBP 1071.16 682.72 2.758
SG-59
07-
301 186.75 186.96 0.21 BBP 1480.60 950.70 2.794
SG-60
07-
301 203.12 203.31 0.19 BBP 1394.05 885.98 2.744
SG-61
07-
298 17.95 18.12 0.17 KP 1286.08 835.70 2.856
SG-62
07-
298 26.87 27.05 0.18 SLST 908.46 577.26 2.743
SG-63
07-
298 35.36 35.52 0.16 QUARTZ 1100.86 682.94 2.634
SG-64
07-
298 41.15 41.33 0.18 KP 857.76 555.00 2.833
SG-65
07-
298 53.66 53.85 0.19 KP 1569.10 1024.90 2.883
SG-66
07-
298 68.7 68.88 0.18 KP 1489.15 963.72 2.834
SG-67
07-
298 78.68 78.87 0.19 KP 1646.10 1070.68 2.861
SG-68
07-
298 87.98 88.19 0.21 KP 1710.15 1116.02 2.878
SG-69 07- 99.81 99.93 0.12 KP 1043.04 677.36 2.852

Eureka Resources Inc. Frasergold Project 64 ___________________________________________________________________________________
___________________________________________________________________________________
ERSi Earth Resource Surveys Inc. Giroux Consultants Ltd.
Sample
#
Hole
#
From
(m)
To
(m)
Length
(m) Unit Comments
Dry
Weight
(g)
Bath
Weight
(g)
Specific
Gravity
(g/cc)
298
SG-70
07-
298 113.14 113.3 0.16 KP/SLST 1259.35 800.48 2.744
SG-71
07-
298 123.45 123.59 0.14 KP 1189.86 774.14 2.862
SG-72
07-
298 135.64 135.77 0.13 KP 887.12 574.99 2.842
SG-73
07-
298 149.88 150.06 0.18 BBP/KP 1430.55 936.58 2.896
SG-74
07-
298 160.42 160.57 0.15 KP 1250.90 810.62 2.841
SG-75
07-
298 169.02 169.22 0.2 KP 1492.30 958.68 2.797
SG-76
07-
298 177.37 177.55 0.18 BBP/KP 1458.90 952.66 2.882
SG-77
07-
298 189.68 189.84 0.16 BBP 1289.50 836.52 2.847
SG-78
07-
298 199.04 199.18 0.14 BBP 1146.92 743.00 2.839
SG-79
07-
298 212.44 212.64 0.2 BBP 1619.10 1037.20 2.782
SG-80
07-
298 225.28 225.43 0.15 BBP 1217.10 773.10 2.741
SG-81
07-
299 7.78 7.94 0.16 KP 1098.18 707.42 2.810
SG-82
07-
299 20.15 20.33 0.18 KP 1530.45 992.14 2.843
SG-83
07-
299 36.35 36.53 0.18 KP 1605.40 1046.92 2.875
SG-84
07-
299 45.36 45.51 0.15 BBP 1028.52 660.18 2.792

Eureka Resources Inc. Frasergold Project 65 ___________________________________________________________________________________
___________________________________________________________________________________
ERSi Earth Resource Surveys Inc. Giroux Consultants Ltd.
Sample
#
Hole
#
From
(m)
To
(m)
Length
(m) Unit Comments
Dry
Weight
(g)
Bath
Weight
(g)
Specific
Gravity
(g/cc)
SG-85
07-
299 56.35 56.5 0.15 BBP 1371.10 885.16 2.822
SG-86
07-
299 69.19 69.36 0.17 BBP 1407.10 913.92 2.853
SG-87
07-
299 83.93 84.13 0.2 KP 1386.70 882.50 2.750
SG-88
07-
299 99.1 99.33 0.23 KP 1543.85 983.92 2.757
SG-89
07-
299 120.59 120.78 0.19 P 1349.45 869.70 2.813
SG-90
07-
299 135.67 135.9 0.23 BBP 1510.70 987.18 2.886
SG-91
07-
299 150.15 150.34 0.19 BBP 1440.65 919.48 2.764
SG-92
07-
299 170 170.18 0.18 BBP 1210.50 772.78 2.765
SG-93
07-
299 190.71 190.9 0.19 BBP 1421.45 910.72 2.783
SG-94
07-
299 208.59 208.77 0.18 BBP 1388.05 890.32 2.789
SG-95
07-
305 14.77 14.97 0.2 KP 1747.65 1134.46 2.850
SG-96
07-
305 31.93 32.13 0.2 KP 1202.65 789.56 2.911
SG-97
07-
305 42.63 42.83 0.2 BBP 1370.50 891.62 2.862
SG-98
07-
305 59.86 60.05 0.19 KP 1441.35 931.56 2.827
SG-99
07-
305 76.44 76.63 0.19 KP/BBP 1068.36 692.94 2.846
SG-100 07- 86.87 87.05 0.18 KP 1418.40 925.22 2.876

Eureka Resources Inc. Frasergold Project 66 ___________________________________________________________________________________
___________________________________________________________________________________
ERSi Earth Resource Surveys Inc. Giroux Consultants Ltd.
Sample
#
Hole
#
From
(m)
To
(m)
Length
(m) Unit Comments
Dry
Weight
(g)
Bath
Weight
(g)
Specific
Gravity
(g/cc)
305
SG-101
07-
305 100.56 100.73 0.17 KP 1471.75 952.28 2.833
SG-102
07-
305 114.55 114.7 0.15 KP 1223.85 794.56 2.851
SG-103
07-
305 134.07 134.22 0.15 KP 1350.80 876.94 2.851
SG-104
07-
305 158.78 158.97 0.19 SLST/QV 1511.85 965.92 2.769
SG-105
07-
305 174.77 174.93 0.16 KP 1455.15 943.54 2.844
SG-106
07-
305 190.8 190.95 0.15 KP 1312.10 848.78 2.832
SG-107
07-
305 205.85 206.02 0.17 KP 1395.40 908.18 2.864
SG-108
07-
305 220.98 221.15 0.17 KP 1431.30 928.84 2.849
SG-109
07-
305 237.45 237.6 0.15 BBP/KP 1358.25 887.38 2.885
SG-110
07-
302 89.48 89.67 0.19 KP 1386.75 891.40 2.800
SG-111
07-
302 101.35 101.53 0.18 KP 1295.65 840.32 2.846
SG-112
07-
302 112.03 112.18 0.15 KP 1211.45 785.12 2.842
SG-113
07-
302 124.62 124.77 0.15 KP 1006.10 648.48 2.813
SG-114
07-
302 137.34 137.56 0.22 BBP 1349.25 870.06 2.816
SG-115
07-
302 150.29 150.48 0.19 LS 1193.34 762.56 2.770

Eureka Resources Inc. Frasergold Project 67 ___________________________________________________________________________________
___________________________________________________________________________________
ERSi Earth Resource Surveys Inc. Giroux Consultants Ltd.
Sample
#
Hole
#
From
(m)
To
(m)
Length
(m) Unit Comments
Dry
Weight
(g)
Bath
Weight
(g)
Specific
Gravity
(g/cc)
SG-116
07-
302 163.31 163.48 0.17 KP 1145.00 740.14 2.828
SG-117
07-
302 176.15 176.35 0.2 KP 1456.40 937.36 2.806
SG-118
07-
302 196.6 196.83 0.23 KP 1569.25 1025.36 2.885
SG-119
07-
302 204.27 204.48 0.21 KP 1287.00 838.28 2.868
SG-120
07-
302 218.98 219.14 0.16 BBP 988.30 639.26 2.831
SG-121
07-
302 228.31 228.54 0.23 BBP 1714.90 1111.34 2.841
SG-122
07-
306 169.58 169.77 0.19 KP 1430.70 931.20 2.864
SG-123
07-
306 180.98 181.17 0.19 KP/SLST
siliceous
sediment
with knots 1280.40 828.12 2.831
SG-124
07-
306 192.25 192.45 0.2 KP 1400.65 900.24 2.799
SG-125
07-
306 208.1 208.26 0.16 KP 992.76 640.38 2.817
SG-126
07-
306 213.75 213.91 0.16 KP
10%
quartz,
sericite
lenses 1305.80 846.86 2.845
SG-127
07-
306 231.79 231.97 0.18 BBP minor knots 1233.95 803.04 2.864
SG-128
07-
306 239.88 240.06 0.18 BBP minor knots 1389.45 904.94 2.868