NHSBT Board Performance Report - ... · PDF fileThe CSM project continues to report at red...
35
Page 1 of 35 Board Performance Report Performance Report For the period ended 31 st October 2017 Status Trend Comments Blood Components Collections were marginally higher than plan this month but, with demand behind plan, stocks remained stable. Stocks should now be starting to build in advance of xmas, albeit demand appears to have picked up in November and we continue to struggle with insufficient numbers of active donors. Despite falling demand we are retaining blood donation capacity in order to manage the gap in donor numbers with a negative impact on productivity and capacity utilisation. DTS A positive income trend continues to be seen in TAS, RCI and SCDT with overall income growth in DTS 9% higher year on year. There have now been 39 cord blood unit issues versus 40 planned year to date (with international issues compensating for lower domestic use). Cornea stocks increased to 315 units by the end of October. ODT There were 137 deceased donors in October. Year to date deceased donors are 3.5% behind plan but are 9.3% higher than last year. The number of deceased transplants is now 8% lower than plan year to date but 8.9% higher than last year. Living Donors (reported one month in arrears) are 26% lower than plan in the year to date (September). Corporate Sickness absence was slightly higher this month at 3.5%. Finance NHSBT is reporting a small year to date deficit of £0.1m, £5.2m better than plan. The latest forecast is a £13.2m deficit (versus £15.3m planned). The 5 year projection continues to be impacted by further reduction in red cell demand reductions, higher pay and marketing costs and the impact of CSM, resulting in an emerging significant cash gap in 2019/20. Change Programme The overall transformation programme continues to report at red status. The CSM project continues to report at red status along with the Networks and Telephony project and also Stock Management. Contents Pages 1. Performance Summary 1 2. Financial Report 2-3 3. Blood Components - Summary 4-16 4. DTS – Summary 17-23 5. ODT – Summary 24-31 6. Group Level Trends 32-33 7. Risk Management 34-35
Transcript of NHSBT Board Performance Report - ... · PDF fileThe CSM project continues to report at red...

Page 1 of 35
Board Performance Report Performance Report
For the period ended 31 st October 2017
S
tatu
s
T
rend
Comments
Blood Components
Collections were marginally higher than plan this month but, with demand behind plan, stocks remained stable. Stocks should now be starting to build in advance of xmas, albeit demand appears to have picked up in November and we continue to struggle with insufficient numbers of active donors. Despite falling demand we are retaining blood donation capacity in order to manage the gap in donor numbers with a negative impact on productivity and capacity utilisation.
DTS A positive income trend continues to be seen in TAS, RCI and SCDT with overall income growth in DTS 9% higher year on
year. There have now been 39 cord blood unit issues versus 40 planned year to date (with international issues compensating for lower domestic use). Cornea stocks increased to 315 units by the end of October.
ODT
There were 137 deceased donors in October. Year to date deceased donors are 3.5% behind plan but are 9.3% higher than last year. The number of deceased transplants is now 8% lower than plan year to date but 8.9% higher than last year. Living Donors (reported one month in arrears) are 26% lower than plan in the year to date (September).
Corporate
Sickness absence was slightly higher this month at 3.5%.
Finance
NHSBT is reporting a small year to date deficit of £0.1m, £5.2m better than plan. The latest forecast is a £13.2m deficit (versus £15.3m planned). The 5 year projection continues to be impacted by further reduction in red cell demand reductions, higher pay and marketing costs and the impact of CSM, resulting in an emerging significant cash gap in 2019/20.
Change Programme
The overall transformation programme continues to report at red status. The CSM project continues to report at red status along with the Networks and Telephony project and also Stock Management.
Contents Pages 1. Performance Summary 1 2. Financial Report 2-3 3. Blood Components - Summary 4-16 4. DTS – Summary 17-23 5. ODT – Summary 24-31 6. Group Level Trends 32-33 7. Risk Management 34-35

Income Budget Actual Variance2016-17 Actual
Full YearBudget
Forecast
£k £k £k £k £k £kRevenue Cash Limit - Organ Donation & Transplantation 36,124 36,124 0 61,697 61,927 61,927Revenue Cash Limit - Diagnostic and Therapeutic Services 2,435 2,435 0 4,173 4,173 4,173Blood & Components Income 152,565 150,841 (1,724) 262,506 257,730 255,567Diagnostic and Therapeutic Services Income 39,139 40,903 1,764 65,377 68,507 70,300Research & Development 642 853 211 1,985 1,101 857Organ Donation & Transplantation Other Income 7,036 6,980 (56) 11,544 12,062 11,906All Other Income 4,095 4,103 8 7,266 7,001 7,128
Total Income 242,036 242,239 203 414,548 412,500 411,858
ExpenditureCost of Sales - Blood Component Stock Movement (130) (713) (583) (143) 0 0Cost of Sales - Tissues Stock Movement 0 (19) (19) 42 0 0Organ Donation & Transplantation: Operational Expenditure (34,700) (33,791) 909 (60,062) (59,601) (58,982)Organ Donation & Transplantation: Change Programme (2,947) (2,797) 150 (5,216) (6,526) (6,016)Blood Supply: Manufacturing, Testing & Issue (40,039) (40,087) (48) (69,589) (67,490) (67,490)Blood Supply: Blood Donation (42,656) (42,033) 622 (76,577) (72,309) (72,304)Blood Supply: Logistics (12,169) (12,453) (284) (21,175) (20,651) (21,054)Diagnostic and Therapeutic Services (35,630) (35,730) (99) (60,293) (61,102) (62,095)Quality (2,916) (2,888) 28 (4,783) (5,023) (5,051)Chief Executive and Board (362) (404) (42) (623) (621) (675)Communications (4,182) (4,044) 137 (7,397) (7,363) (7,363)Estates & Facilities (22,137) (22,046) 91 (40,182) (39,211) (39,395)Finance (3,273) (3,333) (60) (5,760) (5,573) (5,673)Business Transformation Services (970) (776) 194 (1,588) (1,662) (1,385)Workforce (4,498) (4,014) 484 (7,529) (7,710) (7,270)Information Communication Technology (13,297) (13,774) (477) (20,661) (22,814) (23,503)Clinical Directorate (8,389) (8,156) 233 (14,014) (14,166) (13,716)Research & Development (2,159) (2,391) (231) (5,627) (4,443) (4,443)Change Programme (Blood & Corporate) (15,967) (14,025) 1,942 (17,850) (27,842) (28,838)Miscellaneous and Capital Charges (957) 1,113 2,071 (439) (2,156) 187
Total Expenditure (247,379) (242,362) 5,017 (419,467) (426,263) (425,066)
Surplus/(Deficit) (5,343) (123) 5,220 (4,919) (13,762) (13,208)
Statutory Accounts PresentationNHSBT Surplus/(Deficit) as above (5,343) (123) 5,220 (4,919) (13,762) (13,208)Add back Notional Cost of Capital 4,074 4,074 0 7,323 7,121 7,121
Remove Revenue Cash Limit (38,558) (38,558) 0 (65,870) (66,100) (66,100)Deduct Capital Charges Cash Payment (10,234) (10,234) 0 (17,292) (17,544) (17,544)
Net Expenditure (50,062) (44,841) 5,220 (80,758) (90,285) (89,731)
A deficit of £1.4m was reported in October, £0.6m worse than plan.
Year to date NHSBT is reporting a deficit of £0.1m versus a planned deficit of £5.2m. This is driven by a favourable DTS contribution (£1.6m - higher income in TAS and SCDT), an in-year VAT return (£1.8m), lower change programme costs in both Blood/Group (£1.9m) and ODT (£0.9m), partially offset by lower blood component income (£1.7m).
The current forecast for the year is a £13.2m deficit (versus £13.8m budgeted). This is £1.0m higher than the forecast last month reflecting an increased change programme spend (£0.9m) and also higher spend within Blood (£0.2m).
Balance sheet - current assets were £60.0m at the end of October 2017 with a cash balance of £48.5m (including capital charges payable of £1.4m).
Debtor days were at 23 in October, a decrease on last month, although higher than target (22 days).
Year to date
NHSBT REVENUE STATEMENT - FOR THE PERIOD ENDED 31 OCTOBER 2017
Page 2 of 35

Year to date Actual £mBlood &
Components inc. R&D
RCI H&I Reagents IBGRL Tissues CMT CBC BBMR CBB TAS ODT TOTAL
IncomePrices 152.9 7.9 7.7 1.0 0.7 7.5 5.4 - 2.3 0.8 5.1 - 191.3Central Funding from DHAs - - - - - - - - - - - 6.9 6.9Grant in Aid - - - - - - - - 1.0 1.3 - 36.1 38.4Other 3.0 0.2 0.2 - - - 0.3 0.7 0.1 0.7 0.3 0.1 5.6
Total Income 155.9 8.1 8.0 1.0 0.7 7.5 5.6 0.7 3.4 2.8 5.4 43.1 242.2
ExpenditureVariable Costs
Consumables (24.0) (0.6) (2.0) (0.3) (0.1) (1.1) (1.1) (0.3) (0.3) (0.3) (1.9) (1.9) (33.9)Other - - - - - - - - - - - - -
Total Variable Costs (24.0) (0.6) (2.0) (0.3) (0.1) (1.1) (1.1) (0.3) (0.3) (0.3) (1.9) (1.9) (33.9)
Variable Contribution 131.9 7.5 6.0 0.7 0.6 6.4 4.6 0.4 3.0 2.5 3.5 41.2 208.3
Direct CostsPay (50.8) (4.3) (3.7) (0.4) (0.7) (3.8) (2.3) (0.5) (0.8) (1.3) (1.4) (14.7) (84.7)Non Pay (12.1) (0.4) (0.6) (0.1) (0.1) (1.7) (0.5) (0.2) (0.5) (0.3) (0.4) (17.5) (34.4)
Total Direct Costs (62.9) (4.6) (4.3) (0.5) (0.8) (5.5) (2.8) (0.6) (1.3) (1.5) (1.9) (32.2) (119.1)
Direct Contribution 69.0 2.9 1.6 0.2 (0.2) 0.9 1.7 (0.2) 1.7 1.0 1.7 9.0 89.2
Direct SupportOperational Directorate costs (3.2) (0.1) (0.1) (0.0) (0.0) (0.1) (0.1) (0.0) (0.0) (0.0) (0.1) (0.9) (4.7)Logistics (12.2) (0.0) (0.0) (0.0) - (0.0) (0.0) - (0.0) (0.1) (0.1) (0.0) (12.4)Clinical (5.1) (0.3) - - - (0.1) (0.1) - (0.1) (0.0) (0.2) (0.6) (6.4)Attributable Estates costs (12.3) (0.7) (0.5) (0.1) (0.2) (0.8) (0.8) (0.0) (0.1) (0.1) (0.1) (0.7) (16.5)Attributable IT costs (2.5) (0.1) (0.1) (0.0) (0.0) (0.0) (0.0) - (0.0) (0.0) (0.0) (1.4) (4.3)
Depreciation / Cost of CapitalDepreciation / Cost of Capital (1.2) (0.1) (0.3) (0.0) (0.1) (0.1) (0.3) (0.0) (0.1) (0.1) (0.1) (0.3) (2.8)Total Direct Support (36.6) (1.4) (1.0) (0.1) (0.4) (1.2) (1.2) (0.1) (0.4) (0.4) (0.5) (3.9) (47.1)
Notional Internal Income Uplift (1.2) (0.0) 1.2 0.1 0.2 0.0 0.0 (0.0) (0.3) 0.0 0.0 (0.0) (0.0)Cost of Sales (0.7) - - - - (0.0) - - - - - - (0.7)
Contribution to Unallocated Costs 30.5 1.5 1.9 0.2 (0.4) (0.3) 0.5 (0.3) 1.0 0.6 1.2 5.1 41.4
Total Allocated Costs (125.4) (6.7) (6.1) (0.8) (1.1) (7.8) (5.1) (1.0) (2.3) (2.2) (4.2) (38.0) (200.8)
Unallocated Costs ApportionedDirectorate costs (11.9) (0.6) (0.5) (0.1) (0.1) (0.7) (0.4) (0.1) (0.2) (0.2) (0.4) (3.5) (18.6)Estates costs (3.6) (0.2) (0.2) (0.0) (0.0) (0.2) (0.1) (0.0) (0.1) (0.1) (0.1) (1.0) (5.6)Depreciation / Cost of Capital (0.3) (0.0) (0.0) (0.0) (0.0) (0.0) (0.0) (0.0) (0.0) (0.0) (0.0) (0.1) (0.5)
Total Unallocated Costs (15.8) (0.8) (0.7) (0.1) (0.1) (0.9) (0.6) (0.1) (0.3) (0.3) (0.5) (4.6) (24.7)
Operating Net Surplus / (Deficit) 14.6 0.7 1.2 0.1 (0.5) (1.2) (0.0) (0.4) 0.8 0.3 0.7 0.4 16.7
Transformation Costs (14.0) - - - - - - - - - - (2.8) (16.8)
Total Allocated Costs Inc Transformation (139.5) (6.7) (6.1) (0.8) (1.1) (7.8) (5.1) (1.0) (2.3) (2.2) (4.2) (40.8) (217.6)
Net Surplus / (Deficit) Inc Transformation 0.6 0.7 1.2 0.1 (0.5) (1.2) (0.0) (0.4) 0.8 0.3 0.7 (2.4) (0.1)
RAG STATUS (Actuals V Plan) G G G G G G G R G G G G G
R&D PROGRAMME COSTS (2.4) (0.5) (0.1) - - (0.2) (0.3) - - - - (0.0) (3.5)
NHSBT HIGH LEVEL ABC CONTRIBUTION ANALYSIS FOR THE PERIOD ENDED 31 OCTOBER 2017
Diagnostics Stem Cells
Page 3 of 35

Page 4 of 35
DIVISION PILLAR BLOOD 2020 – STRATEGIC TARGETS YTD RAG
RAG CHANGE
PERFORMANCE
72% of blood donors scoring =/> 9/10 for satisfaction. G - 79% vs plan of 75% – Chart 21.
No. of complaints per million donation G - 0.38% vs plan of 0.44% – Chart 22
% of whole blood donations in donor centres G - Month at 19.9%.
% of 9 bed sessions G - 70.5% vs plan of 80%.
Blood Donation Productivity: units/FTE/year G - 1,407 vs plan of 1,417 – charts 29/30.
Number of Donors Donating over the last 12 months (000’s) A - 834.3k vs plan of 846.1 – Chart 23.
Frequency of Donation (overall) G -- 1.88 vs plan of 1.86 (Chart 23).
Number of O- neg Donors donating last 12 months (000’s) R - 103.9k vs 106.8k planned – Chart 24.
Frequency of Donation (O neg donors) A - 1.97 versus 1.93 planned – Chart 24.
Blood Donation and the Donor Experience
Recruitment of new black donors - 7k R - 2.2k versus 4.9k target.
Red Cell Blood Stocks – Alert Levels G - Above 3 day alert for all groups in month – chart 14/15.
Platelet Demand vs. Stock levels R - Below target on 1 occasion in the month – chart 16.
Number of ‘critical’ and “major” regulatory non-compliances R Worse One reported in the month.
97% of Products Issued on Time A - 96.9% vs 97% planned – chart 3.
Manufacturing Productivity (units/FTE/year) A - 10.0k vs 10.2k planned – Chart 27.
BLOOD
Supply-Chain Operations
Testing Productivity (units/FTE/year) A Better 28.6k vs plan of 29.6k – Chart 28.

Page 5 of 35
DIVISION PILLAR BLOOD 2020 – STRATEGIC TARGETS YTD RAG
RAG CHANGE
PERFORMANCE
BLOOD Supply Chain Operations
70 % hospitals scoring =/> 9/10 for satisfaction (chart 4). - - September at 74% (better than target). Next survey December 2017
• Issues in October were 0.7% lower than plan in the month. In the year to date red cell issues are now 0.2% lower than plan and 5.1% lower than last year.
Issues levels appear to have picked up in mid November with week day issues returning to a level above 5000 units/day (versus 4900 in the last two months). • Collections in October were 0.2% higher than plan. With demand marginally behind plan stocks remained stable at around 29k, with O neg stock operating in
a 4 - 4.5 day range (albeit falling to a 3 -4 day range during the early part of November). Stocks should now ideally be building towards xmas, but given immediate trends this may prove to be a challenge.
• Blood collection is being impacted by the impact of lower numbers of active donors than planned as well as an increase in the short term cancellation of
appointments by donors via the online portal (and hence a limited ability to then respond / fill the vacant appointment slot). The total number of active whole blood donors, and the number of active O neg donors are both below plan, with the latter now at red status (charts 23 and 24). In response the donation frequency of O negative donors has continued to remain high (versus an aspiration to decrease it). As reported previously the conversion of donors registering to donors attending has been falling from above 40% to 35% and also adversely impacting the number of active donors A rapid improvement event was held during the month in order to review and identify process improvements to improve the number of active donor numbers. This resulted in actions around eight themes: • rebalancing our donor recruitment strategy to appeal to all social groups whilst recognising we need more black donors • a five year plan to move our sessions to where our future donors are most likely to donate • improving conversion of people who show an interest in blood donation to becoming regular donors • exploring ways we can improve the introduction of first timers to blood donation, to ease their way into becoming regular donors and identifying earlier
those who may not be able to donate • finding a way to capture the lifetime value of the donor to aid with planning and investment decisions • making the most of every donor through a more personalised approach to donation • making more of the West End Donor Centre • education.
• Although demand is falling, because of the donor shortfall, collection capacity is being retained. Productivity is now starting to fall (chart 27), as well as
capacity utilisation. The Continuous Care Project should deliver a 10% increase in productivity over the next year but productivity is now likely to run significantly short of Blood 2020 targets.
• The proportion of O neg issues to total issues was higher this month at 13.5% and in the year to date has remained at 13.4% (versus 13.1% for full year
2016/17). Demand however, appears to have flattened off at ca 12.3% with supply pressure continuing to reflect the need to substitute Ro units with O neg units (as noted in the OTIF comment below).

Page 6 of 35
• The demand forecast for red cells in 2017/18 has remained unchanged this month (at 1.434m issues) and lower than the levels agreed with NCG of 1.461m units. Although the demand forecast for 2018/19 (1.398m units), which was agreed with the NCG in early November, has also remained unchanged, there is a risk that this will be further reduced in the coming months. At present, however, the existing demand forecast has been retained.
Year 2016-17 actual
2017-18 forecast
2018-19 forecast
2019-20 forecast
2020-21 forecast
2021-22 forecast
Red cell issues (million) 1.522 1.434 1.398 1.370 1.343 1.319
% change vs 2016/17 - -5.8% -8.1% -10.0% -11.8% -13.3%
• The NCG meeting held in NCG, achieved a good outcome, with the proposed red cell price increase of 3.6% (flat cost to the NHS) being given support and agreed to. The 5 year financial projections, however, continue to be impacted by lower demand, removal of the 1% pay inflation cap in 2018/19 and higher CSM costs (and resource constraints results) and result in a significant cash shortfall in 2019/20. Although the 2018/19 price rise, has reduced the impact on the 2019/20 position further significant price increases and/or cost reductions will be required to establish a robust financial position.
• OTIF in October was 96.8% below the 97.0% target. Year to date is marginally below target at 96.9%. The two main drivers continue to be Ro substitution
(37% of the misses) and “Timing Only” fails (37% of the misses). Ro substitutions accounted for 1.27% of the OTIF gap to 100%. OTIF for Ro fell back from 55% to 52% in October, with this month seeing the highest ever demand (4,545 units).
• Plans are in place to recruit additional black donors with £1m set aside in transformation funds to pay for this new activity and around 50% of this has been
spent to date. At the end of October, an additional 8,415 black donor have been registered versus 4,836 last year but the lower conversion rate is adversely impacting the increase in donors donating.
• The red cell loss rate in October was lower at 4.78% although the year to date position (4.50%) continues to be higher than plan (3.60%) and also the previous
year (3.86%). The red cell expiry rate was also lower in October at 1.52%, however, the year to date (1.57%) continues to be higher than both target (1.25%) and also the previous year (1.29%). The trend for A neg expiries continues to be high with 1,496 out of a total of 1,877 expiries in the month.
• A neg platelets were below the 1 day alert level on 4 working days during the month, with two of those days being sequential. This trend has continued into
early November with 1 working day below alert level. Although a decline in demand for A neg platelets had been seen since the end of 2015, demand has now returned to 15.3% of total demand over the last 7 months. The drivers behind the fall/increase are not fully understood. Plans are underway to increase donor numbers but attrition levels have increased significantly so that the total number of CD donors, and A negative donors, are both 10% behind plan. Again the reasons are not understood and lapsed donors are being contacted by the NCC to identify causes/trends.
• Platelets issued/produced were lower in the month at 91.09% with the year to date (91.13%) running lower than plan (91.27%) and level with the previous
year. The platelet expiry rate was higher in October at 6.22% (Sept. 5.69%) and also higher than target (6.17%), although the year to date (5.90%) is lower than in the previous year (6.76%). The CD share of issued platelets was lower in October at 49.3% with the year to date now at 52.1% versus 59.4% last year.
• Testing productivity was marginally better this month at 28.5k albeit below plan (29.6k) and reporting at Amber status. The primary driver continues to be
Manchester with opportunities being reviewed to improve, Productivity at Filton, however, was at a record level of 46k. Manufacturing productivity dropped from

Page 7 of 35
10.5k to 10.2k as a result of the impact of the SCM project and the need to improve quality/training at Manchester. In order to facilitate this production was transferred to Colindale.
• The number of faints in the month was better at 155 and marginally below target (160). The number of rebleeds was slightly worse this month at 29 but better than
target (30). • Donor satisfaction again reached record levels of 80% this month (versus target of 75%). Donor complaints (excluding those complaints related to consolidation /
team closures and also those related to cancellation of sessions) were marginally higher this month at 4.2k, although better than plan of 4.4k. The primary drivers for complaints are “turned away”, “cancellation of session” and also “staff attitude”. Work is ongoing to review our SMS communications with donors with a stakeholder workshop planned.
• Sickness absence in logistics was slightly better this month at 5.4% and consistent with a very positive and sustained improvement in the management of sickness
absence.
• There were 3 SABRE reportable events this month– one relating to an irradiation error in Leeds and the two other due to red cells out of time in Manchester manufacturing.
• There were two MHRA inspections in the early part of the November. The Birmingham inspection did not report any critical / major non-compliances, however, the
Manchester inspection resulted in 1 major finding. This was associated with a number of Quality Management System deficiencies and in particular the number of overdue documents. An action plan is now in place to address these.
.
Blood Supply - Status of Strategic Projects per TPB reporting is reported on the following page:
Page 8 of 35
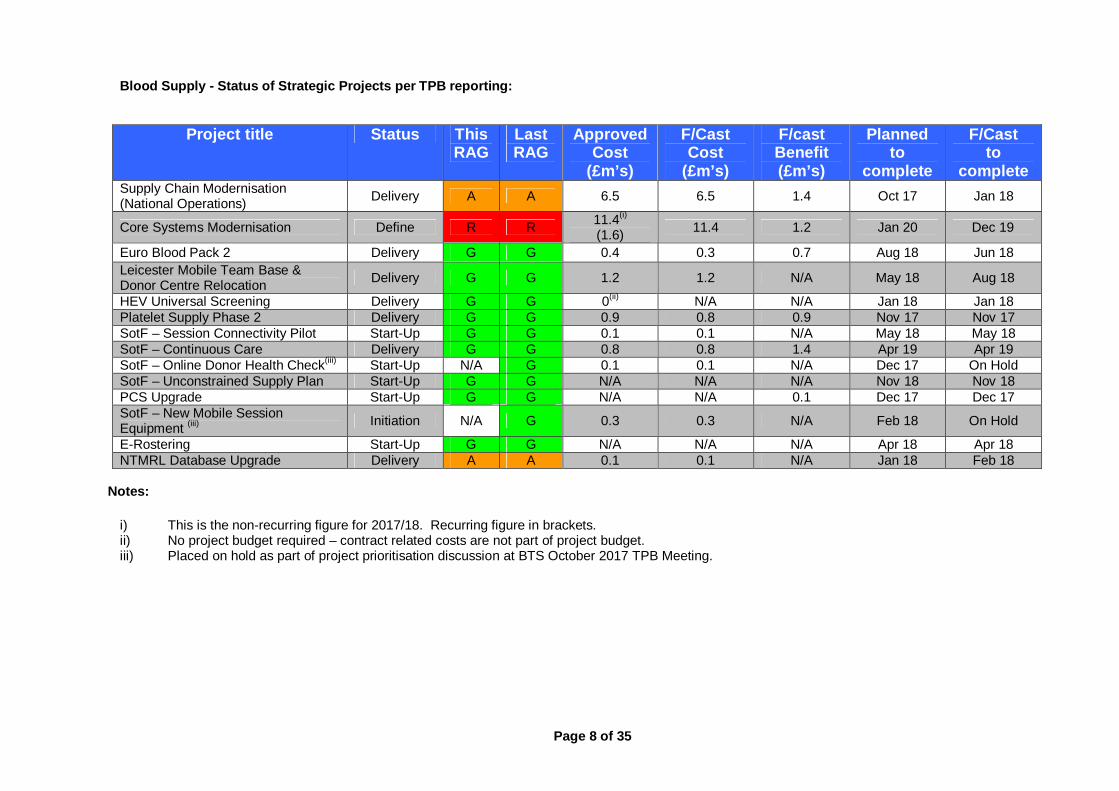
Blood Supply - Status of Strategic Projects per TPB reporting:
Project title Status This RAG
Last RAG
Approved Cost
(£m’s)
F/Cast Cost
(£m’s)
F/cast Benefit (£m’s)
Planned to
complete
F/Cast to
complete Supply Chain Modernisation (National Operations) Delivery A A 6.5 6.5 1.4 Oct 17 Jan 18
Core Systems Modernisation Define R R 11.4(i) (1.6) 11.4 1.2 Jan 20 Dec 19
Euro Blood Pack 2 Delivery G G 0.4 0.3 0.7 Aug 18 Jun 18 Leicester Mobile Team Base & Donor Centre Relocation Delivery G G 1.2 1.2 N/A May 18 Aug 18
HEV Universal Screening Delivery G G 0(ii) N/A N/A Jan 18 Jan 18 Platelet Supply Phase 2 Delivery G G 0.9 0.8 0.9 Nov 17 Nov 17 SotF – Session Connectivity Pilot Start-Up G G 0.1 0.1 N/A May 18 May 18 SotF – Continuous Care Delivery G G 0.8 0.8 1.4 Apr 19 Apr 19 SotF – Online Donor Health Check(iii) Start-Up N/A G 0.1 0.1 N/A Dec 17 On Hold SotF – Unconstrained Supply Plan Start-Up G G N/A N/A N/A Nov 18 Nov 18 PCS Upgrade Start-Up G G N/A N/A 0.1 Dec 17 Dec 17 SotF – New Mobile Session Equipment (iii) Initiation N/A G 0.3 0.3 N/A Feb 18 On Hold
E-Rostering Start-Up G G N/A N/A N/A Apr 18 Apr 18 NTMRL Database Upgrade Delivery A A 0.1 0.1 N/A Jan 18 Feb 18
Notes:
i) This is the non-recurring figure for 2017/18. Recurring figure in brackets. ii) No project budget required – contract related costs are not part of project budget. iii) Placed on hold as part of project prioritisation discussion at BTS October 2017 TPB Meeting.

1. Major QIs raised per month - Blood Supply Directorate 2. % of Patients Receiving Grade A or B1 HLA Matched Platelets H&I # 5
Annual
Target
YTD
Target
YTD
ActualRAG
YTD RAG
Trend
75.0% 75.0% 71.9% A -
3. Percentage of Products Issued OTIF BC # 1
Annual
Target
YTD
Target
YTD
Actual
YTD
RAG
YTD RAG
Trend
Annual
Target
YTD
Target
YTD
Actual
YTD
RAG
YTD RAG
Trend
97.00% 97.00% 96.85% A - 70% 70% 76% G -
Blood Components - Blood Collection: Customer Service
Monthly Performance Report - As at the end of October 2017
Blood Components - Safety and Compliance
YTD Performance
% of patients receiving A or B1 platelets
YTD Performance
% On Time In Full delivery
4. Hospital Satisfaction
YTD Performance
Hospitals rating satisfaction at >/=9/10
0
10
20
30
40
50
60
No
v-16
De
c-16
Jan
-17
Feb
-17
Ma
r-1
7
Apr-
17
Ma
y-17
Jun
-17
Jul-
17
Aug-1
7
Sep-1
7
Oct-
17
Blood Donation Manufacturing & Logistics
0.0%
10.0%
20.0%
30.0%
40.0%
50.0%
60.0%
70.0%
80.0%
No
v-1
6
De
c-1
6
Ja
n-1
7
Fe
b-1
7
Ma
r-1
7
Apr-
17
Ma
y-1
7
Ju
n-1
7
Ju
l-17
Aug
-17
Sep
-17
Oct-
17
Grade A Grade B1 Target
90.0%
91.0%
92.0%
93.0%
94.0%
95.0%
96.0%
97.0%
98.0%
99.0%
100.0%
No
v-16
De
c-16
Jan
-17
Feb
-17
Ma
r-1
7
Apr-
17
Ma
y-17
Jun
-17
Jul-
17
Aug-1
7
Sep-1
7
Oct-
17
OTIF Actual OTIF Plan
70% 70% 70% 70%
85%
76%
84%
76%
50%
55%
60%
65%
70%
75%
80%
85%
90%
De
c-16
Ma
r-1
7
Jun
-17
Sep-1
7
Plan Actual
Monthly Performance Report: As at the end of October 2017 Page 9 of 35

5. Average Weekday Red Cell Issues By Month ->April 2015 6. MAT Red Cells and O Neg Issues (Adult Equivalant Units) - 000's
7. Red Cell Supply - Year to Date by Blood Group
O Pos
A Pos
O Neg
A Neg
B Pos
B Neg
AB Pos
AB Neg
Total 847,245 892,984 -5.1%
113,390 116,659 -2.8%
6,715 7,039 -4.6%
18,555 18,888 -1.8%
301,904 318,023 -5.1%
21,028 22,080 -4.8%
66,360 70,515 -5.9%
67,910 73,976 -8.2%
251,383 265,804 -5.4%
Monthly Performance Report - As at the end of October 2017
Blood Components - Red Cell Issues
Blood Group2017/18 - YTD
Oct 2017
2016/17 - YTD
Oct 2016Change
8. RO Red Cells Requested, Validated and Issued
140
145
150
155
160
165
170
175
180
185
190
195
200
205
210
215
220
1,400
1,450
1,500
1,550
1,600
1,650
1,700
1,750
1,800
1,850
1,900
1,950
2,000
2,050
2,100
2,150
2,200
Apr-
10
Jul-
10
Oct-
10
Jan
-11
Apr-
11
Jul-
11
Oct-
11
Jan
-12
Apr-
12
Jul-
12
Oct-
12
Jan
-13
Apr-
13
Jul-
13
Oct-
13
Jan
-14
Apr-
14
Jul-
14
Oct-
14
Jan
-15
Apr-
15
Jul-
15
Oct-
15
Jan
-16
Apr-
16
Jul-
16
Oct-
16
Jan
-17
Apr-
17
Jul-
17
Oct-
17
O N
eg
Issu
es
Red
Cell I
ssu
es (
incl. O
neg
)
Red Cell Issues (all groups) MAT Red Cell Issues (O Neg) MAT
000's000's
4,500
4,700
4,900
5,100
5,300
5,500
5,700
5,900
6,100
6,300
Apr May Jun Jul Aug Sep Oct Nov Dec Jan Feb Mar
Av
era
ge W
eekd
ay
Issu
es
2015/16 2016/17 Plan 1,434k Initial Plan 2017/18
Latest data point is part month
0
500
1,000
1,500
2,000
2,500
3,000
3,500
4,000
4,500
5,000
Ap
r-1
5
Ma
y-1
5
Jun
-15
Jul-
15
Au
g-1
5
Se
p-1
5
Oct-
15
No
v-1
5
De
c-1
5
Jan
-16
Fe
b-1
6
Ma
r-1
6
Ap
r-1
6
Ma
y-1
6
Jun
-16
Jul-
16
Au
g-1
6
Se
p-1
6
Oct-
16
No
v-1
6
De
c-1
6
Jan
-17
Fe
b-1
7
Ma
r-1
7
Ap
r-1
7
Ma
y-1
7
Jun
-17
Jul-
17
Au
g-1
7
Se
p-1
7
Oct-
17
No
v-1
7
De
c-1
7
Jan
-18
Fe
b-1
8
Ma
r-1
8
RO Requested RO Validated RO Issued
Monthly Performance Report: As at the end of October 2017 Page 10 of 35

9. Average Weekday Platelet Issues By Month ->April 2014 10. MAT Platelet and A Neg Issues (Adult Therepeutic Doses) - 000's
11. MAT UK (Non MB) FFP and UK (Non MB) Cryo Pools - 000's 12. MAT Meth Blue FFP and Meth Blue Cryo Pools
Monthly Performance Report - As at the end of October 2017
Blood Components - Platelet Issues
Blood Components - Frozen Component Issues
0
500
1,000
1,500
2,000
2,500
3,000
3,500
3,000
4,000
5,000
6,000
7,000
8,000
9,000
10,000
Mar-
10
Jun
-10
Sep
-10
Dec-1
0
Mar-
11
Jun
-11
Sep
-11
Dec-1
1
Mar-
12
Jun
-12
Sep
-12
Dec-1
2
Mar-
13
Jun
-13
Sep
-13
Dec-1
3
Mar-
14
Jun
-14
Sep
-14
Dec-1
4
Mar-
15
Jun
-15
Sep
-15
Dec-1
5
Mar-
16
Jun
-16
Sep
-16
Dec-1
6
Mar-
17
Jun
-17
Sep
-17
Me
th B
lue
FF
P
MAT : MB FFP MAT : MB Cryo Pools
18
20
22
24
26
28
30
32
34
36
150
160
170
180
190
200
210
220
230
240
250
260
270
Mar-
10
Jun
-10
Sep
-10
Dec-1
0
Mar-
11
Jun
-11
Sep
-11
Dec-1
1
Mar-
12
Jun
-12
Sep
-12
Dec-1
2
Mar-
13
Jun
-13
Sep
-13
Dec-1
3
Mar-
14
Jun
-14
Sep
-14
Dec-1
4
Mar-
15
Jun
-15
Sep
-15
Dec-1
5
Mar-
16
Jun
-16
Sep
-16
Dec-1
6
Mar-
17
Jun
-17
Sep
-17
UK
Cry
o P
oo
ls (
00
0s)
UK
FF
P (
00
0s)
MAT : UK FFP (000s) MAT : UK Cryo Pools (000s)
26
30
34
38
42
200
220
240
260
280
300
320
Apr-
12
Jul-
12
Oct-
12
Jan
-13
Apr-
13
Jul-
13
Oct-
13
Jan
-14
Apr-
14
Jul-
14
Oct-
14
Jan
-15
Apr-
15
Jul-
15
Oct-
15
Jan
-16
Apr-
16
Jul-
16
Oct-
16
Jan
-17
Apr-
17
Jul-
17
Oct-
17
A n
eg
Issu
es
AT
D P
late
let Is
su
es (
inc
l. A
ne
g)
Platelet Issues (all groups) MAT Platelet Issues (A Neg) MAT
000's 000's
750
770
790
810
830
850
870
890
910
Apr May Jun Jul Aug Sep Oct Nov Dec Jan Feb Mar
Av
era
ge W
eekd
ay
Issu
es
2015/16 2016/17 Plan 261k 2017/18
Latest data point is part month
Me
th B
lue
Cry
o P
oo
ls
Monthly Performance Report: As at the end of October 2017 Page 11 of 35

13. Red Cell - Blood Stocks (Units)
15. Red Cell - O neg : weekday stock levels BC # 3 16. Platelet - Total and A neg : weekday stock levels BC # 4
YTD PerformanceAnnual
Target
YTD
TargetYTD Actual
YTD
RAG
YTD RAG
TrendYTD Performance
Annual
Target
YTD
Target
YTD
Actual
YTD
RAG
YTD RAG
Trend
Number of occasions where red cell stocks (for
any blood group) are below the three day alert
level for three or more consecutive days
0 0 0 G -
Number of occasions where opening stock of
platelets (for any blood group) is below average
daily demand for two or more consecutive days
0 0 19 R -
Monthly Performance Report - As at the end of October 2017
Blood Components - Stocks
14. Average Red Cell Stock Levels for the month by blood group
1.50
2.50
3.50
4.50
5.50
6.50
7.50
21-N
ov-1
6
05-D
ec-1
6
19-D
ec-1
6
02-J
an-1
7
16-J
an-1
7
30-J
an-1
7
13-F
eb
-17
27-F
eb
-17
13-M
ar-
17
27-M
ar-
17
10-A
pr-
17
24-A
pr-
17
08-M
ay-1
7
22-M
ay-1
7
05-J
un-1
7
19-J
un-1
7
03-J
ul-1
7
17-J
ul-1
7
31-J
ul-1
7
14-A
ug-1
7
28-A
ug-1
7
11-S
ep-1
7
25-S
ep-1
7
09-O
ct-
17
23-O
ct-
17
06-N
ov-1
7O- AlertDays stock
0.00
0.75
1.50
2.25
3.00
3.75
03
-Apr-
17
10
-Apr-
17
17
-Apr-
17
24
-Apr-
17
01
-May-1
7
08
-May-1
7
15
-May-1
7
22
-May-1
7
29
-May-1
7
05
-Ju
n-1
7
12
-Ju
n-1
7
19
-Ju
n-1
7
26
-Ju
n-1
7
03
-Ju
l-17
10
-Ju
l-17
17
-Ju
l-17
24
-Ju
l-17
31
-Ju
l-17
07
-Aug
-17
14
-Aug
-17
21
-Aug
-17
28
-Aug
-17
04
-Sep
-17
11
-Sep
-17
18
-Sep
-17
25
-Sep
-17
02
-Oct-
17
09
-Oct-
17
16
-Oct-
17
23
-Oct-
17
30
-Oct-
17
06
-No
v-1
7
13
-No
v-1
7
Total Platelet Stocks Alert Level A-
20,000
25,000
30,000
35,000
40,000
45,000
No
v
De
c
Jan
Feb
Ma
r
Ma
y
Jun
Jul
Aug
Sep
Oct
No
v
Yr to 18 Nov 2016 Yr to 17 Nov 2017
4.8
7.1
6.2
9.0
4.6
11.9
5.4
11.0
6.3
0
1
2
3
4
5
6
7
8
9
10
11
12
13
O+ A+ B+ AB+ O- A- B- AB- Total
Arrows indicate change from last month
Day
s St
ock
Monthly Performance Report: As at the end of October 2017 Page 12 of 35

17. O neg RC Demand and Issues 18. A neg Platelet Demand and Issues
19. Percentage of Donations NOT Converted to Validated Red Cells and Expiries 20. Percentage of Platelets Produced NOT Issued
Monthly Performance Report - As at the end of October 2017
Blood Components - Red Cell Demand/Issues (O Neg) and Platelet Demand/Issues (A Neg)
Blood Components - Wastage
12000
13000
14000
15000
16000
17000
18000
19000
41730 41821 41913 42005 42095 42186 42278 42370 42461 42552 42644
O- Demand O- Issues
12,000
13,000
14,000
15,000
16,000
17,000
18,000
19,000
Ap
r-14
Ju
n-1
4
Au
g-1
4
Oct-
14
Dec-1
4
Feb
-15
Ap
r-15
Ju
n-1
5
Au
g-1
5
Oct-
15
Dec-1
5
Feb
-16
Ap
r-16
Ju
n-1
6
Au
g-1
6
Oct-
16
Dec-1
6
Feb
-17
Ap
r-17
Ju
n-1
7
Au
g-1
7
Oct-
17
O- Demand O- Issues
2,000
2,200
2,400
2,600
2,800
3,000
3,200
3,400
3,600
3,800
4,000
4,200
Ap
r-1
4
Ju
n-1
4
Au
g-1
4
Oct-
14
Dec-1
4
Fe
b-1
5
Ap
r-1
5
Ju
n-1
5
Au
g-1
5
Oct-
15
Dec-1
5
Fe
b-1
6
Ap
r-1
6
Ju
n-1
6
Au
g-1
6
Oct-
16
Dec-1
6
Fe
b-1
7
Ap
r-1
7
Ju
n-1
7
Au
g-1
7
Oct-
17
A- Demand A- Issues
0.00%
0.50%
1.00%
1.50%
2.00%
2.50%
3.00%
3.50%
4.00%
4.50%
5.00%
5.50%
6.00%
2010
/11 F
Y
2011
/12 F
Y
2012
/13 F
Y
2013
/14 F
Y
2014
/15 F
Y
2015
/16 F
Y
2016
/17 F
Y
Apr-
17
May-1
7
Jun-1
7
Jul-17
Aug-1
7
Sep-1
7
Oct-
17
Nov-1
7
Dec-1
7
Jan-1
8
Fe
b-1
8
Mar-
18
Actual Process Losses Plan Process Losses Actual Expiries Plan Expiries
0.00%
2.50%
5.00%
7.50%
10.00%
12.50%
15.00%
17.50%
20.00%
22.50%
2010
/11 F
Y
2011
/12 F
Y
2012
/13 F
Y
2013
/14 F
Y
2014
/15 F
Y
2015
/16 F
Y
2016
/17 F
Y
Apr-
17
May-1
7
Jun-1
7
Jul-17
Aug-1
7
Sep-1
7
Oct-
17
Nov-1
7
Dec-1
7
Jan-1
8
Fe
b-1
8
Mar-
18
Period Total Pooled CD Plan
Monthly Performance Report: As at the end of October 2017 Page 13 of 35

21. Donor Satisfaction BC # 5 22. Donor Complaints BC # 10
YTD Performance Annual Target
YTD Target
YTD Actual
YTD RAG
YTD RAG Trend YTD Performance Annual
TargetYTD
TargetYTD
ActualYTD RAG
YTD RAG Trend
% of donors scoring >= 9/10 for satisfaction 75.0% 75.0% 79.0% G - Number of complaints per million
donations 4,400 4,400 3,830 G -
23.Donor Base and Frequency of Donation BC # 6 BC # 7 24. O Neg: Donorbase and Frequency of Donation BC # 8 BC # 9
YTD Performance Annual Target
YTD Target
YTD Actual
YTD RAG
YTD RAG Trend YTD Performance Annual
TargetYTD
TargetYTD
ActualYTD RAG
YTD RAG Trend
Number of donors donating in the last 12 months 838,342 846,066 834,339 A - Number of active O neg donors donating
over the last 12 months 107,513 106,800 103,866 R -
Frequency of donation (overall) 1.836 1.860 1.877 G - Frequency of donation (O neg donors) 1.887 1.925 1.971 A -
Monthly Performance Report - As at the end of October 2017
Blood Components - Blood Donor Base
1.838
1.888
1.938
1.988
2.038
2.088
2.138
100,000101,000102,000103,000104,000105,000106,000107,000108,000109,000110,000
Nov
-16
Dec
-16
Jan-
17
Feb-
17
Mar
-17
Apr-1
7
May
-17
Jun-
17
Jul-1
7
Aug-
17
Sep-
17
Oct
-17
O-neg Donors Donating O-neg Frequency
0
10,000
20,000
30,000
40,000
50,000
60,000
750,000
770,000
790,000
810,000
830,000
850,000
870,000
890,000
Nov
-16
Dec
-16
Jan-
17
Feb-
17
Mar
-17
Apr-1
7
May
-17
Jun-
17
Jul-1
7
Aug-
17
Sep-
17
Oct
-17
New Donors Registering New Donors Attending Donors Donating (All Groups)
0%10%20%30%40%50%60%70%80%90%
2010
/11
FY
2011
/12
FY
2012
/13
FY
2013
/14
FY
2014
/15
FY
2015
/16
FY
2016
/17
FY
Apr-1
7
May
-17
Jun-
17
Jul-1
7
Aug-
17
Sep-
17
Oct
-17
Nov
-17
Dec
-17
Jan-
18
Feb-
18
Mar
-18
Donor Satisfaction - Actual Donor Satisfaction - Plan
0
1,000
2,000
3,000
4,000
5,000
6,000
7,000
8,000
0
200
400
600
800
1,000
1,200
Apr-1
5
Jun-
15
Aug-
15
Oct
-15
Dec
-15
Feb-
16
Apr-1
6
Jun-
16
Aug-
16
Oct
-16
Dec
-16
Feb-
17
Apr-1
7
Jun-
17
Aug-
17
Oct
-17
Ra
tio
/ m
illio
n
To
tal n
um
bers
-fo
r C
om
pla
ina
nts
w
ith
Do
na
tio
ns
fa
cto
red
by 1
/25
0 t
o
fit
ch
art
Collections/250 Complainants Complainants/million donations
Monthly Performance Report: As at the end of October 2017 Page 14 of 35

25. Ro Donor Base and Black Donor Recruitment BC # 6 BC # 7 26. CD platelet Donor Base : Total and A Neg BC # 8 BC # 9
YTD PerformanceAnnual Target
YTD Target
YTD Actual
YTD RAG
YTD RAG Trend
Number of Ro donors donating in the last 12 months
29,440 25,137 19,186 R -
Frequency of donation (overall) 1.836 1.860 1.866 G -
AB-A+
-206
2,159
2,365
A-
2423311563,982 11,4972,824820777
-384
10,5072,6117606952193001653,598
Target
Reviewed report
Variance vs target
-990 -213 -60 -82 -23 -31 9
Monthly Performance Report - As at the end of October 2017Blood Components - Blood Donor Base (continued)
The table below reports that the Component Donation donor base is substantially lower than target. A flaw has been identified in the counting methodology, and this is the first month where the actual counts have been restated (downwards). It is not possible to restate historical counts.
Targets were based on the old counting methodology and will be restated. The correct donor base and restated targets will be reported next month (with history from September 2017 onwards).
Desc TotalO+O-B+B-AB+
0
500
1,000
1,500
2,000
2,500
3,000
Apr-1
7M
ay-1
7Ju
n-17
Jul-1
7Aug
-17
Sep-1
7Oct-
17Nov
-17
Dec-1
7Ja
n-18
Feb-1
8M
ar-1
8
Bla
ck D
on
ors
0
5,000
10,000
15,000
20,000
25,000
30,000
35,000
Ro
Do
no
r B
ase
Black Donors Registering New Black Donors Donating
Ro Donors donating (last 12 mths) Ro Donor base target
Monthly Performance Report: As at the end of October 2017 Page 15 of 35

27. Processing Productivity : YTD and Current Month BC # 17 28. Testing Productivity : YTD and Current Month BC # 18
Annual
Target
YTD
Target
YTD
ActualRAG
YTD
RAG
Trend
Annual
Target
YTD
Target
YTD
ActualRAG
YTD
RAG
Trend
10,300 10,239 10,028 A Worse 29,700 29,637 28,576 A Better
29. Blood Donation Productivity : YTD and Current Month BC # 19 30. Blood Donation Productivity - Distribution Mobile Teams
Annual
Target
YTD
Target
YTD
ActualRAG
YTD
RAG
Trend
1,411 1,416 1,407 G Better
Blood Components - Productivity
Monthly Performance Report - As at the end of October 2017
YTD Performance
Testing productivity (units/FTE/year)
YTD Performance
Manufacturing productivity (units/FTE/year)
YTD Performance
Blood Donation Productivity (units/FTE/Year)
1,4
07
1,4
59
900
1,000
1,100
1,200
1,300
1,400
1,500
1,600
1,700
1,800
1,900
20
08/0
9
20
09/1
0
20
10/1
1
20
11/1
2
20
12/1
3
20
13/1
4
20
14/1
5
20
15/1
6
20
16/1
7
20
17/1
8 Y
TD
20
17/1
8P
eri
od
EBA Top Quartile 1,752
10,0
28
10,2
05
4,000
5,000
6,000
7,000
8,000
9,000
10,000
11,000
20
08/0
9
20
09/1
0
20
10/1
1
20
11/1
2
20
12/1
3
20
13/1
4
20
14/1
5
20
15/1
6
20
16/1
7
20
17/1
8 Y
TD
20
17/1
8P
eri
od
EBA Top Quartile 9,749
28,5
76
34,1
46
5,000
10,000
15,000
20,000
25,000
30,000
35,000
20
08/0
9
20
09/1
0
20
10/1
1
20
11/1
2
20
12/1
3
20
13/1
4
20
14/1
5
20
15/1
6
20
16/1
7
20
17/1
8 Y
TD
20
17/1
8P
eri
od
EBA Top Quartile23,996
1,050
1,150
1,250
1,350
1,450
1,550
1,650
1,750
1,850
1,950
YTD Average includes static sites
21 above average
Slough (1,890)Reading (1,765)Teesside (1,650)
York (1,571)Milton Keynes (1,556)
28 below average
Plymouth (1,192)Cambridge (1,222)
Liverpool (1,223)Hertfordshire (1,233)City (1,240)
Top 5
Bottom 5
Monthly Performance Report: As at the end of October 2017 Page 16 of 35

Page 17 of 35
DIVISION THEME STRATEGIC TARGET YTD RAG
RAG CHANGE PERFORMANCE
Sales Income (£69.3m) G - £43.3m (vs plan of £41.6m).
Number of Serious Incidents (SI’s) G - None reported this month
Zero ‘critical’ regulatory non-compliances G - None reported in the month.
Group Targets
Number of ‘major’ regulatory non-compliances G - None reported in the month.
Sales income achieved - £13.6m (chart 31) G - Equal to plan (vs £7.5m).
80% percent of customers scoring =/> 9/10 for satisfaction with Tissues - - March 2017 (reported in April 2017) at 75%.
Tissue & Eye Services
98.0% of Product issued on time G - 99.3% vs plan of 98.0% (year to date).
Sales Income achieved - £13.9m (chart 32) A - £8.0m vs plan of £8.1m.
% of patients receiving A or B1 platelets A - 72% vs plan of 75% - Chart 2.
Time to type deceased organ donors G - Reporting monthly in arrears - at 83% vs target of 80%.
H&I
Turnaround time vs SLA (chart 36) G - At plan (95%).
£14.95m Sales income achieved (chart 32) G - £8.1m vs plan of £7.8m.
DTS
RCI Sample turnaround time vs SLA (chart 35) G - 97.1% vs plan of 95%.

Page 18 of 35
DIVISION THEME STRATEGIC TARGET YTD RAG
RAG CHANGE PERFOMANCE
£11.2m sales income achieved (chart 33) A Worse £6.3m vs plan of £6.4m. CMT
On time in full – target 100% G At target.
£9.8m sales income achieved (chart 33) G - £6.2m vs plan of £5.7m.
2,300 increase to Banked Cords TNC > 140 R - 985 vs plan of 1340.
40% BAME Cord Blood units add to the bank G - 41% in the year to date (> 40).
Issue 75 Cord Blood units G - 39 units issued in the year to date (vs plan of 40).
Adult Donor Provisions (216) G - 139 vs plan of 123
SCDT
Donors recruited to fit panel – 10k A Worse 5, 730 vs plan of 5,833.
£7.6m sales income achieved (chart 34) G - £5.5m vs plan of £4.5m.
62% of hospitals scoring =/> 9/10 for satisfaction - - 70.5% vs 62% at February 2017.
DTS
Therapeutic Apheresis Services
95% of Patients rating patient experience =/>9/10 - - Latest survey, reported in December 2016 at 93% (vs 95%)
• DTS is reporting an I&E surplus of £1.6m in the year to date. The forecast outturn for the year has improved to a surplus of £0.8m. • Sickness absence in DTS was worse this month at 3.7% (vs 2.9% in September) but better than the NHSBT target of 4%. The increase occurred in TAS and may
reflect the workload and the impact of strong demand on the service. A cohort of newly trained nurses should alleviate the pressure in the next few months.
• All SBUs are contributing at or better than plan in the year to date and reporting at ‘Green’ status with the exception of CBC. The CBC is reporting a small I&E deficit of £0.15m, although the service is expected to see improved sales and recover to plan over the remainder of the year. Overdue debtors are running at a high rate across DTS (£4.6m out of a total £7.3m is more than 30 days old with £1.1m of that over 6 months old). Work is underway to improve collections.

Page 19 of 35
DTS Income by SBU – YTD October 2017
2017/18 Budget
2017/18 Income
2017/18 Variance
2016/17 Actual
Growth
Tissue & Eye Services 7.5 7.5 0.0 7.2 5% TAS 4.4 5.4 1.0 4.3 27% H&I 8.1 8.0 -0.1 7.7 3% RCI 8.7 9.1 0.4 8.1 13% IBGRL & DD 0.7 0.7 0.0 0.4 73% CMT 6.4 6.3 -0.1 5.9 7% SCDT 5.7 6.2 0.5 6.0 3% Customer Services 0.1 0.1 0.0 0.1 80% Total (£m’s) 41.6 43.3 1.8
39.6 9% • Tissue and Eye Services - income was again marginally worse than plan in October. In the year to date, it is 0.2% worse than plan, however it remains 4.9%
higher than the previous year. Strong sales have been seen in corneas, ASE/AlloSE and cardiovascular and only partially offset by underperformance in skin, sclera, dCell dermis and processed bone. A small favourable position on expenditure, however, is resulting in a balanced contribution position in the year to date. Eye bank stocks were at 315 at the end of October (vs 278 in September).
• RCI income is 5.0% better than plan in the year to date and 13.0% higher than last year with antenatal referrals/screening and reagents sales continuing to
perform well. There is a small favourable position on expenditure resulting in a surplus contribution year to date of £0.5m. Sample turnaround was again marginally lower than plan this month at 94.5% as a result of sickness, although it continues to be better than plan in the year to date (97.15% vs 95.0%).
• H&I income is marginally worse than plan year to date. Activity in stem cell investigations is 2% better than plan but this is more than offset by general
investigations and solid organ investigations which are 5% and 3% respectively below plan so far this year. Turnaround times are at plan levels in the year to date. The provision of A and B1 matched platelets was 76% in October and better than target (75%), albeit in the year to date it remains worse than plan at 72%.
• Stem Cell Donation & Transplantation income is showing a £0.5m favourable variance in the year to date. There have been 39 cord issues year to date (versus target of 40) with international 9 better than plan and the UK 10 below plan. BBMR donors are higher than plan in the year to date (139 versus target of 123) with the UK 6 behind plan and international 22 ahead of plan. The IT connection with US registries is now in place and has resulted in increased activity. The cords banked target was to have banked 20k by end of the 2018/19 financial year, however, at the current run rate, we will now hit 20k by September 2019. At this point the bank changes from a growth to a maintenance phase, and collection activity will be reduced (the TNC threshold will be increased so we are only banking A&B grade units at a rate of around 31per month - this will maintain the bank at 20k units and gradually improve the proportion of A&B cords). The slow down in the banking rate is due to a decision to leave posts vacant, and shifts uncovered, hence avoiding the need to recruit staff to reach target only to make them redundant next year. DH is in agreement with this approach as we are tracking towards the agreed bank size. The introduction of NICE guidelines on delayed cord clamping in March 2017, however is now being implemented in hospitals and has impacted our clinical conversion rate. As a consequence the number of cord units banked continues to run behind plan (26% in the year to date) and is expected to continue reporting at red status through the rest of the year. BAME cord donations banked were better than target in the month (at 41% versus target of 40%).
• .Cellular and Molecular Therapies - service income in the year to date is £0.1m worse than budget and generating a small income and expenditure deficit of
£0.2m.

Page 20 of 35
• Therapeutic Apheresis Services income in the year to date is 23% ahead of target and 27% higher than in the previous year, primarily due to strong
performance on ECP (£0.8m), red cell exchange (£0.1m) and stem cell harvests (£0.1m). The income surplus (£1.0m), when combined with the increased expenditure to support these activity levels, is resulting in a favourable contribution surplus of £0.4m. Confirmation has now been received from NHSE that they will be commissioning ECP service across London for the treatment of Graft versus Host Disease, based on TAS delivering all paediatric ECP services in London. This will generate £0.2m of improved contribution through the remainder of the year.
• There were no critical / major non-compliances reported in October. The HTA inspection at Leeds, although subject to a formal report, received positive feedback
from the inspectors.
DTS – Status of Strategic Projects per TPB reportin g:
Project title Status This RAG
Last RAG
Approved Cost
(£m’s)
F/Cast Cost
(£m’s)
F/cast Benefit (£m’s)
Planned to complete
F/Cast to complete
Stock Management Rollout Delivery R A 0.3 0.3 N/A Nov 17 Nov 17 TAS - Liverpool Delivery G A N/A N/A N/A Mar 20 Mar 20 Filton Extension Start-Up G G 0.2 0.2 N/A Jan 21 Oct 21 Automated Software Testing Start-Up G G N/A 0.2 N/A Nov 18 Mar 19

31. Tissue and Eye Services Income (MAT) TS # 1 32. Diagnostic Service Income (MAT) H&I # 1 RCI # 1
Annual
Target
YTD
Target
YTD
ActualRAG
YTD RAG
Trend
Annual
Target
YTD
TargetYTD Actual RAG
YTD RAG
Trend
14.884 8.673 9.107 G -13.882 8.130 7.983 A -
33. Stem Cells - SCDT/CMT Income (MAT) CMT # 1 SCDT # 1 34. Therapeutic Apheresis Services Income (MAT) TAS # 1
Annual
Target
YTD
Target
YTD
ActualRAG
YTD RAG
Trend
Annual
TargetYTD Target YTD Actual RAG
YTD RAG
Trend
11.212 6.376 6.321 A -
9.795 5.699 6.197 G -
Income (£m's) - H&IIncome (£m's) - TES 13.602 7.524 7.511
Income (£m's) - RCI
Monthly Performance Report - As at the end of October 2017
Diagnostic and Therapeutic Services - Income
YTD Performance YTD Performance
-
YTD Performance
Income (£m's) - CMT
Income (£m's) - SCDT7.581 4.419 5.423 G
YTD Performance
Income (£m's) - TAS
A Worse
7,000
8,000
9,000
10,000
11,000
12,000
13,000
14,000
15,000
Apr-
14
Jun
-14
Aug
-14
Oct-
14
Dec-1
4
Feb-1
5
Apr-
15
Jun
-15
Aug
-15
Oct-
15
Dec-1
5
Feb-1
6
Apr-
16
Jun
-16
Aug
-16
Oct-
16
Dec-1
6
Feb-1
7
Apr-
17
Jun
-17
Aug
-17
Oct-
17
Dec-1
7
Feb-1
8
£000s
TES Actual TES Budget
11,500
12,000
12,500
13,000
13,500
14,000
14,500
15,000
15,500
Apr-
14
Jun
-14
Aug
-14
Oct-
14
Dec-1
4
Feb-1
5
Apr-
15
Jun
-15
Aug
-15
Oct-
15
Dec-1
5
Feb-1
6
Apr-
16
Jun
-16
Aug
-16
Oct-
16
Dec-1
6
Feb-1
7
Apr-
17
Jun
-17
Aug
-17
Oct-
17
Dec-1
7
Feb-1
8
£000s
H&I Actual RCI Actual H&I Budget RCI Budget
5,000
5,500
6,000
6,500
7,000
7,500
8,000
8,500
9,000
Apr-
14
Jun
-14
Aug
-14
Oct-
14
Dec-1
4
Feb-1
5
Apr-
15
Jun
-15
Aug
-15
Oct-
15
Dec-1
5
Feb-1
6
Apr-
16
Jun
-16
Aug
-16
Oct-
16
Dec-1
6
Feb-1
7
Apr-
17
Jun
-17
Aug
-17
Oct-
17
Dec-1
7
Feb-1
8
£000s
TAS Actual TAS Target
6,000
7,000
8,000
9,000
10,000
11,000
12,000
13,000
Apr-
14
Jun
-14
Aug
-14
Oct-
14
Dec-1
4
Feb-1
5
Apr-
15
Jun
-15
Aug
-15
Oct-
15
Dec-1
5
Feb-1
6
Apr-
16
Jun
-16
Aug
-16
Oct-
16
Dec-1
6
Feb-1
7
Apr-
17
Jun
-17
Aug
-17
Oct-
17
Dec-1
7
Feb-1
8
£000s
CMT Actual SCDT Actual CMT Budget SCDT Budget
Monthly Performance Report: As at the end of October 2017 Page 21 of 35
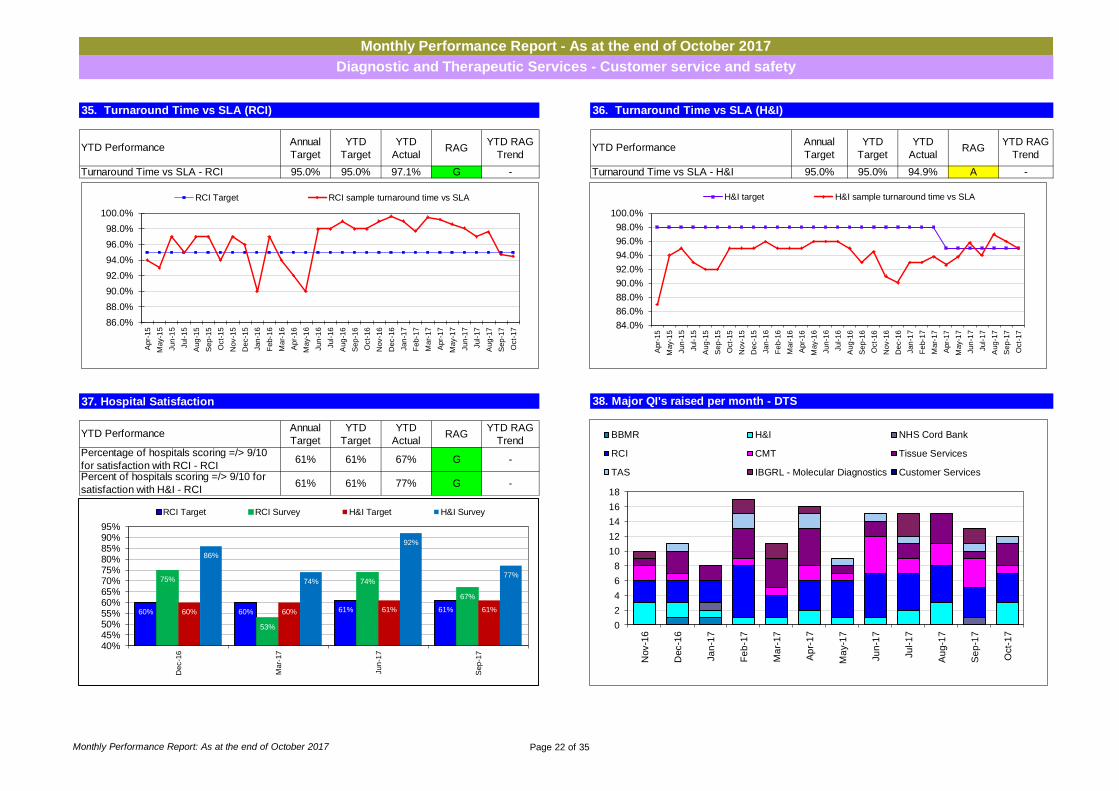
35. Turnaround Time vs SLA (RCI) RCI # 5 36. Turnaround Time vs SLA (H&I) H&I # 7
Annual
Target
YTD
Target
YTD
ActualRAG
YTD RAG
Trend
Annual
Target
YTD
Target
YTD
ActualRAG
YTD RAG
Trend
95.0% 95.0% 97.1% G - 95.0% 95.0% 94.9% A -
37. Hospital Satisfaction H&I # 3 RCI # 3 38. Major QI's raised per month - DTS
Annual
Target
YTD
Target
YTD
ActualRAG
YTD RAG
Trend
61% 61% 67% G -
61% 61% 77% G -Percent of hospitals scoring =/> 9/10 for
satisfaction with H&I - RCI
Monthly Performance Report - As at the end of October 2017
Diagnostic and Therapeutic Services - Customer service and safety
Percentage of hospitals scoring =/> 9/10
for satisfaction with RCI - RCI
Turnaround Time vs SLA - H&I
YTD Performance
YTD Performance
Turnaround Time vs SLA - RCI
YTD Performance
60% 60% 61% 61%
75%
53%
74%
67%
60% 60% 61% 61%
86%
74%
92%
77%
40%45%50%55%60%65%70%75%80%85%90%95%
Dec-1
6
Mar-
17
Jun
-17
Sep
-17
RCI Target RCI Survey H&I Target H&I Survey
86.0%
88.0%
90.0%
92.0%
94.0%
96.0%
98.0%
100.0%
Apr-
15
May-1
5
Jun
-15
Jul-
15
Aug
-15
Sep
-15
Oct-
15
Nov-1
5
Dec-1
5
Jan
-16
Feb-1
6
Mar-
16
Apr-
16
May-1
6
Jun
-16
Jul-
16
Aug
-16
Sep
-16
Oct-
16
Nov-1
6
Dec-1
6
Jan
-17
Feb-1
7
Mar-
17
Apr-
17
May-1
7
Jun
-17
Jul-
17
Aug
-17
Sep
-17
Oct-
17
RCI Target RCI sample turnaround time vs SLA
84.0%
86.0%
88.0%
90.0%
92.0%
94.0%
96.0%
98.0%
100.0%
Apr-
15
May-1
5
Jun
-15
Jul-
15
Aug
-15
Sep
-15
Oct-
15
Nov-1
5
Dec-1
5
Jan
-16
Feb-1
6
Mar-
16
Apr-
16
May-1
6
Jun
-16
Jul-
16
Aug
-16
Sep
-16
Oct-
16
Nov-1
6
Dec-1
6
Jan
-17
Feb-1
7
Mar-
17
Apr-
17
May-1
7
Jun
-17
Jul-
17
Aug
-17
Sep
-17
Oct-
17
H&I target H&I sample turnaround time vs SLA
0
2
4
6
8
10
12
14
16
18
Nov-1
6
Dec-1
6
Ja
n-1
7
Fe
b-1
7
Ma
r-17
Ap
r-1
7
Ma
y-1
7
Ju
n-1
7
Ju
l-1
7
Au
g-1
7
Se
p-1
7
Oct-
17
BBMR H&I NHS Cord Bank
RCI CMT Tissue Services
TAS IBGRL - Molecular Diagnostics Customer Services
Monthly Performance Report: As at the end of October 2017 Page 22 of 35

39. Adult donor provisions : UK and International - MATs SCDT # 8 40. Issue of cord blood units : UK and International - MATs SCDT # 7
SCDT # 8 SCDT # 8
Annual
Target
YTD
Target
YTD
ActualRAG
YTD RAG
Trend
Annual
Target
YTD
Target
YTD
ActualRAG
YTD RAG
Trend
216 123 139 G - 75 40 39 A Worse
41. Suitable Cornea Donations - MAT, and Cornea stocks 42. NHSBT CBB stock (active units - cell dose post process TNC) SCDT # 5
Annual
Target
YTD
Target
YTD
ActualRAG
YTD RAG
Trend
2,300 1,340 985 R -
Adult donor provisions (total)
Monthly Performance Report - As at the end of October 2017
Stem Cell Donation and Transplantation, and Tissue and Eye Services : Corneas - Strategic Targets
YTD Performance
Banked Donations TNC > 140
YTD Performance
YTD Performance
Number of Cord Units Issued (total)
30
50
70
90
110
130
150
170
Apr-
14
Jun-1
4
Aug-1
4
Oct-
14
Dec-1
4
Fe
b-1
5
Apr-
15
Jun-1
5
Aug-1
5
Oct-
15
Dec-1
5
Fe
b-1
6
Apr-
16
Jun-1
6
Aug-1
6
Oct-
16
Dec-1
6
Fe
b-1
7
Apr-
17
Jun-1
7
Aug-1
7
Oct-
17
Dec-1
7
Fe
b-1
8
UK MAT International MAT UK Target International Target
200
220
240
260
280
300
320
340
360
3,600
3,800
4,000
4,200
4,400
4,600
Nov-1
6
Dec-1
6
Jan
-17
Feb-1
7
Mar-
17
Apr-
17
May-1
7
Jun
-17
Jul-
17
Aug
-17
Sep
-17
Oct-
17
Co
rne
a S
toc
k
Su
ita
ble
Co
rne
a D
on
ati
on
s M
AT
MAT Suitable Cornea Donations Cornea Stock
7,790
11,000
4,157
1,410
0
2,000
4,000
6,000
8,000
10,000
12,000
Less than 90 TNC (Researchgrade)
Between 90 to 139 TNC(Operational C Grade)
Between 139 to 190 TNC(Operational B Grade)
Greater than 190 TNC(Operational A Grade)
0
10
20
30
40
50
60
Ap
r-14
Ju
n-1
4
Au
g-1
4
Oct-
14
Dec-1
4
Feb
-15
Ap
r-15
Ju
n-1
5
Au
g-1
5
Oct-
15
Dec-1
5
Feb
-16
Ap
r-16
Ju
n-1
6
Au
g-1
6
Oct-
16
Dec-1
6
Feb
-17
Ap
r-17
Ju
n-1
7
Au
g-1
7
Oct-
17
Dec-1
7
Feb
-18
UK MAT International MAT UK Target International Target
Monthly Performance Report: As at the end of October 2017 Page 23 of 35

Page 24 of 35
• There were 137 deceased donors in October. This is the third highest month for deceased donors following the 143 in October 2015 and 141 in November
2016. Year to date, there have been 858 deceased donors, a 9% increase on last year (+ 63 DBD, + 7 DCD). Activity in the early part of November, has continued to improve and is currently trending at around 3% below plan.
• The DBD SNOD presence rate in October was 92%, following a consistent 96% for the last four months. This has brought the year to date rate down to 94%.
However, and in contrast, the DCD SNOD presence rate in October was high at 91%, increasing the year to date rate to 86%. This translates into 10 DBD / 13 DCD occasions where a SNOD was not present in the month. Planning within the regional teams remains focused on timely SNOD mobilisation.
DIVISION THEME STRATEGIC TARGET YTD RAG
RAG CHANGE PERFORMANCE
Increase % Consent/Authorisation rate (Overall) A - 64.6% year to date vs plan of 70% - chart 55.
Increase % Consent/Authorisation rate (Overall) – DBD G - 72.7% in October year to date vs plan of 73%.
Increase % Consent/Authorisation rate (Overall) - DCD R - 58.4% year to date vs plan of 67%.
Deceased donors - 2017/18 target – 1,524 A - Year to date at 858 vs target of 889 – chart 43.-
Deceased Organ Donors per million population - - September - 22.6m vs plan 22.9m. Next report December
Number of Living donors 2016/17 (1,260) – reported one month in arrears R - Year to date (September 2017) at 518 vs plan of 696 –
chart 46.
Living Donors per million population – 19.0 per/m R - September at 15.9m vs plan 18.7m (update in January).
Internal NHSBT target based on 1.1m new registrations in 2017/18. G - New registrations are 0.641m year to date (vs 0.642m)
Organ Transplants – Deceased (4,116) A - 1,891 year to date vs plan of 2,058 – chart 44.
Deceased Organ Transplants per million population. - - September at 59.2m vs plan 61.3m. Next report December.
Proportion of population who have had a conversation about their donation decision (target 47%) - - New measure, next report February 2018
ODT
TOT 2020 Key Outcome Measures
NHSBT Cost per Transplant (chart 45). - £16.3k (2017/18 target) G - September at £16.4k. Next update December 2017.

Page 25 of 35
• Following two very strong months for the DBD consent rate (79% in August and 78% in September) the DBD consent rate in October was lower at 69%. The DBD consent rate in the year to date has decreased slightly to 73% (but remains green). The October DCD consent rate at 68.5% however, and was the highest ever. The DCD consent rate year to date therefore increased to 58% (but remains red). Overall the consent rate in October was the highest ever at 69% and the overall consent rate year to date increased to 65% (still amber); again the highest ever.
. • Following strong months in August and September the consent rate for patients from black and Asian communities fell back to 35% in October, the lowest this
year. The year to date rate has therefore decreased to 44% but remains green. . • October was a relatively low month for overall ODR overrides (4 compared with a monthly average of 7) due to the low number of DCD ODR overrides (1
compared with a monthly average of 6). In contrast October was a high month for DBD overrides (3 compared with a monthly average of 1). A SNOD was present on all four occasions. The consent rate for patients on the ODR remains at 92% year to date.
• October was a strong month for the consent rate for patients not on the ODR (57%). When a SNOD was present and the patient was not on the ODR the consent rate was 62% in October and 58% year to date. When a SNOD was not present and the patient was not on the ODR, the consent rate was 11% in October and 10% year to date. The year to date consent rate for patients not on the ODR remains at 51% overall.
• In October, 334 patients received a solid organ transplant from a deceased donor. The number of transplantable organs per DBD was the lowest over recent years at (3.46). This compares to the average in the first six months of 2017/18 of 3.74, and an even higher 3.78 in 2016/17. In the year to date, 2,227 patients have received a solid organ transplant from a deceased donor, which is an 8% increase on last year. In total 162 more patients have received a transplant year to date. - The 'Taking Organ Utilisation to 2020' activities and initiatives continue to be implemented to increase the numbers of organs used. - Outcome 1. Recent changes to the DCD Donor Assessment and Screening Tool including the implementation of a formal Liver Screening process, will go live 1st December 2017. - Outcome 3. 'Consent in Organs Transplantation Workshop' will be held 15th November 2017 and stakeholders will be asked to share innovative approaches and best practices re consent with regards to high risk donors. - Outcome 4. A joint RINTAG - BTS stakeholder 2 day meeting will be held January 2018. The British Viral Hepatitis group are considering the use of HCV positive organs in HCV negative recipients, SaBTO Guidance is permissive of such an approach.
• Living donation remains stable but well below target. Initiatives to improve awareness, encourage engagement from professionals, patients and public and
develop the UK living kidney sharing schemes (UKLKSS) are priorities in delivering the LDKT 2020 plan. Nephrology leads for LDKT have been identified in all transplant and referring nephrology units to enhance local / regional leadership and embed best practice across the UK. There is an incremental increase in transplants identified in each quarterly matching run of the UKLKSS and further improvements will be implemented in Q4 to improve effectiveness and utilisation of kidneys donated by non-directed donors within the schemes. Regional per million population LDKT data by regional transplant centre has been published for the first time in the annual LDKT centre-specific report 2016/17. .
• There were 87k new opt-in registrations to the ODR in October, taking the cumulative total of new registrations for the financial year to 641k. 43% of new registrations this month can be attributed to communications /marketing activity. 42% of new registrations came through digital channels. If we are to hit the target for 2017/18, comms and marketing channels will need to account for a greater proportion of the registrations as data transfer partner numbers decline. We are still working hard to secure new high volume end of transaction partners and held meetings with NHS Digital and HMRC in October. The Prime Minister announced a consultation around the legislative system in October and this announcement led to a spike in visits to the website, and online sign ups and online opt outs. During the consultation period we will keep encouraging people to register as donors. In October our paid activity on social media continued to target levers for encouraging family conversations on Facebook and Twitter, and we restarted registration adverts to over 50s. Registration adverts will continue until the end of the year.

Page 26 of 35
Two ODR data feeds remain inactive: � Scottish GP Service - due to a defect in the source data that is currently being investigated by the third party provider. � England/Wales GP Service with a back-log dating back to 1 April 2017. This will be loaded throughout November and December after which the feed will
be re-activated. The NHS Tracing Service & De-Duplication Process have been inactive since May 2015. This may result in significant numbers of duplicate registrations on the live ODR i.e. over-reporting the number of registrants.
• There has been a further increase in sickness absence this month but remains within target for the past 12 months. Absence in Organ Donation increased from 2.98% to 4.35% but much of this is short term absence.
• There has been a further increase in turnover this month with Organ Donation increasing from 11.03% in Sept to 13.82%. TSS and Clinical remain high with
turnover at 15.65% and 19.95% respectively although both are reduced from last month. Detailed analysis will be undertaken for reporting to SMT in December. .
ODT – Status of Strategic Projects per TPB reportin g:
Project title Status This RAG
Last RAG
Approved Cost
(£m’s)
F/Cast Cost
(£m’s)
F/cast Benefit (£m’s)
Planned to complete
F/Cast to complete
ODT Hub Define A A 3.2(i) (0.6) N/A(ii) N/A Dec 19 Dec 19
Notes: i) This is non-recurring figure for 2017/18, recurring figure in brackets. ii) Now an under spend of £84k.

43. MAT number of Deceased Organ Donors ODT # 4 44. MAT number of Deceased Donor Organ Transplants ODT # 9
YTD PerformanceAnnual
Target
YTD
TargetYTD Actual YTD RAG
YTD RAG
TrendYTD Performance
Annual
Target
YTD
TargetYTD Actual RAG
YTD RAG
Trend
Number of Deceased Organ Donors 1524 889 858 A - Number of Deceased Donor Transplants 4116 2401 2227 A -
45. ODT Cost per Donor/Transplant ODT # 11 46. MAT number of Live Organ Donors (reported one month in arrears) ODT # 6
Annual
Target
Forecast
for the
year
YTD RAGYTD RAG
TrendYTD Performance
Annual
Target
YTD
TargetYTD Actual YTD RAG
YTD RAG
Trend
16.2 16.4 G -Number of Living Organ Donors (reported one
month in arrears)1392 696 518 R -
Monthly Performance Report - As at the end of October 2017
Organ Donation and Transplant - Outcomes
YTD Performance
NHSBT Cost per Transplant (£k's)
0
500
1000
1500
2000
2500
3000
3500
4000
4500
0
10
20
30
40
50
60
70
80
10/11 11/12 12/13 13/14 14/15 15/16 16/17 Budget17/18
Forecast17/18
Do
no
rs/T
ran
sp
lan
ts (N
o.)
£
ODT Total Spend (£M) Cost per donor (£K) Cost per transplant (£K)
Transplants (No.) Donors (No.)
1418
1432
1445
1447
1465
1473
1483
1524
1764
1000
1100
1200
1300
1400
1500
1600
1700
1800
Ap
r-1
7
Ma
y-1
7
Ju
n-1
7
Ju
l-1
7
Aug-1
7
Sep
-17
Oct-
17
No
v-1
7
De
c-1
7
Jan-1
8
Fe
b-1
8
Ma
r-18
Mar-
19
Mar-
20
Ma
r-21
Ma
r-22
MAT Actual MAT Plan
3708
3760
3769
3786
3829
3869
3877 4116
5028
2800
3100
3400
3700
4000
4300
4600
4900
5200
Apr-
17
May-1
7
Ju
n-1
7
Jul-17
Au
g-1
7
Se
p-1
7
Oct-
17
Nov-1
7
Dec-1
7
Ja
n-1
8
Fe
b-1
8
Ma
r-1
8
Ma
r-1
9
Ma
r-2
0
Ma
r-2
1
Ma
r-2
2
MAT Actual MAT Plan
1018
1027
1031
1030
1046
1041
1392
900
950
1000
1050
1100
1150
1200
1250
1300
1350
1400
1450
Apr-
17
May-1
7
Jun-1
7
Jul-17
Aug-1
7
Sep-1
7
Oct-
17
Nov-1
7
Dec-1
7
Jan-1
8
Fe
b-1
8
Mar-
18
MAT Actual MAT Plan
Monthly Performance Report: As at the end of October 2017 Page 27 of 35

47. MAT number of Deceased Organ Donors (DBD) 48. Deceased Organ Donors - Monthly (DBD)
49. Deceased Organ Donors - Weekly (DBD) 50. Deceased Organ Donors - By Nation (DBD)
Monthly Performance Report - As at the end of October 2017
Organ Donation and Transplant - DBD Activity
0
5
10
15
20
25
30
Apri
l
May
Jun
e
July
Aug
ust
Sep
tem
ber
Octo
be
r
Decem
ber
Jan
ua
ry
Febru
ary
Marc
h
2017/18 Plan (DBD) 2017/18 Actual (DBD) 2016/17 Actual (DBD)
0
50
100
150
200
250
300
350
400
450
500
En
gla
nd
Wale
s
Scotland
No
rthe
rnIr
ela
nd
Organ donors YTD October 2016/17 (DBD) Organ donors YTD October 2017/18 (DBD)
892
863
500
550
600
650
700
750
800
850
900
950
1000
Apr-
16
Ma
y-1
6
Ju
n-1
6
Ju
l-16
Aug
-16
Sep
-16
Oct-
16
No
v-1
6
De
c-1
6
Ja
n-1
7
Fe
b-1
7
Ma
r-1
7
Apr-
17
Ma
y-1
7
Ju
n-1
7
Ju
l-17
Aug
-17
Sep
-17
Oct-
17
No
v-1
7
De
c-1
7
Ja
n-1
8
Fe
b-1
8
Ma
r-1
8
DBD MAT Actual DBD MAT Target
0
10
20
30
40
50
60
70
80
90
100
Apr May Jun Jul Aug Sep Oct Nov Dec Jan Feb Mar
2016/17 DBD Actual 2017/18 DBD Actual 2017/18 DBD Target
Monthly Performance Report: As at the end of October 2017 Page 28 of 35

51. MAT number of Deceased Organ Donors (DCD) 52. Deceased Organ Donors - Monthly (DCD)
53. Deceased Organ Donors - Weekly (DCD) 54. Deceased Organ Donors - By Nation (DCD)
Monthly Performance Report - As at the end of October 2017
Organ Donation and Transplant - DCD Activity
0
2
4
6
8
10
12
14
16
18
20
Apri
l
May
Jun
e
July
Aug
ust
Sep
tem
ber
Octo
be
r
Decem
ber
Jan
ua
ry
Febru
ary
Marc
h
2017/18 Plan (DCD) 2017/18 Actual (DCD) 2016/17 Actual (DCD)
0
50
100
150
200
250
300
350
Engla
nd
Wa
les
Sco
tlan
d
No
rth
ern
Irela
nd
Organ donors YTD October 2016/17 (DCD) Organ donors YTD October 2017/18 (DCD)
591 6
14
450
500
550
600
650
Apr-
16
Ma
y-1
6
Ju
n-1
6
Ju
l-16
Aug
-16
Sep
-16
Oct-
16
No
v-1
6
De
c-1
6
Ja
n-1
7
Fe
b-1
7
Ma
r-1
7
Apr-
17
Ma
y-1
7
Ju
n-1
7
Ju
l-17
Aug
-17
Sep
-17
Oct-
17
No
v-1
7
De
c-1
7
Ja
n-1
8
Fe
b-1
8
Ma
r-1
8
DCD MAT Actual DCD Target
0
10
20
30
40
50
60
70
Apr May Jun Jul Aug Sep Oct Nov Dec Jan Feb Mar
2016/17 DCD Actual 2017/18 DCD Actual 2017/18 DCD Target
Monthly Performance Report: As at the end of October 2017 Page 29 of 35

55. Consent / Authorisation rate (DBD & DCD) ODT # 1 56. Consent/Authorisation rate (DBD) per month ODT # 2
YTD PerformanceAnnual
Target
YTD
TargetYTD Actual YTD RAG
YTD RAG
TrendYTD Performance
Annual
Target
YTD
TargetYTD Actual YTD RAG
YTD RAG
Trend
Consent/Authorisation rate (%) 70.0% 70.0% 64.6% A - DBD Consent/Authorisation rate (%) 73.0% 73.0% 72.7% G -
57. Consent/Authorisation rate (DCD) per month ODT # 3 58. Number of people registered on the ODR (opt-ins) ODT # 8
YTD PerformanceAnnual
Target
YTD
TargetYTD Actual YTD RAG
YTD RAG
TrendYTD Performance
Annual
Target
YTD
TargetYTD Actual YTD RAG
YTD RAG
Trend
DCD Consent/Authorisation rate (%) 67.0% 67.0% 58.4% R - Opt-in registrants on the ODR (millions) 1.100 0.642 0.642 G -
Monthly Performance Report - As at the end of October 2017
Organ Donation and Transplant - Consent / ODR
000's
0.00
5.00
10.00
15.00
20.00
25.00
30.00
Apr-
16
Ma
y-16
Jun
-16
Jul-
16
Aug-1
6
Sep-1
6
Oct-
16
No
v-16
De
c-16
Jan
-17
Feb
-17
Ma
r-1
7
Apr-
17
Ma
y-17
Jun
-17
Jul-
17
Aug-1
7
Sep-1
7
Oct-
17
No
v-17
De
c-17
Jan
-18
Feb
-18
Ma
r-1
8
Registrants Target
50%
54%
58%
62%
66%
70%
74%
0
50
100
150
200
250
300
350
No
v-16
De
c-16
Jan
-17
Feb
-17
Ma
r-1
7
Apr-
17
Ma
y-17
Jun
-17
Jul-
17
Aug-1
7
Sep-1
7
Oct-
17
Approach Consent Percent Target %
50%
54%
58%
62%
66%
70%
74%
78%
82%
0
20
40
60
80
100
120
140
160
No
v-16
De
c-16
Jan
-17
Feb
-17
Ma
r-1
7
Apr-
17
Ma
y-17
Jun
-17
Jul-
17
Aug-1
7
Sep-1
7
Oct-
17
Eligible DBD family approached DBD family consents Target Consent % Mthly%
50.0%
54.0%
58.0%
62.0%
66.0%
70.0%
74.0%
0
20
40
60
80
100
120
140
160
180
200
No
v-16
De
c-16
Jan
-17
Feb
-17
Ma
r-1
7
Apr-
17
Ma
y-17
Jun
-17
Jul-
17
Aug-1
7
Sep-1
7
Oct-
17
Eligible DCD family approached DCD family consents Target Consent % Mthly%
Monthly Performance Report: As at the end of October 2017 Page 30 of 35

59. Transplantable Organs per Donor 60. ODT Hub Operations - Incidents per Organ Offer
61. ODT Absence rate (%) 62. Annual Turnover rate (%)
Monthly Performance Report - As at the end of October 2017
Organ Donation and Transplant - Absence/Turnover
Organ Donation and Transplant - Transplantable Organs and Duty Office Incidents
0.0
0.5
1.0
1.5
2.0
2.5
3.0
3.5
4.0
4.5
No
v-1
6
De
c-1
6
Jan-1
7
Feb
-17
Ma
r-1
7
Apr-
17
Ma
y-1
7
Jun-1
7
Jul-1
7
Aug-1
7
Sep-1
7
Oct-
17
DBD (Actual) DCD (Actual)
%
0.0
0.5
1.0
1.5
2.0
2.5
3.0
3.5
4.0
4.5
5.0
Nov-1
6
Dec-1
6
Jan
-17
Feb-1
7
Mar-
17
Ap
r-17
May-1
7
Jun
-17
Jul-1
7
Au
g-1
7
Se
p-1
7
Oct-
17
ODT Overall % Absence Organ Donation % Absence Transplant Support Services % Absence
0
5
10
15
20
25
30
Nov-1
6
Dec-1
6
Jan
-17
Fe
b-1
7
Mar-
17
Ap
r-17
Ma
y-1
7
Jun
-17
Jul-1
7
Au
g-1
7
Se
p-1
7
Oct-
17
ODT % turnover Organ Donation % turnover Transplant Support Services % turnover
0
500
1,000
1,500
2,000
2,500
3,000
3,500
0.00%
0.20%
0.40%
0.60%
0.80%
1.00%
No
v-1
6
De
c-1
6
Jan-1
7
Feb
-17
Ma
r-1
7
Apr-
17
Ma
y-1
7
Jun-1
7
Jul-1
7
Aug-1
7
Sep-1
7
Oct-
17
Incid
en
t R
ate
Incident Rate Organ Offers made
Monthly Performance Report: As at the end of October 2017 Page 31 of 35

Page 32 of 35
SECTOR NOTES/UPDATE REPORT
NHSBT Corporate
Sickness absence was marginally higher in the month at 3.5% although lower than last year (3.6%). As noted above a sustained improvement within logistics is supporting the overall performance seen in NHBST. Health and Safety – the Incidence rate (12 months to September 2017) for all work related lost time is 2.0 This is no change form last month The target is to achieve an LTI rate of 1.8 or less within 12 months and will be reported on a monthly basis going forward. The logging of digital receipts in support of expense claims is now at 71%. From 1 April 2018 only digital receipts will be accepted for the reimbursement of expenses with all colleagues being encouraged to adopt this approach by January 2018. We are just over halfway through our flu vaccination campaign with many colleagues taking up the opportunity to book appointments via our new online system.
Corporate - Status of Strategic Projects per TPB re porting:
Project title Status This RAG
Last RAG
Approved Cost
(£m’s)
F/Cast Cost
(£m’s)
F/cast Benefit (£m’s)
Planned to complete
F/Cast to complete
Brentwood Estates Optimisation Closure G G 7.1 3.8 0.4 Nov 17 Nov 17 Networks & Telephony Contract Delivery R A 1.6 1.6 0.1 Apr 17 Mar 18 Leeds Sheffield Delivery G G 16.5 16.5 N/A Jan 21 Jan 21 Desktop Modernisation Delivery A A 3.5 2.2 N/A Apr 17 Feb 18 QPulse Performance Remediation & Upgrade Delivery G G 0.1 0.1 N/A TBC Jan 18
Exchange On-Line Migration Delivery G G 0.6 N/A N/A TBC Jun 18 Pulse GUI/Middleware Server Upgrade Delivery G G 0.6 N/A N/A TBC Apr 18
Portfolio and Resource Management Start-Up G G N/A N/A N/A TBC May 18 Robotic Process Automation Start-Up G A N/A N/A N/A TBC Jan 18 Tooting 2nd Floor Delivery G G 0.4 0.4 N/A Jan 18 Jan 18 Colindale 3rd Floor Refurbishment (i) Start-Up G A N/A N/A N/A Mar 19 Mar 19 Notes: i) Reported this month but project now closing as part of project prioritisation discussion at BTS October 2017 TPB Meeting. Work to proceed under Estates management.

63. IT system performance 64. Health and Safety - Accident Reporting
Period
Target
Period
Actual
Period
RAG
RAG
Trend
Level 1&2 MAT
Target
Level 1&2 MAT
Total
Level 1-3
Mthly Target
Level 1-3
Period Actual
<=17 14 <=24 7
<=6 5 <=4.5 1
<=1 2 <=2 2
0 0 <=1 0
0 0 <=1 1
<=24 21 <=32.5 11
65. Headcount / WTE (as at payroll date) 66. Sickness Absence
Plan WTE
(Ave YTD)
YTD Ave
WTE (C)
Variance
WTEVariance %
806 798 7 0.9%
1,409 1,410 -2 -0.1%
849 792 57 6.7%
408 405 3 0.8%
3,472 3,406 66 1.9%
3 3 0 -12.7%83 86 -4 -4.4%73 66 7 9.1%77 76 1 1.9%
349 345 5 1.3%99 98 2 1.7%27 22 4 16.5%
137 129 9 6.3%169 163 6 3.6%181 170 10 5.6%
33 40 -7 -21.6%6 27 -21 -352.4%
1,237 1,226 11 0.9%
4,693 4,619 74 1.6%
74% 74%
TMS
OBOS 99.95% 100.00%
Hematos
Blood Supply: LogisticsFinance
Better
Function
Blood Supply: Manufacturing, Testing & Issue
Diagnostic and Therapeutic Services
Blood Supply: Blood Donation
Organ Donation (including Group Services)
100.00% G
% Operational WTE to Total WTE
Sub-total Operational
Sub-total Group Service
Total
Quality
Business Transformation Services
Communications
Change Programme & Development
ClinicalBTS - Information Communication Technology
CEO and Board
Estates & Facilities
Workforce
EOS 99.95% 100.00% G
NtXD 99.95%
G
99.95% 98.77% R Worse
H&S Incident Levels (x 1 mth in
arrears)
Blood Donation
DTS/SpS
Monthly Performance Report - As at the end of October 2017
NHSBT Corporate - ICT / Workforce
System availability
100.00% G BetterDonor Portal 99.95%
Research and Development
NHSBT
M&L
99.95% 100.00% G Better
99.95% 100.00% -
-
Organ Donation
Group ServicesPulse
G
-
11
0
10
20
30
Oct-
16
Nov-1
6
Dec-1
6
Jan
-17
Feb-1
7
Mar-
17
Apr-
17
May-1
7
Jun
-17
Jul-
17
Aug
-17
Sep
-17
Blood Supply - MTI / Donation DTS Organ Donation Group Services NHSBT Total
2017/18 Monthly Target (33)
2.50%
3.50%
4.50%
5.50%
6.50%
7.50%
8.50%
Nov-1
6
Dec-1
6
Jan
-17
Feb-1
7
Mar-
17
Apr-
17
May-1
7
Jun
-17
Jul-
17
Aug
-17
Sep
-17
Oct-
17
NHSBT Blood Donation Logistics
Monthly Performance Report: As at the end of October 2017 Page 33 of 35

Page 34 of 35
RISK MANAGEMENT Risk register summary ( net risk) and summary by themes
Corporate Risk Register Summary Red Amber Green
126 11 111 6
The dependency and reliance on the SME that currently provides support for our critical operational systems (PULSE/Hematos) and, in particular, their ability to retain the necessary capability and service levels as we transition away to new systems as part of the CSM project. The ability to supply in case of the loss of a key facility (e.g. Filton, Speke) or the loss of critical IT systems (Pulse, Hematos, networks etc). The risk of critical system loss is increasing on the back of the significant changes that are planned (e.g. new desktop, CSM etc.) and the significant complexity and inter-dependency between them. Inability to supply as a result of planning / supply challenges through: • (at the macro level) limited visibility with regard to longer term blood demand trends and especially when current demand decline
will be offset by the anticipated impact of demographic trends • significant differential short term demand trends at group / component level (eg O neg red cells, A neg platelets) The scale of the transformation programme across NHSBT will create a significant challenge on the capacity and capability of NHSBT to safely execute the change (both ICT and business resources) and a potential distraction to delivering business as usual. The ability to maintain blood prices remains highly dependant on our ability to manage the combined impact of : • the need to fund the significant investment in CSM (and uncertainty regarding the phasing of the spend and timescale) • the organisational focus required to safely implement CSM and a slow down in the delivery of underlying BAU efficiency
improvements • ongoing reduction in red cell (and now platelet) demand and the loss of related income and contribution • being able to generate significant productivity improvements in Blood Donation especially (given the inherent productivity gap
and high contribution to overall costs) and the significant impact on service configuration required. Ongoing reduction in demand will require significant changes to the configuration of blood collection services in order to not just maintain productivity but deliver the increased Blood 2020 targets. This would involve fewer / larger mobile sessions, greater use of fixed donor venues and much less collection activity in certain parts of the country. This could result in adverse donor reaction (and potentially attendance) if not managed and communicated well and an impact on supply if, for example, sufficient numbers of O neg donors cannot be retained. The high prevalence of manual, paper based and verbal processes throughout NHSBT’s operations, especially within reference testing and in the duty office within organ donation and transplant. Although these are mitigated by appropriate manual control checks, and new systems are removing transcription in some areas, there is a residual risk that these are ineffective and cause transcription errors that could lead to the death or harm of NHS patients.

Page 35 of 35
RISK MANAGEMENT Risk register summary ( net risk) and summary by themes (cont.)
Risk to delivery of TOT 2020 strategic targets driven by : • adverse trends in the organ donor pool • inability to change consent levels • lack of funding required for supporting business cases in respect of consent strategy and new technologies • lack of transplant capacity. Changing clinical/commissioning intentions in Stem Cells (ie Cord Blood / BBMR) as a recommended treatment, impacting on the outcomes and therefore the future viability of these services.
There are no new high/extreme risks that have been formally escalated for review this month. A new risk may be reported in the near future month regarding emerging data on donor health and the results of the Interval and Compare trials (impact on donor numbers and testing costs).
There were no new high/extreme risks this month: