


NHS Sustainability Day 2016 Exeter Road Show
344
Welcome to the Exeter NHS Sustainability Day 2016 Road Show #Dayforaction
-
Upload
matthew-abbott -
Category
Health & Medicine
-
view
494 -
download
2
Transcript of NHS Sustainability Day 2016 Exeter Road Show

Welcome to the Exeter NHS Sustainability Day 2016 Road Show
#Dayforaction

Chair’s welcome and introduction
Fiona Daly, Associate Director of Sustainability and Patient Transport,
Barts Health NHS Trust
#Dayforaction

A Trust in Action


District Heating
• Combined Heat and Power
• On-site electricity – cheaper than grid
• Heat – waste by product
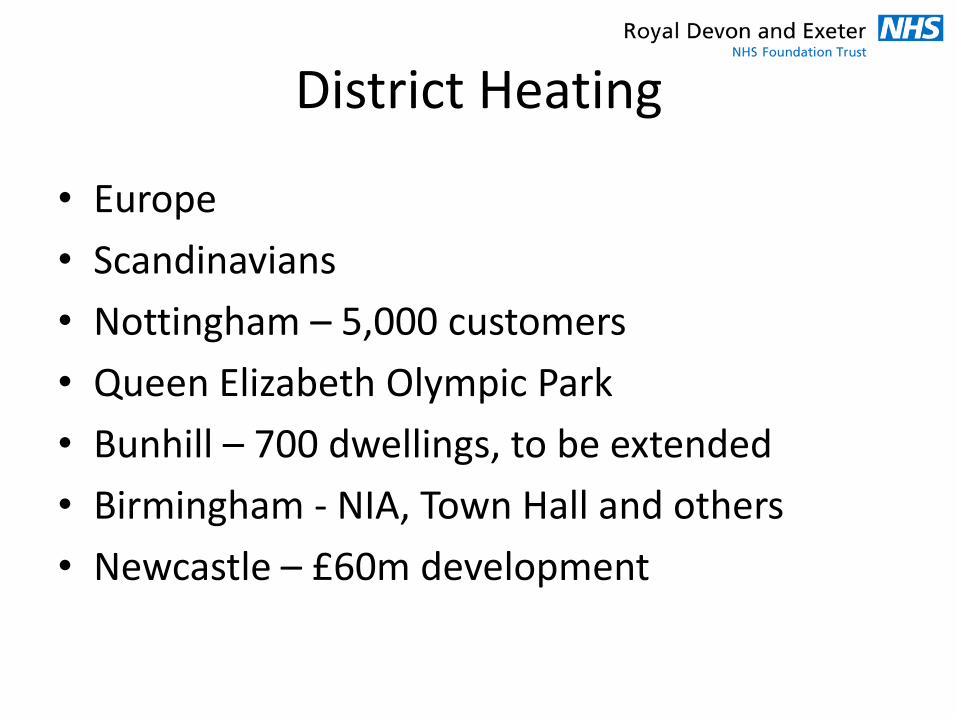
District Heating
• Europe
• Scandinavians
• Nottingham – 5,000 customers
• Queen Elizabeth Olympic Park
• Bunhill – 700 dwellings, to be extended
• Birmingham - NIA, Town Hall and others
• Newcastle – £60m development

Exeter District Heating
• 2008 – Cranbrook
• ECC climate strategy
• 2010 – Planning policies
• Energy from Waste
• 2012 – Feasibility study

Exeter Heat Loads

Exeter Energy Network
• Elevator Moment

Exeter Energy Network
• DECC/HNDU funding for detailed work
• MoU - Transparency and team work
• Technical
• Legal
• Commercial

Exeter Energy Network
• Studies:
• Validated previous work
• Presented viable models to use

Lessons
• Varied skill set in project team
• Well resourced
• Patience and awareness of scale
• Decision making
• CURRENT ECONOMIC CLIMATE
• Collaborative working

Is greenspace really good for you?
Links between natural environments, health and
wellbeing
Ben Wheeler, Senior Research Fellow


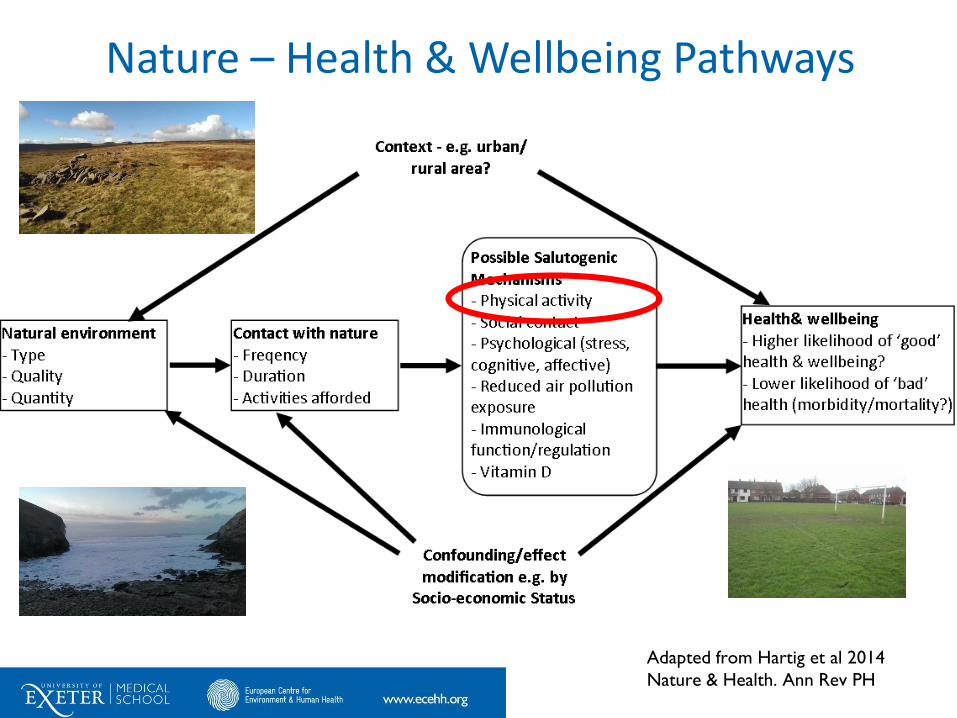
Nature – Health & Wellbeing Pathways
Adapted from Hartig et al 2014
Nature & Health. Ann Rev PH

Determinants of health
• Natural environments just
one complex component of
an even more complex
system of health
determinants
Barton, H., and M. Grant. 2006. A health map for the local human habitat. J R Soc Promot Health 126:252-253.

Some evidence

Greenspace and mortality Mitchell, R. and F. Popham "Effect of
exposure to natural environment on health
inequalities: an observational population
study." The Lancet 372(9650): 1655-1660.

Mitchell, R & Popham, F (2008). Lancet, 372, 1655-1660.
Greenspace & Inequality
• Availability of greenspace
may provide resilience
against health inequalities

British Household Panel Survey (1991-2008)
Urban Greenspace & Mental Health in England
Each year 5,000 households (n > 10,000) surveyed
Focused on 84% of households in “urban” areas
Mental Ill-health: General Health Questionnaire (GHQ-12) “Compared to
usual how have you been feeling in the last few weeks”
e.g. “able to cope”, “stressed”. The higher the score, the
higher the mental distress.
Subjective well-being: Life Satisfaction (LS): “How dissatisfied or satisfied
are you with your life overall?” with responses ranging
from 1 (Not satisfied at all) to 7 (Completely satisfied).
r(GHQ/LS) = -.50

-0.15
-0.1
-0.05
0
0.05
0.1
0.15
48% (-1SD from M) 80% (+1SD from M)
Co
mp
are
d t
o M
ean
Gre
en
Sp
ace
(6
4%
)
% of green space in local area
GHQ (mental distress)
Life Satisfaction
Error bars = 95%
confidence intervals
BHPS & Mental Health
Controlling for:
Individual Level - age, income, education, health, employment status, marital status, children, commute,
house type, house size. Area Level: Income, Employment, Education, Crime,
White, Alcock, Wheeler & Depledge (2013). Would you be
happier living in a greener urban area? Psychological Science.24,
920-928.

Mental well-being (Inverse GHQ: 1-12)
(N = 12,818; Obs = 87,573)
British Household Panel Survey (1991-2008; 27,284 Urban LSOA)
0
0.1
0.2
0.3
0.4
Green space Aged 16-25(v. 46-55)
Married No healthissue
Employed
Life Satisfaction (1-7)
(N = 10,168; Obs = 56,574)
Modelling the impact of moving from an LSOA 1SD < M Green
cover (48%) to one 1SD >M green cover (81%)
BHPS & Mental Health
Controlling for:
Individual Level - age, income, education, health, employment status, marital status, children, commute,
house type, house size. Area Level: Income, Employment, Education, Crime,
White, Alcock, Wheeler & Depledge (2013). Would you be
happier living in a greener urban area? Psychological Science.24,
920-928.
-1.4
-1.2
-1
-0.8
-0.6
-0.4
-0.2
0
0.2
High vs LowGreen space
Aged 16-25 vs.46-55
Married vssingle Healthy vs ill
Employed vsUnemployed

BHPS & Mental Health over time
T0: Move to a less green areaT0: Move to a greener area
-0.8
-0.6
-0.4
-0.2
0
0.2
0.4
0.6
0.8
T-2 T-1 T+1 T+2 T+3Inve
rse G
HQ
(C
hange fro
m b
aselin
e y
ear
T-2
)
Year relative to move
-0.8
-0.6
-0.4
-0.2
0
0.2
0.4
0.6
0.8
T-2 T-1 T+1 T+2 T+3Inve
rse G
HQ
(C
hange fro
m b
aselin
e y
ear
T-2
)
Year relative to move
Changes in (Inverse)GHQ scores compared to baseline (T-2) for moves to:
(a) a greener area and (b) a less green area (Error bars = 95% CIs).
N = 595, Obs = 2970 N = 470, Obs = 2350
Alcock I, White M, Wheeler B, Fleming L, Depledge M. Longitudinal
Effects on Mental Health of Moving to Greener and Less Green Urban
Areas. Environ Sci Technol. 2014; 48(2): 1247-55
Before/after moving home

What about ‘blue space’?

Fortescue-Fox, 1934, 1938. Lancet.
Margate Sea Bathing Hospital

Monitor of
Engagement with
the Natural
Environment
• Visits to natural
environments
• Outcomes (self-reported):
– Restoration/stress recovery
– Physical activity

Nature – Health & Wellbeing Pathways
Adapted from Hartig et al 2014
Nature & Health. Ann Rev PH
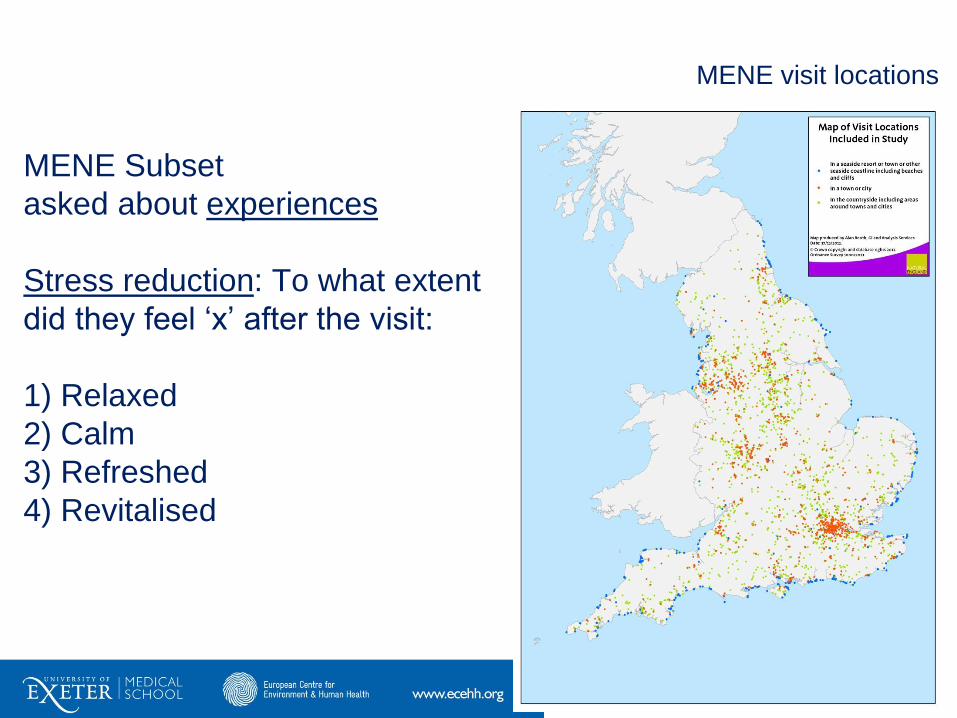
MENE visit locations
MENE Subset
asked about experiences
Stress reduction: To what extent
did they feel ‘x’ after the visit:
1) Relaxed
2) Calm
3) Refreshed
4) Revitalised

Stress reduction in different natural environments
3
3.2
3.4
3.6
3.8
4
4.2
4.4
Stre
ss r
ed
uct
ion
White, Pahl, Ashbullby, Herbert & Depledge (2013). Journal of Environmental Psychology, 35, 40-51
Error bars:
95% CI
Controlled for Who (Age, gender, SES) & What (activities, duration, who with, distance
travelled etc.)
Nature – Health & Wellbeing Pathways
Adapted from Hartig et al 2014
Nature & Health. Ann Rev PH

Do people who live near the coast exercise more?
MENE n = 183,755 – “How many days a week of ≥ 30mins
exercise” (Recommendations: 5 or more)
White, Wheeler, Herbert, Alcock & Depledge
(2014). Preventive Medicine, 69, 135-140
Controlling for area
(income etc.) and individual
controls (age, gender, dog
ownership etc).
Error bars:
95% CI
ref
0.94
0.96
0.98
1
1.02
1.04
1.06
1.08
1.1
1.12
1.14
1.16
<1km 1-5km 5-20km >20kmOd
ds
Rat
io f
or
mee
tin
g p
hys
ical
act
ivit
y gu
idel
ines
Home (LSOA) distance from the coast

‘Geo-narratives’: In-depth understandings of the value of wellbeing experiences in nature
Bell, S. L., Phoenix, C., Lovell, R., & Wheeler, B. W. (2015). Using GPS and geo-narratives: a methodological approach for understanding and situating everyday green space encounters. Area, 47(1), 88-96.
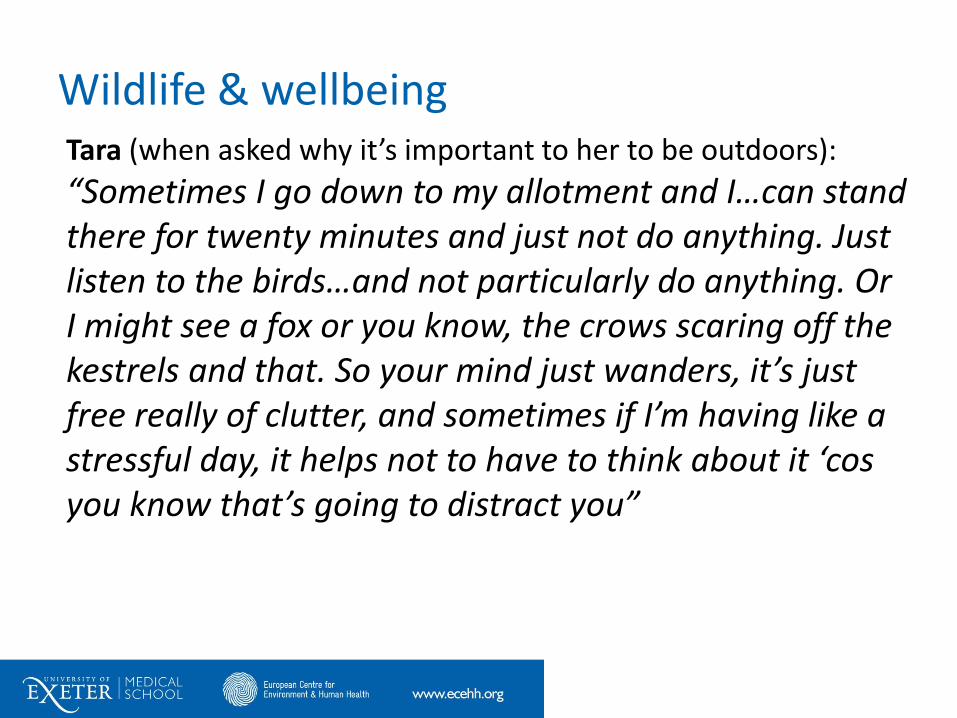
Wildlife & wellbeingTara (when asked why it’s important to her to be outdoors):
“Sometimes I go down to my allotment and I…can stand there for twenty minutes and just not do anything. Just listen to the birds…and not particularly do anything. Or I might see a fox or you know, the crows scaring off the kestrels and that. So your mind just wanders, it’s just free really of clutter, and sometimes if I’m having like a stressful day, it helps not to have to think about it ‘cos you know that’s going to distract you”

Bringing wellbeing in stressful circumstances
Grace “As a child I escaped into nature. I’d escape from home and go and lay in a field or up a tree. We had a big hill just behind our house…nobody ever went up there, and it led onto a sort of coppice and hedge with trees, and I used to go there…and just lay on the ground. I don't know what I did…the grasshoppers would jump all over me and I just felt peaceful, mmm, nobody could get at me…I mean this was during the war and life was a little bit difficult anyway”.


Health interventions: conservation
activities to promote health (green
prescriptions)
Positive processes:
• Mental health
• Quality of life
• Sense of achievement
and contribution
• Contact with natural
environment
Understanding how environmental
enhancement and conservation activities
may benefit health and wellbeing: a
systematic review. R Lovell, et al 2015
BMC Public Health 15 (1), 864
School for Public Health Research

‘Greenspace’ in the NHS?
• Design of health and social care environments
Shackell, A. and Walter, R. (2012). Greenspace design for health and well-being. Forestry Commission Practice Guide.

Shackell, A. and Walter, R. (2012). Greenspace design for health and well-being. Forestry Commission Practice Guide.
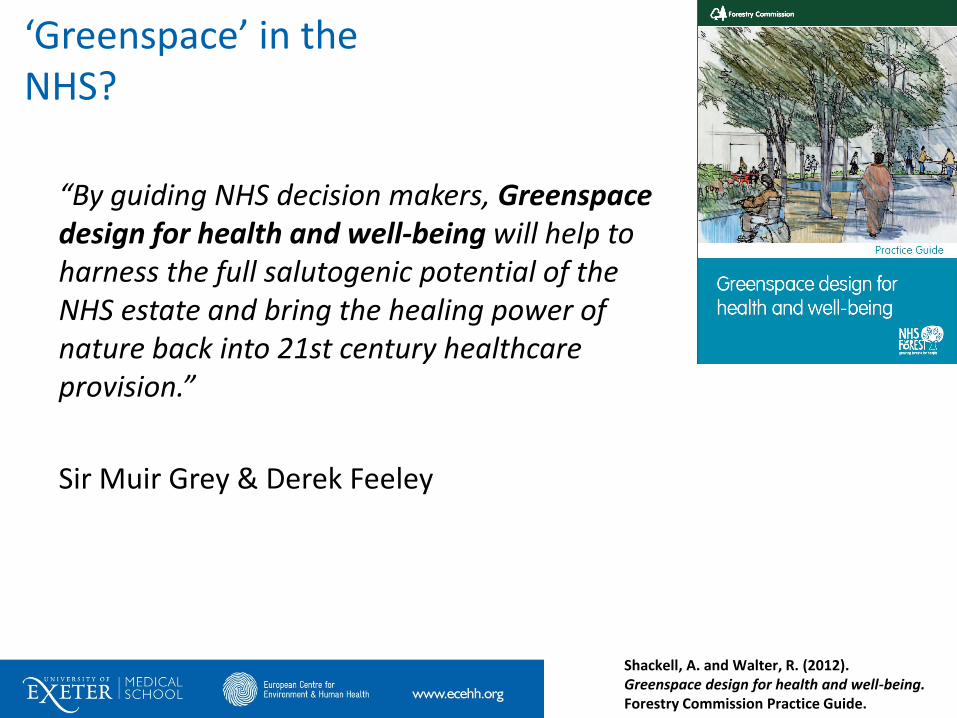
‘Greenspace’ in the NHS?
“By guiding NHS decision makers, Greenspace design for health and well-being will help to harness the full salutogenic potential of the NHS estate and bring the healing power of nature back into 21st century healthcare provision.”
Sir Muir Grey & Derek Feeley
Shackell, A. and Walter, R. (2012). Greenspace design for health and well-being. Forestry Commission Practice Guide.

View through a window…
Ulrich, R. S. (1984). View Through a Window May
Influence Recovery from Surgery. Science, 224, 420-421.
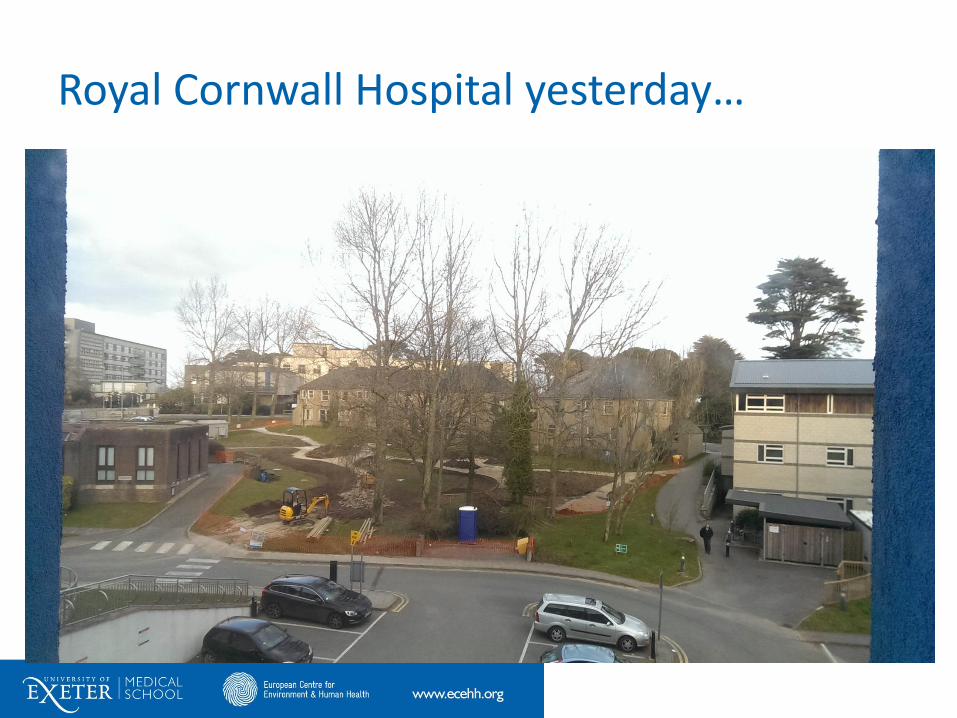
Royal Cornwall Hospital yesterday…

Key issue?
What are the opportunities to capitalise on natural
environments to support and improve human health
and wellbeing (whilst not degrading) them?
a) Prevention – health promotion?
b) Therapeutic use (‘green prescriptions’?)
c) Health and social care environments (for staff as well as
patients)
[Need evidence]

Opportunity: University of Exeter Medical School
MSc in Environment & Human Health
http://medicine.exeter.ac.uk/

Beyond Greenspace blog http://beyondgreenspace.wordpress.com/
Thanks to colleagues
Mat White
Becca Lovell
Sarah Bell
Sahran Higgins
Mike Depledge
& the rest of the team
[email protected]@benedictwheeler

Climate Change, Extreme Events
and Health
Air Pollution and Climate Change Group,
Environmental Change Department,
Centre for Radiation, Chemical and Environmental Hazards (CRCE)
NHS Sustainability Day 2016 - Exeter Road Show
Dr Bernd Eggen

Outline
Climate change & extreme events
Health and Care System Adaptation Report 2015
Heat and cold effects on health
Air pollution and climate change
Extreme events and health
Environmental health and sustainability
Climate Change and Health

Climate Change & Extreme Events
(the sciency bit !)
48 Climate Change and Health

The Rise and Rise of CO2 Emissions
49

The Rise and Rise of CO2 Emissions
The annual growth rate of atmospheric carbon dioxide measured at
NOAA’s Mauna Loa Observatory in Hawaii jumped by 3.05 parts per
million during 2015, the largest year-to-year increase in 56 years of
research.
In another first, 2015 was the fourth consecutive year that CO2 grew
more than 2 ppm, said Pieter Tans, lead scientist of NOAA's Global
Greenhouse Gas Reference Network.
“Carbon dioxide levels are increasing faster than they have in hundreds
of thousands of years,” Tans said. “It’s explosive compared to natural
processes.”
So far, pledges / commitments at COP only “hot air” …
50

Global annual mean temperature anomaly

Temperatures in the UK in 2014
Every month except
August significantly
warmer than average;
Did this register with
general public ?
52

Temperatures in the UK in 2015
Most of year around average; Nov & Dec significantly warmer, and wetter !
South-westerly air flow brought mild & very wet conditions.
53

Meanwhile, in Continental Europe

Mitigation is vital, but we need to
prepare for inevitable climate change
observations
projections
2003
2060s
2040s
Te
mp
era
ture
an
om
aly
ove
r E
uro
pe (
wrt
19
61
-90
)
°C
Hadley Centre
We are already
committed to this from
past emissions alone

Climate Change &
UK Law & Actions
e.g.
Health and Care System
Adaptation Report 2015
56 Climate Change and Health

Climate Change Act
2008
Climate Change Risk
Assessment
2012
National Adaptation
Programme
2013
Committee on
Climate
Change
Adaptation
Economic
Assessment
Committee on
Climate
Change
Committee on
Climate
Change
Committee on
Climate
Change
Health Effects
of Climate
Change 2012
UK
CP
09
UK
CIP
02
Health Effects
of Climate
Change 2002
Health Effects
of Climate
Change 2008
Legislative Framework: Moving
from evidence to policy
Climate Change and Health

Adaptation Report for the Healthcare System
• Developed jointly by SDU, PHE & cross-system
group; published Sep 2015
• Download URL http://www.sduhealth.org.uk/arp
58 Climate Change and Health

Heat and Cold Effects on Health
… several ingredients
needed …
59 Climate Change and Health

0
20000000
40000000
60000000
80000000
100000000
120000000
0
2000000
4000000
6000000
8000000
10000000
12000000
14000000
16000000
NE
NW
YH
EM
WM
EE
LN
SE
SW
WA
SC
NI
UK
Population TrendsUK population is currently 62M rising to 69-86M (2050s)
& 72-113M (2080s)
Climate Change and Health

Age Distribution
(Source: ONS)

Temperature Effects• Increases in annual mean temperatures of around 2 to 5oC under a
medium emissions scenario (A1B) by 2080.
• Quantification of preventable heat- and cold-related mortality and
morbidity, focusing on vulnerable population groups.
• Understanding the role of the Urban Heat Island in exacerbating the
impact of climate change on mortality rates.
• Improved understanding of the role of planned adaptation strategies
and long-term physiological changes.
• Provision of input to public health plans, and evaluation of their
effectiveness.
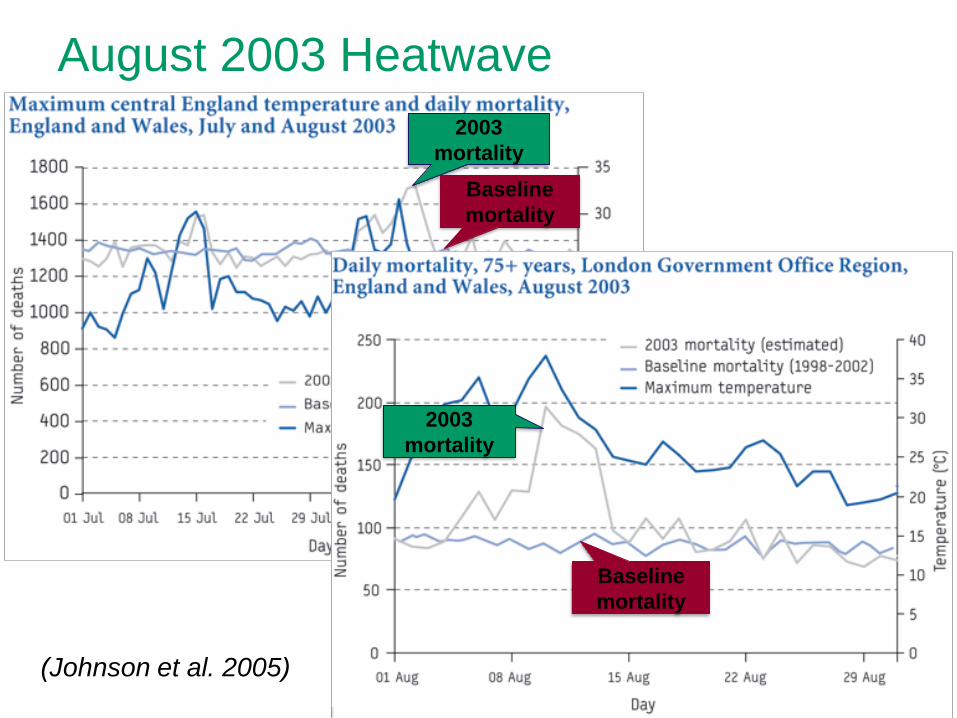
August 2003 Heatwave
2003
mortality
Baseline
mortality
2003
mortality
Baseline
mortality
(Johnson et al. 2005)

Climate Change and Health
0
2000
4000
6000
8000
10000
1
2
3
4
5
-10 -5 0 5 10 15 20 25 30
Agg
rega
te c
ou
nt
of
day
s
Mea
n d
aily
dea
ths
(pe
r 1
00
K p
op
ula
tio
n)
Mean Temperature oC
England & Wales deaths
days
Cold effects Heat effects
Temperature Effects
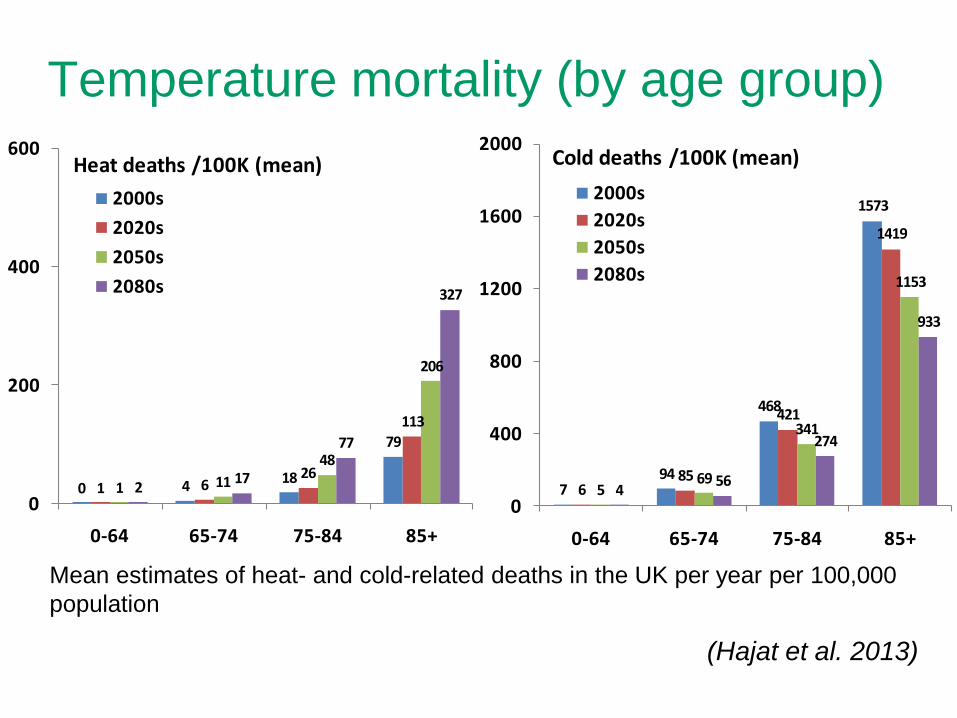
Temperature mortality (by age group)
794
468
1573
685
421
1419
569
341
1153
456
274
933
0
400
800
1200
1600
2000
0-64 65-74 75-84 85+
Cold deaths /100K (mean)
2000s
2020s
2050s
2080s
0 418
79
1 626
113
1 11
48
206
217
77
327
0
200
400
600
0-64 65-74 75-84 85+
Heat deaths /100K (mean)
2000s
2020s
2050s
2080s
Mean estimates of heat- and cold-related deaths in the UK per year per 100,000
population
(Hajat et al. 2013)
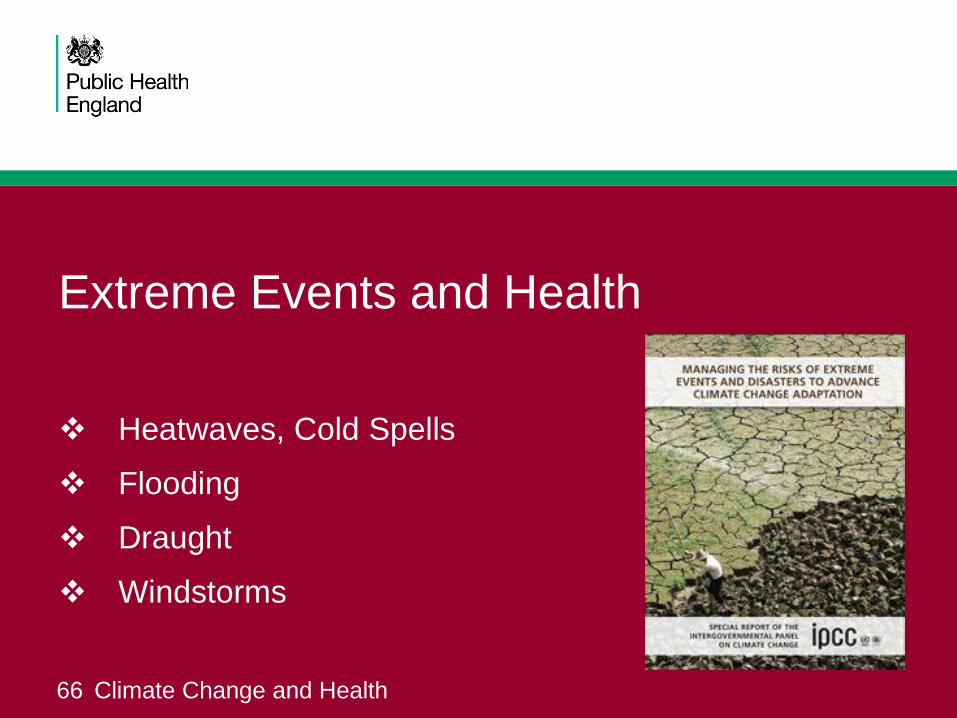
Extreme Events and Health
Heatwaves, Cold Spells
Flooding
Draught
Windstorms
66 Climate Change and Health

Floods (and Droughts) • Climate change is likely to affect river and
coastal flood risk.
• Some areas are particularly vulnerable to
coastal floods: South Wales, NW Scotland,
Yorkshire and Lincolnshire, East Anglia and
Thames Estuary.
• Understanding how floods (and droughts)
affect both physical and mental health of
populations.
• Development and evaluation of public
health action plans, advice and guidance.

Changes in Precipitation – Winter

River Flow between
Dec 2013 – Feb 2014
69
River-flow accumulation map for
December 2013 to February 2014.
Flows are expressed as a
percentage of long-term average
flows. Note: new period-of-record
maxima are circled with arrows.
Muchan et al, Weather, Feb 2015

Flooding
70
Somerset Levels, winter 2014
Somerset County Council and
Sedgemoor District Council
declared a major incident (24 Jan)
17,000 acres (6,900 ha) of
agricultural land having been
under water for 1month+
village of Thorney abandoned
Muchelney cut off by flood waters
for almost a month
over 600 houses flooded

Effects of Flooding on Mental Health
71
Experiencing a flood can be frightening, and the activities
of normal life can be disrupted. For most people, feeling
temporarily distressed does not interfere with their abilities
to cope with the process of recovery.
However, it is important not to underestimate the stress and
strain of being flooded and cleaning up after floods. Take
the time to consider your and your family’s mental health
and well-being. Do not overdo it when cleaning up, and
remember that tiredness, difficulty sleeping and anxiety are
normal in these circumstances.
Primary & secondary stressors can play a role

Effects of Flooding on Mental Health
72
While the experience of a flood can be distressing, events that occur after a flood can also be a source of stress. They include:
• difficulties accessing continuing healthcare and prescription medications; difficulties with getting healthcare for new health problems
• disruption to normal household activities and separation from family and friends
• loss of school facilities and interrupted attendance at school
• feelings of loss of control and worry that flooding may reoccur
• seeking compensation, recovery and re-building of homes, submitting an insurance claim, loss of employment and/or income, and loss of physical possessions
Only a minority of people are at risk of developing mental health problems

Environmental Health & Sustainability
73 Climate Change and Health

Health Co-benefits of Mitigation• Mitigation policies may achieve health, GHG
and economic benefits simultaneously
(‘the triple bottom line’).
• Understanding the health co-benefits of
policies to reduce GHG emissions in
transport, energy generation and food
production.
• Evaluation of the health effects (both positive
and negative) of emerging ‘low carbon’
technologies and biofuel policies.
• Healthy-Polis: International Consortium for
Urban Environmental Health & Sustainability http://www.healthy-polis.org/

Conclusions • Climate change is likely to pose significant challenges to public health
in the UK by aggravating existing public health problems.
• Some UK regions (flood risk and densely populated areas) and
population groups (elderly, deprived, ill) are more vulnerable.
• Research needed on current and future interactions between climate,
and environmental and behavioural drivers that affect public health.
• The environmental public health sector needs to respond to these
challenges by:
strengthening modelling, monitoring and surveillance systems
improving the resilience of public health infrastructure
improving the assessment & communication of climate related risks
developing the evidence on health benefits of climate change
adaptation and mitigation

Acknowledgements
• Climate change, extreme events and associated research in PHE/CRCE
• Department of Health (DH); Sustainable Development Unit (SDU)
• Department for Environment, Food and Rural Affairs
• NHS Sustainable Development Unit
• UK Climate Impacts Programme
• UK Met Office
Climate Change and Health

Climate Change and Health

Air Pollution and Climate Change
78 Climate Change and Health

Air Pollution
Climate Change and Health
• Understanding how climate change interacts with ground level ozone
and other climate sensitive air pollutants.
• Investigation of the range and extent of health effects of ozone,
including those associated with chronic exposure.
• Understanding how vulnerable people (e.g. those with pre-existing
respiratory illness) need to be protected.

Annual mean Summer mean
Change in ground level O3 simulated by EMEP4UK for a +5oC increase in
temperature relative to the base simulation for meteorological year 2003.
Ground Level Ozone
(Heal et al. 2013)
Climate Change and Health

Ozone Mortality Burdens (no threshold)
(Heal et al. 2013)
Wales: 677 700 782 815 765

Sian McCartCorporate Affairs


Mission: To reduce global water
consumption by
1%

Water efficiency experts for 20 years
Advisors to the Government since 1999
Lead consultants of Watermark


£70 million

Major improvements
Metering
Billing
Reporting


Wider ranging
Greater detail
Robust

£500 million per annum in lost
revenue, which if saved coincides with a
30% reduction in water use

London’s Total Annual Water Consumption

3 billion Cups of Tea

…or filling this room 9 million times over

What this means for the NHS
10 million m3 per year
£24 million


500Different Building
BenchmarkClassifications

Why do we need you?

3 years free bill validation
Electronic water consumption profiles
Identification of high consumption anomalies
A benchmarking toolkit

More accurate reporting on water
Prepare for deregulation from 2017 and;
Tools to potentially reduce your water bill by a third

3 Simple Steps
to Participate

We provide you with an email to send
to your water supplier
They send your future bills to us for
benchmarking assessment and
validation
Within 24 hours of receiving them, we
send your now validated bills onto you

Climate Change
Rapid Population Growth
Economic Development


True water management
- comprehensive approach

Introduction
Knowledge sharing and case studies
Summary of the loan application process
To demonstrate how Salix can help NHS England
Our goals for today

Introduction to Salix funding model

Who we are
Established in 2004
Independent, publicly funded, not-for-profit company
100% interest-free capital finance for the public sector
Funded by DECC, Scottish and Welsh Government, EfA and DfE
Support public sector bodies such as local authorities, educational establishments and NHS Trusts
Working throughout England, Wales, Scotland and N. Ireland

Minimise wasted energy – controls and awareness raising
Efficient conversion –installing energy
efficient technology
Salix focus capital investment to
reduce energy and save carbon
Energy hierarchy
Onsiterenewable
energy

Loan funding by public sector body type
40%
30%
12%
10%
4%3%
1%
England between April 2010 - March 2015
Local Authority
Higher EducationInstitute
National Health Service
School
Further EducationInstitute
Academy
Emergency

Salix Activity within the NHS

Top 10 NHS Clients Imperial College Healthcare NHS Trust
Northern Devon Healthcare Trust
Hinchingbrooke NHS Trust
Bradford Teaching Hospitals NHS FT
Princess Alexandra Hospital NHS Trust
Northampton General Hospital NHS Trust
St George’s Hospital
Poole NHS FT
Salisbury NHS FT
Ealing NHS Hospital Trust

Energy usage in the NHS
245 eligible organisations spend over £634m on energy and utilities 1
Average of £2.5m per hospital 1
Typically 3rd largest expenditure
Our NHS clients have saved on average £200k per year 2
1. Health and Social Care Information Centre, Hospital estates and facilities statistics 20152. Salix Finance – loan applications since 2008

Knowledge sharing and case studies

Knowledge sharing and case studies
Case Studies
Project Knowledge Slides
Social Media
News & Blog

Salix project case studies

Northampton General Hospital - case study
Pre project conditions –
• Mixed 40 acre estate with buildings ranging in age from 1793 to 2008
• Issues with BMS control, heating networks, pipework lagging, heat loss, and inefficient lighting
Salix funded solution –
• Total project cost £381k
• Cavity wall and pipework insulation, draught proofing, BEMS upgrades, pool covers, and T5/LED lighting
• 3 year payback
Project overview Salix helped Northampton General Hospital to deliver a suite of new projects across their estate saving the hospital £127,484 per year

Project knowledge slides
Sharing of knowledge between clients
Completed projects
Before and after
Supporting comments
experiences
lessons learnt
supplier
contact details

SOLVING ENERGY EFFICIENCY FINANCE IN THE PUBLIC SECTORWWW.SALIXFINANCE.CO.UK
Salix application process

SOLVING ENERGY EFFICIENCY FINANCE IN THE PUBLIC SECTORWWW.SALIXFINANCE.CO.UK
Online application process

SOLVING ENERGY EFFICIENCY FINANCE IN THE PUBLIC SECTORWWW.SALIXFINANCE.CO.UK
Six simple steps to apply
1. Log on to the Salix website salixfinance.co.uk/loans
2. Select the NHS loans page
3. Complete the compliance tool with project details
4. Complete an online loan application
5. Submit your application online
6. Salix will do a technical assessment

Summary
NHS Trusts and Foundation Trusts – no maximum loan amount
Help achieve energy and carbon reduction targets
Long-term funding plans, SDMPs, estates strategies
Reduce energy bills at your Trust
Refreshments and Networking
#Dayforaction
Title bar
Body text
○ Bullet text
Carillion HealthNHS Sustainability Day Conference, Exeter

What is Facilities Management…?

People at the heart of what we do.
Focussing on our people so that they
can focus on your people…
Carillion has an engaged and
empowered workforce that
understands the NHS imperative for
a sustainable operation.

Getting it right first time…
Everything costs money and everything draws upon the limited resources we have.
Carillion understands the crucial importance
in getting the job right first time.
○ Minimising the use of chemicals
○ Minimising the amount of waste
○ Minimising the amount the of down time
○ Minimising the need for repeating the jobs

Don’t Walk By!
The number of Don’t Walk By reports recorded and actioned within
Carillion each year, globally, is in the region of 1.5 million!
Which represents, potentially, 1.5 million times that the workplaces we
operate in have been improved. But it is also 1.5 million times that we
know health, safety, environmental impact and quality have been
discussed in our workplaces.
Which means that 6000 times every day we are a making a
contribution to creating sustainable workplaces.

Helping you help others…
Carillion understands our stake in
the wider Sustainability agenda.
The health and welfare of our wider
society is paramount. Clearly the NHS
is in the vanguard with this. But
Carillion is there facilitating and
driving standards where we can.

Our People
People

Looking after our people…
Carillion recognises the need for a healthy
workforce. Recently we have brought a greater
focus to the health aspect of the Health and
Safety agenda – we call this Health like Safety.
We want our people to be in the work place
being productive.

Sustainability within our Values
Sustainability is at the heart of the Carillion
business and at the core of our values.
○ We care
○ We achieve together
○ We improve
○ We deliver
Sustainability in facilities management is all
about the people.


The business case for reuse:Daniel O’ConnorHead of Customer [email protected]@WarpIt_

Overview
Financial
Environment
Social
Overview
NHS real case studies
Free resources How to set up your own
Business case templates
Legal templates

Value
“It is only a waste when it is in the wrong place”

The Enemy
Time
Space
Distance

Priority?
Reuse has a much great impact than recycling

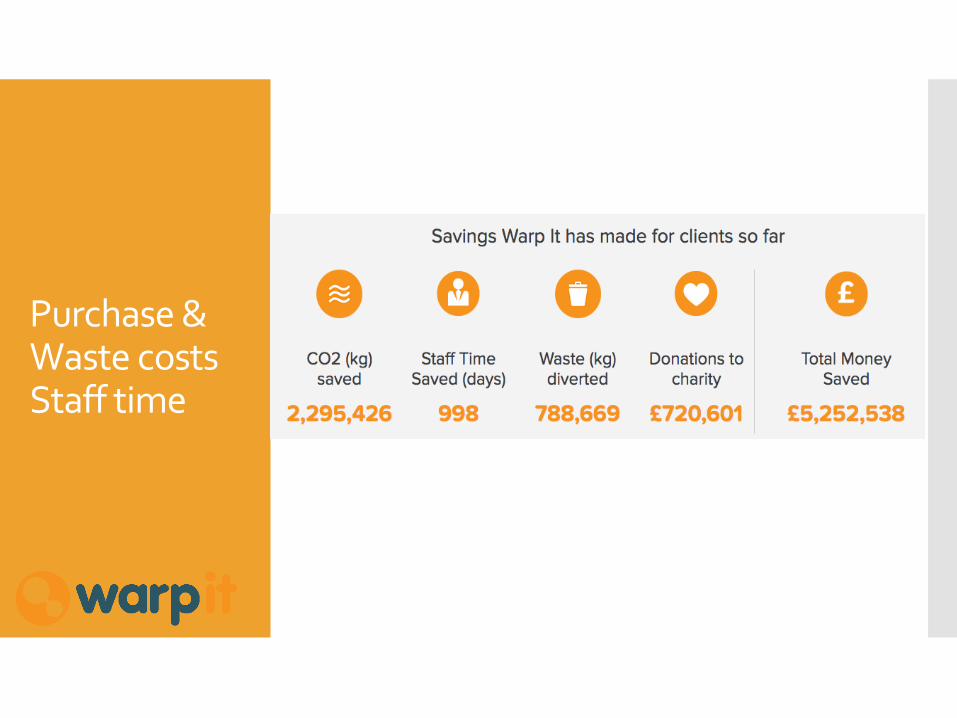
Purchase & Waste costs Staff time

Supply Chain Impacts
60% NHS Carbon from supply chain

#

Supply Chain
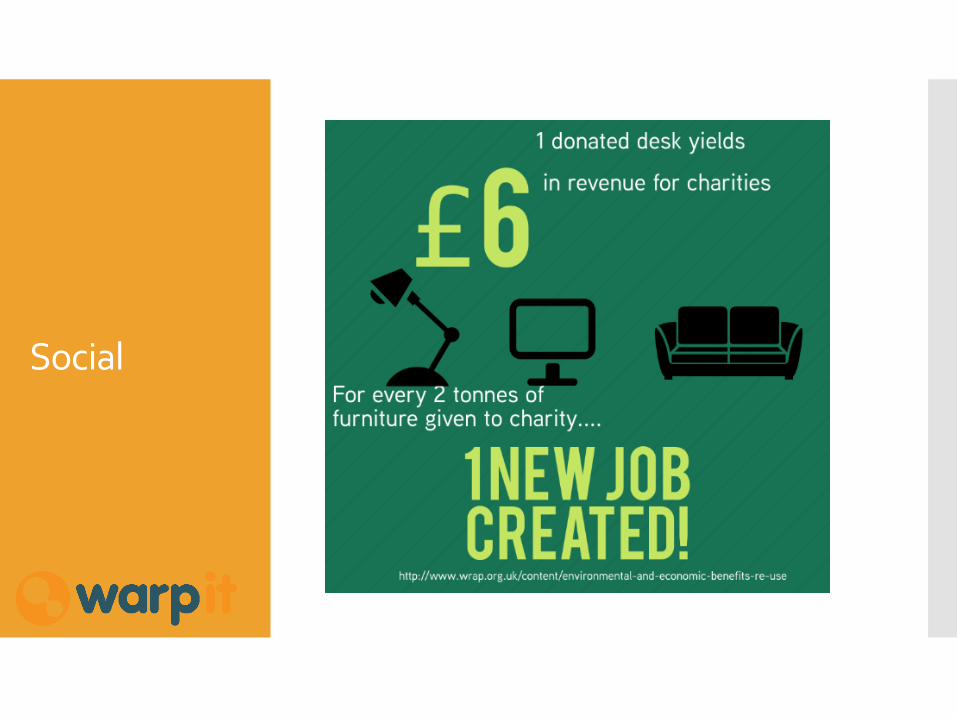
Social

Internal Collaboration

Internal Collaboration

Internal Collaboration

Procurement & waste avoidance benefits

Internal Collaboration

External Collaboration

Friend requests

External Collaboration

External Collaboration
Aber Unisave £10K in 1st trade!! (audio room)

Metrics from NHS Tayside

Metrics from NHS Tayside

Metrics from CWP

Metrics from CWP
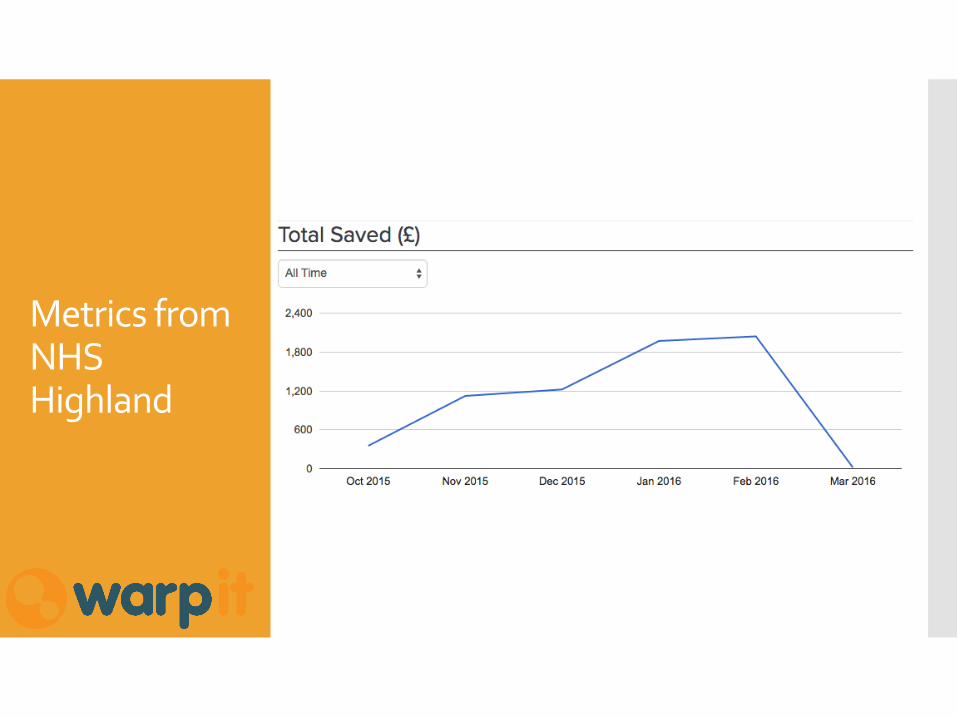
Metrics from NHS Highland

Metrics from GMW

Top 10’s

Win win win

Win win win

Win win win

Take home tip
Explore developing a reuse target
>Track your savings
>>Put more resources into reuse

Free resources
Freegle
Warp It (is free really)
Legal document for donation to 3rd parties
Business case for reuse system

GetWarpIt.com
Book a callback!

Engaging with Organisational Sustainability
What’s the problem?
What is sustainability?
Strategic planning for sustainability
What this might mean in practice? -Engagement
Who are we?
• Low Carbon Europe – work with a range of clients to deliver sustainable outcomes
• Energy and carbon management specialists
• Strategic sustainable development planning and organisational change

Source: Jae Mathers, Carbon Free Group, IEMA Presentation, 03/09/15
What is the problem?

What is sustainability?
"Meeting the needs of the present generation without compromising the ability of future generations to meet their needs." Bruntland Report (1987)

From this…
…to this
It’s common sense really…

Strategic planning for sustainability

What might this mean in practice? – Board Level
• Sustainability Steering group oversees progress of SDAP
• Agree dedicated resource to deliver sustainability
• Building partnerships to deliver effective early interventions, support community recovery and reduce readmissions
• Consider the use of technology as patient empowerment tools
• Mobilise external organisations to deliver improvements to support the Trust’s aims
• Consider future service changes (demographics) or adaptation needs (resilience)

Initial steps…
• Informal discussions to understand each service area and implications/feasibility for sustainability
– What are the quick wins?
– What might be time or budget constrained?
– Baseline data, monitoring and evaluation requirements
– Training needs
• Initiation of Sustainability Steering Group to develop the SDAP and oversee its implementation
• Reporting of SDAP to the Board annually

What might this mean in practice? – Staff Engagement
• A systematic approach to recruitment • Developing a network of champions • Managerial approval to allow staff time to participate• Develop and run dedicated workshops focussing on the
context of your Trust • Departmental Action Planning & Working Groups
– Clinical pathways – Sustainability Aspects (Transport, Water, Energy, Waste, Food &
Procurement)
• Seeing is Believing Tours & Action Planning Updates • Evaluation & Monitoring• Sharing & Celebrating – NHS Sustainability Day

What might this mean in practice? – Communities
• Partnership working
– Schools, Colleges, Universities
– Local Government
– Local Businesses
– Charities
• Health & Wellbeing Projects
• Patient Surveys and Focus Groups

Any questions?
Sarah MooreSustainability Consultant
T: (01273) 862582M: 07712 [email protected]
Low Carbon Europe LtdQueensberry House, 106 Queens Road, Brighton, BN1 3XF

Convert what you throw away into what you need
Rod Fountain
CEO and founder

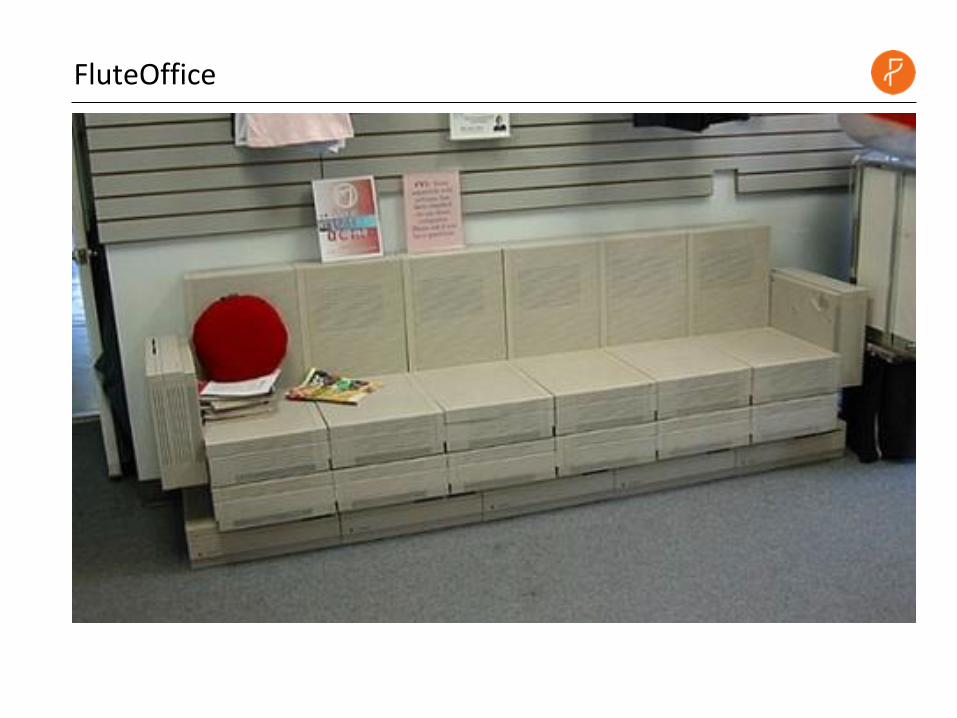
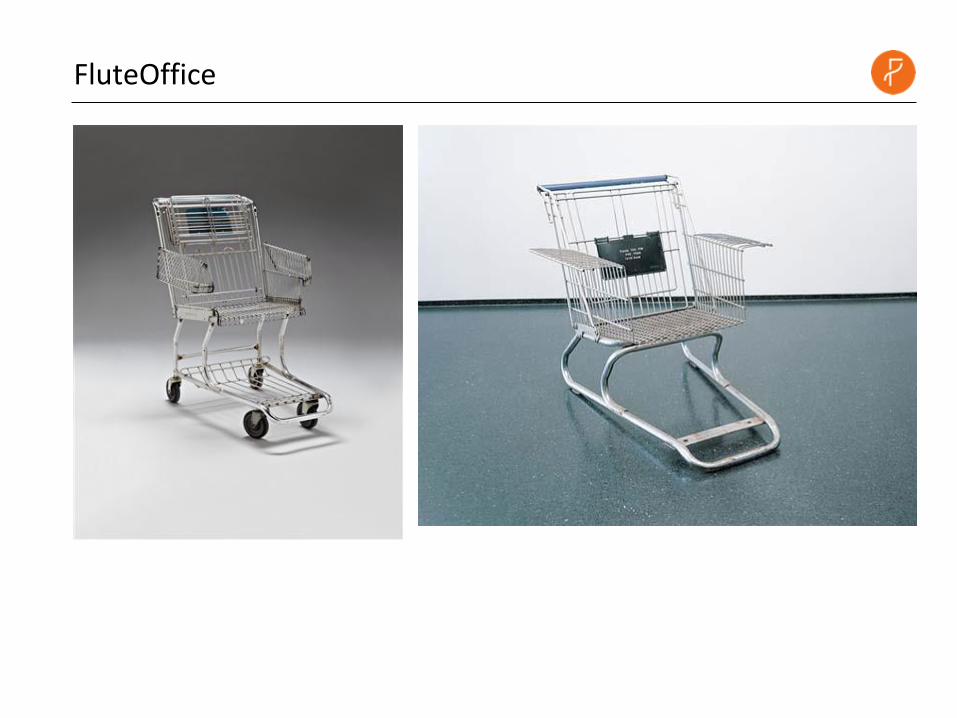
we take this
and make this
FluteOffice
we take this
and make this
FluteOffice

we take this
and make this
FluteOffice
we take this
and make this
FluteOffice

we take this
and make this
FluteOffice
1 tonne of waste £50
1 tonne of upcycled waste £10,000+

we take this
and make this
FluteOffice

we take this
and make this
FluteOffice

we take this
and make this
FluteOffice

and make this
FluteOffice

and make this
FluteOffice

and make this
FluteOffice

and make this
FluteOffice

and make this
FluteOffice

and make this
FluteOffice

and make this
FluteOffice
Join the
dots!1
2

and make this
FluteOffice
we take this

and make this
FluteOffice
Medical Records Office
Estates Office
Post room
Anti-Coag Office
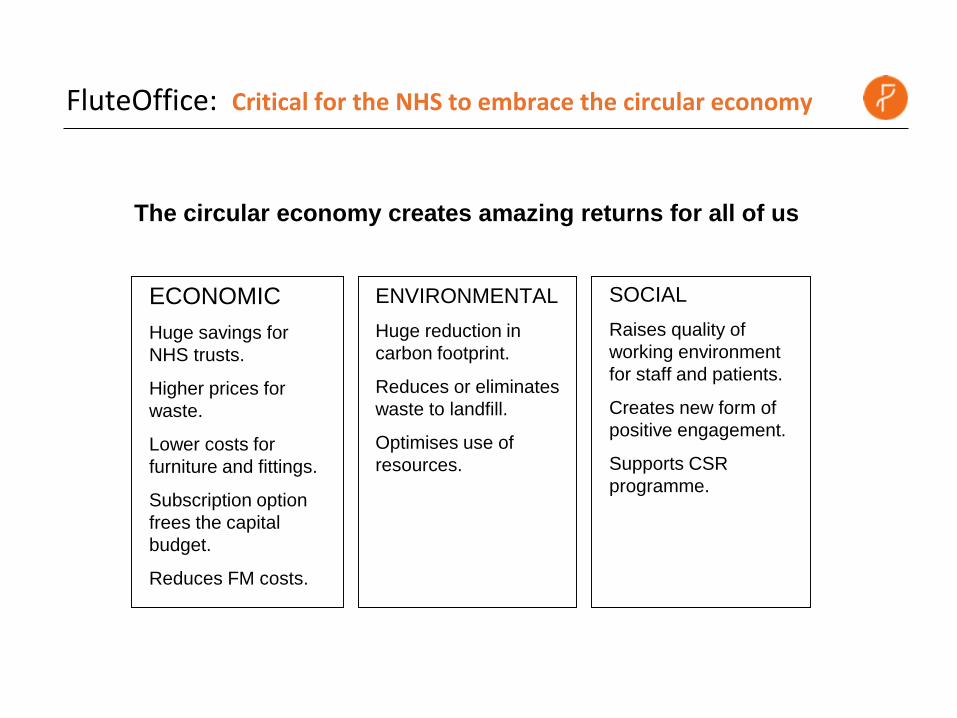
The circular economy creates amazing returns for all of us
ECONOMIC
Huge savings for
NHS trusts.
Higher prices for
waste.
Lower costs for
furniture and fittings.
Subscription option
frees the capital
budget.
Reduces FM costs.
ENVIRONMENTAL
Huge reduction in
carbon footprint.
Reduces or eliminates
waste to landfill.
Optimises use of
resources.
SOCIAL
Raises quality of
working environment
for staff and patients.
Creates new form of
positive engagement.
Supports CSR
programme.
FluteOffice: Critical for the NHS to embrace the circular economy

“The FluteOffice solution represents the future for our Trust. The opportunity
exists to save many millions of pounds for the NHS if it embraces the circular
economy across the country.”David Sissling CEO Kettering General Hospital NHS Foundation Trust
“We find the FluteOffice model utterly compelling and we intend to roll it out
throughout our estate.”Martin Riley Managing Director Medway Community Healthcare
“We want everyone who works for us to be proud of what we are doing to make
their working environment much better and at the same time much more
environmentally responsible and sustainable. We are all very excited about the
future potential of working with FluteOffice.”
Julie Sherlock, Board Lead Customer Care & Facilities, Your Healthcare
Kingston
FluteOffice: Everyone loves it!

FluteOffice: Example of the closed loop model for the NHS
We take waste cardboard from NHS trusts and use it to make
stunning furniture and interior office products….
….which we then resupply to the
NHS for use in its buildings for as
long as required….
….and when they aren’t
needed anymore we take them
back and remanufacture into
new products for resupply to
the NHS…….

and make this
FluteOffice

FluteOffice

FluteOffice

Better, much better,does not have to cost the earth.
FURTHER INFORMATIONRod Fountain [email protected]+ 44 (0) 7957 424976
FluteOffice LtdThe Studio, Gardeners Cottage,Jayes Park Courtyard, Ockley,Surrey, RH5 5RR+ 44 (0) 1306 400070
www.fluteoffice.com 215

Version 1

What is Sustainability?
SUSTAINABILITY = THE ABILITY TO CONTINUE DOING SOMETHING INDEFINITELY
....or put another way:
‘Living within our means’
Or
‘making the most out of what we’ve got’
Or
‘waste not want not’

Our Environmental Objectives• To reduce the carbon footprint of each of our businesses
• To reduce our reliance on natural resources
• To become a zero waste to landfill business
• To improve our environmental and compliance performance
Our Group Sustainability report for 2015 highlights the achievements Stericycle have made with these objectives

Energy generation –Knostrop Incinerator Leeds
A true first in the Clinical waste industry
• The generator uses innovative power generation technology that enables it to produce ‘free’ electricity using our steam and is the first of its kind in the clinical waste industry.
• The Heliex System is a novel rotary device that recovers energy from the steam generated during the incineration process.
• The systems currently produces 100kw of energy 1/3 of the whole facility’s energy usage reducing costs and reducing CO2 emissions
• Our new incinerator in Avonmouth, Bristol will also have a HeliexSystem

Sharps Management Service• SRCL wash line is unique in the sector, it is a fully automated wash line
using state of the art robotics
• Powered by the neighbouring Knostrop incinerators, utilising the steam and energy generated to give a true sustainable solution
• On site autoclave processes single use metal instruments which are then sent for recycling rather than incineration


• Sustainable service that brings innovation to sharps management
• It’s a service, not just a container!
• A fully integrated service that:
– Reduces costs 10-20%
– Reduces needle stick injuries
– Much more of a sustainable service –used 600 times
– Saves time
– Free up storage space
What is it?

UN Approved Reusable Containers
7.5L Vertical Drop Container
The Sharps Containers are colour coded in line with HTM The Safe Managementof Healthcare Waste.

• Robust & easy to manoeuvre
• Curved edges and minimal bolts for easy cleaning
• Optional work area/Instrument tray holder
• Braked 65mm sealed medical grade casters
• Robust nylon modified polyester coatings
• Weighted low centre of gravity base for
greater stability
Point of patient care –transport trolley

To date 95 individual hospitals, pharmacies and
Laboratories are using SRCL’s Bio-Systems Service
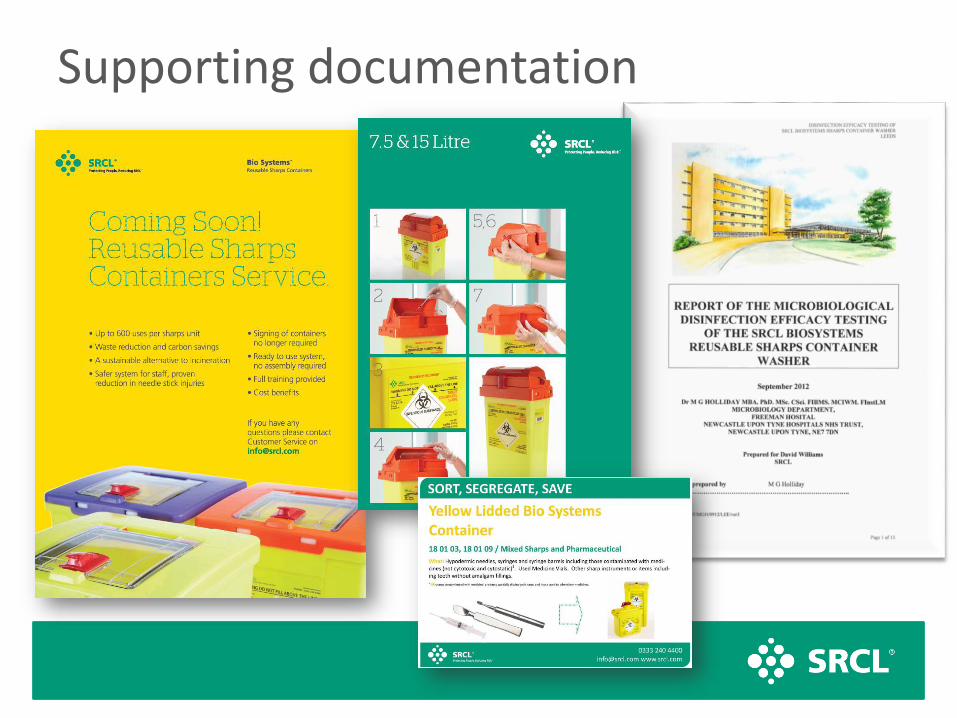
Supporting documentation

• Reduces costs
• Reduces waste
• Reduces needle stick injuries
• Saves space
• Frees up hospital staff
• All containers are puncture resistant
• Environmentally sustainable
• Full training provided
Summary of the benefits

Join usJoin us

Healthy Eating
“The Route to Health and Wellbeing”
“Why we need healthy new proteins with
a low environmental impact”

Who is Tim Finnigan???
• Married, two children (grown up)

Who is Tim Finnigan???• Married, two children (grown up)• Likes running up hills and likes a pint• 30 years R&D in Food and Drink• PhD Canola protein, Government food research, APV,
General Foods and...

I’D LIKE TO LOOK AT THREE THINGS
WHY WE NEED HEALTHY NEW PROTEINS WITH A LOW ENVIRONMENTAL IMPACT.
THE GOOD NEWS THAT ‘IT CAN BE DONE’ - QUORN AS AN EXAMPLE
HOW WE FEEL WE CAN HELP, AND WHAT WE’VE BEEN DOING

The 1960s was a time of
huge achievements...
But First some context…….

....And growing concerns
The Green Revolution

1964 A man with a big idea
Inter-generational equity

236
From 1964 to 1985 – time flies……….

+ a large number of ducks, rabbits, horses, turkeys…
..3 camels and one unfortunate mule
Chickens 110,000
Pigs 2,630
Sheep 922
Goats 781
Cows 557
The scale of livestock production is driven by our desire for cheaper and more plentiful meat, but there are damaging
consequences, which at the moment are forecast only to intensify
The current context…

Challenge Consequence
To feed 9bn in 2050 FAO say we need a 60% increase in food production
some of the true costs of cheap and plentiful animal protein
Our demand for ever cheaper and more plentiful meat has a number of potentially devastating consequences…
238

Bowel Cancer • Is the third most common cancer in the UK • Eating 100 to 120 g of red and processed meat a day
- things like ham, salami and sausages – increasing the risk of developing bowel cancer by about 25% -we need to eat less
• Fibre offers a protective effect – we need to eat more (SACN Report)
Quorn are supporting bowel cancer awareness
http://www.ncbi.nlm.nih.gov/pmc/articles/PMC2121650/pdf/pmed.0040345.pdfhttp://scienceblog.cancerresearchuk.org/2007/11/12/how-does-red-meat-increase-bowel-cancer-risk/http://www.dietandcancerreport.org/?p=ERhttps://www.gov.uk/government/publications/sacn-carbohydrates-and-health-report

Challenge Consequence
To feed 9bn in 2050 FAO say we need a 60% increase in food production
some of the true costs of cheap and plentiful animal protein
Our demand for ever cheaper and more plentiful meat has a number of potentially devastating consequences…
240


Challenge Consequence
To feed 9bn in 2050 FAO say we need a 60% increase in food production
some of the true costs of cheap and plentiful animal protein
Our demand for ever cheaper and more plentiful meat has a number of potentially devastating consequences…
242
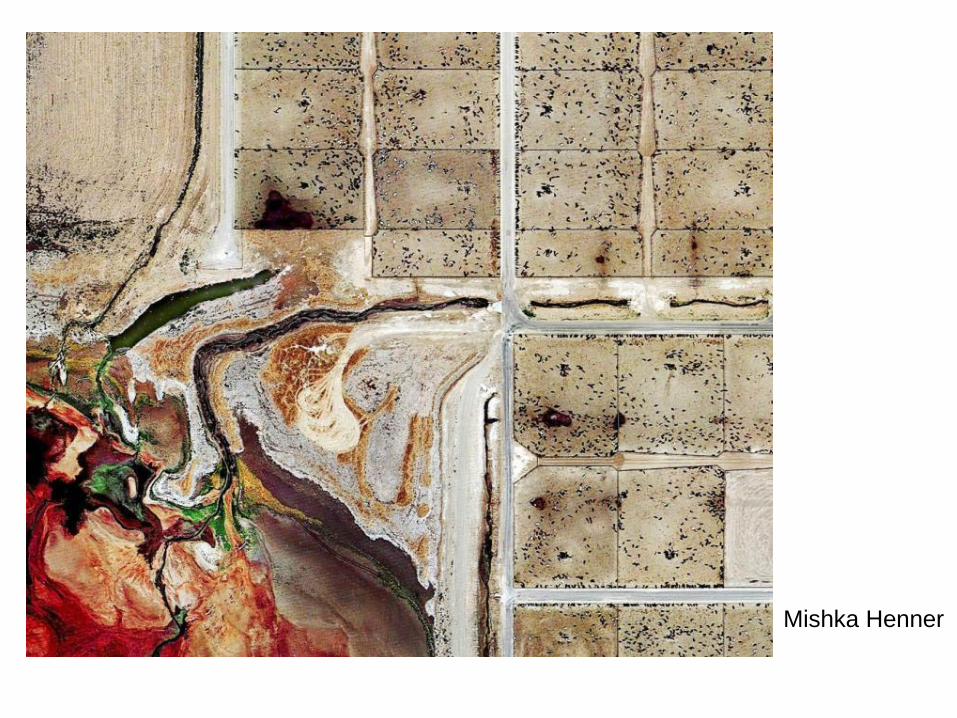
Mishka Henner

MEAT THE No 1 CONTRIBUTER 1/3rd water use. 18% -30% of global GHG emissions. 45% of all land. 91% of rainforest destruction to date (1 acre per
second). Species loss. Ocean deadzones. Habitat destruction. The rise of the superbug. Micronutrient depletion. Unaccounted costs of poor health and
environmental impact. Animal welfare and cruelty on an unprecedented scale.
Our biggest lever that can address both environmental impact and improve our health

Who’s responsibility is it anyway ?
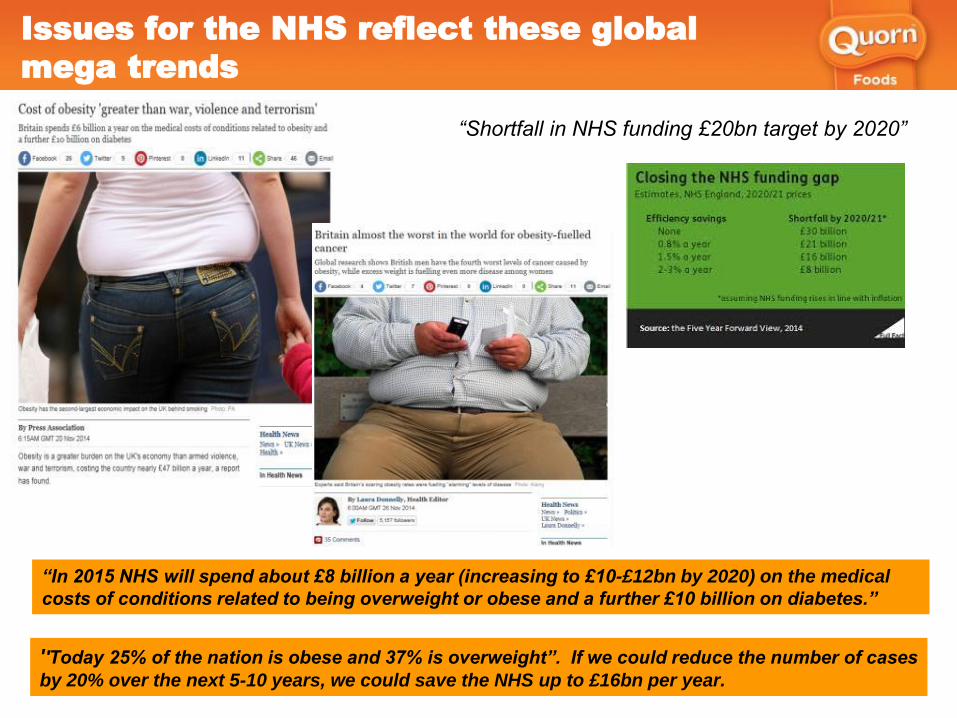
Issues for the NHS reflect these global
mega trends
''Today 25% of the nation is obese and 37% is overweight”. If we could reduce the number of cases
by 20% over the next 5-10 years, we could save the NHS up to £16bn per year.
“In 2015 NHS will spend about £8 billion a year (increasing to £10-£12bn by 2020) on the medical
costs of conditions related to being overweight or obese and a further £10 billion on diabetes.”
“Shortfall in NHS funding £20bn target by 2020”

“NHS as an employer sets a national example in the support it offers its own 1.3 million staff to stay healthy, and serve as “health ambassadors” in their local communities”.
Simon Stevens Five Year Forward
Tackle the root causes of ill health.
A radical upgrade in prevention and public health.
Hard hitting action on Obesity, Alcohol and other major health risks.

248
Easy to use, easy to enjoy – Quorn are proud
to support the NHS in achieving this vision

Creating the world’s leading meat-alternative business
So, what exactly is Quorn and
what have you been doing to
help??

Quorn video

“Quorn ….began by taking the original fungi found in soil and domesticating it in the same way that our ancestors did with many plants.”
Spector, T (2015) The Diet Myth. Weidenfield and Nicholson pp 137
A new way of farming…….

252
Additional InterestSCFA productionFibre (chitin and ẞ-glucans)
Mycoprotein as a food ingredient
Physical
Properties (shape)
Denny, A, Aisbitt, B and Lunn, J (2008) Mycoprotein and health. BNF Nutrition Bulletin 33: 298 – 310.Bottin, J. (2014) Nutrition and Surgical Influences on appetite regulation in obese adults. PhD Thesis Imperial College London
BENEFITS
Texture creation• Authentic meat-like texture• Creation of fibrosity through fibre assembly
General Nutrition• High quality protein• Low fat content (membranephospho-lipids)
• High fibre (cell wall)• Low energy densityClinical Research Programmes• Lowering serum cholesterol• Satiety• Insulinemia and
glycemia in diabetics
Composition


Key comparisons - Quorn
By working closely with Carbon Trust we have established that Quorn foods offer significant environmental benefits relative to meat.
Quorn is the first and only meat free brand to have carried out such a systematic third party analysis of its
environmental footprint.
1 Geraldes, E & Freire F (2013) Greenhouse gas assessment of soyabean production: implications of land use change J Cleaner Production 54, 49 -60
2. Matsuka, T& Goldsmith, P (2009) World soyabean production: Area yield and projections. In: J Food Agric Management review 12 (4) 143-161
3. Ercin, AE Aldaya, M &Hoekstra, AYl (2011) The water footprint of soymilk, soyburger and equivalent animal products. UNESCO IHE Inst Water Education. Report 49
4. Carbon Trust. Report to Marlow Foods (2014) Available on request
ENVIRONMENTAL COMPARISON PROTEINS AND MYCOPROTEINGHG
(kg/kg)LAND
(ha/te)WATER (m3/te)
MYCOPROTEIN 1.6 0.17 860
source#4: carbon trust lifecycle analysis of mycoprotein. Report 2014
QUORN MINCE 2.4 0.4 1900
SOYABEAN 0.1 - 17.8 0.43 2500
source#1 source#2 source#3
BEEF (GRAZED) 121(114 - 130) 5 21500
BEEF (MIXED) 30(16 - 69) 3.5 19500
source#4: carbon trust lifecycle analysis of mycoprotein. Report 2014
POULTRY 9 0.7 3970
Compared with Quorn mince ex factory
GHG LAND WATER
Beef (mixed)
X12 X9 X10
Beef (grazed)
X50 X12 X11
Poultry X4 X2 X2
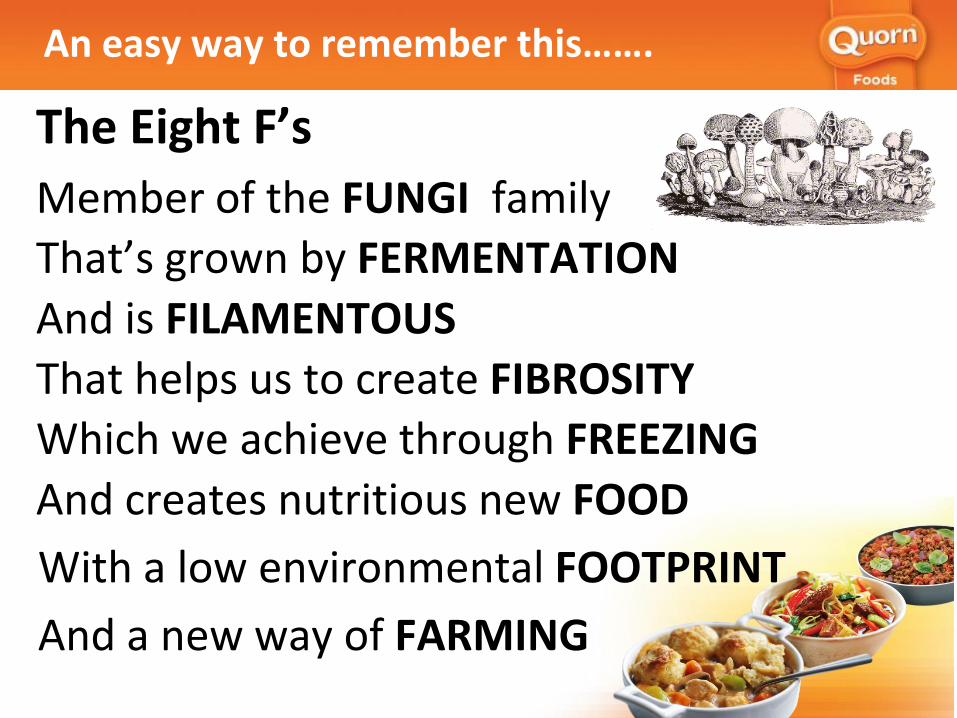
An easy way to remember this…….
Member of the FUNGI family
That’s grown by FERMENTATION
And is FILAMENTOUS
That helps us to create FIBROSITY
Which we achieve through FREEZING
The Eight F’s
And creates nutritious new FOOD
With a low environmental FOOTPRINT
And a new way of FARMING

What have we have been doing……

What if every NHS member of staff ate the
same lunch as you will be eating today??

THANK YOU

Lunch and Networking
#Dayforaction

Welcome back
Fiona Daly, Associate Director of Sustainability and Patient Transport,
Barts Health NHS Trust
#Dayforaction

Creating the story of changeSusie Vernon and Rick Lomax
Sussex Community NHS Trust in partnership with Capita


1. Sustainability at Sussex Community NHS Trust:Care Without Carbon
2. Carbon road mapping
3. Engaging Staff: Dare to Care
Contents

Excellent Care at the Heart of the Community
4,500 staff serving 1.1m people throughout the community
315 Inpatient beds in 9 locations£196m annual spend (£1m surplus)
plus £4m capital spend

Brief history of sustainability at SCT
First Sustainable Development Management Plan approved by Board in 2010: “15 by 15”
Focused on demonstrating the value of sustainability through tangible results
Laying foundations for future development of the programme

Where to next?...
Well on the way to achieving our 15 x 15 targets Challenge from Board – great but where next?! How do we build on successes and accelerate pace of
progress and change? How do we better integrate sustainability into
operational fabric of Trust and put it at the heart of “core business”?
How do we give sustainability a personality and drive real and lasting cultural change?

Why is this important to SCT?
Copyright © 2016 Sussex Community NHS Foundation Trust - all rights reserved

Why is this important to SCT?
Copyright © 2016 Sussex Community NHS Foundation TrustAll rights reserved


Performance 2010 - 2015

CO2 reduction 2010 – 2015

Why is this important to SCT?
Copyright © 2016 Sussex Community NHS Foundation Trust - all rights reserved

NHS Carbon Footprint
Climate Change Act target: 34% by 2020(baseline year
1990 or 2007)
1990 Baseline
2015 Target 10%
2020 Target 34%
2050 Target 80%

Climate Change Act (2008)
ERIC submission data – where Trust’s think they are
Stage No. of Trusts Percentage
No Sustainable Development Management Plan or Carbon Plan
63 26%
No Target included in Plan 18 8%
Target included but not on track to be met 56 23%
On track to meet target 103 43%

Achieving 34%: Carbon Road Mapping
CARBON ROAD MAP: a strategic and planned approach for an NHS Trust/provider to achieve 34% carbon reduction target by 2020.
Identifies viable, cost-effective saving opportunities (especially in
the context of today’s Budget update)
Helps demonstrate an organisation’s commitment to tackling climate change to commissioners, employees and patients
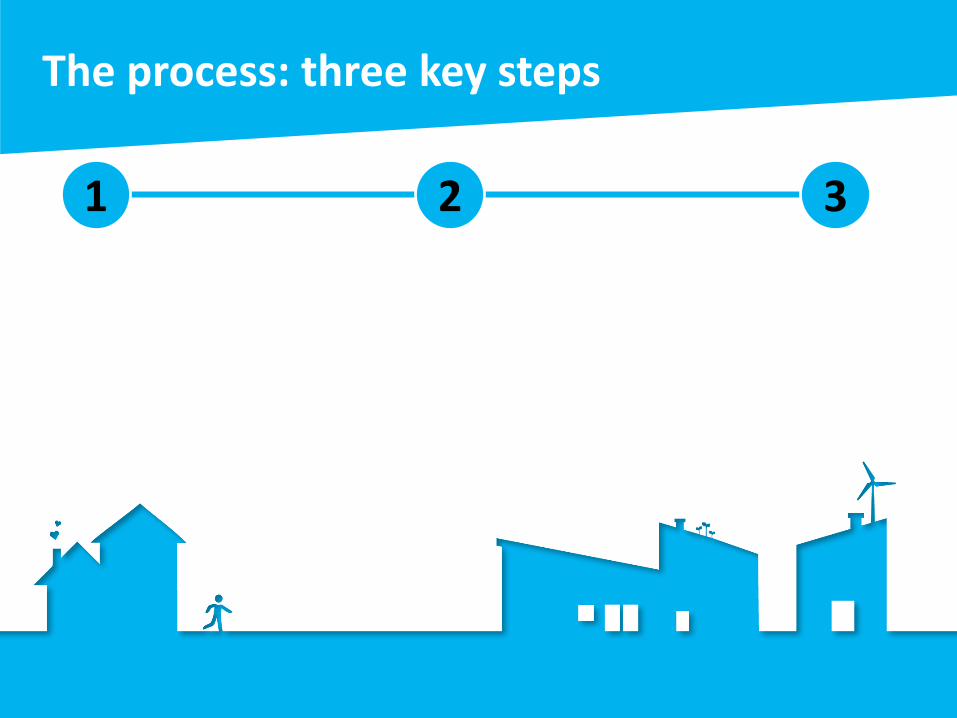
The process: three key steps
1 2 3

The process: three key steps
Where you are Review site and operations Data analysis and benchmarking Carbon footprinting Identify baseline
1 2 3

The process: three key steps
Where do you want to be? Set your targets – 34% by 2020 Identify progress to date Plot trajectory to 2020 and Value at Stake Quantify carbon shortfall
1 2 3

The process: three key steps
How do you get there – your bespoke roadmap Known Knowns: review current planned projects Identify and quantify measures to achieve the
shortfall Outline potential funding mechanisms
1 2 3

Summary
0
1,000
2,000
3,000
4,000
5,000
6,000
7,000
8,000
9,000
10,000
To
nn
es C
O2e
BASELINE
BUSINESS AS USUAL
REDUCED EMISSIONSSCENARIO
Carbon shortfall
Identify, quantify and outline funding for:•Planned projects•Energy reduction measures•Efficient energy generation•Green travel•Waste management•Staff engagement
CLIMATE CHANGE ACT TARGET

“Every Trust should have a Carbon Road Map. We are working towards having a detailed plan of what we need to achieve and a process to validate that achievement each year. The Road map is indicating annual cost effective savings of around £200k and through innovative funding mechanisms could achieve a further £200k from our energy bill to fund carbon saving measures.”
Andy HayesHead of Estates & FacilitiesSomerset Partnership NHS FT

Why is this important to SCT?
Copyright © 2016 Sussex Community NHS Foundation Trust - all rights reserved

Key staff engagement challenges
• Too many initiatives in NHS are top down – Board can’t do it alone, needs grass roots action
• How do we show that sustainability is relevant to frontline staff and make it meaningful?
• Staff are busy, stretched and suffer from initiative overload
• Staff are very dispersed – large geography and number of sites
• How do we know engagement has been successful?

1. Looked at language – and visual identity
Developed a brand CWC is shorthand for a
sustainable NHS Making sustainability more
intuitive for frontline staff Instantly recognisable across
Trust – not just another initiative

2. Created a narrative
Bringing the CWC brand to life Talked to our staff – workshops to help identify what would
motivate our staff
The narrative: CWC is about doing new things that will make you feel good AND create a healthier, happier and more sustainable NHS

3. Identified the right format
Drew on external expertise e.g. EAST model Easy Accessible Social Timely

3. Identified the right format
Pledge based system: Dare to Care (language again!)
Fun “can do” approach, not preachy “must do”
Range of dares – something for everyone; each has a cost, environmental and wellbeing benefit
Easy for staff to build actions into working day
Dare refresh every 6 months –reflect organisational priorities & staff ideas

3. Format: online
Bespoke online platform as main vehicle for the campaign carewithoutcarbon.org
24/7 access Public website Capturing information and
measuring progress

4. Format: online

3. Format: posters

3. Format: posters

3. Format: face-to-face

4. Incentivising
Goodie bags Quarterly prize draw Dare Challenges Sponsored by local suppliers

Dare in numbers

Dare in numbers
Staff survey: engagement score increased on last year, above national average for community trusts

“I have completely changed the way I work over the last 6 months and no longer drive my car to work. I catch the train and walk from the station, it’s much more enjoyable than driving –no parking issues and I get all of the health benefits. If I need a car I use a fleet car, it’s easy to arrange and always a friendly service. Without Dare to Care I probably would not have done this, so thank you!“
Andrea Richardson, Occupational Health

“I wanted to let you know how much I have benefitted from the Care Without Carbon campaign. I used to jump into my car to go from Burgess Hill to Haywards Heath for two of my evening activities. Since daring to make 1 less car journey I take the train to Haywards Heath for both these activities. This involves walking to the train station (and back). The train journey costs about the same as using the car. I now also usually walk to my local Pilates class instead of taking the car. As well as saving carbon I have noticed a marked improvement in my sleep as I am now taking more exercise. “
Claire Bird, Speech & Language Therapist

Where next?
NHS Sustainability Day! Measurement and reporting – CWC, Dare and wellbeing Supporting other Trusts with their own sustainability journeys Extending the reach (and impact) of the Dare campaign –
collective action across the NHS with bespoke campaigns for individual Trusts

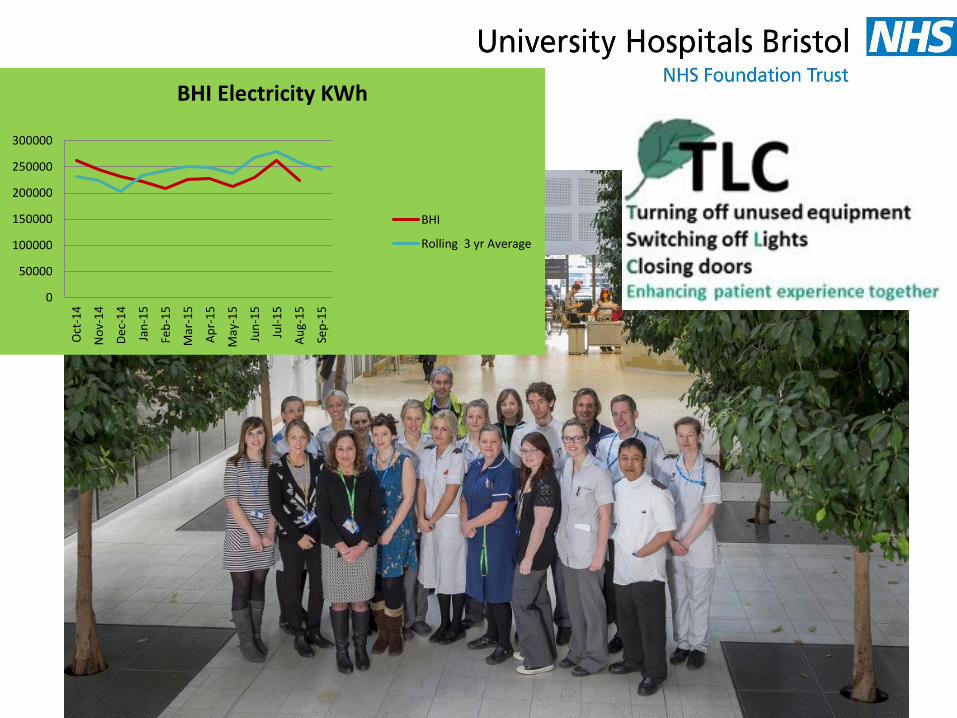
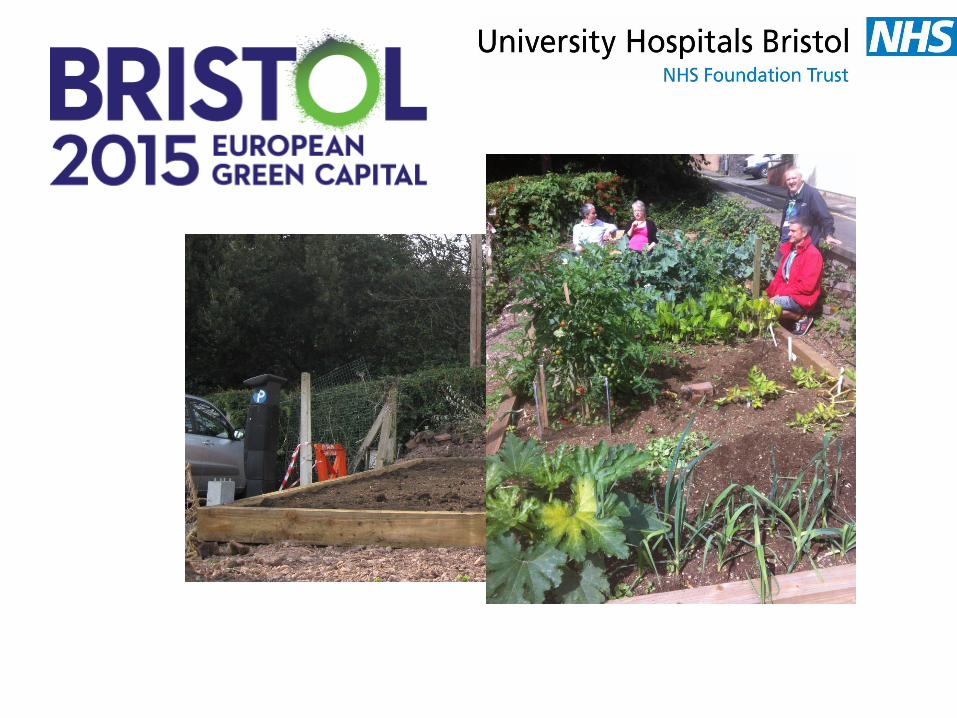
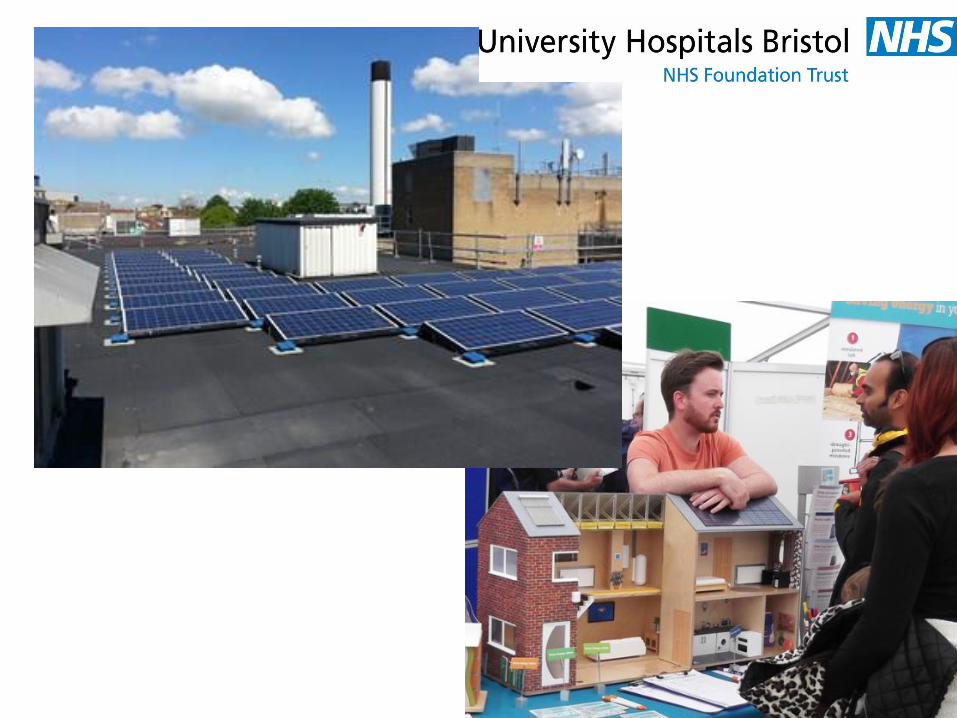
Bristol Improving Environmental and Social Sustainability
Sam Willitts
Energy and Sustainability Manager

“Green Impact has given some structure to the Green Champion role. Instead of just receiving a newsletter and having a green lanyard, now I have a clear role and can see the effect I’m having.”
“Being involved in Green Impact has given a new aspect to my role – I’m learning things and developing professionally. I’m definitely classing this as CPD.”
“It’s given me some legitimacy – people don’t just think of me as the office nag any more, they can see a reason why I’m doing it.”
“It’s great to see the Trust supporting this centrally. It’s not just about the few enthusiastic people now”“There is definitively momentum building with the green agenda in the Trust.”
0
50000
100000
150000
200000
250000
300000
Oct
-14
No
v-1
4
De
c-1
4
Jan
-15
Feb
-15
Mar
-15
Ap
r-1
5
May
-15
Jun
-15
Jul-
15
Au
g-1
5
Sep
-15
BHI Electricity KWh
BHI
Rolling 3 yr Average


Bristol Method• Effective engagement with staff, patients and
public
• System-wide (and beyond) approach to sustainability
• Impact -delivering environmental, financial and social benefits
• Best practice from others combined it in our own way and spreading it more widely

Evidence-based sustainability in healthcare
curriculaProfessor Janet Richardson
Plymouth University


Year 1
Induction
Year 2
Skills
Year 3
Leadership
Skills, waste,
reflective practice
Health inequalities,
global health, public
health, prevention,
disease management
Management,
public health, skills,
reflective practice

Year 1 Induction
(Case Study)

It is Summer in Cornwall and a 7
year old boy is admitted to the
ward with acute diarrhoea,
abdominal pain and fever.


Chris Large
Partner at Global Action Plan

Changing Lives inEast London
• Largest NHS Trust in the country
• Serves 2.5M people

We help people to limit
environmental damage
Schools Businesses Communities


SUCCESSES - Cost and Carbon Savings

• Increased natural light in mental health patient rooms
resulted in 3.7 day shorter hospital stay on average (AHRQ, 2005)
• Cervical and lumar spinal surgeries patients who received
more natural light saw a 22% decrease in painkilling
medicine use (Joseph, 2006)
Behaviour change in action
Increasing natural light exposure
Reduction in artificial light
• Darkening hospital rooms at night – reduced sleep
disturbances by 38% (Bartick et al,. 2009)
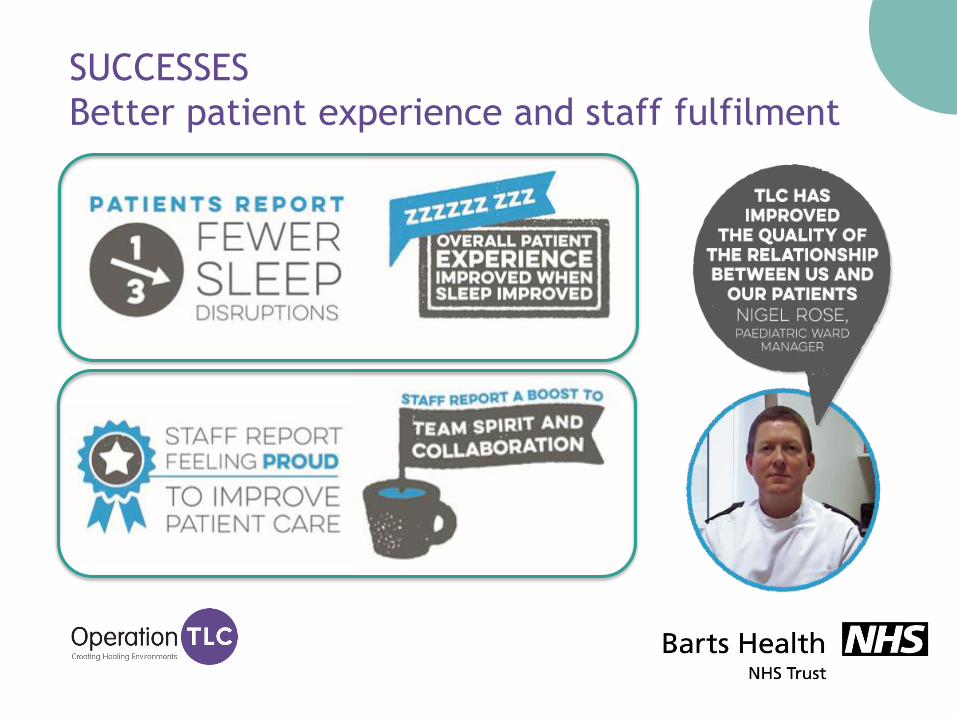
SUCCESSES
Better patient experience and staff fulfilment

Design of a behaviour change programme
What can staff do to save energy?
How often do staff do those actions already?
What is the value of doing those actions more often?
What stops people acting and how can we help uptake?
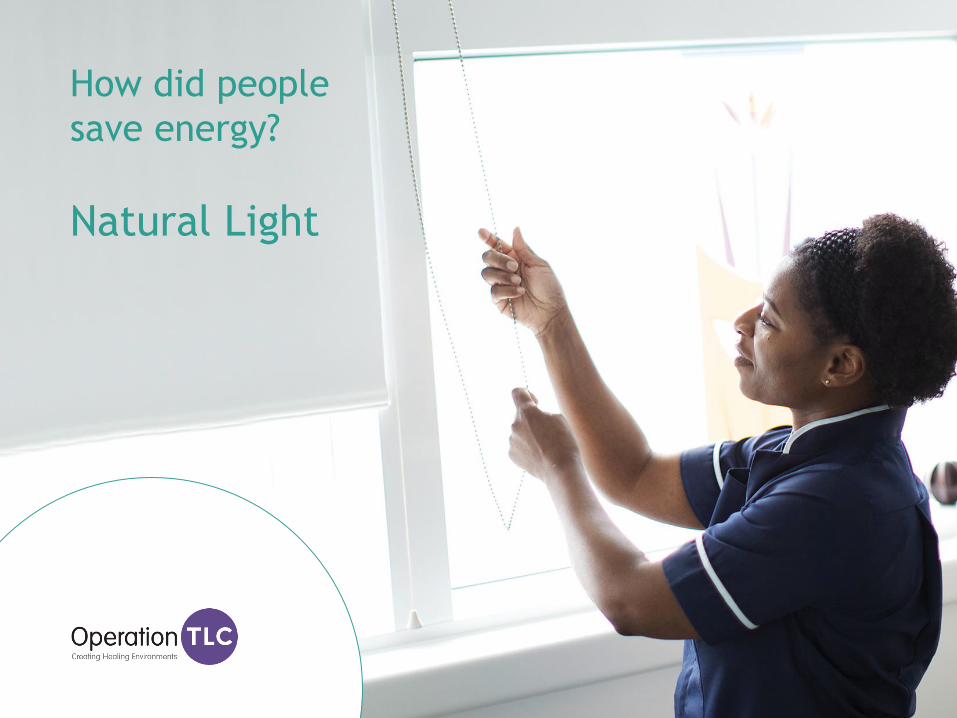
How did people
save energy?
Natural Light

QUIET
TIME
NIGHT
MODE
HIGH
ENERGY
AREAS
BUILDING
AWARENESS
How did people save energy?
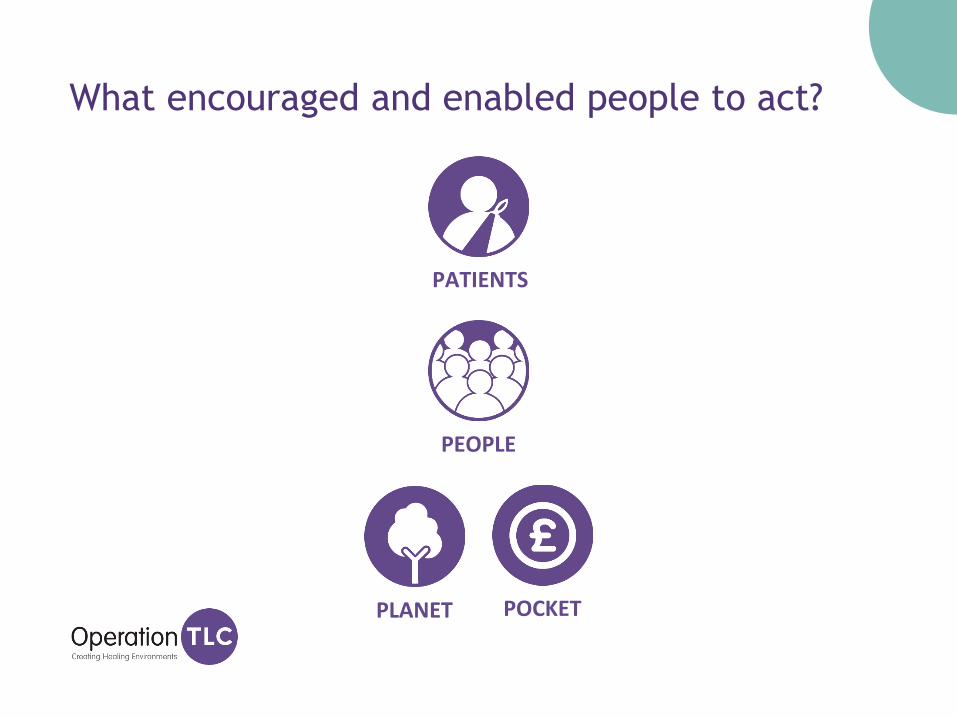
What encouraged and enabled people to act?
PATIENTS
PEOPLE
PLANET POCKET

Patient – Staff – Estate
Triangle
What encouraged and enabled people to act?

How did we measure the impact and savings?
PATIENT
SURVEY
METER
DATA
LIGHT
METERS
SPOT
CHECKS


From energy saving to better relationships

Help is at hand to run your own Operation TLC
Scope
• Quantify energy waste
• Create business case
• Engage clinical leaders
Change
• Face to face engagement
• Personalised comms materials
• Coaching for champions and project leaders
Measure
• Improvements in staff taking energy action
• Cost and carbon savings
• Patient experience benefits
• Staff benefits


Concluding comments
Fiona Daly, Associate Director of Sustainability and Patient Transport,
Barts Health NHS Trust
#Dayforaction