NGV – a dependable solution for environment friendly...
55
www.eni.it NGV – a dependable solution for environment friendly mobility Ad Hoc Meeting of the Gas Centre with the United Nations Economic and Social Commission for Western Asia (ESCWA) - Beirut 5 - 6 July 2011 – Flavio Mariani – Eni Gas & Power
Transcript of NGV – a dependable solution for environment friendly...

www.eni.it
NGV – a dependable solution for environment friendly mobility
Ad Hoc Meeting of the Gas Centre with the United Nations Economic and Social Commission for Western Asia (ESCWA) - Beirut 5 - 6 July 2011 – Flavio Mariani – Eni Gas & Power

2
Content
World natural gas resources and demand
Opportunities for the environment protection
NGV market/technology progress
Strategies for fuels in World’s regions
Examples of OEM models on the market
Predictions on future NGV market trend
What do Eni in Italy and in Europe
Relatore
Note di presentazione
NG worlds resources - conventional, unconventional, flared gas Opportunities for the environment protection - GHG NOx, PM, mutagenic HC NGV market progress - technology; norms; vehicle park; refuelling stations Strategies for fuels in Europe and North America (OEM); South America (retrofit and QVM); Asia (OEM, retrofit and QVM) Panoramic of OEM models on the market (Italy) Predictions on future NGV market trend (NGV Global)

3
world natural gas resources and demand

4
World’s proven conventional NG resources (2008) = 180,000 Bm3 , (~60 years production at current rates: 3.065 billion m3/year).
Recent estimate for virtually recoverable NG = 850,000 Bm3 , (virtually ~280 years production at current rates).
Unconventional resources, (e.g. coalbed methane, tight gas from low-permeability reservoirs, shale gas) = 45% of this amount. Increasingly affordable with rising crude price, and new technologies
To date, only 66,000 Bm3 of gas has been produced (or flared)[IEA Energy Outlook 2009].
World natural gas resources: increasing above expectations
Relatore
Note di presentazione
World’s proven NG resources in 2008 = 180,000 Bm3 , (~60 years production at current rates). Estimated recoverable NG resources long-term global recoverable NG resource base is etimated at more than 850,000 Bm3 , enough for ~280 years production at current rates. They are expensive, but become affordable with rising oil price. Unconventional gas resources, mainly coalbed methane, tight gas (from low-permeability reservoirs) and shale gas, make up about 45% of this amount. To date, only 66,000 Bm3 of gas has been produced (or flared) [IEA Energy Outlook 2009]. Flared gas: still > 100 billion (!) m3/year
5
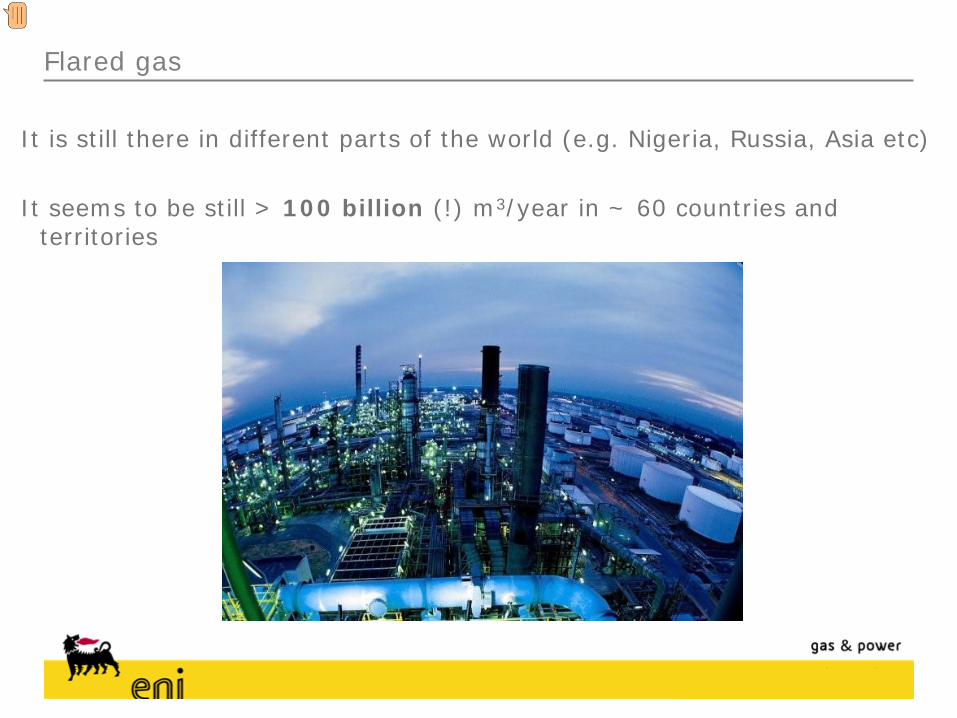
Flared gas
It is still there in different parts of the world (e.g. Nigeria, Russia, Asia etc)
It seems to be still > 100 billion (!) m3/year in ~ 60 countries and territories
Relatore
Note di presentazione
Collected data from satellites showed that over the last 12 years the amount of flared gas has increased in 22 countries: South Africa, Saudi Arabia, Azerbaigian, China, Ghana, Equatorial Guinea, Irak, Kazakistan, Kirghizistan, Mauritania, Myanmar, Oman, Uzbekistan, Philippines, Papua New Guinea, Qatar, Russia (except the region of Kanty Mansi), Sudan, Ciad, Thailand, Turkmenistan, Yemen. �In 16 countries the gas flaring has decreased: Algeria, Argentina, Bolivia, Camerun, Chile, Egypt, United Arab Émirates, India, Indonesia, Libia, North Sea (offshore), Nigeria, Norway, Perù, Siria, Usa (offshore). In 9 countries gas flaring has kept at the same level: Australia, Equador, Gabon, Iran, Kuwait, Malaysia, Romania, Khanty-Mansi (Russia), Trinidad and Tobago.

6
Reference scenario of IEA Energy Outlook 2009 = global NG demand rise from 3,000 Bm3 in 2007 to 4,300 Bm3 in 2030
Average increase: 1.5% per year.
The share of NG in the global primary energy mix will increase marginally, from 20.9% in 2007 to 21.2% in 2030. over 80% of the increase in NG use between 2007 and 2030 will occur in non OECD countries, with the biggest rise occurring in the Middle East.
The rise of NG demand
Relatore
Note di presentazione
In the reference scenario of IEA Energy Outlook 2009, global NG demand will rise from 3.0 x 10¹² m3 in 2007 to 4.3 x 10¹² m3 in 2030 (average increase: 1.5% per year). The share of NG in the global primary energy mix will increase marginally, from 20.9% in 2007 to 21.2 in 2030. over 80% of the increase in NG use between 2007 and 2030 will occur in non OECD countries, with the biggest rise occurring in the Middle East.

7
Opportunities for the environment protection

8
Comparison of GHG emissions
Relatore
Note di presentazione
Mong fossil fuels, CNG is the best choice in terms of GHG emissions Its infrastructures are paving the way to renewable gaseous fuels such as bio-methane and hydrogen obtained from renewable energy sources

9

10
A good example: the Iveco Heavy Duty engines
EEV = Enhanced enviromental friendly vehicles
Relatore
Note di presentazione
I motori pesanti a CNG sono in grado, (NB: senza richiespeciali tecnologie di trattamento fumi che servono invece ai mezzi a gasolio), di rispettare le norme più severe sulle emissioni, come l’Euro 5 e l’EEV, Enhanced Environment friendly Vehicle (norma volontaria, che contraddistingue i veicoli più ecologici, in vista di speciali strategie che li possano privilegiare)
11
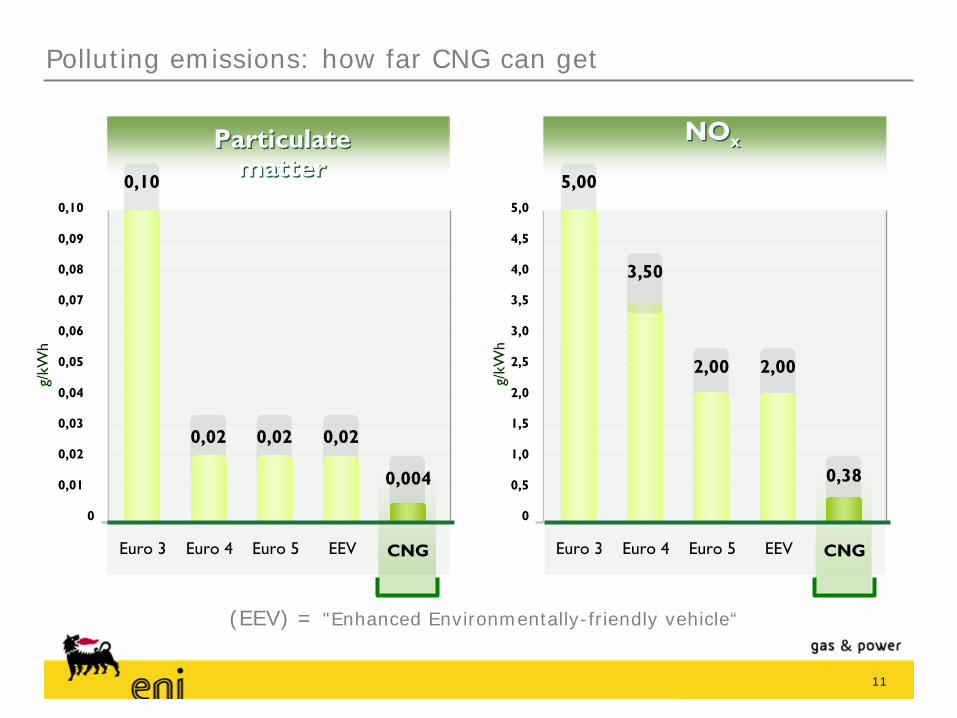
Polluting emissions: how far CNG can get
Euro 3
g/kW
h
Euro 4 Euro 5 EEV CNG
Particulate matter
Particulate matter
Euro 3
0
0,5
1,0
1,5
2,0
2,5
5,0
g/kW
h
Euro 4 Euro 5 EEV CNG
0,38
NOx
NOx
2,002,00
4,5
4,0
3,5
3,0
3,50
5,00
0,01
0,02
0,03
0,04
0,05
0,10
0,09
0,08
0,07
0,06
0
0,10
0,004
0,02 0,02 0,02
(EEV) = "Enhanced Environmentally-friendly vehicle“

12
Polluting emission comparison
Source: M. FerreraFiat Powertrain TechnologiesNGV 2010 – Roma
Relatore
Note di presentazione
A NGV EEV is 3 times cleaner than a Diesel EEV, and without the need for complex exhaust aftertreatment systems

13
Polluting emission comparison
Source: M. FerreraFiat Powertrain TechnologiesNGV 2010 – Roma
Relatore
Note di presentazione
NGV have a lower GWI, by 10-20% compared to Diesel vehicles, and by >20% compared to gasoline vehicles. The contribution of NGV to the total emissions of CH4 in the world is negligible: even if the share of NGV rise up to 10% in the world, their contribution to global CH4 emissions will only increase from 0.10 to 0.15%. NGV substantially curbe the emissions of the most dangerous pollutants, such as ozone promoters and aromatic copmpounds (mutagenic).

14
Economy and safety of transport
C
• Continuity• Safety• Reduced environmental impact
Natural gas
Crude oil
ExceptLNG

15
15
29.785 km
620,0 MW
Snam Rete Gas national network
OtherSnam Rete Gas regional network
Import of LNG
Import from Algeria
Import from North sea Import from Russia
Import from Libia
Domestic production
More than 30,000 Km pipelines
GN supply diversification - transport Infrastructures
Import of LNG
Plan for future import from Algeria

16
NGV market/technology progress
17
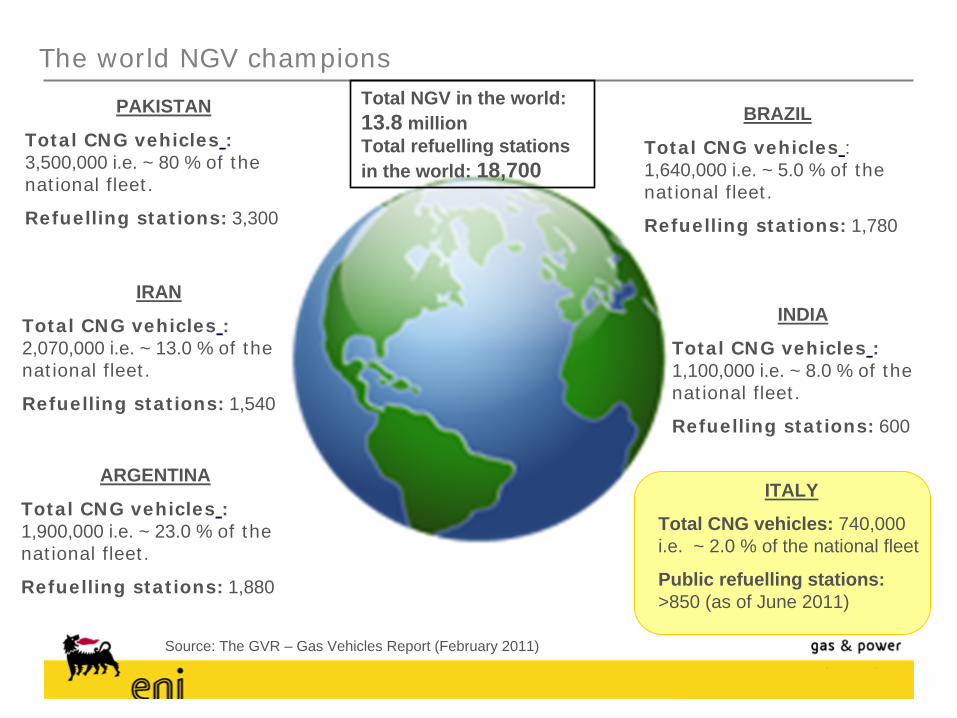
ARGENTINA
Total CNG vehicles : 1,900,000 i.e. ~ 23.0 % of the national fleet.
Refuelling stations: 1,880
PAKISTAN
Total CNG vehicles : 3,500,000 i.e. ~ 80 % of the national fleet.
Refuelling stations: 3,300
BRAZIL
Total CNG vehicles : 1,640,000 i.e. ~ 5.0 % of the national fleet.
Refuelling stations: 1,780
INDIA
Total CNG vehicles : 1,100,000 i.e. ~ 8.0 % of the national fleet.
Refuelling stations: 600
IRAN
Total CNG vehicles : 2,070,000 i.e. ~ 13.0 % of the national fleet.
Refuelling stations: 1,540
ITALY
Total CNG vehicles: 740,000 i.e. ~ 2.0 % of the national fleet
Public refuelling stations: >850 (as of June 2011)
Source: The GVR – Gas Vehicles Report (February 2011)
The world NGV championsTotal NGV in the world: 13.8 millionTotal refuelling stations in the world: 18,700

18
Source: ENI – NGVA Europe – G.V.R. (February 2011)
780 740
90092
13423.2
120 9.3
330.5
80.6
2205.3
672.8
301.6
125(priv)12.5(HD)
90.3
40.1
143.3
18 (priv)0.8
332.1
6 0.4
10.1
382.0
20.1
44 pr2.5
The NGV market – in Europe
Black: CNG refuelling stationsRed: Vehicles/000
3725.3
283200
255
249103
40.3
20.5
Relatore
Note di presentazione
Esiste un novero di nazioni (Club dei 100) che hanno sviluppato ormai una rete distributiva di un certo rilievo, con più di 100 stazioni: Italia, Germania, Austria, Svizzera, Svezia, Ucraina e Russia. Nella maggior parte degli altri casi, la rete è incipiente, e si tratta spesso di iniziative pilota, dimostrative e di flotte, come per esempio nel caso della Francia In Europa, l’Italia è tuttora al primo posto con oltre circa 700.000 veicoli a metano e altre nazioni europee stanno seguendo il nostro esempio. Molto attiva risulta ad esempio la Germania che con quasi 900 distributori sta facendo un grosso sforzo promozionale per l’autotrazione a metano. Il mercato del metano compresso in Italia è stato nel 2010 di circa 800 milioni di metri cubi/anno. In termini percentuali il metano rappresenta poco più dell’1% del totale carburanti usato nell’autotrazione.

19
Gas cylinders integrated in the vehicle structure no on-board space limitations
Low fuel consumption and very low emission engines (downsize/turbocharge; multiair etc.)
Electronic management
dual fuel for virgin areas (“pathfinder/pioneer”)
Industry for Industry for NGVsNGVs: Innovation in vehicles: Innovation in vehicles
Relatore
Note di presentazione
Le bombole non sono più “aggiunte” o “applicate” ai veicoli, sono integrate nella struttura. I motori nascono di fabbrica a metano. Questo è lo schema del motore esposto nello stand. Mille motori sono stati forniti alla Cina per i bus per le olimpiadi di pechino 2008

20
Technology progress – International norm framework

21
Innovative systems for NG supply to NGV refuelling stations: L-CNG
L-CNG and LNG refuellingh station in Lleida, Spain – manufacturer: INDOX
CryoEnergy (ROS ROCA Group)

22
Innovative systems for NG supply to NGV refuelling stations: L-CNG
L-CNG: liquefied natural gas at -160°C, pumped in liquid form at 200 bar, with cryogenic pumps, then vaporized by means of atmospheric heat exchanger to get gaseous CNG at 200 bar, without using a compressor, which saves >90% ofcompression energy
Cryogenic pump The first Italian L-CNG public refuelling station started operating in August 2010 in Cuneo, North Italy manufacturer: VANZETTI (It’s an all-made-in-Italy technology)

23
Alternative systems for NG supply to NGV refuelling stations : mother/daughter station systemA long distance connection of the CNG refuelling station to the natural gas pipeline becomes unaffordable above 1-2 kilometres. Up to a certain range, the refuelling stations (daughter station), which are too far from the existing pipeline, may be served by means of cylinder truck, filled at a normal refuelling station (mother station). The cylinder trucks are serving daughter stations, and operate also for industrial and residential application natural gas supply in case of energency, such as pipeline service break- down. A similar solution is the “mobile refuelling station”: the cylinder truck includes also a compressor and a gas flow meter.

24
Economic support from government: favorevourable taxation of cleaner fuels – the Italian example
EXCISES AND PRICES OF FUELS IN ITALYEXCISES IN APPLICATION SINCE 1° MAY 2008
excises enforced by the law
per commercial unitNet heating
value On energy basisgasoline 0,56400€/litre 32,00 MJ/litre 1,76250€cent/MJ
diesel 0,42300€/litre 35,00 MJ/litre 1,20857€cent/MJlpg 0,12500€/litre 0,22777€/kg 44,50 MJ/kg(*) 25MJ/litre(*) 0,51184€cent/MJ
CNG 0,00291€/m3 0,00409€/kg 36,00 MJ/m3 50MJ/kg 0,00808€cent/MJ
PUMP PRICES AS OF May 2011National average(**)per commercial unit On energy basisgasoline 1,567 €/litre 4,90 €cent/MJgasoline 98 RON 1,68 €/litre 5,25 €cent/MJdiesel 1,46 €/litre 4,17 €cent/MJecodiesel 1,54 €/litre 4,40 €cent/MJlpg 0,774 €/litre 3,10 €cent/MJCNG 0,896 €/kg 1,79 €cent/MJ(*) mixture of 50% propane 50% butane
(**) no control over pump prices

25
Strategies for fuels in World’s regions

26
Strategies for fuels in the world’s regions
Promotion of CNG as the better combination of assets (every country):
Care for environment
Availability
Technological maturity
Commercial maturity
Cost of development and R/D
To take profit of a domestic NG resources (e.g. Middle East, South America)
Reduce dependence on foreign oil (e.g. Europe, South America, North America, Asia)
Diversification of energy sources, in terms of supply and origin (e.g. Europe)
Use of NG which would otherwise be flared, or injected back into NG gisement (e.g. Africa, Asia, East Europe)

27
Report of the European Expert Group on Future Transport Fuels –December 2010
Alternative fuel options for substituting oil as energy source for propulsion in transport are:Electricity/hydrogen, and biofuels as the main optionsSynthetic fuels as a technology bridge from fossil to biomass based fuelsMethane (natural gas and biomethane) as complementary fuelsLPG as supplement

28
Examples of OEM models on the market

29
Increasing availability of OEM NGV on the market in Italy
Number of OEM NGV models* on the market (at end of year) Main CNG LD vehicles available on the
market
2220
1412
8
20072006 20092008 2010
* Considering the different versions of the various models produced by car OEM, the total number is higher
Relatore
Note di presentazione
Negli anni scorsi si è mantenuto in costante aumento il numero di modelli di veicoli progettati e costruiti direttamente dalla casa in versione a CNG, con indubbi vantaggi in termini di qualità, affidabilità, garanzie, prestazioni, e gradimento del cliente (privato o gestore di flotta). OEM = Original Equipment Manufacturer veicolo prodotto dalla fabbrica direttamente a metano

30
International NGV availability - some from the bunch…….
GM - Opel
Ford
Mercedes
Vokswagen
Fiat
Citroen
Renault
Peugeot
Tata (HD)
Toyota
Honda
Nissan (HD)
Isuzu (HD)
MAN (HD)
Iveco (HD)
Cummins (HD)
Volvo (HD)

31
Available NGV models on the market HD
Mercedes EconicMercedes Citaro
Stralis IVECOGarbage collecor IVECO

32
Urban buses

33
Bus and truck
Mercedes EconicMercedes Citaro
Stralis IVECOCompattatore IVECO

34
Available NGV models on the market
New Opel Zafira
Volkswagen TouranVolkswagen Caddy
Fiat Grande Punto

35
Available NGV models on the market
FIAT MultiplaFIAT Nuova Panda
CITROËN C3 Bi Energy MMercedes B 170 NGT

36
Available NGV models on the market
FIAT Nuovo Doblò
OPEL Combo
Citroen C4 G.Picasso Bi energy
VW Passat TSI Ecofuel
37
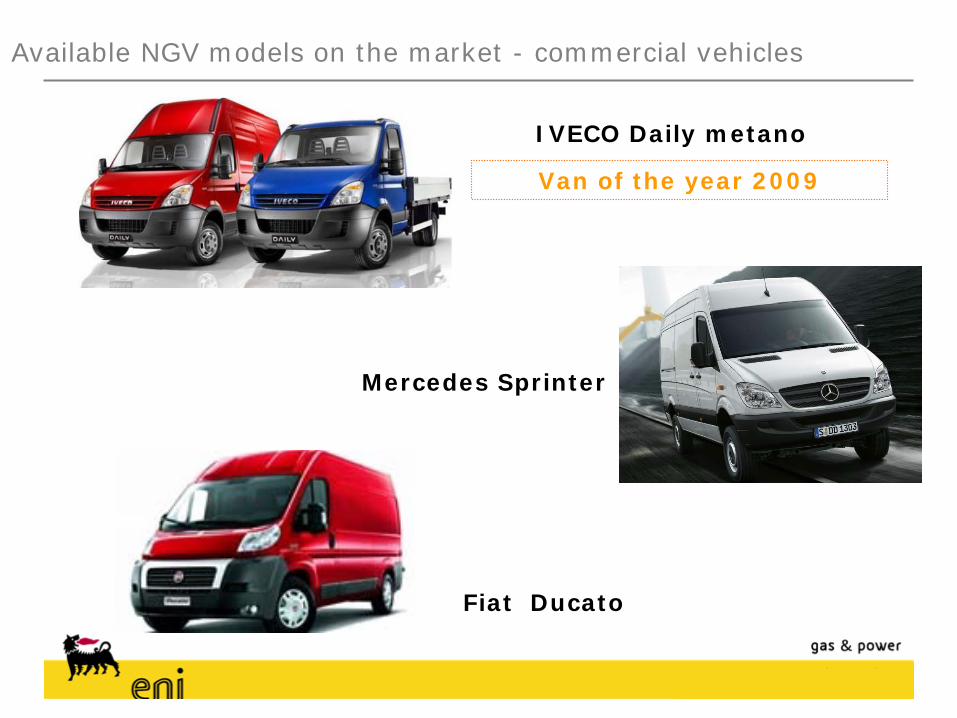
Available NGV models on the market - commercial vehicles
Mercedes Sprinter
IVECO Daily metano
Fiat Ducato
Van of the year 2009

38
CITROËN Berlingo OPEL Combo
RENAULT Kangoo Mercedes Sprinter NGT
Available NGV models on the market - commercial vehicles

39
Predictions on future NGV market trend

40
Landscape in the near future As reported by the main investors and market analysts, the worldwide landscape is moving towards a diversification in all geographic areas with a constant decreasing of conventional fuel demand and simultaneously increasing of hybrid propulsion and NGV.
Several market analysts predict, since 2009 till at least 2015, a constant increasing of NG urban buses both in Europe and U.S. thanks to a policy of grants and de-taxation

41
Trend of the NGV global population
Relatore
Note di presentazione
If this trend keeps this pace, or even smaller, like for example a less optimistic 16%, by 2020 the world population might get up to 60 million vehicles. 12 Mvehicles X 1.1611 = 61.4 Mvehicles

43
Source: John Lyon past Pres. IANGV - at NGV 2008 Rio De Janeiro

44
NGV world population growth expectation to 2020 (increase by 18% annually)= 1.18%11years x 11Mvehicles = ~60 Mvehicles
0
10
20
30
40
50
60
70
2011 2013 2015 2017 2019 2021
M vehicles
Prediction by IANGV (now NGV Global): CNG sale to NGV = 400 Bm3/year in 2020 (9% market
share ?)

45

46
The NGV market growth trend
The development of the worldwide running park of NG and biomethane vehicles has been growing at an annual pace of 15% in the last decade of the 20th century,
but since 2001 the annual growth rate has been 26%,
having reached about 13 million vehicles in the world in 2010. This is all due to the clear advantages in terms of economy, emissions and reduced dependence on crude oil.
Out of this important global figure EU countries represent 1 million vehicles.

47
Predicted development of NGV fleet in Europe
Source: Universitat Duisburg Essen – CAR, Center utomotive Research

48
NGV market – In Italy
Estimate of CNG sale to NGV Italy Mm3
830670587534473
2006 2007
740
2008
~10%
20092005
develpment factors
Economy vs. other fuels
356
National NGV fleet (OEM+retrofit) 1,000 unitsAverage yerly increase of national NGV fleet: ~15%
New OEM 1,000 units
8587652923
2007
2006
~40%
2009
140
2008
2005
391 445 536 640
Incentives (2008- 2009) and norms
Availability of new OEM models
2010
740
2010
Stability of the fiscal policies favourable to clean fuels
Relatore
Note di presentazione
The CNG consumption of NGV has been constantly growing so far, initially driven by aftermarket vehicles, now mostly driven by OEM. The decreasing of new OEM occurred in 2010 was due to the fact that most of the financial incentives for new NGV purchase have been withdrawn.

49
NGV predictable trend in the long term
further growth in Italy
National NGV fleet – Italy Million cars
Trend “max”
Trend “as is”
0,97 1,29
0,11 2,982,25
1,7
0,70
0,26
0,08
0,20
0,15
2010
2012
2014
2016
0,80 1,06
2018
+25%
+15%
1
2
• Position of government
A. Keep incentives for NGV purchase
B. Suitable norms/regul.
C. Keep favourable tax- ation of clean fuels
D. Incentives for ref. stations
• Position of automotive OEM
A. Wide NGV model range offer
B. Investments in R&D
C. Suitable price politicy
D. After sale assistance
Rivedere stime
2020
0,06
1,40
1,85
2,45
3,24

50

51
What do Eni in Italy and Europe to develop NGV market, and face the challenges: •Direct involvement (dedicated NGV promotion department)•Government relations (national/international)•Associations (Italy: NGV System Italia; Europe: NGV A Europe; internationally: NGV Global)•Information dissemination
52
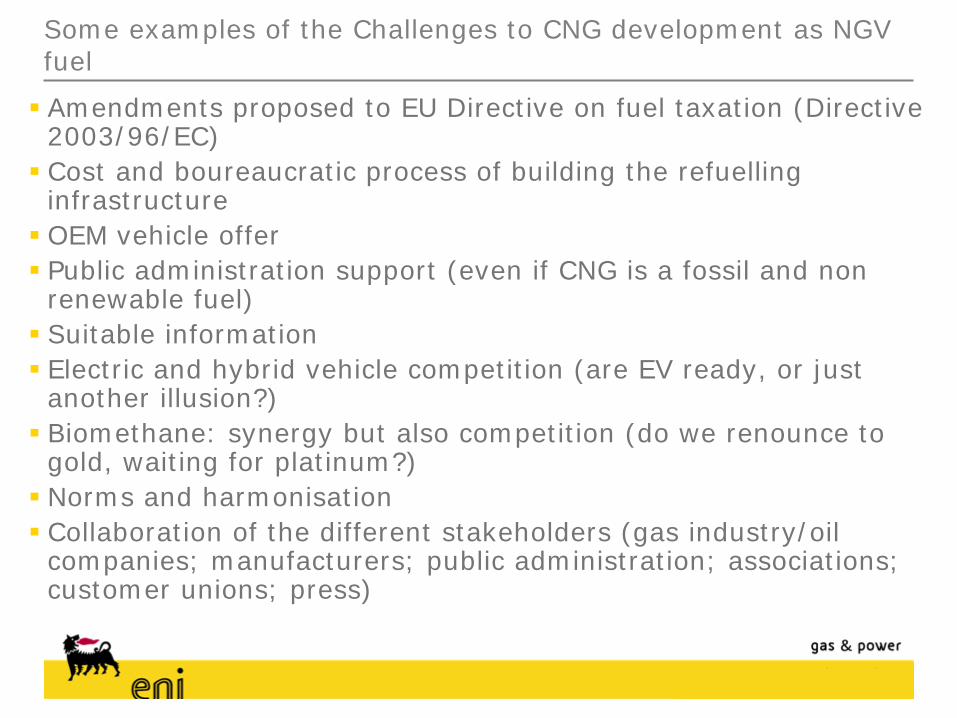
Some examples of the Challenges to CNG development as NGV fuel
Amendments proposed to EU Directive on fuel taxation (Directive 2003/96/EC)
Cost and boureaucratic process of building the refuelling infrastructure
OEM vehicle offer
Public administration support (even if CNG is a fossil and non renewable fuel)
Suitable information
Electric and hybrid vehicle competition (are EV ready, or just another illusion?)
Biomethane: synergy but also competition (do we renounce to gold, waiting for platinum?)
Norms and harmonisation
Collaboration of the different stakeholders (gas industry/oil companies; manufacturers; public administration; associations; customer unions; press)

53
Taxation directive
An amendment has been proposed to the Energy taxation Directive 2003/96/CE of the Council, which suggests to increase the minimum tax (excise) for CNG as a vehicle fuel, from 2.6 €/MJ in force today, to 9.6 €/MJ by 2018 (i.e. 370% increase).
By 2018 all fuels, gasoline, diesel, LPG, CNG would be subject to the same minimum tax of 9.6 €/MJ.
This would for sure destroy the NGV market in Europe.

54
The threat of the EU Directive 2003/96/EC on minimum taxation of energy and electricity (excise duties)

55
Recommendations
Set a target within reach; which fits the country characteristics
Make gas/oil/energy companies well aware of the potential of NGV.
Keep OEM and retrofit operators active in the NGV field
Keep constant relations with the PA; make them well acquainted with the value of the NGV option, compared to the other energy source alternatives for the transport system
Never relent fostering a favourable fiscal strategy
Provide for a comprehensive and fair set of standards, to ensure safety with reasonable development costs
Be a partner, and encourage patnership, in the combined promotion effort, even with your competitors on the energy market (e.g. by joining the associations)
www.eni.it
THANK YOU