NGTL System and Foothills Pipeline Customer Meeting€¢ Muster point is located on the plus-15...
38
NGTL System and Foothills Pipeline Customer Meeting May 11, 2017
Transcript of NGTL System and Foothills Pipeline Customer Meeting€¢ Muster point is located on the plus-15...

NGTL System and Foothills Pipeline Customer Meeting
May 11, 2017

2
Welcome
Safety Moment:
• In case of alarm or emergency, please proceed immediately to the ground-level exit
• Nearest stairs to ground-level exit are outside this room and directly to the left
• Muster point is located on the plus-15 level of 5th Avenue Place (425 1st Street SW)
Participating through WebEx:
• Please sign-in through WebEx application including your full name and company
• In response to customer requests to reduce background noise and improve audio quality,
all WebEx participants will be placed on mute
• Prior to commenting or asking a question, please remember to take yourself off mute and
identify yourself
Information provided herein is for informational purposes only and is not to be relied upon for any other purpose whatsoever. The information is based upon certain assumptions that may or may not be accurate, and therefore is subject to various risks and uncertainties. TransCanada shall not be liable for damages sustained as a result of any use or reliance on such information.

3
NGTL System
• Monthly Outage Forecasts
• Short Term Operational Plan (STOP)
• NGTL Current System Report
• System Utilization
• Presentations
• Plant Turnaround Information Form for
Receipt and Sales Stations
• Appendix 2: 2017 Facility Status Update
• NGTL System Simplified Map
Information Available on Customer Express Hyperlinks
Foothills System
• Monthly Outage Forecasts
• Short Term Operational Plan (STOP)
• Current System Report
• System Utilization
• Presentations
• Plant Turnaround Information Form for
Receipt and Sales Stations
Informational Postings
• Receipt and Delivery Availability Maps
• Capacity (Design, Major Borders)
• Bulletins
• Tariff
• NGTL System Transportation Rates &
Abandonment Surcharge
Informational Postings
• Capacity (Design, Major Borders)
• Notices
• Tariff

4
• Outage Communication Improvements
• Construction Material and Expansion Update
• Upstream James River Review and Outlook
Agenda
5
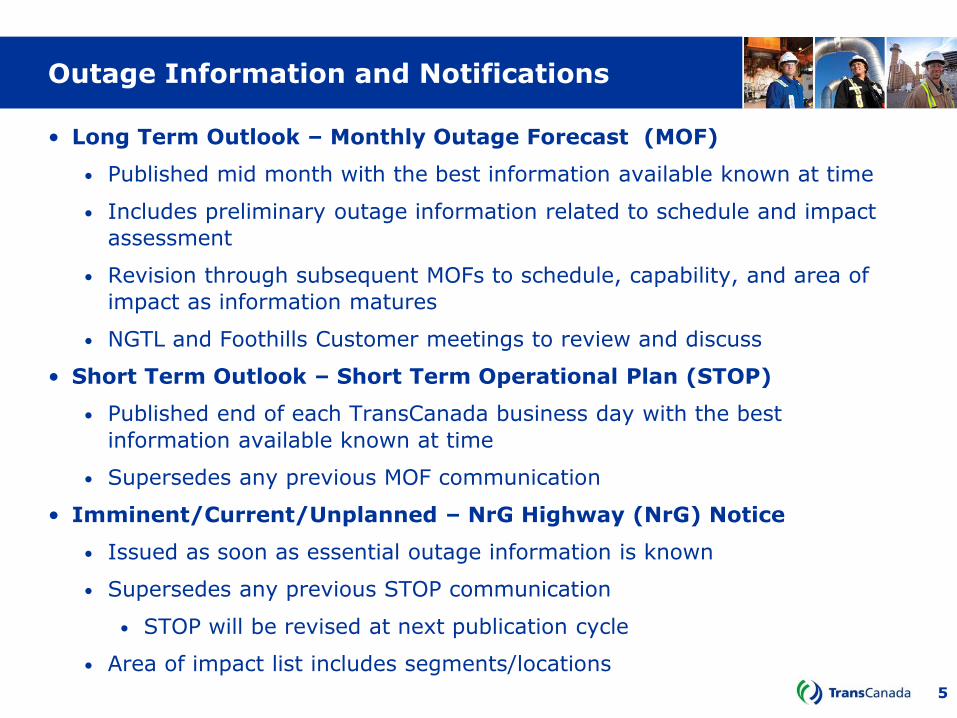
• Long Term Outlook – Monthly Outage Forecast (MOF)
• Published mid month with the best information available known at time
• Includes preliminary outage information related to schedule and impact
assessment
• Revision through subsequent MOFs to schedule, capability, and area of
impact as information matures
• NGTL and Foothills Customer meetings to review and discuss
• Short Term Outlook – Short Term Operational Plan (STOP)
• Published end of each TransCanada business day with the best
information available known at time
• Supersedes any previous MOF communication
• Imminent/Current/Unplanned – NrG Highway (NrG) Notice
• Issued as soon as essential outage information is known
• Supersedes any previous STOP communication
• STOP will be revised at next publication cycle
• Area of impact list includes segments/locations
Outage Information and Notifications

6
Past Improvements

7
Near Term Improvements (based on feedback)
• NrG Notices
• Template style format with minimal free form text – implementation May 23
• Short Term Operational Plan
• Review and refine USJR typical flow - completed Mar 22
• Align service restriction start/end dates with STOP entry – completed Mar 27
• Service restriction often starts before and ends after the outage
• Re-organize and simplify for ease of review and reference
• Change tracking mechanism
• Monthly Outage Forecast
• MOF information overlaps with and sometimes differs from STOP
• Roll MOF tabular information into STOP
• Continue to revise and post operational capability charts
Feedback: Be clear, concise, consistent, and timely

8
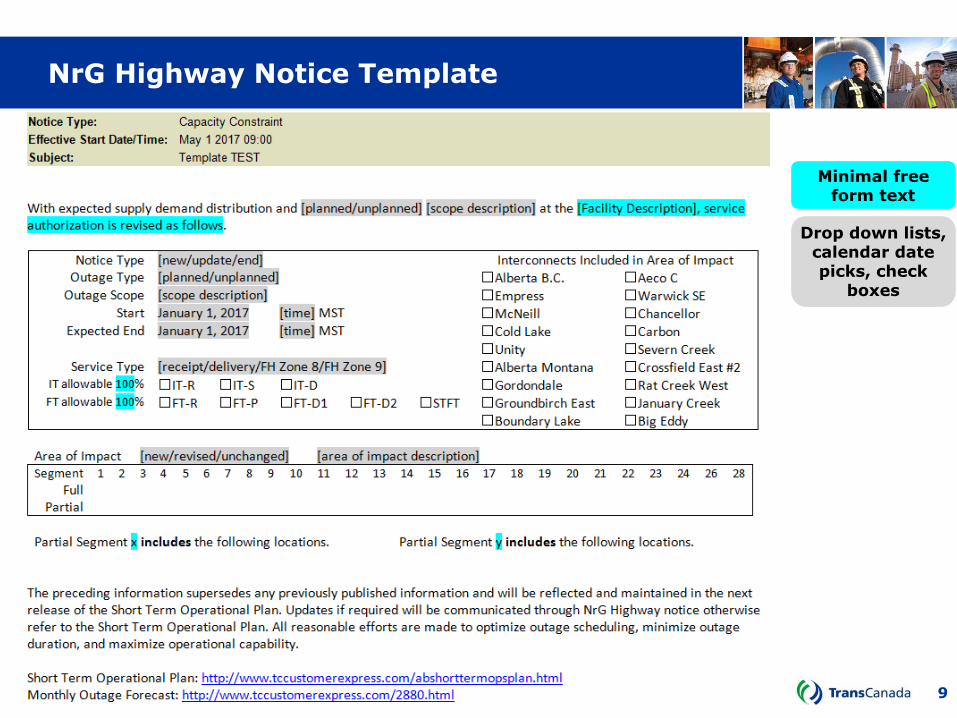
NrG Highway Notice Recent Example
9
NrG Highway Notice Template
Drop down lists, calendar date picks, check
boxes
Minimal free form text

10
NrG Highway Notice Sample
Downloadable list of all affected locations is under review

11
• Review the new format and provide feedback
through May 19, 2017
• Implementation planned for any notices issued on
and after May 23, 2017
Service Restriction Notice Format
Share your thoughts and ideas regarding future improvements with your Commercial representatives

12
Short Term Operational Plan Current Format – WGAT and EGAT
Export Capability (WGAT and EGAT)
Export Capability (Foothill B.C.)
Export Capability (Foothill Sask.)
Receipt and Delivery Capability (NGTL Locations/Areas)
Government Run Inspects
Plant Turnarounds

13
Short Term Operation Plan Current Format - Foothills B.C. and Sask.
Export Capability (WGAT and EGAT)
Export Capability (Foothill B.C.)
Export Capability (Foothill Sask.)
Receipt and Delivery Capability (NGTL Locations/Areas)
Government Run Inspects
Plant Turnarounds
14
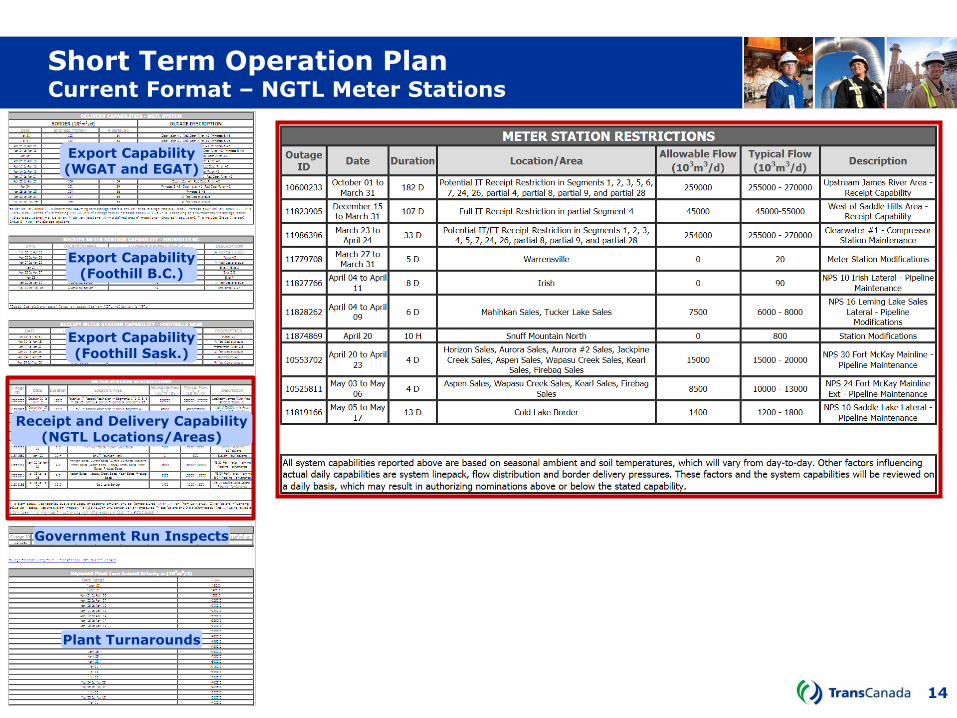
Short Term Operation Plan Current Format – NGTL Meter Stations
Export Capability (WGAT and EGAT)
Export Capability (Foothill B.C.)
Export Capability (Foothill Sask.)
Receipt and Delivery Capability (NGTL Locations/Areas)
Government Run Inspects
Plant Turnarounds

15
Short Term Operation Plan Current Format – GRIs and PTAs
Export Capability (WGAT and EGAT)
Export Capability (Foothill B.C.)
Export Capability (Foothill Sask.)
Receipt and Delivery Capability (NGTL Locations/Areas)
Government Run Inspects
Plant Turnarounds

16
Short Term Operation Plan Proposed Improvements in 2017
1. Provide link to a new service restriction dashboard
• Current service allowable status for affected areas/interconnects
• Link to relevant NrG Notice
2. Categorize by receipt, delivery, and interconnect
• Organize from receipt to delivery
• Separate Area and Local tables
• Government run inspections (GRI’s) incorporated into Local table
3. Provide link to reported plant turn around activity in chart format
• Available aggregate PTA data, separate receipt and delivery charts
4. All available outage information contained in one report
• Extend STOP timeline to incorporate MOF
• Provide links to all recent capability and historical flow charts
5. Provide link to STOP report data in CSV format
• Allows stakeholders to track changes according to their individual needs

17
Short Term Operation Plan Service Restriction Dashboard
NGTL and Foothills Service Allowable Dashboard
Areas Segments Locations
FT %
Allowable
IT %
Allowable
NrG
Notice
USJR 100 0 Mar 29
WGAT Partial 0 Mar 31
EGAT 100 Partial Apr 4
NEDA 100 Partial Apr 4
OSDA 100 100
Full 11,14 80 0 Mmm dd
Partial 4 100 0 Mmm dd
Footnotes

18
Short Term Operation Plan USJR Receipt Area
Upstream James River Receipt Area (USJR) USJR capability and historical flow (hyperlink) – Current Base Capability 268,000
Start
End
Capability (103m3/day)
Outage Description
Mar 23 Apr 24 262,000 Clearwater C/S unit 1 – unplanned maintenance
Apr 24 Apr 28 260,000 Alces River C/S – maintenance
May 8 May 12 255,000 Berland River C/S – maintenance
May 15 May 17 260,000 Meikle River B C/S – maintenance
May 23 May 25 262,000 Fox Creek C/S - maintenance
May 26 Jun 1 252,000 Gold Creek C/S – maintenance
Jun 6 Jun 16 242,000 NPS 42 EDSML Loop – inline inspection
Jun 7 Jun 12 [no additional impact] Wolf Lake C/S – maintenance
Jul 10 Jul 17 242,000 NPS 42 GPML Loop – modifications
Jul 17 Jul 21 258,000 Clearwater C/S unit 1 – maintenance
Jul 18 Jul 19 256,000 Clearwater C/S station– maintenance
Aug 12 Aug 21 212,000 NPS 48 EDSML Loop 3 - pipeline modifications
Aug 12 Aug 21 [no additional impact] NPS 36/42 GPML Loop - pipeline modifications
Aug 12 Aug 21 [no additional impact] NPS 36 GPML Loop - pipeline modifications
Aug 14 Aug 18 [no additional impact] Swartz Creek C/S - Station Maintenance
Aug 14 Aug 20 [no additional impact] Latornell C/S - Station Maintenance
Aug 30 Sep 3 240,000 NPS 36 GPML – pipeline modifications
Sep 5 Sep 7 252,000 Knight C/S station – maintenance
Sep 11 Sep 15 260,000 Woodenhouse C/S station – maintenance
Oct 2 Oct 20 257,000 Nordegg C/S station – maintenance
Oct 16 Oct 29 260,000 Paul Lake C/S unit 2 - maintenance
Oct 30 Dec 8 262,000 Clearwater C/S unit 5 – modifications
Footnotes

19
Short Term Operation Plan USJR Receipt Area Chart Mockup

20
Short Term Operation Plan Local Receipt Areas and Locations
Local Receipt Areas/Locations
Start
(Duration) End
Capability (103m3/day)
Typical Flow (103m3/day)
Service Allowable Location/Area
Outage Description
Apr 4 (2h) 0 330 Zero FT and Zero IT allowable Timberwolf
Government run inspection
Apr 4 Apr 11 0 90 Zero FT and Zero IT allowable Irish
NPS 10 Irish Lateral – inline inspection
Apr 20 (10h) 0 800 Zero FT and Zero IT allowable Snuff Mountain North
Snuff Mountain North - modifications
May 11 (10h) 1,300 2,600 Partial FT allowable Chickadee Creek West, Clark Lake, Kaybob, Two Creeks, Two Creeks East
NPS 20 Kaybob Lateral – inline inspection
Footnotes

21
Short Term Operation Plan WGAT Delivery Area and Foothills Zone 8 (FHZ8)
Western Gate (WGAT) Delivery Area Alberta B.C. capability and historical flow (hyperlink) – Current Base Capability 65,000
Start
End
Capability (103m3/day)
Outage Description
Mar 23 Apr 24 64,000 Clearwater C/S unit 1 – unplanned maintenance
Apr 4 Apr 5 51,000 Winchell Lake C/S station - maintenance
Apr 17 Apr 21 63,000 Burton Creek C/S unit 2 - maintenance
Apr 22 Apr 24 64,000 NPS 36 WASML Loop
May 8 May 12 62,000 Turner Valley C/S station – maintenance
May 9 May 11 60,000 Turner Valley C/S unit 2 – maintenance
May 29 Jun 2 56,000 Winchell Lake C/S station – maintenance
Jun 5 Jun 9 61,000 Burton Creek C/S station – maintenance
Jun 13 Jun 23 62,000 NPS 42 WASML Loop – inline inspection
Jul 10 Jul 23 62,000 NPS 24 South Lateral – inline inspection
Aug 9 Aug 18 56,000 NPS 36 WASML – inline inspection
Sep 14 Sep 18 63,000 Drywood C/S station – maintenance
Sep 22 Sep 29 58,000 NPS 36 Foothills Zone 7 – inline inspection
Footnotes
Foothills Zone 8 (FHZ8) Alberta B.C. capability and historical flow (hyperlink) – Current Base Capability 80,000
Start
End
Capability (103m3/day)
Outage Description
Apr 24 Apr 27 62,000 Elko C/S station - maintenance
May 8 May 12 59,000 Moyie C/S station - maintenance
May 30 May 31 52,000 Crowsnest C/S station - maintenance
Footnotes

22
Short Term Operation Plan EGAT Delivery Area and Foothills Zone 9 (FHZ9)
Eastern Gate Delivery Area (EGAT) Empress/McNeill capability and historical flow (hyperlink) – Current Base Capability 126,000
Start
End
Capability (103m3/day)
Outage Description
Mar 23 Apr 24 124,000 Clearwater C/S unit 1 – unplanned maintenance
Mar 29 Apr 9 121,000 Princess C/S unit 6 – unplanned maintenance
Apr 5 Apr 9 115,000 Beiseker C/S unit 1 – unplanned maintenance
Apr 11 Apr 13 119,000 Jenner C/S station - maintenance
May 9 May 18 125,000 NPS 34 EASML – inline inspection
May 16 May 19 126,000 Hussar C/S station – maintenance
Jul 4 Jul 14 124,000 Acme C/S station – maintenance
Footnotes
Foothills Zone 9 (FHZ9) Current Base Capability 75,000
Start
End
Capability (103m3/day)
Outage Description
Footnotes
23
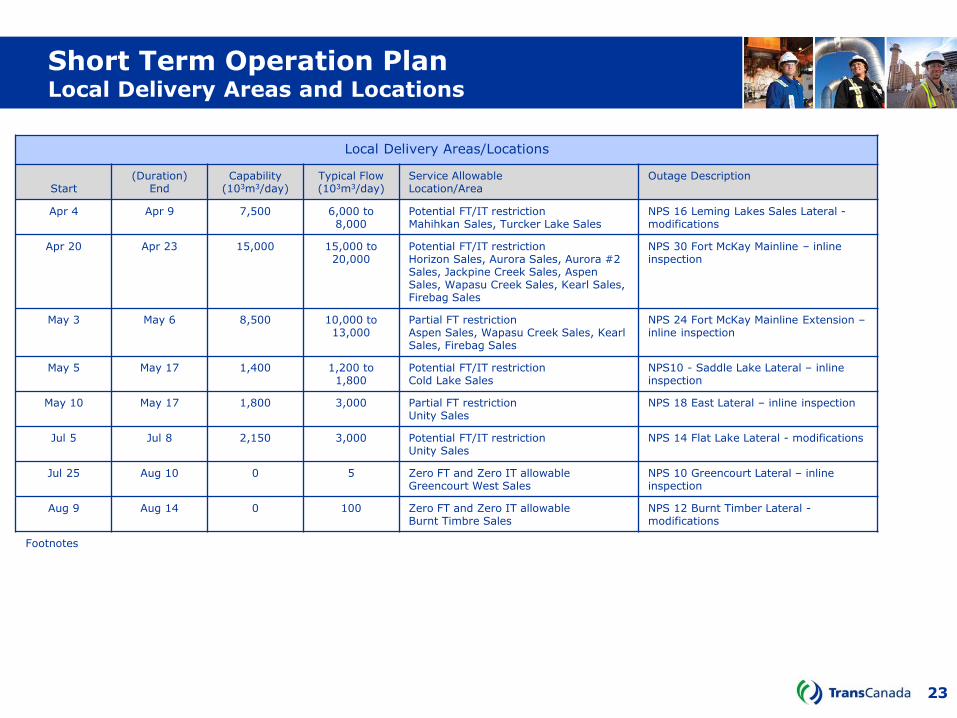
Short Term Operation Plan Local Delivery Areas and Locations
Local Delivery Areas/Locations
Start
(Duration) End
Capability (103m3/day)
Typical Flow (103m3/day)
Service Allowable Location/Area
Outage Description
Apr 4 Apr 9 7,500 6,000 to 8,000
Potential FT/IT restriction Mahihkan Sales, Turcker Lake Sales
NPS 16 Leming Lakes Sales Lateral - modifications
Apr 20 Apr 23 15,000 15,000 to 20,000
Potential FT/IT restriction Horizon Sales, Aurora Sales, Aurora #2 Sales, Jackpine Creek Sales, Aspen Sales, Wapasu Creek Sales, Kearl Sales, Firebag Sales
NPS 30 Fort McKay Mainline – inline inspection
May 3 May 6 8,500 10,000 to 13,000
Partial FT restriction Aspen Sales, Wapasu Creek Sales, Kearl Sales, Firebag Sales
NPS 24 Fort McKay Mainline Extension – inline inspection
May 5 May 17 1,400 1,200 to 1,800
Potential FT/IT restriction Cold Lake Sales
NPS10 - Saddle Lake Lateral – inline inspection
May 10 May 17 1,800 3,000 Partial FT restriction Unity Sales
NPS 18 East Lateral – inline inspection
Jul 5 Jul 8 2,150 3,000 Potential FT/IT restriction Unity Sales
NPS 14 Flat Lake Lateral - modifications
Jul 25 Aug 10 0 5 Zero FT and Zero IT allowable Greencourt West Sales
NPS 10 Greencourt Lateral – inline inspection
Aug 9 Aug 14 0 100 Zero FT and Zero IT allowable Burnt Timbre Sales
NPS 12 Burnt Timber Lateral - modifications
Footnotes

24
• Review proposed improvements discussed today and provide feedback through May 31, 2017
• Are we moving in the right direction?
• What refinements to the proposal would you like to see?
• Next Steps
• Requirements finalization and definition, Jun 2017
• Software modification/testing, Jul through Aug 2017
• Tentative implementation, Sep 2017 (pending more detailed review and implementation planning)
Proposed Improvements to STOP
Share your thoughts and ideas regarding future improvements with your Commercial representatives

25
Outage Communication Improvements

26
Construction Material Background
• One elbow used in recent construction
did not meet TransCanada specifications
• Investigation expanded the focus to
specific components from one fitting
manufacturer used on specific projects
after 2010 with potential for similar
issues
• Rigorous investigation, including
extensive materials testing and
Engineering analysis is complete
Operational consequence is currently limited to availability of three facilities

27
• Specific in-service facilities are limited to not exceed historical maximum pressure and temperature – safe and reliable operation
• No expected impact to normal system operation or throughput
• Three facilities recently constructed are delayed or unavailable
• Meikle River D, Goodfish, and Leismer East compressor stations
• No impact to normal system operation or throughput
• Resolution expected by end of Q3 2017 (subject to NEB approvals)
• Meikle River D leave to open application submitted Mar 22, approved Apr 21
• Commissioning in progress – expected onstream May 2017
• Goodfish leave to open submission expected May 2017
• Single engineering assessment for all in service facilities to lift the pressure and temperature limitations – EA submission expected Jun 2017
• Includes Leismer East C/S
Construction Materials Response
Meikle River D and Goodfish - originally expected onstream Nov 2016 Leismer East – was onstream Jul 2016

28
In Progress
NWML Loop (Boundary Lake)
Meikle River D
Goodfish
Upstream James River Expansion Update
Alces B3
Otter Lake B2
Expansion Facility
Expected Onstream
Meikle River D C/S
NWML Loop (Bear Canyon)
Liege Lateral Loop 2 (Pelican)
NWML Loop (Boundary Lake)
Goodfish C/S
GPML Loop 2 (McLeod River)
outage Aug 12 to 21
Alces River B C/S Unit 3
Otter Lake B C/S Unit 2
May 2017
May 2017
Jun 2017
Jun 2017
Jul 2017
Sep 2017
Nov 2017
Nov 2017
NWML Loop (Bear Canyon)
GPML Loop No.2 (McLeod River)
Leige Loop (Pelican Section)
Outage Required
Design capability increases are provided in the NGTL Annual Plan and operational capability increases are provided in MOF charts.
Onstream

29
Construction Material and Expansion Update

30
• FT Service Restrictions 2015, 2016, 2017
• Unusual operational constraints resolved
• Impactful pipeline MOP de-rates resolved
• Capability addition through expansion in progress
• USJR receipt flow increase
Upstream James River Review

31
USJR Capability Review and 2017 Outlook
NEB Derate CLWTR-1 CLWTR-5
MEKRB MEKRD
GFISH
160
170
180
190
200
210
220
230
240
250
260
270
280
290
300
310
(106m3/day)
operational constraints and pipeline MOP derates resolved
significant expansion facilities onstream through 2017
optimized 2017 outage plan
2015 95 days
2017 Q1
13 days 2016 90 days
Bcfd
6.0
7.0
8.0
9.0
10.0
11.0
FT Restrictions

32
2015 2016 2017, Q1
average FT contracted 8.5 Bcf/d 9.9 Bcf/d 10.5 Bcf/d
average all facilities available capability 8.5 Bcf/d 9.3 Bcf/d 9.7 Bcf/d
average flow 8.0 Bcf/d 8.6 Bcf/d 9.1 Bcf/d
days with 100% FT and >0% IT (% of time)
140 (38%)
144 (39%)
49 (53%)
days with 100% FT and 0% IT (% of time)
130 (36%)
132 (36%)
30 (33%)
days with FT allowable <100% (% of time)
95 (26%)
90 (25%)
13 (14%)
FT contract utilization when FT allowable 100% or greater
93% 85% 87%
average FT allowable when FT allowable <100%
93% 83% 85%
FT contract utilization when FT allowable <100%
95% 95% 98%
average flow impact during FT restriction (% of average flow)
440 mmcf/d (5.5%)
400 mmcf/d (4.7%)
350 mmcf/d (3.9%)
annualized average flow impact during FT restriction
(% of average flow)
115 mmcf/d (1.4%)
98 mmcf/d (1.2%)
51 mmcf/d (0.6%)
Upstream James River Service Statistics

33
2017 Q1 FT Utilization
FT allowable when required to accommodate maintenance averaged 85% in 2017 Q1 (4% or 350 mmcfd reduction in flow)
60
65
70
75
80
85
90
95
100
Group A Group B Group C
100% FT, 0% IT allowable
Results in 87% FT utilization
in aggregate
34
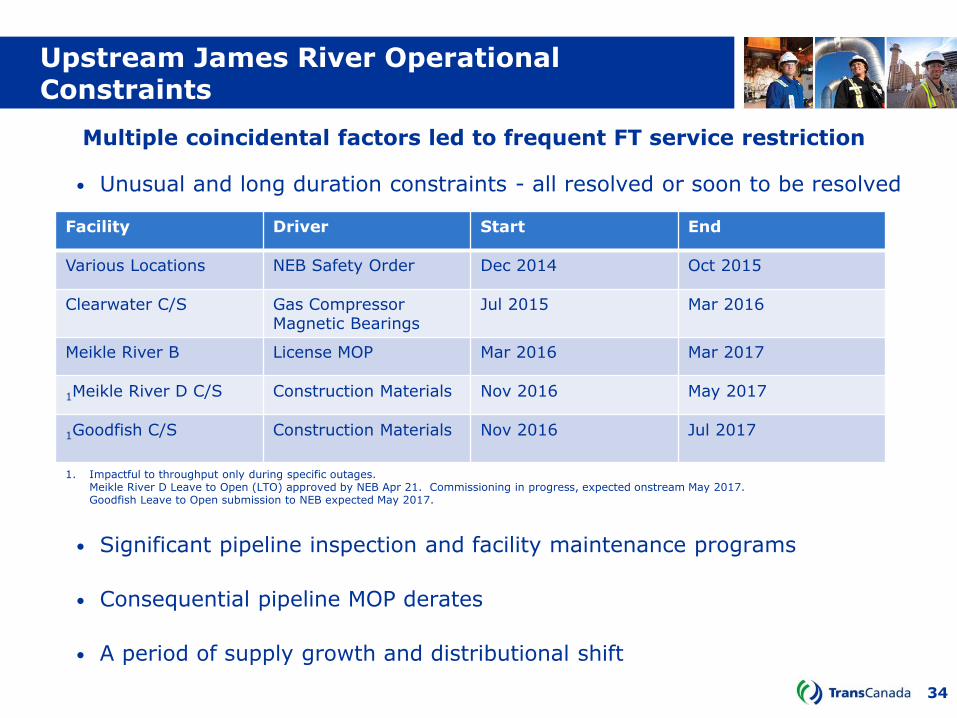
Upstream James River Operational Constraints
Multiple coincidental factors led to frequent FT service restriction
• Unusual and long duration constraints - all resolved or soon to be resolved
• Significant pipeline inspection and facility maintenance programs
• Consequential pipeline MOP derates
• A period of supply growth and distributional shift
Facility Driver Start End
Various Locations NEB Safety Order Dec 2014 Oct 2015
Clearwater C/S Gas Compressor Magnetic Bearings
Jul 2015 Mar 2016
Meikle River B License MOP Mar 2016 Mar 2017
1Meikle River D C/S Construction Materials Nov 2016 May 2017
1Goodfish C/S Construction Materials
Nov 2016 Jul 2017
1. Impactful to throughput only during specific outages. Meikle River D Leave to Open (LTO) approved by NEB Apr 21. Commissioning in progress, expected onstream May 2017. Goodfish Leave to Open submission to NEB expected May 2017.

35
• Capability Expectations
• Largely unconstrained by pipeline MOP derates
• Ongoing Pipeline Integrity Programs
• Optimized 2017 outage program
• 2018 outage program planning underway
• Capability addition through expansion
• USJR receipt flow and resulting FT service reliability?
Upstream James River Outlook for 2017
Maintenance events have been executed recently with no impact to FT service
36
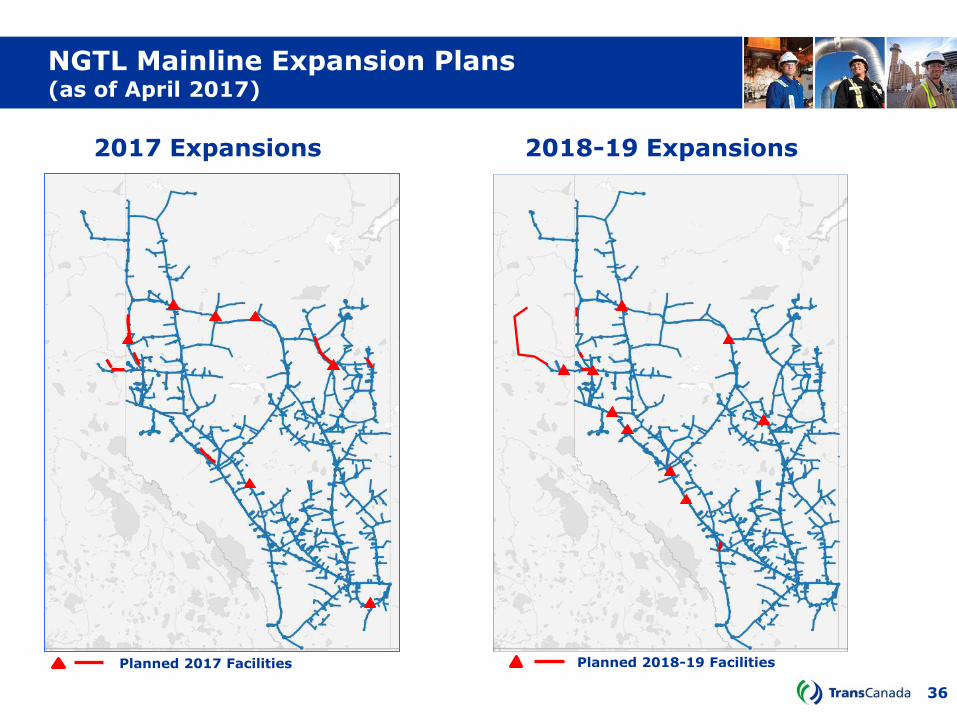
NGTL Mainline Expansion Plans (as of April 2017)
Planned 2017 Facilities Planned 2018-19 Facilities
2017 Expansions 2018-19 Expansions

37
Continuous Improvement Focus Areas
• Planning and Scheduling
• How can planning and scheduling be refined to maximize
throughput?
• Condition monitoring and preventative maintenance
• What risk factors which lead to unplanned outages can
be mitigated?
• Outage execution
• What outage work activities be complete without an
outage?
Strategies and opportunities to maximize operational capability are constantly under review

38
Upstream James River Review and Outlook