NGA Panel on Renewable Energy Ken Beiser, Managing Director
24
NGA Panel on Renewable Energy Ken Beiser, Managing Director 09/12/13
Transcript of NGA Panel on Renewable Energy Ken Beiser, Managing Director

NGA Panel on Renewable Energy
Ken Beiser, Managing Director
09/12/13

Incentive Types Policy/Regulation/ Incentive Description No. of States offers
Renewable Portfolio Standard Solar Set-aside (SRECs)
Law for utilities to procure certain amount of specific type of technology such as solar or DG. Leads to the creation and trade of SRECs.
16 states + DC
Tax Credit Reduce tax payment by % of PV system cost 22 states + DC
Net Metering Allow to bank excess electricity on the grid and reduce bill 43 states + DC
Rebate Partial refund to purchased systems 15 states + DC
Sales Tax Exemption Elimination of the sales taxes owed for purchased systems 21 states
Property Tax Exemption Elimination of the property taxes owed for purchased systems installed on house/building 30 states

What Makes a Good Incentive? • Long-Term Value • Transparency • Simplicity • Utility Response • Liquidity • Certainty

Long-Term Value Upfront cost reductions are great: lower initial costs. But tie to production is sensible, and good for taxpayers/ratepayers. Long and medium term SREC contracts are to be encouraged!
• NJ “SREC Loan Programs” • MA SREC Auction mechanism – soft ‘floor’ price is intended • CT ZREC Program • Utility tenders over 5 years are helpful. Spot/ Near term tenders
are not. – Utility SREC tenders that have the same collateral requirements as
energy tenders are difficult for commercial customers – Collateral structured as loans works (PSEG Solar 4 All) – A lien mechanism within an RPS registration should be possible.

Transparency • How many facilities, where, when: allow prediction of supply
– Massachusetts DOER SQA list – Massachusetts DOER Distributed Generation & Interconnection List – PJM List of Installed Facility
• Purchases and sales of SRECS validates Prices and Quantities – (PJM) High, low and average of monthly deliveries is helpful but not
enough. Volume is meaningful in a retail vs. wholesale market where aggregation is expensive. Don’t need to know buyers and sellers
– (NEPOOL) no transparency to volume or price sold.
• Contract/Award Values – CT ZREC Program Publishes Bids – CA status of steps
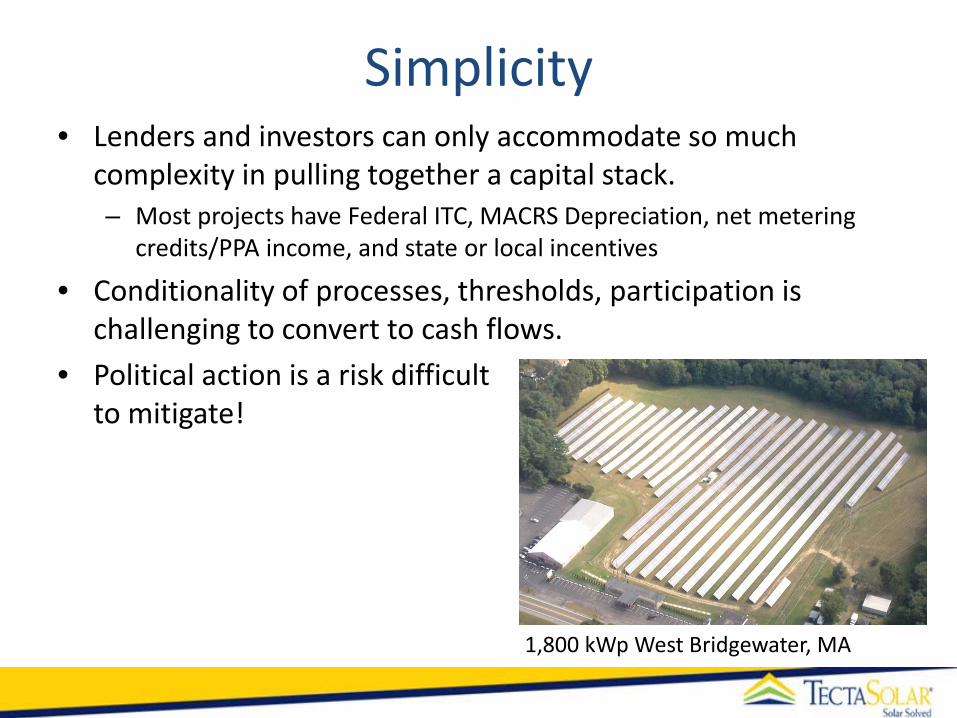
Simplicity • Lenders and investors can only accommodate so much
complexity in pulling together a capital stack. – Most projects have Federal ITC, MACRS Depreciation, net metering
credits/PPA income, and state or local incentives
• Conditionality of processes, thresholds, participation is challenging to convert to cash flows.
• Political action is a risk difficult to mitigate!
1,800 kWp West Bridgewater, MA

Utility Response • Net Metering/Interconnection limits match or exceed
available incentives – Individual projects and total installed capacity
• Utilities compelled to follow timeline – Delays in impact studies and interconnection jeopardize projects
• MD rooftop projects (100 – 800 kWp) – 3 weeks • NY rooftop projects (950 kWp) – 6 weeks • MA rooftop projects (400 – 1000 kWp) – 4 months • MA rooftop projects (1000 kWp+) – 8 months • MA ground projects (1000 – 7000 kWp) – 8+ months
• Utility “buy in” and cooperation materially reduces cost to build

Liquidity of Incentives • Some liquidity serves as a reference for the whole market,
provides comfort that there is validation of values, highlights changing risks and rewards.
• Incentive ‘lock-down’ excludes participants - E.g. State tax credits confine benefit to one type investor • Liquidity helped when speculative buyers to stand equivalent
to originators or utilities. – Both Speculators and Project Owners able to deposit SRECs into
Clearinghouse

Certainty • Legislative Risk
– Federal Investment Tax Credit expired in 2008 and 2009. Solar developers stopped developing new projects
– Pennsylvania Solar Tax Credit Repealed in 2009/2010 – A few states have discussed repealing RPS
• Availability of Incentives – Reservation queues needed – Incentives assured before construction begins
500 kWp, Harleysville, PA

Returns as a function of SRECs Includes value of Federal ITC, MACRS on this 1 MWp project
State Washington DC Maryland Massachusetts Maryland at
Market New Jersey Virginia
SREC Assumptions 60% of ACP
5-year forward at
$120 5-year forward at
$200 35% of ACP
5 year forward at
$150 Spot at $10 Insolation Factor 1226 1227 1209 1227 1185 1274 IRR 15.4% 8.0% 12.2% 7.0% 9.7% 1.7% Avoided Cost of power 0.134 0.118 0.145 0.118 0.139 0.077
0.0%2.0%4.0%6.0%8.0%
10.0%12.0%14.0%16.0%18.0%
IRR
IRR
Basic Assumptions System Size 938 System Price $2.20/watt PPA Rate .065/watt PPA Term 20 Escalator 2.75%

Number of Installs
http://openpv.nrel.gov/visualization/index.php
States with a high number of installs have/had incentives and policies designed to encourage distributed generation projects. Solar potential and high electric prices can supplement.

Installed Capacity
http://openpv.nrel.gov/visualization/index.php
States with a high installed capacity may also support large utility scale projects.

Solar Installed Cost

Installed Cost vs MD SRECs
Q1
2011
Q1
2013

MD Spot SREC Prices
Source: SREC Trade

MD Annual Installs
Source: NREL PV Market Mapper
Start of Solar Carveout in RPS

NJ Spot SREC Prices
Source: SREC Trade
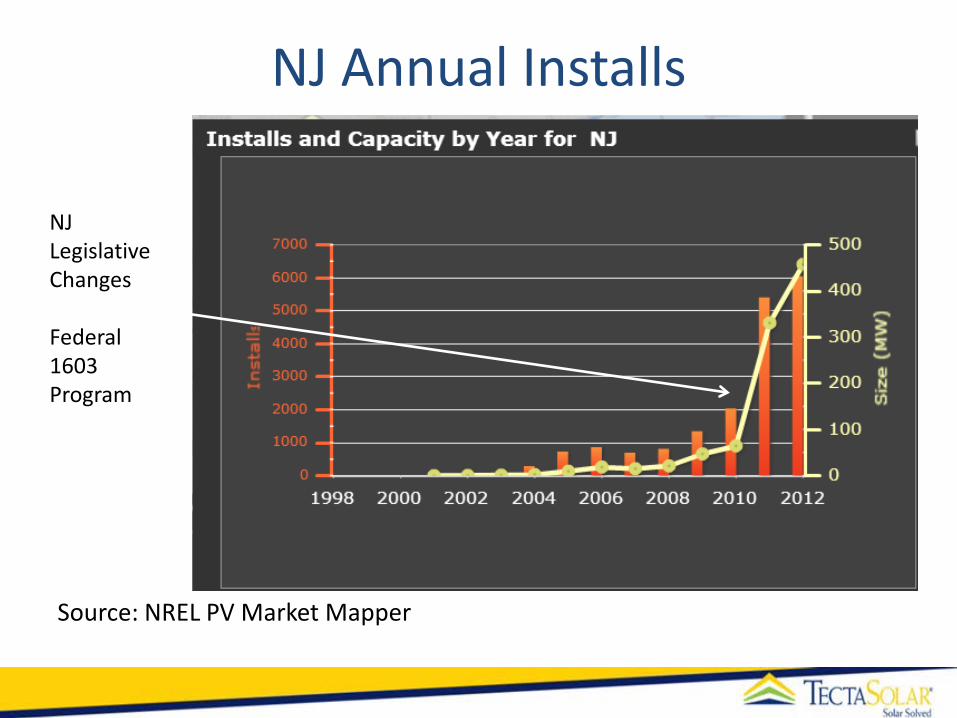
NJ Annual Installs
Source: NREL PV Market Mapper
NJ Legislative Changes Federal 1603 Program

PA Spot SREC Prices
Source: SREC Trade

PA Annual Installs
Source: NREL PV Market Mapper
PA Commonwealth Financing Authority Grants

Retail Commercial Electricity

Energy Efficiency ≠ Renewable DG Energy Efficiency incentives should not be treated as a 1:1 parity to incentives for Alternative Energy Distributed Generation projects (AE projects). a) EE projects are not as easy to quantify power savings benefits - there is no meter. AE
has a kWh meter. EE estimates are “biased towards optimism”. b) EE Projects are inherently in part replacing investment that would have occurred
without incentive. AE is all new investment, there is no leakage to sweeten a open market viable investment activity.
c) EE Project's time of use (TOU) savings are unknown, and vary greatly from project to project. Absent these TOU queues, project incentives are mixed and policy guesses are made. Solar production is highly predictable (P(90) is typically within 7% of the mean). AE incentives may be fit to local TOU needs: an RPS or Bid for Incentive program does this using a market-mediated incentive.
d) EE Projects’ benefits to society are more likely to end when a location changes use. Closed facilities, or altered uses, may ameliorate the benefits. Short of a tear down, a rooftop solar facility will survive any change of use, or non-use and generate power to the grid at de minimus marginal cost. (under $0.002/kWh in the northern US) These are not reasons for ignoring EE, just don't presume it should be treated as 1:1 with AE.

About Tecta Solar Tecta Solar is a division of Tecta America, a national contractor. Focus: Commercial and small utility-scale projects: 200 kW to 10 MW. Customers are industry, municipalities, real estate developers, schools. We are the general contractor for our installations – our employees do the installations. Subcontract electrical work locally. To provide a full solar package:
PPAs structured Tax and financial leasing, debt placement Incentive capture, SREC monitization (selling only for our own projects) Operations and maintenance
Tecta America is the largest commercial roofer in the US, with 3,000 employees, $420 million in 2011 Sales.