Basin Impacts of Irrigation Water Conservation Policy In Press, Ecological Economics
NFRWSP: Conservation/Irrigation
Efficiency Methods Briefing
Jennifer Gihring SJRWMD
February 17, 2015
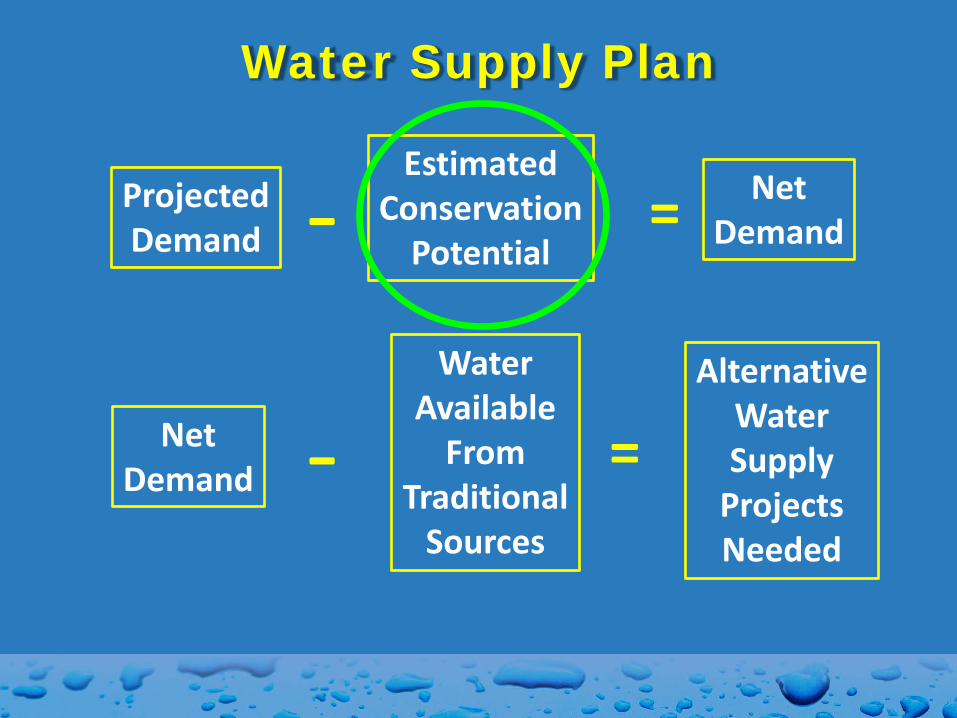
Water Supply Plan
Projected Demand
Estimated Conservation
Potential
Net Demand
Net Demand
Water Available
From Traditional
Sources
Alternative Water Supply
Projects Needed
= -
- =
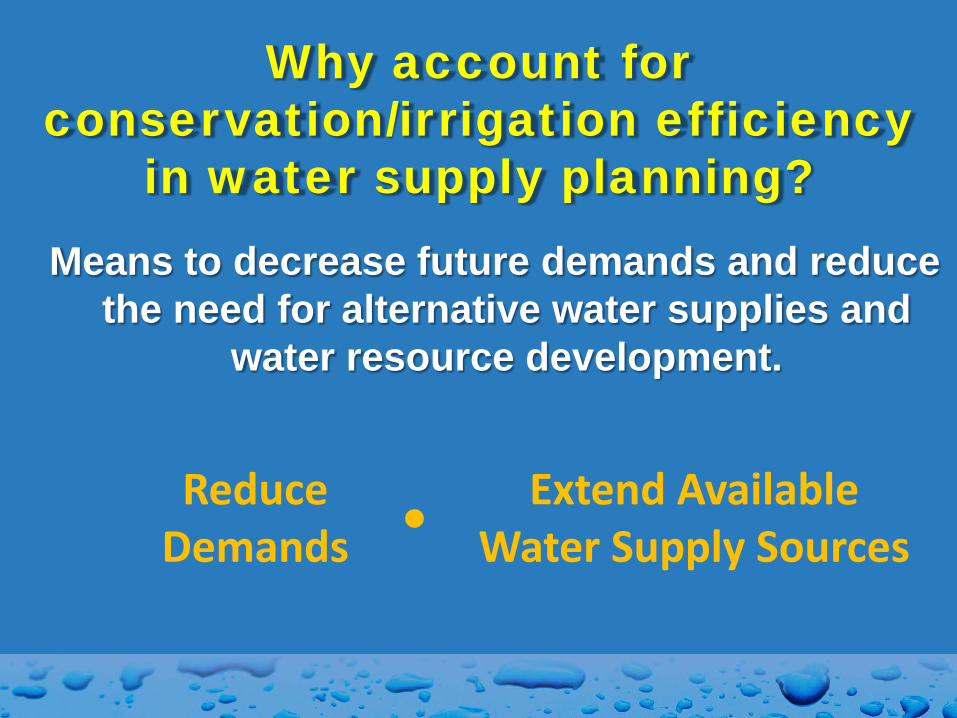
Why account for conservation/irrigation efficiency
in water supply planning? Means to decrease future demands and reduce
the need for alternative water supplies and water resource development.
Reduce Demands
Extend Available Water Supply Sources
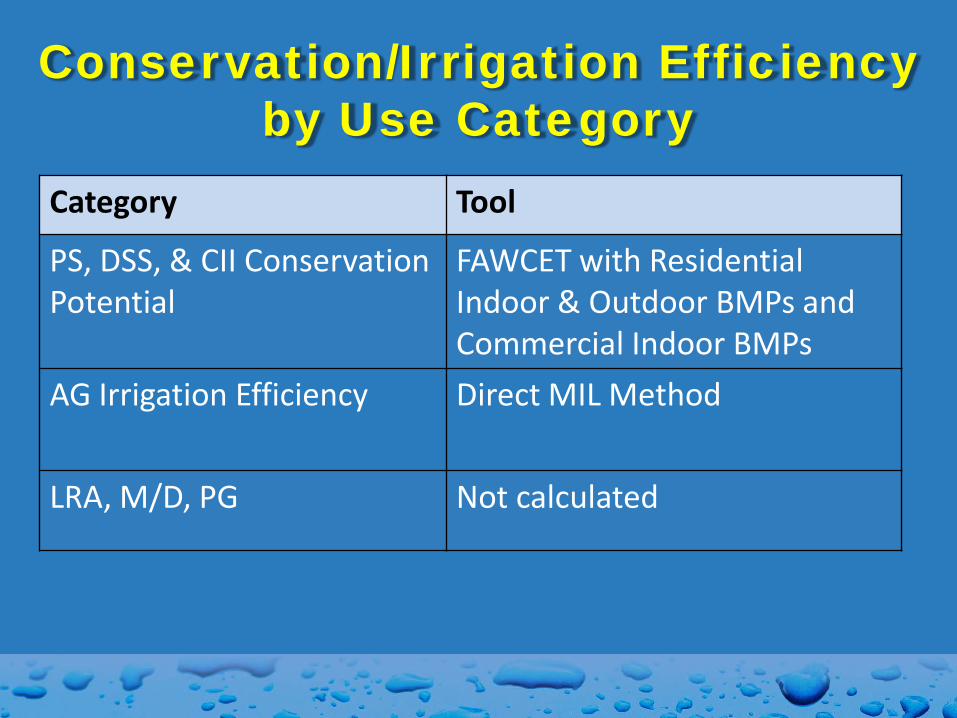
Conservation/Irrigation Efficiency by Use Category
Category Tool
PS, DSS, & CII Conservation Potential
FAWCET with Residential Indoor & Outdoor BMPs and Commercial Indoor BMPs
AG Irrigation Efficiency Direct MIL Method
LRA, M/D, PG Not calculated
Conservation and Irrigation Efficiency
SAC briefed on conservation tools in July 2013
BMPs in the tools help quantify
potential conservation & irrigation efficiency. They do not require or limit
what water users choose to implement.
Conservation Potential Tool: FAWCET
• Florida Automated Water Conservation Estimation Tool (FAWCET)
• Analyzes conservation potential (volume & cost) for indoor residential use, outdoor use, and publicly supplied commercial uses
• Optimization can run to meet different goals: volume, gpcd, or budget.
How FAWCET Works • Join account-level data from utilities to
property appraiser parcels. • Use account-level data to generate
residential load profiles relative to property characteristics.
• Set starting assumptions/constraints. • Linear programming optimization to select
the most cost effective BMPs.
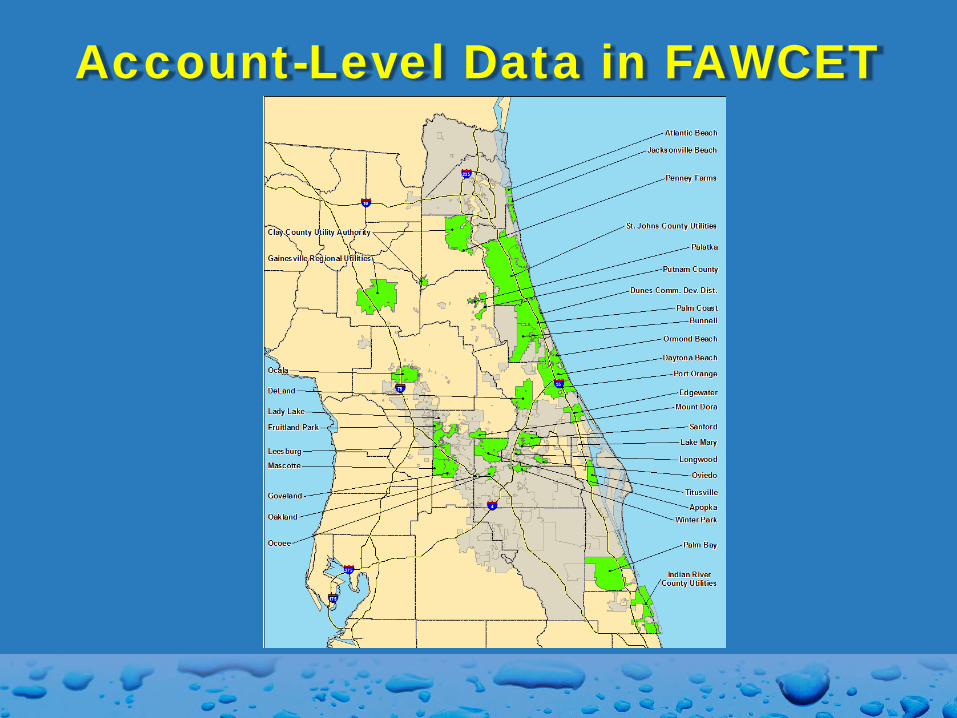
Account-Level Data in FAWCET
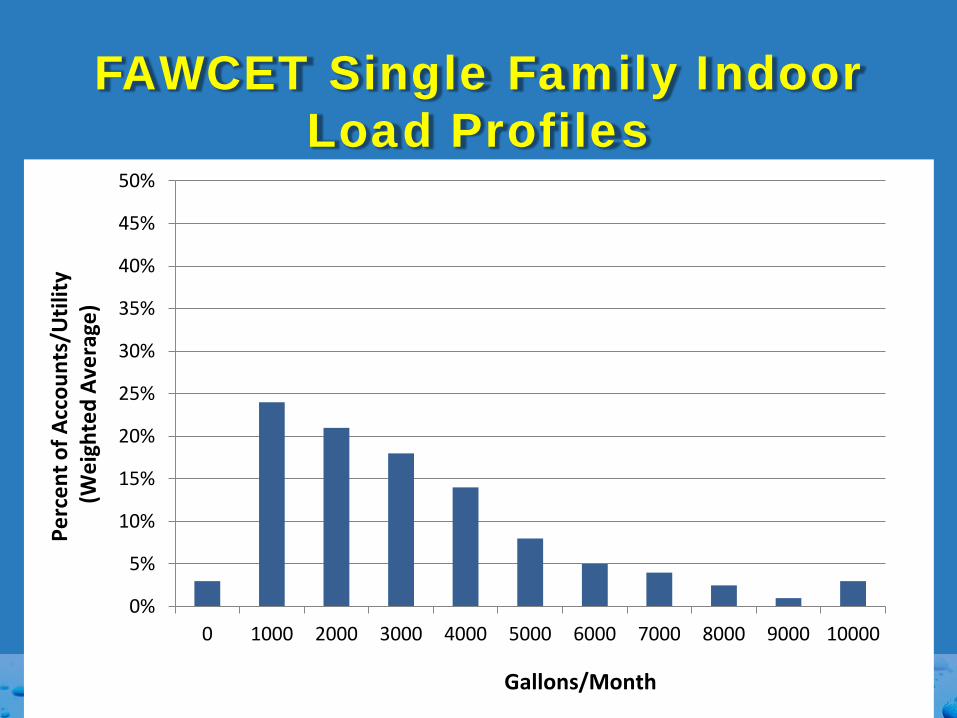
FAWCET Single Family Indoor Load Profiles
0%
5%
10%
15%
20%
25%
30%
35%
40%
45%
50%
0 1000 2000 3000 4000 5000 6000 7000 8000 9000 10000
Gallons/Month
Perc
ent o
f Acc
ount
s/U
tility
(W
eigh
ted
Aver
age)
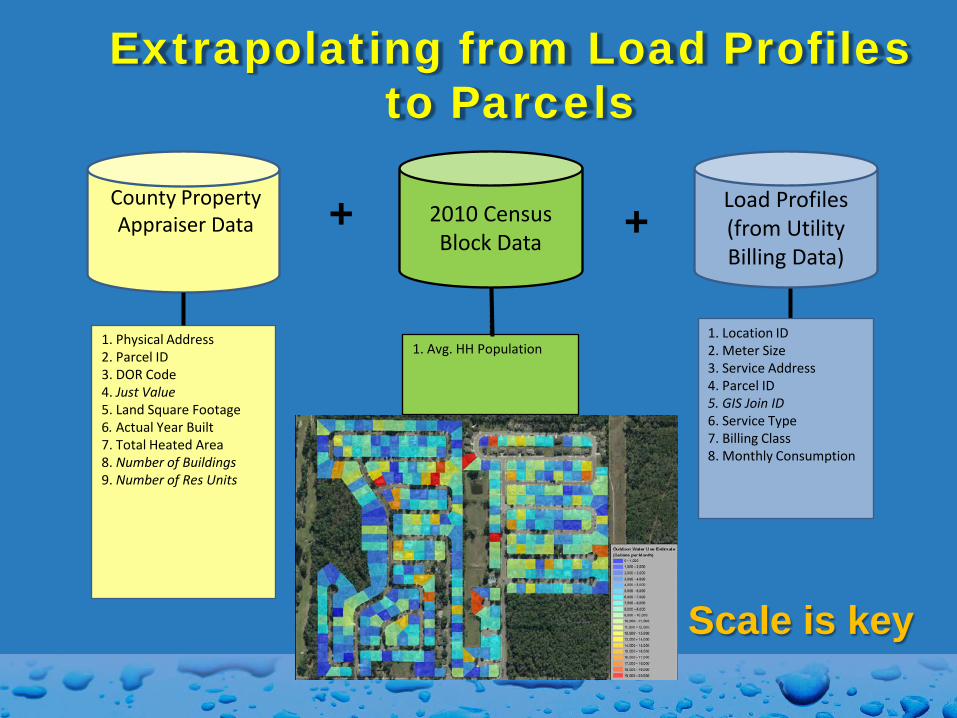
Extrapolating from Load Profiles to Parcels
+ 2010 Census Block Data
1. Avg. HH Population
Load Profiles (from Utility Billing Data)
1. Location ID 2. Meter Size 3. Service Address 4. Parcel ID 5. GIS Join ID 6. Service Type 7. Billing Class 8. Monthly Consumption
1. Physical Address 2. Parcel ID 3. DOR Code 4. Just Value 5. Land Square Footage 6. Actual Year Built 7. Total Heated Area 8. Number of Buildings 9. Number of Res Units
County Property Appraiser Data
+
Scale is key
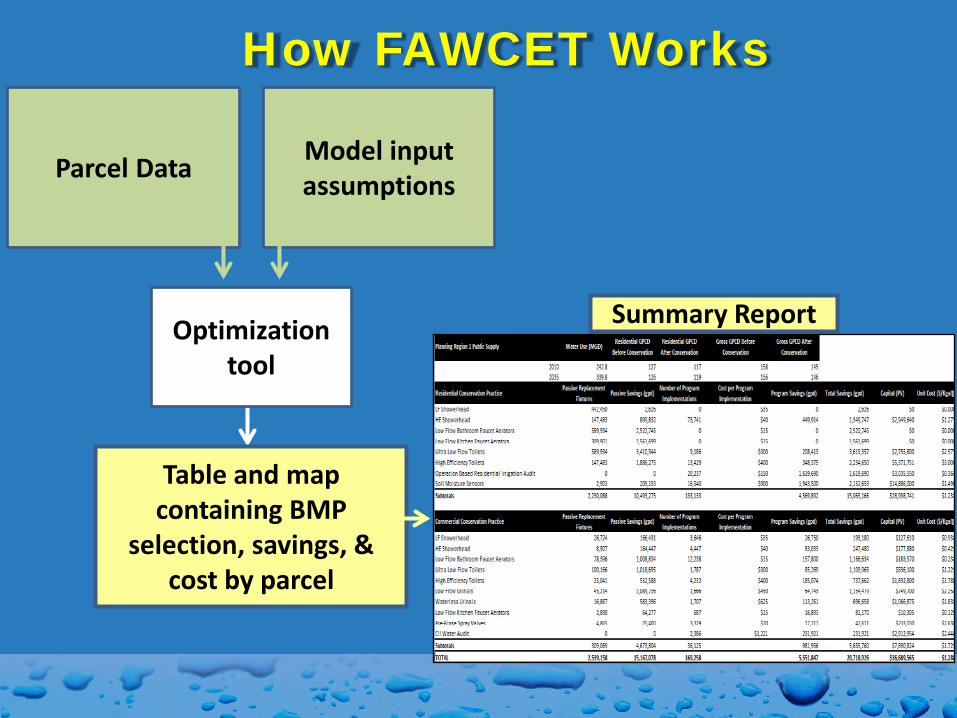
How FAWCET Works
Parcel Data Model input assumptions
Summary Report
Table and map containing BMP
selection, savings, & cost by parcel
Optimization tool
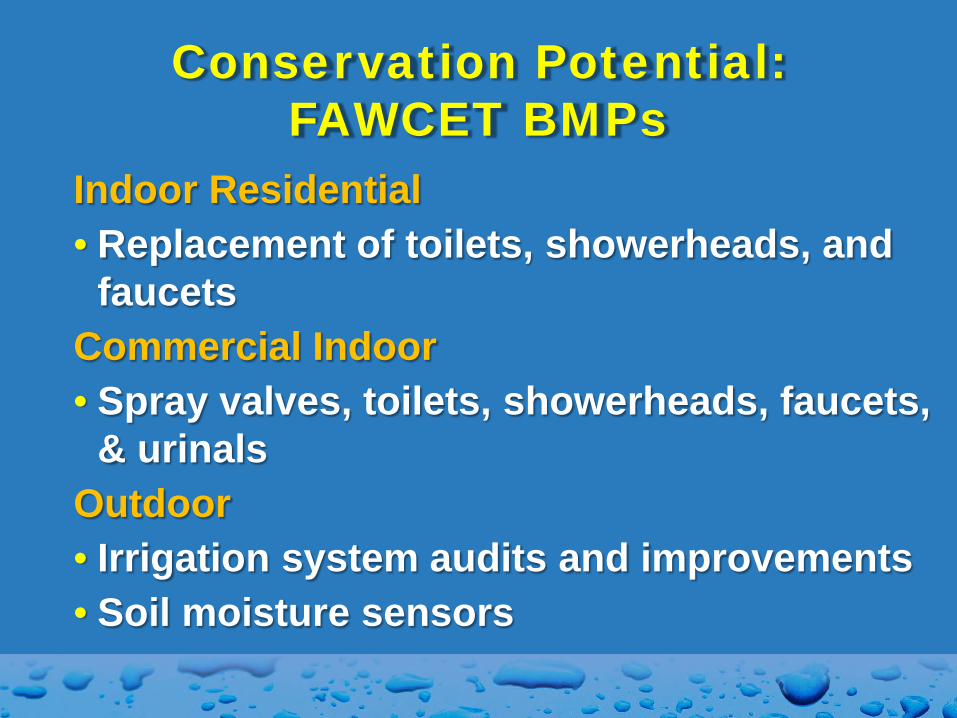
Conservation Potential: FAWCET BMPs
Indoor Residential • Replacement of toilets, showerheads, and
faucets Commercial Indoor • Spray valves, toilets, showerheads, faucets,
& urinals Outdoor • Irrigation system audits and improvements • Soil moisture sensors
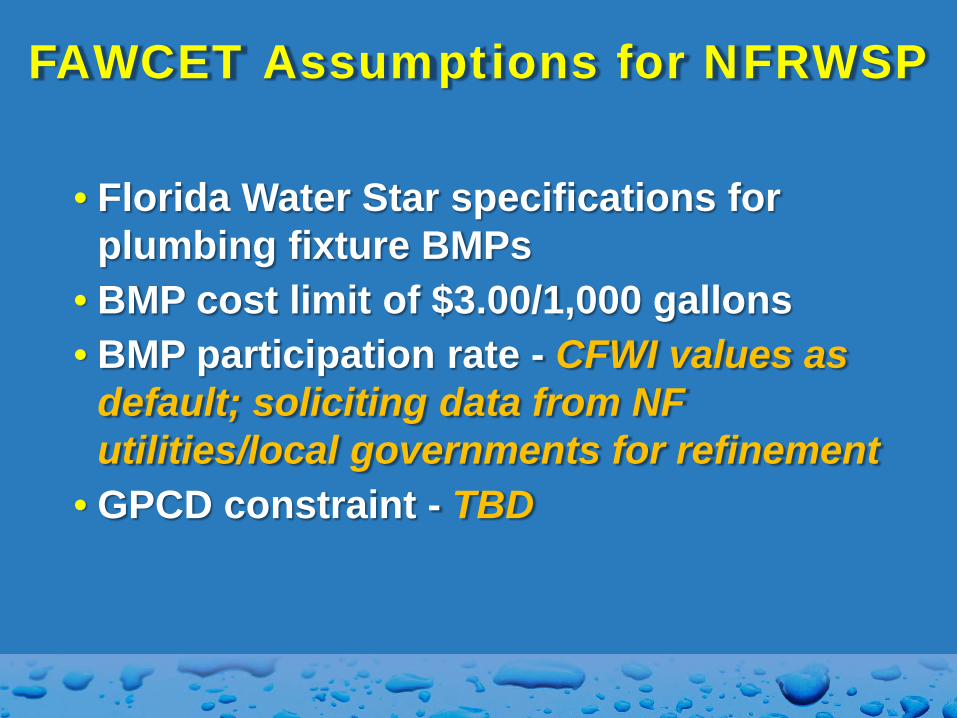
FAWCET Assumptions for NFRWSP
• Florida Water Star specifications for plumbing fixture BMPs
• BMP cost limit of $3.00/1,000 gallons • BMP participation rate - CFWI values as
default; soliciting data from NF utilities/local governments for refinement
• GPCD constraint - TBD
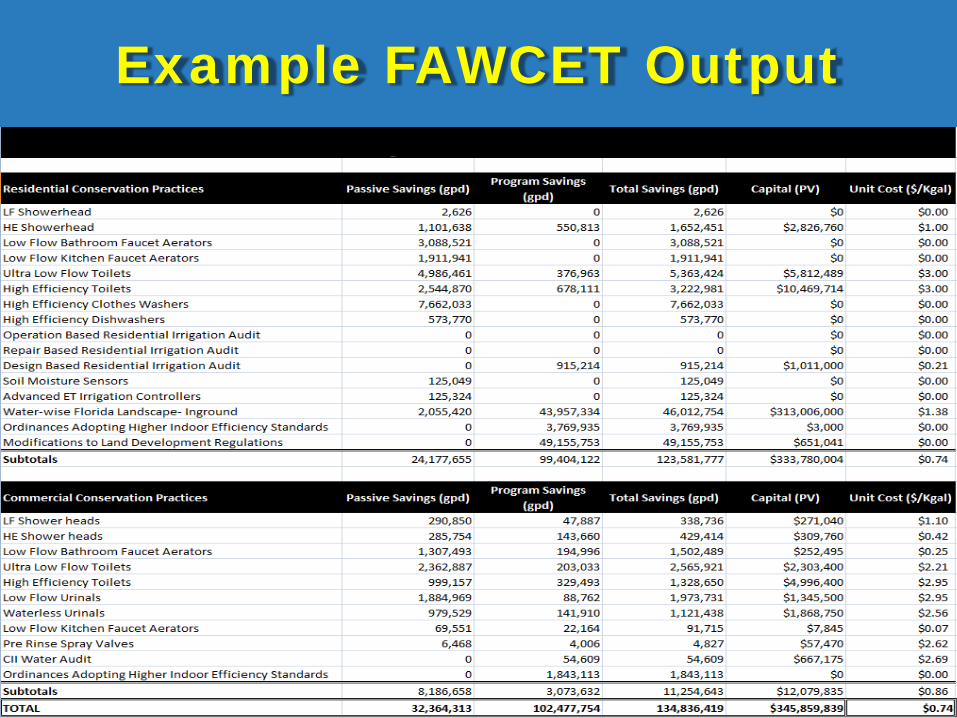
Example FAWCET Output l
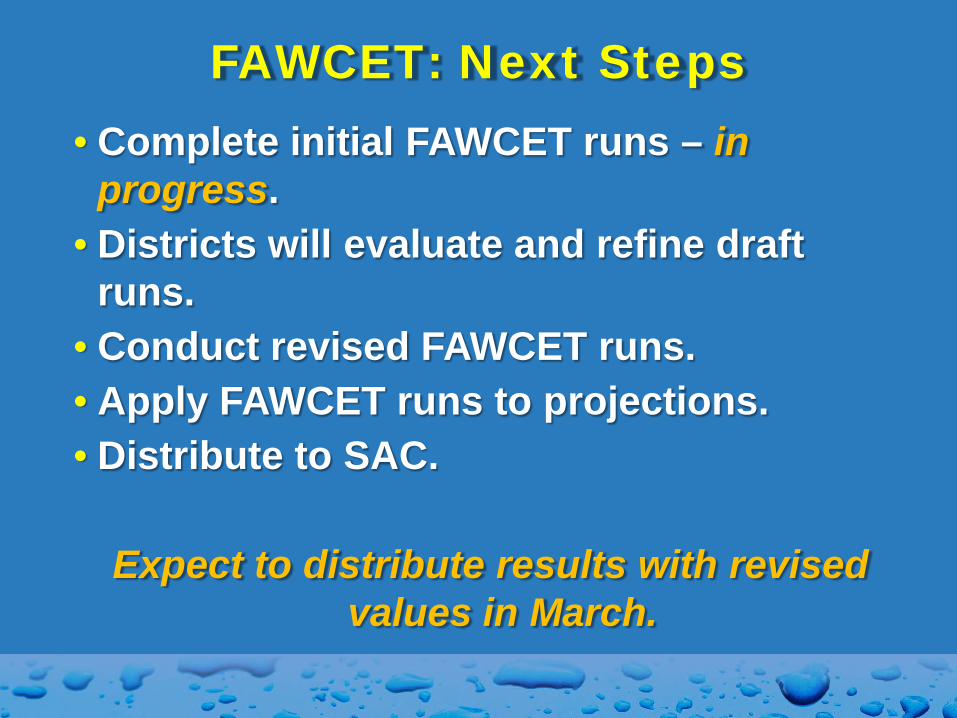
FAWCET: Next Steps • Complete initial FAWCET runs – in
progress. • Districts will evaluate and refine draft
runs. • Conduct revised FAWCET runs. • Apply FAWCET runs to projections. • Distribute to SAC.
Expect to distribute results with revised
values in March.
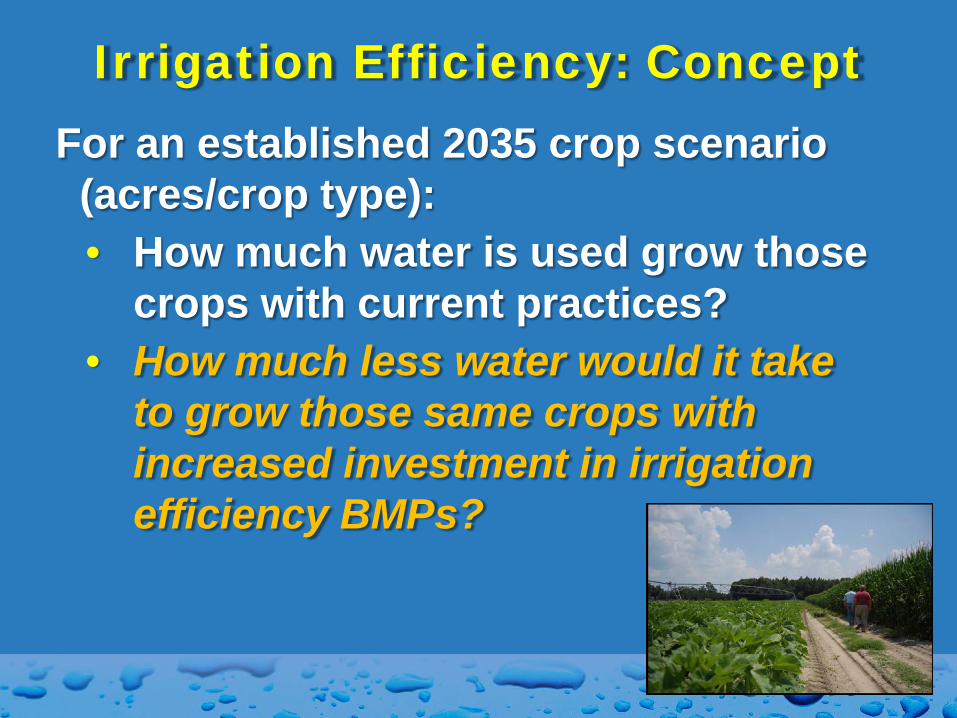
Irrigation Efficiency: Concept For an established 2035 crop scenario
(acres/crop type): • How much water is used grow those
crops with current practices? • How much less water would it take
to grow those same crops with increased investment in irrigation efficiency BMPs?
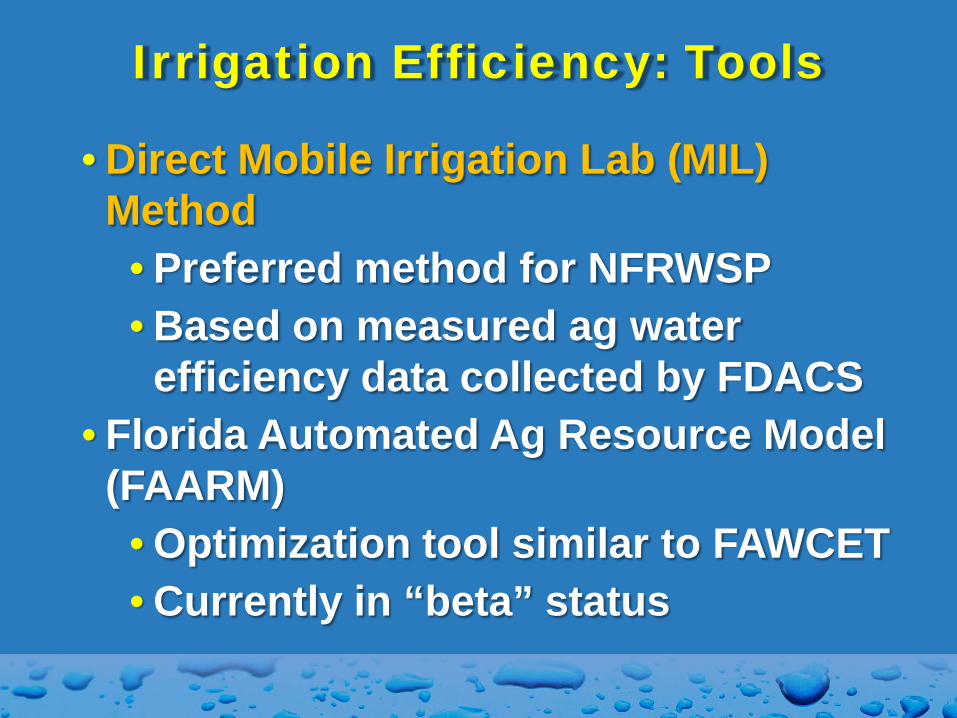
Irrigation Efficiency: Tools
• Direct Mobile Irrigation Lab (MIL) Method
• Preferred method for NFRWSP • Based on measured ag water
efficiency data collected by FDACS • Florida Automated Ag Resource Model
(FAARM) • Optimization tool similar to FAWCET • Currently in “beta” status
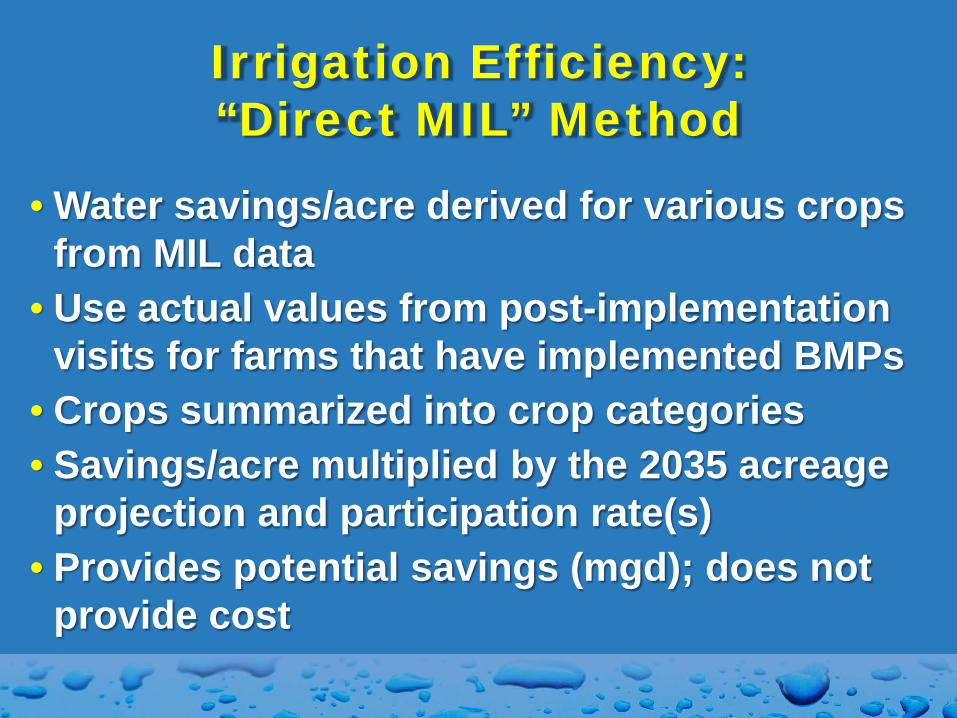
Irrigation Efficiency: “Direct MIL” Method
• Water savings/acre derived for various crops from MIL data
• Use actual values from post-implementation visits for farms that have implemented BMPs
• Crops summarized into crop categories • Savings/acre multiplied by the 2035 acreage
projection and participation rate(s) • Provides potential savings (mgd); does not
provide cost
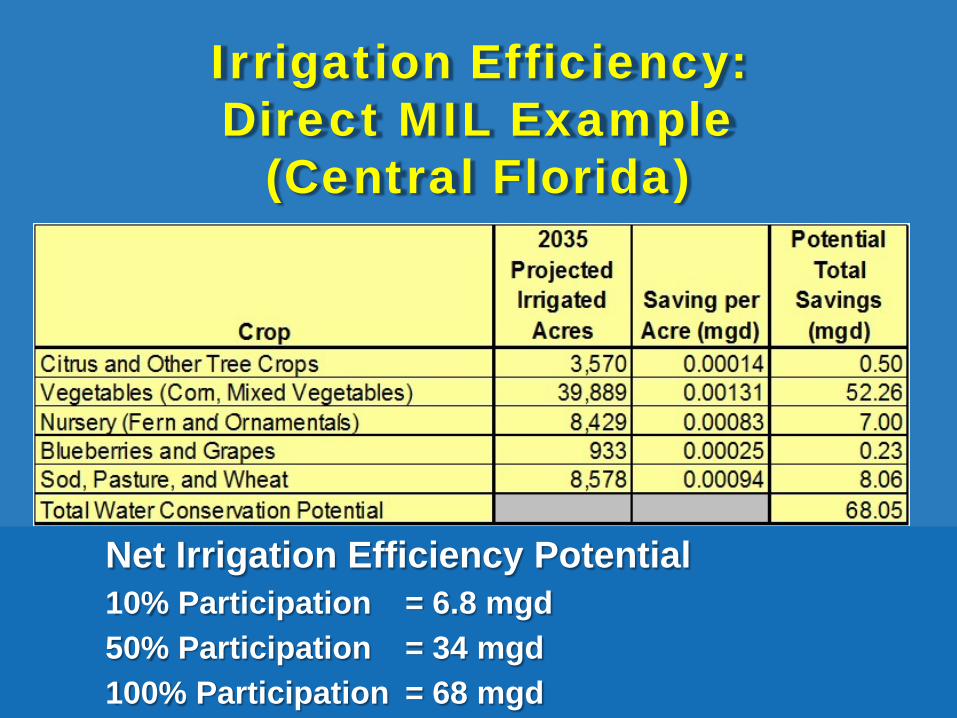
Irrigation Efficiency: Direct MIL Example
(Central Florida)
Net Irrigation Efficiency Potential 10% Participation = 6.8 mgd 50% Participation = 34 mgd 100% Participation = 68 mgd
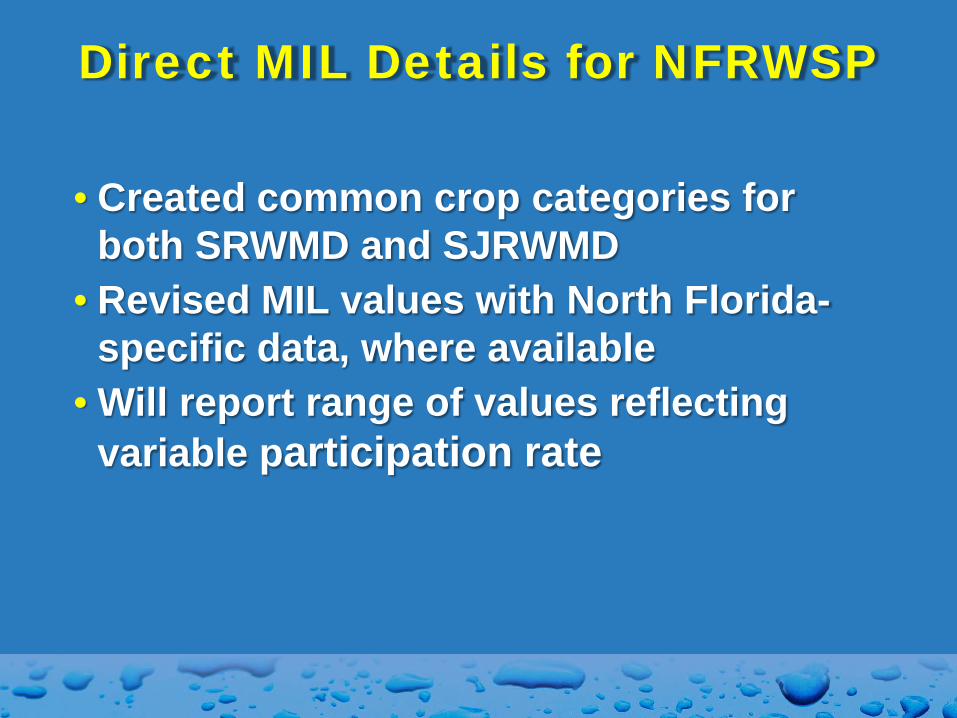
Direct MIL Details for NFRWSP
• Created common crop categories for both SRWMD and SJRWMD
• Revised MIL values with North Florida-specific data, where available
• Will report range of values reflecting variable participation rate
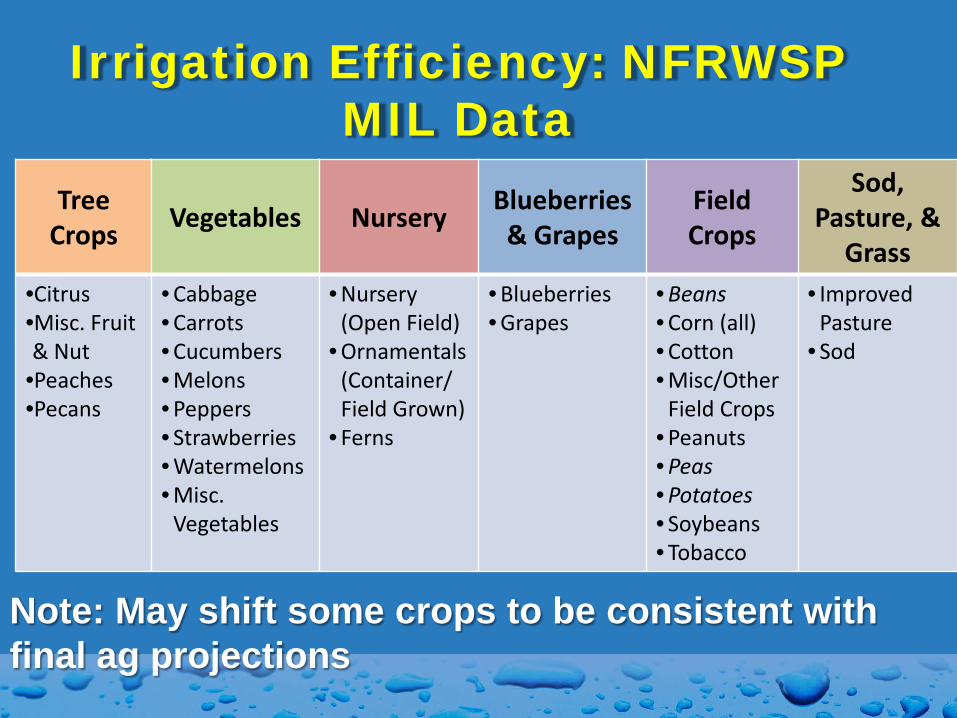
Irrigation Efficiency: NFRWSP MIL Data
Tree Crops Vegetables Nursery Blueberries
& Grapes Field Crops
Sod, Pasture, &
Grass •Citrus •Misc. Fruit & Nut
•Peaches •Pecans
• Cabbage • Carrots • Cucumbers • Melons • Peppers • Strawberries • Watermelons • Misc.
Vegetables
• Nursery (Open Field)
• Ornamentals (Container/ Field Grown)
• Ferns
• Blueberries • Grapes
• Beans • Corn (all) • Cotton • Misc/Other
Field Crops • Peanuts • Peas • Potatoes • Soybeans • Tobacco
• Improved Pasture
• Sod
Note: May shift some crops to be consistent with final ag projections
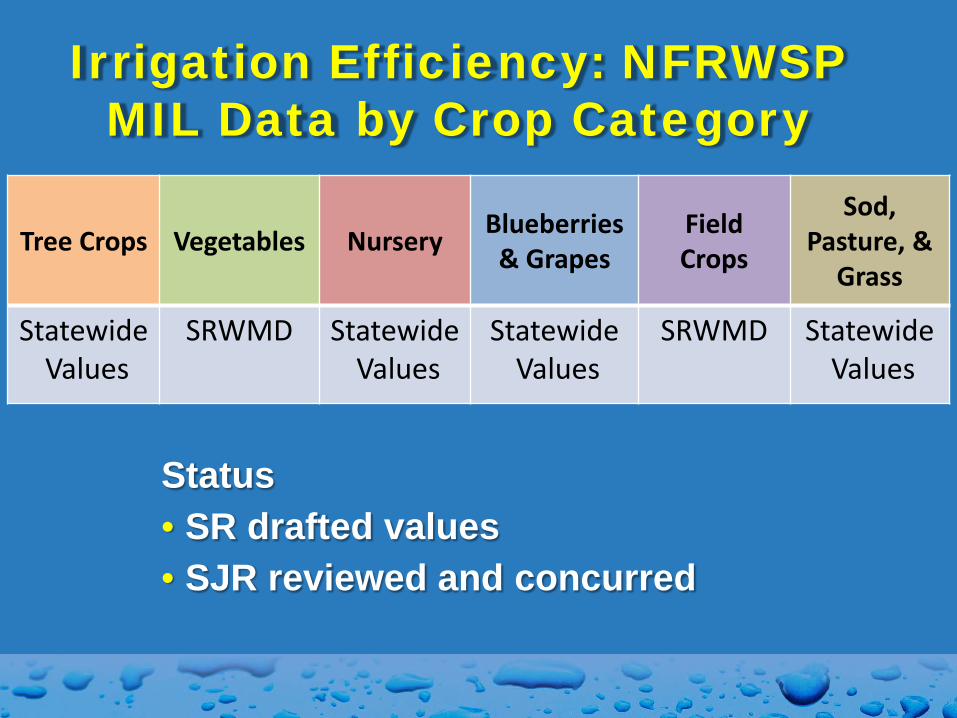
Irrigation Efficiency: NFRWSP MIL Data by Crop Category
Tree Crops Vegetables Nursery Blueberries & Grapes
Field Crops
Sod, Pasture, &
Grass
Statewide Values
SRWMD Statewide Values
Statewide Values
SRWMD
Statewide Values
Status • SR drafted values • SJR reviewed and concurred
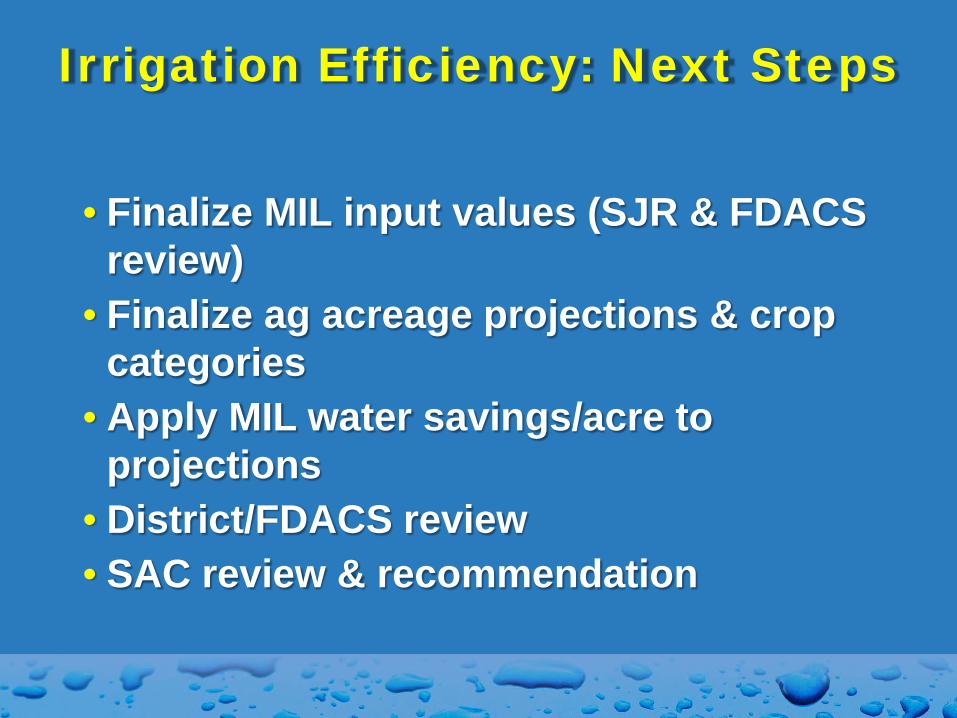
• Finalize MIL input values (SJR & FDACS
review) • Finalize ag acreage projections & crop
categories • Apply MIL water savings/acre to
projections • District/FDACS review • SAC review & recommendation
Irrigation Efficiency: Next Steps
NFRWSP: Conservation and Irrigation Efficiency
Questions?