NFIB ECONOMIC TRENDS2015. 97.9 98.0 95.2 96.9 98.3 94.1 95.4 95.9 96.1 96.1 94.8. OPTIMISM INDEX....
23
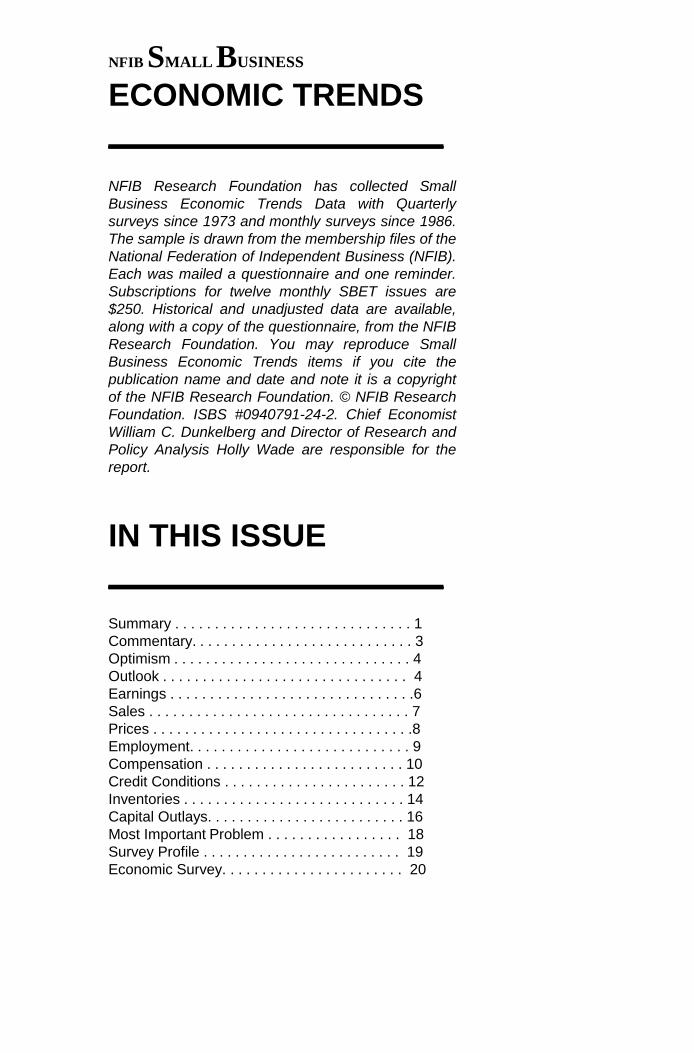
SMALL BUSINESS OPTIMISM INDEX COMPONENTS Index Component Seasonally Adjusted Level Change from Last Month Contribution to Index Change Plans to Increase Employment 11% 0 * Plans to Make Capital Outlays 25% -1 * Plans to Increase Inventories 0% 0 * Expect Economy to Improve -7% -3 * Expect Real Sales Higher -1% -5 * Current Inventory -6% -2 * Current Job Openings 27% 0 * Expected Credit Conditions -4% 1 * Now a Good Time to Expand 12% -1 * Earnings Trends -19% -3 * Total Change -14 100% (Column 1 is the current reading; column 2 is the change from the prior month; column 3 the percent of the total change accounted for by each component; * is under 1 percent and not a meaningful calculation) Based on a Survey of Small and Independent Business Owners NFIB SMALL BUSINESS ECONOMIC TRENDS NFIB SMALL BUSINESS ECONOMIC TRENDS William C. Dunkelberg Holly Wade November 2015
Transcript of NFIB ECONOMIC TRENDS2015. 97.9 98.0 95.2 96.9 98.3 94.1 95.4 95.9 96.1 96.1 94.8. OPTIMISM INDEX....
SMALL BUSINESS OPTIMISM INDEX COMPONENTS
Index ComponentSeasonally
Adjusted LevelChange from Last Month
Contribution to Index Change
Plans to Increase Employment 11% 0 *Plans to Make Capital Outlays 25% -1 *Plans to Increase Inventories 0% 0 *Expect Economy to Improve -7% -3 *Expect Real Sales Higher -1% -5 *Current Inventory -6% -2 *Current Job Openings 27% 0 *Expected Credit Conditions -4% 1 *Now a Good Time to Expand 12% -1 *Earnings Trends -19% -3 *Total Change -14 100%(Column 1 is the current reading; column 2 is the change from the prior month; column 3 the percent of the total change accounted for by each component; * is under 1 percent and not a meaningful calculation)
1201 “F” Street NW
Suite 200W
ashington, DC
20004 nfib.com
Based on a Survey of Small and Independent Business Owners
NFIB SMALL BUSINESS
ECONOMIC TRENDS NFIB SMALL BUSINESS
ECONOMIC TRENDS
NFIBS
MA
LL B
USIN
ESS
EC
ON
OM
IC TR
EN
DS
NFIBS
MA
LL B
USIN
ESS
EC
ON
OM
IC TR
EN
DS
William C. DunkelbergHolly Wade
SBET_CVR_2012.indd 1-2SBET_CVR_2012.indd 1-2 3/30/2012 11:27:49 AM3/30/2012 11:27:49 AM
November 2015
NFIB SMALL BUSINESS
ECONOMIC TRENDS
_____________________
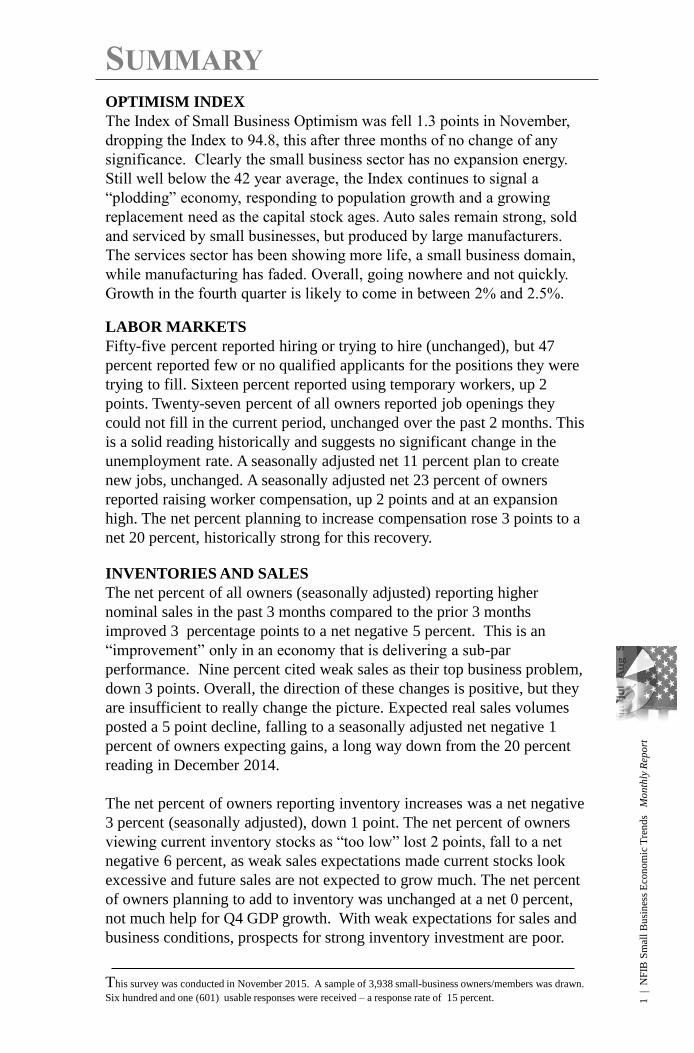
NFIB Research Foundation has collected Small
Business Economic Trends Data with Quarterly
surveys since 1973 and monthly surveys since 1986.
The sample is drawn from the membership files of the
National Federation of Independent Business (NFIB).
Each was mailed a questionnaire and one reminder.
Subscriptions for twelve monthly SBET issues are
$250. Historical and unadjusted data are available,
along with a copy of the questionnaire, from the NFIB
Research Foundation. You may reproduce Small
Business Economic Trends items if you cite the
publication name and date and note it is a copyright
of the NFIB Research Foundation. © NFIB Research
Foundation. ISBS #0940791-24-2. Chief Economist
William C. Dunkelberg and Director of Research and
Policy Analysis Holly Wade are responsible for the
report.
IN THIS ISSUE
_____________________
Summary . . . . . . . . . . . . . . . . . . . . . . . . . . . . . . 1
Commentary. . . . . . . . . . . . . . . . . . . . . . . . . . . . 3
Optimism . . . . . . . . . . . . . . . . . . . . . . . . . . . . . . 4
Outlook . . . . . . . . . . . . . . . . . . . . . . . . . . . . . . . 4
Earnings . . . . . . . . . . . . . . . . . . . . . . . . . . . . . . .6
Sales . . . . . . . . . . . . . . . . . . . . . . . . . . . . . . . . . 7
Prices . . . . . . . . . . . . . . . . . . . . . . . . . . . . . . . . .8
Employment. . . . . . . . . . . . . . . . . . . . . . . . . . . . 9
Compensation . . . . . . . . . . . . . . . . . . . . . . . . . 10
Credit Conditions . . . . . . . . . . . . . . . . . . . . . . . 12
Inventories . . . . . . . . . . . . . . . . . . . . . . . . . . . . 14
Capital Outlays. . . . . . . . . . . . . . . . . . . . . . . . . 16
Most Important Problem . . . . . . . . . . . . . . . . . 18
Survey Profile . . . . . . . . . . . . . . . . . . . . . . . . . 19
Economic Survey. . . . . . . . . . . . . . . . . . . . . . . 20
1 |
NF
IB S
mal
l B
usi
nes
s E
con
om
ic T
ren
ds
M
on
thly
Rep
ort
SUMMARY
OPTIMISM INDEX
The Index of Small Business Optimism was fell 1.3 points in November,
dropping the Index to 94.8, this after three months of no change of any
significance. Clearly the small business sector has no expansion energy.
Still well below the 42 year average, the Index continues to signal a
“plodding” economy, responding to population growth and a growing
replacement need as the capital stock ages. Auto sales remain strong, sold
and serviced by small businesses, but produced by large manufacturers.
The services sector has been showing more life, a small business domain,
while manufacturing has faded. Overall, going nowhere and not quickly.
Growth in the fourth quarter is likely to come in between 2% and 2.5%.
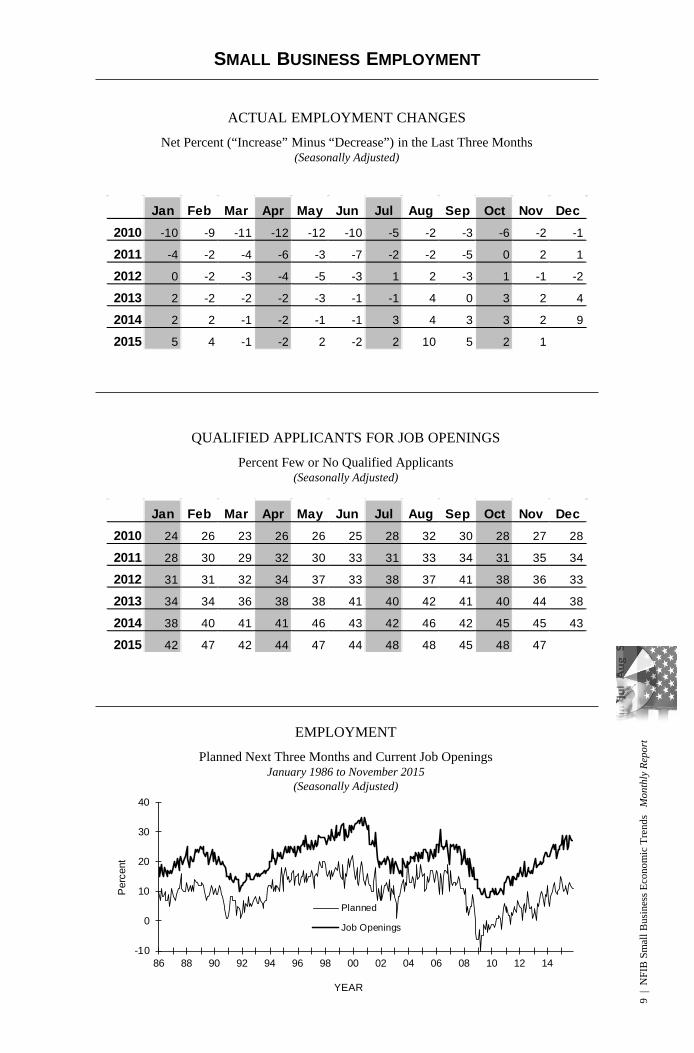
LABOR MARKETS
Fifty-five percent reported hiring or trying to hire (unchanged), but 47
percent reported few or no qualified applicants for the positions they were
trying to fill. Sixteen percent reported using temporary workers, up 2
points. Twenty-seven percent of all owners reported job openings they
could not fill in the current period, unchanged over the past 2 months. This
is a solid reading historically and suggests no significant change in the
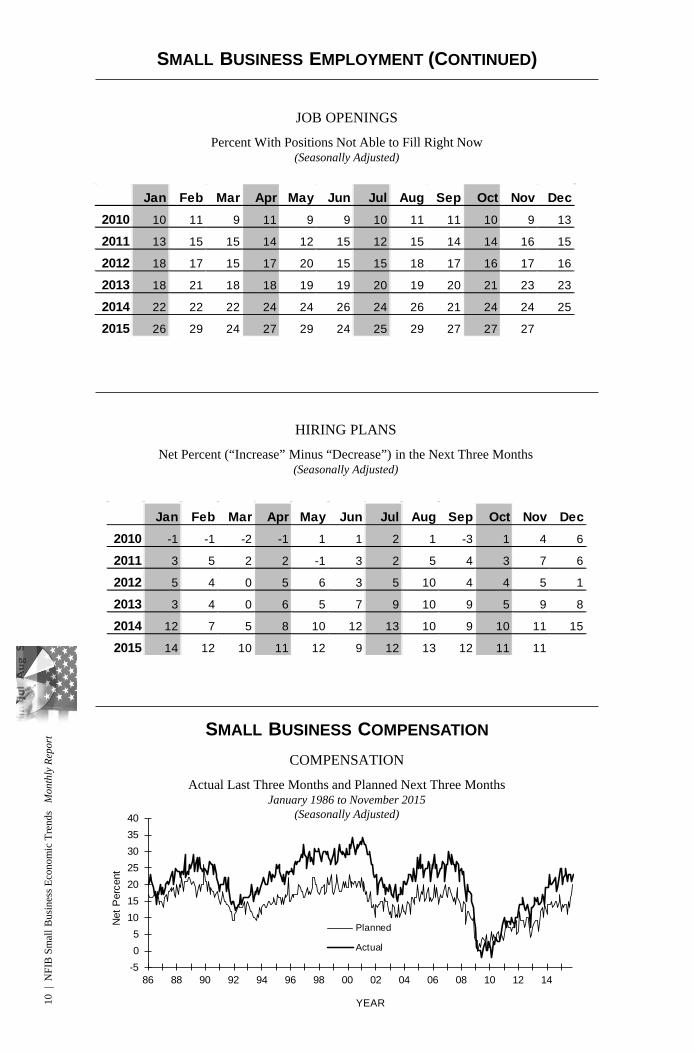
unemployment rate. A seasonally adjusted net 11 percent plan to create
new jobs, unchanged. A seasonally adjusted net 23 percent of owners
reported raising worker compensation, up 2 points and at an expansion
high. The net percent planning to increase compensation rose 3 points to a
net 20 percent, historically strong for this recovery.
INVENTORIES AND SALES
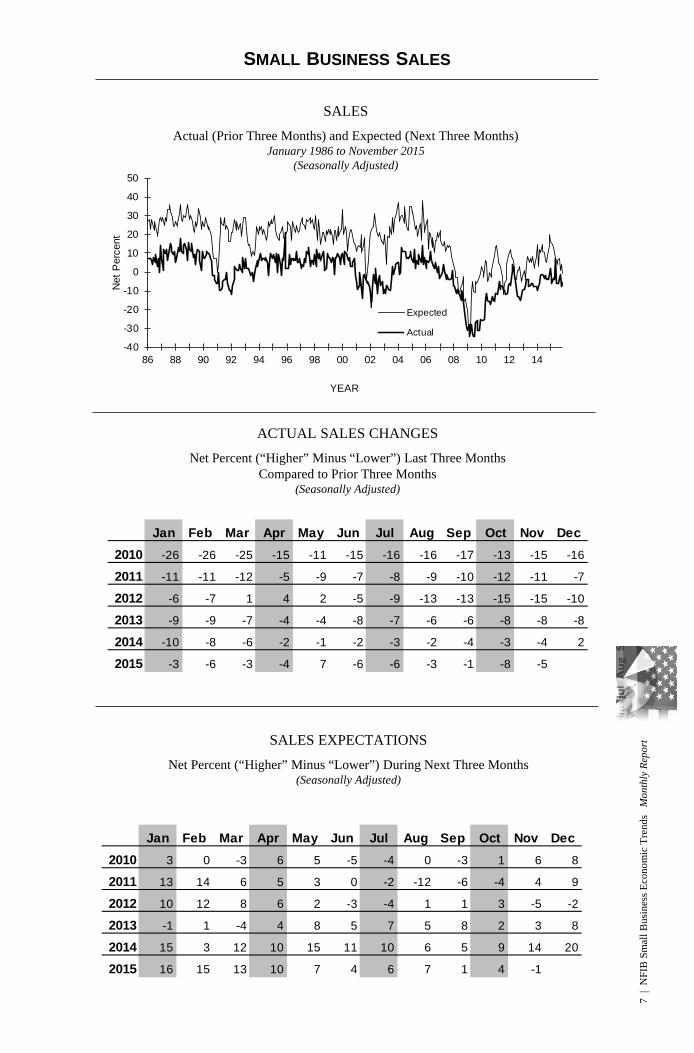
The net percent of all owners (seasonally adjusted) reporting higher
nominal sales in the past 3 months compared to the prior 3 months
improved 3 percentage points to a net negative 5 percent. This is an
“improvement” only in an economy that is delivering a sub-par
performance. Nine percent cited weak sales as their top business problem,
down 3 points. Overall, the direction of these changes is positive, but they
are insufficient to really change the picture. Expected real sales volumes
posted a 5 point decline, falling to a seasonally adjusted net negative 1
percent of owners expecting gains, a long way down from the 20 percent
reading in December 2014.
The net percent of owners reporting inventory increases was a net negative
3 percent (seasonally adjusted), down 1 point. The net percent of owners
viewing current inventory stocks as “too low” lost 2 points, fall to a net
negative 6 percent, as weak sales expectations made current stocks look
excessive and future sales are not expected to grow much. The net percent
of owners planning to add to inventory was unchanged at a net 0 percent,
not much help for Q4 GDP growth. With weak expectations for sales and
business conditions, prospects for strong inventory investment are poor.
This survey was conducted in November 2015. A sample of 3,938 small-business owners/members was drawn.
Six hundred and one (601) usable responses were received – a response rate of 15 percent.
2 |
NF
IB S
mal
l B
usi
nes
s E
con
om
ic T
ren
ds
M
on
thly
Rep
ort
CAPITAL SPENDING
Sixty-two percent reported capital outlays, up 4 percentage points from
November. Overall, capital spending was much stronger in November,
perhaps anticipating Congress’ passage of expensing and other tax
extenders. The percent of owners planning capital outlays in the next 3 to 6
months fell 1 point to 25 percent, not a strong reading historically but
among the best in this expansion. Seasonally adjusted, the net percent
expecting better business conditions deteriorated 3 points to a net negative
7 percent, a rather negative outlook for an “expansion”. The seasonally
adjusted net percent expecting higher real sales fell 5 points to a net
negative 1 percent of all owners. Owner expectations for the economy
overall appear to anticipate a continuation of “under-performance”.
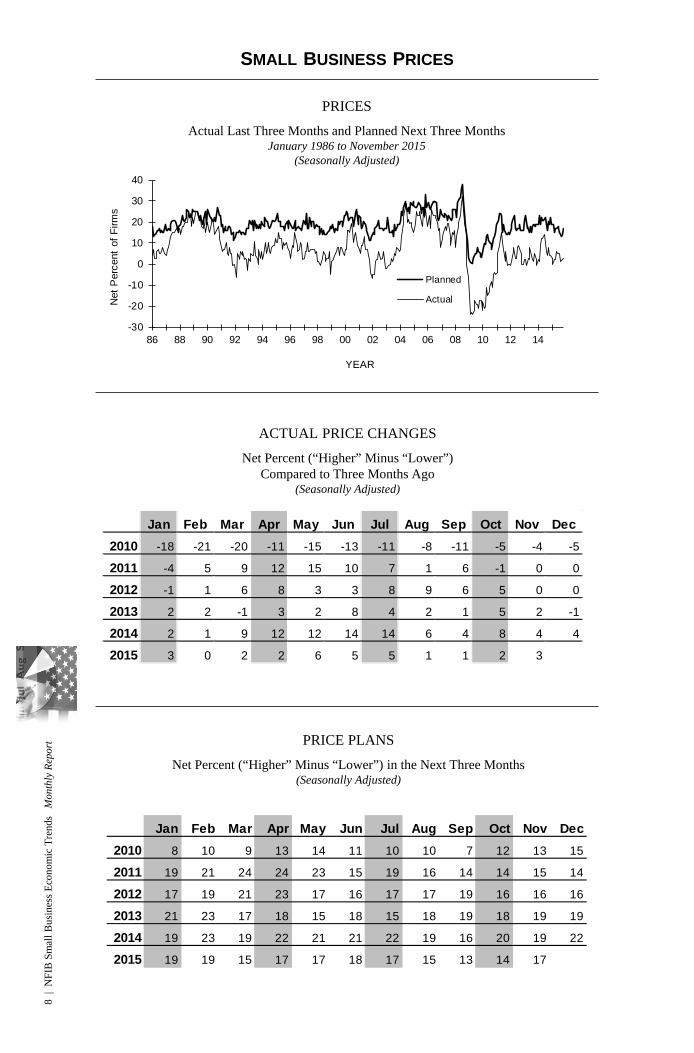
INFLATION
Seasonally adjusted, the net percent of owners raising selling prices was 3
percent, up 1 point from October. This is bad news for the Federal Reserve
which is trying to stoke the flames of inflation, while for consumers, the
news is good. Twenty-three percent plan on raising average prices in the
next few months (up 6 points). percent plan reductions (unchanged), far
fewer than actually reported reductions in past prices. Seasonally adjusted,
a net 17 percent plan price hikes (up 3 points). If history repeats, this will
be offset by unplanned reductions in selling prices.
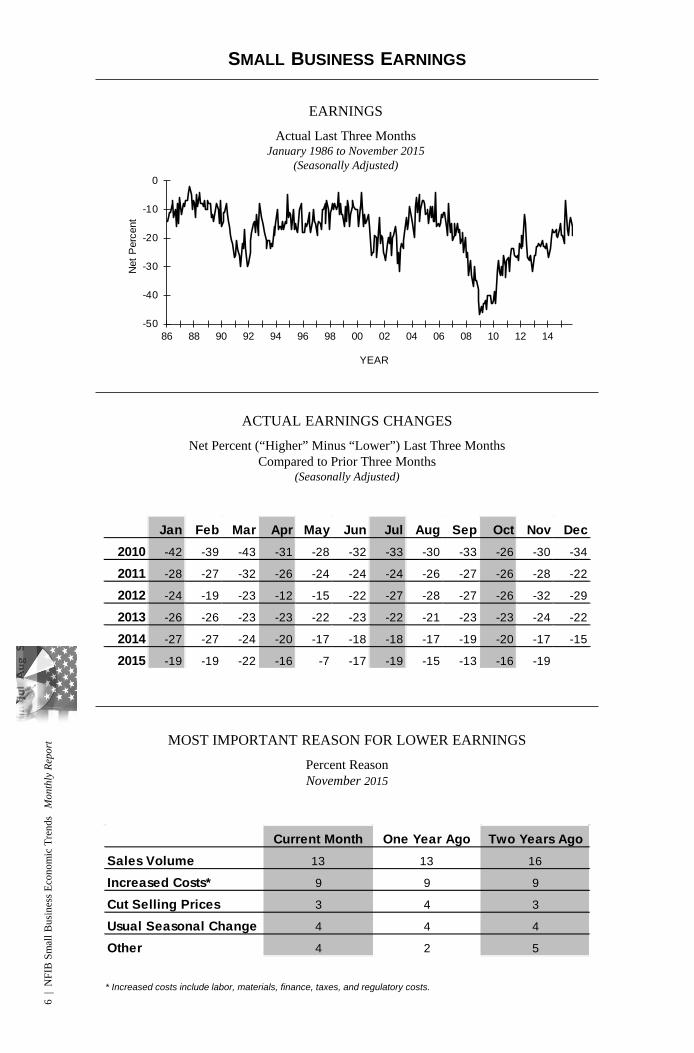
EARNINGS AND WAGES
Earnings trends deteriorated 3 points, falling to a negative 19 percent
reporting quarter on quarter profit improvements. Far more owners are
reporting profits lower quarter to quarter than higher. A seasonally adjusted
net 23 percent of owners reported raising worker compensation, up 2
points and at an expansion high. The net percent planning to increase
compensation rose three points to a net 20 percent, historically strong for
this recovery. However, it is not clear how increased comp is divided
between take home wages and rising benefits.
CREDIT MARKETS
Three percent of owners reported that all their borrowing needs were not
satisfied, 1 point above the record low reached in September. Thirty-two
percent reported all credit needs met (up 2 points), and 52 percent
explicitly said they did not want a loan. Only 2 percent reported that
financing was their top business problem. Twenty-seven percent of all
owners reported borrowing on a regular basis, down 1 point. The average
rate paid on short maturity loans fell 40 basis points to 4.7 percent. Loan
demand remains historically weak, owners can’t find many good reasons to
borrow to invest when expectations for growth are not very positive. The
net percent of owners expecting credit conditions to ease in the coming
months was a negative 4 percent, a 1 point improvement.
3 |
NF
IB S
mal
l B
usi
nes
s E
con
om
ic T
ren
ds
M
on
thly
Rep
ort
COMMENTARY
In this “Season of Hope”, small business owners are finding little to be
hopeful or optimistic about including the economy in the New Year.
Society is showing stress fractures all around, on college campuses, mass
shootings, terrorist attacks, major cities and their police forces, scandals
and incompetence rampant in D.C., a Justice Department politicized, a
political IRS and EPA running roughshod over individual rights and
personal freedom, a Fed that can’t make up its mind about 0 interest rates
“for too long”, a Congress that can’t seem to stay in the “power ring” with
the President for a round, a President who thinks that our most important
problem and threat is climate change (formally known as global warming)
and is willing to punish the current economy for inconsequential benefits
in the future just to set an example for the world (right!). It feels like we
are starting to “lose it”, to dissemble.
Well, the news isn’t all bad. The stock and bond markets are at record high
levels. Unfortunately that means the downside risk is HUGE! The dollar is
strong and we are doing much better than most countries around the world.
OK, that’s good, relatively speaking. The current NFIB survey reads are
generally the best in this expansion, although historically below average in
the 42 year history of expansions. The 1983-90 expansion created 689,000
jobs per quarter compared to 439,000 in this expansion, 2009Q3 to the
present - all that with a 30 percent smaller labor force back then. Of
course, the economic policies in place under Reagan (like “tax cuts”) were
very different than those of the current Administration. That might have
made a difference.
Overall, the outlook remains about the same, slow 2 percent-ish growth,
payroll employment growth averaging around 200,000 a month, 100,000 in
the Household Survey (enough to keep the unemployment rate around 5
percent), not much pressure on prices from Main Street. Just hoping for a
Happy New Year to show up.

4 |
NFI
B S
mal
l Bus
ines
s Eco
nom
ic T
rend
s M
onth
ly R
epor
tOVERVIEW - SMALL BUSINESS OPTIMISM
OPTIMISM INDEX
Based on Ten Survey Indicators(Seasonally Adjusted 1986=100)
Jan Feb Mar Apr May Jun Jul Aug Sep Oct Nov Dec2010 89.3 88.0 86.8 90.6 92.2 89.0 88.1 88.8 89.0 91.7 93.2 92.6
2011 94.1 94.5 91.9 91.2 90.9 90.8 89.9 88.1 88.9 90.2 92.0 93.8
2012 93.9 94.3 92.5 94.5 94.4 91.4 91.2 92.9 92.8 93.1 87.5 88.0
2013 88.9 90.8 89.5 92.1 94.4 93.5 94.1 94.1 93.9 91.6 92.5 93.9
2014 94.1 91.4 93.4 95.2 96.6 95.0 95.7 96.1 95.3 96.1 98.1 100.4
2015 97.9 98.0 95.2 96.9 98.3 94.1 95.4 95.9 96.1 96.1 94.8
OPTIMISM INDEX
Based on Ten Survey Indicators(Seasonally Adjusted 1986=100)
OUTLOOK
Good Time to Expand and Expected General Business ConditionsJanuary 1986 to November 2015
(Seasonally Adjusted)
SMALL BUSINESS OUTLOOK
80
90
100
110
86 88 90 92 94 96 98 00 02 04 06 08 10 12 14
Inde
x V
alue
(19
86=1
00)
YEAR
-40
-20
0
20
40
60
80
0
10
20
30
86 88 90 92 94 96 98 00 02 04 06 08 10 12 14
Per
cent
"G
ood
Tim
e to
Exp
and"
(th
ick
line)
Per
cent
"B
ette
r" M
inus
"W
orse
" E
xpec
ted
Gen
eral
B
usin
ess
Con
ditio
ns (
thin
line
)
YEAR
5 |
NFI
B S
mal
l Bus
ines
s Eco
nom
ic T
rend
s M
onth
ly R
epor
t
SMALL BUSINESS OUTLOOK (CONTINUED)
Jan Feb Mar Apr May Jun Jul Aug Sep Oct Nov Dec2010 5 4 2 4 5 6 5 4 6 7 9 8
2011 8 7 5 4 5 4 6 5 6 7 8 10
2012 9 8 7 7 7 5 5 4 7 7 6 8
2013 6 5 4 4 8 7 9 6 8 6 9 10
2014 8 6 8 8 10 7 10 9 13 11 11 16
2015 13 13 10 10 14 9 12 10 12 13 12
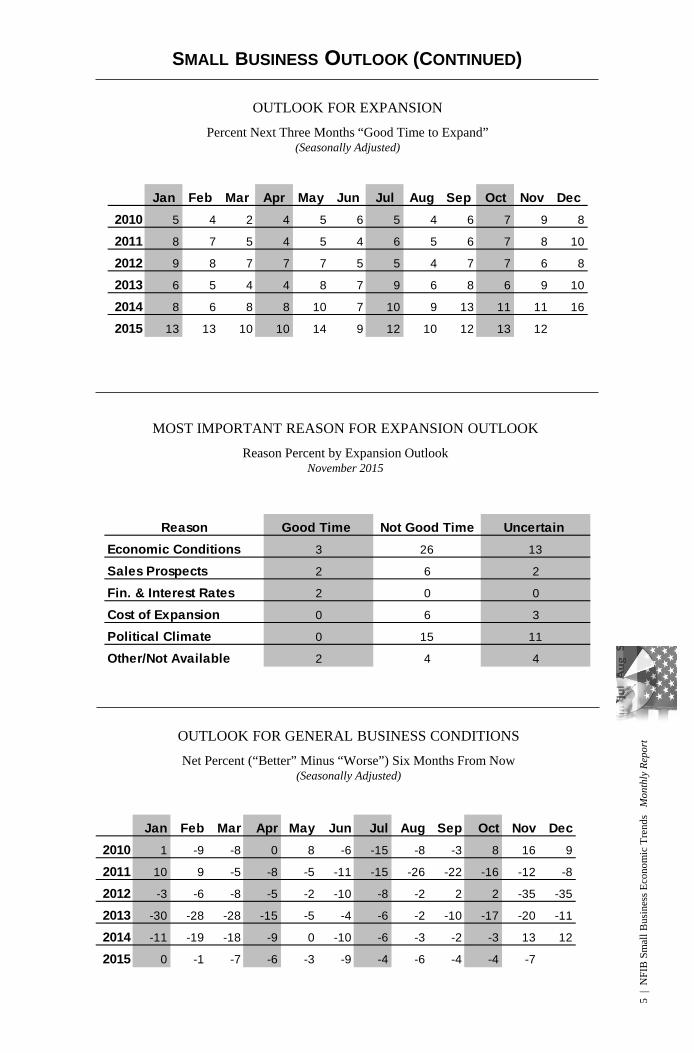
OUTLOOK FOR EXPANSION
Percent Next Three Months “Good Time to Expand”(Seasonally Adjusted)
MOST IMPORTANT REASON FOR EXPANSION OUTLOOK
Reason Percent by Expansion OutlookNovember 2015
Reason Good Time Not Good Time Uncertain Economic Conditions 3 26 13
Sales Prospects 2 6 2
Fin. & Interest Rates 2 0 0
Cost of Expansion 0 6 3
Political Climate 0 15 11
Other/Not Available 2 4 4
OUTLOOK FOR GENERAL BUSINESS CONDITIONS
Net Percent (“Better” Minus “Worse”) Six Months From Now(Seasonally Adjusted)
Jan Feb Mar Apr May Jun Jul Aug Sep Oct Nov Dec2010 1 -9 -8 0 8 -6 -15 -8 -3 8 16 9
2011 10 9 -5 -8 -5 -11 -15 -26 -22 -16 -12 -8
2012 -3 -6 -8 -5 -2 -10 -8 -2 2 2 -35 -35
2013 -30 -28 -28 -15 -5 -4 -6 -2 -10 -17 -20 -11
2014 -11 -19 -18 -9 0 -10 -6 -3 -2 -3 13 12
2015 0 -1 -7 -6 -3 -9 -4 -6 -4 -4 -7
6 |
NFI
B S
mal
l Bus
ines
s Eco
nom
ic T
rend
s M
onth
ly R
epor
tSMALL BUSINESS EARNINGS
EARNINGS
Actual Last Three MonthsJanuary 1986 to November 2015
(Seasonally Adjusted)
ACTUAL EARNINGS CHANGES
Net Percent (“Higher” Minus “Lower”) Last Three MonthsCompared to Prior Three Months
(Seasonally Adjusted)
MOST IMPORTANT REASON FOR LOWER EARNINGS
Percent ReasonNovember 2015
Current Month One Year Ago Two Years AgoSales Volume 13 13 16
Increased Costs* 9 9 9
Cut Selling Prices 3 4 3
Usual Seasonal Change 4 4 4
Other 4 2 5
Jan Feb Mar Apr May Jun Jul Aug Sep Oct Nov Dec2010 -42 -39 -43 -31 -28 -32 -33 -30 -33 -26 -30 -34
2011 -28 -27 -32 -26 -24 -24 -24 -26 -27 -26 -28 -22
2012 -24 -19 -23 -12 -15 -22 -27 -28 -27 -26 -32 -29
2013 -26 -26 -23 -23 -22 -23 -22 -21 -23 -23 -24 -22
2014 -27 -27 -24 -20 -17 -18 -18 -17 -19 -20 -17 -15
2015 -19 -19 -22 -16 -7 -17 -19 -15 -13 -16 -19
* Increased costs include labor, materials, finance, taxes, and regulatory costs.
-50
-40
-30
-20
-10
0
86 88 90 92 94 96 98 00 02 04 06 08 10 12 14
Net
Per
cent
YEAR
7 |
NFI
B S
mal
l Bus
ines
s Eco
nom
ic T
rend
s M
onth
ly R
epor
t
SMALL BUSINESS SALES
SALES EXPECTATIONS
Net Percent (“Higher” Minus “Lower”) During Next Three Months(Seasonally Adjusted)
ACTUAL SALES CHANGES
Net Percent (“Higher” Minus “Lower”) Last Three MonthsCompared to Prior Three Months
(Seasonally Adjusted)
SALES
Actual (Prior Three Months) and Expected (Next Three Months)January 1986 to November 2015
(Seasonally Adjusted)
Jan Feb Mar Apr May Jun Jul Aug Sep Oct Nov Dec2010 -26 -26 -25 -15 -11 -15 -16 -16 -17 -13 -15 -16
2011 -11 -11 -12 -5 -9 -7 -8 -9 -10 -12 -11 -7
2012 -6 -7 1 4 2 -5 -9 -13 -13 -15 -15 -10
2013 -9 -9 -7 -4 -4 -8 -7 -6 -6 -8 -8 -8
2014 -10 -8 -6 -2 -1 -2 -3 -2 -4 -3 -4 2
2015 -3 -6 -3 -4 7 -6 -6 -3 -1 -8 -5
Jan Feb Mar Apr May Jun Jul Aug Sep Oct Nov Dec2010 3 0 -3 6 5 -5 -4 0 -3 1 6 8
2011 13 14 6 5 3 0 -2 -12 -6 -4 4 9
2012 10 12 8 6 2 -3 -4 1 1 3 -5 -2
2013 -1 1 -4 4 8 5 7 5 8 2 3 8
2014 15 3 12 10 15 11 10 6 5 9 14 20
2015 16 15 13 10 7 4 6 7 1 4 -1
-40
-30
-20
-10
0
10
20
30
40
50
86 88 90 92 94 96 98 00 02 04 06 08 10 12 14
Expected
Actual
Net
Per
cent
YEAR
8 |
NFI
B S
mal
l Bus
ines
s Eco
nom
ic T
rend
s M
onth
ly R
epor
tSMALL BUSINESS PRICES
PRICE PLANS
Net Percent (“Higher” Minus “Lower”) in the Next Three Months(Seasonally Adjusted)
ACTUAL PRICE CHANGES
Net Percent (“Higher” Minus “Lower”)Compared to Three Months Ago
(Seasonally Adjusted)
PRICES
Actual Last Three Months and Planned Next Three MonthsJanuary 1986 to November 2015
(Seasonally Adjusted)
Jan Feb Mar Apr May Jun Jul Aug Sep Oct Nov Dec2010 -18 -21 -20 -11 -15 -13 -11 -8 -11 -5 -4 -5
2011 -4 5 9 12 15 10 7 1 6 -1 0 0
2012 -1 1 6 8 3 3 8 9 6 5 0 0
2013 2 2 -1 3 2 8 4 2 1 5 2 -1
2014 2 1 9 12 12 14 14 6 4 8 4 4
2015 3 0 2 2 6 5 5 1 1 2 3
Jan Feb Mar Apr May Jun Jul Aug Sep Oct Nov Dec2010 8 10 9 13 14 11 10 10 7 12 13 15
2011 19 21 24 24 23 15 19 16 14 14 15 14
2012 17 19 21 23 17 16 17 17 19 16 16 16
2013 21 23 17 18 15 18 15 18 19 18 19 19
2014 19 23 19 22 21 21 22 19 16 20 19 22
2015 19 19 15 17 17 18 17 15 13 14 17
-30
-20
-10
0
10
20
30
40
86 88 90 92 94 96 98 00 02 04 06 08 10 12 14
Planned
ActualNet
Per
cent
of F
irms
YEAR
9 |
NFI
B S
mal
l Bus
ines
s Eco
nom
ic T
rend
s M
onth
ly R
epor
t
SMALL BUSINESS EMPLOYMENT
Jan Feb Mar Apr May Jun Jul Aug Sep Oct Nov Dec2010 -10 -9 -11 -12 -12 -10 -5 -2 -3 -6 -2 -1
2011 -4 -2 -4 -6 -3 -7 -2 -2 -5 0 2 1
2012 0 -2 -3 -4 -5 -3 1 2 -3 1 -1 -2
2013 2 -2 -2 -2 -3 -1 -1 4 0 3 2 4
2014 2 2 -1 -2 -1 -1 3 4 3 3 2 9
2015 5 4 -1 -2 2 -2 2 10 5 2 1
ACTUAL EMPLOYMENT CHANGES
Net Percent (“Increase” Minus “Decrease”) in the Last Three Months(Seasonally Adjusted)
QUALIFIED APPLICANTS FOR JOB OPENINGS
Percent Few or No Qualified Applicants(Seasonally Adjusted)
EMPLOYMENT
Planned Next Three Months and Current Job OpeningsJanuary 1986 to November 2015
(Seasonally Adjusted)
-10
0
10
20
30
40
86 88 90 92 94 96 98 00 02 04 06 08 10 12 14
Planned
Job Openings
YEAR
Per
cent
Jan Feb Mar Apr May Jun Jul Aug Sep Oct Nov Dec2010 24 26 23 26 26 25 28 32 30 28 27 28
2011 28 30 29 32 30 33 31 33 34 31 35 34
2012 31 31 32 34 37 33 38 37 41 38 36 33
2013 34 34 36 38 38 41 40 42 41 40 44 38
2014 38 40 41 41 46 43 42 46 42 45 45 43
2015 42 47 42 44 47 44 48 48 45 48 47
10 |
NFI
B S
mal
l Bus
ines
s Eco
nom
ic T
rend
s M
onth
ly R
epor
tSMALL BUSINESS EMPLOYMENT (CONTINUED)
JOB OPENINGS
Percent With Positions Not Able to Fill Right Now(Seasonally Adjusted)
HIRING PLANS
Net Percent (“Increase” Minus “Decrease”) in the Next Three Months(Seasonally Adjusted)
Jan Feb Mar Apr May Jun Jul Aug Sep Oct Nov Dec2010 -1 -1 -2 -1 1 1 2 1 -3 1 4 6
2011 3 5 2 2 -1 3 2 5 4 3 7 6
2012 5 4 0 5 6 3 5 10 4 4 5 1
2013 3 4 0 6 5 7 9 10 9 5 9 8
2014 12 7 5 8 10 12 13 10 9 10 11 15
2015 14 12 10 11 12 9 12 13 12 11 11
SMALL BUSINESS COMPENSATION
COMPENSATION
Actual Last Three Months and Planned Next Three MonthsJanuary 1986 to November 2015
(Seasonally Adjusted)
-505
10152025303540
86 88 90 92 94 96 98 00 02 04 06 08 10 12 14
Net
Per
cent
YEAR
Planned
Actual
Jan Feb Mar Apr May Jun Jul Aug Sep Oct Nov Dec2010 10 11 9 11 9 9 10 11 11 10 9 13
2011 13 15 15 14 12 15 12 15 14 14 16 15
2012 18 17 15 17 20 15 15 18 17 16 17 16
2013 18 21 18 18 19 19 20 19 20 21 23 23
2014 22 22 22 24 24 26 24 26 21 24 24 25
2015 26 29 24 27 29 24 25 29 27 27 27
11 |
NFI
B S
mal
l Bus
ines
s Eco
nom
ic T
rend
s M
onth
ly R
epor
t
SMALL BUSINESS COMPENSATION (CONTINUED)
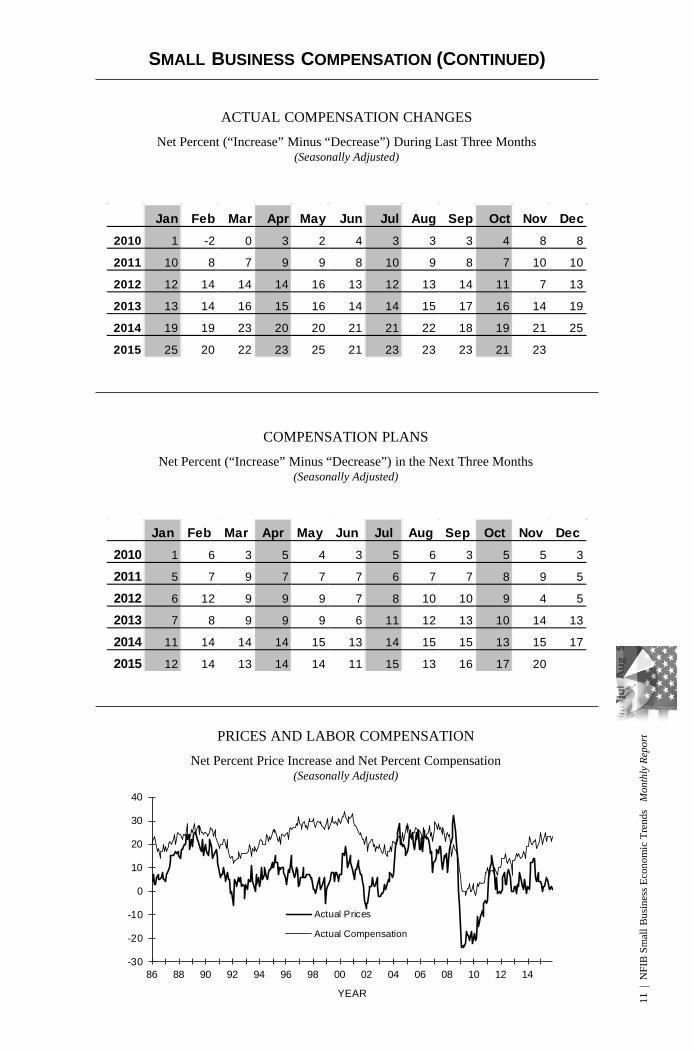
ACTUAL COMPENSATION CHANGES
Net Percent (“Increase” Minus “Decrease”) During Last Three Months(Seasonally Adjusted)
Jan Feb Mar Apr May Jun Jul Aug Sep Oct Nov Dec2010 1 -2 0 3 2 4 3 3 3 4 8 8
2011 10 8 7 9 9 8 10 9 8 7 10 10
2012 12 14 14 14 16 13 12 13 14 11 7 13
2013 13 14 16 15 16 14 14 15 17 16 14 19
2014 19 19 23 20 20 21 21 22 18 19 21 25
2015 25 20 22 23 25 21 23 23 23 21 23
Jan Feb Mar Apr May Jun Jul Aug Sep Oct Nov Dec2010 1 6 3 5 4 3 5 6 3 5 5 3
2011 5 7 9 7 7 7 6 7 7 8 9 5
2012 6 12 9 9 9 7 8 10 10 9 4 5
2013 7 8 9 9 9 6 11 12 13 10 14 13
2014 11 14 14 14 15 13 14 15 15 13 15 17
2015 12 14 13 14 14 11 15 13 16 17 20
COMPENSATION PLANS
Net Percent (“Increase” Minus “Decrease”) in the Next Three Months(Seasonally Adjusted)
PRICES AND LABOR COMPENSATION
Net Percent Price Increase and Net Percent Compensation(Seasonally Adjusted)
-30
-20
-10
0
10
20
30
40
86 88 90 92 94 96 98 00 02 04 06 08 10 12 14
Actual Prices
Actual Compensation
YEAR
12 |
NFI
B S
mal
l Bus
ines
s Eco
nom
ic T
rend
s M
onth
ly R
epor
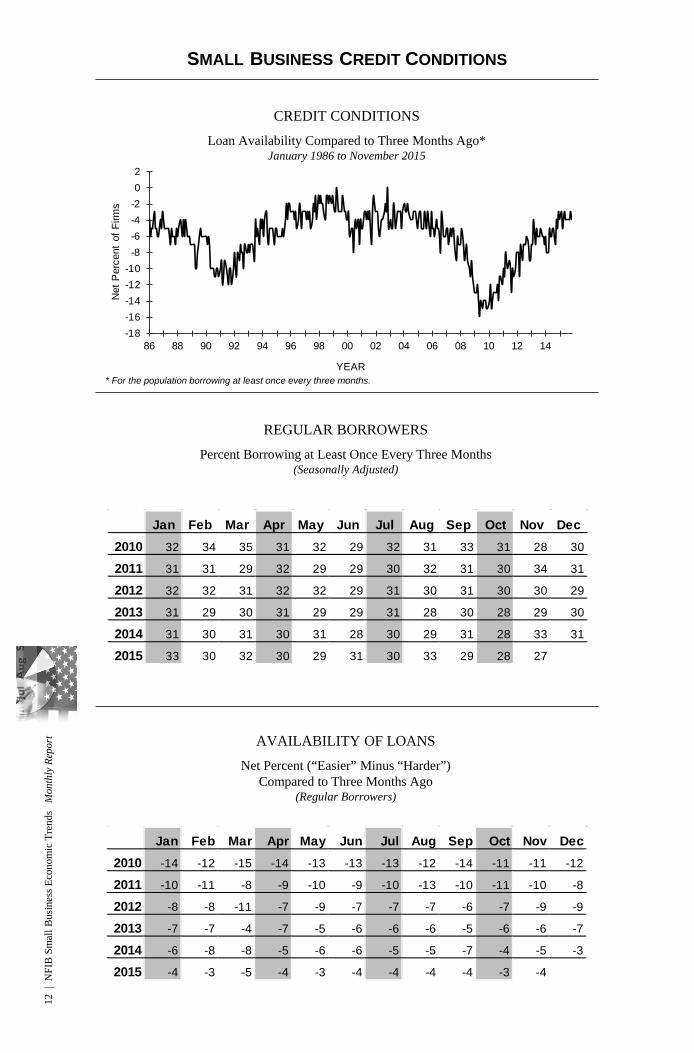
tSMALL BUSINESS CREDIT CONDITIONS
CREDIT CONDITIONS
Loan Availability Compared to Three Months Ago*January 1986 to November 2015
* For the population borrowing at least once every three months.
REGULAR BORROWERS
Percent Borrowing at Least Once Every Three Months(Seasonally Adjusted)
Jan Feb Mar Apr May Jun Jul Aug Sep Oct Nov Dec2010 32 34 35 31 32 29 32 31 33 31 28 30
2011 31 31 29 32 29 29 30 32 31 30 34 31
2012 32 32 31 32 32 29 31 30 31 30 30 29
2013 31 29 30 31 29 29 31 28 30 28 29 30
2014 31 30 31 30 31 28 30 29 31 28 33 31
2015 33 30 32 30 29 31 30 33 29 28 27
AVAILABILITY OF LOANS
Net Percent (“Easier” Minus “Harder”)Compared to Three Months Ago
(Regular Borrowers)
Jan Feb Mar Apr May Jun Jul Aug Sep Oct Nov Dec2010 -14 -12 -15 -14 -13 -13 -13 -12 -14 -11 -11 -12
2011 -10 -11 -8 -9 -10 -9 -10 -13 -10 -11 -10 -8
2012 -8 -8 -11 -7 -9 -7 -7 -7 -6 -7 -9 -9
2013 -7 -7 -4 -7 -5 -6 -6 -6 -5 -6 -6 -7
2014 -6 -8 -8 -5 -6 -6 -5 -5 -7 -4 -5 -3
2015 -4 -3 -5 -4 -3 -4 -4 -4 -4 -3 -4
-18-16-14-12-10
-8-6-4-202
86 88 90 92 94 96 98 00 02 04 06 08 10 12 14
Net
Per
cent
of F
irms
YEAR
13 |
NFI
B S
mal
l Bus
ines
s Eco
nom
ic T
rend
s M
onth
ly R
epor
t
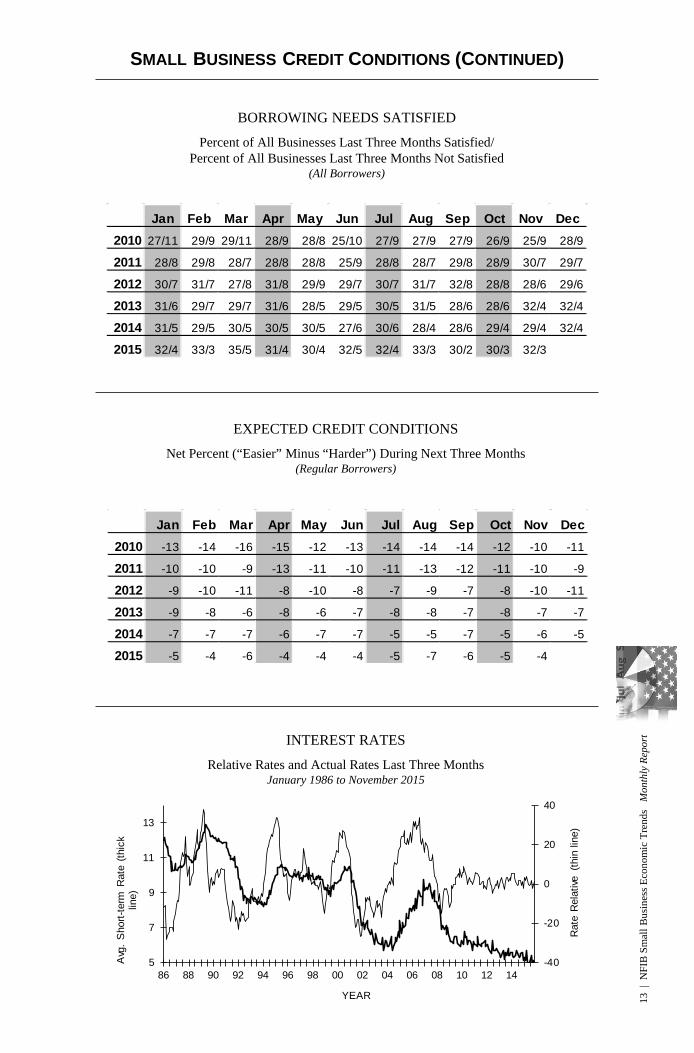
SMALL BUSINESS CREDIT CONDITIONS (CONTINUED)
Jan Feb Mar Apr May Jun Jul Aug Sep Oct Nov Dec2010 27/11 29/9 29/11 28/9 28/8 25/10 27/9 27/9 27/9 26/9 25/9 28/9
2011 28/8 29/8 28/7 28/8 28/8 25/9 28/8 28/7 29/8 28/9 30/7 29/7
2012 30/7 31/7 27/8 31/8 29/9 29/7 30/7 31/7 32/8 28/8 28/6 29/6
2013 31/6 29/7 29/7 31/6 28/5 29/5 30/5 31/5 28/6 28/6 32/4 32/4
2014 31/5 29/5 30/5 30/5 30/5 27/6 30/6 28/4 28/6 29/4 29/4 32/4
2015 32/4 33/3 35/5 31/4 30/4 32/5 32/4 33/3 30/2 30/3 32/3
BORROWING NEEDS SATISFIED
Percent of All Businesses Last Three Months Satisfied/Percent of All Businesses Last Three Months Not Satisfied
(All Borrowers)
Jan Feb Mar Apr May Jun Jul Aug Sep Oct Nov Dec2010 -13 -14 -16 -15 -12 -13 -14 -14 -14 -12 -10 -11
2011 -10 -10 -9 -13 -11 -10 -11 -13 -12 -11 -10 -9
2012 -9 -10 -11 -8 -10 -8 -7 -9 -7 -8 -10 -11
2013 -9 -8 -6 -8 -6 -7 -8 -8 -7 -8 -7 -7
2014 -7 -7 -7 -6 -7 -7 -5 -5 -7 -5 -6 -5
2015 -5 -4 -6 -4 -4 -4 -5 -7 -6 -5 -4
EXPECTED CREDIT CONDITIONS
Net Percent (“Easier” Minus “Harder”) During Next Three Months(Regular Borrowers)
INTEREST RATES
Relative Rates and Actual Rates Last Three MonthsJanuary 1986 to November 2015
-40
-20
0
20
40
5
7
9
11
13
86 88 90 92 94 96 98 00 02 04 06 08 10 12 14
YEAR
Avg
. S
hort-
term
Rat
e (th
ick
line)
Rat
e R
elat
ive (
thin
line
)
14 |
NFI
B S
mal
l Bus
ines
s Eco
nom
ic T
rend
s M
onth
ly R
epor
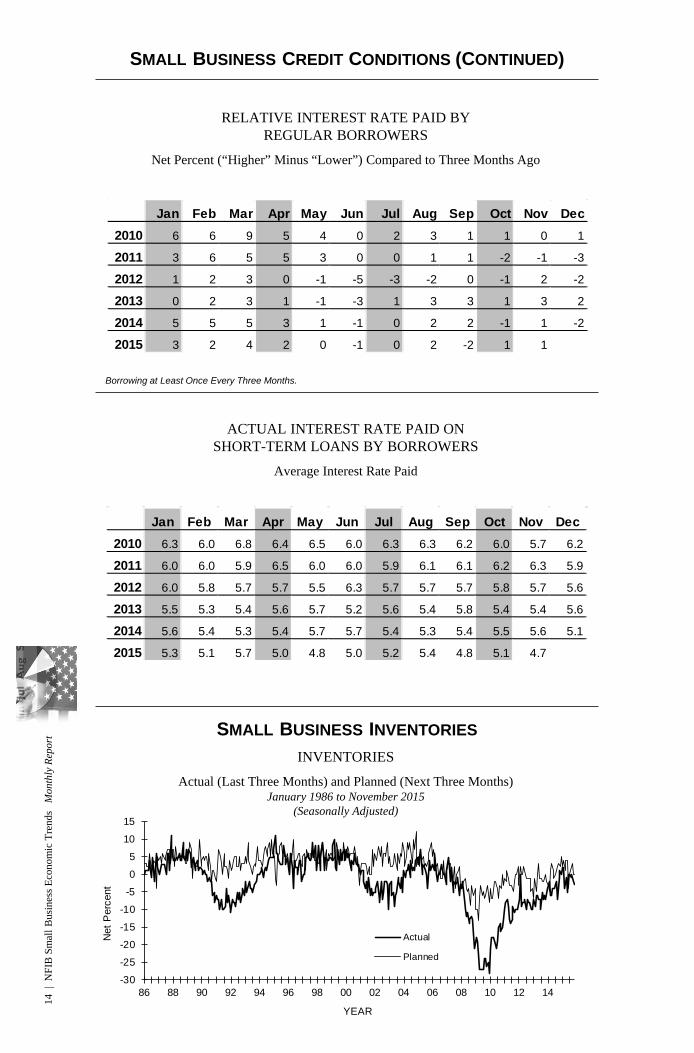
tSMALL BUSINESS CREDIT CONDITIONS (CONTINUED)
Jan Feb Mar Apr May Jun Jul Aug Sep Oct Nov Dec2010 6 6 9 5 4 0 2 3 1 1 0 1
2011 3 6 5 5 3 0 0 1 1 -2 -1 -3
2012 1 2 3 0 -1 -5 -3 -2 0 -1 2 -2
2013 0 2 3 1 -1 -3 1 3 3 1 3 2
2014 5 5 5 3 1 -1 0 2 2 -1 1 -2
2015 3 2 4 2 0 -1 0 2 -2 1 1
RELATIVE INTEREST RATE PAID BY REGULAR BORROWERS
Net Percent (“Higher” Minus “Lower”) Compared to Three Months Ago
Borrowing at Least Once Every Three Months.
ACTUAL INTEREST RATE PAID ON SHORT-TERM LOANS BY BORROWERS
Average Interest Rate Paid
Jan Feb Mar Apr May Jun Jul Aug Sep Oct Nov Dec2010 6.3 6.0 6.8 6.4 6.5 6.0 6.3 6.3 6.2 6.0 5.7 6.2
2011 6.0 6.0 5.9 6.5 6.0 6.0 5.9 6.1 6.1 6.2 6.3 5.9
2012 6.0 5.8 5.7 5.7 5.5 6.3 5.7 5.7 5.7 5.8 5.7 5.6
2013 5.5 5.3 5.4 5.6 5.7 5.2 5.6 5.4 5.8 5.4 5.4 5.6
2014 5.6 5.4 5.3 5.4 5.7 5.7 5.4 5.3 5.4 5.5 5.6 5.1
2015 5.3 5.1 5.7 5.0 4.8 5.0 5.2 5.4 4.8 5.1 4.7
SMALL BUSINESS INVENTORIESINVENTORIES
Actual (Last Three Months) and Planned (Next Three Months)January 1986 to November 2015
(Seasonally Adjusted)
-30
-25
-20
-15
-10
-5
0
5
10
15
86 88 90 92 94 96 98 00 02 04 06 08 10 12 14
Actual
Planned
Net
Per
cent
YEAR
15 |
NFI
B S
mal
l Bus
ines
s Eco
nom
ic T
rend
s M
onth
ly R
epor
t
SMALL BUSINESS INVENTORIES (CONTINUED)
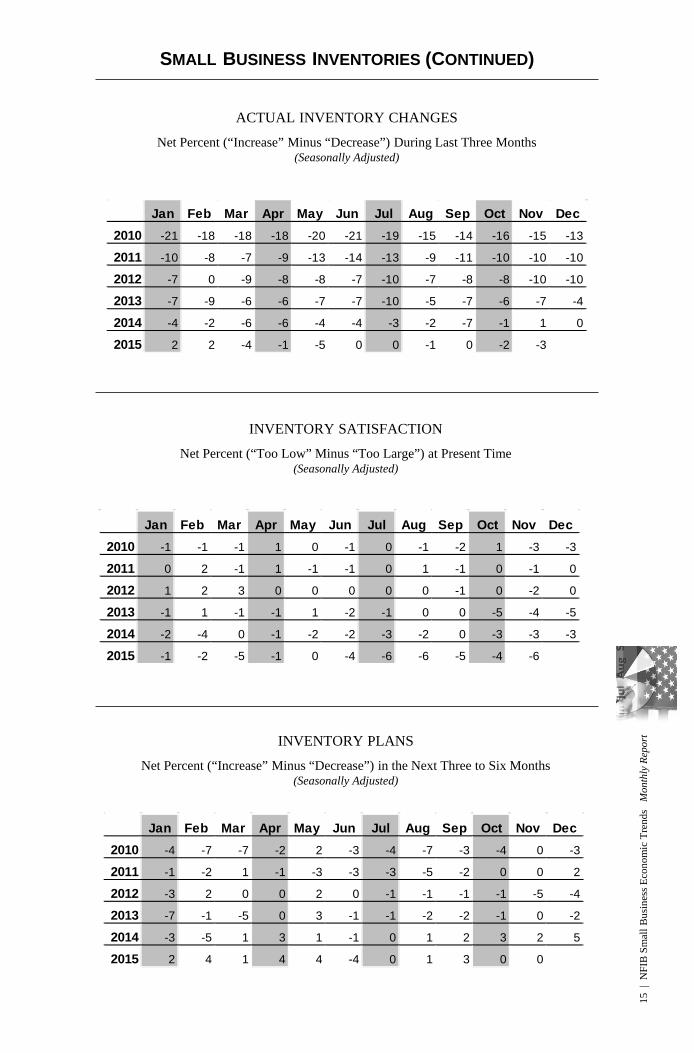
ACTUAL INVENTORY CHANGES
Net Percent (“Increase” Minus “Decrease”) During Last Three Months(Seasonally Adjusted)
Jan Feb Mar Apr May Jun Jul Aug Sep Oct Nov Dec2010 -21 -18 -18 -18 -20 -21 -19 -15 -14 -16 -15 -13
2011 -10 -8 -7 -9 -13 -14 -13 -9 -11 -10 -10 -10
2012 -7 0 -9 -8 -8 -7 -10 -7 -8 -8 -10 -10
2013 -7 -9 -6 -6 -7 -7 -10 -5 -7 -6 -7 -4
2014 -4 -2 -6 -6 -4 -4 -3 -2 -7 -1 1 0
2015 2 2 -4 -1 -5 0 0 -1 0 -2 -3
INVENTORY SATISFACTION
Net Percent (“Too Low” Minus “Too Large”) at Present Time(Seasonally Adjusted)
Jan Feb Mar Apr May Jun Jul Aug Sep Oct Nov Dec2010 -1 -1 -1 1 0 -1 0 -1 -2 1 -3 -3
2011 0 2 -1 1 -1 -1 0 1 -1 0 -1 0
2012 1 2 3 0 0 0 0 0 -1 0 -2 0
2013 -1 1 -1 -1 1 -2 -1 0 0 -5 -4 -5
2014 -2 -4 0 -1 -2 -2 -3 -2 0 -3 -3 -3
2015 -1 -2 -5 -1 0 -4 -6 -6 -5 -4 -6
INVENTORY PLANS
Net Percent (“Increase” Minus “Decrease”) in the Next Three to Six Months(Seasonally Adjusted)
Jan Feb Mar Apr May Jun Jul Aug Sep Oct Nov Dec2010 -4 -7 -7 -2 2 -3 -4 -7 -3 -4 0 -3
2011 -1 -2 1 -1 -3 -3 -3 -5 -2 0 0 2
2012 -3 2 0 0 2 0 -1 -1 -1 -1 -5 -4
2013 -7 -1 -5 0 3 -1 -1 -2 -2 -1 0 -2
2014 -3 -5 1 3 1 -1 0 1 2 3 2 5
2015 2 4 1 4 4 -4 0 1 3 0 0

16 |
NFI
B S
mal
l Bus
ines
s Eco
nom
ic T
rend
s M
onth
ly R
epor
tSMALL BUSINESS CAPITAL OUTLAYS
CAPITAL EXPENDITURES
Actual Last Six Months and Planned Next Three MonthsJanuary 1986 to November 2015
(Seasonally Adjusted)
ACTUAL CAPITAL EXPENDITURES
Percent Making a Capital Expenditure During the Last Six Months
Jan Feb Mar Apr May Jun Jul Aug Sep Oct Nov Dec2010 47 47 45 46 46 46 45 44 45 47 51 47
2011 51 49 51 50 50 50 50 52 50 52 53 56
2012 55 57 52 54 55 52 54 55 51 54 53 52
2013 55 56 57 56 57 56 54 53 55 57 55 64
2014 59 57 56 57 55 54 55 58 56 56 57 60
2015 59 60 58 60 54 58 61 58 58 58 62
INVENTORY SATISFACTION AND INVENTORY PLANS
Net Percent (“Too Low” Minus “Too Large”) at Present TimeNet Percent Planning to Add Inventories in the Next Three to Six Months
(Seasonally Adjusted)
-15
-10
-5
0
5
10
15
86 88 90 92 94 96 98 00 02 04 06 08 10 12 14
Plans Satisfaction
Per
cent
YEAR
15
25
35
45
55
65
75
86 88 90 92 94 96 98 00 02 04 06 08 10 12 14
Per
cent
YEAR
Actual
Expected
17 |
NFI
B S
mal
l Bus
ines
s Eco
nom
ic T
rend
s M
onth
ly R
epor
t
SMALL BUSINESS CAPITAL OUTLAYS (CONTINUED)
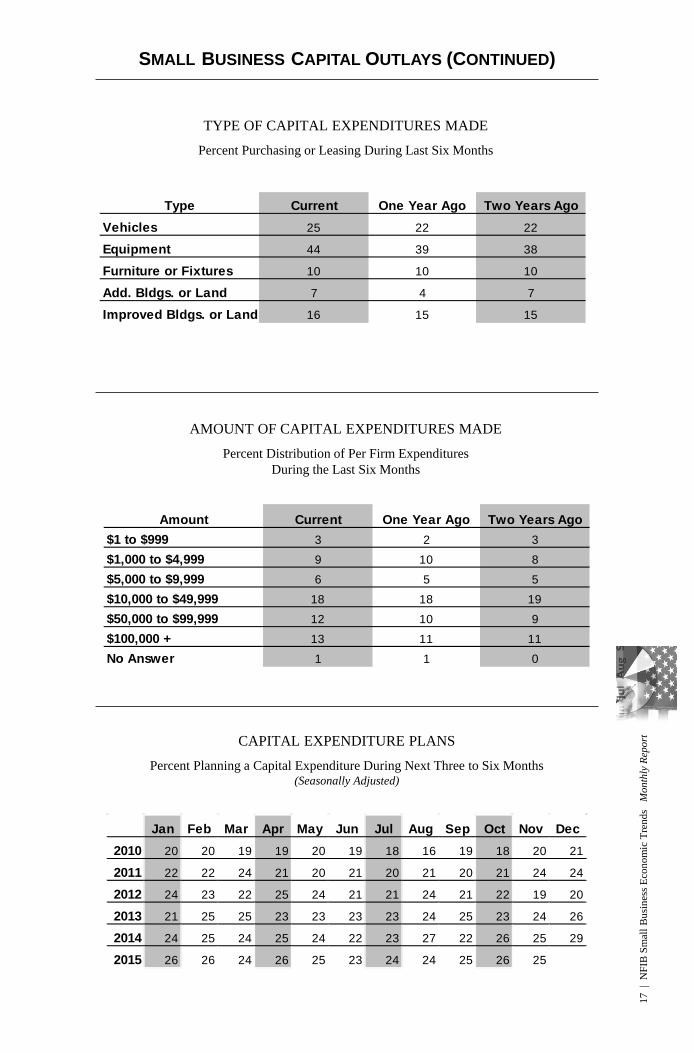
AMOUNT OF CAPITAL EXPENDITURES MADE
Percent Distribution of Per Firm ExpendituresDuring the Last Six Months
Amount Current One Year Ago Two Years Ago$1 to $999 3 2 3
$1,000 to $4,999 9 10 8
$5,000 to $9,999 6 5 5
$10,000 to $49,999 18 18 19
$50,000 to $99,999 12 10 9
$100,000 + 13 11 11
No Answer 1 1 0
CAPITAL EXPENDITURE PLANS
Percent Planning a Capital Expenditure During Next Three to Six Months(Seasonally Adjusted)
Jan Feb Mar Apr May Jun Jul Aug Sep Oct Nov Dec2010 20 20 19 19 20 19 18 16 19 18 20 21
2011 22 22 24 21 20 21 20 21 20 21 24 24
2012 24 23 22 25 24 21 21 24 21 22 19 20
2013 21 25 25 23 23 23 23 24 25 23 24 26
2014 24 25 24 25 24 22 23 27 22 26 25 29
2015 26 26 24 26 25 23 24 24 25 26 25
TYPE OF CAPITAL EXPENDITURES MADE
Percent Purchasing or Leasing During Last Six Months
Type Current One Year Ago Two Years AgoVehicles 25 22 22
Equipment 44 39 38
Furniture or Fixtures 10 10 10
Add. Bldgs. or Land 7 4 7
Improved Bldgs. or Land 16 15 15

18 |
NFI
B S
mal
l Bus
ines
s Eco
nom
ic T
rend
s M
onth
ly R
epor
tSINGLE MOST IMPORTANT PROBLEM
SINGLE MOST IMPORTANT PROBLEM
November 2015
Problem Current One
Year AgoSurvey
High Survey
Low Taxes 20 23 32 8
Inflation 1 3 41 0
Poor Sales 9 12 34 2
Fin. & Interest Rates 2 3 37 1
Cost of Labor 5 5 9 2
Govt. Reqs. & Red Tape 21 22 27 4
Comp. From Large Bus. 8 8 14 4
Quality of Labor 15 10 24 3
Cost/Avail. of Insurance 10 7 29 4
Other 9 7 31 1
SELECTED SINGLE MOST IMPORTANT PROBLEM
Inflation, Big Business, Insurance and RegulationJanuary 1986 to November 2015
0
10
20
30
40
86 88 90 92 94 96 98 00 02 04 06 08 10 12 14
Big Business Insurance
Inflation Regulation
Per
cent
of F
irms
YEAR
SELECTED SINGLE MOST IMPORTANT PROBLEM
Taxes, Interest Rates, Sales and Labor QualityJanuary 1986 to November 2015
0
10
20
30
40
86 88 90 92 94 96 98 00 02 04 06 08 10 12 14
Taxes Sales
Interest Rates & Finance Labor Quality
Per
cent
of F
irms
YEAR
19 |
NFI
B S
mal
l Bus
ines
s Eco
nom
ic T
rend
s M
onth
ly R
epor
t
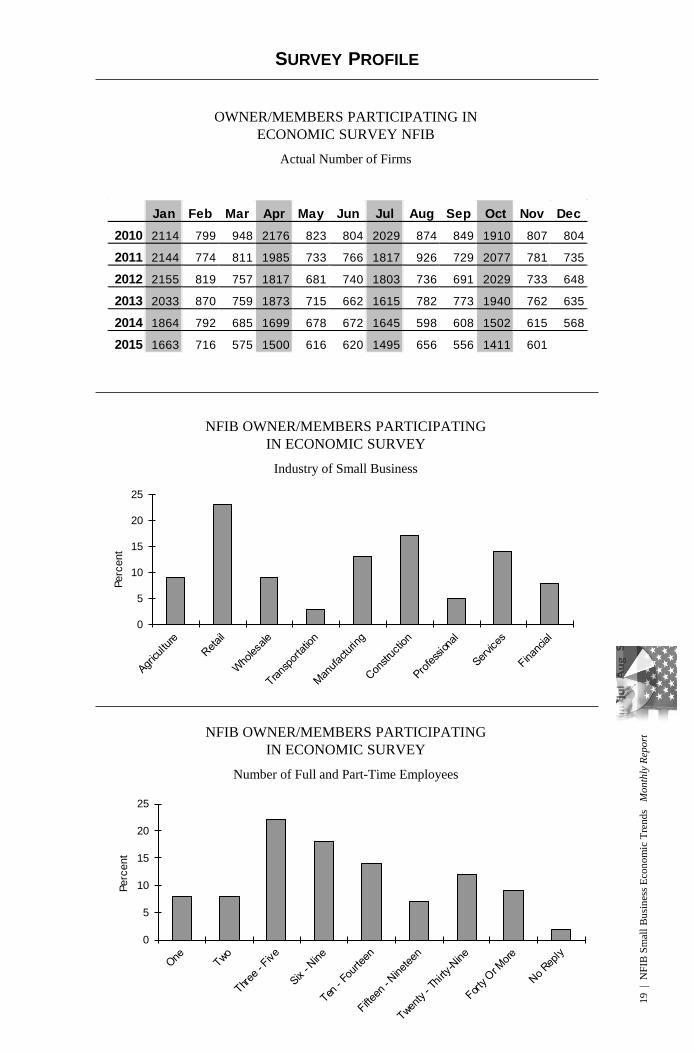
SURVEY PROFILE
OWNER/MEMBERS PARTICIPATING IN ECONOMIC SURVEY NFIB
Actual Number of Firms
NFIB OWNER/MEMBERS PARTICIPATING IN ECONOMIC SURVEY
Industry of Small Business
Jan Feb Mar Apr May Jun Jul Aug Sep Oct Nov Dec2010 2114 799 948 2176 823 804 2029 874 849 1910 807 804
2011 2144 774 811 1985 733 766 1817 926 729 2077 781 735
2012 2155 819 757 1817 681 740 1803 736 691 2029 733 648
2013 2033 870 759 1873 715 662 1615 782 773 1940 762 635
2014 1864 792 685 1699 678 672 1645 598 608 1502 615 568
2015 1663 716 575 1500 616 620 1495 656 556 1411 601
NFIB OWNER/MEMBERS PARTICIPATING IN ECONOMIC SURVEY
Number of Full and Part-Time Employees
0
5
10
15
20
25
Perc
ent
0
5
10
15
20
25
Perc
ent
20 |
NFI
B S
mal
l Bus
ines
s Eco
nom
ic T
rend
s M
onth
ly R
epor
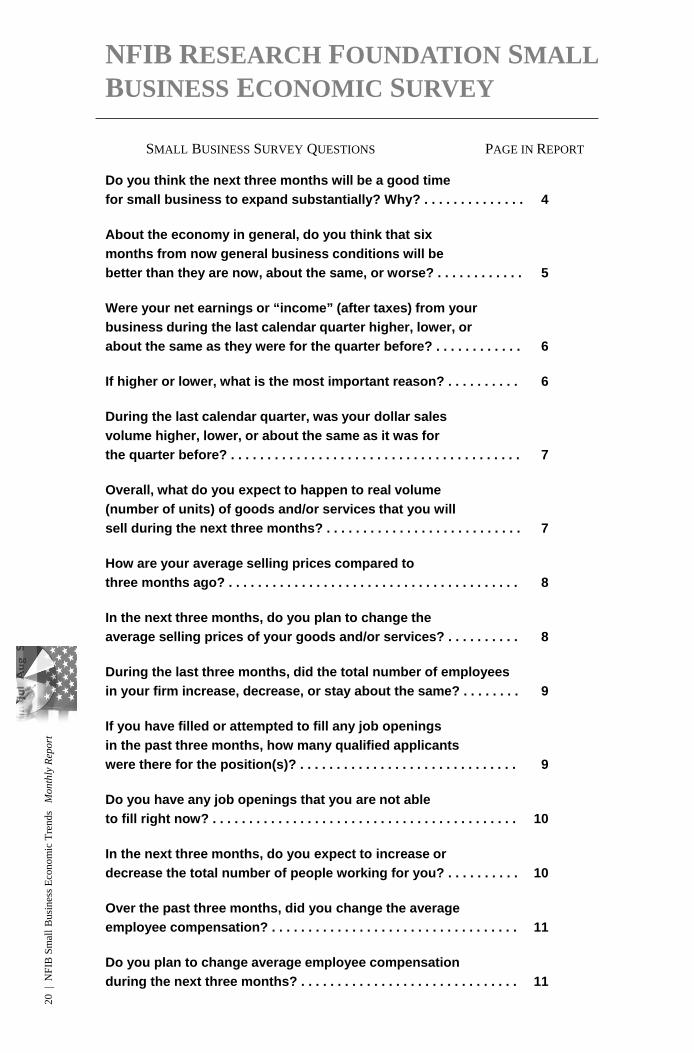
tNFIB RESEARCH FOUNDATION SMALLBUSINESS ECONOMIC SURVEY
SMALL BUSINESS SURVEY QUESTIONS PAGE IN REPORT
Do you think the next three months will be a good timefor small business to expand substantially? Why? . . . . . . . . . . . . . . 4
About the economy in general, do you think that six months from now general business conditions will be better than they are now, about the same, or worse? . . . . . . . . . . . . 5
Were your net earnings or “income” (after taxes) from yourbusiness during the last calendar quarter higher, lower, or about the same as they were for the quarter before? . . . . . . . . . . . . 6
If higher or lower, what is the most important reason? . . . . . . . . . . 6
During the last calendar quarter, was your dollar sales volume higher, lower, or about the same as it was for the quarter before? . . . . . . . . . . . . . . . . . . . . . . . . . . . . . . . . . . . . . . . . 7
Overall, what do you expect to happen to real volume (number of units) of goods and/or services that you will sell during the next three months? . . . . . . . . . . . . . . . . . . . . . . . . . . . 7
How are your average selling prices compared to three months ago? . . . . . . . . . . . . . . . . . . . . . . . . . . . . . . . . . . . . . . . . 8
In the next three months, do you plan to change the average selling prices of your goods and/or services? . . . . . . . . . . 8
During the last three months, did the total number of employees in your firm increase, decrease, or stay about the same? . . . . . . . . 9
If you have filled or attempted to fill any job openings in the past three months, how many qualified applicants were there for the position(s)? . . . . . . . . . . . . . . . . . . . . . . . . . . . . . . 9
Do you have any job openings that you are not able to fill right now? . . . . . . . . . . . . . . . . . . . . . . . . . . . . . . . . . . . . . . . . . . 10
In the next three months, do you expect to increase or decrease the total number of people working for you? . . . . . . . . . . 10
Over the past three months, did you change the average employee compensation? . . . . . . . . . . . . . . . . . . . . . . . . . . . . . . . . . . 11
Do you plan to change average employee compensation during the next three months? . . . . . . . . . . . . . . . . . . . . . . . . . . . . . . 11
21 |
NFI
B S
mal
l Bus
ines
s Eco
nom
ic T
rend
s M
onth
ly R
epor
t
SMALL BUSINESS SURVEY QUESTIONS PAGE IN REPORT
Are…loans easier or harder to get than they werethree months ago? . . . . . . . . . . . . . . . . . . . . . . . . . . . . . . . . . . . . . . . 12
During the last three months, was your firm able tosatisfy its borrowing needs? . . . . . . . . . . . . . . . . . . . . . . . . . . . . . . . 13
Do you expect to find it easier or harder to obtain yourrequired financing during the next three months? . . . . . . . . . . . . . 13
If you borrow money regularly (at least once every threemonths) as part of your business activity, how does therate of interest payable on your most recent loan comparewith that paid three months ago? . . . . . . . . . . . . . . . . . . . . . . . . . . . 14
If you borrowed within the last three months for businesspurposes, and the loan maturity (pay back period) was 1year or less, what interest rate did you pay? . . . . . . . . . . . . . . . . . . 14
During the last three months, did you increase or decreaseyour inventories? . . . . . . . . . . . . . . . . . . . . . . . . . . . . . . . . . . . . . . . . . 15
At the present time, do you feel your inventories are toolarge, about right, or inadequate? . . . . . . . . . . . . . . . . . . . . . . . . . . 15
Looking ahead to the next three months to six months,do you expect, on balance, to add to your inventories,keep them about the same, or decrease them? . . . . . . . . . . . . . . . 15
During the last six months, has your firm made any capitalexpenditures to improve or purchase equipment, buildings,or land? . . . . . . . . . . . . . . . . . . . . . . . . . . . . . . . . . . . . . . . . . . . . . . . 16
If [your firm made any capital expenditures], what wasthe total cost of all these projects? . . . . . . . . . . . . . . . . . . . . . . . . 17
Looking ahead to the next three to six months, do youexpect to make any capital expenditures for plantand/or physical equipment? . . . . . . . . . . . . . . . . . . . . . . . . . . . . . . 17
What is the single most important problem facing yourbusiness today? . . . . . . . . . . . . . . . . . . . . . . . . . . . . . . . . . . . . . . . . 18
Please classify your major business activity, using oneof the categories of example below . . . . . . . . . . . . . . . . . . . . . . . . 19
How many employees do you have full and part-time,including yourself? . . . . . . . . . . . . . . . . . . . . . . . . . . . . . . . . . . . . . 19