Newsletter Power & Utilities in Europe - Deloitte US · Power & Utilities January 2016 ... Arch...
25
Power & Utilities January 2016 Commodities Crude Oil ($/bbl) ICE Brent ended the year below $ 40 /bbl with NYMEX WTI at a reduced spread lower at $38/bbl. Oil demand in December stood at 95.3 mbbl/d up 1.3 mbbl/d compared to the year before (against an anticipated demand growth of). Oil demand for Year 2015 stands at 94.6 md/d on average up 2.2 mb/d on average over the year. Total supplies stood 1.8 mb/d above a year ago, with OPEC accounting for most of the increase. Oil supply at end of Q3 2015 was in excess of 96.9 mbbl/d or over 1.5 mbbl/d over demand. Total Non-OPEC supply for the year was 58.3 mbbl/d, and OPEC average supply for 2015 went up to 31.2 mbbl/d (up 1.6 mb/d compared to previous year). Looking into 2016, global oil demand is expected to go up by 1.2 mbbl/d at 95.8 mbbl/d on a yearly average, a clear sign that global demand is easing compared to the 2.2 mb/d increase in 2015 versus 2014 as mentioned above. Oil demand is expected to continue dropping markedly in Europe in particular, after losing 1% in Spain, 1.4% in Germany and up to 5.3% in France in just a year. The oil supply prospect for 2016 indicate that the 'call on OPEC crude' will be unchanged at 31.3 mbbl/d following the last OPEC meeting in Vienna where the 13-member group abandoned the idea of an official output ceiling, leaving the global supply with a glut of about 1.5 million-2 million b/d over demand. OECD commercial stocks stand at 2 971 mb at the end of the year, one of the highest records. Global inventories are set to keep building at least until late 2016, albeit at a much slower pace than before. US refineries are running at a very high utilisation rate with a view to capturing the benefit of positive refinery margins, but the result is they are also converting crude into product stock builds. However, the latest OPEC decision to keep fuelling the global oversupply, therefore pushing the oil price lower, does not support the economics of storage. US economists are also pointing out that the prospect of higher interest rates in the US will increase the cost to store crude, leading many traders to liquidate their stocks onto the market and push the price lower down. The oil price dropped to a seven-year low over the last quarter of 2015 after OPEC’s decision to decide on production ceilings in the context of a persistent global oversupply. Newsletter Power & Utilities in Europe Source Capital IQ
Transcript of Newsletter Power & Utilities in Europe - Deloitte US · Power & Utilities January 2016 ... Arch...

Power & UtilitiesJanuary 2016
Commodities
Crude Oil ($/bbl) ICE Brent ended the year below $ 40 /bbl with NYMEX WTI at a reduced spread lower at $38/bbl.
Oil demand in December stood at 95.3 mbbl/d up 1.3 mbbl/d compared to the year before (against an anticipated demand growth of). Oil demand for Year 2015 stands at 94.6 md/d on average up 2.2 mb/d on average over the year.
Total supplies stood 1.8 mb/d above a year ago, with OPEC accounting for most of the increase. Oil supply at end of Q3 2015 was in excess of 96.9 mbbl/d or over 1.5 mbbl/d over demand. Total Non-OPEC supply for the year was 58.3 mbbl/d, and OPEC average supply for 2015 went up to 31.2 mbbl/d (up 1.6 mb/d compared to previous year).
Looking into 2016, global oil demand is expected to go up by 1.2 mbbl/d at 95.8 mbbl/d on a yearly average, a clear sign that global demand is easing compared to the 2.2 mb/d increase in 2015 versus 2014 as mentioned above. Oil demand is expected to continue dropping markedly in Europe in particular, after losing 1% in Spain, 1.4% in Germany and up to 5.3% in France in just a year.
The oil supply prospect for 2016 indicate that the 'call on OPEC crude' will be unchanged at 31.3 mbbl/d following the last OPEC meeting in Vienna where the 13-member group abandoned the idea of an official output ceiling, leaving the global supply with a glut of about 1.5 million-2 million b/d over demand.
OECD commercial stocks stand at 2 971 mb at the end of the year, one of the highest records. Global inventories are set to keep building at least until late 2016, albeit at a much slower pace than before. US refineries are running at a very high utilisation rate with a view to capturing the benefit of positive refinery margins, but the result is they are also converting crude into product stock builds. However, the latest OPEC decision to keep fuelling the global oversupply, therefore pushing the oil price lower, does not support the economics of storage.
US economists are also pointing out that the prospect of higher interest rates in the US will increase the cost to store crude, leading many traders to liquidate their stocks onto the market and push the price lower down.
The oil price dropped to a seven-year low over the last quarter of 2015 after OPEC’s decision to decide on production ceilings in the context of a persistent global oversupply.
Newsletter Power & Utilities in Europe
Source Capital IQ
2 Newsletter - Power and Utilities in Europe
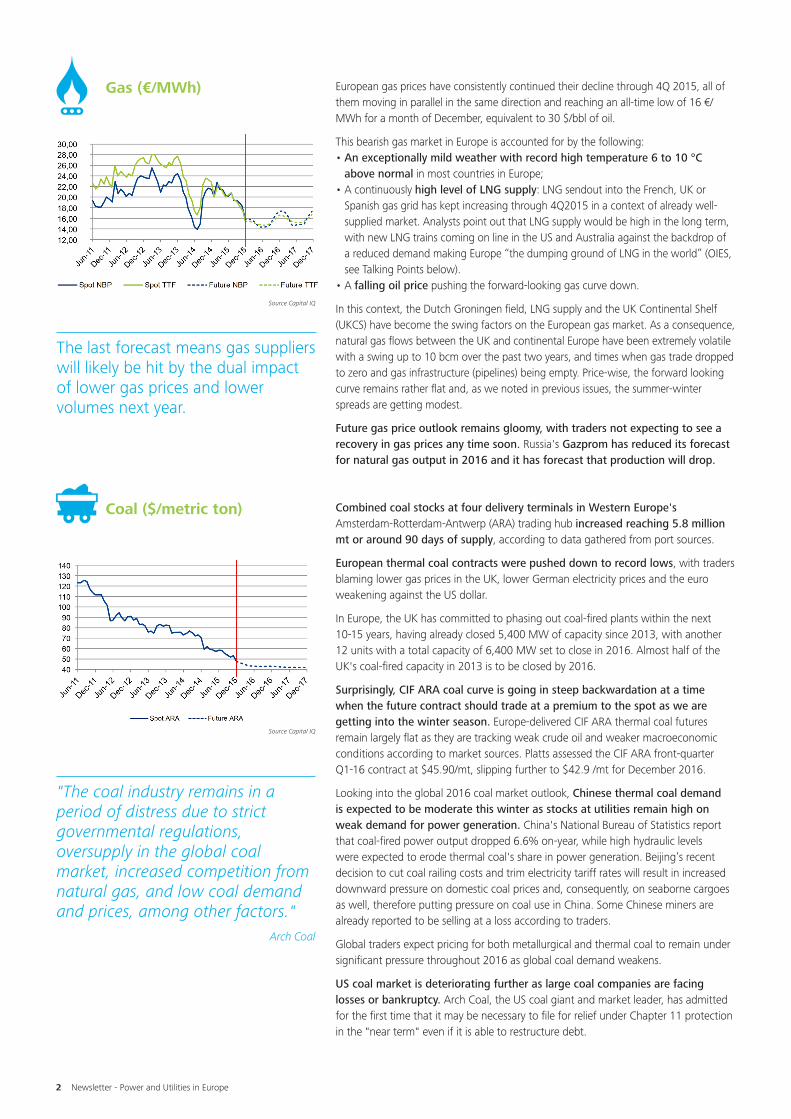
Gas (€/MWh)
The last forecast means gas suppliers will likely be hit by the dual impact of lower gas prices and lower volumes next year.
Coal ($/metric ton)
Source Capital IQ
Source Capital IQ
European gas prices have consistently continued their decline through 4Q 2015, all of them moving in parallel in the same direction and reaching an all-time low of 16 €/MWh for a month of December, equivalent to 30 $/bbl of oil.
This bearish gas market in Europe is accounted for by the following:• An exceptionally mild weather with record high temperature 6 to 10 °C
above normal in most countries in Europe;• A continuously high level of LNG supply: LNG sendout into the French, UK or
Spanish gas grid has kept increasing through 4Q2015 in a context of already well-supplied market. Analysts point out that LNG supply would be high in the long term, with new LNG trains coming on line in the US and Australia against the backdrop of a reduced demand making Europe “the dumping ground of LNG in the world” (OIES, see Talking Points below).
• A falling oil price pushing the forward-looking gas curve down.
In this context, the Dutch Groningen field, LNG supply and the UK Continental Shelf (UKCS) have become the swing factors on the European gas market. As a consequence, natural gas flows between the UK and continental Europe have been extremely volatile with a swing up to 10 bcm over the past two years, and times when gas trade dropped to zero and gas infrastructure (pipelines) being empty. Price-wise, the forward looking curve remains rather flat and, as we noted in previous issues, the summer-winter spreads are getting modest.
Future gas price outlook remains gloomy, with traders not expecting to see a recovery in gas prices any time soon. Russia's Gazprom has reduced its forecast for natural gas output in 2016 and it has forecast that production will drop.
Combined coal stocks at four delivery terminals in Western Europe's Amsterdam-Rotterdam-Antwerp (ARA) trading hub increased reaching 5.8 million mt or around 90 days of supply, according to data gathered from port sources.
European thermal coal contracts were pushed down to record lows, with traders blaming lower gas prices in the UK, lower German electricity prices and the euro weakening against the US dollar.
In Europe, the UK has committed to phasing out coal-fired plants within the next 10-15 years, having already closed 5,400 MW of capacity since 2013, with another 12 units with a total capacity of 6,400 MW set to close in 2016. Almost half of the UK's coal-fired capacity in 2013 is to be closed by 2016.
Surprisingly, CIF ARA coal curve is going in steep backwardation at a time when the future contract should trade at a premium to the spot as we are getting into the winter season. Europe-delivered CIF ARA thermal coal futures remain largely flat as they are tracking weak crude oil and weaker macroeconomic conditions according to market sources. Platts assessed the CIF ARA front-quarter Q1-16 contract at $45.90/mt, slipping further to $42.9 /mt for December 2016.
Looking into the global 2016 coal market outlook, Chinese thermal coal demand is expected to be moderate this winter as stocks at utilities remain high on weak demand for power generation. China's National Bureau of Statistics report that coal-fired power output dropped 6.6% on-year, while high hydraulic levels were expected to erode thermal coal's share in power generation. Beijing’s recent decision to cut coal railing costs and trim electricity tariff rates will result in increased downward pressure on domestic coal prices and, consequently, on seaborne cargoes as well, therefore putting pressure on coal use in China. Some Chinese miners are already reported to be selling at a loss according to traders.
Global traders expect pricing for both metallurgical and thermal coal to remain under significant pressure throughout 2016 as global coal demand weakens.
US coal market is deteriorating further as large coal companies are facing losses or bankruptcy. Arch Coal, the US coal giant and market leader, has admitted for the first time that it may be necessary to file for relief under Chapter 11 protection in the "near term" even if it is able to restructure debt.
"The coal industry remains in a period of distress due to strict governmental regulations, oversupply in the global coal market, increased competition from natural gas, and low coal demand and prices, among other factors."
Arch Coal

3 Newsletter - Power and Utilities in Europe
The anticipated increase of renewable electricity capacities in the EU casts considerable doubt over the future levels of EUA supply and demand balance.
French, German and UK power prices went down over 4Q2015 as electricity demand have been reviewed downward due to exceptionally warm temperatures and record wind generation in Western Europe, in Germany in particular.
Source Capital IQ
Carbon CO2 (€/ton)
Baseload Electricity Baseload Spot Day Ahead (€/MWh)
Source Capital IQ
The market for EU Allowances remained rather stable over 4Q 2015 in a context of weak auctions.
With trades just above 8 €/t, market commentators point out that EUA prices are expected to hit an upside resistance and find it difficult to go any higher, as 8 €/t is the price level where those industrial who are long start selling part of their surplus EUA holdings.
More generally, one of the main reason why the EUA trade lacks direction includes the fact that the Market Stability Reserve only addresses part of the problem, i.e. the current excess liquidity but does not tackle the root of the problem, i.e. the cause of excess carbon credits and the on-going allocation of free allowances. EU Member States do not agree yet on ways to review the free EUA allocation mechanisms.
French, German and UK power prices all went down over 4Q2015 as electricity demand forecasts have been reviewed downward over the quarter due to (i) exceptionally warm temperatures going into winter (6 to 10° C above normal) together with (ii) record wind generation levels forecast in Western Europe, Germany in particular.
Instead of appreciating with the approach of winter, baseload electricity prices went down on EPEX Spot with December trading at a 10 to 15 €/MWh discount compared to previous years (and peakload around 35 €/MWh i.e. an 8 €/MWh fall versus December on the year before). The fall of the electricity prices in the UK was also due to falling gas prices, as CCGT have been price setters for a number of hours with around 15 GW of gas-fired units operating.
The supply side was further increased due to:(i) French Nuclear output being at its strongest (reaching 54.6 GW) with EDF’s 900
MW Dampierre-3 reactor and 1.3 GW Flamanville-2 coming back up in steps and reaching full capacity after their maintenance programme at the end of the period; and
(ii) Wind output in Germany set to ramp up to a near-record of 35 GW.
According to Platts Renewable Power tracker, solar panels and wind turbines have generated, on average, 12.3 GW each hour so far this year in Germany, more than Germany's remaining fleet of nuclear power stations. Wind capacity was forecast to reach 45 GW by the end of 2015 with the first wave of offshore projects coming online this year, while solar additions have slowed to 1 GW so far this year with total solar PV capacity set to top 40 GW next year.
Prices in Italy de-correlated from the rest of the Continental Western European market and went up by 10 €/MWh over the quarter as hydro levels stayed poor and wind power generation has been low. In this context, gas-fired units have played the role as price-setters (for more than 42% of the time over 4 Q 2015), producing the marginal unit of electricity on the wholesale market. In addition, the Italian market is also reacting to the Government’s decision to phase out the Virtual Interconnector capacity system, which allowed electricity players to contract interconnection capacity and buy electricity from Italy’s neighbouring countries.

4 Newsletter - Power and Utilities in Europe
UK clean dark and spark spreads (£/MWh)
German clean dark and spark spreads (€/MWh)
Source Capital IQ
Source Capital IQ
The UK Clean Spark Spread has gone up modestly with lower gas prices (and a low oil price forward curve) but with lower electricity prices as well.
Clean Spark Spreads and Clean Dark Spreads are meeting at around 2.5 £/MWh. This means that the Carbon Floor Price of the UK Government is equal to the “coal-to-gas” switch price.
But Clean Dark and Clean Spark Spreads are not equal to the profit margin after deduction of all variable costs. The Clean Dark and Clean Sparks Spreads still include the Operating & Maintenance costs. As the Operating & Maintenance costs of a coal plant are twice the amount of a gas plant, then we understand that coal plants are now running at a loss, purely based on their variable (or marginal costs) in the UK and probably as well in Germany (see below). This is exactly what the UK Government wanted to do when it introduced the Carbon Price Floor: coal-fired power plants are clearly going to shut down. Furthermore, the dominance of gas plants in the UK (compared to the Continent where gas-fired generation units are hardly operating) will result in CCGT setting marginal prices a lot more often in the UK than obviously on the continent.
Clean Spark Spreads in Germany are at an almost 4-year high, although still in negative territory. This means that profit margins for using gas-fired power plants to produce electricity for delivery in Germany have risen to their highest level in years as gas prices are now falling and EUA carbon allowance prices marginally favoring gas over more carbon-intensive coal-fired power generation.
By contrast, the German Clean Dark Spread for coal-fired power plants (with 35% efficiency) has fallen slightly but regularly. However, the latest generation of new coal-fired power plants recently commissioned in Germany have a 45% efficiency and could therefore contribute to restoring the coal plant owners’ return.
This means that the profit gap between a modern CCGT gas-fired power plant with 50% efficiency and an old coal-fired power plant has narrowed from almost €30/MWh two years ago to just over €10/MWh currently.
The current clean dark spreads level means that coal plants are now running at a loss.
Currently the profit gap between a modern CCGT gas-fired power plant and an old coal-fired power plant is just has narrowed and stand just over €10/MWh currently.

5 Newsletter - Power and Utilities in Europe
Spotlight on Power and Utilities marketCapital market overview
Deloitte Index (1)
Engie EDF EON Iberdrola RWEGas
NaturalEnel SSE Centrica
Market cap. ratios
Currency EUR EUR EUR EUR EUR EUR EUR GBP GBP
Market cap. (Dec. 31, 2015) 38 363 24 473 16 897 40 738 7 182 19 224 37 243 14 667 10 729
3m stock price performance 5% 17% -12% 19% 10% 19% 6% 0% 2% -2%
YoY stock price performance -8% -15% -40% -36% 17% -54% -10% 6% -5% -21%
Market multiples
EV/EBITDA 2014 8,5x 6,7x 6,6x 5,6x 9,9x 7,8x 8,7x 6,9x 9,1x 6,8x
EV/EBITDA 2015 7,9x 6,7x 6,4x 6,2x 9,2x 6,6x 7,2x 6,7x 8,0x 6,8x
P/E 2014 11,0x 15,7x 6,6x n.m. 17,4x 4,0x 13,1x n.m. 22,1x n.m.
P/E 2015 13,0x 14,3x 6,2x 10,7x 17,3x 6,5x 12,9x 12,6x 12,5x 12,2x
Price/book value 2014 1,5x 0,8x 0,7x 0,9x 1,1x 0,7x 1,3x 1,2x 2,4x 3,4x
Profitability ratios
ROE forward 12m 13% 5% 11% 6% 7% 11% 11% 9% 19% 32%
ROCE forward 12m 8% 5% 6% 8% 4% 13% 7% 8% 12% 14%
EBITDA margin 2014 19% 15% 23% 7% 23% 11% 18% 20% 7% 9%
EBITDA margin 2015 20% 16% 23% 7% 23% 13% 20% 20% 8% 9%
EBIT margin 2014 12% 9% 12% 4% 14% 6% 12% 13% 5% 5%
EBIT margin 2015 12% 9% 12% 4% 13% 7% 13% 12% 6% 5%
(1): Deloitte Index is composed of Engie, EDF, EON, Iberdrola, RWE, Gas Natural, Enel, SSE and Centrica n.m.: not meaningful
Key messages from brokers and analysts
“Difficult commodity backdrop means self-help is key” (Deutsche Bank - January 12, 2016) “Growing renewables, sluggish demand and ever-present political risk represent further negatives” (HSBC – November 26, 2015) “We don’t believe that the decline in power prices has yet ended” (HSBC – November 26, 2015)
“We believe that decarbonisation is the main structural megatrend in Energy policy in Europe – soon enough - globally”(UBS – November 24, 2015)
“European gas prices are still not low enough to discourage further increase of LNG market share” (Crédit Suisse – November 19, 2015)
(1) : Deloitte Index is composed of Engie, EDF, EON, Iberdrola, RWE, Gas Natural, Enel, SSE and Centrica
Source Capital IQ
Source Capital IQ

6 Newsletter - Power and Utilities in Europe
M&A Trends
Transactions involving Power & Utilities companies
Czech group EPH has signed a contract to purchase from Enel of a 66% stake in Slovak energy company SE, the biggest electricity producer in Slovakia, for €750m. (Reuters - December 18, 2015)
Czech EP Energy, part of the privately-held EPH group, has completed the acquisition of a 95.6% stake in Budapesti Eromu from EDF which operates 3 co-generating gas power plants covering 60% of heat consumption in Budapest. The amount of the transaction is not disclosed. (Reuters, December 10, 2015)
Enbridge Inc, a power generation, distribution and transmission company, has acquired for £573m from E.ON a 24.9% stake in Rampion Offshore Wind Ltd, which owns and operates an offshore wind power plant with a 400MW capacity. (GlobalData – November 6, 2015)
RWE Innogy has secured a 25% stake in the 336MW Galloper offshore wind farm in the UK. The project is runned with Macquarie Capital, UK Green Investment Bank and Siemens Financial Services, and represents a £1.5bn investment. (Platts – November 2, 2015)
German energy utilities EnBW and EWE have agreed to restructure their shareholdings and to swap assets in an amount of €1.5bn. As part of the deal EnBW is taking over 74.2% of local natural gas company VNG Verbundnetz Gas to become the third largest domestic gas supplier in Germany. (GlobalData - October 19, 2015)
Transactions in electricity and gas infrastructures
Italian gas infrastructure company SNAM completed the acquisition of a 20% interest in Trans Adriatic Pipeline (TAP) from Statoil for a total compensation of €205m. (SeeNews – December 18, 2015)
Belgian gas transporting company Fluxys has purchased a 10% stake in Interconnector Ltd (UK), the owner of a natural gas pipeline between the UK and Belgium, from Russian Gazprom. The amount of the deal is not disclosed. (Reuters, December 17, 2015)
Terna Spa, the Italian power grid operator, has agreed to acquire the high voltage electricity grid SELF from Italy’s state railways for €757m representing 8,379 km of high voltage and fiber-optic lines. (SeeNews – December 10, 2015)
Spain’s Red Electrica, a Spanish transmission company, announced the acquisition of a 50% stake in the capital of Transmisora Electrica del Norte, a Chilean transmission company, for €202m. (SeeNews - December 7, 2015)
Transaction involving equity funds
Sweden's Vattenfall has sold its 49% stake in Britain's 150MW Ormonde offshore wind farm to Swedish pension fund AMF for £237m. This agreement comes two months after AMF committed £300 million to the Green Investment Bank’s (GIB) pioneering offshore wind fund. (Reuters - December 18, 2015)
The European Bank for Reconstruction and Development is acquiring for $100m a 20% stake in Turkeys AkfenRE, a subsidiary of infrastructure group Akfen Holding specialized in renewable energy and owning a combined capacity of 210MW. (Reuters - December 15, 2015)
Macquarie, a private equity fund, has agreed to acquire 49% stake in Hydro Dolomiti from Enel for €335m. Hydro Dolomiti is a power generation company operating 26 large hydro power plants with a combined installed capacity of up to 1,280 MW. (GlobalData – November 16, 2015)
ERG Renew, an Italian wind energy operator, will purchase 17 wind farms with combined installed capacity of 206MW from Impax Asset Management, a private equity fund for €297m. (GlobalData - October 19, 2015)
UK Renewable HoldCo 1, a joint venture between Cheung Kong Infrastructure Holding and Power Assets, an electricity generation company, has agreed to acquire Iberwind, a renewable energy company operating an installed capacity of 700MW in Portugal, from Magnum Capital, a private equity firm for a purchase price of €288m. (GlobalData – October 8, 2015)

7 Newsletter - Power and Utilities in Europe
European Power and Utilities companies wrap-up
Q3 2015 Highlights
• Q3 2015 Group sales organic dropped by 0.4% compared to 9 months 2014:- 2.1% organic change including 2012 tariffs catch-up
which had impacted 2014 sales for +€921m- 2015 nuclear output at 306 Twh compared to 305
Twh in 2015- Less favourable hydro conditions in France with a
12.6% drop in output
• Q3 2015 EBITDA went down by 7.5% compared to last year- drop in oil and gas prices on exploration-production activities and
on LNG sales- decrease in average realized power prices and unavailability of Doel
3, Tihange 2 and Doel 1 nuclear plants• These negative impacts have been partly compensated by
commissioning of new assets, performance on costs, favorable impact from foreign exchange and positive weather impact in France
Key events in the period
• Agreements signed with CGN on October 21, 2015 for construction of 2 EPR reactors at Hinkley Point C with a FID subject to finalization of long form documentation and financing plan, approval by the Board of EDF and CGN, and clearance by merger control and other governmental authorities in China and Europe
• Payment of the interim dividend (€0.57 per share)
• Long term bonds issues with an average coupon lowered at 2.8% and a 12.8 years average maturity:- $1.5bn of Senior bond on the Taiwanese market - $4.75bn through 5 US Senior bonds including the
largest US$ green bond from a corporate ($1.25bn)
• New agreement on EDF Luminus shareholders structure
• Selective investments to accelerate growth strategy- Further steps in developing energy services worldwide, notably in
Chile, France, Belgium, USA, Asia-Pacific (8 acquisitions)- Acquisition of Solairedirect, making Engie the leader of solar in France- Acquisition through Cofely Axima of group Nexilis, a major player in
HVAC technology- In China, strategic agreement with Chongqing Energy Investment in
distributed energy
• New investments in power generation to emit no or little CO2
- No further coal projects - Focus on renewable & gas power projects
• Agreement with the Belgian government for a 10-years extension to operation of Doel 1 and Doel 2
• ENGIE entered Dow Jones Sustainable Indexes (World & Europe) on September 2015.
FY 2015 Outlook
• FY 2015 EBITDA guidance confirmed.
• Additonnal impairment charge would be recognized in the second semester 2015 in the range of €2.3bn
• 2015 outlook confirmed
• In addition, the group has initiated its annual process for reassessment of its carrying value. As a result notably of worsening market conditions, it is forseeable that this process will lead to the adjustment of the carrying value of certain assets
Q3 2015 Highlights
• Sales in the Q3 increased by 5% compared to last year principally due to upper sales in Global Commodities and Other EU Countries. However, sales in Generation, Exploration & Production and Non-EU Countries still declining.
• EBITDA declined by 18% year on year. Positive weather effect more than offset by lower earnings in power business and lower commodity prices at Exploration & Production
• Goodwill and assets impairment for €8.3bn in Q3
• EBITDA declined by 6% as result of continued drop in margins in conventional electricity generation.
• The operating result fell by 9%.
• Adjusted net income (formerly recurrent net income) decreased by 29% since the 2015 operating result included a €185m non recurring profit linked to VSE assets reevaluation in respect with the first full consolidation of this entity in 2015.
Key events in the period
• E.ON spin off to be effective in January 1rst 2016:- E.ON’s conventional power generation, trading and
E&P spin-off will be named Uniper.- The rump E.ON business will focus on renewables,
energy networks and customer solution.
• On December 23, 2015 RWE and E.ON jointly sold their minority stakes in the Luxembourg utility Enovos to the Grand Duchy of Luxembourg and the investment company Ardian.
• Anti-trust authorities approved the disposal of E.ON Italian activities
• RWE power stations qualify for second UK capacity market auction: the invitation to tender covers 44.7 GW for making secured generation capacity available to the market from October 2019 to September 2020.
• In respect with the German Law on lignite power plants RWE will put 5 units of the 300MWH class on stand-by between 2017 and 2019. Operators will be compensated for keeping them on stand-by.
• RWE signed a cooperation agreement with Emirate of Dubai to develop management and technical consulting services on energy supply and demand side mangement
• On December 11, 2015 RWE announced that the company will transfer its renewables, grid and retail operations in Germany and abroad to a new subsidiary, which it intends to list on the stock market towards the end of next year. RWE AG will focus on conventional electricity generation and energy trading. RWE AG will remain the new subsidiary’s majority shareholder over the long term and consolidate it fully.
FY 2015 Outlook
• 2015 outlook confirmed. • 2015 outlook confirmed.

8 Newsletter - Power and Utilities in Europe
Q3 2015 Highlights
• Q3 2015 sales went up by 5% compared to last year because of a rise in fuels sales and environmental certificates in Italy as a result of greater volume handled.
• This development was accompanied by a rise in revenues in Latin America, mainly owing to rising prices and volumes but also due to local programs.
• EBITDA increased by 5% year on year. Increase in in Latin America and Iberian Peninsula partly offset by a reduction in generation & trading margin in Italy.
• Upstream gas and power businesses both continue to be impacted by the low commodity price environment.
• Average British Gas year-on-year residential gas consumption was 20% higher and average year-on-year electricity consumption was 3.5% lower in Q3 2015 reflecting colder than normal temperatures in the UK compared to a warm 2014.
• In North America, Direct Energy is performing well and remains on track to deliver material operating profit growth in 2015.
Key events in the period
• Simplification of the organization in Latin America: split between “Chile” and “Rest of LatAm”, with Chile separated in “Generation” and “Distribution”.
• Acquisition of BLP Energy, the utility-scale wind and solar subsidiary of Bharat Light and Power.
• ENEL remains in the FTSE4Good index and the Dow Jones Sustainable World Index.
• In September, the Competition and Markets Authority (CMA) announced they were extending the timetable for the investigation into the UK energy market by six months.
• Direct Energy completed the acquisition of Panoramic Power, providing Centrica’s DE&P business with leading capabilities in energy management technology and data science expertise.
FY 2015 Outlook
• 2015 outlook confirmed. • 2015 outlook confirmed.
Q3 2015 Highlights
• EBITDA increased by 5.8% year on year driven by international businesses and strong operating performance, party offset by a drop of 2% in Spain.
• EBITDA went up by 10.9% year on year thanks to:
- the contribution of the Chilean energy company (€464m EBITDA in Q3 2015) which is fully integrated since 30th November 2014
- the good performance of international activities increased by 30%.
Key events in the period
• Bonds issuance for €500m in September 2015 (maturity 2023, coupon of 1.75%)
• Iberdrola merged its US assets with UIL, a US Energy Company, in a $17,9bn transaction to create an Energy publicly-traded Company. Iberdrola will own 81.5% of the resulting company and UIL will receive 18.5% plus $597m in cash.
• Net investments in the period for €2.1 bn (€1.1 bn in networks)
• Renewal of 1 bcm gas supply contract with GAIL (India) for the year 2016
• Acquisition in September 2015 of ~250,000 LPG connection points in Spain from Repsol
• Approval by EIB of a €900 million long term loan to finance expansion of gas distribution networks in Spain
• Acquisition in October 2015 of an additional 8.33% of Metrogas by Gas Natural Fenosa Chile: - raises GNF’s controlling stake in Metrogas from 51.84% to
60.17%
FY 2015 Outlook
• 2015 outlook confirmed.
• Integration between UIL Holdings and Iberdrola USA contemplated in the last quarter of 2015.
• 2015 outlook confirmed.
• Targets set in the 2013-2015 strategic plan confirmed. Targets which now include the Chilean acquisition CGE competed in Q4 2014.

9 Newsletter - Power and Utilities in Europe
Talking points
1. World energy demand grows in all WEO scenarios but the demand profile is comparable to previous WEO projections. Under the New Policies Scenario, the central scenario of the IEA, the global primary energy demand increases by 32% from 2015 to 2040.
2. All of the net demand growth comes from non-OECD countries while OECD demand ends 3% lower at the end of the time horizon
3. Energy demand grows at 1.0% per year between 2013 and 2040, about half the average annual rate since 1990, thanks to increased energy efficiency in end uses and structural changes to the economy.
4. The largest oil consumer – the United States – experiences one of the world’s largest reductions in demand from 2013 to 2040 (along with the European Union), declining by around 4 million barrels per day (mb/d), and returning to levels last observed in the 1960s
5. Global natural gas demand goes up 47% globally, led by China and the Middle East. But, in Japan, and for the first year in the EU, the IEA sees gas demand drop over the 2013-2040 period.
6. Decarbonisation and energy efficiency efforts still fall short of what is required to move the world onto a pathway consistent with the 2 °C climate goal. In the New Policies Scenario, energy-related CO2 emissions increase to 36.7 Gt in 2040, 16% higher than in 2013, i.e. a scenario in line with a 3 to 4°C increase relative to pre-industrial level at the end of the century. The power sector decarbonises more than ever before: CO2 emissions from power generation grow at only one-fifth of the rate at which power generation grows to 2040, breaking a longstanding one-for-one correlation.
7. The world’s appetite for electricity lifts demand by more than 70% by 2040. The Renewables account for half of all growth over the period to 2040, overtaking coal as the largest source of electricity by the early-2030s. The deployment of renewables, which totals 3 600 GW from 2015-2040 with over 13,000 TWh, is greater than for all other types of power plant combined as non-hydro (mostly wind and solar) become increasingly competitive.
Decarbonisation and energy efficiency efforts still fall short of what is required to move the world onto a pathway consistent with the 2°C climate goal.
The world’s appetite for electricity lifts demand by more than 70% by 2040 and the Renewables account for half of all growth overtaking coal as the largest source of electricity by the 2030s
1 – The Key learnings of the IEA’s World Energy Outlook 2015Newsletter January 2016
Topics
1 – The Key learnings of the IEA’s World Energy Outlook 2015
1. World energy demand grows in all WEO scenarios but the demand profile is comparable to previous WEO projections. Under the New Policies Scenario, the central scenario of the IEA, the global primary energy demand increases by 32% from 2015 to 2040.
2. All of the net demand growth comes from non-OECD countries while OECD demand ends 3% lower at the end of the time horizon
3. Energy demand grows at 1.0% per year between 2013 and 2040, about half the
average annual rate since 1990, thanks to increased energy efficiency in end uses and structural changes to the economy.
3. Energy demand grows at 1.0% per year between 2013 and 2040, about half the
average annual rate since 1990, thanks to increased energy efficiency in end uses and structural changes to the economy.
4. The largest oil consumer – the United States – experiences one of the world’s largest reductions in demand from 2013 to 2040 (along with the European Union), declining by around 4 million barrels per day (mb/d), and returning to levels last observed in the 1960s
5. Global natural gas demand goes up 47% globally, led by China and the Middle East. But, in Japan, and for the first year in the EU, the IEA sees gas demand drop over the 2013-2040 period.
6. Decarbonisation and energy efficiency efforts still fall short of what is required to move the world onto a pathway consistent with the 2 °C climate goal. In the New Policies Scenario, energy-related CO2 emissions increase to 36.7 Gt in 2040, 16% higher than in 2013, i.e. a scenario in line with a 3 to 4°C increase relative to pre-industrial level at the end of the century. The power sector decarbonises more than ever before: CO2 emissions from power generation grow at only one-fifth of the rate at which power generation grows to 2040, breaking a longstanding one-for-one correlation.
7. The world’s appetite for electricity lifts demand by more than 70% by 2040. The Renewables account for half of all growth over the period to 2040, overtaking coal as the largest source of electricity by the early-2030s. The deployment of renewables, which totals 3 600 GW from 2015-2040 with over 13,000 TWh, is greater than for all other types of power plant combined as non-hydro (mostly wind and solar) become increasingly competitive.
8. Renewables-based generation reaches 50% in the European Union by 2040, around 30% in China and Japan, and above 25% in the United States and India.
9. Coal’s share of total electricity generation drops to 30% in 2040, and the output from inefficient sub-critical plants declines by 45%.
Sources: IEA, WEO 2015, Deloitte
Electricity production in 2040 and change relative to 2014 by source
Source: WEO 2015
Sources: IEA, WEO 2015, Deloitte
Sources: IEA, WEO 2015, Deloitte
Sources: IEA, WEO 2015, Deloitte
Sources: IEA, WEO 2015, Deloitte
Sources: IEA, WEO 2015, Deloitte
Sources: IEA, WEO 2015

10 Newsletter - Power and Utilities in Europe
8. Renewables-based generation reaches 50% in the European Union by 2040, around 30% in China and Japan, and above 25% in the United States and India.
9. Coal’s share of total electricity generation drops to 30% in 2040, and the output from inefficient sub-critical plants declines by 45%.
10. Asia the final destination for 80% of regionally traded coal, 75% of oil and 60% of natural gas in 2040.
Sources: IEA, WEO 2015
8. Renewables-based generation reaches 50% in the European Union by 2040, around 30% in China and Japan, and above 25% in the United States and India.
9. Coal’s share of total electricity generation drops to 30% in 2040, and the output from inefficient sub-critical plants declines by 45%.
Sources: IEA, WEO 2015, Deloitte
Electricity production in 2040 and change relative to 2014 by source
Source: WEO 2015
10. Asia the final destination for 80% of regionally traded coal, 75% of oil and 60% of
natural gas in 2040.
Sources: IEA, WEO 2015
11. In the New Policies Scenario, the IEA crude oil import price, which a proxy for the international oil market price, goes from 80 $/bbl in 2020 up to 113 $/bbl in 2030 and 128 $/bbl in 2040 as these price levels are required from suppliers to match demand. For the first time, the IEA has worked out a Low Oil Price Scenario where global demand is met by oil quantities which are readily available at a low cost of extraction

11 Newsletter - Power and Utilities in Europe
11. In the New Policies Scenario, the IEA crude oil import price, which a proxy for the international oil market price, goes from 80 $/bbl in 2020 up to 113 $/bbl in 2030 and 128 $/bbl in 2040 as these price levels are required from suppliers to match demand. For the first time, the IEA has worked out a Low Oil Price Scenario where global demand is met by oil quantities which are readily available at a low cost of extraction on the long run. A new oil market equilibrium then emerges at prices in a $50-60/bbl range that last until well into the 2020s before edging higher to $85/bbl in 2040. According to the World Energy Outlook 2015 of the IEA, the Low Oil Price scenario assumes a sluggish near-term economic growth globally against the backdrop of (i) a moderate economic performance in China, (ii) a stable Middle East in which key producers are driven by the need to increase their share of the market in volumes, and (iii) resilient performance from key non-OPEC producers, particularly US tight oil. In this scenario, demand is pushed up to over 107 mb/d by 2040, nearly 4 mb/d higher than in the New Policies Scenario.
12. If lower prices persist for decades, OPEC producers get back to the market power that they gained in the 1970s. However, if investment falls short, the world also faces the risk of a sharp market rebound which could bring back prices to higher levels. Within OPEC, output growth is led by Iraq and Iran, although both face distinct challenges to mobilise the necessary investment. With the prospect of international sanctions being lifted, Iran increases its production up to 5.4 mb/d, while Iraqi oil output more than doubles to nearly 8 mb/d by 2040.
13. US tight oil has demonstrated its ability to respond quickly to price signals. The US have taken over Saudi Arabia as the global swing producer in many respects. But the prospect of oil prices remaining below 50 US$/bbl could limit the volumes which US producers can bring to the market at a profit.
on the long run. A new oil market equilibrium then emerges at prices in a $50-60/bbl range that last until well into the 2020s before edging higher to $85/bbl in 2040.
According to the World Energy Outlook 2015 of the IEA, the Low Oil Price scenario assumes a sluggish near-term economic growth globally against the backdrop of (i) a moderate economic performance in China, (ii) a stable Middle East in which key producers are driven by the need to increase their share of the market in volumes, and (iii) resilient performance from key non-OPEC producers, particularly US tight oil. In this scenario, demand is pushed up to over 107 mb/d by 2040, nearly 4 mb/d higher than in the New Policies Scenario.
Sources: IEA, WEO 2015
12. If lower prices persist for decades, OPEC producers get back to the market power that they gained in the 1970s. However, if investment falls short, the world also faces the risk of a sharp market rebound which could bring back prices to higher levels. Within OPEC, output growth is led by Iraq and Iran, although both face distinct challenges to mobilise the necessary investment. With the prospect of international sanctions being lifted, Iran increases its production up to 5.4 mb/d, while Iraqi oil output more than doubles to nearly 8 mb/d by 2040.
Oil supply change in the Low Oil Price scenario versus the New Policies Scenario source: WEO 2015
With nuclear accounting for 50% of France’s electricity generation capacity and a 75% contribution to its electricity production, any change to the French electricity mix has always been regarded as problematic or marginal at best.
In October 2015, ADEME, the energy and climate think tank of the French Government, released a pre-feasibility Study on a 100% renewable electricity mix. The report is based on a model used to determine the optimal renewable parks by region in France, making sure that the balance between production and demand can be achieved for each hour, taking into account severe reported climate shocks including past reported heat waves or cold snaps.
The horizon of this electricity mix is 2050, at which time it is assumed that the French population will include 74 million inhabitants in 36 million houses or flats, with different electricity demand scenarii
from 422 TWh yearly (low demand case) to 510 TWh
per annum (reduced energy efficiency scenario), as
opposed to 442 TWh today. It is further assumed
that 50% of the car fleet will be plug-in hybrid or
electric; 100% of hot water production for domestic
use will use electricity and 40% of heating systems
in the residential and service industry sectors will
be supplied by heat pumps, of which 75% will be
dispatchable, i.e. with load-shedding facility.
The study is further based on internationally reputed,
official assessments of the total national resource
potential for each renewable sources. The full
renewable potential of France is then established to
be as high as 364 GW for roof-top PV capacity, 174
GW maximum capacity for onshore wind potential,
but only 410 MW of CSP or 140 MW of geothermal
electricity.
2 – A blueprint for a 100% renewable electricity mix by 2050 in France?
Sources: IEA, WEO 2015
For the first time, the IEA has worked out a Low Oil Price Scenario where global demand is met by oil quantities which are readily available at a low cost of extraction on the long run.
The horizon of this electricity mix is 2050 with different electricity demand scenarii from 422 to 510 TWh per annum as opposed to 442 TWh today.
Sources: IEA, WEO 2015

12 Newsletter - Power and Utilities in Europe
The major achievement of the ADEME study is to work out a number of scenarii for up to 100% renewable electricity mix by 2050 around one 100% renewable Reference Scenario.
In all cases, a combination of wind (both onshore and offshore) and solar technologies (both roof-top and utility-scale) accounts for more than 80% of the electricity mix. The different levels of social acceptability are dealt with by changing the share of each type within a type of energy: constraints on the development of utility-scale PV is compensated by a larger share of roof-top panels; a high level of social resistance to wind onshore results in a larger offshore wind capacity. Scenarii with a 80% or 40% renewable base have been developed to reflect a high level of social constraint on grid development.
Under the 100% renewable Reference Scenario, the installed capacity of the French system required to reach system adequacy – or the electricity supply to match demand at any point in time – needs to be equal to 230 GW versus around 120 GW in 2012, with the electricity mix as below.
The generation mix is on average accounted for by wind energy for 63% (generated by some 50,000 wind turbines across the country, against
4,000 today), solar 17%, and hydro 13%, and 7% for renewable thermal energy which includes a combination of biogas and biomass, as per the graph below :
With non-dispatchable, intermittent renewable energy generation varying between 20 and 120 GW of capacity (essentially wind generation), the various scenarios rely on a number of demand flexibility solutions, assuming widespread development of smart meters and associated services. Demand-side management is activated according to differentiated load-shifting conditions depending on the dispatchable loads (heating, washing, hot water equipment or electric vehicle charging). This results in a maximum theoretical upward (in effect, consumption stimulation) flexibility of 22 GW and downward (load-shifting) of 8 GW. The balance of the intermittency is matched by the storage capacity.
Indeed, in order to move from 40% to 80%, then 95% and 100% renewables penetration, and therefore replace all fossil-fuel generation, a number of energy storage solutions need to be in place. These include three types of storage: with the capacities as per the graph below:
(i) A short-term storage (6 hours discharge time) comprising of compressed air energy storage (ACAES) or batteries, with a Levelized Cost of Storage (LCOS) which has been calculated to be 58 €/MWh
(ii) Pumped storage hydropower plants (PSHP), intra-day storage and within-week storage (32 hours discharge time), with a LCOS of 46 €/MWh;
The major achievement of the ADEME study is to work out a number of scenarii for up to 100% renewable electricity mix by 2050 around one 100% renewable Reference Scenario.
In all cases, a combination of wind (both onshore and offshore) and solar technologies (both roof-top and utility-scale) accounts for more than 80% of the electricity mix. The different levels of social acceptability are dealt with by changing the share of each type within a type of energy: constraints on the development of utility-scale PV is compensated by a larger share of roof-top panels; a high level of social resistance to wind onshore results in a larger offshore wind capacity. Scenarii with a 80% or 40% renewable base have been developed to reflect a high level of social constraint on grid development.
Under the 100% renewable Reference Scenario, the installed capacity of the French system required to reach system adequacy – or the electricity supply to match demand at any point in time – needs to be equal to 230 GW versus around 120 GW in 2012, with the electricity mix as below.
The generation mix is on average accounted for by wind energy for 63% (generated by some 50,000 wind turbines across the country, against 4,000 today), solar 17%, and hydro 13%, and 7% for renewable thermal energy which includes a combination of biogas and biomass, as per the graph below :
MSW : Municipal Solid Waste incineration
Source : ADEME
Source : ADEME, Deloitte
MSW: Municipal Solid Waste incineration
The major achievement of the ADEME study is to work out a number of scenarii for up to 100% renewable electricity mix by 2050 around one 100% renewable Reference Scenario.
In all cases, a combination of wind (both onshore and offshore) and solar technologies (both roof-top and utility-scale) accounts for more than 80% of the electricity mix. The different levels of social acceptability are dealt with by changing the share of each type within a type of energy: constraints on the development of utility-scale PV is compensated by a larger share of roof-top panels; a high level of social resistance to wind onshore results in a larger offshore wind capacity. Scenarii with a 80% or 40% renewable base have been developed to reflect a high level of social constraint on grid development.
Under the 100% renewable Reference Scenario, the installed capacity of the French system required to reach system adequacy – or the electricity supply to match demand at any point in time – needs to be equal to 230 GW versus around 120 GW in 2012, with the electricity mix as below.
The generation mix is on average accounted for by wind energy for 63% (generated by some 50,000 wind turbines across the country, against 4,000 today), solar 17%, and hydro 13%, and 7% for renewable thermal energy which includes a combination of biogas and biomass, as per the graph below :
MSW : Municipal Solid Waste incineration
Source : ADEME
Source : ADEME, Deloitte
Source: ADEME, Deloitte
With non-dispatchable, intermittent renewable energy generation varying between 20 and 120 GW of capacity (essentially wind generation), the various scenarios rely on a number of demand flexibility solutions, assuming widespread development of smart meters and associated services. Demand-side management is activated according to differentiated load-shifting conditions depending on the dispatchable loads (heating, washing, hot water equipment or electric vehicle charging). This results in a maximum theoretical upward (in effect, consumption stimulation) flexibility of 22 GW and downward (load-shifting) of 8 GW. The balance of the intermittency is matched by the storage capacity.
Indeed, in order to move from 40% to 80%, then 95% and 100% renewables penetration, and therefore replace all fossil-fuel generation, a number of energy storage solutions need to be in place. These include three types of storage: with the capacities as per the graph below:
(i) A short-term storage (6 hours discharge time) comprising of compressed air energy storage (ACAES) or batteries, with a Levelized Cost of Storage (LCOS) which has been calculated to be 58 €/MWh
(ii) Pumped storage hydropower plants (PSHP), intra-day storage and within-week storage (32 hours discharge time), with a LCOS of 46 €/MWh;
(iii) An Inter-seasonal storage system through the use of "power-to-gas" (methanation) and "gas-to-power" in order to face the most challenging weather conditions for the system which has a LCOS of 138 €/MWh.
Source : ADEME, Deloitte
Source : ADEME
Source: ADEME, Deloitte
These capacities would be theoretically able to produce the amount of electricity shown in the graph below:
In all cases, a combination of wind (both onshore and offshore) and solar echnologies (both roof-top and utility-scale) accounts for more than 80% of the electricity mix.
With non- dispatchable, intermittent renewable energy varying between 20 and 120 GW of capacity, the various scenarios rely on a strong development of demand flexibility.

13 Newsletter - Power and Utilities in Europe
(iii) An Inter-seasonal storage system through the use of "power-to-gas" (methanation) and "gas-to-power" in order to face the most challenging weather conditions for the system which has a LCOS of 138 €/MWh.
As far as the upgrade and reinforcement of the TSO and DSO grids are concerned, the domestic interconnection capacities will need to be increased by 36% compared to today’s level, and the cross-border connections will have to be upped from 14 to 23 GW for export and 11 to 16 GW for import. The overnight capital expenditure relating to (i) connecting the new REN capacities and (ii) reinforcing the transmission network was estimated to be €70 million/GW and reach a total investment of 1.6 bn €. The cost of constructing new (underground) lines (comprising all CAPEX figures other than connection and reinforcement is assumed to be 1.8 bn €. In terms of TSOs and DSOs Operation & Maintenance costs, ADEME estimates a global domestic figure of 7.6 bn € annually. Finally, the extra grid losses will represent an amount of approximately 1.4 bn €. ADEME estimates that the yearly TSO and DSO cost increase related to operating the optimised transmission and distribution system of a 100% renewable mix will be equal to an extra 470 m€ per annum and represent less than 1% of the annual cost of the electricity system.
Under the Reference Scenario, the annual cost of the electricity system calculated by ADEME (based on economical cost, and not levelized costs) amounts to €50.1 billion, of which 65% is accounted for by the renewable energy costs, 8% for storage costs, 23% represents the MV transmission and distribution network costs, and 4% the HV transmission network cost.
Based on a cost approach, the electricity system price varies from 103 €/MWh to 138€/MWh by 2050, with a base case as below:
The price range above is to be compared to a current supply cost of 99 €/MWh (before tax) available to industrial users in France in 2012 (Commission de Régulation de l’Energie, 2012 report). A key learning of the French study is that a 100% renewable electricity system will not come at a significant cost increase for the consumers, contrary to many messages of doom and gloom.
Other scenarii have been developed for the purpose of modelling different constraints over the development of the 100% renewable mix including reduced public acceptance, constraint on grid development or upgrade, technology barriers, capital constraints etc…
With non-dispatchable, intermittent renewable energy generation varying between 20 and 120 GW of capacity (essentially wind generation), the various scenarios rely on a number of demand flexibility solutions, assuming widespread development of smart meters and associated services. Demand-side management is activated according to differentiated load-shifting conditions depending on the dispatchable loads (heating, washing, hot water equipment or electric vehicle charging). This results in a maximum theoretical upward (in effect, consumption stimulation) flexibility of 22 GW and downward (load-shifting) of 8 GW. The balance of the intermittency is matched by the storage capacity.
Indeed, in order to move from 40% to 80%, then 95% and 100% renewables penetration, and therefore replace all fossil-fuel generation, a number of energy storage solutions need to be in place. These include three types of storage: with the capacities as per the graph below:
(i) A short-term storage (6 hours discharge time) comprising of compressed air energy storage (ACAES) or batteries, with a Levelized Cost of Storage (LCOS) which has been calculated to be 58 €/MWh
(ii) Pumped storage hydropower plants (PSHP), intra-day storage and within-week storage (32 hours discharge time), with a LCOS of 46 €/MWh;
(iii) An Inter-seasonal storage system through the use of "power-to-gas" (methanation) and "gas-to-power" in order to face the most challenging weather conditions for the system which has a LCOS of 138 €/MWh.
Source : ADEME, Deloitte
Source : ADEME Source: ADEME
As far as the upgrade and reinforcement of the TSO and DSO grids are concerned, the domestic interconnection capacities will need to be increased by 36% compared to today’s level, and the cross-border connections will have to be upped from 14 to 23 GW for export and 11 to 16 GW for import. The overnight capital expenditure relating to (i) connecting the new REN capacities and (ii) reinforcing the transmission network was estimated to be €70 million/GW and reach a total investment of 1.6 bn €. The cost of constructing new (underground) lines (comprising all CAPEX figures other than connection and reinforcement is assumed to be 1.8 bn €. In terms of TSOs and DSOs Operation & Maintenance costs, ADEME estimates a global domestic figure of 7.6 bn € annually. Finally, the extra grid losses will represent an amount of approximately 1.4 bn €. ADEME estimates that the yearly TSO and DSO cost increase related to operating the optimised transmission and distribution system of a 100% renewable mix will be equal to an extra 470 m€ per annum and represent less than 1% of the annual cost of the electricity system.
Under the Reference Scenario, the annual cost of the electricity system calculated by ADEME (based on economical cost, and not levelized costs) amounts to €50.1 billion, of which 65% is accounted for by the renewable energy costs, 8% for storage costs, 23% represents the MV transmission and distribution network costs, and 4% the HV transmission network cost.
Based on a cost approach, the electricity system price varies from 103 €/MWh to 138€/MWh by 2050, with a base case as below:
The price range above is to be compared to a current supply cost of 99 €/MWh (before tax) available to industrial users in France in 2012 (Commission de Régulation de l’Energie, 2012 report). A key learning of the French study is that a 100% renewable electricity system will not come at a significant cost increase for the consumers, contrary to many messages of doom and gloom.
Other scenarii have been developed for the purpose of modelling different constraints over the development of the 100% renewable mix including reduced public acceptance, constraint on grid development or upgrade, technology barriers, capital constraints etc…
Source : A 100% electricity mix ? ADEME, December 2015
Source : ADEME Source: ADEME
The domestic interconnection capacities will need to be increased by 36% compared to today’s level.
A key learning of the study is that a 100% renewable electricity system will not come at a significant cost increase for the consumers.

14 Newsletter - Power and Utilities in Europe
Another key learning of the French study is that a 100% renewable energy system will not destroy market mechanisms and take us back to the regulated pre-liberalisation era. In other words, a 100% renewable energy system will still be driven by a wholesale electricity market (e.g. EPEX Spot) where the electricity clearing price is determined by and equal to the short-term marginal cost of the marginal MWh supplied to the market. The marginal cost of REN might be close to zero most of the time. But the spot price of electricity will still be set by the marginal generating unit which will be, as the case may be, either a biomass-fired cogeneration unit (16 €/MWh), or a biogas unit (64 €/MWh), or imported coal-fired electricity at 106 €/MWh or Gas-to-Power units whose marginal cost
of generation ranges from 159 to 239 €/MWh. Under the Reference Scenario, these figures are being reached, and become the spot price of electricity, 200 to over 1200 times per year. A 100% renewable energy system would therefore require next to no market re-design and would be totally compatible with spot market rules, with the marginal electricity cost sending the right signal to investors.
What the study however does not say is what the trajectory should be to move from a 50% nuclear-based system to a 100% renewable electricity mix.
The full report from ADEME is available on the following link (in French).
Under a recent study, the French energy think-tank and advisor to the French public authorities, ADEME, compiles the various operating and costs assumptions for most electricity generation systems as published by the outstanding energy institutes or research centers across the world (IEA, US EIA-NREL, Black&Veatch, Sachverständigenrat für Umweltfragen-“SRU”, the Fraunhofer Institute, ADEME…) including costs projections. The study then works out a cost trajectory for all electricity generation technologies up to 2050. The study further calculates LCOEs for most technologies, taking into account operation and efficiency improvement to 2050.
The major assumptions of the study include a 5.25% real discount rate (consistent with the French Regulator’s agreed rate applied to regulatory assets). The TSO grid connection costs are estimated to be a flat 100 €/kW for all onshore facilities, 200 €/kW for all marine sources of energy and offshore facilities other than floating offshore, the latter being assessed to be 250 €/kW.
The study assumes a commodity price environment (in €2012 value) as follows:
(i) The international gas price is assumed to move from 30 €/MWh in 2012 to 41 €/MWh in 2050 (HHV) equivalent to 15.8 $2012/Mbtu in 2050.
(ii) Coal price is almost flat over the whole period and only varies from 10 €/MWh to 12 €/MWh in 2050 (HHV).
(iii) CO2 is anticipated to be consistent with the European Commission assumptions of 35 €/t as soon as 2030 and 100 €/tonne in 2050.
(iv) The wood pellet or biomass price is assessed to be 22 €/MWh, inlet combustion plant, equivalent to the heat output value in district heating systems
The LCOE calculations for all electricity generation sources is as below:
The various energy research institutes and laboratories, including the French ADEME, have got very different views on the electricity cost profile per technology for the period to 2050.
As far as the cost of onshore wind electricity is concerned, the US National Renewable Energy Laboratory (NREL), part of the US Department of Energy, does not see any cost decline going forward, assuming a (real cost) flat figure of 78 €/MWh from now to 2050. Nor does the Fraunhofer Institute from Germany, with a broader flat range from 50 to over 100 €/MWh for the period. The German SRU however sees the cost of onshore wind electricity drop sharply, from 90 to 45 €/MWh and below from 2010 to 2050.
The cost of generating one MWh with a ground-mounted, utility-scale PV installation is not anticipated to drop significantly either over the 2010 – 2050 period according to the US NREL, from the equivalent of 140 €/MWh down to 100 €/MWh,
3 - Towards a consensus on technological costs of generating electricity by 2050 (July 2015)
LCOE 2050 (in 2012€/MWh)
Biogas+cogeneration 51
Geothermal 57
Ground-mounted PV 60
Onshore wind 65
Offshore wind (fixed) 80
Biomass-fired cogeneration 80
Roof-top PV 85
Offshore wind (floating) 107
Marine sources 110
CCGT 121
OCGT 177
CSP 298
The various energy research institutes and laboratories, including the French ADEME, have got very different views on the electricity cost profile per technology for the period to 2050.
As far as the cost of onshore wind electricity is concerned, the US National Renewable Energy Laboratory (NREL), part of the US Department of Energy, does not see any cost decline going forward, assuming a (real cost) flat figure of 78 €/MWh from now to 2050. Nor does the Fraunhofer Institute from Germany, with a broader flat range from 50 to over 100 €/MWh for the period. The German SRU however sees the cost of onshore wind electricity drop sharply, from 90 to 45 €/MWh and below from 2010 to 2050.
The cost of generating one MWh with a ground-mounted, utility-scale PV installation is not anticipated to drop significantly either over the 2010 – 2050 period according to the US NREL, from the equivalent of 140 €/MWh down to 100 €/MWh, whereas the German SRU on the contrary heralds a dramatic fall from some 440 €/MWh in 2010 down to 180 €/MWh in 2030 and 80 €/MWh in 2050. Over the same period, the Fraunhofer Institute sees the PV cost of generation moving in a declining band reaching the 55-95 €/MWh range as early as 2030, by which time solar energy will be competitive against gas-fired CCGT (which will stand at around 100 €/MWh). French ADEME views that the utility-scale PV cost will come down from around 160 €/MWh in 2010 to around 60 €/MWh as soon as 2025.
Finally, roof-top PV electricity cost drops from 340 €/MWh to 160 €/MWh according to the US NREL and Black & Veatch, from 440 €/MWh down to 75 €/MWh from the German SRU over the period 2010- 2050, and from 340 €/MWh down to 130 €/MWh as soon as 2025 for the French ADEME.
Recent developments have already demonstrated that the anticipated cost decline is well on its way and could take a lot less than announced.
The Cestas PV plant, recently commissioned in France - the largest in Europe with 300 MW peak capacity, representing about a million solar modules - is expected to
What the study however does not say is what the trajectory should be to move from a 50% nuclear-based system to a 100% renewable electricity mix.
The German SRU however sees the cost of onshore wind electricity drop sharply, from 90 to 45 €/MWh and below from 2010 to 2050.

15 Newsletter - Power and Utilities in Europe
whereas the German SRU on the contrary heralds a dramatic fall from some 440 €/MWh in 2010 down to 180 €/MWh in 2030 and 80 €/MWh in 2050. Over the same period, the Fraunhofer Institute sees the PV cost of generation moving in a declining band reaching the 55-95 €/MWh range as early as 2030, by which time solar energy will be competitive against gas-fired CCGT (which will stand at around 100 €/MWh). French ADEME views that the utility-scale PV cost will come down from around 160 €/MWh in 2010 to around 60 €/MWh as soon as 2025.
Finally, roof-top PV electricity cost drops from 340 €/MWh to 160 €/MWh according to the US NREL and Black & Veatch, from 440 €/MWh down to 75 €/MWh from the German SRU over the period 2010- 2050, and from 340 €/MWh down to 130 €/MWh as soon as 2025 for the French ADEME.
Recent developments have already demonstrated that the anticipated cost decline is well on its way and could take a lot less than announced.
The Cestas PV plant, recently commissioned in France - the largest in Europe with 300 MW peak capacity, representing about a million solar modules - is expected to produce about 350GWh pa under a 20-year PPA at €105/MWh contracted price. The same project initially studied in 2010 was estimated to require a €300/MWh price to operate on a profitable basis. The Cestas PV project deserves to be called a success, being the first energy project in a long time to come on line on time and at a final cost of one-third of the initial CAPEX. The competitiveness of solar power is on the rise, as bids were as low as €70MWh in the latest tender organised by the French government.
Under most assumptions, the European gas demand is expected to increase at best by around 20% to 2030 (from 520 to 620 bcm/y) in case of nuclear or coal-fired generation reduction, or alternatively stay flat if gas continues being displaced by renewables and coal. Against this unpromising background, a number of studies, including recent Oxford Institute for Energy Studies publications, have cast a new light on European gas pricing mechanisms.
The key message of these studies is that the European gas market and trading have been integrating rapidly since 2007, reaching an approximate overall 21,000 TWh trade transactions annually at the end of 2014, equivalent to over 500% of the EU gas consumption. Amongst the leading gas exchange places in the EU, the UK NBP and Dutch TTF account for most of the trade, equivalent to gas trading in France, Germany, Italy, Belgium, and Austria together. The Day-ahead contract is by far the most frequently traded product.
Furthermore, European hub prices today are broadly aligned: prices move in parallel with spreads from one hub to another reflecting the transportation costs. This is another evidence of a closer integrated European market where prices are the pure reflection of the supply and demand balance at a particular time, subject to physical congestion of the interconnecting infrastructure, as is most often the case for the UK Interconnector or the North-South link between the two French PEGs. But market observers point out that, over the past few years, more than 60% of the time, gas was priced on the basis of gas-to-gas competition across Europe and almost 90% in NorthWest Europe (i.e. Belgium, Denmark, France, Germany, Ireland, Netherlands, UK).
How does this new context affect the strategy game of the major gas suppliers to Europe, i.e. Russia and Norway who account for 33% and 23% respectively, together over 55%, of the gas supply to Europe in 2014. The OIES expert papers we refer to hereunder (*) establish that over 60% of all Long Term Russian gas import and Norwegian gas import contracts have now been renegotiated and are priced based on the EU hubs mentioned above, therefore on supply-demand mechanisms. The studies further demonstrate that, since 2010, Gazprom (Russia) and Statoil (Norway) are managing their EU contracts with a twofold view to (i) avoiding a price war and (ii) keeping spot prices at a level acceptable to them, even if these move away from the old oil price link.
According to the Oxford Institute for Energy Studies, Russia and Norway are keeping gas prices in Europe between a floor estimated at $6/MMBtu and a ceiling that is either the cost of new gas (estimated at $9.5/MMBtu for pipeline gas from the Caspian Sea) or Henry Hub + $6/MMBtu for upcoming US LNG.
This new gas pricing game in Europe gives Gazprom a clear advantage (over Norway) as Gazprom has got huge spare capacity which it can mobilise at next to no notice when the EU domestic gas production continues its decline. Furthermore, with the oil price sliding further, Gazprom’s old oil-indexed contracts – still effective today - are becoming more competitive, and more attractive to EU buyers, than the EU hub prices below 60 US$/bbl.
The major paradigm shift for EU gas pricing is now coming from the “excess” LNG supplies: “Europe is, and will continue to be, the ‘dumping’ ground for excess LNG” according to the OIES authors.
4 – The new gas market and pricing game in Europe
Recent developments have already demonstrated that the anticipated cost decline is well on its way and could take a lot less than announced.
The major paradigm shift for EU gas pricing is now coming from the “excess” LNG supplies.

16 Newsletter - Power and Utilities in Europe
With around 145 bcm/year of new LNG supply expected to reach the global market from now to 2020 (the bulk of which being uncontracted US LNG), and the old Asian gas market tightness now being history (Asian prices today give little incentive to European LNG buyers to re-export), one can expect that a significant quantity of the above new LNG will end up – Gazprom permitting! - on the EU market. For the outlook period 2016 – 2020, the alternative for these new US LNG producers will be either to dump the EU gas market at a cut-price which will have to sink down to Gazprom marginal supply cost to the EU, or to shut down their newly commissioned LNG trains. Gazprom can still rest assured that it will continue to be the swing supplier of gas to the EU. And EU gas market watchers, and consumers, can expect to see a price war on the EU hubs every time there is a new “wave of LNG” coming up.
Extracted from The evolution of European traded gas hubs, December 2015, OIES.
The Impact of Lower Gas and Oil Prices on Global Gas and LNG Markets, July 2015; the Oxford Energy Forum, August 2015; The evolution of European traded gas hubs, December 2015.
Gazprom’s old oil-indexed contracts – still effective today - are becoming more competitive, and more attractive to EU buyers, than the EU hub prices below 60 US$/bbl.
The major paradigm shift for EU gas pricing is now coming from the “excess” LNG supplies: “Europe is, and will continue to be, the ‘dumping’ ground for excess LNG” according to the OIES authors.
With around 145 bcm/year of new LNG supply expected to reach the global market from now to 2020 (the bulk of which being uncontracted US LNG), and the old Asian gas market tightness now being history (Asian prices today give little incentive to European LNG buyers to re-export), one can expect that a significant quantity of the above new LNG will end up – Gazprom permitting! - on the EU market. For the outlook period 2016 – 2020, the alternative for these new US LNG producers will be either to dump the EU gas market at a cut-price which will have to sink down to Gazprom marginal supply cost to the EU, or to shut down their newly commissioned LNG trains. Gazprom can still rest assured that it will continue to be the swing supplier of gas to the EU. And EU gas market watchers, and consumers, can expect to see a price war on the EU hubs every time there is a new “wave of LNG” coming up.
Extracted from The evolution of European traded gas hubs, December 2015, OIES.
The Impact of Lower Gas and Oil Prices on Global Gas and LNG Markets, July 2015; the Oxford Energy Forum, August 2015; The evolution of European traded gas hubs, December 2015.
And EU gas market watchers, and consumers, can expect to see a price war on the EU hubs every time there is a new “wave of LNG” coming up.

17 Newsletter - Power and Utilities in Europe
Policy and Regulation RadarThis section summarizes the key changes respectively in the EU or in the country regulation that may significantly affect the power and utilities companies.
What is changing in the EU regulation?
The first State of the Energy Union Report
Key features Insights
On 18th November, the European Commission published the first State of the Energy Union Report which evaluates the progress made towards building the Energy Union since the adoption of the Framework Strategy. The Report sets out achievements to date and legislative proposals for 2016.
EU is meeting its targets on greenhouse gas emissions, renewables and energy efficiency, as well as making significant progresses on the single market and security of supply.
The Report published is accompanied by 28 factsheets providing an assessment of delivering the Energy Union for each Member State.
The main conclusions are as follows:
• Decarbonisation: EU is on track to meet the 2020 target for reducing greenhouse emissions by 20%. However, further measures are needed to meet the 2030 emissions reduction target of at least 40%. In line with this, the Commission proposed a revision of the EU Emissions Trading System (ETS) for 2016. Furthermore, a new Renewable Energy Directive and a bioenergy sustainability policy for 2030 will be presented in 2016. These measures should provide the right framework to achieve the binding EU level target of at least 27% renewable energy by 2030.
• Energy efficiency: The Commission remains optimistic that the 20% target will be achieved. In 2016, the Commission foresees legislative proposals to align the Energy Efficiency Directive to the 2030 indicative EU level target. Also, a dedicated strategy for heating and cooling is planned for early 2016.
• Internal energy market: With regard to the 10% electricity interconnection capacity target for 2020, 22 Member States are on track to reach the target. The second list of Projects of Common Interest (PCIs) sets out those projects that are urgently needed to achieve the targets. (See following section about new PCIs)
• Energy security: The Commission will propose a revision of the Gas Security of Supply Regulation early next year. A comprehensive strategy on liquefied natural gas (LNG) and gas storage will be developed in order to improve diversification. In addition, a review of the Intergovernmental Agreements (IGA) Decision is needed to improve the transparency on energy supply.
• Research, Innovation and Competitiveness: An integrated Energy Union Research, Innovation and Competitiveness strategy for energy and climate will be adopted in 2016.
• Governance of the Energy Union: The Energy Union needs a reliable and transparent governance process. On November 26th, the Energy Council adopted relevant conclusions about the governance system. (See following section about governance of the Energy Union)
Next steps
The Commission has committed to report annually on the State of the Energy Union in order to address the key issues and steer the policy debate.
Link: State of the Energy Union Report

18 Newsletter - Power and Utilities in Europe
Projects of Common Interest (PCIs)
European Energy Council: Energy Union governance
Key features Insights
On 18th November, the European Commission adopted a list of 195 key energy infrastructure projects known as Projects of Common Interest (PCIs).
These projects will enable the gradual build-up of the Energy Union by integrating the energy markets in Europe and by diversifying the energy sources and transport routes.
The PCIs will benefit from:• strengthened transparency and improved public
consultation;• accelerated permitting procedures;• improved and faster environmental assessment;• a single national competent authority will act as
a one-stop-shop for permit granting procedures;• improved regulatory treatment and regulatory
incentives;• possibility of receiving financial assistance under
Connecting Europe Facility (CEF).
For a project to be included in the list, it had to: • demonstrate significant benefits for at least two Member States; • contribute to market integration • increase competition on energy markets by offering alternatives to consumers; • enhance security of supply;• reduce CO2 emissions.
The list includes 108 electricity, 77 gas, 7 oil and 3 smart grids projects.
This list of projects is an update of the PCI list adopted in October 2013 (which included 248 projects). The number of PCIs has been reduced mainly in the gas sector to avoid creating capacity which exceeds the security of supply needs. Since the adoption of the first PCI list in 2013, 13 projects have been completed or will be commissioned before the end of 2015. Furthermore, some 62 projects are expected to be completed by the end of 2017.
Next steps
The list of PCIs will be updated every two years with the aim to integrate newly needed projects and remove obsolete ones.
Link: List of Projects of Common Interest
Key features Insights
On November 26th, the Energy Council adopted relevant conclusions about the governance system of the Energy Union. Bearing in mind the targets of the 2030 Climate and Energy Policy Framework, this governance system will monitor the EU's collective progress to complete the European Energy Union across its five dimensions.
The governance system will be reliable and transparent. It will be developed to ensure that the EU meets its energy policy goals, with the necessary flexibility for Member States and fully respecting their freedom to determine their energy mix.
In addition, the Energy Council discussed about some points included in the Commission´s Energy Summer Package (see last Newsletter):• The Council reached a general approach on the
proposal for a regulation setting a framework for energy efficiency labelling.
• The Council held an orientation debate, on a new energy market design and on a new deal for energy consumers.
The essential components of the governance system are:• A National Energy and Climate Plan (National Plan) to be adopted by each member
state. The first National Plan will cover the period from 2021 to 2030.• Progress reports on the implementation of the National Plan will be submitted by
Member States to the Commission every two years.• Constructive dialogues between the Commission and the Member States.• Monitoring and evaluation based on key indicators. The Commission will summarise
and assess the progress made at EU level.The Commission will prepare in cooperation with the Member States:• The basis for the following essential components:
- an inventory of existing planning and reporting obligations;- templates for the National Plans and biennial Progress Reports;- a guidance on regional cooperation;- a list and a methodology for the common key indicators.
• A general outlook including the dialogues between Member States and the Commission.
Next steps
The Commission has made a statement to be included in the Council minutes, since it wished that member states presented their first National Plans in 2017.
Legislative proposals on new energy market design and on a new deal for energy consumers are expected for the second half of 2016.
Link: Council conclusions on the governance system of the Energy Union

19 Newsletter - Power and Utilities in Europe
Key consultations from EU
What is discussed? Insights Link
“Preparation of a new Renewable Energy Directive for the period after 2020”
EU seeks to consult stakeholders and citizens on the new renewable energy directive (REDII) for the period 2020-2030, foreseen before the end of 2016. Closing date: February 10th.
Link to the consultation
“Consultation on the Review of Directive 2012/27/EU on Energy Efficiency”
EU seeks to consult stakeholders and citizens on the Review of Directive 2012/27/EU on energy efficiency (EED), foreseen for the second half of 2016. Closing date: January 29th.
Link to the consultation
“Revision of the information and procedural requirements under Articles 41 to 44 of the Euratom Treaty”
EU seeks to consult stakeholders and other interested parties on the need for a revision of the existing information and procedural requirements under Articles 41 to 44 of the Euratom Treaty. The Commission is seeking views on how the legal framework in this area could be clarified, streamlined or updated. Closing date: January 25th.
Link to the consultation
UN Climate Change Conference in Paris (COP 21): Global Agreement
Key features Insights
On December 12th, the COP21 UN Climate Change Conference, which took place in Paris, reached a global agreement to tackle climate change. 195 countries adopted a new universal, legally binding global climate deal. This agreement sets out a global action plan to put the world on track to avoid dangerous climate change by limiting global warming to well below 2°C.
Among the key measures in the Paris Agreement, global leaders have agreed to:• keep the increase in global average temperature to well below 2°C above
pre-industrial levels and to pursue efforts to limit it to 1.5°C.• call for global emissions to peak as soon as possible, recognising that this will take
longer for developing countries.• come together every 5 years to set more ambitious targets. A robust transparency
and accountability system will track progress towards the long-term goal.• to support climate action to reduce emissions and build resilience to climate change
impacts in developing countries. Developed countries intend to continue their existing collective goal to mobilise USD 100 billion per year until 2025 when a new collective goal will be set.
• to cooperate and enhance the understanding, action and support in different areas such as early warning systems, emergency preparedness and risk insurance.
Next steps
The Paris Agreement will enter into force in 2020. It opens the way but much effort remains to be done to achieve the goals.
Link: Climate Change Conference in Paris (COP 21): Global Agreement

20 Newsletter - Power and Utilities in Europe
Spain
Topic Key features Insights Next Steps
Royal Decree about electricity generation for self-consumption
• On October, a new framework about electricity generation for self-consumption has been passed.
• Self-consumers that produce and consume their own energy without being connected to the network don´t have to pay the costs of the electrical system. However self-consumers connected to the network have to pay these costs.
• For self-consumers connected to the network the new regulation recognizes two types. In both types, the sum of the installed power of the generation facilities has to be equal to or less than the contracted power:
- Type 1: With a contracted power less than 100 kW. The generation facilities don´t have to be registered as production facilities. Self-consumer can put into the network the excess energy but without receiving financial compensation for it.
- Type 2: Without contracted power limits. The generation facilities have to be registered as production facilities in the administrative register. Self-consumer will receive a financial compensation for the energy put into the network.
• Self-consumers connected to the network have to pay the following costs:- Access tolls to transmission and distribution
networks.- Costs of the electrical system. These costs
cover mainly:o remunerations for renewable energy
generation;o high-efficiency cogeneration and waste;o cost of production in non-peninsular
territories;o deficit of the electricity system.
- Costs for other system services: Costs generated by ensuring the balance between generation and demand.
• The latter two costs have not been passed yet. Temporarily, they will be replaced by:- Fixed costs: These costs are calculated
based on the generated power.- Variable costs: These costs are calculated
based on the self-consumed energy.• Exemptions to the variable costs:
- Self-consumers classified as type 1 with a contracted power equal to or less than 10 kW.
- Self-consumers located in Canarias, Ceuta, Melilla, Ibiza and Formentera. (Reduced costs for Mallorca and Menorca).
- Cogeneration until 31st December 2019.
The consumers, facilities and other agents affected by the new regulation have six months to adapt to these standards.
Remuneration for new biomass and wind facilities based on an auction
• On October, a new regulation about the remuneration for new biomass and wind facilities has been passed.
• Through this regulation, Spanish government has called an auction up to 500Mw of wind power and 200Mw of biomass power.
• The concept auctioned is a percentage of reduction on the initial value of the investment fixed by the Spanish government (3,335,000 €/Mw for biomass facilities and 1,200,000 €/Mw for wind facilities), that will be applied for the calculation of the remuneration. Each participant offers a reduction of this value according to their calculations of efficiency and profitability that they expect of each project.
• The percentage of reduction applicable to each bid will be the percentage of reduction last awarded offer.
• In addition, new regulation includes the rest of specific retributive parameters for each type of installation:- Parameters that won’t be reviewed again:
regulatory useful life (20 years for wind facilities and 25 for biomass facilities) and initial value of the investment.
- Parameters that will be reviewed next years: equivalent operation hours, energy price, operating cost, remuneration to the investment, remuneration to the operation, etc.
The auction will be on 14th January 2016
Development Plan of the Transmission Network 2015-2020
• On October, a new development plan of the transmission network for the next six years has been passed.
• The main factors considered in the plan are:
- Compliance with the requirements of safety and reliability of the grid and the security of supply.
- Minimize the environmental impact.
- Increase in interconnections.
- Integration of renewable energies.
- Attention to the needs of demand.
• The Plan makes a forecast of future energy needs and the actions that need to be performed.
• Projects included for 2015-2020 correspond to 1,517 km of new circuits at 400 kV and 1,747 km of 220 kV.
• In addition, the plan includes the upgrading of 2,676 km of 400 kV circuit and 3,512 km of 220 kV.
• The estimated cost is 4,554 million euros.
• Besides, the plan includes facilities deemed necessary after 2020. These facilities are included in order to begin its administrative procedures in advance.
The plan will be applied in the next six years
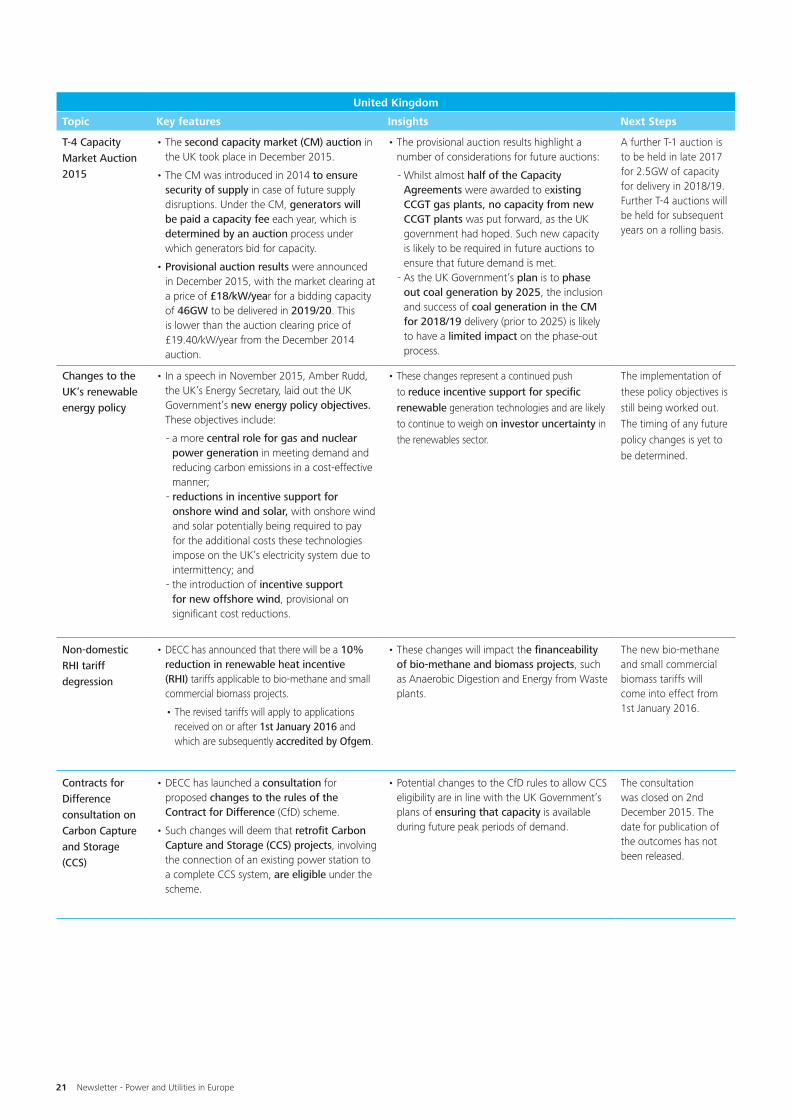
21 Newsletter - Power and Utilities in Europe
United Kingdom
Topic Key features Insights Next Steps
T-4 Capacity Market Auction 2015
• The second capacity market (CM) auction in the UK took place in December 2015.
• The CM was introduced in 2014 to ensure security of supply in case of future supply disruptions. Under the CM, generators will be paid a capacity fee each year, which is determined by an auction process under which generators bid for capacity.
• Provisional auction results were announced in December 2015, with the market clearing at a price of £18/kW/year for a bidding capacity of 46GW to be delivered in 2019/20. This is lower than the auction clearing price of £19.40/kW/year from the December 2014 auction.
• The provisional auction results highlight a number of considerations for future auctions:
- Whilst almost half of the Capacity Agreements were awarded to existing CCGT gas plants, no capacity from new CCGT plants was put forward, as the UK government had hoped. Such new capacity is likely to be required in future auctions to ensure that future demand is met.
- As the UK Government’s plan is to phase out coal generation by 2025, the inclusion and success of coal generation in the CM for 2018/19 delivery (prior to 2025) is likely to have a limited impact on the phase-out process.
A further T-1 auction is to be held in late 2017 for 2.5GW of capacity for delivery in 2018/19. Further T-4 auctions will be held for subsequent years on a rolling basis.
Changes to the UK’s renewable energy policy
• In a speech in November 2015, Amber Rudd, the UK’s Energy Secretary, laid out the UK Government’s new energy policy objectives. These objectives include:
- a more central role for gas and nuclear power generation in meeting demand and reducing carbon emissions in a cost-effective manner;
- reductions in incentive support for onshore wind and solar, with onshore wind and solar potentially being required to pay for the additional costs these technologies impose on the UK’s electricity system due to intermittency; and
- the introduction of incentive support for new offshore wind, provisional on significant cost reductions.
• These changes represent a continued push to reduce incentive support for specific renewable generation technologies and are likely to continue to weigh on investor uncertainty in the renewables sector.
The implementation of these policy objectives is still being worked out. The timing of any future policy changes is yet to be determined.
Non-domestic RHI tariff degression
• DECC has announced that there will be a 10% reduction in renewable heat incentive (RHI) tariffs applicable to bio-methane and small commercial biomass projects.
• The revised tariffs will apply to applications received on or after 1st January 2016 and which are subsequently accredited by Ofgem.
• These changes will impact the financeability of bio-methane and biomass projects, such as Anaerobic Digestion and Energy from Waste plants.
The new bio-methane and small commercial biomass tariffs will come into effect from 1st January 2016.
Contracts for Difference consultation on Carbon Capture and Storage (CCS)
• DECC has launched a consultation for proposed changes to the rules of the Contract for Difference (CfD) scheme.
• Such changes will deem that retrofit Carbon Capture and Storage (CCS) projects, involving the connection of an existing power station to a complete CCS system, are eligible under the scheme.
• Potential changes to the CfD rules to allow CCS eligibility are in line with the UK Government’s plans of ensuring that capacity is available during future peak periods of demand.
The consultation was closed on 2nd December 2015. The date for publication of the outcomes has not been released.

22 Newsletter - Power and Utilities in Europe
Germany
Topic Key features Insights Next Steps
Amendment of the CHP-Promo-tion Act
• The German Bundestag approved a law that will increase combined heat and power (CHP) financing, but will abolish subsidies for new coal-fired CHP plants to help Germany reach its 2020 climate targets.
• The law defines the CHP-Plants eligible for promotion of the electricity produced on a kWh-bonus-basis concerning new or modernized CHP-plants.
• In principle, the promotion is limited from now on to small CHP-Plants (also for self-consumed electricity) and other CHP-Plants for the electricity fed in the public grid (provided for certain exemptions).
• Investments in eligible CHP-Plants benefit of higher promotion than before (e.g. 8 Cent/kWh for power fed in the public grid compared with 5,41 Cent/kWh before <= 50 kW)
The law will enter in force on 1st January 2016.
European Commission’s approval is still pending

23 Newsletter - Power and Utilities in Europe
Snapshot on surveys and publications – September 2015Deloitte
Energy markets and the implications of renewables – November 2015
South Australia finds itself at the cutting edge of contemporary electricity grids. It’s renewable resources are in the form of wind and the sun; resources described as 'intermittent' – they are only available when the wind is blowing or the sun is shining.Link to the survey
Electricity storage: Technologies, impacts, and prospects – October 2015
The rising role of renewable generation, both grid-scale and distributed; tightening emission limits on fossil-fuel based generation; the acceleration of smart grid deployment; and the emergence of multiple options for electricity consumers to better manage overall consumption and the shape of their load, together point to a very different landscape than in the past.Link to the survey
Grid parity: Three converging forces provide a tailwind for US renewable power - 2015In the US, the debate about when renewable energy will be able to compete on equal footing with conventional sources of generation, generally assumes the continuation of at least some subsidies. This analysis takes a different tack, purposefully excluding subsidies from the assessment of grid parity in order to provide a different perspective on the competitiveness of the renewable energy sector.Link to the survey
Agencies or research institutes
International Energy Agency
Key World Energy Statistics – November 2015
The IEA produced a compilation of its most used statistics in a booklet containing timely, clearly presented data on the supply, transformation and consumption of all major energy sources for the main regions of the world. It covers key statistics on more than 130 countries and regions including energy indicators, energy balances, prices, CO2 emissions as well as energy forecasts. Link to the survey
European Commission
Assessing the Employment and Social Impact of Energy Efficiency – December 2015
This study assesses the direct and indirect linkages between energy efficiency, labor markets and social welfare, at both the micro and the macro levels, using a mixture of qualitative and quantitative approaches to carry out the analysis.Link to the survey
Study on cost benefit analysis of smart metering systems in EU Member States – November 2015
This report reflects the final deliverable in the assessment of the cost benefit analysis (CBA) of a widespread roll out of smart metering systems in Member States (MS). It considers the context to the project, and findings related to the projects key tasks.Link to the survey
Savings and benefits of global regulations for energy efficient products – October 2015
This study identified widespread and increasing global adoption of minimum energy performance standards (MEPS) and energy labels for products. The key motivations for this study were to further quantify the huge potential savings (and avoided costs and wider impacts) from global harmonization, and to refine understanding of the overall benefits (and costs) of greater global harmonization.Link to the survey
Study supporting the impact assessment concerning rules on harmonised transmission tariff structures for Gas and allocation of new gas transmission capacity – October 2015
Europe is facing increasing competition from rapidly growing economies around the globe. Competitive energy prices for European companies will be crucial in keeping advantages reached so far. Achieving a full functioning and competitive European gas market could achieve welfare gains.Link to the survey
Eurelectric
Power statistics and trends: the five dimensions of the energy union – December 2015
This report is based on the latest available data (2014) covering 33 countries. The report examines the policy context, the evolution of fundamentals such as production, capacity and demand, and provides a brief outlook of markets developments, prices, innovation and environmental performances.Link to the survey

24 Newsletter - Power and Utilities in Europe
Harmonisation of electricity generation transmission tariffs – December 2015
EURELECTRIC closely follows the ongoing work on tariff harmonisation as transmission tariffs influence investment and dispatch decisions and eventually also cross-border competition. ACER’s ongoing work in this field is important for the continuation of electricity markets’s integration and for ensuring a level playing field. Link to the survey
Achieving the Energy Union – A collective effort by all EU Member States – October 2015
This paper highlights through specific examples the added value of regional and EU wide cooperation regarding market integration, renewables and security of supply and provides recommendations for the Member States and the EU to achieve the Energy Union.Link to the survey
Oxford institute for Energy
The evolution of European traded gas hubs – December 2015
This paper dedicated to the development of European traded gas hubs based on extensive field research. In addition to comparing national aspirations with EC goals and deadlines it points out not just the infrastructure projects required to create the connectivity for traded market development, but equally importantly the political will, cultural acceptance of traded markets and the commercial appetite.Link to the survey
Incidence and Impact: A Disaggregated Poverty Analysis of Fossil Fuel Subsidy Reform – December 2015
This study uses household expenditure data from Nigeria to understand energy consumption patterns with respect to income levels, different energy goods, urban and rural livelihoods, and geographical distribution. This paper simulates 50% and 100% reductions of subsidies on petrol, electricity and kerosene. It presents the estimated effects of such reforms on consumption, poverty, and government revenue.Link to the survey
A holistic framework for the study of interdependence between electricity and gas sectors - November 2015
This paper seeks to align the study of gas and power industries by providing a holistic framework for the thorough identification and discussion of power and gas sector structure, infrastructure, market, and regulatory rivers. It acts as a lens through which the combined gas and power supply chains of any given country can be observed and understood.Link to the survey
The Dynamics of the Revenue Maximization–Market Share Trade-Off : Saudi Arabia’s Oil Policy in the 2014–2015 Price Fall – October 2015
A key objective of this paper is to analyze the behavior of Saudi Arabia during the 2014-15 price fall in the light of the rise of US shale supply, the cohesion within PEC, and the structural features of Saudi Arabia’s domestic economy and energy sector.Link to the survey

Deloitte refers to one or more of Deloitte Touche Tohmatsu Limited, a UK private company limited by guarantee, and its network of member firms, each of which is a legally separate and independent entity. Please see www.deloitte.com/about for a detailed description of the legal structure of Deloitte Touche Tohmatsu Limited and its member firms. In France, Deloitte SAS is a firm member of Deloitte Touche Tohmatsu Limited and the professional services are performed by its subsidiaries and affiliates.
Deloitte185, avenue Charles-de-Gaulle92524 Neuilly-sur-Seine CedexTél. : 33 (0)1 40 88 28 00 - Fax : 33 (0)1 40 88 28 28
© 2016 Deloitte & Associés - All rights reserved - Member of Deloitte Touche Tohmatsu LimitedStudio Graphique Neuilly
Newsletter contacts
Global Power Leadership contacts
Véronique Laurent
Partner France - E&R [email protected]
Nuria Fernandez
Senior [email protected]
Thomas Gounel
Jean-Michel Gauthier
DirectorE&R France - Chief Economist Officer [email protected]
Emmanuel Rollin
Global Power Leadership Name Contact Details
Global Power Leader Felipe Requejo [email protected]
European Power Leader Veronique Laurent [email protected]
Global Renewable Energy Leader Jane Allen [email protected]
Global E&R Function Leadership Name Contact Details
Global E&R Consulting Leader Anton Botes [email protected]
Global E&R Tax Leader Brad Seltzer [email protected]
Global E&R Financial Advisory Services Leader Rajeev Chopra [email protected]
Global E&R Enterprise Risk Services Leader Paul Zonneveld [email protected]
Global E&R Audit & Accounting Leader Doug King [email protected]