Newsletter - Idaho National Laboratory · PDF fileCase studies are being undertaken to support...
20
Light Water Reactor Sustainability Newsletter Issue 22 • October 2016 Kathryn A. McCarthy Director, LWRS Program Technical Integration Office W elcome to the 22 nd issue of the Light Water Reactor Sustainability (LWRS) Program newsletter, which features the following articles highlighting recent program accomplishments: Validating Smoothed Particle Hydrodynamics Codes for Flooding Applications: This article describes an approach for evaluating the potential impact of flooding on the existing fleet of nuclear power plants and providing insights for decision makers through a series of plant dynamics simulations. While simulation is increasingly being accepted as a way of verifying systems against given design parameters and operations, simulations must be shown to deliver validated and practical results. This article describes testing against real-world data and other simulation methods. The scenario described in the article demonstrates the power of smoothed-particle hydrodynamics (SPH) in dealing with free-surface slamming phenomena. In the scenario, the force exerted by fluid particles onto a post from a dam failure is measured and compared with results from experimental data. This research is important because having enhanced models can help identify conservatisms in plant designs, which could permit the operators of those plants to place more components into a lower risk category, and clarify safety margins for those components that are close to the low-risk threshold. Advanced Three-Dimensional Spatial Modeling and Analysis to Accurately Represent Nuclear Facility External Event Scenarios: This article describes integration of external and internal event probabilistic risk assessments (PRAs)to support application of seismic PRAs (SPRAs) in a manner that better accounts for the dynamic nature of seismic events. Case studies are being undertaken to support development activities. Two of these case studies are summarized in the article. Enhanced methods and tools will provide a phenomenologically and probabilistically consistent approach on a common computational platform for systematically addressing the myriad of unique conditions that could result from a major seismic event at a nuclear power plant. Safety Insights from U.S. Forensics Evaluations at Daiichi: This article describes how lessons learned from Fukushima Daiichi are being evaluated to identify opportunities for enhancing the safety of existing and future nuclear power plant designs. The article highlights two examples that illustrate how significant safety insights are being obtained from these evaluations. In addition to reducing uncertainties related to severe accident modeling progression, safety insights gained from the U.S. forensics effort are actively being used by industry to update and improve pressurized water reactor (PWR) and boiling water reactor (BWR) guidance for severe accident prevention, mitigation, and emergency planning. Introduction Table of Contents • Introduction . . . . . . . . . . . . . . . . . . . . . . . . . . . . . . . . . . . . . . . . . . . . . . . . . . . . . . . . . . . . . . . . . . 1 • Validating Smoothed Particle Hydrodynamics Codes for Flooding Applications . . . . . . . . . . . . . . . . . . . . . . . 2 • Advanced Three-Dimensional Spatial Modeling and Analysis to Accurately Represent Nuclear Facility External Event Scenarios . . . . . . . . . . . . . . . . . . . . . . . . . . . . . . . . . 6 • Safety Insights from U.S. Forensics Evaluations at Daiichi . . . . . . . . . . . . . . . . . . . . . . . . . . . . . . . . . . . . . 10 • Recent LWRS Program Reports . . . . . . . . . . . . . . . . . . . . . . . . . . . . . . . . . . . . . . . . . . . . . . . . . . . . . . 19
Transcript of Newsletter - Idaho National Laboratory · PDF fileCase studies are being undertaken to support...
Light Water Reactor Sustainability
NewsletterIssue 22 • October 2016
Kathryn A. McCarthy Director, LWRS Program Technical Integration Office
Welcome to the 22nd issue of the Light Water Reactor Sustainability (LWRS)
Program newsletter, which features the following articles highlighting recent program accomplishments:
Validating Smoothed Particle Hydrodynamics Codes for Flooding Applications: This article describes an approach for evaluating the potential impact of flooding on the existing fleet of nuclear power plants and providing insights for decision makers through a series of plant dynamics simulations. While simulation is increasingly being accepted as a way of verifying systems against given design parameters and operations, simulations must be shown to deliver validated and practical results. This article describes testing against real-world data and other simulation methods. The scenario described in the article demonstrates the power of smoothed-particle hydrodynamics (SPH) in dealing with free-surface slamming phenomena. In the scenario, the force exerted by fluid particles onto a post from a dam failure is measured and compared with results from experimental data. This research is important because having enhanced models can help identify conservatisms in plant designs, which could permit the operators of those plants to place more components into a lower risk
category, and clarify safety margins for those components that are close to the low-risk threshold.
Advanced Three-Dimensional Spatial Modeling and Analysis to Accurately Represent Nuclear Facility External Event Scenarios: This article describes integration of external and internal event probabilistic risk assessments (PRAs)to support application of seismic PRAs (SPRAs) in a manner that better accounts for the dynamic nature of seismic events. Case studies are being undertaken to support development activities. Two of these case studies are summarized in the article. Enhanced methods and tools will provide a phenomenologically and probabilistically consistent approach on a common computational platform for systematically addressing the myriad of unique conditions that could result from a major seismic event at a nuclear power plant.
Safety Insights from U.S. Forensics Evaluations at Daiichi: This article describes how lessons learned from Fukushima Daiichi are being evaluated to identify opportunities for enhancing the safety of existing and future nuclear power plant designs. The article highlights two examples that illustrate how significant safety insights are being obtained from these evaluations. In addition to reducing uncertainties related to severe accident modeling progression, safety insights gained from the U.S. forensics effort are actively being used by industry to update and improve pressurized water reactor (PWR) and boiling water reactor (BWR) guidance for severe accident prevention, mitigation, and emergency planning.
Introduction
Table of Contents• Introduction . . . . . . . . . . . . . . . . . . . . . . . . . . . . . . . . . . . . . . . . . . . . . . . . . . . . . . . . . . . . . . . . . . 1
• Validating Smoothed Particle Hydrodynamics Codes for Flooding Applications . . . . . . . . . . . . . . . . . . . . . . . 2
• Advanced Three-Dimensional Spatial Modeling and Analysis to Accurately Represent Nuclear Facility External Event Scenarios . . . . . . . . . . . . . . . . . . . . . . . . . . . . . . . . . 6
• Safety Insights from U.S. Forensics Evaluations at Daiichi . . . . . . . . . . . . . . . . . . . . . . . . . . . . . . . . . . . . .10
• Recent LWRS Program Reports . . . . . . . . . . . . . . . . . . . . . . . . . . . . . . . . . . . . . . . . . . . . . . . . . . . . . .19
2 LWRS Newsletter LWRS Newsletter 3
The Risk-Informed Safety Margin Characterization (RISMC) Pathway is modernizing nuclear power safety analysis (i.e., tools, methods, and data) by
implementing state-of-the-art modeling techniques, taking advantage of modern computing hardware, and combining probabilistic and mechanistic analyses to enable a risk-informed safety analysis process. The modernized tools provide an improved understanding of safety margins and the critical parameters that affect them, thereby aiding plant operators in their efforts to maintain the current high levels of safety in the commercial nuclear power fleet.
To evaluate the possible impact of hazards on the existing fleet of nuclear power plants, the RISMC Pathway aims to provide insight for decision makers through a series of plant dynamics simulations for different initial conditions; flooding is one example application. Simulation is increasingly being accepted as a way of verifying systems against given design parameters and operations. Being able to virtually run a scenario not only reduces costs, but also makes it possible to go beyond physical testing capabilities. However, we need to be assured that these simulations can deliver validated and practical results.
Validating Smoothed Particle Hydrodynamics Codes for Flooding Applications
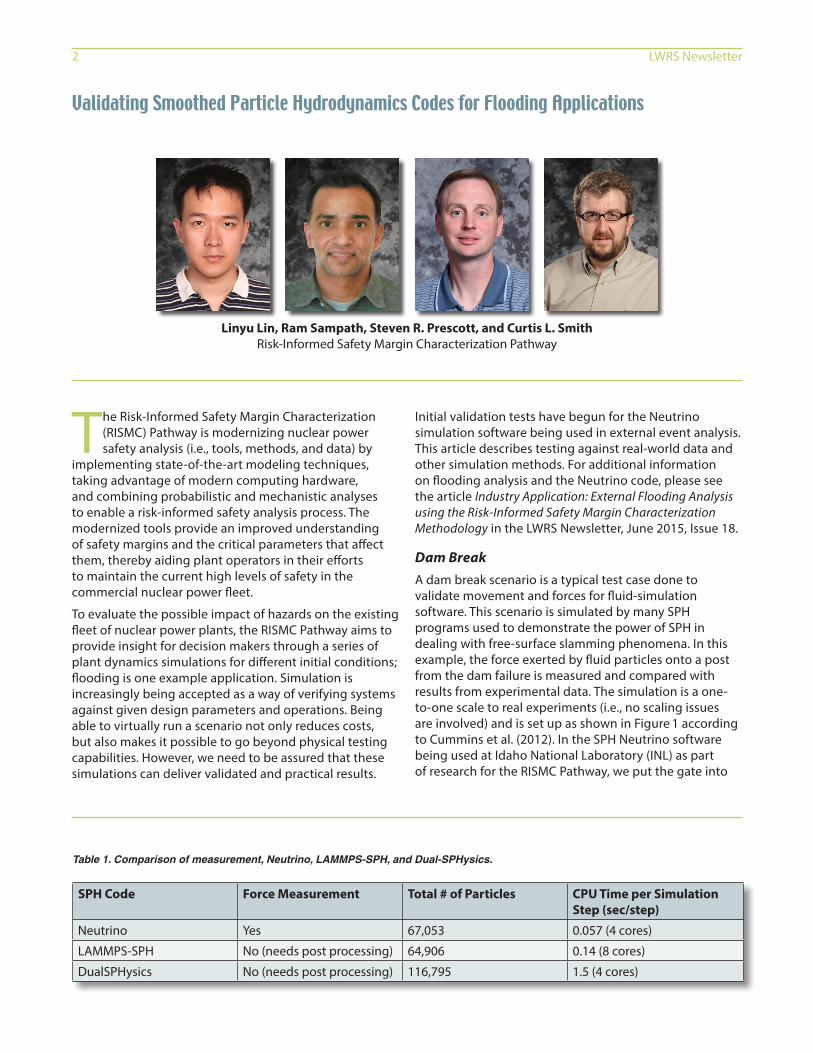
Linyu Lin, Ram Sampath, Steven R. Prescott, and Curtis L. Smith Risk-Informed Safety Margin Characterization Pathway
Initial validation tests have begun for the Neutrino simulation software being used in external event analysis. This article describes testing against real-world data and other simulation methods. For additional information on flooding analysis and the Neutrino code, please see the article Industry Application: External Flooding Analysis using the Risk-Informed Safety Margin Characterization Methodology in the LWRS Newsletter, June 2015, Issue 18.
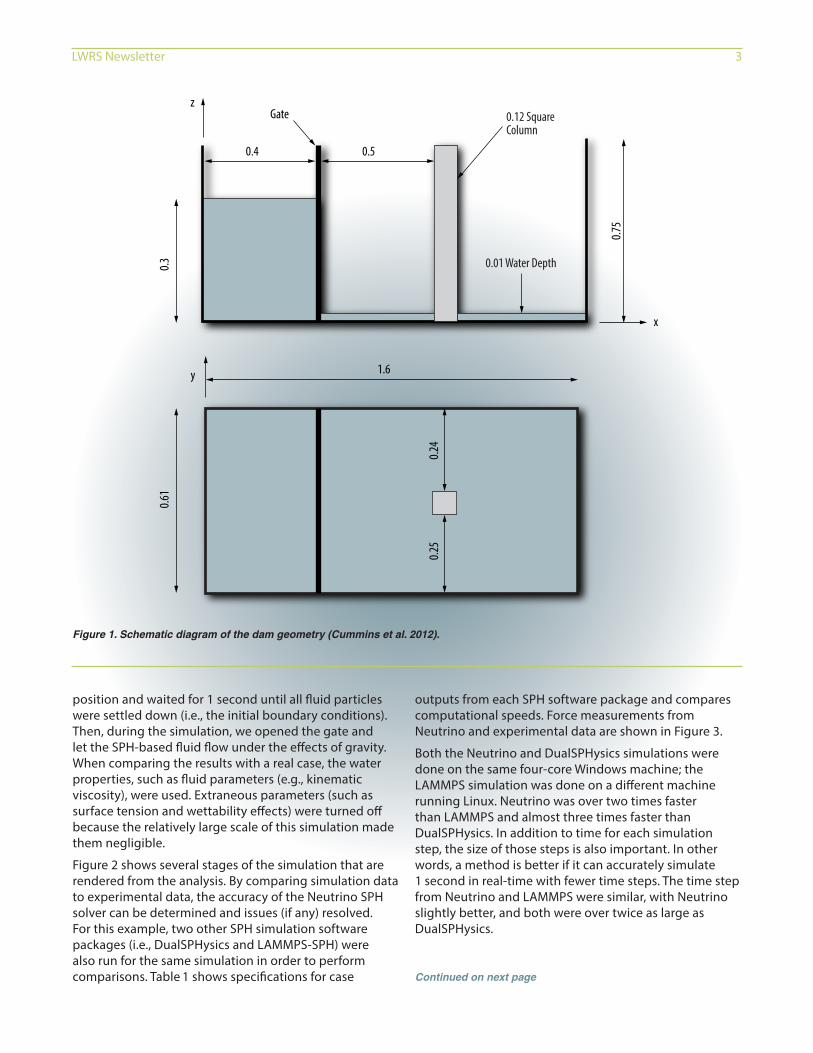
Dam BreakA dam break scenario is a typical test case done to validate movement and forces for fluid-simulation software. This scenario is simulated by many SPH programs used to demonstrate the power of SPH in dealing with free-surface slamming phenomena. In this example, the force exerted by fluid particles onto a post from the dam failure is measured and compared with results from experimental data. The simulation is a one-to-one scale to real experiments (i.e., no scaling issues are involved) and is set up as shown in Figure 1 according to Cummins et al. (2012). In the SPH Neutrino software being used at Idaho National Laboratory (INL) as part of research for the RISMC Pathway, we put the gate into
SPH Code Force Measurement Total # of Particles CPU Time per Simulation Step (sec/step)
Neutrino Yes 67,053 0.057 (4 cores)
LAMMPS-SPH No (needs post processing) 64,906 0.14 (8 cores)
DualSPHysics No (needs post processing) 116,795 1.5 (4 cores)
Table 1. Comparison of measurement, Neutrino, LAMMPS-SPH, and Dual-SPHysics.
2 LWRS Newsletter LWRS Newsletter 3
position and waited for 1 second until all fluid particles were settled down (i.e., the initial boundary conditions). Then, during the simulation, we opened the gate and let the SPH-based fluid flow under the effects of gravity. When comparing the results with a real case, the water properties, such as fluid parameters (e.g., kinematic viscosity), were used. Extraneous parameters (such as surface tension and wettability effects) were turned off because the relatively large scale of this simulation made them negligible.
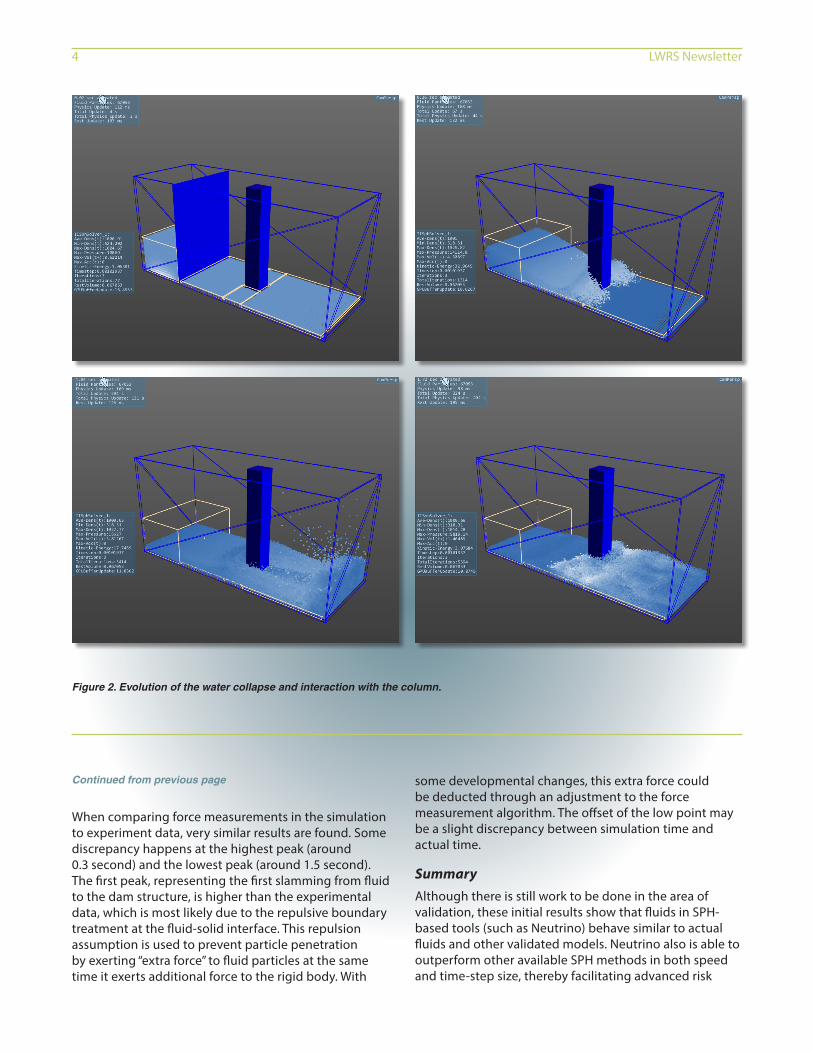
Figure 2 shows several stages of the simulation that are rendered from the analysis. By comparing simulation data to experimental data, the accuracy of the Neutrino SPH solver can be determined and issues (if any) resolved. For this example, two other SPH simulation software packages (i.e., DualSPHysics and LAMMPS-SPH) were also run for the same simulation in order to perform comparisons. Table 1 shows specifications for case
Figure 1. Schematic diagram of the dam geometry (Cummins et al. 2012).
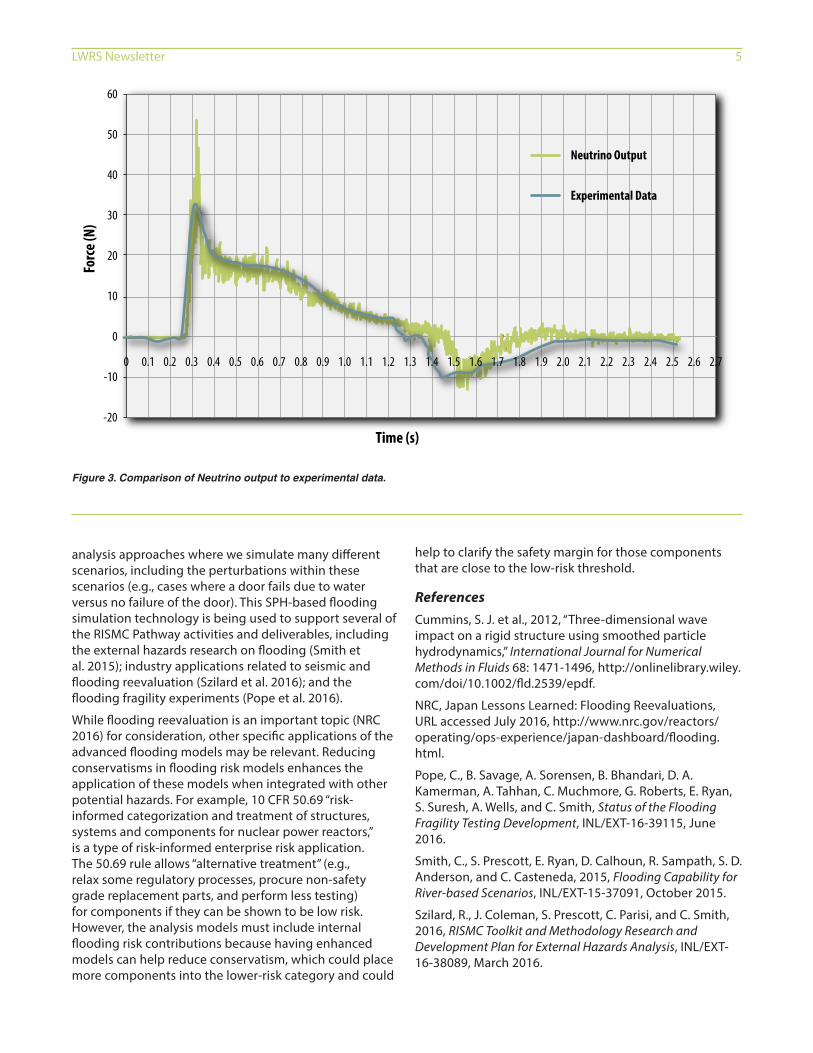
outputs from each SPH software package and compares computational speeds. Force measurements from Neutrino and experimental data are shown in Figure 3.
Both the Neutrino and DualSPHysics simulations were done on the same four-core Windows machine; the LAMMPS simulation was done on a different machine running Linux. Neutrino was over two times faster than LAMMPS and almost three times faster than DualSPHysics. In addition to time for each simulation step, the size of those steps is also important. In other words, a method is better if it can accurately simulate 1 second in real-time with fewer time steps. The time step from Neutrino and LAMMPS were similar, with Neutrino slightly better, and both were over twice as large as DualSPHysics.
Continued on next page
0.4
zGate 0.12 Square
Column
0.01 Water Depth
0.5
1.6y
x
0.75
0.30.6
1
0.24
0.25
4 LWRS Newsletter LWRS Newsletter 5
Continued from previous page
When comparing force measurements in the simulation to experiment data, very similar results are found. Some discrepancy happens at the highest peak (around 0.3 second) and the lowest peak (around 1.5 second). The first peak, representing the first slamming from fluid to the dam structure, is higher than the experimental data, which is most likely due to the repulsive boundary treatment at the fluid-solid interface. This repulsion assumption is used to prevent particle penetration by exerting “extra force” to fluid particles at the same time it exerts additional force to the rigid body. With
Figure 2. Evolution of the water collapse and interaction with the column.
some developmental changes, this extra force could be deducted through an adjustment to the force measurement algorithm. The offset of the low point may be a slight discrepancy between simulation time and actual time.
SummaryAlthough there is still work to be done in the area of validation, these initial results show that fluids in SPH-based tools (such as Neutrino) behave similar to actual fluids and other validated models. Neutrino also is able to outperform other available SPH methods in both speed and time-step size, thereby facilitating advanced risk
4 LWRS Newsletter LWRS Newsletter 5
Figure 3. Comparison of Neutrino output to experimental data.
analysis approaches where we simulate many different scenarios, including the perturbations within these scenarios (e.g., cases where a door fails due to water versus no failure of the door). This SPH-based flooding simulation technology is being used to support several of the RISMC Pathway activities and deliverables, including the external hazards research on flooding (Smith et al. 2015); industry applications related to seismic and flooding reevaluation (Szilard et al. 2016); and the flooding fragility experiments (Pope et al. 2016).
While flooding reevaluation is an important topic (NRC 2016) for consideration, other specific applications of the advanced flooding models may be relevant. Reducing conservatisms in flooding risk models enhances the application of these models when integrated with other potential hazards. For example, 10 CFR 50.69 “risk-informed categorization and treatment of structures, systems and components for nuclear power reactors,” is a type of risk-informed enterprise risk application. The 50.69 rule allows “alternative treatment” (e.g., relax some regulatory processes, procure non-safety grade replacement parts, and perform less testing) for components if they can be shown to be low risk. However, the analysis models must include internal flooding risk contributions because having enhanced models can help reduce conservatism, which could place more components into the lower-risk category and could
help to clarify the safety margin for those components that are close to the low-risk threshold.
ReferencesCummins, S. J. et al., 2012, “Three-dimensional wave impact on a rigid structure using smoothed particle hydrodynamics,” International Journal for Numerical Methods in Fluids 68: 1471-1496, http://onlinelibrary.wiley.com/doi/10.1002/fld.2539/epdf.
NRC, Japan Lessons Learned: Flooding Reevaluations, URL accessed July 2016, http://www.nrc.gov/reactors/operating/ops-experience/japan-dashboard/flooding.html.
Pope, C., B. Savage, A. Sorensen, B. Bhandari, D. A. Kamerman, A. Tahhan, C. Muchmore, G. Roberts, E. Ryan, S. Suresh, A. Wells, and C. Smith, Status of the Flooding Fragility Testing Development, INL/EXT-16-39115, June 2016.
Smith, C., S. Prescott, E. Ryan, D. Calhoun, R. Sampath, S. D. Anderson, and C. Casteneda, 2015, Flooding Capability for River-based Scenarios, INL/EXT-15-37091, October 2015.
Szilard, R., J. Coleman, S. Prescott, C. Parisi, and C. Smith, 2016, RISMC Toolkit and Methodology Research and Development Plan for External Hazards Analysis, INL/EXT-16-38089, March 2016.
60
50
40
30
20
10
0
-10
-20
Forc
e (N)
Time (s)
Neutrino Output
Experimental Data
2.72.62.52.42.32.22.12.01.91.81.71.61.51.41.31.21.11.00.90.80.70.60.50.40.30.20.10
6 LWRS Newsletter LWRS Newsletter 7
The Ohio State University, in collaboration with the INL and RIZZO Associates, is investigating the integration of external and internal event PRAs in
order to support the assessment of SPRAs in a manner that better accounts for the dynamic nature of seismic events. A 2013 Nuclear Energy University Program award (Consolidated Innovative Nuclear Research Funding Op-portunity) from the U.S. Department of Energy sponsors this research project.
SPRA BackgroundThe nuclear industry, under the leadership of the Electric Power Research Institute, has developed methods and guidelines for the implementation of SPRA that have strengths in demonstrating the design adequacy of the seismic safety of plants in a cost-effective manner. In general, SPRA looks to determine the risk of key systems, structures, and components following the initiating event of an earthquake. A key component in the calculation of risk is determining fragilities of systems, structures, and components. In this context, fragility is defined as the “conditional probability of failure of a structure or component for a given peak ground acceleration.” Thus, there are two elements of fragility: (1) acceleration demands imposed on the structure or component of concern and (2) response (e.g., potential failure) of that structure or component to the imposed loads. For equipment, shaker table tests are used to determine the median acceleration that leads to operational and physical failure. While based on experiments, various sources of uncertainty contribute to the uncertainty about acceleration when the component would fail 50% of the time (i.e., the median). In traditional SPRA practice, these uncertainties are treated as multiplicative factors,
Advanced Three-Dimensional Spatial Modeling and Analysis to Accurately Represent Nuclear Facility External Event Scenarios
each characterized by a log-normal distribution. Expert judgment and general guidelines are used to assess the magnitude of these uncertainties.
Limitations of Existing Methods of SPRAExisting SPRA methodologies rely heavily on expert judgment and simplifying models. The standard event tree approach to PRA is limited when representing the dynamic aspects of seismic events, particularly related to the response of the plant structures and plant personnel in the recovery of safety functions and with regard to the impacts of seismic aftershocks. Seismically induced floods and fires also involve dynamic and spatial considerations, such as the response time of the fire brigade or implementation of manual actions. In the post-Fukushima era, there is increased interest in accounting for recovery actions, including the use of FLEX equipment, and enhancing the realism of risk models for (potentially) long-term off-normal scenarios.
A unique characteristic of seismic events is the potential for common-cause relationships in equipment failure. In general SPRA practice today, common cause failure is treated simplistically, because component failures are treated as either fully correlated or fully uncorrelated according to general guidelines. In the LWRS Program, the current methods of uncertainty analysis can be applied to any form of uncertainty distribution and can account for partial correlation between multi-dimensional variables (Szilard et al. 2014). This enables some of the basic assumptions in SPRA to be relaxed.
The objective of the Nuclear Energy University Program research is not to develop an alternative approach to the existing SPRA but to develop methods and tools that can
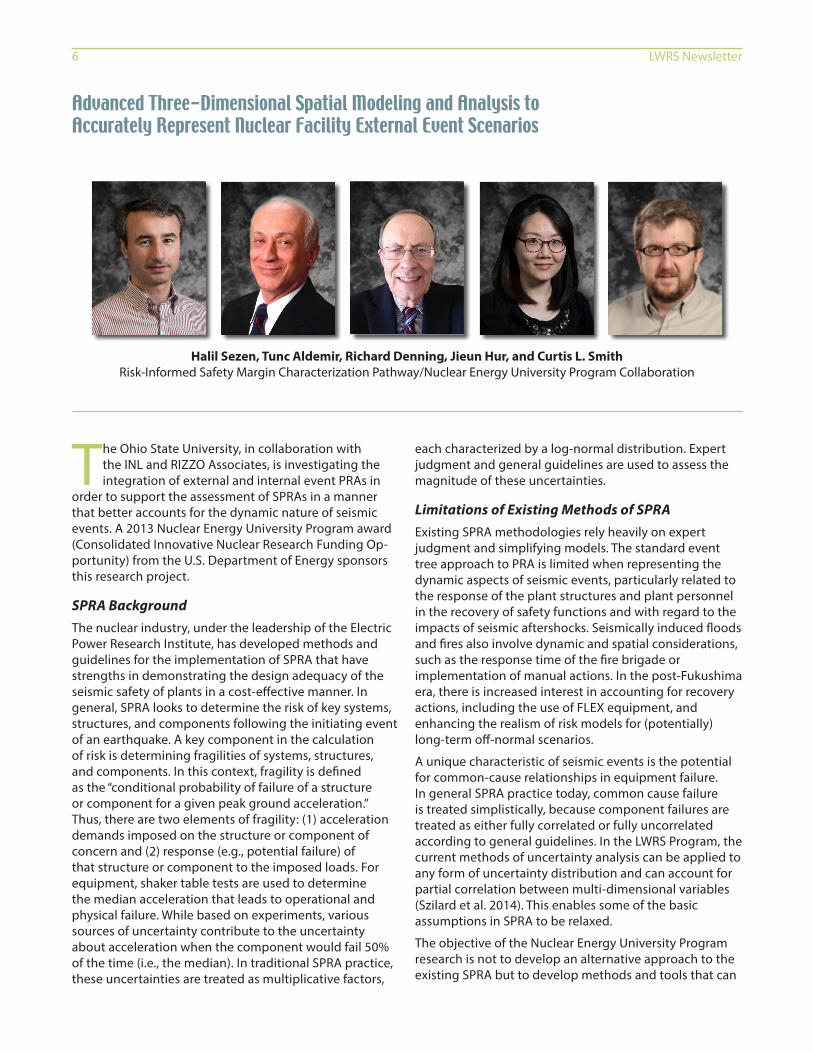
Halil Sezen, Tunc Aldemir, Richard Denning, Jieun Hur, and Curtis L. Smith Risk-Informed Safety Margin Characterization Pathway/Nuclear Energy University Program Collaboration
6 LWRS Newsletter LWRS Newsletter 7
be used to supplement those approaches on a common computational platform when dealing with specific issues for which the existing methodology is inadequate by increasing the realism of the modeling approach. Meeting this objective will help the nuclear industry enhance the validity of SPRA models and applications.
Case StudiesCurrently, we are investigating scenarios involving coupled, multi-physics phenomena (e.g., fluid-structure and soil-structure interactions, dynamic events where the timing of events can change within the range of modeling uncertainties, and events where human actions critically affect scenario outcomes) on a detailed basis, with an assessment of the potential failures and impacts. Case studies are being undertaken to support development activities. Two of these case studies are summarized in the following sections.
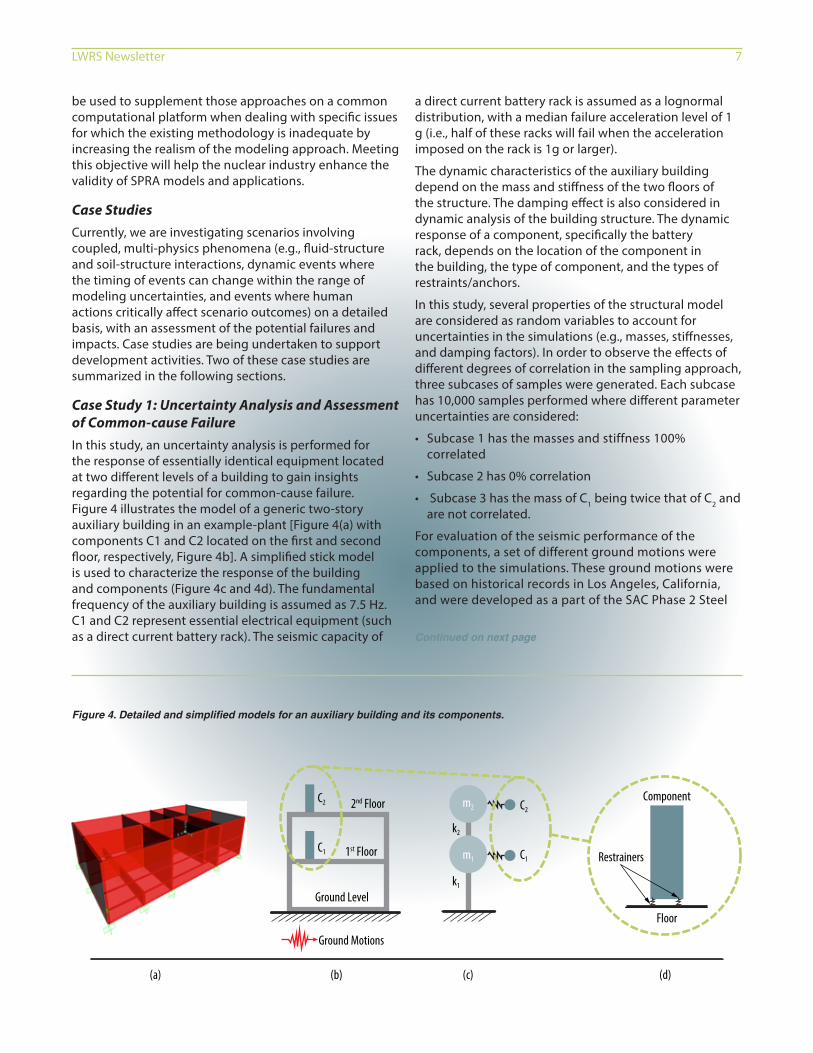
Case Study 1: Uncertainty Analysis and Assessment of Common-cause FailureIn this study, an uncertainty analysis is performed for the response of essentially identical equipment located at two different levels of a building to gain insights regarding the potential for common-cause failure. Figure 4 illustrates the model of a generic two-story auxiliary building in an example-plant [Figure 4(a) with components C1 and C2 located on the first and second floor, respectively, Figure 4b]. A simplified stick model is used to characterize the response of the building and components (Figure 4c and 4d). The fundamental frequency of the auxiliary building is assumed as 7.5 Hz. C1 and C2 represent essential electrical equipment (such as a direct current battery rack). The seismic capacity of
a direct current battery rack is assumed as a lognormal distribution, with a median failure acceleration level of 1 g (i.e., half of these racks will fail when the acceleration imposed on the rack is 1g or larger).
The dynamic characteristics of the auxiliary building depend on the mass and stiffness of the two floors of the structure. The damping effect is also considered in dynamic analysis of the building structure. The dynamic response of a component, specifically the battery rack, depends on the location of the component in the building, the type of component, and the types of restraints/anchors.
In this study, several properties of the structural model are considered as random variables to account for uncertainties in the simulations (e.g., masses, stiffnesses, and damping factors). In order to observe the effects of different degrees of correlation in the sampling approach, three subcases of samples were generated. Each subcase has 10,000 samples performed where different parameter uncertainties are considered:
• Subcase 1 has the masses and stiffness 100% correlated
• Subcase 2 has 0% correlation
• Subcase 3 has the mass of C1 being twice that of C2 and are not correlated.
For evaluation of the seismic performance of the components, a set of different ground motions were applied to the simulations. These ground motions were based on historical records in Los Angeles, California, and were developed as a part of the SAC Phase 2 Steel
Continued on next page
Figure 4. Detailed and simplified models for an auxiliary building and its components.
Ground Motions
(a) (b) (c) (d)
Component
Floor
Restrainers
Ground Level
1st Floor
2nd FloorC2
C1
C2
C1
m2
m1
k2
k1
8 LWRS Newsletter LWRS Newsletter 9
Project (SAC 1997). For each subcase, the probability of failure of C1, probability of failure of C2, and joint probability of failure of both components were determined. Not surprisingly, because the acceleration of the structure is amplified at the second floor relative to the first floor, the probability of failure of C2 was found to be greater than that of C1. However, the conditional probability of failure of C2 was found to be very close to unity given failure of C1, indicating a very high contribution to common cause failure associated with the structural response of the building.
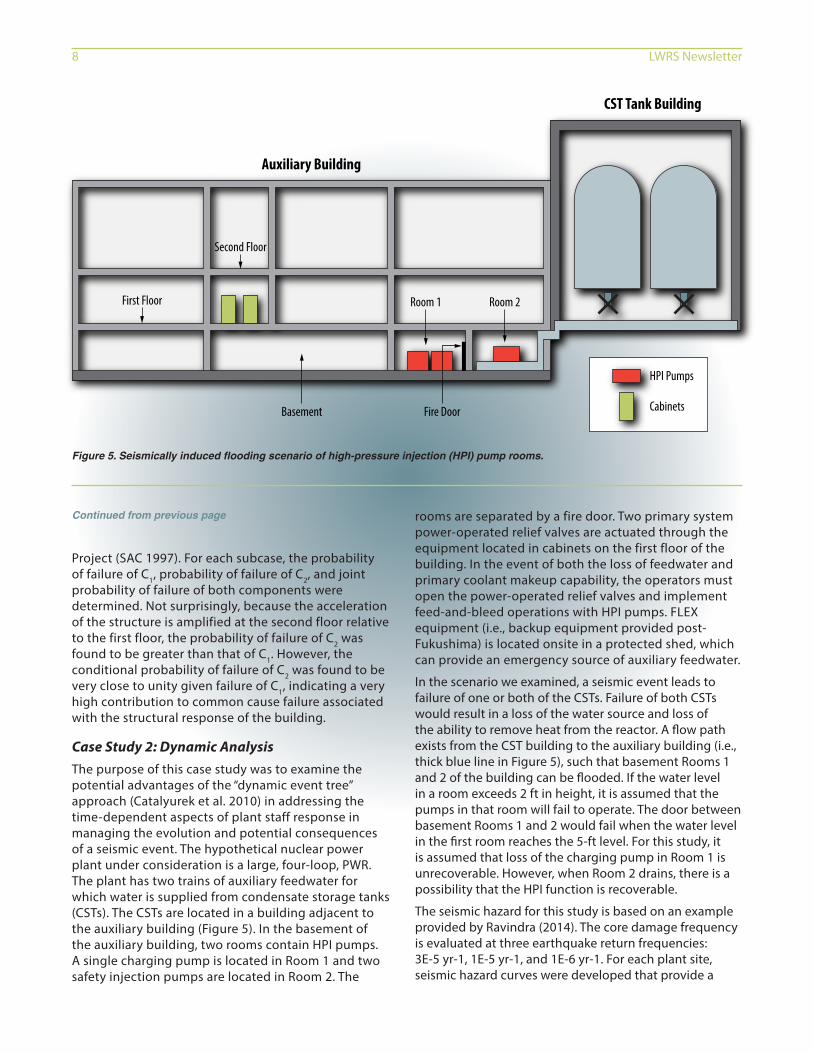
Case Study 2: Dynamic AnalysisThe purpose of this case study was to examine the potential advantages of the “dynamic event tree” approach (Catalyurek et al. 2010) in addressing the time-dependent aspects of plant staff response in managing the evolution and potential consequences of a seismic event. The hypothetical nuclear power plant under consideration is a large, four-loop, PWR. The plant has two trains of auxiliary feedwater for which water is supplied from condensate storage tanks (CSTs). The CSTs are located in a building adjacent to the auxiliary building (Figure 5). In the basement of the auxiliary building, two rooms contain HPI pumps. A single charging pump is located in Room 1 and two safety injection pumps are located in Room 2. The
Continued from previous page
Figure 5. Seismically induced flooding scenario of high-pressure injection (HPI) pump rooms.
rooms are separated by a fire door. Two primary system power-operated relief valves are actuated through the equipment located in cabinets on the first floor of the building. In the event of both the loss of feedwater and primary coolant makeup capability, the operators must open the power-operated relief valves and implement feed-and-bleed operations with HPI pumps. FLEX equipment (i.e., backup equipment provided post-Fukushima) is located onsite in a protected shed, which can provide an emergency source of auxiliary feedwater.
In the scenario we examined, a seismic event leads to failure of one or both of the CSTs. Failure of both CSTs would result in a loss of the water source and loss of the ability to remove heat from the reactor. A flow path exists from the CST building to the auxiliary building (i.e., thick blue line in Figure 5), such that basement Rooms 1 and 2 of the building can be flooded. If the water level in a room exceeds 2 ft in height, it is assumed that the pumps in that room will fail to operate. The door between basement Rooms 1 and 2 would fail when the water level in the first room reaches the 5-ft level. For this study, it is assumed that loss of the charging pump in Room 1 is unrecoverable. However, when Room 2 drains, there is a possibility that the HPI function is recoverable.
The seismic hazard for this study is based on an example provided by Ravindra (2014). The core damage frequency is evaluated at three earthquake return frequencies: 3E-5 yr-1, 1E-5 yr-1, and 1E-6 yr-1. For each plant site, seismic hazard curves were developed that provide a
HPI Pumps
CabinetsFire Door
CST Tank Building
Auxiliary Building
First Floor
Second Floor
Basement
Room 1 Room 2

8 LWRS Newsletter LWRS Newsletter 9
Table 2. Results of analysis.
family of curves describing the relationship between peak acceleration and return period. Then, fragility assessments were conducted for the critical components.
Three time-critical recovery actions were considered in this study: (1) recovery of operation of the power-operated relief valves, (2) recovery of auxiliary feedwater flow by means of FLEX equipment, and (3) recovery of HPI function after the room drains. In order to support modeling of these recovery actions, it would be necessary in practice to perform simulated recovery actions while attempting to include the additional stresses or barriers associated with an actual seismic event. For this case study, an “expert assessment” was made of the probability that a recovery action could be performed within a given time period by fitting a distribution to the probability that the equipment function would be restored within the given time.
A developed simplified (i.e., reduced order) flooding model was used to describe the potential flooding of compartments following a seismic event. The model is fast running and flexible to support performance of dynamic uncertainty analyses. The model solves differential equations for fluid flow under the assumption that a single water level characterizes the depth of water within a room. The model has been calibrated against the FLUENT code (ANSYS 2009). The flooding model was used to examine flooding of the two HPI rooms in the basement of the auxiliary building (see Figure 5) for eight scenarios associated with different leak rates from the CST piping. The timing of failure associated with flooding of HPI pumps and subsequent dry out of the HPI rooms was determined for each of the eight leak rate scenarios. Calculations were performed with the MELCOR code (SNL 2006) in advance of the dynamic analysis to establish criteria for the conditions leading to core damage, depending on which systems had been failed and which systems had been recovered as a function of time.
Analysis of the eight scenarios was performed using Monte Carlo sampling (using 100,000 iterations) from the recovery distributions to determine the time to restore auxiliary feedwater flow and HPI. The effect of aftershocks
on recovery actions was treated by adding a delay time to each sampled recovery time. For each iteration, the recovery time and ability to perform feed-and-bleed operations was compared with the time-criteria developed from the MELCOR calculations to determine whether core damage would be prevented.
Table 2 provides overall conditional core damage probabilities and overall frequencies for the three seismic return frequencies that were evaluated. Note that these results represent a quasi-dynamic analysis, where MELCOR runs were performed in advance to determine the failure conditions under which core damage would be expected.
ConclusionsBy its very nature, a seismic event is both dynamic and a source of potential common-cause failures. The possibility for dependent failures, aftershocks, the need for recovery actions, the need for operating staff to verify the status of the plant, the potential for seismically induced flooding, and the potential for fires lead to conditions that would be difficult to analyze realistically within the constraints of static event trees. It is expected that enhanced methods and tools will provide a phenomenological and probabilistically consistent approach on a common computational platform for systematically addressing these unique conditions.
The next steps of our research are to further demonstrate the proposed analysis approach and process for dynamic SPRA in order to produce additional scenarios with a large number of ground motions representative of potential earthquakes in the central and eastern United States. These ground motions, developed as part of this project, are being used for seismic analysis of detailed and simplified structural models of representative containment buildings, auxiliary buildings, equipment, and condensate storage tanks, including fluid-structure interaction.
Return Frequency (yr-1) Conditional Core Damage Probability
Core Damage Frequency (yr-1)
3E-5 0.0087 2.6E-7
1E-5 0.067 6.7E-7
1E-6 0.67 6.7E-7
Total 1.6E-6
Continued on page 18
10 LWRS Newsletter LWRS Newsletter 11
Safety Insights from U.S. Forensics Evaluations at Daiichi
Joy L. Rempe, Rempe and Associates, LLC
Reactor Safety Technologies Pathway
Although accident signatures from the affected units at the Fukushima Daiichi Nuclear
Power Station (hereafter referred to as Daiichi) differ, little is known about the end-state of core materials within these units. Some of this uncertainty can be attributed to a lack of information related to cooling system operation and cooling water injection. There also is uncertainty in our understanding of phenomena affecting (a) in-vessel core damage progression during severe accidents in BWRs and (b) ex-vessel phenomena for BWRs and PWRs. Similar to what
and improves the ability of the Tokyo Electric Power Company (TEPCO) to characterize potential hazards and ensure the safety of workers involved with cleanup activities. The U.S. forensics effort is using this information to identify opportunities for enhancing the safety of existing and future nuclear power plant designs. This article highlights two examples that illustrate significant safety insights being obtained from these evaluations. In addition to reducing uncertainties related to severe accident modeling progression, these insights are being
occurred after the accident at Three-Mile Island Unit 2 (Rempe et al. 2012), these Daiichi units offer a means for reducing uncertainties by obtaining prototypic data from multiple full-scale BWR severe accidents.
Information obtained from Daiichi informs decontamination and decommissioning (D&D) activities
used to update guidance for severe accident prevention, mitigation, and emergency planning.
Objectives and ApproachThe Reactor Safety Technologies Pathway is leading the U.S. forensics effort with the following objectives:
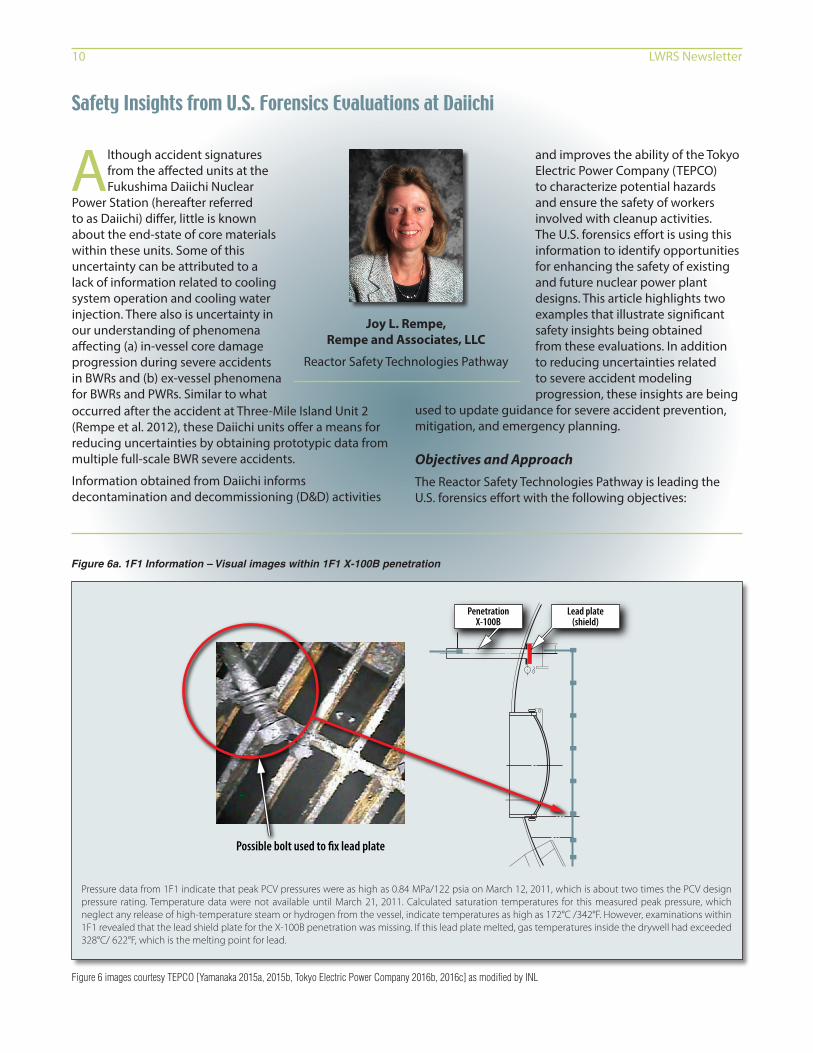
Pressure data from 1F1 indicate that peak PCV pressures were as high as 0.84 MPa/122 psia on March 12, 2011, which is about two times the PCV design pressure rating. Temperature data were not available until March 21, 2011. Calculated saturation temperatures for this measured peak pressure, which neglect any release of high-temperature steam or hydrogen from the vessel, indicate temperatures as high as 172°C /342°F. However, examinations within 1F1 revealed that the lead shield plate for the X-100B penetration was missing. If this lead plate melted, gas temperatures inside the drywell had exceeded 328°C/ 622°F, which is the melting point for lead.
Figure 6 images courtesy TEPCO [Yamanaka 2015a, 2015b, Tokyo Electric Power Company 2016b, 2016c] as modified by INL
Figure 6a. 1F1 Information – Visual images within 1F1 X-100B penetration
Possible bolt used to �x lead plate
PenetrationX-100B
Lead plate(shield)

10 LWRS Newsletter LWRS Newsletter 11
Visual examinations of material from the X-6 penetration suggest that either the chloroprene cable cover or silicon seal material melted and dribbled out of this penetration, indicating peak temperatures greater than 300°C/572°F. The dribbling pattern suggests that relocation occurred at low pressure (rather than a high-pressure ejection). Plant data indicate that 1F2 peak pressures reached 0.75 MPa/109 psia on March 15, 2011. Temperature data were not available until March 21, 2011. Calculated saturation temperatures for the measured peak pressure, which neglect any release of high-temperature steam or hydrogen from the vessel, indicate values of approximately 168°C/334°F.
Figure 6b. 1F2 Information – Photographs and radiation surveys (in mSv/hour) near 1F2 X-6 penetration (values measured in 13 locations).
Objective 1: Develop consensus U.S. input for high priority time-sequenced examination tasks and supporting research activities that can be completed with minimal disruption of TEPCO D&D plans for Daiichi. An important aspect of this U.S. effort is to NOT adversely affect D&D roadmap activities identified by the Government of Japan. (Nuclear Damage Compensation and Decommissioning Facilitation Corporation 2015).
Objective 2: Evaluate obtained information to:
− Gain a better understanding related to events that occurred in each unit at Daiichi
− Gain insights for reducing uncertainties related to predicting severe accident progression
− Gain insights related to severe accident equipment performance
− Provide insights beneficial to TEPCO D&D activities
− Confirm and, if needed, improve guidance for severe accident prevention, mitigation, and emergency planning
− Update and/or refine Objective 1 information requests.
To complete Objective 1, expert panel meetings are held to develop consensus input related to high priority time-sequenced examination tasks. Experts from industry,
universities, and national laboratories participate in this process. Representatives from the U.S. Nuclear Regulatory Commission, U.S. Department of Energy, and TEPCO also participate during these meetings. Evaluations focus on the available information from sources, such as the TEPCO website (Tokyo Electric Power Company 2016a), presentations provided by TEPCO representatives, and TEPCO reports documenting unconfirmed and unresolved issues.
Representative Results and InsightsU.S. experts focus on forensic data needs identified as higher priority areas. These areas and leads are:
• Area 1 – Component/System Performance (Leads: Jeffrey R. Gabor, Jensen Hughes, and Kevin R. Robb, Oak Ridge National Laboratory)
• Area 2 – Radionuclide Surveys/Sampling (Leads: David L. Luxat, Jensen Hughes, and Randall O. Gauntt, Sandia National Laboratories)
• Area 3 – Core Debris End-State (Leads: Mitchell T. Farmer, Argonne National Laboratory, Martin G. Plys, Fauske and Associates, LLC, and Randall O. Gauntt, Sandia National Laboratories)
Continued on next page
Possible source of the e�uence• O-ring of �ange• Cable covering material, etc.
X-6 Penetration
Floor
Trace
526 326 358
536 430 452
590 426 397
827 837
1150 1197
Front side
Back side300 mmFront
side
X-6 Penetration
O-ring CRD maintenanceequipment control cable
PCV
Backside
12 LWRS Newsletter LWRS Newsletter 13
• Area 4 – Combustible Gas Effects (Leads: Wison Luangdilok, Fauske and Associates, LLC, and Nathan C. Andrews, Sandia National Laboratories).
During semi-annual meetings, over 40 U.S. experts review information presented by the leads in each area. In addition, Robert J. Lutz, Lutz Consulting and Bill T. Williamson II, Tennessee Valley Authority, develop industry insights from examination information; and Paul W. Humrickhouse, INL, archives information evaluated by experts on the website (http://fukushima.inl.gov). Professor Michael L. Corradini, University of Wisconsin-Madison, provided guidance as the lead for the Reactor Safety Technologies Pathway. This article presents two representative examples where insights were obtained using information from multiple areas. Additional examples may be found in Amway et al. (2016).
Example 1 – Component and System Performance (Areas 1 and 2)Results from TEPCO examinations to support D&D activities are of interest to assess component and system performance. Visual images (i.e., pictures and videos), dose surveys, water level measurements and samples,
and temperature information are of special interest. As part of the U.S. forensics effort, U.S. experts tabulate findings related to the status of various penetrations and equipment based on TEPCO examinations. Results (see Figure 6a, b, and c) emphasize notable differences in Daiichi Unit 1 (1F1), Daiichi Unit 2 (1F2), and Daiichi Unit 3 (1F3) component degradation. Possible causes for these differences include variations in unit designs, availability/functionality of backup cooling systems, ability to externally inject water during the accidents, ability to vent the primary system and containment during accidents, and differences in combustible gas effects at each unit. Available information highlights different leakage points and the possibility for multiple leakage points within the primary containment vessel (PCV). Identifying leakage locations, leakage timing, and the conditions causing this leakage was of special interest to U.S. experts because of industry efforts to update severe accident guidance.
Insights and Limitations
Many of the leakage points identified for 1F1, 1F2, and 1F3 are not routinely modeled by systems-level severe accident codes. Both MAAP (Fauske and Associates, LLC 2013) and MELCOR (Sandia National Laboratories 2015) simulations predict drywell head failure for the three
Continued from previous page
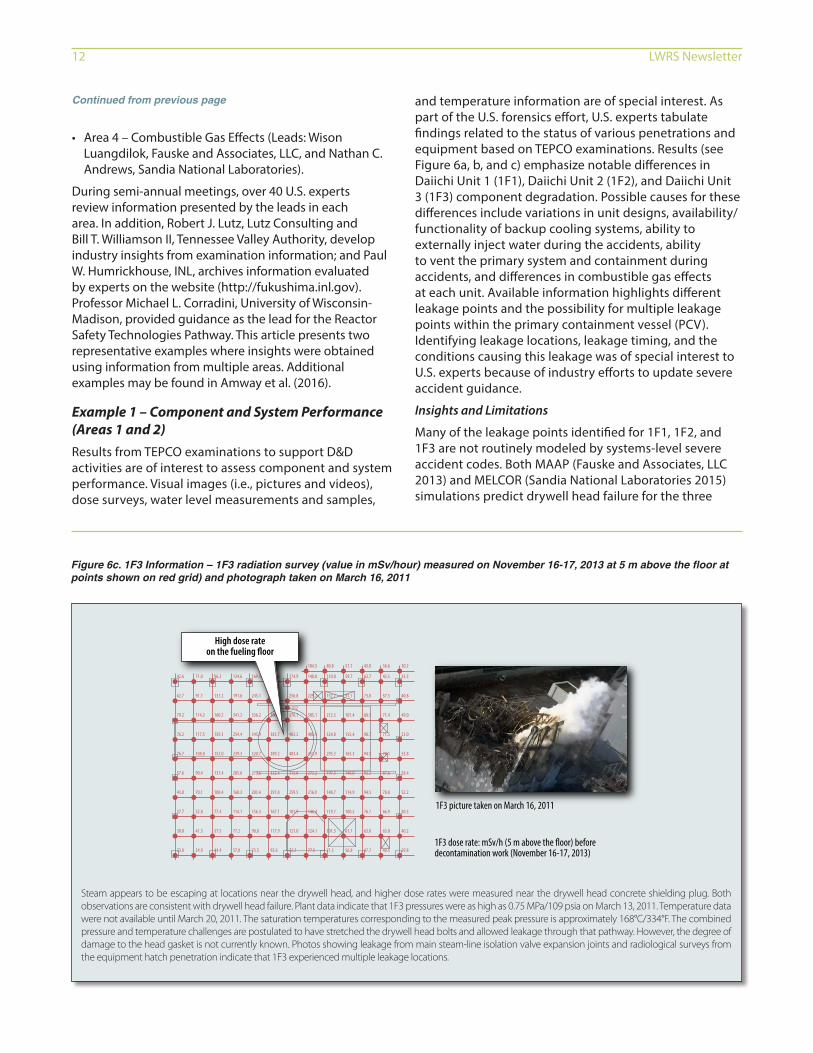
Steam appears to be escaping at locations near the drywell head, and higher dose rates were measured near the drywell head concrete shielding plug. Both observations are consistent with drywell head failure. Plant data indicate that 1F3 pressures were as high as 0.75 MPa/109 psia on March 13, 2011. Temperature data were not available until March 20, 2011. The saturation temperatures corresponding to the measured peak pressure is approximately 168°C/334°F. The combined pressure and temperature challenges are postulated to have stretched the drywell head bolts and allowed leakage through that pathway. However, the degree of damage to the head gasket is not currently known. Photos showing leakage from main steam-line isolation valve expansion joints and radiological surveys from the equipment hatch penetration indicate that 1F3 experienced multiple leakage locations.
Figure 6c. 1F3 Information – 1F3 radiation survey (value in mSv/hour) measured on November 16-17, 2013 at 5 m above the floor at points shown on red grid) and photograph taken on March 16, 2011
35.5
40.8
49.0
53.0
55.8
58.4
52.2
50.5
40.2
29.8
43.5
57.5
71.4
71.5
78.1
87.6
78.8
66.9
63.0
40.5
63.7
73.0
88.5
98.7
94.5
92.2
94.5
76.7
63.0
47.7
59.7
91.7
101.4
155.4
165.3
146.0
114.9
100.5
61.7
56.8
110.0
152.7
212.3
324.8
295.3
197.5
148.7
119.7
101.5
71.5
148.8
30.236.645.051.180.8104.5
229.2
305.1
402.4
351.9
273.2
216.9
146.4
124.1
77.5
174.9
256.8
376.1312
403.2
403.4
313.6
259.5
181.9
121.0
72.2
159.4
249.1
366.0
383.7
389.2
322.4
291.8
167.1
117.9
92.6
169.5
245.1
336.2
345.9
320.7
275.6
203.4
156.3
98.8
73.5
124.6
191.6
241.2
254.4
239.3
205.8
160.3
114.1
77.2
57.8
96.3
131.2
160.2
159.3
152.0
131.4
100.4
77.4
57.5
44.4
71.0
91.7
114.2
117.5
108.8
90.4
70.1
52.8
41.5
34.9
42.6
62.7
79.2
76.2
76.7
57.6
43.8
37.7
30.0
23.8
High dose rateon the fueling �oor
1F3 dose rate: mSv/h (5 m above the �oor) beforedecontamination work (November 16-17, 2013)
1F3 picture taken on March 16, 2011
12 LWRS Newsletter LWRS Newsletter 13
units (Luxat and Gabor 2013, Gauntt et al. 2012). It is evident that reconsideration of other penetrations/piping failures may be warranted for investigation in these systems analysis codes.
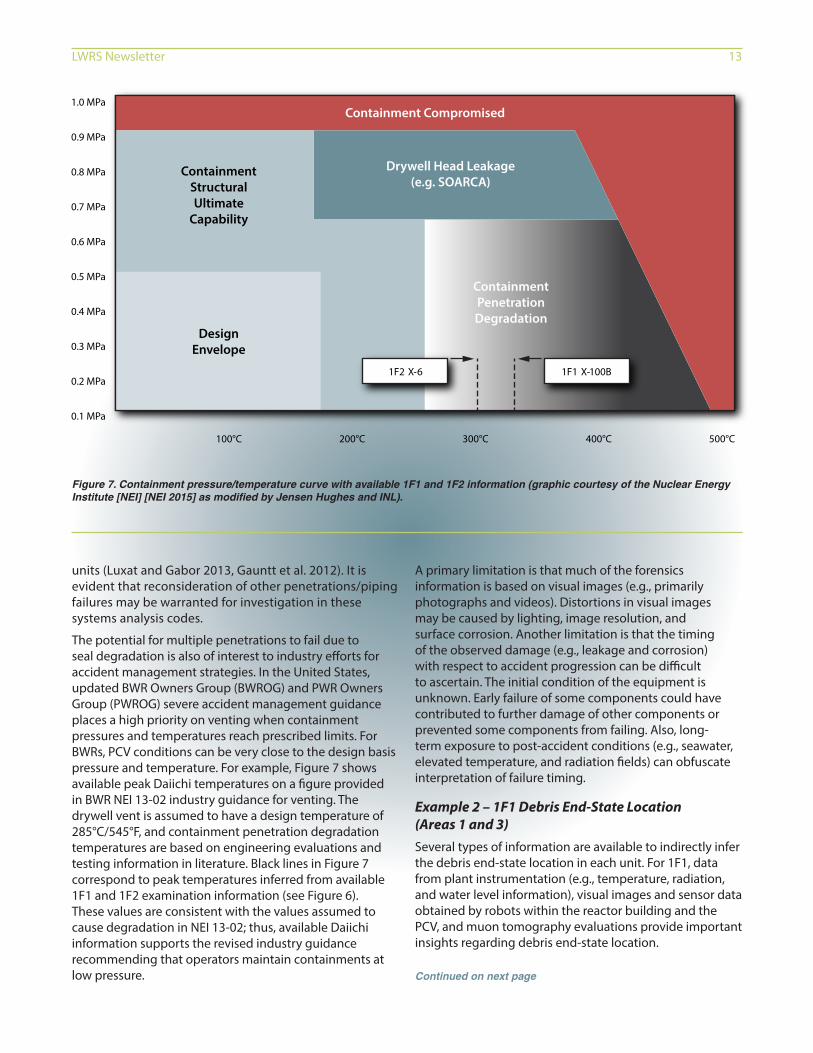
The potential for multiple penetrations to fail due to seal degradation is also of interest to industry efforts for accident management strategies. In the United States, updated BWR Owners Group (BWROG) and PWR Owners Group (PWROG) severe accident management guidance places a high priority on venting when containment pressures and temperatures reach prescribed limits. For BWRs, PCV conditions can be very close to the design basis pressure and temperature. For example, Figure 7 shows available peak Daiichi temperatures on a figure provided in BWR NEI 13-02 industry guidance for venting. The drywell vent is assumed to have a design temperature of 285°C/545°F, and containment penetration degradation temperatures are based on engineering evaluations and testing information in literature. Black lines in Figure 7 correspond to peak temperatures inferred from available 1F1 and 1F2 examination information (see Figure 6). These values are consistent with the values assumed to cause degradation in NEI 13-02; thus, available Daiichi information supports the revised industry guidance recommending that operators maintain containments at low pressure.
A primary limitation is that much of the forensics information is based on visual images (e.g., primarily photographs and videos). Distortions in visual images may be caused by lighting, image resolution, and surface corrosion. Another limitation is that the timing of the observed damage (e.g., leakage and corrosion) with respect to accident progression can be difficult to ascertain. The initial condition of the equipment is unknown. Early failure of some components could have contributed to further damage of other components or prevented some components from failing. Also, long-term exposure to post-accident conditions (e.g., seawater, elevated temperature, and radiation fields) can obfuscate interpretation of failure timing.
Example 2 – 1F1 Debris End-State Location (Areas 1 and 3)Several types of information are available to indirectly infer the debris end-state location in each unit. For 1F1, data from plant instrumentation (e.g., temperature, radiation, and water level information), visual images and sensor data obtained by robots within the reactor building and the PCV, and muon tomography evaluations provide important insights regarding debris end-state location.
Continued on next page
Figure 7. Containment pressure/temperature curve with available 1F1 and 1F2 information (graphic courtesy of the Nuclear Energy Institute [NEI] [NEI 2015] as modified by Jensen Hughes and INL).
1.0 MPa
0.9 MPa
0.8 MPa
0.7 MPa
0.6 MPa
0.5 MPa
0.4 MPa
0.3 MPa
0.2 MPa
0.1 MPa
100°C
DesignEnvelope
ContainmentStructuralUltimate
Capability
Containment Compromised
Drywell Head Leakage(e.g. SOARCA)
ContainmentPenetrationDegradation
1F2 X-6 1F1 X-100B
200°C 300°C 400°C 500°C
14 LWRS Newsletter LWRS Newsletter 15
Thermocouple Measurements
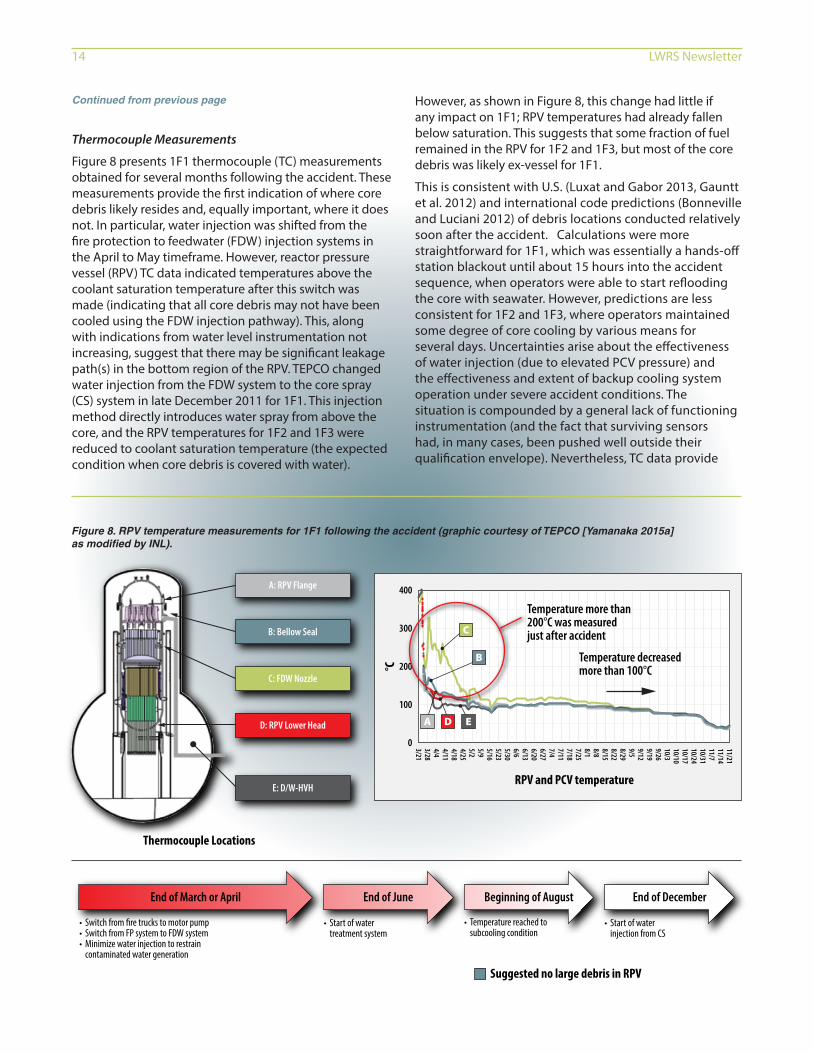
Figure 8 presents 1F1 thermocouple (TC) measurements obtained for several months following the accident. These measurements provide the first indication of where core debris likely resides and, equally important, where it does not. In particular, water injection was shifted from the fire protection to feedwater (FDW) injection systems in the April to May timeframe. However, reactor pressure vessel (RPV) TC data indicated temperatures above the coolant saturation temperature after this switch was made (indicating that all core debris may not have been cooled using the FDW injection pathway). This, along with indications from water level instrumentation not increasing, suggest that there may be significant leakage path(s) in the bottom region of the RPV. TEPCO changed water injection from the FDW system to the core spray (CS) system in late December 2011 for 1F1. This injection method directly introduces water spray from above the core, and the RPV temperatures for 1F2 and 1F3 were reduced to coolant saturation temperature (the expected condition when core debris is covered with water).
However, as shown in Figure 8, this change had little if any impact on 1F1; RPV temperatures had already fallen below saturation. This suggests that some fraction of fuel remained in the RPV for 1F2 and 1F3, but most of the core debris was likely ex-vessel for 1F1.
This is consistent with U.S. (Luxat and Gabor 2013, Gauntt et al. 2012) and international code predictions (Bonneville and Luciani 2012) of debris locations conducted relatively soon after the accident. Calculations were more straightforward for 1F1, which was essentially a hands-off station blackout until about 15 hours into the accident sequence, when operators were able to start reflooding the core with seawater. However, predictions are less consistent for 1F2 and 1F3, where operators maintained some degree of core cooling by various means for several days. Uncertainties arise about the effectiveness of water injection (due to elevated PCV pressure) and the effectiveness and extent of backup cooling system operation under severe accident conditions. The situation is compounded by a general lack of functioning instrumentation (and the fact that surviving sensors had, in many cases, been pushed well outside their qualification envelope). Nevertheless, TC data provide
Continued from previous page
Figure 8. RPV temperature measurements for 1F1 following the accident (graphic courtesy of TEPCO [Yamanaka 2015a] as modified by INL).
D: RPV Lower Head
E: D/W-HVH
C: FDW Nozzle
B: Bellow Seal
A: RPV Flange
Thermocouple Locations
Suggested no large debris in RPV
End of March or April End of June Beginning of August End of December
• Start of water injection from CS
• Temperature reached to subcooling condition
• Start of water treatment system
• Switch from �re trucks to motor pump• Switch from FP system to FDW system• Minimize water injection to restrain contaminated water generation
C
A D E
B
RPV and PCV temperature
Temperature more than200°C was measuredjust after accident
Temperature decreasedmore than 100°C
400
°C
300
200
100
3/213/284/44/114/184/255/25/95/165/235/306/66/136/206/277/47/117/187/258/18/88/158/228/299/59/129/199/2610/310/1010/1710/2410/3111/711/1411/21
0
14 LWRS Newsletter LWRS Newsletter 15
valuable information related to core debris end-state location and water addition strategies. At this time, data indicate that TEPCO may need to remove core debris from the RPVs for at least two units and from the PCV for 1F1. In addition, TC data illustrate the benefit of injecting though core sprays for BWRs; this method optimizes the probability that core debris will be contacted by and cooled with the injected water.
Images from Examinations within the PCV and Reactor Building
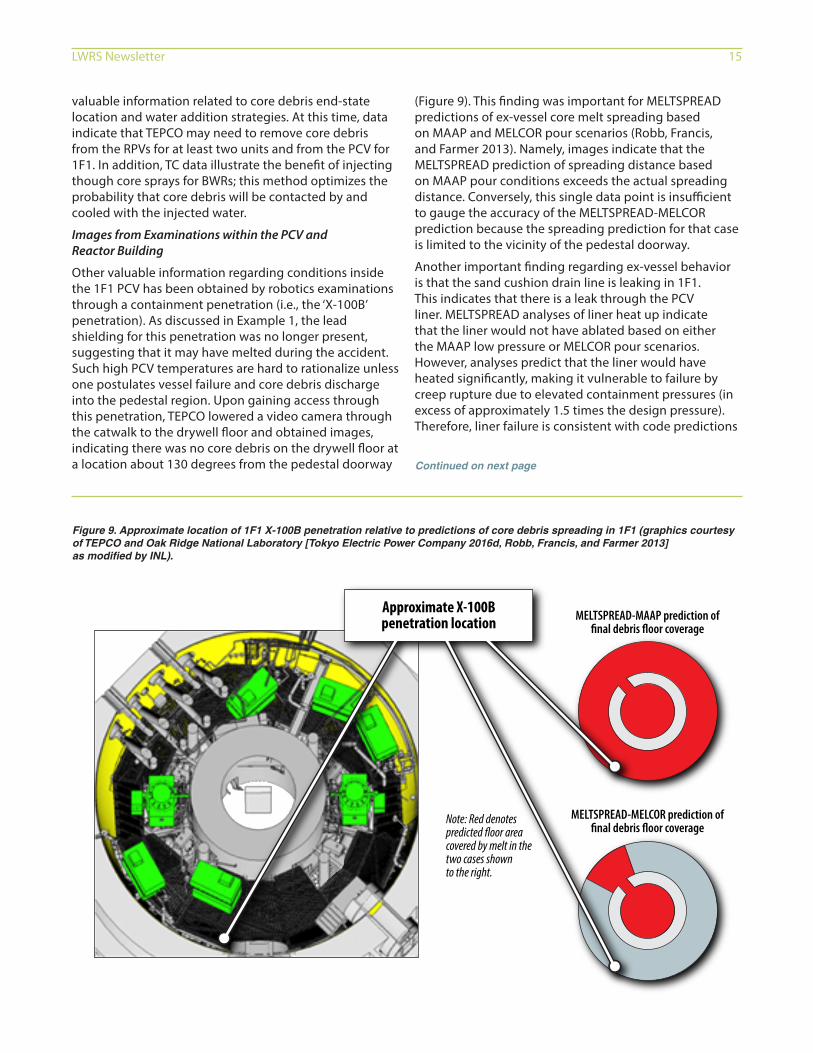
Other valuable information regarding conditions inside the 1F1 PCV has been obtained by robotics examinations through a containment penetration (i.e., the ‘X-100B’ penetration). As discussed in Example 1, the lead shielding for this penetration was no longer present, suggesting that it may have melted during the accident. Such high PCV temperatures are hard to rationalize unless one postulates vessel failure and core debris discharge into the pedestal region. Upon gaining access through this penetration, TEPCO lowered a video camera through the catwalk to the drywell floor and obtained images, indicating there was no core debris on the drywell floor at a location about 130 degrees from the pedestal doorway
(Figure 9). This finding was important for MELTSPREAD predictions of ex-vessel core melt spreading based on MAAP and MELCOR pour scenarios (Robb, Francis, and Farmer 2013). Namely, images indicate that the MELTSPREAD prediction of spreading distance based on MAAP pour conditions exceeds the actual spreading distance. Conversely, this single data point is insufficient to gauge the accuracy of the MELTSPREAD-MELCOR prediction because the spreading prediction for that case is limited to the vicinity of the pedestal doorway.
Another important finding regarding ex-vessel behavior is that the sand cushion drain line is leaking in 1F1. This indicates that there is a leak through the PCV liner. MELTSPREAD analyses of liner heat up indicate that the liner would not have ablated based on either the MAAP low pressure or MELCOR pour scenarios. However, analyses predict that the liner would have heated significantly, making it vulnerable to failure by creep rupture due to elevated containment pressures (in excess of approximately 1.5 times the design pressure). Therefore, liner failure is consistent with code predictions
Continued on next page
Figure 9. Approximate location of 1F1 X-100B penetration relative to predictions of core debris spreading in 1F1 (graphics courtesy of TEPCO and Oak Ridge National Laboratory [Tokyo Electric Power Company 2016d, Robb, Francis, and Farmer 2013] as modified by INL).
MELTSPREAD-MAAP prediction of�nal debris �oor coverage
Note: Red denotespredicted �oor areacovered by melt in thetwo cases shownto the right.
MELTSPREAD-MELCOR prediction of�nal debris �oor coverage
Approximate X-100Bpenetration location
16 LWRS Newsletter LWRS Newsletter 17
and with measured radiation levels in the 1F1 reactor building.
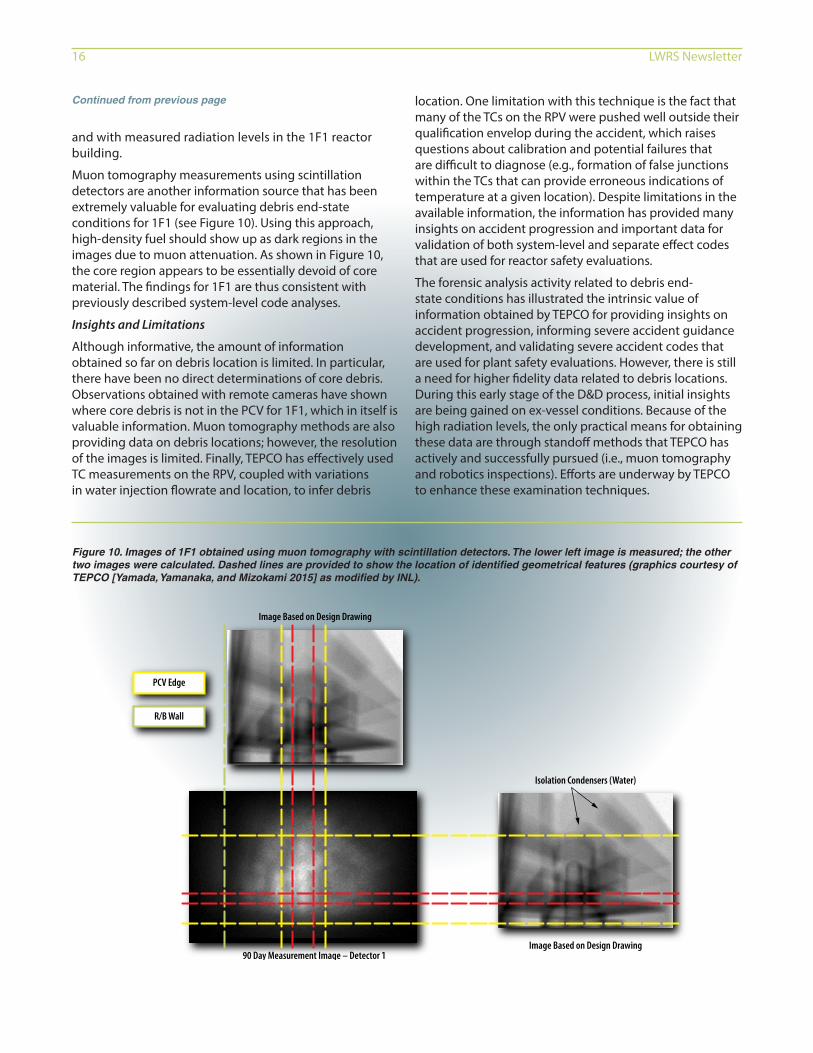
Muon tomography measurements using scintillation detectors are another information source that has been extremely valuable for evaluating debris end-state conditions for 1F1 (see Figure 10). Using this approach, high-density fuel should show up as dark regions in the images due to muon attenuation. As shown in Figure 10, the core region appears to be essentially devoid of core material. The findings for 1F1 are thus consistent with previously described system-level code analyses.
Insights and Limitations
Although informative, the amount of information obtained so far on debris location is limited. In particular, there have been no direct determinations of core debris. Observations obtained with remote cameras have shown where core debris is not in the PCV for 1F1, which in itself is valuable information. Muon tomography methods are also providing data on debris locations; however, the resolution of the images is limited. Finally, TEPCO has effectively used TC measurements on the RPV, coupled with variations in water injection flowrate and location, to infer debris
location. One limitation with this technique is the fact that many of the TCs on the RPV were pushed well outside their qualification envelop during the accident, which raises questions about calibration and potential failures that are difficult to diagnose (e.g., formation of false junctions within the TCs that can provide erroneous indications of temperature at a given location). Despite limitations in the available information, the information has provided many insights on accident progression and important data for validation of both system-level and separate effect codes that are used for reactor safety evaluations.
The forensic analysis activity related to debris end-state conditions has illustrated the intrinsic value of information obtained by TEPCO for providing insights on accident progression, informing severe accident guidance development, and validating severe accident codes that are used for plant safety evaluations. However, there is still a need for higher fidelity data related to debris locations. During this early stage of the D&D process, initial insights are being gained on ex-vessel conditions. Because of the high radiation levels, the only practical means for obtaining these data are through standoff methods that TEPCO has actively and successfully pursued (i.e., muon tomography and robotics inspections). Efforts are underway by TEPCO to enhance these examination techniques.
Continued from previous page
Figure 10. Images of 1F1 obtained using muon tomography with scintillation detectors. The lower left image is measured; the other two images were calculated. Dashed lines are provided to show the location of identified geometrical features (graphics courtesy of TEPCO [Yamada, Yamanaka, and Mizokami 2015] as modified by INL).
Image Based on Design Drawing
Image Based on Design Drawing
Isolation Condensers (Water)
90 Day Measurement Image – Detector 1
PCV Edge
R/B Wall

16 LWRS Newsletter LWRS Newsletter 17
SummarySafety insights gained from the U.S. forensics effort are actively being used by industry to update and improve PWR and BWR guidance for severe accident prevention, mitigation, and emergency planning in addition to reducing uncertainties in severe accident modeling progression.
Severe Accident Guidance
Specific to the two examples presented in this article, the U.S. forensics effort has the following benefits to industry severe accident guidance:
− Primary Containment Integrity Challenges – As discussed in Example 1, the three operating units exhibited different patterns of PCV leakage of fission products and hydrogen. The variability introduced by unit-to-unit differences at Fukushima points to uncertainties in actual leakage locations and confirms that maintaining containment conditions below design basis temperature and pressure limits (and that a high priority is placed on reducing containment conditions when they exceed design basis values) is an appropriate strategy. The revised BWROG and PWROG severe accident guidance places a high priority on venting the primary containment when the combination of pressure and temperature reaches a prescribed limit. For BWRs, these conditions can be very close to the containment design basis pressure and temperature.
− Water Addition Pathways – As discussed in Example 2, currently available information indicates differences in the core debris end-state location in 1F1, 1F2, and 1F3. It is believed that these differences are due to differences in accident progression at each unit. The BWROG and PWROG guidance places a higher priority on injection of water to the RPV compared to the primary containment. If the RPV fails, the injected water will flow through the RPV breach to the core debris in the primary containment. This ensures that core debris is cooled with injected water (and possibly submerged in water) regardless of its location. Because a large amount of water is required to cool the core debris in all possible locations (in the primary containment and in the RPV) for both BWRs and some PWRs, the emphasis on water addition in the updated guidance is appropriate. The BWROG also places a high priority on injection of water to the RPV using core spray to assist in more complete cooling of in-vessel core debris.
Severe Accident Modeling
Although results are preliminary, available information has already identified several areas where efforts are needed to reduce uncertainties in severe accident modeling. Specific examples are as follows:
− Primary Containment Integrity Challenges – As discussed in Example 1, the three operating units exhibited
different patterns of PCV leakage of fission products and hydrogen. Many of these leakage points are not routinely modeled by system level severe accident codes (e.g., MAAP and MELCOR). Both MAAP and MELCOR simulations predict drywell head failure for the three units. It is evident that other penetrations and piping failures should be considered in systems analyses codes.
− MAAP and MELCOR Nodalization Studies - As discussed in Example 2, MAAP and MELCOR RPV nodalization studies to improve temperature predictions could also provide insights related to post-accident debris end-state predictions and provide insights related to modeling of in-core melt progression.
− 1F2 MELTSPREAD-CORQUENCH Analysis – As discussed in Example 2, ex-vessel debris spreading analyses have only been performed for 1F1. System-level code analyses indicated that there is the potential for vessel failure to also have occurred at 1F2. An evaluation of 1F2 may be useful for rationalizing differences in future observations obtained from 1F1 and 1F2.
The U.S. forensics effort is providing important insights from information evaluated in the areas of component system performance, radionuclide surveys and sampling, core debris end-state, and combustible gas effects. Only two examples have been highlighted in this article. Additional examples may be found in our annual reports.
ReferencesAmway, P., N. Andrews, W. Bixby, R. Bunt, M. Corradini, P. Ellison, M. Farmer, T. Farthing, M. Francis, J. Gabor, R. Gauntt, C. Henry, P. Humrickhouse, S. Kraft, R. Linthicum, W. Luangdilok, R. Lutz, D. Luxat, J. Maddox, C. Negin, C. Paik, M. Plys, J. Rempe, K. Robb, R. Sanders, R. Wachowiak, and B. Williamson, 2016, U.S. Efforts in Support of Examinations at Fukushima Daiichi – 2016 Evaluations, ANL/LWRS-16-02, J. L. Rempe (ed.), to be published September 2016.
Bonneville, H. E. and A. Luciani, 2012, “Simulation of the Core Degradation Phase of the Fukushima Accidents Using the ASTEC Code,” Nuclear Engineering and Design 272.
Fauske and Associates, LLC, 2013, “Transmittal Document for MAAP5 Code Revision MAAP 5.02,” FAI/13-0801.
Gauntt, R. O. et al., 2012, “Fukushima Daiichi Accident Study,” SAND2012-6173.
Luxat, D. and J. Gabor, 2013, “Fukushima Technical Evaluation: Phase 1 – MAAP5 Analysis,” EPRI Report No. 1025750.
NEI, 2015, “Industry Guidance for Compliance with Order EA-13-109,” NEI 13-02, Revision 1, Nuclear Energy Institute.
Nuclear Damage Compensation and Decommissioning Facilitation Corporation, 2015, “Technical Strategic Plan
Continued on next page
18 LWRS Newsletter LWRS Newsletter 19
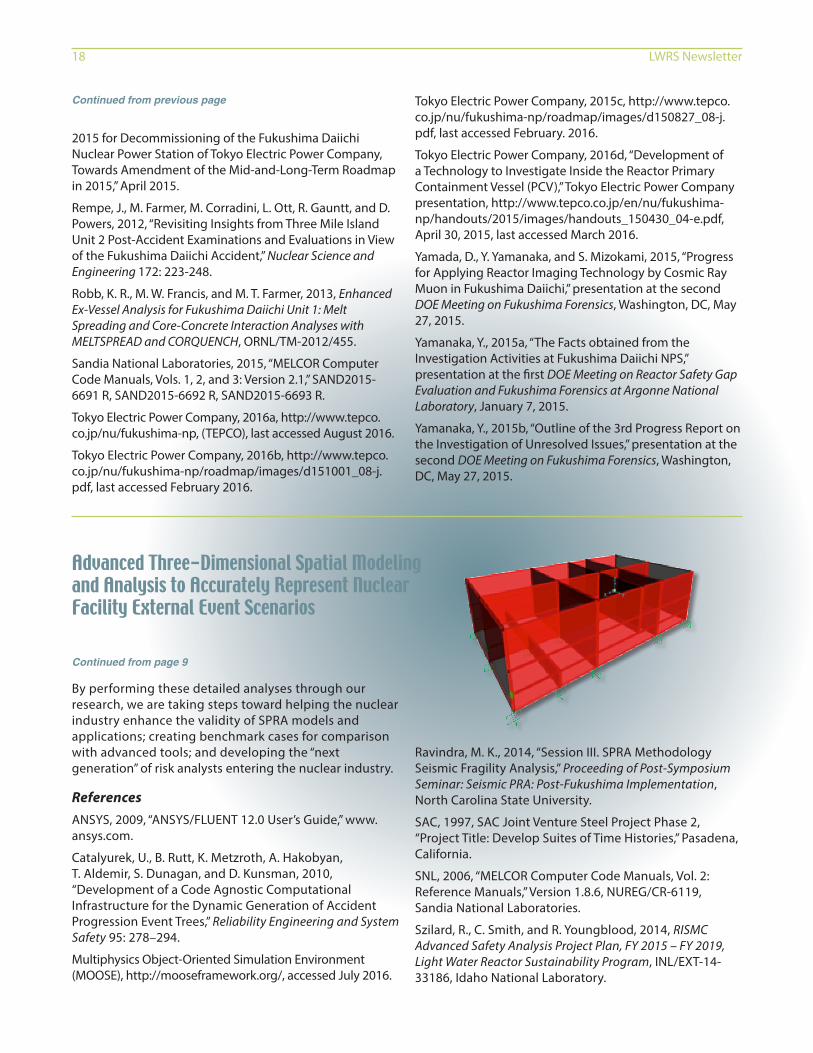
By performing these detailed analyses through our research, we are taking steps toward helping the nuclear industry enhance the validity of SPRA models and applications; creating benchmark cases for comparison with advanced tools; and developing the “next generation” of risk analysts entering the nuclear industry.
ReferencesANSYS, 2009, “ANSYS/FLUENT 12.0 User’s Guide,” www.ansys.com.
Catalyurek, U., B. Rutt, K. Metzroth, A. Hakobyan, T. Aldemir, S. Dunagan, and D. Kunsman, 2010, “Development of a Code Agnostic Computational Infrastructure for the Dynamic Generation of Accident Progression Event Trees,” Reliability Engineering and System Safety 95: 278–294.
Multiphysics Object-Oriented Simulation Environment (MOOSE), http://mooseframework.org/, accessed July 2016.
Ravindra, M. K., 2014, “Session III. SPRA Methodology Seismic Fragility Analysis,” Proceeding of Post-Symposium Seminar: Seismic PRA: Post-Fukushima Implementation, North Carolina State University.
SAC, 1997, SAC Joint Venture Steel Project Phase 2, “Project Title: Develop Suites of Time Histories,” Pasadena, California.
SNL, 2006, “MELCOR Computer Code Manuals, Vol. 2: Reference Manuals,” Version 1.8.6, NUREG/CR-6119, Sandia National Laboratories.
Szilard, R., C. Smith, and R. Youngblood, 2014, RISMC Advanced Safety Analysis Project Plan, FY 2015 – FY 2019, Light Water Reactor Sustainability Program, INL/EXT-14-33186, Idaho National Laboratory.
Continued from page 9
2015 for Decommissioning of the Fukushima Daiichi Nuclear Power Station of Tokyo Electric Power Company, Towards Amendment of the Mid-and-Long-Term Roadmap in 2015,” April 2015.
Rempe, J., M. Farmer, M. Corradini, L. Ott, R. Gauntt, and D. Powers, 2012, “Revisiting Insights from Three Mile Island Unit 2 Post-Accident Examinations and Evaluations in View of the Fukushima Daiichi Accident,” Nuclear Science and Engineering 172: 223-248.
Robb, K. R., M. W. Francis, and M. T. Farmer, 2013, Enhanced Ex-Vessel Analysis for Fukushima Daiichi Unit 1: Melt Spreading and Core-Concrete Interaction Analyses with MELTSPREAD and CORQUENCH, ORNL/TM-2012/455.
Sandia National Laboratories, 2015, “MELCOR Computer Code Manuals, Vols. 1, 2, and 3: Version 2.1,” SAND2015-6691 R, SAND2015-6692 R, SAND2015-6693 R.
Tokyo Electric Power Company, 2016a, http://www.tepco.co.jp/nu/fukushima-np, (TEPCO), last accessed August 2016.
Tokyo Electric Power Company, 2016b, http://www.tepco.co.jp/nu/fukushima-np/roadmap/images/d151001_08-j.pdf, last accessed February 2016.
Tokyo Electric Power Company, 2015c, http://www.tepco.co.jp/nu/fukushima-np/roadmap/images/d150827_08-j.pdf, last accessed February. 2016.
Tokyo Electric Power Company, 2016d, “Development of a Technology to Investigate Inside the Reactor Primary Containment Vessel (PCV),” Tokyo Electric Power Company presentation, http://www.tepco.co.jp/en/nu/fukushima-np/handouts/2015/images/handouts_150430_04-e.pdf, April 30, 2015, last accessed March 2016.
Yamada, D., Y. Yamanaka, and S. Mizokami, 2015, “Progress for Applying Reactor Imaging Technology by Cosmic Ray Muon in Fukushima Daiichi,” presentation at the second DOE Meeting on Fukushima Forensics, Washington, DC, May 27, 2015.
Yamanaka, Y., 2015a, “The Facts obtained from the Investigation Activities at Fukushima Daiichi NPS,” presentation at the first DOE Meeting on Reactor Safety Gap Evaluation and Fukushima Forensics at Argonne National Laboratory, January 7, 2015.
Yamanaka, Y., 2015b, “Outline of the 3rd Progress Report on the Investigation of Unresolved Issues,” presentation at the second DOE Meeting on Fukushima Forensics, Washington, DC, May 27, 2015.
Continued from previous page
Advanced Three-Dimensional Spatial Modeling and Analysis to Accurately Represent Nuclear Facility External Event Scenarios

18 LWRS Newsletter LWRS Newsletter 19
Materials Aging and Degradation• Assessment of Radiation Resistance of Selected Alloys in The ARRM Program Using Ion Irradiation
• Incorporation of copper-rich precipitation model into developed Ni-Mn-Si precipitate development models September 30, 2016 Milestone
• Toughness and High-Temperature Steam Oxidation Evaluations of Advanced Alloys for Core Internals
• Independent Modeling of the Alkali-Silica Reaction: Mock-up Test Block
• Bulk and Distributed Electrical Cable Non-Destructive Examination Methods for Nuclear Power Plant Cable Aging Management Programs
• Development of Computational Tools for Predicting Thermal- and Radiation-Induced Solute Segregation at Grain Boundaries in Fe-based Alloys
• “Evaluation of Advanced Signal Processing Techniques to Improve Detection and Identification of Embedded Defects”
• Mechanical Properties of Model Cast Austenitic Stainless Steels after Thermal Aging for 1500 Hours
• L3 Milestone M3LW-16OR0406015, Provide documentation on the information and states of both the first and second series of neutron irradiate series of B-doped steels for the weld validation testing to begin in FY17
• Precursor Damage Evolution and Stress Corrosion Crack Initiation of Cold-worked Alloy 690 in PWR Primary Water
• Report Detailing Friction Stir Welding Process Development for the Hot Cell Welding System
• Simulation of Concrete Members Affected by Alkali-Silica Reaction with Grizzly
• Status Report and Research Plan for Cables Harvested from Crystal River Unit 3 Nuclear Generating Plan
• Study of High Fluence Radiation-induced Swelling and Hardening under Light Water Reactor Conditions
• Study the Cyclic Plasticity Behavior of 508 LAS under Constant, Variable and Grid-Load-Following Loading Cycles for Fatigue Evaluation of PWR Components
• The Assessment and Validation of Mini-Compact Tension Test Specimen Geometry and Progress in Establishing Technique for Fracture Toughness Master Curves for Reactor Pressure Vessel Steels
• Zion Unit 1 Reactor Pressure Vessel Sample Acquisition: Phase 2 and Phase 3 Status Report
• Identification of Mechanisms to Study Alkali-Silica Reaction Effects on Stressed-Confined Concrete Nuclear Thick Structures
• LWRS contribution to the RILEM benchmark on materials modeling of ASR – Preliminary results
• Materials Aging and Degradation Technical Program Plan 2016
• Progress in Characterizing Naturally-Aged Nuclear Power Plant Cables
• Report on the Installation of the Integrated Welding Hot Cell at ORNL Building 7930
• Update on the High Fluence Advanced Test Reactor – 2 Reactor Pressure Vessel High Fluence Irradiation Project
• Report on the Harvesting and Acquisition of Zion Unit 1 Reactor Pressure Vessel Segments
Risk-Informed Safety Margin Characterization• Data Analysis Approaches for the Risk-Informed Safety Margins Characterization Toolkit
• Enhancements of the RAVEN Code in FY16
• Flooding Fragility Experiments and Prediction
• Loss of Coolant Accident Emergency Core Collant System Evaluation of Risk-informed Margins Management Strategies for a Representative Pressurized Water Reactor
• Lower Length Scale Model Development for Embrittlement of Reactor Pressure Vessel Steel
• Multi-Hazard Advanced Seismic Probabilisitc Risk Assessment Tools and Applications
• Probabilistic Fracture Mechanics of Reactor Pressure Vessels with Populations of Flaws
Recent LWRS Program Reports

20 LWRS Newsletter LWRS Newsletter PB
10-GA50624-22
To submit information or suggestions, contact Cathy J. Barnard at [email protected].
Editor: LauraLee Gourley Designer: David Combs
Risk-Informed Safety Margin Characterization (continued)• RELAP-7 Software Verification and Validation Plan
• Risk-informed Safety Margins Charterization (RISMC) Pathway Technical Program Plan
• Plan to Verify and Validate Multi-Hazard Risk-Informed Margin Management Methods and Tools
• Demonstration of External Hazards Analysis
• Large Scale Laminar Box Test Plan
• Integration of Human Reliability Analysis Models into the Simulation-Based Framework
• RELAP-7 Theory Manual
• Status of the Flooding Fragility Testing Development
Advanced Instrumentation, Information, and Control System Technologies• Advanced Instrumentation Information and Control Systems Technologies Technical Program Plan for FY2017
• Computer-Based Procedures for Field Workers – FY16 Research Activities
• Data Analysis of Different Nondestructive Testing Techniques to Monitor Concrete Structure Degradation due to Alkali-Silica Reaction
• Design Guidance for Computer-Based Procedures for Field Workers
• Development of an Overview Display to Allow Advanced Outage Control Center Management to Quickly Evaluate Outage Status
• Report for Task 8.4: Development of Control Room Layout Recommendations
• Framework for Structural Online Health Monitoring of Aging and Degradation of Secondary Systems due to some Aspects of Erosion
• Baseline Study Methodology for Future Phases of Research on Nuclear Power Plant Control Room Technologies
• A Business Case for Nuclear Plant Control Room Modernization
Reactor Safety Technologies• Status Report on Ex-Vessel Coolability and Water Management
• US Efforts in Support of Examinations at Fukushima Daiichi – 2016 Evaluations
• Reactor Safety Technologies Pathway Technical Program Plan
Recent LWRS Program Reports (continued)
(Click on the report title to download the document.)