News U Can Use - Reliance Mutual Fund · Regulatory Updates in India ... The government has...
20
News U Can Use September 9, 2016
Transcript of News U Can Use - Reliance Mutual Fund · Regulatory Updates in India ... The government has...

News U Can UseSeptember 9, 2016

Slide
The Week that was…
05th September to 09th September
2

Slide
Indian Economy
3
Data from a private survey showed that India’s services activity grew in Aug on the back of
upbeat domestic and foreign demand. The Nikkei India Services Business Activity Index rose
to 54.7 in Aug from 51.9 in Jul. The seasonally adjusted Nikkei India Composite Purchasing
Managers’ Index climbed to 54.6 in Aug from 52.4 in Jul, implying notable improvement in
private sector economic activity.
Data from Society of Indian Automobile Manufacturers showed that sales of passenger
vehicles grew 16.68% to 258,722 units in Aug mainly due to new launches, favourable
monsoons, and implementation of the 7th Pay Commission’s recommendations. Sale of
passenger vehicles in the same period of the previous fiscal stood at 221,743 units. Sales of
two-wheelers also increased 26.32% to 16,48,883 units in Aug. However, sales of
commercial vehicles moderated and grew 1.53% to 52,996 units in the same period.
The President gave its approval to the Constitutional Amendment Bill that would pave the
way for the Goods and Services Tax (GST). According to the finance minister, the
government expects to implement GST from Apr 1, 2017. GST is touted to be the biggest
tax reform since independence, and is expected to create uniform market for seamless
movement of goods and services with one uniform tax rate.

Slide 4
Indian Equity MarketDomestic Equity Market Indices
Indices 09-Sep-16 1 Week Return YTD Return
S&P BSE Sensex 28797.25 0.93% 10.08%
Nifty 50 8866.70 0.65% 11.35%
S&P BSE Mid-Cap 13345.32 0.86% 18.67%
S&P BSE Small-Cap 12861.39 1.72% 7.71%
Source: MFI Explorer
NSE Advance/Decline Ratio
Date Advances Declines Advance/Decline Ratio
06-Sep-16 1033 595 1.74
07-Sep-16 806 816 0.99
08-Sep-16 1004 616 1.63
09-Sep-16 560 1056 0.53Source: NSE
During the week, Indian equity
market touched a record high by
crossing the 29,000 mark for the
first time since Apr 13, 2015. Initially,
market gained after lower than
expected U.S. non-farm payroll data
reduced the possibility of a rate hike
by the U.S. Federal Reserve.
Improved service sector Purchasing
Managers' Index (PMI) data and car
sales data in Aug further helped
gains. Sentiment also got support
after Chinese trade data for Aug
came in better than expected.
Towards the end, gains were pared
following profit booking and lower
cues from other regional peers.
Global sentiment was also impacted
on news that North Korea had
conducted a nuclear test.
RatiosS&P BSE
Sensex Nifty 50
S&P BSE
Mid Cap
S&P BSE
Small Cap
P/E 21.2 24.31 34.35 76.77
P/B 3.04 3.38 2.79 2.2
Dividend Yield 1.35 1.21 1.11 0.85
Source: BSE, NSE Value as on September 9, 2016

Slide 5
Indian Equity Market (contd.)Sectoral Indices
IndicesLast Returns (in %)
Closing 1-Wk 1-Mth
S&P BSE Auto 22844.3 2.40% 5.32%
S&P BSE Bankex 23249.8 1.96% 7.37%
S&P BSE CD 12716.4 1.93% 2.78%
S&P BSE CG 15403.0 2.00% 1.94%
S&P BSE FMCG 8871.76 0.15% 2.53%
S&P BSE HC 16587.1 2.18% 2.30%
S&P BSE IT 10207.1 -1.88% -7.06%
S&P BSE Metal 10080.9 1.39% 3.42%
S&P BSE Oil & Gas 11193.8 1.79% 3.70%Source: Reuters Value as on September 9, 2016
On the BSE sectoral front, barring S&P
BSE IT (-1.88%) and S&P BSE Teck (-
1.44%), all the indices closed in the green.
S&P BSE Realty (5.67%) stood as the top
gainer followed by S&P BSE Auto and
S&P BSE Healthcare.
Auto sector gained after the Society of
Indian Automobile Manufactures reported
strong car sales growth in Aug and revised
its FY16 growth estimate upwards.
Banking sector gained after MSCI raised
its weightage on a couple of banking
stocks.Indian Derivatives Market Review
Nifty Sep 2016 Futures were at 8,903.75 points, a premium of 37.05 points, over the spot
closing of 8,866.70 points. The turnover on NSE’s Futures and Options segment stood at
Rs. 15.58 lakh crore during the week to Sep 9, compared with Rs. 16.31 lakh crore
recorded in the previous week.
The Put-Call ratio stood at 0.93, compared with the previous week’s close of 1.02.
The Nifty Put-Call ratio stood at 1.18, compared with the previous session’s close of 1.13.
.

Slide 6
Domestic Debt Market
Debt Indicators
(%)
Current
Value
1-Wk
Ago
1-Mth
Ago
6-Mth
Ago
Call Rate 6.40 6.37 6.48 6.88
91 Day T-Bill 6.54 6.56 6.56 7.23
07.80% 2021, (5 Yr GOI) 6.91 7.00 7.05 7.84
07.59% 2026, (10 Yr GOI) 7.06 7.12 7.12 7.65
Source: Reuters Value as on September 9, 2016
Bonds yields fell as weaker than
expected U.S. jobs data for Aug
lowered chances of an immediate
interest rate hike by the U.S. Federal
Reserve. Buying interests improved
further following Reserve Bank of
India (RBI)’s announcement of Open
Market Purchase (OMO) program to
ensure sufficient cash in the banking
system.
However, gains were capped as
investors preferred to book profits
and remain cautious ahead of the
release of key macroeconomic data
due next week.
Yield on 10-year benchmark bond
(7.59% GS 2026) fell 6 bps to close
at 7.06% compared with the previous
week’s close of 7.12%. Yields moved
in the range of 7.03% to 7.11% during
the week.
7.04
7.08
7.12
6-Sep 7-Sep 8-Sep 9-Sep
Yie
ld in %
10 -Yr Benchmark Bond ( % )
Source: CCIL

Slide 7
Domestic Debt Market (Spread Analysis)
MaturityG-Sec Yield
(%)
Corporate Yield
(%)
Spread
bps
1 Year 6.91 7.30 39
3 Year 6.95 7.39 44
5 Year 7.10 7.47 38
10 Year 7.24 7.57 33
Source: Reuters Value as on September 9, 2016
Yields on gilt securities fell across the
maturities in the range of 2 to 8 bps.
Maximum decline was seen on the 4-, 7-,
and 8-year papers, while minimum fall was
noticed on the 14-year paper.
Corporate bond yields dropped across the
curve in the range of 5 bps to 9 bps.
Difference in spread between AAA
corporate bond and gilt contracted across
the segments up to 5 bps, barring 4- and 5-
year papers, which expanded up to 2 bps.
-8
-4
0
6.40
6.90
7.40
3 Mths 6 Mths 1 Yr 5 Yrs 10 Yrs 20 Yrs 30 Yrs
India Yield Curve Shift (%) (W-o-W)
Change in bps 09-Sep-16 02-Sep-16
Yie
ldin
%C
hange
in b
ps
Source: Reuters

Slide 8
Regulatory Updates in India According to the chief economic advisor, Universal Basic Income may feature in the next
economic survey. Universal Basic Income is a single unconditional income that lowers
government efforts to ensure delivery of individual social security schemes. The official
added that Universal Basic Income promises every citizen unconditional cash transfer in
place of the many benefits like in case of health and subsidies.
The Modified Special Incentive Package Scheme or M-SIPS is set for a major overhaul
after the Ministry of Finance raised concerns regarding lack of clarity in the quantum of
subsidy outgo under the given framework till 2020. The M-SIPS policy aims to give
incentives to companies for manufacturing locally by providing them a 20% to 25% subsidy
on their capital expenditure.
The government has tightened rules for appointing merchant bankers and brokers for the
sale of its stake in blue chip companies held through the Specified Undertaking of Unit Trust
of India (SUUTI). According to the new rules, the selected merchant bankers will have to
submit a list of institutional and other major investors at the domestic and international level
that they will approach for proposed stake sale in SUUTI. However, merchant bankers can
enter into a competing transaction with a private company provided they notify SUUTI as
and when they enter into any conflict of interest situation.

Slide 9
Regulatory Updates in India (contd..) The Department of Public Enterprises has come out with timelines for sale of land, disposal
of movable assets, and retrenchment of employees who have not opted for voluntary
retirement. The move comes amid concerns about excessive delays and additional time
taken for closing down sick or loss-making central public sector enterprises (CPSEs) where
decisions for closure were taken a long time ago. According to the timelines, the
retrenchment of employees of such CPSEs who have not opted for VRS has to be
completed within four months from the ‘Zero Date’. Wages, salaries, and other statutory
dues have to be settled within three months from the ‘Zero Date’. Zero Date is the date of
issue of minutes of approval for closure of sick or loss-making CPSEs by the Cabinet
Committee of Economic Affairs.
The government is considering easing rules in the goods and services tax (GST) framework
for banks, NBFCs, and insurance companies. In the present GST framework, banking and
financial companies need to register all their branches in a state separately and treat them
as separate entities. There are concerns that under such a framework, calculating GST in
each transaction in every branch would be very cumbersome and the compliance cost for
banks and other financial companies will increase. The government is planning to ease
these concerns by introducing single registration and centralised audit for banks and
NBFCs.

Slide 10
Global News/Economy According to the Institute for Supply Management, U.S. services Purchasing Managers
Index (PMI) plunged to 51.4 in Aug 2016 from 55.5 in Jul 2016. The index fell to its lowest
level since Feb 2010.
According a report released by the Labor Department, initial jobless claims in the U.S.
surprisingly fell by 4,000 to 2,59,000, in the week to Sep 3 from the previous week's
unrevised level of 263,000.
According to survey figures from Markit/Chartered Institute of Procurement & Supply, the
U.K. services PMI surged better than forecast at 52.9 in Aug 2016 from 47.4 in Jul 2016.
The European Central Bank (ECB) kept interest rates unchanged in its policy meeting and
retained its asset purchases programme. Thus, the refinance rate, deposit rate, and the
marginal lending facility rate stood at 0%, (-) 0.40%, and 0.25%, respectively.
According to survey figures from Markit Economics, Japan's services PMI dropped to 49.6 in
Aug 2016 from 50.4 in Jul 2016. Index below 50 indicates negative growth or contraction.
The Nikkei composite output index (manufacturing + services) also fell to 49.8 in Aug.

Slide 11
Global Equity MarketsGlobal Indices
Indices 09-Sep -161-Week
Return
YTD
Return
Dow Jones 18085.45 -2.20% 5.46%
Nasdaq 100 4681.535 -2.44% 4.08%
FTSE 100 6776.95 -1.71% 11.22%
DAX Index 10573.44 -1.03% 2.82%
Nikkei Average 16965.76 0.24% -8.05%
Straits Times 2873.33 2.48% 1.32%
Source: Reuters
U.S.
U.S. markets rose initially after
weaker than expected U.S. jobs data
for Aug and a slowdown in U.S.
service sector growth in Aug, raised
hopes that the U.S. Federal Reserve
could refrain from increasing interest
rates in Sep.
However, the trend reversed after the
European Central Bank announced it
had decided not to change its key
interest rates.
Europe
European markets rose initially after weaker than expected U.S. jobs report for Aug led to
expectations that the Fed could withhold plans to increase interest rates later during the
month. However, the trend reversed when oil prices started to move down. North Korea’s
nuclear test, weak economic data from France and Germany contributed to an overall
pessimism.
Asia
Asian markets displayed a mixed trend over the week, with bourses initially moving up.
Weaker than expected U.S. jobs data for Aug brought relief to investors apprehensive
about an interest rate hike by the U.S. Federal Reserve.
Slide 12
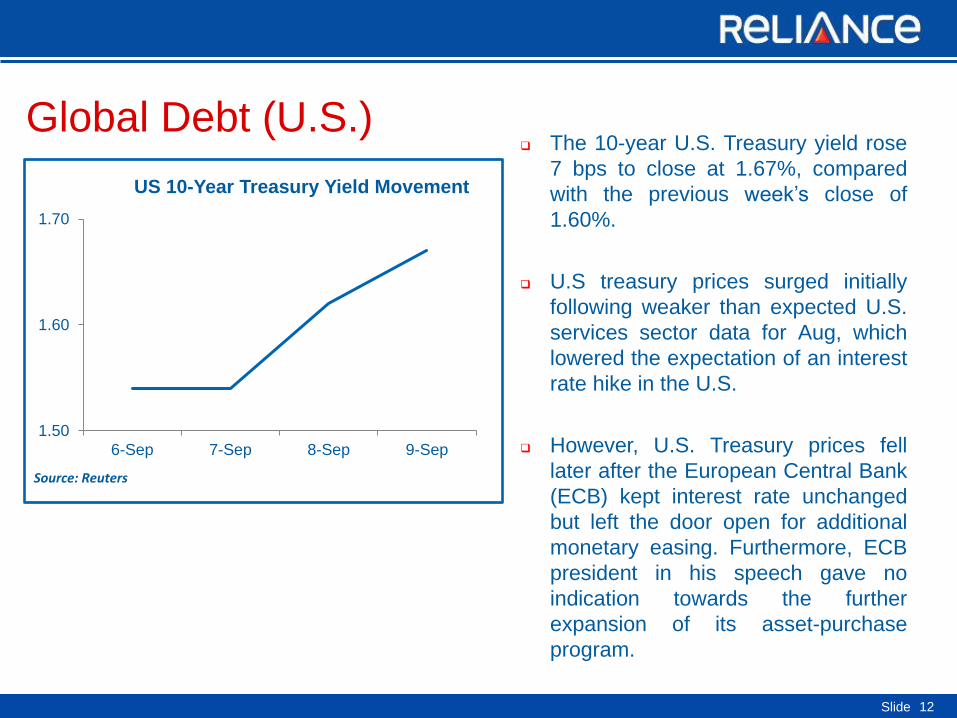
Global Debt (U.S.) The 10-year U.S. Treasury yield rose
7 bps to close at 1.67%, compared
with the previous week’s close of
1.60%.
U.S treasury prices surged initially
following weaker than expected U.S.
services sector data for Aug, which
lowered the expectation of an interest
rate hike in the U.S.
However, U.S. Treasury prices fell
later after the European Central Bank
(ECB) kept interest rate unchanged
but left the door open for additional
monetary easing. Furthermore, ECB
president in his speech gave no
indication towards the further
expansion of its asset-purchase
program.
1.50
1.60
1.70
6-Sep 7-Sep 8-Sep 9-Sep
US 10-Year Treasury Yield Movement
Source: Reuters

Slide 13
Commodities Market
Performance of various commodities
Commodities Last Closing 1-Week Ago
Brent Crude($/Barrel) 48.5 45.6
Gold ($/Oz) 1327.7 1324.7
Gold (Rs/10 gm) 31191.0 30761.0
Silver ($/Oz) 19.0 19.4
Silver (Rs/Kg) 45937.0 44411.0
Source: Reuters Value as on September 9, 2016
Gold
Gold prices gained amid easing
concerns over an imminent rate hike by
the U.S. Federal Reserve after U.S.
nonfarm payroll data for Aug came in
below market expectations.
Furthermore, weak U.S. service PMI
data (official survey) for the same
period affirmed such belief.
Crude
Optimism over significant breakthrough
in the upcoming OPEC meeting on
stabilization of oil markets, boosted
brent crude prices during the week.
Investors cheered when Saudi Arabia
and Russia joined hands for the
endeavour.
Baltic Dry Index
The Baltic Dry Index went up during the
week owing to better capesize and
panamax activities.
9.00
10.00
11.00
12.00
10-Aug-16 20-Aug-16 30-Aug-16 9-Sep-16
Global Commodity Movement
Gold Spot ($/Oz) Silver Spot ($/Oz) Brent ($/bbl)
Glo
balC
om
modity P
rices
Rebased to 10
Source: Reuters
6.47%
0.23%
-1.95%

Slide 14
Currencies Markets
Movement of Rupee vs Other Currencies
Currency Last Closing 1-Wk Ago
US Dollar 66.55 66.84
Pound Sterling 88.59 88.70
EURO 75.02 74.80
JPY(per 100 Yen) 65.13 64.52
Source: RBI Figures in INR , Value as on September 9, 2016
Rupee
The rupee strengthened against the
greenback following gains in the domestic
equity market and weak U.S. data for Aug.
Euro
The euro strengthened against the
greenback following weak U.S. service
sector data for Aug, which lowered the
expectation for a near-term interest rate
increase from the U.S. Federal Reserve
(Fed).
Pound
The pound initially jumped after U.S.
economy's service sector expanded at a
slower pace in Aug. However, gains were
reversed following ECB’s decision to
maintain interest rates in its monetary
policy review.
Yen
The yen rose against the greenback after
the Bank of Japan Governor did not give
clear signal about further monetary easing.
9.70
9.90
10.10
10.30
10-Aug-16 20-Aug-16 30-Aug-16 9-Sep-16
USD GBP Euro JPYSource: RBI
Cu
rren
cy P
rice
s (
in t
erm
s o
f IN
R)
Rebased to 10 Currency Movement
-0.13%
0.30%
0.95%
-0.44%

Slide
The Week that was…
September 5 to September 9
15

Slide 16
The Week that was (Sep 5 – Sep 9)Date Events Present Value Previous Value
Monday,
September 05, 2016
Markit Japan Services PMI (AUG) 49.6 50.4
China Caixin PMI Composite (AUG) 52.1 51.7
U.K. Markit/CIPS Composite PMI (AUG) 52.9 47.4
Euro-Zone Sentix Inestor Confidence (SEP) 5.6 4.2
Euro-Zone Retail Sales (YoY) (JUL) 2.90% 1.70%
Tuesday,
September 06, 2016
U.S. ISM Non-Manufacturing Composite (AUG) 51.4 55.5
Germany Factory Orders s.a. (MoM) (Jul) 0.20% -0.30%
Euro-Zone Gross Domestic Product s.a. (YoY) (2Q F) 1.60% 1.60%
Wednesday,
September 07, 2016
Japan Leading Index (JUL P) 100 100.7
U.K. Industrial Production (YoY) (JUL) 2.10% 1.40%
Thursday,
September 08, 2016
European Central Bank Rate Decision (SEP 8) -0.40% -0.40%
U.S. Initial Jobless Claims (Sep 2) 259K 263K
Friday,
September 09, 2016
China Consumer Price Index (YoY) (AUG) -0.80% -1.70%
U.S. Wholesale Inventories (Jul) 0.00% 0.30%

Slide 17
The Week Ahead…
September 12 to September 16

Slide 18
The Week AheadDay Event
Monday,
September 12, 2016
Japan Machine Tool Orders (YoY) (Aug) Preliminary
U.K. CB Leading Economic Index (Aug)
India Index of Industrial Production (Jul)
Tuesday,
September 13, 2016
China Retail Sales (YoY) (Aug)
U.K. Consumer Price Index (MoM) (Aug)
China Industrial Production (YoY) (Aug
Wednesday,
September 14, 2016
India Consumer Price Inflation (Aug)
India Wholesale Price Inflation (Aug)
Japan Industrial Production (MoM) (Jul)
Thursday,
September 15, 2016
U.S. Retail Sales (MoM) (Aug)
Bank of England Interest Rate Decision
U.S. Initial Jobless Claims (Sep 9)
Friday,
September 16, 2016
U.S. Consumer Price Index (MoM) (Aug)
U.S. Reuters/Michigan Consumer Sentiment Index (Sep) PRELIMINAR

Slide 19
DisclaimerThe information herein is meant only for general reading purposes and contains all factual and statistical information pertaining to Industry and markets
which have been obtained from independent third party sources and which are deemed to be reliable. The information provided cannot be considered
as guidelines, recommendations or as a professional guide for the readers. It may be noted that since Reliance Nippon Life Asset Management
Company Limited (RNLAM) (formerly Reliance Capital Asset Management Limited) has not independently verified the accuracy or authenticity of such
information or data, or for that matter the reasonableness of the assumptions upon which such data and information has been processed or arrive data;
RNLAM does not in any manner assures the accuracy or authenticity of such data and information. Some of the statements & assertions contained in
these materials may reflect RNLAM’s views or opinions, which in turn may have been formed on the basis of such data or information. The Sponsor(s),
the Investment Manager, the Trustee or any of their respective directors, employees, affiliates or representatives do not assume any responsibility for,
or warrant the accuracy, completeness, adequacy and reliability of such data or information. Whilst no action has been solicited based upon the
information provided herein, due care has been taken to ensure that the facts are accurate and opinions given are fair and reasonable, to the extent
possible. This information is not intended to be an offer or solicitation for the purchase or sale of any financial product or instrument. Recipients of this
information should rely on information/data arising out of their own investigations. Before making any investments, the readers are advised to seek
independent professional advice, verify the contents in order to arrive at an informed investment decision. None of the Sponsor(s), the Investment
Manager, the Trustee, their respective directors, employees, affiliates or representatives shall be liable in any way for any direct, indirect, special,
incidental, consequential, punitive or exemplary damages, including on account of lost profits arising from the information contained in this material.
All information contained in this document has been obtained by ICRA Online Limited from sources believed by it to be accurate and reliable. Although
reasonable care has been taken to ensure that the information herein is true, such information is provided ‘as is’ without any warranty of any kind, and
ICRA Online Limited or its affiliates or group companies and its respective directors, officers, or employees in particular, makes no representation or
warranty, express or implied, as to the accuracy, suitability, reliability, timelines or completeness of any such information. All information contained
herein must be construed solely as statements of opinion, and ICRA Online Limited, or its affiliates or group companies and its respective directors,
officers, or employees shall not be liable for any losses or injury, liability or damage of any kind incurred from and arising out of any use of this
document or its contents in any manner, whatsoever. Opinions expressed in this document are not the opinions of our holding company, ICRA Limited
(ICRA), and should not be construed as any indication of credit rating or grading of ICRA for any instruments that have been issued or are to be issued
by any entity.

Thank you