News Release Communiqué de Presse...Paris, October 31, 2013 Third quarter and first nine months...
38
1 Paris, October 31, 2013 Third quarter and first nine months 2013 results 1 3Q13 Change vs 3Q12 9M13 Change vs 9M12 Adjusted net income 2 - in billion euros (B€) 2.7 -19% 8.3 -10% - in billion dollars (B$) 3.6 -14% 10.9 -8% - in euros per share 1.19 -19% 3.65 -11% - in dollars per share 1.58 -15% 4.80 -8% Net income 3 of 2.8 B€ in 3Q13 and 6.8 B€ in the first nine months of 2013 Net-debt-to-equity ratio of 23.0% on September 30, 2013 Hydrocarbon production of 2,299 kboe/d in 3Q13 Interim dividend for 3Q13 of 0.59 €/share payable in March 2014 4 Commenting on the results, Chairman and CEO Christophe de Margerie said : « With adjusted net income of 2.7 billion euros, Total reports solid third quarter performance, slightly better than the second quarter, and a stronger financial position. In the Upstream, significant progress was made in the quarter with the start-up of Kashagan in Kazahkstan, of Ekofisk South in Norway and the launch of major projects, including the Fort Hills mining project in Canada that will contribute to our growth for several decades. In addition, by seizing a unique opportunity to take a share of the most prolific pre-salt discovery in the world, Total starts a new chapter of its story in Brazil as part of the consortium in charge of developing the giant Libra field. So, the Group is improving its outlook for sustainable post-2017 production growth under terms consistent with its strict return criteria, while confirming its commitment to reduce near-term investment. In the downstream segments, the quality of the results this quarter, given the poor environment for refining, clearly shows the effectiveness of the ongoing restructuring program. The successful start-up of the first units of the Satorp refinery in Saudi Arabia illustrates the capacity of the Group and its teams to progress in a responsible and sustainable manner in the fulfillment of its objectives. » 1 Following the application of revised accounting standard IAS 19 effective January 1, 2013, the information for 2011 and 2012 has been restated; however, the impact on such restated results is not significant (see note 1 of the notes to the consolidated financial statements). 2 Definition of adjusted results on page 2 – dollar amounts represent euro amounts converted at the average €-$ exchange rate for the period: 1.3242 $/€ in 3Q13, 1.2502 $/€ in 3Q12, 1.3062 $/€ in 2Q13, 1.3171 $/€ in 9M13, and 1.2808 $/€ in 9M12. 3 Group share. 4 The ex-dividend date for the interim dividend will be March 24, 2014, and the payment date will be March 27, 2014. 2, place Jean Millier Arche Nord Coupole/Regnault 92 400 Courbevoie France Tel. : (33) 1 47 44 58 53 Fax : (33) 1 47 44 58 24 Martin DEFFONTAINES Karine KACZKA Magali PAILHE Patrick GUENKEL Robert HAMMOND (U.S.) Tel. : (1) 713-483-5070 Fax : (1) 713-483-5629 TOTAL S.A. Capital 5 941 838 402,50 euros 542 051 180 R.C.S. Nanterre www.total.com Communiqué de Presse News Release
Transcript of News Release Communiqué de Presse...Paris, October 31, 2013 Third quarter and first nine months...

1
TOTAL 2, place de la Coupole La Défense 6 92 400 Courbevoie France Tel. : 33 (1) 47 44 58 53 Fax : 33 (1) 47 44 58 24 Jérôme SCHMITT Philippe HERGAUX Sandrine SABOUREAU Laurent KETTENMEYER Robert HAMMOND (U.S.) Tel. : (1) 201 626 3500 Fax : (1) 201 626 4004 TOTAL S.A Capital 5 981 907 382 euros 542 051 180 R.C.S. Nanterre www.total.com
Paris, October 31, 2013
Third quarter and first nine months 2013 results1
3Q13 Change vs 3Q12
9M13 Change vs 9M12
Adjusted net income2 - in billion euros (B€) 2.7 -19% 8.3 -10%
- in billion dollars (B$) 3.6 -14% 10.9 -8% - in euros per share 1.19 -19% 3.65 -11% - in dollars per share 1.58 -15% 4.80 -8%
Net income3 of 2.8 B€ in 3Q13 and 6.8 B€ in the first nine months of 2013
Net-debt-to-equity ratio of 23.0% on September 30, 2013
Hydrocarbon production of 2,299 kboe/d in 3Q13 Interim dividend for 3Q13 of 0.59 €/share payable in March 20144 Commenting on the results, Chairman and CEO Christophe de Margerie said : « With adjusted net income of 2.7 billion euros, Total reports solid third quarter performance, slightly better than the second quarter, and a stronger financial position. In the Upstream, significant progress was made in the quarter with the start-up of Kashagan in Kazahkstan, of Ekofisk South in Norway and the launch of major projects, including the Fort Hills mining project in Canada that will contribute to our growth for several decades. In addition, by seizing a unique opportunity to take a share of the most prolific pre-salt discovery in the world, Total starts a new chapter of its story in Brazil as part of the consortium in charge of developing the giant Libra field. So, the Group is improving its outlook for sustainable post-2017 production growth under terms consistent with its strict return criteria, while confirming its commitment to reduce near-term investment. In the downstream segments, the quality of the results this quarter, given the poor environment for refining, clearly shows the effectiveness of the ongoing restructuring program. The successful start-up of the first units of the Satorp refinery in Saudi Arabia illustrates the capacity of the Group and its teams to progress in a responsible and sustainable manner in the fulfillment of its objectives. »
1 Following the application of revised accounting standard IAS 19 effective January 1, 2013, the information for 2011 and 2012 has been restated; however, the impact on such restated results is not significant (see note 1 of the notes to the consolidated financial statements). 2 Definition of adjusted results on page 2 – dollar amounts represent euro amounts converted at the average €-$ exchange rate for the period: 1.3242 $/€ in 3Q13, 1.2502 $/€ in 3Q12, 1.3062 $/€ in 2Q13, 1.3171 $/€ in 9M13, and 1.2808 $/€ in 9M12. 3 Group share. 4 The ex-dividend date for the interim dividend will be March 24, 2014, and the payment date will be March 27, 2014.
2, place Jean Millier Arche Nord Coupole/Regnault 92 400 Courbevoie France Tel. : (33) 1 47 44 58 53 Fax : (33) 1 47 44 58 24 Martin DEFFONTAINES Karine KACZKA Magali PAILHE Patrick GUENKEL Robert HAMMOND (U.S.) Tel. : (1) 713-483-5070 Fax : (1) 713-483-5629 TOTAL S.A. Capital 5 941 838 402,50 euros 542 051 180 R.C.S. Nanterre www.total.com
Com
mun
iqué
de
Pres
se
New
s Rel
ease

2
TOTAL 2, place de la Coupole La Défense 6 92 400 Courbevoie France Tel. : 33 (1) 47 44 58 53 Fax : 33 (1) 47 44 58 24 Jérôme SCHMITT Philippe HERGAUX Sandrine SABOUREAU Laurent KETTENMEYER Robert HAMMOND (U.S.) Tel. : (1) 201 626 3500 Fax : (1) 201 626 4004 TOTAL S.A Capital 5 981 907 382 euros 542 051 180 R.C.S. Nanterre www.total.com
Key figures 5
3Q13 2Q13 3Q12 3Q13
vs 3Q12
in millions of euros except earnings per share and number of shares 9M13 9M12
9M13 vs
9M12
46,686 46,973 49,890 -6% Sales 141,789 150,193 -6%
5,146 5,084 6,561 -22% Adjusted operating income from business segments 16,009 19,047 -16%
2,989 3,025 3,709 -19% Adjusted net operating income from business segments 9,128 10,031 -9%
2,329 2,325 2,897 -20% Upstream 7,120 8,459 -16%
330 370 567 -42% Refining & Chemicals 1,083 1,009 +7%
330 330 245 +35% Marketing & Services 925 563 +64%
2,716 2,699 3,364 -19% Adjusted net income 8,278 9,235 -10%
1.19 1.19 1.48 -19% Adjusted fully-diluted earnings per share (euros) 3.65 4.08 -11%
2,275 2,274 2,268 - Fully-diluted weighted-average shares (millions) 2,269 2,265 -
2,761 2,537 3,082 -10% Net income (Group share) 6,835 8,268 -17%
5,852 5,712 5,416 +8% Investments6 17,548 16,320 +8%
2,188 1,334 1,635 +34% Divestments 4,138 4,305 -4%
3,664 4,378 3,781 -3% Net investments 13,410 12,015 +12%
6,954 3,706 5,163 +35% Cash flow from operations 14,378 16,597 -13%
5,421 5,019 6,058 -11% Adjusted cash flow from operations 15,649 15,921 -2%
3Q13 2Q13 3Q12 3Q13
vs 3Q12
in millions of dollars7 except earnings per share and number of shares 9M13 9M12
9M13 vs
9M12
61,822 61,356 62,372 -1% Sales 186,750 192,367 -3%
6,814 6,641 8,203 -17% Adjusted operating income from business segments 21,085 24,395 -14%
3,958 3,951 4,637 -15% Adjusted net operating income from business segments 12,022 12,848 -6%
3,084 3,037 3,622 -15% Upstream 9,378 10,834 -13%
437 483 709 -38% Refining & Chemicals 1,426 1,292 +10%
437 431 306 +43% Marketing & Services 1,218 721 +69%
3,597 3,525 4,206 -14% Adjusted net income 10,903 11,828 -8%
1.58 1.55 1.85 -15% Adjusted fully-diluted earnings per share (dollars) 4.80 5.22 -8%
2,275 2,274 2,268 - Fully-diluted weighted-average shares (millions) 2,269 2,265 -
3,656 3,314 3,853 -5% Net income (Group share) 9,002 10,590 -15%
7,749 7,461 6,771 +14% Investments6 23,112 20,903 +11%
2,897 1,742 2,044 +42% Divestments 5,450 5,514 -1%
4,852 5,719 4,727 +3% Net investments 17,662 15,389 +15%
9,208 4,841 6,455 +43% Cash flow from operations 18,937 21,257 -11%
7,178 6,556 7,574 -5% Adjusted cash flow from operations 20,611 20,392 +1%
5 Adjusted results are defined as income using replacement cost, adjusted for special items, excluding the impact of changes for fair value. Adjusted cash flow from operations is defined as cash flow from operations before changes in working capital at replacement cost; adjustment items are on page 18 and the inventory valuation effect is explained on page 15. 6 Including acquisitions. 7 Dollar amounts represent euro amounts converted at the average €-$ exchange rate for the period.

3
TOTAL 2, place de la Coupole La Défense 6 92 400 Courbevoie France Tel. : 33 (1) 47 44 58 53 Fax : 33 (1) 47 44 58 24 Jérôme SCHMITT Philippe HERGAUX Sandrine SABOUREAU Laurent KETTENMEYER Robert HAMMOND (U.S.) Tel. : (1) 201 626 3500 Fax : (1) 201 626 4004 TOTAL S.A Capital 5 981 907 382 euros 542 051 180 R.C.S. Nanterre www.total.com
Highlights since the beginning of the third quarter 2013
• Started up the Kashagan field in Kazakhstan and the Ekofisk South field in the Norwegian North Sea
• Launched the Fort Hills mining project in Canada, the Incahuasi gas and condensate field in Bolivia and the offshore Vega Pleyade field in Argentina
• Obtained 20% of the giant Libra oil field, in the Santos Basin in Brazil
• Discovered oil and gas on the Harir block in Kurdistan in Iraq
• Acquired offshore exploration acreage in South Africa
• Completed the sales of TIGF, the natural gas transportation and storage subsidiary in France, and the E&P assets in Trinidad & Tobago
• Announced the modernization project for the Carling petrochemicals platform in France
• Shipped first cargoes of refined products from the Satorp refining and petrochemicals platform in Jubail, Saudi Arabia
• Launched SunPower’s Project Salvador, the construction of the largest solar power plant in Chile
Third quarter 2013 results
> Operating income from business segments
In the third quarter 2013, the Brent price averaged 110.3 $/b, an increase of 1% compared to the third quarter 2012. The European refining margin indicator (ERMI) averaged 10.6 $/t, a decrease of 79% compared to the third quarter 2012. The environment for petrochemicals improved compared to the same period last year. The euro-dollar exchange rate averaged 1.32 $/€ in the third quarter 2013 compared to 1.25 $/€ in the third quarter 2012. In this context, the adjusted operating income8 from business segments was 5,146 M€, a decrease of 22% compared to the third quarter 2012. Expressed in dollars, the decrease was 17%. The effective tax rate9 for the business segments was 54.8% in the third quarter 2013 compared to 53.6% in the third quarter 2012. Adjusted net operating income from the business segments was 2,989 M€ compared to 3,709 M€ in the third quarter 2012, a decrease of 19%. Expressed in dollars, adjusted net operating income from the business segments was 4.0 billion dollars (B$), a decrease of 15% compared to the third quarter 2012. This decrease is mainly due to a lower contribution from Upstream, which reflects an unfavorable production mix and higher exploration charges, and a lower contribution from Refining & Chemicals, partially offset by robust performance at Marketing & Services.
8 Special items affecting operating income from the business segments had a negative impact of 772 M€ in 3Q13 and a negative impact of 1,362 M€ in 3Q12. 9 Defined as: (tax on adjusted net operating income) / (adjusted net operating income - income from equity affiliates - dividends received from investments + tax on adjusted net operating income).

4
TOTAL 2, place de la Coupole La Défense 6 92 400 Courbevoie France Tel. : 33 (1) 47 44 58 53 Fax : 33 (1) 47 44 58 24 Jérôme SCHMITT Philippe HERGAUX Sandrine SABOUREAU Laurent KETTENMEYER Robert HAMMOND (U.S.) Tel. : (1) 201 626 3500 Fax : (1) 201 626 4004 TOTAL S.A Capital 5 981 907 382 euros 542 051 180 R.C.S. Nanterre www.total.com
> Net income (Group share)
Adjusted net income was 2,716 M€ in the third quarter 2013 compared to 3,364 M€ in the third quarter 2012, a decrease of 19%. Expressed in dollars, adjusted net income decreased by 14%.
Adjusted net income excludes the after-tax inventory effect, the effect of changes in fair value, and special items10:
• The after-tax inventory effect had a negative impact on net income of 24 M€ in the third quarter 2013 and a positive impact on net income of 524 M€ in the third quarter 2012.
• Changes in fair value had a negative impact on net income of 7 M€ in the third quarter 2013 and a negative impact on net income of 6 M€ the third quarter 2012.
• Special items had a positive impact on net income of 76 M€ in the third quarter 2013, comprised mainly of the gain on the sale of TIGF in France, essentially offset by impairments, including assets in the Barnett field in the United States and in Syria. In the third quarter 2012, special items had a negative impact on net income of 800 M€.
Net income (Group share) was 2,761 M€ compared to 3,082 M€ in the third quarter 2012. The effective tax rate for the Group was 55.8% in the third quarter 2013. Adjusted fully-diluted earnings per share, based on 2,275 million fully-diluted weighted-average shares, decreased by 19% to €1.19 from €1.48 in the third quarter 2012. Expressed in dollars, adjusted fully-diluted earnings per share decreased by 15% to $1.58.
> Investments – Divestments11
Investments, excluding acquisitions and including changes in non-current loans, were 5.0 B€ (6.6 B$) in the third quarter 2013 compared to 4.9 B€ (6.1 B$) in the third quarter 2012. Acquisitions were 549 M€ in the third quarter 2013, comprised essentially of the bonus for exploration licenses in South Africa and Brazil and the carry on the Utica gas and condensate field in the United States. Asset sales in the third quarter 2013 were 1,849 M€, comprised essentially of the sale of TIGF in France and the Group’s exploration and production assets in Trinidad & Tobago. Net investments12 were 3.7 B€ (4.9 B$) in the third quarter 2013 compared to 3.8 B€ (4.7 B$) in the third quarter 2012.
10 Adjustment items explained on page 15. 11 Detail shown on page 19. 12 Net investments = investments including acquisitions and changes in non-current loans – asset sales.

5
TOTAL 2, place de la Coupole La Défense 6 92 400 Courbevoie France Tel. : 33 (1) 47 44 58 53 Fax : 33 (1) 47 44 58 24 Jérôme SCHMITT Philippe HERGAUX Sandrine SABOUREAU Laurent KETTENMEYER Robert HAMMOND (U.S.) Tel. : (1) 201 626 3500 Fax : (1) 201 626 4004 TOTAL S.A Capital 5 981 907 382 euros 542 051 180 R.C.S. Nanterre www.total.com
> Cash flow
Cash flow from operations was 6,954 M€ in the third quarter 2013, an increase of 35% compared to 5,163 M€ in the third quarter 2012. The increase was due mainly to favorable changes in working capital. Adjusted cash flow from operations13 was 5,421 M€, a decrease of 11% compared to the third quarter 2012. Expressed in dollars, adjusted cash flow from operations was 7.2 B$, a decrease of 5%. The Group’s net cash flow14
was 3,290 M€ in the third quarter 2013 compared to 1,382 M€ in the third quarter 2012. Expressed in dollars, net cash flow was 4.4 B$ in the third quarter 2013 compared to 1.7 B$ in the third quarter 2012, reflecting essentially the favorable evolution of changes in working capital.
13 Cash flow from operations at replacement cost before changes in working capital. 14 Net cash flow = cash flow from operations - net investments.

6
TOTAL 2, place de la Coupole La Défense 6 92 400 Courbevoie France Tel. : 33 (1) 47 44 58 53 Fax : 33 (1) 47 44 58 24 Jérôme SCHMITT Philippe HERGAUX Sandrine SABOUREAU Laurent KETTENMEYER Robert HAMMOND (U.S.) Tel. : (1) 201 626 3500 Fax : (1) 201 626 4004 TOTAL S.A Capital 5 981 907 382 euros 542 051 180 R.C.S. Nanterre www.total.com
Results for the first nine months 2013
> Operating income from business segments
Compared to the first nine months of 2012, the average Brent price decreased by 3% to 108.5 $/b in the first nine months of 2013. The European refining margin indicator (ERMI) averaged 20.5 $/t in the first nine months of 2013 compared to 36.7 $/t in the first nine months of 2012, a decrease of 44%. In contrast, the petrochemicals environment on average improved, particularly in Asia and the United States, between the two periods. The euro-dollar exchange rate averaged 1.32 $/€ compared to 1.28 $/€ in the first nine months of 2012. In this context, the adjusted operating income from the business segments was 16,009 M€, or a decrease of 16% compared to the first nine months of 201215. The effective tax rate for the business segments was 55.6% in the first nine months of 2013 compared to 56.5% in the first nine months of 2012. Adjusted net operating income from the business segments was 9,128 M€ compared to 10,031 M€ in the first nine months of 2012, a decrease of 9%. Expressed in dollars, adjusted net operating income from the business segments decreased by 6%. This decrease is mainly due to a lower contribution from Upstream, which was partially offset by better performance in the downstream segments.
> Net income (Group share)
Adjusted net income decreased by 10% to 8,278 M€ from 9,235 M€ in the first nine months of 2012. Expressed in dollars, adjusted net income decreased by 8%. Adjusted net income excludes the after-tax inventory effect, special items and the effect of changes in fair value16:
• The after-tax inventory effect had a negative impact on net income of 475 M€ in the first nine months of 2013 compared to a positive impact of 155 M€ in the first nine months of 2012.
• Changes in fair value had a negative impact on net income of 30 M€ in the first nine months of 2013 compared to a negative impact of 17 M€ in the first nine months of 2012.
• Special items had a negative impact on net income of 938 M€ in the first nine months of 2013, comprised mainly of the loss on the sale of the Voyageur upgrader project in Canada and the impairment of assets in the Barnett field in the United States, partially offset by the gain on the sale of TIGF in France and Upstream assets in Italy. Special items had a negative impact on net income of 1,105 M€ in the first nine months of 2012.
Net income (Group share) was 6,835 M€ compared to 8,268 M€ in the first nine months of 2012. On September 30, 2013, there were 2,274 million fully-diluted shares compared to 2,270 million fully-diluted shares on September 30, 2012. Adjusted fully-diluted earnings per share, based on 2,269 million fully-diluted shares, were €3.65, a decrease of 11% compared to the first nine months of 2012. Expressed in dollars, adjusted fully-diluted earnings per share were $4.80 compared to $5.22 in the first nine months of 2012, a decrease of 8%. 15 Special items affecting operating income from the business segments had a negative impact of 815 M€ in the first nine months of 2013 and a negative impact of 1,428 M€ in the first nine months of 2012. 16 Adjustment items explained on page 15.

7
TOTAL 2, place de la Coupole La Défense 6 92 400 Courbevoie France Tel. : 33 (1) 47 44 58 53 Fax : 33 (1) 47 44 58 24 Jérôme SCHMITT Philippe HERGAUX Sandrine SABOUREAU Laurent KETTENMEYER Robert HAMMOND (U.S.) Tel. : (1) 201 626 3500 Fax : (1) 201 626 4004 TOTAL S.A Capital 5 981 907 382 euros 542 051 180 R.C.S. Nanterre www.total.com
> Investments – divestments17
Investments, excluding acquisitions and including changes in non-current loans, were 14.8 B€ (19.4 B$) in the first nine months of 2013 compared to 13.2 B€ (16.9 B$) in the first nine months of 2012. Acquisitions were 2.0 B€ (2.6 B$) in the first nine months of 2013, comprised essentially of the acquisition of an additional 6% interest in the Ichthys project in Australia, an additional 0.8% interest in Novatek18, the carry on the Utica gas and condensate field in the United States and the bonus for exploration licenses in South Africa and Brazil. Asset sales in the first nine months of 2013 were 3.3 B€ (4.4 B$)19, comprised essentially of the sale of TIGF in France, an interest in the Tempa Rossa field in Italy, the Group’s 49% interest in the Voyageur upgrader project in Canada and the exploration and production assets in Trinidad & Tobago. Net investments were 13.4 B€ (17.7 B$) in the first nine months of 2013, compared to 12.0 B€ (15.4 B$) in the first nine months of 2012.
> Cash flow
Cash flow from operations was 14,378 M€, a decrease of 13% compared to the first nine months of 2012, mainly due to lower results and unfavorable changes in working capital. Adjusted cash flow from operations20 was 15,649 M€, a decrease of 2% compared to the first nine months of 2012. Expressed in dollars, adjusted cash flow from operations was 20.6 B$, an increase of 1%. The Group’s net cash flow21 was 968 M€ compared to 4,582 M€ in the first nine months of 2012. Expressed in dollars, the Group’s net cash flow was 1.3 B$ in the first nine months of 2013, a decrease compared to the first nine months of 2012 that was mainly due to higher net investments and unfavorable changes in working capital. The net-debt-to-equity ratio was 23.0% on September 30, 2013 compared to 21.2% on September 30, 201222.
17 Detail shown on page 19. 18 As of September 30, 2013, the Group owns 16.2% of the share capital of Novatek. 19 This amount does not include the sale of an interest in block 14 in Angola, which was reported in the cash flow statement of the first quarter 2013 as a transaction involving a non-controlling interest. 20 Cash flow from operations at replacement cost before changes in working capital. 21 Net cash flow = cash flow from operations - net investments. 22 Detail shown on page 20.

8
TOTAL 2, place de la Coupole La Défense 6 92 400 Courbevoie France Tel. : 33 (1) 47 44 58 53 Fax : 33 (1) 47 44 58 24 Jérôme SCHMITT Philippe HERGAUX Sandrine SABOUREAU Laurent KETTENMEYER Robert HAMMOND (U.S.) Tel. : (1) 201 626 3500 Fax : (1) 201 626 4004 TOTAL S.A Capital 5 981 907 382 euros 542 051 180 R.C.S. Nanterre www.total.com
Analysis of business segment results
Upstream Effective July 1, 2012, the Upstream segment no longer includes the activities of New Energies, which are now reported with Marketing & Services. As a result, certain information has been restated according to the new organization.
> Environment – liquids and gas price realizations*
3Q13 2Q13 3Q12 3Q13
vs 3Q12
9M13 9M12 9M13
vs 9M12
110.3 102.4 109.5 +1% Brent ($/b) 108.5 112.2 -3%
107.2 96.6 107.6 - Average liquids price ($/b) 103.5 108.1 -4%
7.18 6.62 6.00 +20% Average gas price ($/Mbtu) 7.04 6.68 +5%
77.3 69.8 75.8 +2% Average hydrocarbon price ($/boe) 74.8 77.4 -3%
* consolidated subsidiaries, excluding fixed margins.
> Production
3Q13 2Q13 3Q12 3Q13
vs 3Q12
Hydrocarbon production 9M13 9M12 9M13
vs 9M12
2,299 2,290 2,272 +1% Combined production (kboe/d) 2,304 2,302 -
1,174 1,160 1,225 -4% Liquids (kb/d) 1,175 1,224 -4%
6,167 6,169 5,680 +9% Gas (Mcf/d) 6,158 5,875 +5%
Hydrocarbon production was 2,299 thousand barrels of oil equivalent per day (kboe/d) in the third quarter 2013, an increase of 1% compared to the third quarter 2012, essentially as a result of: • +1.5% for growth from new projects, • -0.5% for normal decline, partially offset by lower maintenance, • +2% for the restart of production from Elgin/Franklin in the UK North Sea and Ibewa
in Nigeria, • -2% for security issues in Nigeria and Libya in the third quarter 2013, partially offset
by improved security conditions in Yemen.
In the first nine months of 2013, hydrocarbon production was 2,304 kboe/d, stable compared the first nine months of 2012, essentially as a result of: • +2.5% for growth from new projects, • -1.5% for normal decline and scheduled maintenance, • -1% for security issues in Nigeria and Libya, partially offset by improved security
conditions in Yemen.

9
TOTAL 2, place de la Coupole La Défense 6 92 400 Courbevoie France Tel. : 33 (1) 47 44 58 53 Fax : 33 (1) 47 44 58 24 Jérôme SCHMITT Philippe HERGAUX Sandrine SABOUREAU Laurent KETTENMEYER Robert HAMMOND (U.S.) Tel. : (1) 201 626 3500 Fax : (1) 201 626 4004 TOTAL S.A Capital 5 981 907 382 euros 542 051 180 R.C.S. Nanterre www.total.com
Results
3Q13 2Q13 3Q12 3Q13
vs 3Q12
in millions of euros 9M13 9M12 9M13
vs 9M12
4,486 4,308 5,551 -19% Adjusted operating income* 13,754 17,007 -19%
2,329 2,325 2,897 -20% Adjusted net operating income * 7,120 8,459 -16%
499 527 578 -14% • includes income from equity affiliates 1,659 1,506 +10%
5,064 5,056 4,567 +11% Investments 15,375 14,100 +9%
2,114 1,112 401 x5.3 Divestments 3,769 1,383 x2.7
4,765 2,128 3,457 +38% Cash flow from operations 11,043 14,521 -24%
4,373 4,283 5,105 -14% Adjusted cash flow from operations 12,842 13,812 -7%
* detail of adjustment items shown in the business segment information annex to financial statements. In the third quarter 2013, adjusted net operating income from the Upstream segment was 2,329 M€ compared to 2,897 M€ in the third quarter 2012, a decrease of 20%. Expressed in dollars, adjusted net operating income decreased by 15%, mainly due to an unfavorable production mix and higher exploration charges in line with the more active drilling program. The effective tax rate for the Upstream segment was 60.1% compared to 58.8% in the third quarter 2012. In the first nine months of 2013, adjusted net operating income from the Upstream segment was 7,120 M€ compared to 8,459 M€ in the first nine months of 2012, a decrease of 16%. Expressed in dollars, adjusted net operating income was 9,378 M$, or a decrease of 13% explained principally by an unfavorable production mix, higher exploration charges and a decrease in average realized hydrocarbon prices between the two periods. The return on average capital employed (ROACE23) for the Upstream segment was 15% for the twelve months ended September 30, 2013, compared to 16% for the twelve months ended June 30, 2013.
23 Calculated based on adjusted net operating income and average capital employed, using replacement cost, as shown on page 21.

10
TOTAL 2, place de la Coupole La Défense 6 92 400 Courbevoie France Tel. : 33 (1) 47 44 58 53 Fax : 33 (1) 47 44 58 24 Jérôme SCHMITT Philippe HERGAUX Sandrine SABOUREAU Laurent KETTENMEYER Robert HAMMOND (U.S.) Tel. : (1) 201 626 3500 Fax : (1) 201 626 4004 TOTAL S.A Capital 5 981 907 382 euros 542 051 180 R.C.S. Nanterre www.total.com
Refining & Chemicals
> Refinery throughput and utilization rates*
3Q13 2Q13 3Q12 3Q13
vs 3Q12
9M13 9M12 9M13
vs 9M12
1,759 1,772 1,790 -2% Total refinery throughput (kb/d) 1,764 1,833 -4%
696 729 653 +7% France 684 699 -2%
784 781 864 -9% Rest of Europe 810 873 -7%
279 262 273 +2% Rest of world 270 261 +3%
Utlization rates**
81% 83% 82% Based on crude only 82% 83%
86% 87% 86% Based on crude and other feedstock 86% 88%
* includes share of TotalErg. Results for refineries in South Africa, French Antilles and Italy are accounted for in the Marketing & Services segment. ** based on distillation capacity at the beginning of the year.
In the third quarter 2013, refinery throughput decreased by 2% compared to the third quarter 2012. The decrease was mainly due to the start of a scheduled turnaround at Lindsey and maintenance at several of the Group’s refineries during the third quarter 2013, as well as the closure of the Rome refinery at the end of the third quarter 2012. In addition, there were voluntary throughput reductions at the end third quarter 2013 due to the weakness of the margins.
In the first nine months of 2013, refinery throughput decreased by 4% compared to the first nine months of 2012, reflecting essentially the scheduled turnaround at the Antwerp platform in 2013, increased maintenance at Donges, as well as the closure of the Rome refinery at the end of the third quarter 2012.
> Results
3Q13 2Q13 3Q12 3Q13
vs 3Q12
in millions of euros (except the ERMI) 9M13 9M12
9M13 vs
9M12
10.6 24.1 51.0 -79% European refining margin indicator - ERMI ($/t) 20.5 36.7 -44%
262 357 652 -60% Adjusted operating income* 1,029 1,067 -4%
330 370 567 -42% Adjusted net operating income* 1,083 1,009 +7%
119 113 102 +17% • contribution of Specialty Chemicals** 321 290 +11%
415 382 441 -6% Investments 1,330 1,371 -3%
8 208 55 -85% Divestments 243 203 +20%
840 1,303 1,036 -19% Cash flow from operations 1,855 1,625 +14%
493 572 771 -36% Adjusted cash flow from operations 1,628 1,498 +9%
* detail of adjustment items shown in the business segment information annex to financial statements. ** Hutchinson, Bostik, Atotech.

11
TOTAL 2, place de la Coupole La Défense 6 92 400 Courbevoie France Tel. : 33 (1) 47 44 58 53 Fax : 33 (1) 47 44 58 24 Jérôme SCHMITT Philippe HERGAUX Sandrine SABOUREAU Laurent KETTENMEYER Robert HAMMOND (U.S.) Tel. : (1) 201 626 3500 Fax : (1) 201 626 4004 TOTAL S.A Capital 5 981 907 382 euros 542 051 180 R.C.S. Nanterre www.total.com
The European refining margin indicator (ERMI) averaged 10.6 $/t in the third quarter, a decrease of 79% compared to the third quarter 2012. Petrochemical margins improved globally (Europe, United States, Asia) compared to the same period last year, reflecting the impact of lower raw material prices, naphtha in Europe and Asia, ethane and LPG in the United States. In the third quarter 2013, adjusted net operating income from the Refining & Chemicals segment was 330 M€ compared to 567 M€ in the third quarter 2012. Expressed in dollars, adjusted net operating income was 437 M$, a decrease of 38% compared to the third quarter 2012. Implementing operational efficiencies and synergies as well as a more favorable petrochemicals environment partially offset the sharp decrease in European refining margins. As part of its downstream strategy, the Group announced in the third quarter 2013 a project to adapt and modernize its Carling petrochemicals platform and restore its competitiveness. In addition, the integrated Satorp platform in Saudi Arabia shipped its initial cargoes of refined products after successfully starting up the first units of the refinery. In the first nine months of 2013, adjusted net operating income from the Refining & Chemicals segment was 1,083 M€, an increase of 7% compared to the first nine months of 2012. Expressed in dollars, adjusted net operating income was 1,426 M$, an increase of 10% compared to the first nine months of 2012, despite the sharply lower refining margins (a decrease of 44% compared to the first nine months 2012). The increase was due partly to the more favorable petrochemicals environment and partly to the effectiveness of the Group’s planned synergies and operational efficiency programs. The Specialty Chemicals performed well despite a less favorable environment in Europe. The ROACE24 for the Refining & Chemicals segment for the twelve months ended September 30, 2013, was 9% compared to 11% for the twelve months ended June 30, 2013.
24 Calculated based on adjusted net operating income and average capital employed, using replacement cost, as shown on page 21.

12
TOTAL 2, place de la Coupole La Défense 6 92 400 Courbevoie France Tel. : 33 (1) 47 44 58 53 Fax : 33 (1) 47 44 58 24 Jérôme SCHMITT Philippe HERGAUX Sandrine SABOUREAU Laurent KETTENMEYER Robert HAMMOND (U.S.) Tel. : (1) 201 626 3500 Fax : (1) 201 626 4004 TOTAL S.A Capital 5 981 907 382 euros 542 051 180 R.C.S. Nanterre www.total.com
Marketing & Services Effective July 1, 2012, Marketing & Services now includes the activities of New Energies. As a result, certain information has been restated according to the new organization.
> Refined product sales
3Q13 2Q13 3Q12 3Q13
vs 3Q12
Sales in kb/d*
9M13 9M12 9M13
vs 9M12
1,144 1,150 1,143 - Europe 1,134 1,173 -3%
599 633 563 +6% Rest of world 613 539 +14%
1,743 1,783 1,706 +2% Total sales volumes 1,747 1,712 +2%
* Excludes trading and bulk refining sales, includes share of TotalErg. In the third quarter 2013, sales increased by 2% compared to the third quarter last year. This increase was driven by sales in the Americas, Africa and Asia. In the first nine months of 2013, sales volumes increased by 2% compared to the first nine months of 2012, mainly due to net increases in sales in the Americas, Africa and Asia. Sales in Europe declined by 3%, with a marked decrease in Italy that was related directly to the closure of the Rome refinery.
> Results
3Q13 2Q13 3Q12 3Q13
vs 3Q12
in millions of euros 9M13 9M12 9M13
vs 9M12
21,074 20,561 21,574 -2% Sales 62,634 64,945 -4%
398 419 358 +11% Adjusted operating income* 1,226 973 +26%
330 330 245 +35% Adjusted net operating income* 925 563 +64%
(7) - (8) na • contribution of New Energies (20) (183) na
326 242 383 -15% Investments 755 793 -5%
44 12 41 +7% Divestments 94 106 -11%
1,287 414 692 +86% Cash flow from operations 1,608 108 X14.9
472 525 202 X2.3 Adjusted cash flow from operations 1,431 839 +71%
* detail of adjustment items shown in the business segment information annex to financial statements.

13
TOTAL 2, place de la Coupole La Défense 6 92 400 Courbevoie France Tel. : 33 (1) 47 44 58 53 Fax : 33 (1) 47 44 58 24 Jérôme SCHMITT Philippe HERGAUX Sandrine SABOUREAU Laurent KETTENMEYER Robert HAMMOND (U.S.) Tel. : (1) 201 626 3500 Fax : (1) 201 626 4004 TOTAL S.A Capital 5 981 907 382 euros 542 051 180 R.C.S. Nanterre www.total.com
Marketing & Services sales were 21.1 B€, a decrease of 2% compared to the third quarter 2012. In the third quarter 2013, adjusted net operating income from the Marketing & Services segment was 330 M€ an increase of 35% compared to the third quarter 2012, mainly due to higher margins and volumes, particularly in the lubricants and retail network. In the first nine months of 2013, adjusted net operating income from the Marketing & Services segment was 925 M€, an increase of 64% compared to the first nine months of 2012. The increase was due mainly to the improved performance of New Energies, which had a significant net loss for the first nine months of 2012, as well as overall improvements for marketing of refined products, particularly in emerging markets. The ROACE25 for the Marketing & Services segment for the twelve months ended September 30, 2013, was 17% compared to 14% for the twelve months ended June 30, 2013.
25 Calculated based on adjusted net operating income and average capital employed, using replacement cost, as shown on page 21.

14
TOTAL 2, place de la Coupole La Défense 6 92 400 Courbevoie France Tel. : 33 (1) 47 44 58 53 Fax : 33 (1) 47 44 58 24 Jérôme SCHMITT Philippe HERGAUX Sandrine SABOUREAU Laurent KETTENMEYER Robert HAMMOND (U.S.) Tel. : (1) 201 626 3500 Fax : (1) 201 626 4004 TOTAL S.A Capital 5 981 907 382 euros 542 051 180 R.C.S. Nanterre www.total.com
Summary and outlook
The ROACE26 for the Group for the twelve months ended was 14% compared to 15% for the twelve months ended June 30, 2013. Return on equity for the twelve months ended September 30, 2013, was 16%. With the recent launch and start-up of several projects, Total is progressing toward its objectives for 2015-2017, while laying the foundation for longer term growth. In the Upstream, after launching the major Fort Hills mining project in Canada, the Group is continuing to evaluate the Kaombo project in Angola and the Yamal LNG project in Russia. In the downstream, the progressive start-up of the Satorp platform in Jubail, Saudi Arabia should be achieved in early 2014. Following the sale of TIGF in France, the Group is continuing to actively manage and optimize its asset portfolio to achieve its 2012-14 objective of selling 15-20 B$ of assets. While the Brent price has remained robust since the start of the fourth quarter, refining margins in Europe weakened to very low levels and the environment for petrochemicals appears less favorable than in the third quarter, due to seasonally lower demand. As approved by the Board of Directors on October 30, 2013, Total will pay a third quarter 2013 interim dividend of 0.59 €/share on March 27, 2014.
♦ ♦ ♦ To listen to CFO Patrick de La Chevardière’s conference call with financial analysts today at 15:00 (Paris time) please log on to www.total.com or call +44 (0) 203 194 0570 in Europe or +1 855 255 3883 in the United States. For a replay, please consult the www.total.com website or call +44 (0) 203 367 9460 in Europe or +1 877 642 3018 in the United States (code: 283 844).
26 Calculated based on adjusted net operating income and average capital employed, using replacement cost, as shown on page 21.

15
TOTAL 2, place de la Coupole La Défense 6 92 400 Courbevoie France Tel. : 33 (1) 47 44 58 53 Fax : 33 (1) 47 44 58 24 Jérôme SCHMITT Philippe HERGAUX Sandrine SABOUREAU Laurent KETTENMEYER Robert HAMMOND (U.S.) Tel. : (1) 201 626 3500 Fax : (1) 201 626 4004 TOTAL S.A Capital 5 981 907 382 euros 542 051 180 R.C.S. Nanterre www.total.com
This press release presents the third quarter and first nine months 2013 results from the consolidated financial statements of TOTAL S.A. as of September 30, 2013. The notes to these consolidated financial statements are available on the TOTAL website www.total.com. This document may contain forward-looking information on the Group (including objectives and trends), as well as forward-looking statements within the meaning of the Private Securities Litigation Reform Act of 1995, notably with respect to the financial condition, results of operations, business, strategy and plans of TOTAL. These data do not represent forecasts within the meaning of European Regulation No. 809/2004. Such forward-looking information and statements included in this document are based on a number of economic data and assumptions made in a given economic, competitive and regulatory environment. They may prove to be inaccurate in the future, and are subject to a number of risk factors that could lead to a significant difference between actual results and those anticipated, including currency fluctuations, the price of petroleum products, the ability to realize cost reductions and operating efficiencies without unduly disrupting business operations, environmental regulatory considerations and general economic and business conditions. Certain financial information is based on estimates particularly in the assessment of the recoverable value of assets and potential impairments of assets relating thereto. Neither TOTAL nor any of its subsidiaries assumes any obligation to update publicly any forward-looking information or statement, objectives or trends contained in this document whether as a result of new information, future events or otherwise. Further information on factors, risks and uncertainties that could affect the Company’s financial results or the Group’s activities is provided in the most recent Registration Document filed by the Company with the French Autorité des Marchés Financiers and annual report on Form 20-F filed with the United States Securities and Exchange Commission (“SEC”). Financial information by business segment is reported in accordance with the internal reporting system and shows internal segment information that is used to manage and measure the performance of TOTAL. Performance indicators excluding the adjustment items, such as adjusted operating income, adjusted net operating income, and adjusted net income are meant to facilitate the analysis of the financial performance and the comparison of income between periods. These adjustment items include: (i) Special items Due to their unusual nature or particular significance, certain transactions qualified as "special items" are excluded from the business segment figures. In general, special items relate to transactions that are significant, infrequent or unusual. However, in certain instances, transactions such as restructuring costs or asset disposals, which are not considered to be representative of the normal course of business, may be qualified as special items although they may have occurred within prior years or are likely to occur again within the coming years. (ii) Inventory valuation effect The adjusted results of the Refining & Chemicals and Marketing & Services segments are presented according to the replacement cost method. This method is used to assess the segments’ performance and facilitate the comparability of the segments’ performance with those of its competitors. In the replacement cost method, which approximates the LIFO (Last-In, First-Out) method, the variation of inventory values in the statement of income is, depending on the nature of the inventory, determined using either the month-end price differentials between one period and another or the average prices of the period rather than the historical value. The inventory valuation effect is the difference between the results according to the FIFO (First-In, First-Out) and the replacement cost. (iii) Effect of changes in fair value The effect of changes in fair value presented as an adjustment item reflects for some transactions differences between internal measures of performance used by TOTAL’s management and the accounting for these transactions under IFRS. IFRS requires that trading inventories be recorded at their fair value using period-end spot prices. In order to best reflect the management of economic exposure through derivative transactions, internal indicators used to measure performance include valuations of trading inventories based on forward prices. Furthermore, TOTAL, in its trading activities, enters into storage contracts, which future effects are recorded at fair value in Group’s internal economic performance. IFRS precludes recognition of this fair value effect. The adjusted results (adjusted operating income, adjusted net operating income, adjusted net income) are defined as replacement cost results, adjusted for special items, excluding the effect of changes in fair value. Dollar amounts presented herein represent euro amounts converted at the average euro-dollar exchange rate for the applicable period and are not the result of financial statements prepared in dollars. Cautionary Note to U.S. Investors – The SEC permits oil and gas companies, in their filings with the SEC, to separately disclose proved, probable and possible reserves that a company has determined in accordance with SEC rules. We may use certain terms in this presentation, such as resources, that the SEC’s guidelines strictly prohibit us from including in filings with the SEC. U.S. investors are urged to consider closely the disclosure in our Form 20-F, File N° 1-10888, available from us at 2, Place Jean Millier – Arche Nord Coupole/Regnault - 92078 Paris-La Défense Cedex, France, or at our website: www.total.com. You can also obtain this form from the SEC by calling 1-800-SEC-0330 or on the SEC’s website: www.sec.gov.

16
TOTAL 2, place de la Coupole La Défense 6 92 400 Courbevoie France Tel. : 33 (1) 47 44 58 53 Fax : 33 (1) 47 44 58 24 Jérôme SCHMITT Philippe HERGAUX Sandrine SABOUREAU Laurent KETTENMEYER Robert HAMMOND (U.S.) Tel. : (1) 201 626 3500 Fax : (1) 201 626 4004 TOTAL S.A Capital 5 981 907 382 euros 542 051 180 R.C.S. Nanterre www.total.com
Operating information by segment
for third quarter and first nine months 2013 Upstream
3Q13 2Q13 3Q12 3Q13
vs 3Q12
Combined liquids and gas production by region (kboe/d) 9M13 9M12
9M13 vs
9M12
386 383 361 +7% Europe 387 430 -10%
656 688 737 -11% Africa 678 717 -5%
553 527 501 +10% Middle East 541 496 +9%
77 70 71 +8% North America 73 69 +6%
172 171 182 -5% South America 172 184 -7%
235 229 230 +2% Asia-Pacific 233 219 +6%
220 222 190 +16% CIS 220 187 +18%
2,299 2,290 2,272 +1% Total production 2,304 2,302 -
697 678 615 +13% Includes equity affiliates 685 607 +13%
3Q13 2Q13 3Q12 3Q13
vs 3Q12
Liquids production by region (kboe/d) 9M13 9M12
9M13 vs
9M12
170 154 179 -5% Europe 164 201 -18%
527 542 587 -10% Africa 540 575 -6%
335 320 323 +4% Middle East 328 311 +5%
29 27 25 +16% North America 28 25 +12%
53 55 56 -5% South America 55 60 -8%
30 29 28 +7% Asia-Pacific 30 26 +15%
30 33 27 +11% CIS 30 26 +15%
1,174 1,160 1,225 -4% Total production 1,175 1,224 -4%
331 323 316 +5% Includes equity affiliates 326 309 +6%

17
TOTAL 2, place de la Coupole La Défense 6 92 400 Courbevoie France Tel. : 33 (1) 47 44 58 53 Fax : 33 (1) 47 44 58 24 Jérôme SCHMITT Philippe HERGAUX Sandrine SABOUREAU Laurent KETTENMEYER Robert HAMMOND (U.S.) Tel. : (1) 201 626 3500 Fax : (1) 201 626 4004 TOTAL S.A Capital 5 981 907 382 euros 542 051 180 R.C.S. Nanterre www.total.com
3Q13 2Q13 3Q12 3Q13
vs 3Q12
Gas production by region (Mcf/d) 9M13 9M12 9M13
vs 9M12
1,185 1,285 1,011 +17% Europe 1,228 1,255 -2%
654 741 763 -14% Africa 701 722 -3%
1,212 1,105 971 +25% Middle East 1,161 1,010 +15%
269 242 260 +3% North America 254 252 +1%
667 649 650 +3% South America 651 691 -6%
1,151 1,121 1,135 +1% Asia-Pacific 1,141 1,076 +6%
1,029 1,026 890 +16% CIS 1,022 869 +18%
6,167 6,169 5,680 +9% Total production 6,158 5,875 +5%
2,002 1,900 1,618 +24% Includes equity affiliates 1,942 1,612 +20%
3Q13 2Q13 3Q12 3Q13
vs 3Q12
Liquefied natural gas 9M13 9M12 9M13
vs 9M12
3.01 2.86 2.94 +2% LNG sales* (Mt) 8.77 8.77 -
* Sales, Group share, excluding trading; 2012 data restated to reflect volume estimates for Bontang LNG in Indonesia based on the 2012 SEC coefficient.
Downstream (Refining & Chemicals and Marketing & Services)
3Q13 2Q13 3Q12 3Q13
vs 3Q12
Refined product sales by region (kb/d)* 9M13 9M12 9M13
vs 9M12
2,004 1,973 1,979 +1% Europe 1,985 2,030 -2%
430 442 411 +5% Africa 440 401 +10%
490 544 535 -8% Americas 505 495 +2%
397 520 399 -1% Rest of world 474 497 -5%
3,321 3,479 3,324 - Total consolidated sales 3,404 3,423 -1%
496 534 539 -8% Includes bulk sales 517 527 -2%
1,082 1,162 1,080 - Includes trading 1,140 1,184 -4%
* Includes share of TotalErg.

18
TOTAL 2, place de la Coupole La Défense 6 92 400 Courbevoie France Tel. : 33 (1) 47 44 58 53 Fax : 33 (1) 47 44 58 24 Jérôme SCHMITT Philippe HERGAUX Sandrine SABOUREAU Laurent KETTENMEYER Robert HAMMOND (U.S.) Tel. : (1) 201 626 3500 Fax : (1) 201 626 4004 TOTAL S.A Capital 5 981 907 382 euros 542 051 180 R.C.S. Nanterre www.total.com
Adjustment items
Adjustments to operating income
3Q13 2Q13 3Q12 in millions of euros 9M13 9M12
(772) (37) (1,362) Special items affecting operating income (815) (1,516)
- - (16) Restructuring charges (2) (64)
(656) - (1,134) Impairments (660) (1,134)
(116) (37) (212) Other (153) (318)
(43) (581) 766 Pre-tax inventory effect : FIFO vs. replacement cost (712) 228
(9) (32) (8) Effect of changes in fair value (39) (22)
(824) (650) (604) Total adjustments affecting operating income (1,566) (1,310)
Adjustments to net income (Group share)
3Q13 2Q13 3Q12 in millions of euros 9M13 9M12
76 262 (800) Special items affecting net income (Group share) (938) (1,105)
888 287 202 Gain (loss) on asset sales (72) 355
(16) - (33) Restructuring charges (42) (73)
(447) - (737) Impairments (450) (775)
(349) (25) (232) Other (374) (612)
(24) (400) 524 After-tax inventory effect : FIFO vs. replacement cost (475) 155
(7) (24) (6) Effect of changes in fair value (30) (17)
45 (162) (282) Total adjustments affecting net income (1,443) (967)
Effective tax rates
3Q13 2Q13 3Q12 Effective tax rate* 9M13 9M12
60.1% 58.3% 58.8% Upstream 60.5% 59.5%
55.8% 55.6% 55.2% Group 56.8% 57.8%
* Tax on adjusted net operating income / (adjusted net operating income - income from equity affiliates - dividends received from investments + tax on adjusted net operating income).

19
TOTAL 2, place de la Coupole La Défense 6 92 400 Courbevoie France Tel. : 33 (1) 47 44 58 53 Fax : 33 (1) 47 44 58 24 Jérôme SCHMITT Philippe HERGAUX Sandrine SABOUREAU Laurent KETTENMEYER Robert HAMMOND (U.S.) Tel. : (1) 201 626 3500 Fax : (1) 201 626 4004 TOTAL S.A Capital 5 981 907 382 euros 542 051 180 R.C.S. Nanterre www.total.com
Investments - Divestments
3Q13 2Q13 3Q12 3Q13
vs 3Q12
in millions of euros 9M13 9M12 9M13
vs 9M12
4,964 4,939 4,903 +1% Investments excluding acquisitions* 14,757 13,156 +12%
328 397 303 +8% • Capitalized exploration 1,086 972 +12%
176 9 455 -61% • Change in non-current loans** 462 845 -45%
549 500 294 +87% Acquisitions 1,983 2,564 -23%
5,513 5,439 5,197 +6% Investments including acquisitions* 16,740 15,720 +6%
1,849 1,061 1,416 +31% Asset sales 3,330 3,705 -10%
3,664 4,378 3,781 -3% Net investments** 13,410 12,015 +12%
3Q13 2Q13 3Q12 3Q13
vs 3Q12
in millions of dollars*** 9M13 9M12 9M13
vs 9M12
6,573 6,451 6,130 +7% Investments excluding acquisitions* 19,436 16,850 +15%
434 519 379 +15% • Capitalized exploration 1,430 1,245 +15%
233 12 569 -59% • Change in non-current loans** 609 1,082 -44%
727 653 368 +98% Acquisitions 2,612 3,284 -20%
7,300 7,104 6,498 +12% Investments including acquisitions* 22,048 20,134 +10%
2,448 1,386 1,770 +38% Asset sales 4,386 4,745 -8%
4,852 5,719 4,727 +3% Net investments** 17,662 15,389 +15%
* Includes changes in non-current loans. ** Includes net investments in equity affiliates and non-consolidated companies + net financing for
employee-related stock purchase plans. *** Dollar amounts represent euro amounts converted at the average €-$ exchange rate for the period.

20
TOTAL 2, place de la Coupole La Défense 6 92 400 Courbevoie France Tel. : 33 (1) 47 44 58 53 Fax : 33 (1) 47 44 58 24 Jérôme SCHMITT Philippe HERGAUX Sandrine SABOUREAU Laurent KETTENMEYER Robert HAMMOND (U.S.) Tel. : (1) 201 626 3500 Fax : (1) 201 626 4004 TOTAL S.A Capital 5 981 907 382 euros 542 051 180 R.C.S. Nanterre www.total.com
Net-debt-to-equity ratio
in millions of euros 9/30/2013 6/30/2013 9/30/2012
Current borrowings 8,209 10,030 10,647
Net current financial assets (297) (465) (1,493)
Net financial assets classified as held for sale (42) 775 -
Non-current financial debt 25,128 22,595 24,606
Hedging instruments of non-current debt (1,362) (1,306) (1,796)
Cash and cash equivalents (14,891) (11,558) (16,833)
Net debt 16,745 20,071 15,131
Shareholders’ equity 72,484 72,461 71,338
Estimated dividend payable (1,313) (1,313) (1,291)
Non-controlling interests 1,724 1,701 1,275
Equity 72,895 72,849 71,322
Net-debt-to-equity ratio 23.0% 27.6% 21.2%
2013 sensitivities*
Scenario Change Impact on adjusted operating income
(e)
Impact on adjusted net operating income
(e)
Dollar 1.30 $/€ +0.1 $ per € -2.2 B€ -0.95 B€
Brent 100 $/b +1 $/b +0.24 B€ / 0.31 B$ +0.11 B€ / 0.14 B$
European refining margins (ERMI) 30 $/t +1 $/t +0.08 B€ / 0.1 B$ +0.05 B€ / 0.06 B$
* Sensitivities are revised once per year upon publication of the previous year’s fourth quarter results. Sensitivities are estimates based on assumptions of the Group’s portfolio in 2013. Actual results could vary significantly from estimates based on the application of these sensitivities. The impact of the €-$ sensitivity on adjusted operating income and adjusted net operating income attributable to the Upstream segment are approximately 80% and 70% respectively. The remaining impact is essentially on the Refining & Chemicals segment.

21
TOTAL 2, place de la Coupole La Défense 6 92 400 Courbevoie France Tel. : 33 (1) 47 44 58 53 Fax : 33 (1) 47 44 58 24 Jérôme SCHMITT Philippe HERGAUX Sandrine SABOUREAU Laurent KETTENMEYER Robert HAMMOND (U.S.) Tel. : (1) 201 626 3500 Fax : (1) 201 626 4004 TOTAL S.A Capital 5 981 907 382 euros 542 051 180 R.C.S. Nanterre www.total.com
Return on average capital employed
Twelve months ended September 30, 2013
in millions of euros Upstream Refining & Chemicals
Marketing & Services
Group
Adjusted net operating income 9,806 1,450 1,192 12,032
Capital employed at 9/30/2012* 62,707 15,857 7,600 83,551
Capital employed at 9/30/2013* 67,487 15,443 6,833 87,578
ROACE 15.1% 9.3% 16.5%
14.1%
Twelve months ended June 30, 2013
in millions of euros Upstream Refining & Chemicals
Marketing & Services
Group
Adjusted net operating income 10,374 1,687 1,107 12,679
Capital employed at 06/30/2012* 58,668 16,014 8,003 83,729
Capital employed at 06/30/2013* 69,644 15,998 7,511 90,858
ROACE 16.2% 10.5% 14.3%
14.5%
Full-year 2012
in millions of euros Upstream Refining & Chemicals
Marketing & Services
Group
Adjusted net operating income 11,145 1,376 830 12,927
Capital employed at 12/31/2011* 56,910 15,454 6,852 79,976
Capital employed at 12/31/2012* 63,862 15,726 6,986 84,152
ROACE 18.5% 8.8% 12.0% 15.8%
* At replacement cost (excluding after-tax inventory effect).

1
Main indicators
Chart updated around the middle of the month following the end of each quarter
€/$ European refining
margin ERMI* ($/t)** Brent ($/b) Average liquids price*** ($/b) Average gas price ($/Mbtu)***
Third quarter 2013 1.32 10.6 110.3 107.2 7.18
Second quarter 2013 1.31 24.1 102.4 96.6 6.62
First quarter 2013 1.32 26.9 112.6 106.7 7.31
Fourth quarter 2012 1.30 33.9 110.1 106.4 6.94
Third quarter 2012 1.25 51.0 109.5 107.6 6.00
* European Refining Margin Indicator (ERMI) is an indicator intended to represent the margin after variable costs for a hypothetical complex refinery located around Rotterdam in Northern Europe that processes a mix of crude oil and other inputs commonly supplied to this region to produce and market the main refined products at prev ailing prices in this region. The indicator margin may not be representative of the actual margins achieved by Total in any period because of Total’s particular refinery configurations, product mix effects or other company-specific operating conditions.
** 1 $/t = 0.136 $/b
*** consolidated subsidiaries, excluding fixed margin contracts.
Disclaimer : data is based on Total’s reporting, is not audited and is subject to change.

Total financial statements Third quarter 2013 consolidated accounts, IFRS

CONSOLIDATED STATEMENT OF INCOMETOTAL
(unaudited)
(M€) (a)
3rd quarter2013
2nd quarter2013
3rd quarter2012
Sales 46,686 46,973 49,890Excise taxes (4,658) (4,469) (4,411)
Revenues from sales 42,028 42,504 45,479
Purchases, net of inventory variation (29,368) (30,344) (30,609)Other operating expenses (5,070) (5,635) (5,500)Exploration costs (568) (272) (317)Depreciation, depletion and amortization of tangible assets and mineral interests (2,778) (1,941) (3,246)Other income 1,144 352 474Other expense (161) (94) (129)
Financial interest on debt (159) (182) (154)Financial income from marketable securities & cash equivalents 9 14 8
Cost of net debt (150) (168) (146)
Other financial income 138 157 141Other financial expense (153) (137) (135)
Equity in net income (loss) of affiliates 625 609 641
Income taxes (2,863) (2,456) (3,499)Consolidated net income 2,824 2,575 3,154Group share 2,761 2,537 3,082Non-controlling interests 63 38 72Earnings per share (€) 1.22 1.12 1.37 Fully-diluted earnings per share (€) 1.21 1.12 1.36 (a) Except for per share amounts.

CONSOLIDATED STATEMENT OF COMPREHENSIVE INCOME
TOTAL(unaudited)
(M€)3rd quarter
20132nd quarter
20133rd quarter
2012
Consolidated net income 2,824 2,575 3,154
Other comprehensive income
Actuarial gains and losses 33 (188) (51)Tax effect (8) 72 16Items not potentially reclassifiable to profit and loss 25 (116) (35)Currency translation adjustment (1,086) (1,111) (1,004)Available for sale financial assets 5 6 (183)Cash flow hedge 28 61 33Share of other comprehensive income of equity affiliates, net amount (271) (430) 86Other (4) - -Tax effect (11) (25) 37Items potentially reclassifiable to profit and loss (1,339) (1,499) (1,031)Total other comprehensive income (net amount) (1,314) (1,615) (1,066)
Comprehensive income 1,510 960 2,088- Group share 1,504 978 2,048- Non-controlling interests 6 (18) 40

CONSOLIDATED STATEMENT OF INCOMETOTAL
(unaudited)
(M€) (a)
9 months2013
9 months2012
Sales 141,789 150,193Excise taxes (13,323) (13,363)
Revenues from sales 128,466 136,830
Purchases, net of inventory variation (90,242) (94,944)Other operating expenses (16,057) (16,507)Exploration costs (1,147) (942)Depreciation, depletion and amortization of tangible assets and mineral interests (6,879) (7,112)Other income 1,527 988Other expense (1,787) (676)
Financial interest on debt (510) (511)Financial income from marketable securities & cash equivalents 45 67
Cost of net debt (465) (444)
Other financial income 398 435Other financial expense (418) (389)
Equity in net income (loss) of affiliates 1,952 1,618
Income taxes (8,361) (10,478)Consolidated net income 6,987 8,379Group share 6,835 8,268Non-controlling interests 152 111Earnings per share (€) 3.02 3.67 Fully-diluted earnings per share (€) 3.01 3.65 (a) Except for per share amounts.

CONSOLIDATED STATEMENT OF COMPREHENSIVE INCOME
TOTAL(unaudited)
(M€)9 months
20139 months
2012
Consolidated net income 6,987 8,379
Other comprehensive income
Actuarial gains and losses 14 (474)Tax effect (2) 172Items not potentially reclassifiable to profit and loss 12 (302)Currency translation adjustment (1,246) 285Available for sale financial assets 7 (342)Cash flow hedge 100 36Share of other comprehensive income of equity affiliates, net amount (607) 191Other (12) (14)Tax effect (38) 72Items potentially reclassifiable to profit and loss (1,796) 228Total other comprehensive income (net amount) (1,784) (74)
Comprehensive income 5,203 8,305- Group share 5,131 8,203- Non-controlling interests 72 102

CONSOLIDATED BALANCE SHEETTOTAL
(M€)
September 30, 2013
(unaudited)
June 30, 2013(unaudited)
December 31, 2012
September 30, 2012
(unaudited)
ASSETS
Non-current assetsIntangible assets, net 12,595 13,322 12,858 12,964Property, plant and equipment, net 71,924 71,397 69,332 70,583Equity affiliates : investments and loans 14,624 14,555 13,759 14,413Other investments 1,315 1,210 1,190 1,181Hedging instruments of non-current financial debt 1,362 1,306 1,626 1,796Deferred income taxes 2,756 2,842 2,279 2,003Other non-current assets 2,910 2,914 2,663 2,669
Total non-current assets 107,486 107,546 103,707 105,609
Current assetsInventories, net 15,897 15,441 17,397 17,266Accounts receivable, net 18,426 19,563 19,206 20,331Other current assets 11,244 11,353 10,086 11,377Current financial assets 339 510 1,562 1,726Cash and cash equivalents 14,891 11,558 15,469 16,833Assets classified as held for sale 2,304 3,902 3,797 -
Total current assets 63,101 62,327 67,517 67,533
Total assets 170,587 169,873 171,224 173,142
LIABILITIES & SHAREHOLDERS' EQUITY
Shareholders' equityCommon shares 5,943 5,942 5,915 5,915Paid-in surplus and retained earnings 73,144 71,785 70,116 69,280Currency translation adjustment (3,224) (1,924) (1,504) (515)Treasury shares (3,379) (3,342) (3,342) (3,342)
Total shareholders' equity - Group Share 72,484 72,461 71,185 71,338
Non-controlling interests 1,724 1,701 1,280 1,275
Total shareholders' equity 74,208 74,162 72,465 72,613
Non-current liabilitiesDeferred income taxes 12,917 12,800 12,132 12,649Employee benefits 3,554 3,633 3,744 3,413Provisions and other non-current liabilities 10,949 11,059 11,585 11,170Non-current financial debt 25,128 22,595 22,274 24,606
Total non-current liabilities 52,548 50,087 49,735 51,838
Current liabilitiesAccounts payable 20,594 20,168 21,648 20,869Other creditors and accrued liabilities 14,347 13,901 14,698 16,942Current borrowings 8,209 10,030 11,016 10,647Other current financial liabilities 42 45 176 233Liabilities directly associated with the assets classified as held for sale 639 1,480 1,486 -
Total current liabilities 43,831 45,624 49,024 48,691
Total liabilities and shareholders' equity 170,587 169,873 171,224 173,142

CONSOLIDATED STATEMENT OF CASH FLOWTOTAL
(unaudited)
(M€)
3rd quarter2013
2nd quarter2013
3rd quarter2012
CASH FLOW FROM OPERATING ACTIVITIES
Consolidated net income 2,824 2,575 3,154Depreciation, depletion and amortization 3,169 2,114 3,413Non-current liabilities, valuation allowances and deferred taxes 585 (101) 786Impact of coverage of pension benefit plans - - -(Gains) losses on disposals of assets (1,073) (271) (419)Undistributed affiliates' equity earnings (228) 70 (135)(Increase) decrease in working capital 1,576 (732) (1,661)Other changes, net 101 51 25Cash flow from operating activities 6,954 3,706 5,163
CASH FLOW USED IN INVESTING ACTIVITIES
Intangible assets and property, plant and equipment additions (5,136) (5,232) (4,512)Acquisitions of subsidiaries, net of cash acquired - - (74)Investments in equity affiliates and other securities (201) (198) (156)Increase in non-current loans (515) (282) (674)Total expenditures (5,852) (5,712) (5,416)Proceeds from disposals of intangible assets and property, plant and equipment 39 844 274Proceeds from disposals of subsidiaries, net of cash sold 1,793 200 1Proceeds from disposals of non-current investments 17 17 1,141Repayment of non-current loans 339 273 219Total divestments 2,188 1,334 1,635Cash flow used in investing activities (3,664) (4,378) (3,781)
CASH FLOW USED IN FINANCING ACTIVITIES
Issuance (repayment) of shares: - Parent company shareholders 17 329 1 - Treasury shares (179) - (68)Dividends paid: - Parent company shareholders (1,340) (1,356) (1,282) - Non-controlling interests (9) (70) (2)Other transactions with non-controlling interests 36 (3) -Net issuance (repayment) of non-current debt 3,382 575 2,062Increase (decrease) in current borrowings (1,855) (698) (98)Increase (decrease) in current financial assets and liabilities 48 9 (31)Cash flow used in financing activities 100 (1,214) 582Net increase (decrease) in cash and cash equivalents 3,390 (1,886) 1,964Effect of exchange rates (57) 29 (129)Cash and cash equivalents at the beginning of the period 11,558 13,415 14,998Cash and cash equivalents at the end of the period 14,891 11,558 16,833

CONSOLIDATED STATEMENT OF CASH FLOWTOTAL
(unaudited)
(M€)
9 months2013
9 months2012
CASH FLOW FROM OPERATING ACTIVITIES
Consolidated net income 6,987 8,379Depreciation, depletion and amortization 7,589 7,680Non-current liabilities, valuation allowances and deferred taxes 561 1,112Impact of coverage of pension benefit plans - (362)(Gains) losses on disposals of assets 74 (865)Undistributed affiliates' equity earnings (511) 92(Increase) decrease in working capital (559) 448Other changes, net 237 113Cash flow from operating activities 14,378 16,597
CASH FLOW USED IN INVESTING ACTIVITIES
Intangible assets and property, plant and equipment additions (15,281) (13,867)Acquisitions of subsidiaries, net of cash acquired (16) (199)Investments in equity affiliates and other securities (981) (809)Increase in non-current loans (1,270) (1,445)Total expenditures (17,548) (16,320)Proceeds from disposals of intangible assets and property, plant and equipment 1,303 936Proceeds from disposals of subsidiaries, net of cash sold 1,993 35Proceeds from disposals of non-current investments 34 2,734Repayment of non-current loans 808 600Total divestments 4,138 4,305Cash flow used in investing activities (13,410) (12,015)
CASH FLOW USED IN FINANCING ACTIVITIES
Issuance (repayment) of shares: - Parent company shareholders 346 32 - Treasury shares (179) (68)Dividends paid: - Parent company shareholders (4,029) (3,852) - Non controlling interests (81) (100)Other transactions with non-controlling interests 390 1Net issuance (repayment) of non-current debt 6,807 5,135Increase (decrease) in current borrowings (5,785) (1,892)Increase (decrease) in current financial assets and liabilities 949 (970)Cash flow used in financing activities (1,582) (1,714)Net increase (decrease) in cash and cash equivalents (614) 2,868Effect of exchange rates 36 (60)Cash and cash equivalents at the beginning of the period 15,469 14,025Cash and cash equivalents at the end of the period 14,891 16,833

CONSOLIDATED STATEMENT OF CHANGES IN SHAREHOLDERS' EQUITYTOTAL
(unaudited)
(M€) Number Amount Number Amount
As of January 1, 2012 2,363,767,313 5,909 65,430 (1,004) (109,554,173) (3,390) 66,945 1,352 68,297
Net income of the first nine months - - 8,268 - - - 8,268 111 8,379
Other comprehensive Income - - (548) 483 - - (65) (9) (74)
Comprehensive Income - - 7,720 483 - - 8,203 102 8,305
Dividend - - (3,913) - - - (3,913) (100) (4,013)
Issuance of common shares 2,151,933 6 26 - - - 32 - 32
Purchase of treasury shares - - - - (1,800,000) (68) (68) - (68)
Sale of treasury shares (1) - - (116) - 2,960,542 116 - - -
Share-based payments - - 114 - - - 114 - 114
Share cancellation - - - - - - - - -
Other operations with non-controlling interests - - 13 6 - - 19 (18) 1
Other items - - 6 - - - 6 (61) (55)
As of Sepember 30, 2012 2,365,919,246 5,915 69,280 (515) (108,393,631) (3,342) 71,338 1,275 72,613
Net income of the fourth quarter - - 2,341 - - - 2,341 36 2,377
Other comprehensive Income - - (221) (989) - - (1,210) (31) (1,241)
Comprehensive Income - - 2,120 (989) - - 1,131 5 1,136
Dividend - - (1,324) - - - (1,324) (4) (1,328)
Issuance of common shares 13,900 - - - - - - - -
Purchase of treasury shares - - - - - - - - -
Sale of treasury shares (1) - - - - 1,992 - - - -
Share-based payments - - 32 - - - 32 - 32
Share cancellation - - - - - - - - -
Other operations with non-controlling interests - - (2) - - - (2) 2 -
Other items - - 10 - - - 10 2 12
As of December 31, 2012 2,365,933,146 5,915 70,116 (1,504) (108,391,639) (3,342) 71,185 1,280 72,465
Net income of the first nine months - - 6,835 - - - 6,835 152 6,987
Other comprehensive Income - - 17 (1,721) - - (1,704) (80) (1,784)
Comprehensive Income - - 6,852 (1,721) - - 5,131 72 5,203
Dividend - - (4,024) - - - (4,024) (81) (4,105)
Issuance of common shares 11,263,033 28 318 - - - 346 - 346
Purchase of treasury shares - - - - (4,414,200) (179) (179) - (179)
Sale of treasury shares (1) - - (142) - 3,590,641 142 - - -
Share-based payments - - 112 - - - 112 - 112
Share cancellation - - - - - - - - -
Other operations with non-controlling interests - - (91) 1 - - (90) 446 356
Other items - - 3 - - - 3 7 10
As of September 30, 2013 2,377,196,179 5,943 73,144 (3,224) (109,215,198) (3,379) 72,484 1,724 74,208
(1) Treasury shares related to the restricted stock grants.
Total shareholders'
equity
Shareholders' equity Group
Share
Common shares issued Treasury sharesPaid-in surplus and
retained earnings
Currency translation adjustment
Non-controlling interests

BUSINESS SEGMENT INFORMATIONTOTAL(unaudited)
3rd quarter 2013(M€)
Upstream Refining & Chemicals
Marketing & Services Corporate Intercompany Total
Non-Group sales 4,479 21,260 21,074 (127) - 46,686Intersegment sales 6,974 10,068 431 13 (17,486) -Excise taxes - (975) (3,683) - - (4,658)Revenues from sales 11,453 30,353 17,822 (114) (17,486) 42,028Operating expenses (5,364) (29,925) (17,247) 44 17,486 (35,006)Depreciation, depletion and amortization of tangible assets and mineral interests (2,349) (285) (136) (8) - (2,778)Operating income 3,740 143 439 (78) - 4,244Equity in net income (loss) of affiliates and other items 1,506 75 64 (52) - 1,593Tax on net operating income (2,564) (174) (113) (32) - (2,883)Net operating income 2,682 44 390 (162) - 2,954Net cost of net debt (130)Non-controlling interests (63)Net income 2,761
3rd quarter 2013 (adjustments) (a)
(M€)Upstream Refining &
ChemicalsMarketing &
Services Corporate Intercompany Total
Non-Group sales (9) - - - - (9)Intersegment sales - - - - - -Excise taxes - - - - - -Revenues from sales (9) - - - - (9)Operating expenses (86) (114) 41 - - (159)Depreciation, depletion and amortization of tangible assets and mineral interests (651) (5) - - - (656)Operating income (b) (746) (119) 41 - - (824)Equity in net income (loss) of affiliates and other items 950 (5) 29 (30) - 944Tax on net operating income 149 (162) (10) (34) - (57)Net operating income (b) 353 (286) 60 (64) - 63Net cost of net debt -Non-controlling interests (18)Net income 45
On operating income - (114) 71 -On net operating income - (63) 49 -
(c) Of which equity share of adjustments related to Sanofi-Aventis - - - -
3rd quarter 2013 (adjusted)(M€) (a) Upstream Refining &
ChemicalsMarketing &
Services Corporate Intercompany Total
Non-Group sales 4,488 21,260 21,074 (127) - 46,695Intersegment sales 6,974 10,068 431 13 (17,486) -Excise taxes - (975) (3,683) - - (4,658)Revenues from sales 11,462 30,353 17,822 (114) (17,486) 42,037Operating expenses (5,278) (29,811) (17,288) 44 17,486 (34,847)Depreciation, depletion and amortization of tangible assets and mineral interests (1,698) (280) (136) (8) - (2,122)Adjusted operating income 4,486 262 398 (78) - 5,068Equity in net income (loss) of affiliates and other items 556 80 35 (22) - 649Tax on net operating income (2,713) (12) (103) 2 - (2,826)Adjusted net operating income 2,329 330 330 (98) - 2,891Net cost of net debt (130)Non-controlling interests (45)Ajusted net income 2,716Adjusted fully-diluted earnings per share (€) 1.19(a) Except for earnings per share.
3rd quarter 2013(M€)
Upstream Refining & Chemicals
Marketing & Services Corporate Intercompany Total
Total expenditures 5,064 415 326 47 - 5,852Total divestments 2,114 8 44 22 - 2,188Cash flow from operating activities 4,765 840 1,287 62 - 6,954
(a) Adjustments include special items, inventory valuation effect and the effect of changes in fair value.
(b) Of which inventory valuation effect

BUSINESS SEGMENT INFORMATIONTOTAL(unaudited)
2nd quarter 2013(M€)
Upstream Refining & Chemicals
Marketing & Services Corporate Intercompany Total
Non-Group sales 4,781 21,560 20,561 71 - 46,973Intersegment sales 6,519 9,807 806 27 (17,159) -Excise taxes - (835) (3,634) - - (4,469)Revenues from sales 11,300 30,532 17,733 98 (17,159) 42,504Operating expenses (5,512) (30,413) (17,273) (212) 17,159 (36,251)Depreciation, depletion and amortization of tangible assets and mineral interests (1,512) (298) (123) (8) - (1,941)Operating income 4,276 (179) 337 (122) - 4,312Equity in net income (loss) of affiliates and other items 774 52 38 23 - 887Tax on net operating income (2,421) 80 (100) (44) - (2,485)Net operating income 2,629 (47) 275 (143) - 2,714Net cost of net debt (139)Non-controlling interests (38)Net income 2,537
2nd quarter 2013 (adjustments) (a)
(M€)Upstream Refining &
ChemicalsMarketing &
Services Corporate Intercompany Total
Non-Group sales (32) - - - - (32)Intersegment sales - - - - - -Excise taxes - - - - - -Revenues from sales (32) - - - - (32)Operating expenses - (536) (82) - - (618)Depreciation, depletion and amortization of tangible assets and mineral interests - - - - - -Operating income (b) (32) (536) (82) - - (650)Equity in net income (loss) of affiliates and other items 252 (32) 1 - - 221Tax on net operating income 84 151 26 - - 261Net operating income (b) 304 (417) (55) - - (168)Net cost of net debt -Non-controlling interests 6Net income (162)
On operating income - (499) (82) -On net operating income - (351) (55) -
(c) Of which equity share of adjustments related to Sanofi-Aventis - - - -
2nd quarter 2013 (adjusted)(M€) (a) Upstream Refining &
ChemicalsMarketing &
Services Corporate Intercompany Total
Non-Group sales 4,813 21,560 20,561 71 - 47,005Intersegment sales 6,519 9,807 806 27 (17,159) -Excise taxes - (835) (3,634) - - (4,469)Revenues from sales 11,332 30,532 17,733 98 (17,159) 42,536Operating expenses (5,512) (29,877) (17,191) (212) 17,159 (35,633)Depreciation, depletion and amortization of tangible assets and mineral interests (1,512) (298) (123) (8) - (1,941)Adjusted operating income 4,308 357 419 (122) - 4,962Equity in net income (loss) of affiliates and other items 522 84 37 23 - 666Tax on net operating income (2,505) (71) (126) (44) - (2,746)Adjusted net operating income 2,325 370 330 (143) - 2,882Net cost of net debt (139)Non-controlling interests (44)Ajusted net income 2,699Adjusted fully-diluted earnings per share (€) 1.19(a) Except for earnings per share.
2nd quarter 2013(M€)
Upstream Refining & Chemicals
Marketing & Services Corporate Intercompany Total
Total expenditures 5,056 382 242 32 - 5,712Total divestments 1,112 208 12 2 - 1,334Cash flow from operating activities 2,128 1,303 414 (139) - 3,706
(a) Adjustments include special items, inventory valuation effect and the effect of changes in fair value.
(b) Of which inventory valuation effect

BUSINESS SEGMENT INFORMATIONTOTAL(unaudited)
3rd quarter 2012(M€)
Upstream Refining & Chemicals
Marketing & Services Corporate Intercompany Total
Non-Group sales 5,001 23,260 21,574 55 - 49,890Intersegment sales 7,455 11,168 154 47 (18,824) -Excise taxes - (956) (3,455) - - (4,411)Revenues from sales 12,456 33,472 18,273 102 (18,824) 45,479Operating expenses (5,265) (31,908) (17,835) (242) 18,824 (36,426)Depreciation, depletion and amortization of tangible assets and mineral interests (2,779) (321) (136) (10) - (3,246)Operating income 4,412 1,243 302 (150) - 5,807Equity in net income (loss) of affiliates and other items 642 41 7 302 - 992Tax on net operating income (2,969) (351) (80) (120) - (3,520)Net operating income 2,085 933 229 32 - 3,279Net cost of net debt (125)Non-controlling interests (72)Net income 3,082
3rd quarter 2012 (adjustments) (a)
(M€)Upstream Refining &
ChemicalsMarketing &
Services Corporate Intercompany Total
Non-Group sales (8) - - - - (8)Intersegment sales - - - - - -Excise taxes - - - - - -Revenues from sales (8) - - - - (8)Operating expenses 3 593 (42) - - 554Depreciation, depletion and amortization of tangible assets and mineral interests (1,134) (2) (14) - - (1,150)Operating income (b) (1,139) 591 (56) - - (604)Equity in net income (loss) of affiliates and other items - 5 33 293 - 331Tax on net operating income 327 (230) 7 (90) - 14Net operating income (b) (812) 366 (16) 203 - (259)Net cost of net debt -Non-controlling interests (23)Net income (282)
On operating income - 627 139 -On net operating income - 444 94 -
(c) Of which equity share of adjustments related to Sanofi - - - -
3rd quarter 2012 (adjusted)(M€) (a) Upstream Refining &
ChemicalsMarketing &
Services Corporate Intercompany Total
Non-Group sales 5,009 23,260 21,574 55 - 49,898Intersegment sales 7,455 11,168 154 47 (18,824) -Excise taxes - (956) (3,455) - - (4,411)Revenues from sales 12,464 33,472 18,273 102 (18,824) 45,487Operating expenses (5,268) (32,501) (17,793) (242) 18,824 (36,980)Depreciation, depletion and amortization of tangible assets and mineral interests (1,645) (319) (122) (10) - (2,096)Adjusted operating income 5,551 652 358 (150) - 6,411Equity in net income (loss) of affiliates and other items 642 36 (26) 9 - 661Tax on net operating income (3,296) (121) (87) (30) - (3,534)Adjusted net operating income 2,897 567 245 (171) - 3,538Net cost of net debt (125)Non-controlling interests (49)Ajusted net income 3,364Adjusted fully-diluted earnings per share (€) 1.48(a) Except for earnings per share.
3rd quarter 2012(M€)
Upstream Refining & Chemicals
Marketing & Services Corporate Intercompany Total
Total expenditures 4,567 441 383 25 - 5,416Total divestments 401 55 41 1,138 - 1,635Cash flow from operating activities 3,457 1,036 692 (22) - 5,163
(a) Adjustments include special items, inventory valuation effect and the effect of changes in fair value.
(b) Of which inventory valuation effect
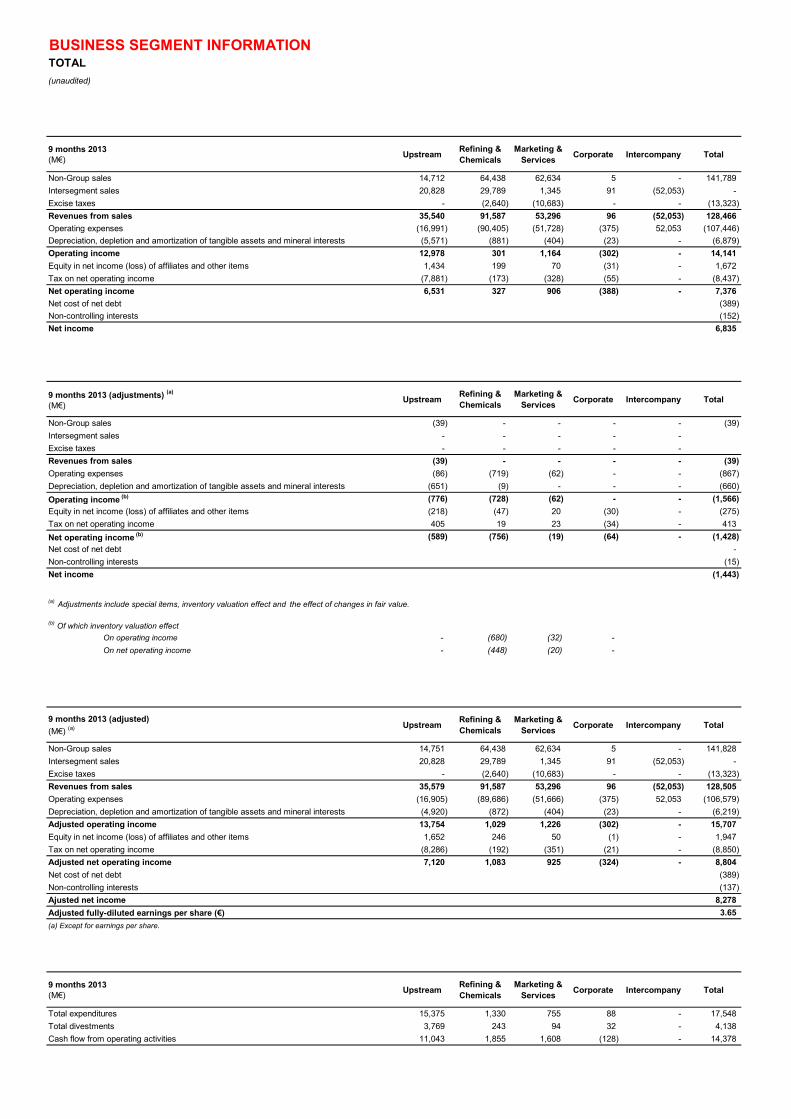
BUSINESS SEGMENT INFORMATIONTOTAL(unaudited)
9 months 2013(M€) Upstream Refining &
ChemicalsMarketing &
Services Corporate Intercompany Total
Non-Group sales 14,712 64,438 62,634 5 - 141,789Intersegment sales 20,828 29,789 1,345 91 (52,053) -Excise taxes - (2,640) (10,683) - - (13,323)Revenues from sales 35,540 91,587 53,296 96 (52,053) 128,466Operating expenses (16,991) (90,405) (51,728) (375) 52,053 (107,446)Depreciation, depletion and amortization of tangible assets and mineral interests (5,571) (881) (404) (23) - (6,879)Operating income 12,978 301 1,164 (302) - 14,141Equity in net income (loss) of affiliates and other items 1,434 199 70 (31) - 1,672Tax on net operating income (7,881) (173) (328) (55) - (8,437)Net operating income 6,531 327 906 (388) - 7,376Net cost of net debt (389)Non-controlling interests (152)Net income 6,835
9 months 2013 (adjustments) (a)
(M€)Upstream Refining &
ChemicalsMarketing &
Services Corporate Intercompany Total
Non-Group sales (39) - - - - (39)Intersegment sales - - - - -Excise taxes - - - - -Revenues from sales (39) - - - - (39)Operating expenses (86) (719) (62) - - (867)Depreciation, depletion and amortization of tangible assets and mineral interests (651) (9) - - - (660)Operating income (b) (776) (728) (62) - - (1,566)Equity in net income (loss) of affiliates and other items (218) (47) 20 (30) - (275)Tax on net operating income 405 19 23 (34) - 413Net operating income (b) (589) (756) (19) (64) - (1,428)Net cost of net debt -Non-controlling interests (15)Net income (1,443)
On operating income - (680) (32) -On net operating income - (448) (20) -
(c) Of which equity share of adjustments related to Sanofi-Aventis - - - -
9 months 2013 (adjusted)(M€) (a) Upstream Refining &
ChemicalsMarketing &
Services Corporate Intercompany Total
Non-Group sales 14,751 64,438 62,634 5 - 141,828Intersegment sales 20,828 29,789 1,345 91 (52,053) -Excise taxes - (2,640) (10,683) - - (13,323)Revenues from sales 35,579 91,587 53,296 96 (52,053) 128,505Operating expenses (16,905) (89,686) (51,666) (375) 52,053 (106,579)Depreciation, depletion and amortization of tangible assets and mineral interests (4,920) (872) (404) (23) - (6,219)Adjusted operating income 13,754 1,029 1,226 (302) - 15,707Equity in net income (loss) of affiliates and other items 1,652 246 50 (1) - 1,947Tax on net operating income (8,286) (192) (351) (21) - (8,850)Adjusted net operating income 7,120 1,083 925 (324) - 8,804Net cost of net debt (389)Non-controlling interests (137)Ajusted net income 8,278Adjusted fully-diluted earnings per share (€) 3.65(a) Except for earnings per share.
9 months 2013(M€) Upstream Refining &
ChemicalsMarketing &
Services Corporate Intercompany Total
Total expenditures 15,375 1,330 755 88 - 17,548Total divestments 3,769 243 94 32 - 4,138Cash flow from operating activities 11,043 1,855 1,608 (128) - 14,378
(a) Adjustments include special items, inventory valuation effect and the effect of changes in fair value.
(b) Of which inventory valuation effect
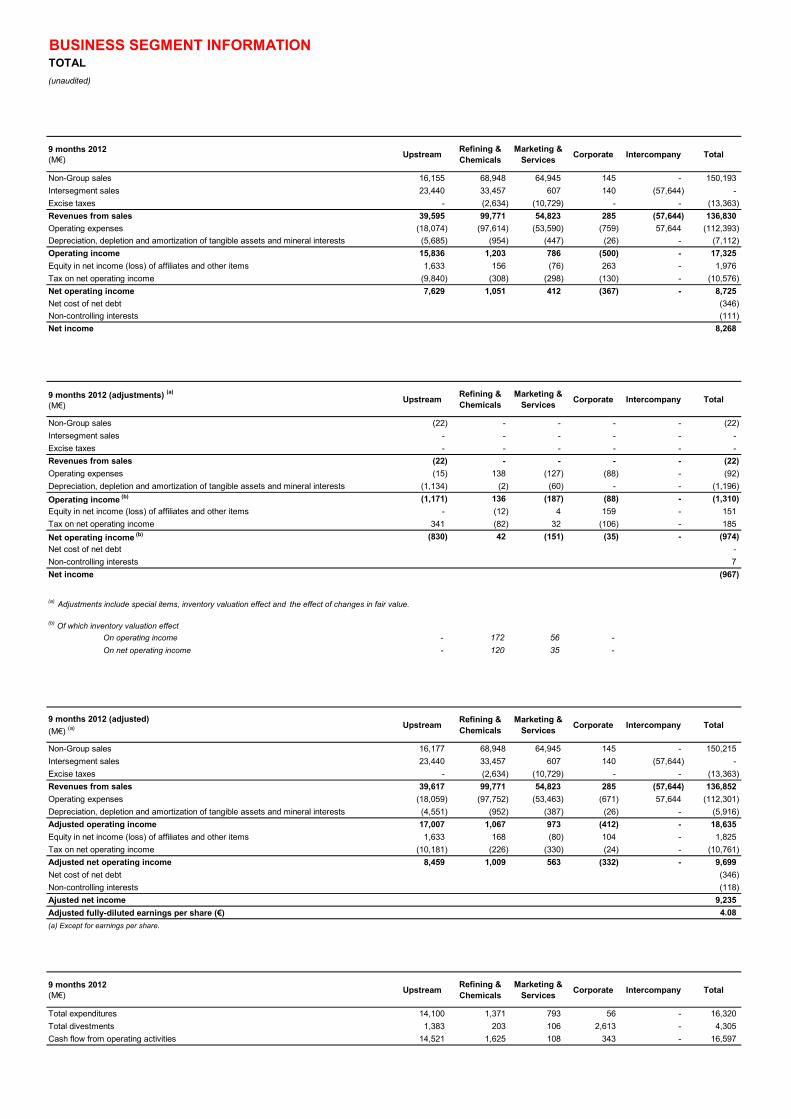
BUSINESS SEGMENT INFORMATIONTOTAL(unaudited)
9 months 2012(M€) Upstream Refining &
ChemicalsMarketing &
Services Corporate Intercompany Total
Non-Group sales 16,155 68,948 64,945 145 - 150,193Intersegment sales 23,440 33,457 607 140 (57,644) -Excise taxes - (2,634) (10,729) - - (13,363)Revenues from sales 39,595 99,771 54,823 285 (57,644) 136,830Operating expenses (18,074) (97,614) (53,590) (759) 57,644 (112,393)Depreciation, depletion and amortization of tangible assets and mineral interests (5,685) (954) (447) (26) - (7,112)Operating income 15,836 1,203 786 (500) - 17,325Equity in net income (loss) of affiliates and other items 1,633 156 (76) 263 - 1,976Tax on net operating income (9,840) (308) (298) (130) - (10,576)Net operating income 7,629 1,051 412 (367) - 8,725Net cost of net debt (346)Non-controlling interests (111)Net income 8,268
9 months 2012 (adjustments) (a)
(M€)Upstream Refining &
ChemicalsMarketing &
Services Corporate Intercompany Total
Non-Group sales (22) - - - - (22)Intersegment sales - - - - - -Excise taxes - - - - - -Revenues from sales (22) - - - - (22)Operating expenses (15) 138 (127) (88) - (92)Depreciation, depletion and amortization of tangible assets and mineral interests (1,134) (2) (60) - - (1,196)Operating income (b) (1,171) 136 (187) (88) - (1,310)Equity in net income (loss) of affiliates and other items - (12) 4 159 - 151Tax on net operating income 341 (82) 32 (106) - 185Net operating income (b) (830) 42 (151) (35) - (974)Net cost of net debt -Non-controlling interests 7Net income (967)
On operating income - 172 56 -On net operating income - 120 35 -
(c) Of which equity share of adjustments related to Sanofi - - - -
9 months 2012 (adjusted)(M€) (a) Upstream Refining &
ChemicalsMarketing &
Services Corporate Intercompany Total
Non-Group sales 16,177 68,948 64,945 145 - 150,215Intersegment sales 23,440 33,457 607 140 (57,644) -Excise taxes - (2,634) (10,729) - - (13,363)Revenues from sales 39,617 99,771 54,823 285 (57,644) 136,852Operating expenses (18,059) (97,752) (53,463) (671) 57,644 (112,301)Depreciation, depletion and amortization of tangible assets and mineral interests (4,551) (952) (387) (26) - (5,916)Adjusted operating income 17,007 1,067 973 (412) - 18,635Equity in net income (loss) of affiliates and other items 1,633 168 (80) 104 - 1,825Tax on net operating income (10,181) (226) (330) (24) - (10,761)Adjusted net operating income 8,459 1,009 563 (332) - 9,699Net cost of net debt (346)Non-controlling interests (118)Ajusted net income 9,235Adjusted fully-diluted earnings per share (€) 4.08(a) Except for earnings per share.
9 months 2012(M€) Upstream Refining &
ChemicalsMarketing &
Services Corporate Intercompany Total
Total expenditures 14,100 1,371 793 56 - 16,320Total divestments 1,383 203 106 2,613 - 4,305Cash flow from operating activities 14,521 1,625 108 343 - 16,597
(a) Adjustments include special items, inventory valuation effect and the effect of changes in fair value.
(b) Of which inventory valuation effect
* Reclassification of intercompany transactions between Upstream and Corporate for €823 million with no impact on the total of cash flow from operating activities

Reconciliation of the information by business segment with consolidated financial statements
TOTAL
(unaudited)
3rd quarter 2013(M€)
Adjusted Adjustments (a) Consolidated statement of income
Sales 46,695 (9) 46,686Excise taxes (4,658) - (4,658)
Revenues from sales 42,037 (9) 42,028
Purchases net of inventory variation (29,325) (43) (29,368)Other operating expenses (4,954) (116) (5,070)Exploration costs (568) - (568)Depreciation, depletion and amortization of tangible assets and mineral interests (2,122) (656) (2,778)Other income 139 1,005 1,144Other expense (90) (71) (161)
Financial interest on debt (159) - (159)Financial income from marketable securities & cash equivalents 9 - 9
Cost of net debt (150) - (150)
Other financial income 138 - 138Other financial expense (153) - (153)
Equity in net income (loss) of affiliates 615 10 625
Income taxes (2,806) (57) (2,863)Consolidated net income 2,761 63 2,824Group share 2,716 45 2,761Non-controlling interests 45 18 63
(a) Adjustments include special items, inventory valuation effect and the effect of changes in fair value.
3rd quarter 2012(M€)
Adjusted Adjustments (a) Consolidated statement of income
Sales 49,898 (8) 49,890Excise taxes (4,411) - (4,411)
Revenues from sales 45,487 (8) 45,479
Purchases net of inventory variation (31,375) 766 (30,609)Other operating expenses (5,288) (212) (5,500)Exploration costs (317) - (317)Depreciation, depletion and amortization of tangible assets and mineral interests (2,096) (1,150) (3,246)Other income 142 332 474Other expense (114) (15) (129)
Financial interest on debt (154) - (154)Financial income from marketable securities & cash equivalents 8 - 8
Cost of net debt (146) - (146)
Other financial income 141 - 141Other financial expense (135) - (135)
Equity in net income (loss) of affiliates 627 14 641
Income taxes (3,513) 14 (3,499)Consolidated net income 3,413 (259) 3,154Group share 3,364 (282) 3,082Non-controlling interests 49 23 72
(a) Adjustments include special items, inventory valuation effect and the effect of changes in fair value.

Reconciliation of the information by business segment with consolidated financial statements
TOTAL
(unaudited)
9 months 2013(M€) Adjusted Adjustments (a) Consolidated
statement of income
Sales 141,828 (39) 141,789Excise taxes (13,323) - (13,323)
Revenues from sales 128,505 (39) 128,466
Purchases net of inventory variation (89,530) (712) (90,242)Other operating expenses (15,902) (155) (16,057)Exploration costs (1,147) - (1,147)Depreciation, depletion and amortization of tangible assets and mineral interests (6,219) (660) (6,879)Other income 270 1,257 1,527Other expense (264) (1,523) (1,787)
Financial interest on debt (510) - (510)Financial income from marketable securities & cash equivalents 45 - 45
Cost of net debt (465) - (465)
Other financial income 398 - 398Other financial expense (418) - (418)
Equity in net income (loss) of affiliates 1,961 (9) 1,952
Income taxes (8,774) 413 (8,361)Consolidated net income 8,415 (1,428) 6,987Group share 8,278 (1,443) 6,835Non-controlling interests 137 15 152
(a) Adjustments include special items, inventory valuation effect and the effect of changes in fair value.
9 months 2012(M€) Adjusted Adjustments (a) Consolidated
statement of income
Sales 150,215 (22) 150,193Excise taxes (13,363) - (13,363)
Revenues from sales 136,852 (22) 136,830
Purchases net of inventory variation (95,172) 228 (94,944)Other operating expenses (16,187) (320) (16,507)Exploration costs (942) - (942)Depreciation, depletion and amortization of tangible assets and mineral interests (5,916) (1,196) (7,112)Other income 447 541 988Other expense (314) (362) (676)
Financial interest on debt (511) - (511)Financial income from marketable securities & cash equivalents 67 - 67
Cost of net debt (444) - (444)
Other financial income 435 - 435Other financial expense (389) - (389)
Equity in net income (loss) of affiliates 1,646 (28) 1,618
Income taxes (10,663) 185 (10,478)Consolidated net income 9,353 (974) 8,379Group share 9,235 (967) 8,268Non-controlling interests 118 (7) 111
(a) Adjustments include special items, inventory valuation effect and the effect of changes in fair value.

![11B 14B (k) vs vs vs vs vs vs vs vs vs vs vs vs vs vs vs ...sanspo-dbls-golf.com/pdf/2017/20171114c.pdf · 11B 14B (k) vs vs vs vs vs vs vs vs vs vs vs vs vs vs vs *7+1 Y—F2 Ll.]](https://static.fdocuments.net/doc/165x107/5bf8a68d09d3f294138c8536/11b-14b-k-vs-vs-vs-vs-vs-vs-vs-vs-vs-vs-vs-vs-vs-vs-vs-sanspo-dbls-golfcompdf2017.jpg)


![= TOTAL HEAD METERS ca_uMN WATER [m] vs vs VS VS vs VS vs vs VS 1 R27 1 R:30 1 gaz 1 gas VS VS VS VS vs vs vs vs VS vs VS VS VS vs vs 188, 7 233, 3 us,o 7 513,3 3 121.7 221.3 276.7](https://static.fdocuments.net/doc/165x107/5af256f17f8b9a8b4c9006d8/-total-head-meters-caumn-water-m-vs-vs-vs-vs-vs-vs-vs-vs-vs-1-r27-1-r30-1-gaz.jpg)