NEWS 01.2010 GB · and matrix. This is not always the case in routine analysis and can lead to...
24
NEWS 1/2010 NEWS SALD series: Particle size analysis in the nano and sub- nano range New: Nexera LC-30A The Masterpiece RF-20A and RF-20AXS: The world’s most sensitive fluorescence detectors Atomic absorption spectrometry AA-7000: Thallium effectively fired up
Transcript of NEWS 01.2010 GB · and matrix. This is not always the case in routine analysis and can lead to...

NEWS
1/2010
NEWS
SALD series: Particle sizeanalysis in the nano and sub-nano range
New: Nexera LC-30AThe Masterpiece
RF-20A and RF-20AXS:The world’s most sensitivefluorescence detectors
Atomic absorption spectrometry AA-7000:Thallium effectively fired up

Follow us on:
.com/ShimadzuEuropewww.
Shimadzu NEWS, Customer Magazine of Shimadzu Europa GmbH, Duisburg
Publisher:Shimadzu Europa GmbHAlbert-Hahn-Str. 6 -10 · D - 47269 DuisburgPhone: +49 - 203 - 76 87- 0 Telefax: +49 - 203 - 76 66 [email protected]
Editorial Team:Uta Steeger · Phone: +49 - 203 - 76 87- 410 Ralf Weber, Tobias Ohme
Design and Production:m/e brand communication GmbH GWADüsseldorf
Circulation:German: 9,460 · English: 22,920
©Copyright:Shimadzu Europa GmbH, Duisburg, GermanyMarch 2010
Windows is a Trademark of Microsoft Corporation
IMPRINT
Thallium effectively fired up – Atomic absorption spectrometry »2
Intelligent textiles – Advantages of the triple-detector integrating sphere »6
Analysis of environmental samples – Qualitative and quantitative analysis of PCBs and PBDEs »8
Ocean’s Eight – TOC, TN and sea water »10
Springtime – New universal testing machine with spring testing software »11
Banning allergies – DMF screening of leather and textile products »12
New: The Masterpiece – UHPLC Nexera – Unmatched in speed, resolution and productivity »4
Not just for the teeny-weenies – SALD series: Particle size analysis in the nano and subnano range »14
The world’s most sensitive fluorescence detectors – RF-20A, RF-20AXS »16
Now available for protein measure-ments – BioSpec-nano » 18
»TOC Virtual Advisor« – TOC around the clock – online support »24
New integrated FTIR accessories – IRAffinity -1 »7
Acute multiple drug intoxication – TOX.I.S. in the clinical toxicology laboratory »19
Software for LC and LCMS – LabSolutions 5 »22
APPLICATION
TELEGRAM
PRODUCTS
READ FOR YOU
SOFTWARE
Next Era – Nexera
APPLICATION Shimadzu News 1/2010
2
Thallium effectiv
Thallium, as well as theequally toxic elements leadand cadmium, belongs to
the group of heavy metals. Thalli-um is prevalent in nature, forinstance in potassium-containingclays and soils. Thallium is usedin the manufacture of optic glass-es for fax machines and photo-copiers, just to mention one ex-ample of an industrial application.
The element is present in verysmall amounts in foods, drinkingwater and in air. Increased thalli-um concentrations are mostnotably measured near cementplants and smelters.
Thallium is extremely toxic. Wheningested through food, it is quick-ly resorbed and distributed in thebody. It acts as a cellular poison
and inhibits several enzyme sys-tems. A level of 1.5 mg of thalli-um per kg body weight is alreadysufficient to trigger symptoms ofpoisoning – loss of appetite, nau-sea and vomiting, severe peripher-al and central nervous system dis-orders, which can lead to comaand even death.
No limit values for thallium
Humans primarily absorb thalli-um through food. Particularly in vegetables, relatively highamounts of thallium can be de-tected. The average daily amountof thallium absorbed has beenestimated at 2 - 5 μg per day.Thallium concentrations of up to15 μg per liter have been detectedin natural mineral waters.
Figure 1: AA-7000 fully automated atomic
absorption spectrometer

3
APPLICATIONShimadzu News 1/2010
vely fired up Atomic absorption spectrometry
There are no limit values for thal-lium in the European DrinkingWater Ordinance of 2006. The USEPA refers to a maximum valueof 2 μg/L in its Drinking WaterStandard based on a water con-sumption of 2 liters per day.
Quantitative determinationvia AAS
Atomic absorption spectrometryis excellently suited to the quanti-tative determination of thallium.This relative quantificationmethod is based on the relation-ship of the concentration of theelement and the absorptionaccording to the Lambert-Beerlaw. In principle, for every ele-ment to be determined a calibra-tion curve is established in thedesired concentration range and isused to quantitate all unknownsamples. A basic condition foraccurate results is that the calibra-tion standards and samples havethe same composition with re-spect to accompanying elementsand matrix. This is not always thecase in routine analysis and canlead to problems, particularlywhen, in addition to elementabsorption, background absorp-tion of the matrix contributes tothe signal.
High-speed self-reversalmethod fully compensatesinterferences
Interferences such as molecularabsorption, particulate causedscattering and spectral interfer-ences by absorption line overlapcan be eliminated by effectivebackground compensation tech-niques. For complete compensa-tion for all known interferences
occurring in atomic absorptionspectrometry (in the flame as wellas in the electrothermal atomiza-tion mode) the high-speed self-reversal method has become wellestablished. Unlike the deuteriumbackground compensation tech-nique which is only applicable inthe wavelength range of up to 420 nm, the high-speed self-rever-sal method is applicable in theentire wavelength range from 185up to 900 nm.
Quantitative determination of theelement thallium in aqueous sam-ples has been carried out usingShimadzu’s AA-7000 atomic ab-sorption spectrometer (figure 1),which is equipped as standardwith deuterium and high-speedself-reversal background compen-sation. For electrothermal atom-ization, the high sensitivity GFA-7000 graphite furnace with digitalcontrol was used. For experimen-tal investigations, standard solu-tions, diluted measuring solutionsas well as reference standard solu-tions were used.
Thallium determination was car-ried out in the concentrationrange of 1 to 10 μg/L using elec-trothermal atomization in theGFA-7000 in accordance withDIN 38406-26:1997-07, Germanstandard methods for the exami-nation of water, waste water andsludge – Cations (group E) – Part26: Determination of thallium byatomic absorption spectrometry(AAS) using electrothermal atom-isation (E 26).
Atomization was carried out at2,700 °C on a pyrolytically coatedgraphite tube with Omega plat-form while adding a rhodiummodifier.
Reliable determination of toxic heavy metals
Under these conditions, aqueoussamples can be analyzed withoutinterferences. The ASC-7000 sam-Figure 2: Thallium calibration curve in the concentration range up to 10 μg/L
Figure 3: Peak profile at 2,700 °C
atomization temperature
ple preparation station enablesfully automated processing of 60samples within one analytical run.The quality assurance criteria ofthe WizAArd software allow theuse of laboratory control samplesand automated calculation of therecovery rates. The absorptionsignals are shown in figure 3 withthe element signal in red as wellas the background signal in blue.The AA-7000 in combinationwith the GFA-7000 is a suitablemonitoring system for reliabledetermination of toxic heavy met-als such as thallium in drinkingwater and mineral water.
We will gladly send you further informa-
tion. Please note the appropriate number
on your reply card. Info 370
0.000
0.050
0.100
0.150
0.200
0.000 1.000 2.000 3.000 4.000 5.000 6.000 7.000 8.000 9.000 10.000 11.000
Concentration (μg/L)
Ab
sorp
tio
n
0.000
0.050
0.100
0.150
0.200
0.250
2.5 5.0
Concentration (μg/L)
Ab
sorp
tio
n

can be used for isocratic separa-tions, for binary gradients (twopumps) or for ternary gradients(three pumps). In terms of soft-ware, a compensation function forthe different mobile phase com-pressibilities is implemented.
Fast chromatography andhighest possible resolution
Due to the pressure range of upto 130 MPa, not only faster chro-matographic separations can beachieved, but also attaining of the highest possible resolutionthrough use of longer columnswith smaller particles. For exam-ple, figure 4 shows how highplate numbers can be attained fora mixture of alkyl phenones bycoupling a second column.
New mixing chamber
Major changes have been carriedout to the mixing chamber: in-stead of the relatively large mix-ing chamber volume used formany years, a micro-reactor(MiRC) is now implemented,achieving much better results for standard applications with its small mixing volume of only20 μL. A 180 μL mixer is availablefor mixing complex mobile phas-es, for instance when using TFAas an additive in the mobile phase.This is a critical advantage partic-ularly in terms of system volume,when considering the associatedshorter gradient elution times.
Autosampler with outstand-ing performance data
Showstopper of the new system isthe SIL-30A autosampler (fig. 5),
PRODUCTS Shimadzu News 1/2010
4
The Masterpiece
UHPLC – Ultra high-pressure or ultra high-performance liquid chro-
matography? These terms are toooften mixed up or used incorrect-ly. High-pressure is often con-fused with high-resolution andhigh-resolution equates to high-pressure.
But first let’s explain where ultrahigh-pressure starts. A value of approximately 1,000 bar (100MPa) can be regarded as a criticalpoint (the transition from HPLCto UHPLC from a pressure-tech-
packing as well as properties ofthe analytes – must be taken intoaccount.
Independently of clear transitionvalues or other generally validdefinitions – the trend towardsachieving increased HPLC systemproductivity remains unchanged.Pressure specifications and thehighest attainable chromatograph-ic resolution play a decisive role -whereby care should be observedwith the use of the aforemen-tioned association high-pressure =high-resolution.
The newly developed LC-30ANexera UHPLC system
The LC-30A Nexera is similar tothe successful prominence series,but an entirely novel developmentlies concealed within its housing.Crucial changes have been madeto the existing prominence con-cept while longstanding positivefunctionalities have been retained.Shimadzu’s extensive HPLCknowledge has been enhancedwith many suggestions and tech-nologies from other businessareas.
The CBM-20A control unit con-tains modified software (figure 2)in order to control the new mod-ules and to support the consider-ably enhanced functionality of theindividual components, such asautosamplers.
Pump pressures of 130 MPa
Based on 20 years of successfulparallel micro piston technology,the LC-30AD pump (figure 3) isvirtually pulse-free and features amodified drive concept designedto enable pump pressures of 130MPa and to deliver flow rates ofup to 3 mL/min. Modifications ofthe piston and seals also ensure aservice life that can normally beattained only in the conventionalHPLC backpressure operationalrange (up to 40 MPa). The pump
nical perspective). Above thispressure, the demands on anHPLC system increase greatly. To make an UPLC system suit-able for routine use while beingrobust and reliable requires con-siderably more effort and techni-cal know-how.
It is more difficult to specify atransition value for ultra high-res-olution chromatography. This isbecause, in addition to the HPLCsystem, column properties – suchas particle size, chemical andphysical parameters of the column
UHPLC Nexera – Un
Figure 1: Nexera system in the standard configuration with additional autosampler
rack changer
Figure 2: CBM-20A screen – SIL-30AC autosampler parameters Figure 3: LC-30AD pump

5
PRODUCTSShimadzu News 1/2010
whose performance again surpass-es its predecessor in terms of sam-ple carryover and reproducibility,and consequently strengthens itsspecial position in the HPLCmarket. In addition to adjust-ments to the stator and the rotorof the high-pressure valve to
ensure an improved service lifeeven under extreme pressures, theneedle and needle port have beenchanged in order to keep the con-tact surface between the needleand needle port as small as possi-ble.
For internal and external needlerinsing, three rinse solvents aswell as an additional active rinsepump are standard. All of theseadditional functions can be acti-vated individually depending
on the application, and their se-quence can be specified. Toachieve the shortest possible cycletimes it is still possible to inject 5 μL in 10 seconds. Conversely:when all options for needle rins-ing are activated, the cycle timeincreases, which is certainly ac-ceptable when elimination ofsample carryover is needed, par-ticularly in high-resolution MS/MS analyses.
In addition to the proven princi-ple of direct injection (DIIMS –direct injection with isolatedmetering system) which offersaccurate injections, sample loopinjection is optional. This injec-tion method dramatically reducessystem volume, in particular forshort and fast gradients, and con-tributes greatly to higher produc-tivity of the entire system.
Functions for overlapping injec-tion and sample preparation com-plete the system specifications.The standard product configura-tion contains racks for 105 samplevials with a volume of 1.5 mL aswell as a standard/control rackfor 10 standards.
To increase sample capacity, amodified rack changer (RackChanger II) is available, whichcan additionally accommodatefour sample trays with a maxi-
Figure 4: Separation of alkyl phenones using a water/acetonitrile (20/80)
mobile phase
Figure 6: Nexera system with LCMS-2020
Figure 5: SIL-30AC with open front door
0
0
25
50
75
100
125
255075
100125150175
0.0
0.0 1.0 2.0 3.0 4.0 5.0 min.
0.5 1.0
mAU150 mmL � 300 mmL 1.8 um
150 mmL
53 MPa
NTP at peak 7 = 35537
Rs (1.2) = 5.01
Width (1) 50 % = 0.013 min
Zorbax eclipese plus C18 ODS(2.1 mmi.d. 150 mm, 1.8 um)0.5 mL/minWater/acn = 20/8050 C245 nm
Zorbax eclipese plus C18 ODS(2.1 mmi.d. 300 mm, 1.8 um)0.5 mL/minWater/acn = 20/8050 C245 nm
1. Acetophenone2. Propiophenone3. Butyrophenone4. Valerophenone5. Hexanophenone6. Heptanophenone7. Octanophenone
1.8 um
300 mml
115 MPa
NTP at peak 7 = 69325
Rs (1.2) = 7.14
Width (1) 50 % = 0,018 min
mAU
1.5 2.0 2.5 min.
+ 150 mmL
mum of 12 microtiter plates con-taining 96 or 384 wells, alterna-tively 12 holders for 54 additionalsample vials of 1.5 mL each.Compared to the model’s prede-cessor, a window is integratedinto the front panel which enablesmonitoring of what is takingplace within the autosampler.
Column oven for high-temperature analysis up to 150 °C
Other avenues were pursued interms of column thermostat whencompared to the LC-20A promi-nence. In addition to the air circu-lation ovens which are still avail-able in the prominence productrange and operate smoothly withthe Nexera, a CTO-30A columnoven is available for high-temper-ature analysis up to 150 °C. Inaddition to a solvent preheaterwith a low-volume of only 3 μLand an optional post-columncooler, the oven also containsslots for installation of twoswitching valves. A special con-trol function, the heat-balancer,compensates temperature differ-ences occurring over the columnby high pressure separations andenables a constant temperature onthe column, which is very impor-tant as far as reproducibility offast and high resolution separa-tions are concerned. Furthermore,
matched in speed, resolution and productivity
the high temperature range allowsthe use of the oven as well as thepost-column reactor, significantlyextending the application range.
Versatile detector compatibility
In addition to the RF-20A/AXSfluorescence detector describedon page 16 of this issue, theproven UV and PDA detectors ofthe LC-20A prominence series arealso available for the Nexera sys-tem. Both are equipped withoptions for 100 Hz data acquisi-tion and the tempered flow cellsensure a favorable signal-to-noiseratio for sensitive detection. MSor MS/MS detectors tuned to theincreased separation performancewith adequate sensitivity are,however, preferred.
We will gladly send you additional informa-
tion. Please indicate the corresponding
code on the reply card. Info 371

The purple colored UV-VIS-NIRspectrum shows filtering at 800nm and an inflection point at awavelength of 737 nm, as well asthe highest reflectance in the NIRrange of 2,500 up to 750 nm com-pared to other textiles. The textilesample shown in figure 2 is espe-cially UV reflecting (orange-redspectrum). Both surfaces (silverand cream colored surface) showweaker reflectance in the visiblerange. These surfaces show goodheat-reflecting properties in theNIR range.
The spectrum of the grey sample(light brown spectrum) exhibitseven lower thermal radiation aswell as reduced light transmissi-bility in the visible range. This iscertainly a suitable textile fordarkening a room. Furthermorethe various organometallic com-pounds in combination with thepolymer generate a NIR spec-trum that enables identificationof the polymer. The fibers consistof polyester plus an ‘intelligent’metallic dye.
With the Shimadzu UV-3600triple-detector system and theassociated ISR-3100 integratingsphere with three detectors, the
APPLICATION Shimadzu News 1/2010
6
light, respectively sunlight. Forthis purpose, materials with twodifferent surfaces have been in-vestigated. An example of a silverand a cream colored surface isshown in figure 2.
The behavior of the material,when light, heat and strong UVradiation hits the textile, is ofspecial interest.
Instrument and measuringconditions
For analysis, a UV-VIS-NIRinstrument was used. The UV-3600 spectrophotometer con-tains an integrating sphere (Ul-bricht sphere). It is equipped withthree detectors in order to meas-ure the entire range from UV toNIR with higher sensitivity.• Instrument: UV-3600• Integrating sphere: ISR-3100
with three detectors.
Measurements were carried outunder 0° reflectance conditions.This method leads to the determi-nation of diffuse reflectance ofthe sample surface. Figure 3 pro-vides a short description of thereflectance of light at a surfacewith specularly reflected light and
I n Europe the previousdecade was the warmestsince recording of tempera-
ture in Germany which approxi-mately began 130 years ago. Tem-peratures have also been risingaround the rest of the globe. Thisdoes not lead to energy-savinghowever, as air conditioning sys-tems are used during the summerto cool living spaces and workplaces. These require much elec-tricity, which also increases costs.Ideas are welcome on how toreduce warming of living andworkspaces resulting from solarirradiation.
Suitable textiles already exist forcars or commercial buildings andoffices. Glass panes coated withlight-reflecting layers are alsoavailable to reduce heat or toprovide anti-glare shields forwindows. At the same time,roller blinds or sun blinds canserve as screens.
The surfaces of these types oftextiles, as used for sun blinds,are shown in figure 2.
This article shows how textilescan be used to allow or to blockdifferent wavelength ranges of
diffusely transmitted light, at anincident light angle of 45°. Inorder to block specularly reflect-ed light, an incident light angle of0° is applied. Figure 4 schemati-cally shows the alignment of thesample to the integrating spherewhen only the diffusely transmit-ted light is measured.
Measuring results
Under these measuring condi-tions, several textiles were ana-lyzed in order to determine thebest properties of the materialunder the aspects of heat trans-missibility and UV transmissibi-lity.
Intelligent textiles reduce warmiworkspaces Advantages of the triple-detector integratin
Figure 1: A typical window blind – a vertical blind Figure 2: Textile with two surfaces, a silver and a cream colored layer of a roller
blind material
Figure 3: Reflectance of light at a
surface

7
TELEGRAMShimadzu News 1/2010
entire UV-VIS-NIR range can beinvestigated with high measuringsensitivity in one single measure-ment.
Legend
UV = Ultraviolet – too much UV
light can cause skin cancer
and eye damage
ing of ng sphere
Figure 4: Alignment of the experiment
VIS = Visible light – this is the work-
ing range of the human eye
NIR = IR is the thermal radiation;
NIR is the near-infrared spec-
tral range of the radiation.
-5.004
0.000
50.000
98.274
190.00 500.00 1000.00 1500.00 2000.00 2500.00nm.
R %
orange-red = sample with silver and cream
colored surfaces
purple = sample with green surface
blue = sample with brown surface
green = sample with grey surface
light brown = low-density grey sample
Figure 5: UV-VIS-NIR spectra of various textiles composed of polymer and metal
layering
New integrated
FTIR accessories
IRAffinity-1
FTIR instruments with attenuated total reflectance (ATR) for surface meas-urements have revolutionized infrared spectroscopy. The ATR measuringtechnique requires an easy sample preparation and post-processing. Identi-fication or quality control can be carried out simply, effectively and quickly.
The ATR technique has been further advanced – through its single reflec-tance accessories. Now, even less sample quantity and time are needed forsample preparation and post-processing than ever before. In addition, due totheir small sample plate surface area, these accessories are extremelyrobust. Sample plates manufactured out of diamond are almost indestructi-ble. This leads to higher sample throughput and to any possible contamina-tion of the sample compartment.
In order to meet the demands of high sample throughput and fast measure-ment, a new accessory concept has been developed for the IRAffinity-1. In 2010, Shimadzu will introduce its new ‘integrated accessories’ for theIRAffinity-1. The accessories originate from the single reflectance and theHATR-techniques. A single reflectance unit, for instance, enables the pro-cessing of large samples as the measuring position is situated on top of theinstrument housing. These accessories expand the already wide range ofproducts. More news will be available at analytica 2010.

APPLICATION Shimadzu News 1/2010
8
Comprehensive GCxGCwith thermal modulationhas a high separation
power for complex matrices [1].
In this technique, analytes arecontinuously refocused betweentwo columns and released in partto a second column. Here anRTX-1 30 m, 0.25 mm, 0.25 μmwas coupled to a BPX-50 1 m,0.15 mm, 0.15 μm with a loop of1.6 m between, giving two stagethermal modulation with just onecold and one hot jet. The newZOEX ZX2 Modulator was used(ZOEX corporation, USA) whichcools the gas for the cold jet withan electronic cooling unit, elimi-nating the need for liquid nitro-gen. The specification of this mo-dulator covers modulation from
Figure 1: NCI spectra for chloro-, trichloro-, tetrachloro- and hexachlorobiphenyl with
ammonia as reagent gas
Figure 2: TIC data together with extracted ion chromatograms of a water sample
extract taken from Westerschelde, the Netherlands. From the TIC the extracted ions
of 35, 79 and 497.3 are also shown to indicate the position of target compounds.
C7 on (C2 for ZX1 with liquidnitrogen). As MS detector, thehigh speed GCMS-QP2010 Pluswas used (50 spectra/sec, 10,000amu/sec over 148 amu).
Negative chemical ionizationshows high sensitivity to PCBsand PBDEs. In addition, thismode is usually much less sensi-tive to matrix signals, resulting incleaner data relative to the targetcompounds [2]. However, forNCI the ionization process forPCBs is different with chlorina-tion, and reagent gas. PCB mol-ecules having low degree of chlo-rination such as trichlorobiphe-nyl, show only a 35 ([CL]-, dis-sociative electron capture) frag-ment while penta to deca chloro-biphenyl show 35 as well asmolecular responses (resonanceelectron capture).
The relative intensity of themolecular mass signal to the oneof chlorine dissociation is highestusing ammonia as reagent gas.This is further influenced by theion source temperature. Here 150 °C was used. Figure 1 showsNCI spectra for chlorobiphenyl,tri-, tetra- and hexachlorobiphe-
nyl with NH3 as reagent gas.While chlorobiphenyl gives adominant m/z = 35 (MW 188),PCBs with higher degree of chlo-rination show the isotopic distri-bution of resonance electron cap-ture. The intensity of the latterdepending on reagent gas pres-sure in the ion source will bestudied in a subsequent work.
A real sample extract from waterat Westerschelde, the Nether-lands, was analyzed which con-tains PCBs and PBDEs (Poly-Brominated Diphenyl Ethers)contaminants. The latter wereused as flame retardants fordecades and appeared as contami-nants in the environment, andsubsequently in the food chain.Analysis of these substances inenvironmental samples has re-cently been regulated by the EU.PBDE spectra in NCI modeshow mainly dissociative frag-ments at 79 and 81 related to[Br]- (and less intensive 2 [Br]-
signals), more or less independ-ently of the reagent gas. The TICdata and extracted ions for 35(Cl), 79 (Br) and 497.3 (Deca-CB)of the sample is shown in fig-ure 2.
Analysis of environmentQualitative and quantitative analysis of PCBs and PBD
0.00
0.0
2.5
5.0
0.250.500.751.001.251.50
(x 1,000,000)
chlorobiphenyl
trichlorobiphenyl
tetrachlorobiphenyl
hexachlorobiphenyl
(x 10,000)
(x 100,000)
(x 1,000,000)
(x 10,000)
50
0.0
0.0
1.0
2.0
3.0
0.0
1.0
2.0
3.0
2.5
5.0
50 100 150 200 250 300 350 400 450 500
50 100 150 200 250 300 350 400 450 500
50 100 150 200 250 300 350 400 450 500
100 150 200 250 300 350 400 450 500
0.00.51.01.52.02.53.03.54.04.55.05.56.06.57.07.58.08.5
(x10,000,000)
10.0 15.0 20.0 25.0 30.0 35.0 40.0 45.0 50.0 55.0 60.0 65.0 70.0 75.0 80.0
Mainly
PCB related
Trace for PBDE relevant
signals
Deca-CB

9
APPLICATIONShimadzu News 1/2010
Figure 4: SIM data of PBDE related signals. The signal to noise ratio for BDE 105 is
15,100 :1 RMS for 20 ng/mL extract.
Figure 3: Extracted ion images of 35 (top) and 79 (bottom)
Due to the above mentioned frag-mentation characteristics, a massrange of 34 to 500 amu was selec-ted for the analysis. The GC pro-gram started at 100 °C with aramp of 2.5 °C/min to 280 °C for20 minutes. The modulation fre-quency was set to eight sec whichresulted in at least three peaks percompound. More than 10 fullscan data points were acquiredfor each modulated peak, allow-ing quantitative determination ofthe contaminants. To performthis, a standard sample was injec-ted. The injection volume was
1 μL (splitless) into the SPL-2010injector (280 °C).
The extracted ion images for 35and 79 produced from the com-prehensive TIC data are shown asa 3-dimensional plot in figure 3.Due to the high selectivity of thenegative chemical ionization, theimage is quite clean of the matrixand dominated by PCB andPBDE related signals. The esti-mated range of contamination forPCBs covers from 20 to 200 ng/mL extract. PBDEs mainly foundwere BDE 28, 49, 47, 58, 100, 99,
154 and 153 with a range of con-centrations between 0.1 and 20 ng/mL extract.
In order to reach highest sensitiv-ity for the PBDEs a SIM experi-ment in NCI mode was per-formed with 35, 79 and 81 amu.The signal to noise level for BDE105 is calculated to be 15,100 :1(79) for a concentration of 20 ng/mL extract. The relevant signal isshown in figure 4. From this thelimit of quantification can be cal-culated to be in the ppt rangewhich is more than compatiblewith regulation limits.
References[1] (a) John B. Phillips und Zaiyou
Liu. “Chromatographic Technique
and Apparatus”, U.S. Patent No.
5,135,549; August 4, 1992.
(b) John B. Phillips und Zaiyou
Liu. “Apparatus and Method
for Multi-dimensional Chemical
Separation,” U.S. Patent No.
5,196,039
[2] J.-F. Focant et al., LCGC The
Application book, March 2009
tal samplesDEs
0.000.0501.001.502.002.503.003.504.004.505.005.506.006.507.007.508.008.509.009.51.001.05
(x10,000,000)
10.0 15.0 20.0 25.0 30.0 35.0 40.0 45.0 50.0 55.0 60.0 65.0 70.0 75.0 80.0 85.0 90.0
BDE 105

RSD [%]
1,08
1,63
1,69
0,54
RSD [%]
1.36
1.25
1.78
1.08
Mean area
16.638.6063.5341.8701.1450.702
APPLICATION Shimadzu News 1/2010
10
Measurement conditions:Method: NPOCAcidification: 1.5 %Sparging: 1.5 minSample: Natural sea waterPotassium hydrogen phthalateused for spiking.
TN Measurement in sea water
Four sea water samples of TNanalysis are listed in table 2.Three of them were spiked with 1 mg N/L, 2 mg N/L and 4 mgThis article does not de-
scribe an early Hollywoodblockbuster, but rather sea
water and inorganic salts instead.Eight samples from the ocean’ssea water were analyzed.
TOC (total organic carbon) is animportant indicator of organiccontamination. TOC measure-ment is widely conducted tomonitor and research environ-mental and sea water pollution.The measurement of TN (TotalNitrogen), which causes eutroph-ication, has attracted attention inrecent years.
Sea water contains large amountsof salts. The TOC-V combustion
analyzer can directly analyzesamples containing large concen-trations of inorganic salts accu-rately and without dilution orother pre-treatment procedures.Furthermore, by combining theTNM-1 unit with the TOC-VCseries, TOC and TN can bemeasured simultaneously.
TOC measurement in sea water
Table 1 shows the results of TOCanalysis of four sea water sam-ples. Three of them were spikedwith 1 mg C/L, 2 mg C/L and 4 mg C/L TOC. The instrumentwas calibrated up to 5 mg C/Lusing potassium hydrogen phtha-late as standard. All of the sam-ples were accurately analyzedwithout any pre-treatment suchas dilution.
Calibration curve
NPOC calibration curve is up to5 mg/L. This calibration curvewas performed with auto dilutionfunction from a 5 mg/L TOC(potassium hydrogen phthalate)standard solution.
Figure 2: NPOC-Calibration Curve 5 mg/L
Figure 1: TOC-V + TNM-1
N/L TN. The system was cali-brated up to 5 mg N/L usingpotassium nitrate as standard. Allof the samples were accuratelyanalyzed without any pre-treat-ment, e.g. dilution.
Measurement conditions:Method: TNSample: Natural sea waterPotassium nitrate used for spik-ing.
Maintenance
Due to high salt content, analysisof sea water samples requireshigher maintenance comparedwith other applications such asanalysis of drinking water. Nev-ertheless, 700 injections of seawater samples can be conductedbefore maintenance is required(injection volume 50 μl). The saltin the sea water accumulates on
5.0002.5001.0000.5000.2500.125
Stock solution
[mg/L]
Dilution factor Concentration
[mg/L]
5.0005.0005.0005.0005.0005.000
125
102040
0,51 ± 0,01
1,53 ± 0,02
2,59 ± 0,04
4,45 ± 0,02
0.72 ± 0.01
1.77 ± 0.02
2.80 ± 0.05
4.85 ± 0.05
Sample
Sea water
Sea water + 1 mg/L TOC
Sea water + 2 mg/L TOC
Sea water + 4 mg/L TOC
TOC as NPOC [mg/L]
Sample
Sea water
Sea water + 1 mg/L TOC
Sea water + 2 mg/L TOC
Sea water + 4 mg/L TOC
TOC as NPOC [mg/L]
Table 1: Results of NPOC determination
Table 2: Results of TN determination
the catalyst. The catalyst cantherefore be regenerated external-ly and used again. Cracked ballsand dust must be removed. After-wards a small amount of new cat-alyst balls are required to reachthe recommended filling height.Depending on the condition ofthe combustion, it can be usedagain for several fillings.
Conclusion
Based on the measurement exam-ples where TOC and TN stan-
dards were added to the seawater, it is clear that the TOCand TN were accurately meas-ured without being influenced bysalts or other coexisting sub-stances.
We will gladly send you further tips and
tricks. Please note the appropriate num-
ber on your reply card. Info 372

8.352607.994888.277987.314318.582248.104400.48895
mm
Free height
11
APPLICATIONShimadzu News 1/2010
Springtime ...New universal testing machinewith spring testing software
spring constants and the freeheight can also be automaticallymeasured and calculated. Anautomated test for the determina-tion of the absolute zero pointand the ‘free height’ can be car-ried out prior to the test series.The parameters required for thispurpose can be adjusted individu-ally.
In order to calculate dampingproperties, the force-deflectionprocess can be determined eitherduring the forward or return
spring recovers its shape. The dif-ference between absorbed andreleased energy is dependent onthe material, material strength andstructural shape of the spring, andis often specifically applied fordamping.
Parameters important forspring construction
In addition to damping, whichcan easily be calculated from aforce-deflection diagram (seebelow) via the hysteresis at eachpoint, the spring constant (springcharacteristic) as well as the so-called ‘free height’ are significantparameters for spring testing.While the spring constant is
No switch, keyboard orballpoint pen can dowithout it – the spring.
A single automobile disk brakesystem contains half a dozensprings. Springs are present inmany forms in everyday objectsbut they live in a rather hiddenexistence. Household products,industrial products or simple arti-cles in daily use, are all inconceiv-able without springs.
No matter what the form, designand individual use – springs arecomponent parts that can be de-formed reversibly by potentialenergy forces while releasing partof their stored energy again in theform of a tensile force when the
expressed as the ratio betweenforce and deflection and can bedescribed by a linear functionaccording to Hooke’s law withinthe range of use, the ‘free height’describes the absolute length of aspring and is therefore an impor-tant structural parameter.
Modern universal testingmachines can be of help to deter-mine these parameters. For thispurpose, Shimadzu’s testingmachines of the AGS-X (up to 10kN) or AG-X (above 10 kN)model series offer two completelyparallel compression plates andstiff jigs or other tensile jigs, de-pending on the intended use. Inaccordance with testing require-ments, the testing machines canbe equipped with load cells in theaccuracy classes 1 or 0.5 that areapplicable in the entire measuringrange with a precision of 1 % and0.5 % respectively.
Ergonomics, efficiency andoccupational safety
To prevent accidental release ofthe test specimen, the spring test-ing machines are equipped withsafety doors. Due to manufactur-ing tolerances of structuralsprings, virtually every springmust be tested and certified. Test-ing machines for small springs inthe AGS-X series are thereforeequipped with vertical slidingdoors, allowing exceptionallyergonomic and effective opera-tion.
Flexible software for com-prehensive data acquisitionand evaluation
In addition to the hardware,effective and state-of-the-art soft-ware is indispensible. The AGS-Xand AG-X series of universaltesters therefore use a modernspring testing software based onthe Trapezium-X software. Inaddition to the possibility ofrepeatedly preloading the spring,and in order to subsequentlyattain consistent material proper-ties, tensile as well as compressiontests can be performed. In addi-tion to the maximum and mini-mum forces and deflections, the
Name Spring constant
Parameter Force 1 - 4.5 N in total measuring range 0.05 %/FS
Max. force
Unit N/mm N
4 x 10_14 x 10_24 x 10_34 x 10_44 x 10_5MeanStandard deviation
1.051840.945610.989320.846001.056090.977770.08682
6.717055.753846.380084.801756.918116.114170.85627
Table 1: Measurement of a batch of 5 ballpoint pen springs
Figure 1: Graphical representation of a batch of ballpoint pen springs
-2
0
2
4
6
8
10
12
14
16
18
20
-1 0 1 2 3 4 5 6 7 8 9 10
Stroke (mm)
Forc
e (
N)
stroke. The results appear indi-vidually, or with different colorsand corresponding offset (asshown in the graph below) forentire test series. Outliers are vi-sualized immediately and can beemphasized with various ‘Pass/Fail’ criteria.
The spring testing module of theTrapezium-X software possessesnumerous functionalities such asstatistical functions, flexible datareporting and simple data exportin many well-known formats.
In conclusion, Shimadzu’s springtesting machines combine allcharacteristics expected of a mod-ern quality control instrument:powerful and high-precisionhardware combined with equallyflexible and user-friendly software– and all for a surprisingly favor-able price. This is truly spring-time …
We will gladly send you further informa-
tion. Please note the appropriate number
on your reply card. Info 373

APPLICATION Shimadzu News 1/2010
12
Banning allergies
F. Puype, J. SamsonekInstitute for testing and certifica-
tion, Zlín, Czech Republic
An increasing part of thepopulation suffers fromallergies. For many aller-
gic reactions it is very difficult torelate the diagnosis to a source oreven to a particular molecule. A growing need to monitor aller-gens in order to detect and regu-late them has therefore become a challenge for many scientiststoday.
The biocide dimethylfumarate(DMF), an allergen newly regu-lated by the European Union, hasbeen banned from the EU marketsince May 1, 2009. DMF protectsconsumer products based on tex-tile and leather from moulds dur-ing shipment. Consumer prod-ucts such as boots, sofas, clothes,toys but also desiccant or anti-mould sachets are impregnatedby DMF before transportation.After distribution of the goodstraces of DMF penetrate con-sumers’ skin, which may causesymptoms ranging from dermal
2009/251/EC, the ShimadzuAOC-5000 autoinjector withGCMS-QP2010S was appliedwith outstanding performance.
The challenge of mass detection
DMF is a volatile white crystallicsubstance with a molecularweight of 144.13 g/mol. Thissmall symmetric molecule makesmass detection challenging due tothe low amount of possible targetions obtained by common elec-tron impact at 70 eV. The lowfragmentation masses from DMFmay encounter spectral interfer-ence from co-elution of othersubstances present in the samplematrix. The fragmentation ion at113.1 M/z has been chosen as thequantification ion. The fragmen-tation ions at 59 and 85 M/z areprone to parallel interference andare therefore used only as identi-fication ions (figure 1).
Many potential DMF carriersmay contain interfering com-pounds originating from shoepolish, paints, perfumes, conserv-ing agents, oligomers, waxes andpolymer additives. To omit theseobstacles a 105 meter Restek RTX
allergic reactions to accute respi-ratory problems. [1]
DMF was detected as an allergenfollowing several incidents withsofas exported from Asia. Clini-cal studies proved that seriousallergic reactions already startafter skin contact with consumerproducts at levels as low as 1 mgDMF/kg. According to the Euro-pean Directive 2009/251/ECproducts or part of the productsmay not contain DMF at a con-centration level higher than 0.1 mg per kg. Due to the lowdetection limit of the directive
DMF screening of leather and textile products –
GCMS-QP2010S with AOC-5000 autoinjector
Figure 1: Electron impact mass spectrum of dimethylfumarate (70eV)
0
10
20
30
40
50
60
70
80
90
100
%
40.0 45.0 50.0 55.0 60.0 65.0 70.0 75.0 80.0 85.0 90.0 95.0 100.0 105.0 110.0 115.0 120.0 125.0 130.0

13
APPLICATIONShimadzu News 1/2010
502.2 column was used for sepa-ration (film thickness 1.80 μm,0.32 mm ID).
All samples were extracted bypressurized solvent extraction(PSE) in methanol followed by apre-concentration and filtrationstep. All extracts were injectedusing splitless injection with theShimadzu AOC-5000 autoinjec-tor into the GCMS QP2010Swith an injection temperature of270 °C. Common GC-MS condi-tions for the analysis of volatileswere applied with a commonsplitless liner. A satisfactoryretention time and a remarkablysymmetrical peak of DMF free ofco-elution and spectral interfer-ence were assured by the longanalytical column (figure 2).
EU limits far exceeded in some cases
The sensitivity of the GCMS-QP2010S enabled the lower limit
GCMS-QP2010S with AOC-5000 autoinjector
Figure 2: Chromatogram obtained in SIM mode from textile containing 0.1 mg/kg Figure 3: Calibration curve of DMF ranging from 0.015 tol 0.61 mg DMF/kg
250
500
750
1,000
1,250
1,500
1,750
21.9 22.0 22.1 22.2 22.3 22.4 22.5 22.6 22.7
0.0
0.5
1.0
1.5
2.0
2.5
3.0
3.5
4.0
(x 1,000)
0.00 0.05 0.10 0.15 0.20 0.25 0.30 0.35 0.40 0.45 0.50 0.55 0.60
Concentration
Are
a
of the analytical need to bereached. The limit of detection,which is the lowest amount of ananalyte detectable in a sample(S/N = 3), was estimated to beabout 0.005 mg DMF/kg. Thecalibration curve for DMF is lin-ear in a wide range as shown infigure 3. The lowest point of thiscalibration represents 10 pg DMFon column which corresponds toa limit of quantification (S/N = 9)of about 0.015 mg DMF/kg.
Recoveries of DMF tested onseveral consumer products showvalues ranging from 94 % to 101 % for concentrations nearand above the limit of 0.1 mgDMF/kg. The mean relative stan-dard deviation for each injectionapproaches 10 %. Analysis ofmany samples on the EU marketshowed that samples were eitherfree of DMF (nothing detectable)or they contained DMF in a con-centration far above the limit of0.1 mg DMF/kg. In some cases
the consumer goods containedmore than 10,000 times theacceptable limit of DMF in theEU.
References:1. European Directive, 2009/251/
EC, Commission Decision of
March 17, 2009, Official Journal
of the European Union,
March 20, 2009, 74/32-34
We will gladly send you additional informa-
tion. Please note the corresponding code
number on the reply card. Info 374

PRODUCTS Shimadzu News 1/2010
14
Not just for theteeny-weenies
In many countries, nanotech-nology research and develop-ment is one of the most pro-
mising areas for future innova-tion. Today, one cannot imagineproducts such as cosmetics, dyesand materials as well as foodswithout the presence of nanopar-ticles. In addition, they oftenserve as catalysts or transmittersin electro-optical layers and indrugs and diagnostics.
While the expression ‘nanoparti-cle’ is, in linguistic terms, prefer-ably used for particles which can-not be distinguished visibly, ac-cording to definition it refers toparticles with a mean dimensionbetween 1 and 100 nm. This cor-responds to 0.000000001 m or 10-9 m.
In general, these small sizes can-not directly be measured optical-ly, so static light scattering is
used. When light hits a particle,the resulting shadow image is notsharply defined due to the wave-like nature of light, but rathershows a light intensity patternthat, depending on the wave-
length and the particle size, alsoreaches far beyond the intrinsic(geometric) shadow. In order tosimplify the calculation of thisintensity distribution, a laser isused to illuminate the particles.In this way, only a single wave-length enters the calculation.
The relationship between meas-ured scattering intensity and par-ticle size can be derived from theso-called Mie theory. For suffi-ciently large particle diameters,the Fraunhofer approximation,deduced from Mie theory as well,can also be applied. As a result,Mie theory describes a pattern oflight and dark circles around thescattering center, whose widthincreases with decreasing particlesize. In other words: a small par-ticle generates a system of ringsthat are widely spaced. Rings atsmaller distances originate from alarge particle.
Particle measurements in the sub-micro range andin highly concentrated substrates
Shimadzu has longstanding expe-rience in the area of particle sizeanalysis using static light scatter-ing. The SALD instrument seriesis based on this process and is themarket leader in Asia.
While the extremely compact sys-tems in the SALD-201V/-301V
SALD series and IG-1000 – particle size analysis in the nano and subnano range
Figure 1: Shimadzu’s SALD-7101 particle size analyzer with autosampler
Figure 2: IG-1000 functional diagram
Time
Dif
fra
cte
d l
igh
t in
ten
sity
15
PRODUCTSShimadzu News 1/2010
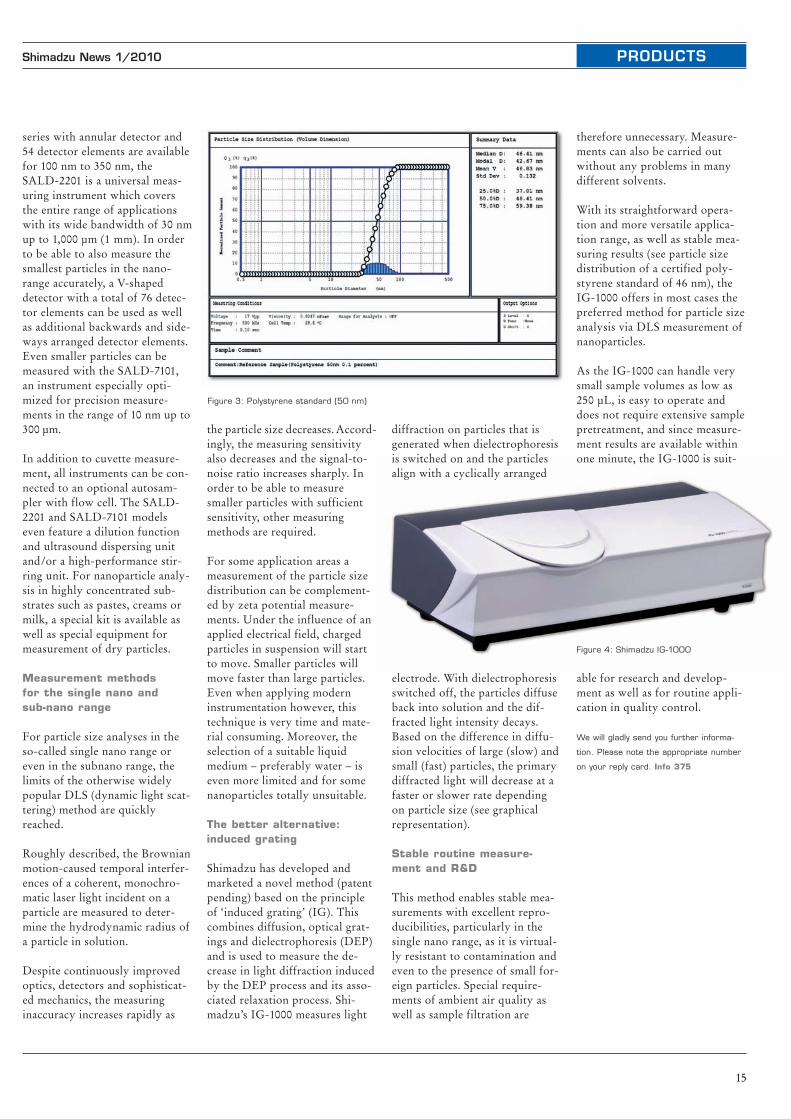
the particle size decreases. Accord-ingly, the measuring sensitivityalso decreases and the signal-to-noise ratio increases sharply. Inorder to be able to measuresmaller particles with sufficientsensitivity, other measuringmethods are required.
For some application areas ameasurement of the particle sizedistribution can be complement-ed by zeta potential measure-ments. Under the influence of anapplied electrical field, chargedparticles in suspension will startto move. Smaller particles willmove faster than large particles.Even when applying moderninstrumentation however, thistechnique is very time and mate-rial consuming. Moreover, theselection of a suitable liquidmedium – preferably water – iseven more limited and for somenanoparticles totally unsuitable.
The better alternative:induced grating
Shimadzu has developed andmarketed a novel method (patentpending) based on the principleof ‘induced grating’ (IG). Thiscombines diffusion, optical grat-ings and dielectrophoresis (DEP)and is used to measure the de-crease in light diffraction inducedby the DEP process and its asso-ciated relaxation process. Shi-madzu’s IG-1000 measures light
series with annular detector and54 detector elements are availablefor 100 nm to 350 nm, theSALD-2201 is a universal meas-uring instrument which coversthe entire range of applicationswith its wide bandwidth of 30 nmup to 1,000 μm (1 mm). In orderto be able to also measure thesmallest particles in the nano-range accurately, a V-shapeddetector with a total of 76 detec-tor elements can be used as wellas additional backwards and side-ways arranged detector elements.Even smaller particles can bemeasured with the SALD-7101,an instrument especially opti-mized for precision measure-ments in the range of 10 nm up to300 μm.
In addition to cuvette measure-ment, all instruments can be con-nected to an optional autosam-pler with flow cell. The SALD-2201 and SALD-7101 modelseven feature a dilution functionand ultrasound dispersing unitand/or a high-performance stir-ring unit. For nanoparticle analy-sis in highly concentrated sub-strates such as pastes, creams ormilk, a special kit is available aswell as special equipment formeasurement of dry particles.
Measurement methods for the single nano and sub-nano range
For particle size analyses in theso-called single nano range oreven in the subnano range, thelimits of the otherwise widelypopular DLS (dynamic light scat-tering) method are quicklyreached.
Roughly described, the Brownianmotion-caused temporal interfer-ences of a coherent, monochro-matic laser light incident on aparticle are measured to deter-mine the hydrodynamic radius ofa particle in solution.
Despite continuously improvedoptics, detectors and sophisticat-ed mechanics, the measuringinaccuracy increases rapidly as
Figure 3: Polystyrene standard (50 nm)
Figure 4: Shimadzu IG-1000
diffraction on particles that isgenerated when dielectrophoresisis switched on and the particlesalign with a cyclically arranged
electrode. With dielectrophoresisswitched off, the particles diffuseback into solution and the dif-fracted light intensity decays.Based on the difference in diffu-sion velocities of large (slow) andsmall (fast) particles, the primarydiffracted light will decrease at afaster or slower rate dependingon particle size (see graphicalrepresentation).
Stable routine measure-ment and R&D
This method enables stable mea-surements with excellent repro-ducibilities, particularly in thesingle nano range, as it is virtual-ly resistant to contamination andeven to the presence of small for-eign particles. Special require-ments of ambient air quality aswell as sample filtration are
therefore unnecessary. Measure-ments can also be carried outwithout any problems in manydifferent solvents.
With its straightforward opera-tion and more versatile applica-tion range, as well as stable mea-suring results (see particle sizedistribution of a certified poly-styrene standard of 46 nm), theIG-1000 offers in most cases thepreferred method for particle sizeanalysis via DLS measurement ofnanoparticles.
As the IG-1000 can handle verysmall sample volumes as low as250 μL, is easy to operate anddoes not require extensive samplepretreatment, and since measure-ment results are available withinone minute, the IG-1000 is suit-
able for research and develop-ment as well as for routine appli-cation in quality control.
We will gladly send you further informa-
tion. Please note the appropriate number
on your reply card. Info 375

PRODUCTS Shimadzu News 1/2010
16
The world’s most sensitiv
Two new fluorescence de-tectors, the RF-20A andRF-20AXS, have been
added to Shimadzu’s prominenceHPLC series for fast-LC fluores-cence measurements.
These detectors set new standardsin sensitivity. The prominencefamily is known for the highestprecision, sensitivity, minimalsample carry-over and utmostreliability. The detectors can beused in a wide range of applica-tions – from conventional HPLCto ultra-fast separations.
The RF-20A and RF-20AXS de-tectors are based on a newlydesigned optical system. Theyoffer dual-channel mode and adata acquisition rate of up to 100Hz. The detectors serve all appli-cations requiring the lowest lim-its of detection. Compared witheach other, the RF-20AXS fea-tures a temperature controlledflow cell and a wide-range photo-multiplier leading to higher sensi-tivity, minimal temperaturequenching at an improved base-line stability, and a wider wave-length range.
Sensitivity as a key feature
The newly designed optical sys-tem has been key to develop theworld’s most sensitive HPLC fluorescence detectors series. TheRF-20AXS achieves a signal-to-noise ratio (ASTM) of at least2000 for water Raman scattering.
But what use is sensitivity whenthe instrument does not achievethe necessary baseline stability?Based on its longstanding experi-ence in the development of opti-cal components and detectors,Shimadzu has successfully devel-oped fluorescence detectors withunprecedented baseline stability
over the entire dynamic range.This also results in the lowestlimits of detection, reflecting thesensitivity of the system. Figure 2shows a high-sensitivity separa-tion of anthracene. A signal-to-noise ratio of 21.5 is achieved foran absolute amount of 10.48 fem-togram, equivalent to a limit ofdetection (S/N>3) of 1.5 fem-togram.
Temperature controlled flow cell
Shimadzu has developed the firstHPLC fluorescence detector witha temperature controlled flowcell. Unlike UV absorption, dif-ferent compounds show a tem-perature dependency with respectto their fluorescence intensities.This is known as temperaturequenching, which can lead to anincrease or decrease in signalintensity of approximately 5 %per °C. The following compari-son will clarify this phenomenon(see figure 3). The example showsthe comparison between twoacridine peaks measured at 25 °Cand 30 °C. The chromatogramoverlay shown in the left diagramwas carried out under active celltemperature control (RF-20AXS),whereas an overlay without celltemperature control is shown inthe right diagram. The differencein peak intensity resulting fromtemperature quenching is clearlyrecognizable. Temperature con-trol suppresses this effect andleads to much higher reprodu-cibilities, as shown in the left dia-gram.
Detection in dual-channel mode
In addition to carrying out time-programmed wavelength switch-ing, the RF-20A and RF-20AXSdetectors can be operated in thedual-channel mode. A special fea-
RF-20A and RF-20AXS
Figure 1: RF-20A and RF-20AXS
Water / Acetonitrile = 30 / 70 (V/V)
0.6 mL/min
Shim-pack XR-ODS (2.0 mmL, D. x 50 mmL, 2.2 μm)
40 °C
250 nm Excitation wavelength, 400 nm Emission wavelength
0.0
2.5
7.5
10.0
12.5
0.0 0.5 1.0 1.5
Analytical Conditions
Mobile phase
Flow rate
Column
Temperature
Detection
Minutes
mV
Figure 2: High-sensitivity analysis of anthracene

Water / Acetonitrile = 20 / 80 (V/V)
1.0 mL/min
Shim-pack VP-ODS (4.6 mmL, D. x 150 mmL, 5 μm)
40 °C
360 nm Excitation wavelength, 450 nm Emission wavelength
Acridine
17
PRODUCTSShimadzu News 1/2010
When fast separations are carriedout at low flow rates, dispersioncaused by the cell volume playsan important role. In order toachieve a high-resolution separa-tion also at low flow rates, theoptional 3 μL semi-micro cell canbe used.
The figure below shows the sepa-ration of 15 polycyclic aromatichydrocarbons (EPA-610 stan-dard) and illustrates the potentialof the RF-20AXS.
Easy maintenance decreasesrunning costs
Components essential for detec-tor maintenance (such as flow cell
ve fluorescence detectors
ture: the excitation wavelength(EX) as well as emission wave-lengths (EM) can be switchedindividually in the dual-channelmode and are available in thetime program.
Ultrafast separations, fast data acquisition ratesand wavelength switching
With a maximum data acquisitionrate of 100 Hz, the new detectorsare optimally suited for ultrafastseparations. Where most fluores-cence detectors reach their limits,the RF-20A and RF-20AXSachieve wavelength switching and‘baseline memory functions’ infractions of seconds.
and Xe lamp) are accessible fromthe front panel of the detector.The new xenon lamp does notrequire any adjustment, meaningthat the lamp can be exchangedwithout any special tools in theshortest possible time. �
Analytical Conditions
Mobile phase
Flowrate
Column
Temperature
Detection
Sample
Rate of change
Consecutive analyses are performed at 25 °C and 30 °C room temperature.The rate of change shows the change in the peak area, taking the averagepeak area value at 25 °C as 1. It is used to confirm the effect of long-termfluctuations in room temperature due to the passage of the seasons.
%RSD
Consecutive analysis is performed while changing the room temperaturefrom 25 °C to 30 °C, and the %RSD value is determined from the analysisdata (n = 6). It is used to confirm the effect of room temperature fluctua-tions during the analysis.
2.50 2.75 3.00 3.25 3.50 3.75 min. 2.50 2.75 3.00 3.25 3.50 3.75 min.
Figure 3: Temperature dependence of the detector signal
With cell temperature control No cell temperature control
Water / Acetonitrile = A / B (Gradient)
B Conc. = 50 % (0 - 0.5 min), 50 - 99 % (0.5 - 3.0 min),
88 % (3.0 - 4.2 min), 100 % (4.21 - 4.5 min), 50 % (4.51 - 5.0 min)
3.0 mL/min
SUPELCOSIL LC-PAH (4.6 mmL, D. x 50 mmL. 3 μm)
40 °C
Excitation/emission wavelengths switched in each interval
Analytical Conditions
Mobile phase
Gradient
Flowrate
Column
Temperature
Detection
A
B
C
D
E
F
G
270 nm Excitation wavelength, 330 Emission wavelength
250 nm Excitation wavelength, 370 Emission wavelength
330 nm Excitation wavelength, 430 Emission wavelength
270 nm Excitation wavelength, 390 Emission wavelength
290 nm Excitation wavelength, 430 Emission wavelength
370 nm Excitation wavelength, 460 Emission wavelength
270 nm Excitation wavelength, 330 Emission wavelength
0.0 0.5 1.0 1.5 2.0 2.5 3.0 3.5 4.0 4.5
Minutes
Figure 4: Ultrafast simultaneous analysis of 15 polycyclic aromatic hydrocarbons

Validation, maintenance andself-diagnosis functions
A comprehensive package ofmaintenance and validation func-tions offers the maximum possi-ble assurance of routine opera-
PRODUCTS Shimadzu News 1/2010
18
tion in a regulated environment.For instance, the high-end modelRF-20AXS supports fully auto-matic validation of the wave-length by a built-in mercurylamp. Detector qualification isautomated and supported step-
Figure 5a: removal of the flow cell Figure 5b: Exchanging the lamp
by-step through the integratedvalidation functions. Detectoroperating hours are counted andthe lamp energy is measured,both supporting maintenanceintervals. In combination with aShimadzu HPLC system, an
automated system check withgeneration of an extensive reportcan be carried out via the soft-ware.
Now available for protein
measurements
In the middle of 2009, Shi-madzu extended its spectro-meter series with a system
particularly dedicated to lifesciences applications – the Bio-Spec-nano. It enables quantita-tion of simple or labeled nucleicacids, and now also supports pro-tein measurements. It is the idealinstrument for genomics research,molecular biology, agriculture,food quality and medical scien-ces.
Since its market introduction, theBioSpec-nano has been immense-ly popular. Its reproducibility ofmeasured results and user-friend-ly control set new standards.Now, additional functions areavailable for BioSpec-nano users:• protein measurements• photometric measurements of
up to eight wavelengths• improved ease of operation.
BioSpec-nano
Smallest sample volumes
The BioSpec-nano further enablesresearchers to conserve valuablesample material while obtainingaccurate and reproducible resultsat the same time. Sample volumes
of 1 μL to 2 μL are already suffi-cient. The automated drivemechanism for cleanup of themeasurement position and thelarge analysis range enablestraightforward RNA/DNAquantitation. Special cuvettes are
not needed for measurements. An optional rectangular cell hold-er is available for larger volumes.
The ‘Drop & Click’ functionalityenables quick and easy analyses.The samples are simply droppedonto the target and the analysisstarts with the push of a button.The BioSpec-nano automaticallyperforms measurement and clean-ing of the target.
Sample measurement takes justthree seconds. The special soft-ware enables quick and simpleoperation of the BioSpec-nano.All operating elements are dis-played in a user-friendly tool baraccording to the user’s workflow.

19
READ FOR YOUShimadzu News 1/2010
Figure 1: Toxicological identification
system (TOX.I.S.)
Acute multiple drug intoxication TOX.I.S. in the clinical toxicology laboratory
Dr. rer. nat. Thomas Grobosch,
Dr. med. Torsten Binscheck,
Dr. rer. nat. Lena Schönberg
Detection of acute intoxi-cations, medicinal ordrug abuse in systematic
toxicological screening requiresthe broadest possible spectrum ofcompounds. A high degree ofautomation supports effortless,straightforward sample prepara-tion.
At the Institute for Toxicology ofthe Clinical Toxicology and Poi-son Control Center Berlin, Ger-many (Institut für Toxikologiedes Berliner Betriebes für Zen-trale Gesundheitliche Aufgabe,BBGes), Shimadzu’s TOX.I.S. isin use for the analysis of basiccompounds in urine, such asmorphine and methadone.
This article introduces an enhance-ment to Shimadzu’s TOX.I.S.: anovel method for the automatedextraction of weakly acidic, neu-tral and weakly basic compoundsfrom urine, for example benzodi-azepines. The analysis of an au-thentic poisoning case demon-strates the applicability of theTOX.I.S..
The non-directional and time-critical search analysis for poi-soning-related active drug sub-stances in biological samples isone of the key challenges in clini-cal toxicology and forensic labo-ratories. The identification ofbasic drugs and substances ofabuse, as well as the analysis ofweakly acidic, neutral and weaklybasic compounds plays an impor-tant role.
Benzodiazepines are drugs with abroad spectrum of applications.They possess anxiolytic, musclerelaxing, antidepressant and anti-
spasmodic action. Abuse of ben-zodiazepines is a well-knownproblem. To date, more than 30different benzodiazepine-con-taining drugs are available on themarket, for example diazepam(Valium®), flunitrazepam (Rohy-pnol®) and midazolam (Dormi-cum®). Therapeutic plasma con-centrations range from 0.005 upto 0.015 mg/L for flunitrazepam,or from 0.4 - 4.0 mg/L for chlor-diazepoxide.
The literature describes variousmethods for the determination ofbenzodiazepines in urine, such asGC-MS, HPLC, LC-MS-MS orLC-(TOF)-MS. Only a fewmethods, for instance those de-scribed by Tatsuno et al, useautomated solid-phase extractionfor sample preparation.
In addition to the latter method,TOX.I.S. offers a spectral librarywith over 3,000 entries. Com-pound and metabolite spectra canbe compared with those of the
parent compound, identified andverified with an in-house method(> 380 entries).
Materials and methods –Sample preparation
A hydrolysis step is essential toincrease the detection sensitivityof the analysis of benzodiaze-pines. For the hydrolysis of glu-curonide conjugates, �-glucuro-nidase, urine and water are pi-petted into a 1.5 mL plastic dis-posable vial and hydrolyzed forat least 30 min at 45 °C in a ther-mo-shaker. After addition of abuffer solution containing theinternal standard (IS, c = 2 mg/L),the mixture is briefly shakenmechanically and subsequentlycentrifuged for 30 s at > 13,000 xg. The same plastic vial is placedinto the TOX.I.S..
TOX.I.S.
The system consists of a binarypump system (LC-20AT and LC-
20AB), each with a solvent degas-ser, an integrated system control-ler, an autosampler (SIL-20AC), a column oven (CTO-20AC) anda diode array detector (SPD-M20A). To control the onlineextraction and the analytical sepa-ration, several switching valvesare integrated into the system:one FCV-20AH2, four FCV-14AH and two FCV-12AH (allfrom Shimadzu, figure 1).
For the online extraction, a stra-ta-X (Phenomenex, also distribut-ed by RECIPE) solid-phaseextraction column was used. Thesample was loaded onto theextraction column using a loadingbuffer. For chromatographic separation of the compounds, aC18 analytical column with anattached pre-column of the sametype (both from Phenomenex)were used. The mobile phase con-sisted of acetonitrile/water (90/10, v/v) and a potassium dihydro-gen phosphate buffer (pH 2.3). �

READ FOR YOU Shimadzu News 1/2010
20
The column oven temperaturewas 40 °C. Detection was carriedout using a diode array detectorin the wavelength range of 195 to380 nm. The chromatographywas performed at a monitoringwavelength of 230 nm. The totalanalysis time including onlineextraction was 50 minutes. Thedrug substances were identifiedaccording to their relative reten-tion times (RRT +/- 5 %) as wellas via comparison of their ab-sorption spectra (similarity: >0.990; control and evaluationsoftware: LC Solution, Shi-madzu)
System control
For functional testing of the sys-tem, a check-mix is injected toverify the retention time/relativeretention time (RT/RRT), thepeak areas and spectral similari-ties with library entries. Systemcontrol results in the typicalchromatogram shown in figure 2.
To check system performance,the method was tested on numer-ous samples in clinical-toxicologyanalysis. A (hydrolyzed) drug-free urine sample (blank urine)was used to prove that the chro-matogram was free from interfer-ences after successful onlineextraction (figure 3).
Drug-free urine
Figure 3 shows a drug-free urinesample (blank urine) after hydro-lysis and automated online ex-traction.
Case history
A 44-year old woman was foundin an inanimate and stronglyhypothermic state. She receivedcardiopulmonal resuscitation, wasthen intubated and had controlledrespiration. Since a suicide attemptwith prescription drugs was sus-pected, a urine sample was sent to
the Institute for Toxicology for atoxicological examination.
Immunological screening of theurine sample resulted in positivedetection of benzodiazepines(CEDIA DAU®: cut-off 0.200mg/L, reference compound: ni-trazepam). For a chromatograph-ic confirmation analysis, the urinewas first enzymatically hydro-lyzed and, after addition of aninternal standard, analyzed usingthe TOX.I.S..
Lorazepam was unequivocallydetected in the hydrolyzed urine
-25
0
25
50
75
100
125
150
0.0 5.0 10.0 15.0 20.0 25.0 30.0 35.0 40.0
Minutes
mA
U
Figure 2: Check Mix: 1 = olanzapine, 2 = 7-aminoflunitrazepam, 3 = bromazepam,
4 = demoxepam 5 = oxazepam, 6 = nordiazepam, 7 = temazepam, IS = N-ethylox-
azepam
Figure 3: Blank urine (hydrolyzed); creatinine assay (Jaffé reaction): 0.31 mg/mL;
IS = N-ethyloxazepam. Comment: The peaks between 6 and 12 min are switching
impulses originating from valve switching.
Figure 4: Case #0927151 (hydrolyzed); creatinine assay (Jaffé reaction): 0.35 mg/mL;
1 = sulpiride, 2 = venlafaxine metabolite, 3 = amitriptyline metabolite, 4 = amitriptyline
metabolite, 5 = venlafaxine, 6 = amitriptyline metabolite, 7 = nortriptyline, 8 = amitrip-
tyline, 9 = amitriptyline-N-oxide, 10 = lorazepam, IS = N-ethyloxazepam.
-25
0
25
50
75
100
125
150
0.0 5.0 10.0 15.0 20.0 25.0 30.0 35.0 40.0
Minutes
mA
U
-50
0
50
100
150
200
250
300
0.0 5.0 10.0 15.0 20.0 25.0 30.0 35.0 40.0
Minutes
mA
U

21
READ FOR YOUShimadzu News 1/2010
Additional toxicologically relevant substances
Amitriptyline oxide and amitriptyline are tricyclicantidepressants (TCAs) and belong to the group ofantidepressant and anxiolytic drugs. TCAs exhibitconsiderable acute toxicity, based on their anticho-linergic action.
Poisoning becomes evident, for instance, throughimpairment of the central nervous system (confusion,agitation, convulsions, disorientation which can leadto coma, respiratory depression and even respiratoryarrest) as well as cardiac and circulatory symptoms(drop in blood pressure, cardiac arrhythmia).
Venlafaxine is a drug used in the treatment of depres-sion and anxiety disorders. Chemically, it is a phenyl-ethylamine derivative acting as a serotonin-noradren-aline reuptake inhibitor (SNRI) in the central nervoussystem. Intoxication symptoms are manifested by atachycardia, reduced consciousness, seizures andvomiting, but also in severe hypotension.
Sulpiride is a benzamide derivative and belongs tothe so-called atypical antidepressants. It possessesneuroleptic as well as antidepressant properties.
Figure 5: UV spectra of amitriptyline (similarity = 0,999919) Figure 6: UV spectra of lorazepam (similarity = 0.999844)
0
250
500
750
1,000
200.0 225.0 250.0 275.0 300.0 325.0 350.0
Minutes
0
10
20
30
50
40
200.0 225.0 250.0 275.0 300.0 325.0 350.0
Minutes
mA
U
mA
U
(peak 10, figure 4). Lorazepam, a 3-hydroxydiazepine, is almostexclusively eliminated as loraze-pam-glucuronide. It is thereforeessential to convert this com-pound to the less hydrophiliclorazepam, for instance by enzy-matic cleavage to enable betteronline extraction.
Lorazepam is, for instance, dis-tributed under the trade namesTavor®, Ativan® or Temesta®. In Germany, lorazepam was thefourth most frequently pre-scribed anxiolytic drug in 2005.An overdose of lorazepam canlead to drowsiness, somnolence,ataxia and a drop in blood pres-sure; severe intoxication can fur-ther lead to loss of consciousnessas well as respiratory and circula-tory depression.
In addition to lorazepam, othersubstances have been detected inurine: amitriptyline oxide, amitrip-tyline, nortriptyline and otheramitriptyline metabolites, ven-lafaxine, norvenlafaxine and othervenlafaxine metabolites, as well asthe atypical neuroleptic sulpiride(see box).
Some metabolites could be iden-tified via comparison of their ab-sorption spectra with their res-pective parent compound. They
were subsequently stored in themethod-specific spectral librarywith their RRT and their absorp-tion spectra.
As an example, the UV-spectra of amitriptyline and lorazepam(black line) are shown in figures 5 and 6 with their comparisonspectra from the library (redline).
In the assessment of the severityand the risks of intoxication, thepresence of multiple drug intoxi-cation through ingestion of sever-al drugs should be considered.Lorazepam, in combination withamitriptyline, venlafaxine andsulpiride, leads to a marked in-crease in toxicity of the individu-
al substances. Consequently, forclinical toxicology assessment ofthe present poisoning case, thenon-specific result ‘benzodiaze-pine-positive’ is not sufficient forevaluating the patient’s individualrisk.
Summary
Based on this authentic poisoningcase, the successful application ofthe new method for determina-tion of weakly basic, acidic andneutral drugs in urine has beendemonstrated. The new methodcan additionally be used for anal-ysis of basic compounds. Switch-ing between both methods is ful-ly automated, meaning that sam-ples can be analyzed sequentially
via both methods, for instanceovernight. The TOX.I.S. is there-fore considered as proven inpractice and suitable for routineapplication in the clinical toxicol-ogy laboratory.
This article is an abbreviated version of
the article published in LABO, 10/2009.
Author information and bibliographical ref-
erences are available from Shimadzu.

SOFTWARE Shimadzu News 1/2010
22
Software for LC and LCM
The devil lies in the detailswhen integrating softwarefor multiple instruments
within a common interface. Seem-ingly trivial details turn out to behard nuts to crack.
Since the introduction of Shi-madzu’s LCMS-2020, the plat-form has withstood the test oftime for all chromatographysoftware to come (figure 1). A HPLC version has also beenanticipated, particularly since theLCMS could already controlmost HPLC modules satisfacto-rily. The currently introducedLC-30A Nexera, however, madenew demands on the software:present menus and program se-quences have had to be modifiedand many ‘trivialities’ requiredmore effort than expected.
New look under one roof
The software’s general appear-ance and the startup windowhave changed. Instead of thespecified number of systems,
Figure 1: Main menu of the software/opened data acquisition window Figure 2: Module selection
Figure 3: Software parameters
each with an offline editor win-dow, the software features a net-work-oriented flexible displayallowing selective display of theinstruments of interest in futureversions.
The LCMS-2020 and the com-plete HPLC family is again
under one roof. In the past, thiswould have been an opportunityfor an “ever-popular” group pho-tograph at a family celebration.Because of the wide range ofmodels in the large HPLC familyand downward compatibility ofmodules which are no longersold but still perform reliably,
LabSolutions 5

23
SOFTWAREShimadzu News 1/2010
MS
this has not been easy to imple-ment. But all modules controlledvia SCL-10AVP and CBM-20Asystem controllers, as well as theLC-2010 are now implementedcompletely. A small selectionfrom the long list of controllableinstruments is shown in figure 2.
Administration and instrument control
System administration is now aseparate menu item. In additionto settings for data storage, back-up and retrieval, parameters canbe defined under their respectivecolumn headings, for instance thenumber of decimal digits.
In addition to the existing HPLCinstrument control functions,complete control of the LC-30ANexera has been implemented. Inthis way, overlapping injectionand pretreatment autosamplerfunctions are equally usable, as isthe application of various rinsingfluids.
Data acquisition and management
The data acquisition window isnow much more user-friendly(see figure 1). When implement-ing multiple detectors, just thesignals of a specific detector orall detector signals can be dis-played. The tab structure enableseasy switching between detec-tors. In this way it is now possi-ble when using multiple detec-tors to avoid displayed channelsappearing so small that peaks areno longer visible.
Enhanced options are availablefor post-processing of acquireddata, which meet widely differingrequirements: in the reanalysis(post-run) window the data anal-ysis parameters are now dis-
played under tabs in the standardwindow. This precludes the useof the right mouse button toopen submenus.
To compare and overlay PDAdata (see figure 4), selected/stored individual data traces dur-ing data acquisition or post-pro-cessing are required. Automaticextraction from the 3D dataset isnot possible.
For additional calculations withgenerated data, enhanced optionsare available.
Easy-to-use software andhardware operation
In addition to the functions de-scribed, other program compo-nents such as the report, havebeen modified to simplify opera-tion of the software as well as theassociated hardware.
Of course users will always havenew demands, or find that theirrequirements are not met suffi-ciently. But in the end, softwareis always subject to personalpreference and one cannot argueabout taste. And arguments, sug-gestions and specific demands areinevitable in terms of changesand future developments.
Figure 4: PDA data overlay
Figure 5: Custom parameters

Follow us on: www. .com/ShimadzuEurope
PRODUCTS Shimadzu News 1/2010
24
2 4-hours on duty via theInternet – The web-basedTOC Virtual Advisor has
been available for quite sometime and is continuously beingupdated.
It guides users step-by-stepthrough maintenance, serviceprocedures and troubleshooting.In addition, it offers a wealth ofinformation that simplifies, butalso enriches the use of theTOC-V system. At present, thewebsite is available in the world’smain languages – English,French, Spanish, Chinese, Por-tuguese, Italian and German.
After a short registration pro-cess, seven sections are available:
1. ‘Using this site’ explains witha short animation how tooptimally use the VirtualAdvisor.
»TOC Virtual Advisor«TOC around the clock – online support
2. ‘Selecting System’ enablesusers to configure their TOCanalysis system virtually. Thecontent of the pages to followis then tuned to this system.
3. ‘Flow diagrams’ shows theflow lines of the instrumentsselected in section 2. For in-stance, when the TOC-VCSHwith the ASI-V injector andthe SSM-5000A solid samplemodule has been specified, allthree instruments are shown,optionally with the animatedflow lines.
4. ‘Daily Maintenance’ – func-tional tests supporting opti-mal use of the measuring sys-tem are listed under the vari-ous systems. Each mouse-click opens a window withadditional explanations.
5. ‘Periodic Maintenance’ offersadvice on larger maintenancetasks, e.g. how to exchangethe catalyst or how to replacesyringes, tubing or o-rings.Short animations providestep-by-step guidance.
6. ‘Troubleshooting’ focuses onvarious phenomena step-by-step. The symptoms refer tothe main instrument and theoptional modules. Afterselecting the symptom, thecorresponding flow diagramopens highlighting a specificarea. At this point, the systemwill ask a specific question. If the user answers ‘yes’, thesystem will provide advice onhow to solve the problem. If the answer is ‘no’, the nexthighlighted area appears witha further question. In thisway, the problems are ana-lyzed in a step-by-step man-ner.
7. ‘Reference’ provides usefulbackground information onTOC determination. In analphabetic glossary the mostimportant terms relating toTOC and TNb analysis areexplained. All Material SafetyData Sheets applicable toTOC determination can bedownloaded under the appro-priate MSDS sections.
The Shimadzu Virtual Advisors at a glance
TOC Virtual Advisorhttp://www.ssi.shimadzu.com/TOC_VirtualAdvisor/TOCVA.htm
LC Virtual Advisorhttp://www.ssi.shimadzu.com/LC_VirtualAdvisor/LCVA.htm
LCMS Virtual Advisorhttp://www.ssi.shimadzu.com/LC_VirtualAdvisor/LCMSVA.htm
Combustion Tube Removal and
Installation
1. Loosen the retaining screw and open the top flap
2. Remove the sample and carrier gastubing
3. Loosen the thumbscrews4. Loosen the combustion tube bottom
connection5. Remove the injektor block and
combustion tube6. Reinstall the combustion tube7. Reinstall the injector. Verify the drain
tubing placement8. Secure the combustion tube bottom
connection9. Tighten the thumbscrews10. Reinstall the sample and carrier gas
tubing11. Close the top flap and tighten the
retaining screw
»Virtual Advisor« – Animation for removal and installation of the combustion tube