
Newport beach real estate market report april 2013
5
Key Metrics 2012 2013 Percent Change Thru 4-2012 Thru 4-2013 Percent Change New Listings 89 88 - 1.1% 1,036 945 - 8.8% Pending Sales 74 70 - 5.4% 565 739 + 30.8% Closed Sales 60 79 + 31.7% 543 738 + 35.9% Days on Market Until Sale 124 86 - 30.6% 123 112 - 8.9% Median Sales Price* $1,320,000 $1,575,000 + 19.3% $1,347,750 $1,450,000 + 7.6% Average Sales Price* $1,608,425 $2,024,870 + 25.9% $1,597,298 $1,799,150 + 12.6% Percent of Original List Price Received* 91.9% 94.8% + 3.2% 90.7% 92.8% + 2.3% Inventory of Homes for Sale 375 190 - 49.3% -- -- -- Months Supply of Inventory 8.0 3.1 - 61.3% -- -- -- * Does not account for seller concessions and/or down payment assistance. Note: Activity for one month can sometimes look extreme due to small sample size. Key Metrics 2012 2013 Percent Change Thru 4-2012 Thru 4-2013 Percent Change New Listings 36 32 - 11.1% 379 332 - 12.4% Pending Sales 23 33 + 43.5% 242 283 + 16.9% Local Market Update for April 2013 A Research Tool Provided by the Pacific West Association of REALTORS® Newport Beach Orange County April Last 12 Months April Last 12 Months Single Family Townhouse-Condo Pending Sales 23 33 + 43.5% 242 283 + 16.9% Closed Sales 17 32 + 88.2% 227 289 + 27.3% Days on Market Until Sale 120 67 - 44.2% 137 95 - 30.7% Median Sales Price* $450,000 $707,500 + 57.2% $535,000 $600,000 + 12.1% Average Sales Price* $537,588 $781,296 + 45.3% $602,155 $685,914 + 13.9% Percent of Original List Price Received* 94.1% 98.7% + 4.9% 90.4% 95.4% + 5.5% Inventory of Homes for Sale 124 43 - 65.3% -- -- -- Months Supply of Inventory 6.1 1.8 - 70.5% -- -- -- * Does not account for seller concessions and/or down payment assistance. Note: Activity for one month can sometimes look extreme due to small sample size. Current as of May 6, 2013. All data comes from CRMLS. Powered by 10K Research & Marketing. Percent changes are calculated using rounded figures. Newport Beach — All PWR Areas — All PWR Areas — Newport Beach — $250,000 $500,000 $750,000 $1,000,000 $1,250,000 $1,500,000 $1,750,000 $2,000,000 1-2008 1-2009 1-2010 1-2011 1-2012 1-2013 Median Sales Price – Single Family Rolling 12-Month Calculation $200,000 $300,000 $400,000 $500,000 $600,000 $700,000 $800,000 $900,000 1-2008 1-2009 1-2010 1-2011 1-2012 1-2013 Median Sales Price – Townhouse-Condo Rolling 12-Month Calculation Current as of May 6, 2013. All data comes from CRMLS. Powered by 10K Research & Marketing. Percent changes are calculated using rounded figures.
-
Upload
jay-valento -
Category
Documents
-
view
212 -
download
0
description
View Newport Beach Real Estate Market Report for April 2013 to understand the overall trends and trends by zip code and property types.
Transcript of Newport beach real estate market report april 2013

Key Metrics 2012 2013 Percent Change Thru 4-2012 Thru 4-2013 Percent Change
New Listings 89 88 - 1.1% 1,036 945 - 8.8%
Pending Sales 74 70 - 5.4% 565 739 + 30.8%
Closed Sales 60 79 + 31.7% 543 738 + 35.9%
Days on Market Until Sale 124 86 - 30.6% 123 112 - 8.9%
Median Sales Price* $1,320,000 $1,575,000 + 19.3% $1,347,750 $1,450,000 + 7.6%
Average Sales Price* $1,608,425 $2,024,870 + 25.9% $1,597,298 $1,799,150 + 12.6%
Percent of Original List Price Received* 91.9% 94.8% + 3.2% 90.7% 92.8% + 2.3%
Inventory of Homes for Sale 375 190 - 49.3% -- -- --
Months Supply of Inventory 8.0 3.1 - 61.3% -- -- --
* Does not account for seller concessions and/or down payment assistance. Note: Activity for one month can sometimes look extreme due to small sample size.
Key Metrics 2012 2013 Percent Change Thru 4-2012 Thru 4-2013 Percent Change
New Listings 36 32 - 11.1% 379 332 - 12.4%
Pending Sales 23 33 + 43.5% 242 283 + 16.9%
Local Market Update for April 2013A Research Tool Provided by the Pacific West Association of REALTORS®
Newport BeachOrange County
April Last 12 Months
April Last 12 MonthsSingle Family
Townhouse-Condo
Pending Sales 23 33 + 43.5% 242 283 + 16.9%
Closed Sales 17 32 + 88.2% 227 289 + 27.3%
Days on Market Until Sale 120 67 - 44.2% 137 95 - 30.7%
Median Sales Price* $450,000 $707,500 + 57.2% $535,000 $600,000 + 12.1%
Average Sales Price* $537,588 $781,296 + 45.3% $602,155 $685,914 + 13.9%
Percent of Original List Price Received* 94.1% 98.7% + 4.9% 90.4% 95.4% + 5.5%
Inventory of Homes for Sale 124 43 - 65.3% -- -- --
Months Supply of Inventory 6.1 1.8 - 70.5% -- -- --
* Does not account for seller concessions and/or down payment assistance. Note: Activity for one month can sometimes look extreme due to small sample size.
Current as of May 6, 2013. All data comes from CRMLS. Powered by 10K Research & Marketing. Percent changes are calculated using rounded figures.
Newport Beach — All PWR Areas — All PWR Areas —
Newport Beach —
$250,000
$500,000
$750,000
$1,000,000
$1,250,000
$1,500,000
$1,750,000
$2,000,000
1-2008 1-2009 1-2010 1-2011 1-2012 1-2013
Median Sales Price – Single FamilyRolling 12-Month Calculation
$200,000
$300,000
$400,000
$500,000
$600,000
$700,000
$800,000
$900,000
1-2008 1-2009 1-2010 1-2011 1-2012 1-2013
Median Sales Price – Townhouse-Condo Rolling 12-Month Calculation
Current as of May 6, 2013. All data comes from CRMLS. Powered by 10K Research & Marketing. Percent changes are calculated using rounded figures.
Winner
Typewritten text
Jay Valento, Realtor® Main Street Realtors 877-300-9959 direct line
Winner
Typewritten text
Winner
Typewritten text
www.hometourjay.com
Key Metrics 2012 2013 Percent Change Thru 4-2012 Thru 4-2013 Percent Change
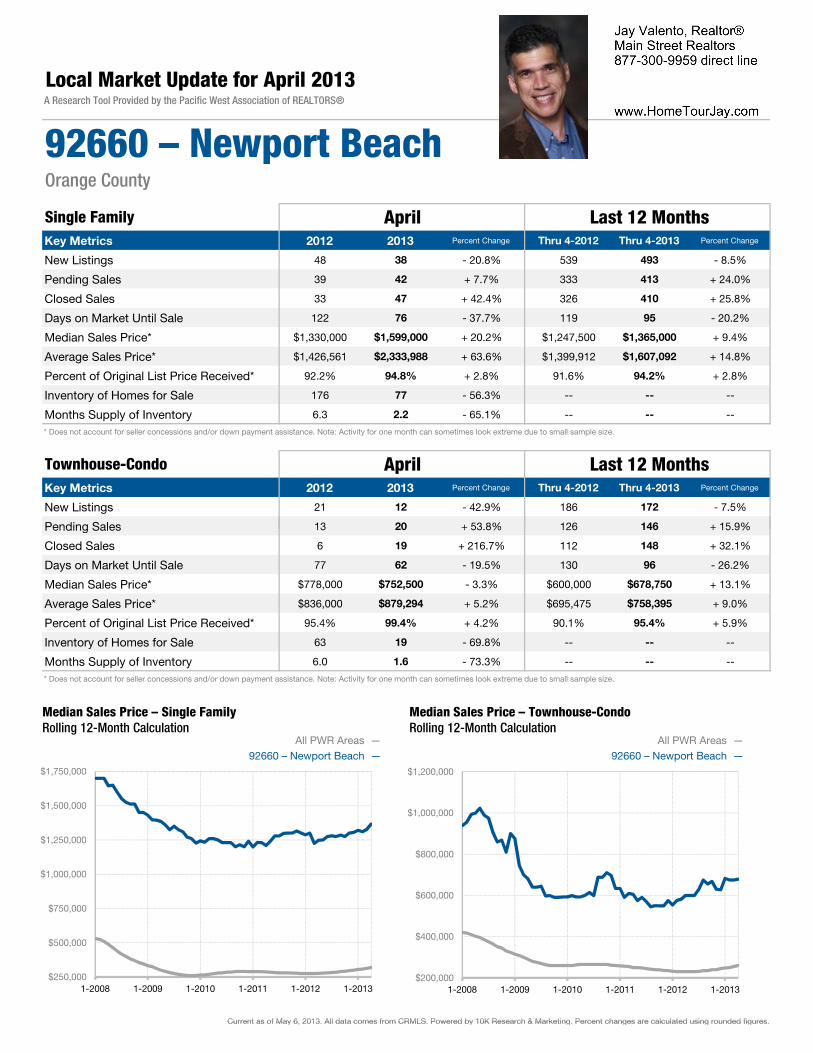
New Listings 48 38 - 20.8% 539 493 - 8.5%
Pending Sales 39 42 + 7.7% 333 413 + 24.0%
Closed Sales 33 47 + 42.4% 326 410 + 25.8%
Days on Market Until Sale 122 76 - 37.7% 119 95 - 20.2%
Median Sales Price* $1,330,000 $1,599,000 + 20.2% $1,247,500 $1,365,000 + 9.4%
Average Sales Price* $1,426,561 $2,333,988 + 63.6% $1,399,912 $1,607,092 + 14.8%
Percent of Original List Price Received* 92.2% 94.8% + 2.8% 91.6% 94.2% + 2.8%
Inventory of Homes for Sale 176 77 - 56.3% -- -- --
Months Supply of Inventory 6.3 2.2 - 65.1% -- -- --
* Does not account for seller concessions and/or down payment assistance. Note: Activity for one month can sometimes look extreme due to small sample size.
Key Metrics 2012 2013 Percent Change Thru 4-2012 Thru 4-2013 Percent Change
New Listings 21 12 - 42.9% 186 172 - 7.5%
Pending Sales 13 20 + 53.8% 126 146 + 15.9%
Local Market Update for April 2013A Research Tool Provided by the Pacific West Association of REALTORS®
92660 – Newport BeachOrange County
April Last 12 Months
April Last 12 MonthsSingle Family
Townhouse-Condo
Pending Sales 13 20 + 53.8% 126 146 + 15.9%
Closed Sales 6 19 + 216.7% 112 148 + 32.1%
Days on Market Until Sale 77 62 - 19.5% 130 96 - 26.2%
Median Sales Price* $778,000 $752,500 - 3.3% $600,000 $678,750 + 13.1%
Average Sales Price* $836,000 $879,294 + 5.2% $695,475 $758,395 + 9.0%
Percent of Original List Price Received* 95.4% 99.4% + 4.2% 90.1% 95.4% + 5.9%
Inventory of Homes for Sale 63 19 - 69.8% -- -- --
Months Supply of Inventory 6.0 1.6 - 73.3% -- -- --
* Does not account for seller concessions and/or down payment assistance. Note: Activity for one month can sometimes look extreme due to small sample size.
Current as of May 6, 2013. All data comes from CRMLS. Powered by 10K Research & Marketing. Percent changes are calculated using rounded figures.
92660 – Newport Beach — All PWR Areas — All PWR Areas —
92660 – Newport Beach —
$250,000
$500,000
$750,000
$1,000,000
$1,250,000
$1,500,000
$1,750,000
1-2008 1-2009 1-2010 1-2011 1-2012 1-2013
Median Sales Price – Single FamilyRolling 12-Month Calculation
$200,000
$400,000
$600,000
$800,000
$1,000,000
$1,200,000
1-2008 1-2009 1-2010 1-2011 1-2012 1-2013
Median Sales Price – Townhouse-Condo Rolling 12-Month Calculation
Current as of May 6, 2013. All data comes from CRMLS. Powered by 10K Research & Marketing. Percent changes are calculated using rounded figures.
Winner
Typewritten text
Jay Valento, Realtor® Main Street Realtors 877-300-9959 direct line
Winner
Typewritten text
www.HomeTourJay.com

Key Metrics 2012 2013 Percent Change Thru 4-2012 Thru 4-2013 Percent Change
New Listings 12 4 - 66.7% 117 96 - 17.9%
Pending Sales 7 10 + 42.9% 39 78 + 100.0%
Closed Sales 8 6 - 25.0% 37 70 + 89.2%
Days on Market Until Sale 167 97 - 41.9% 174 164 - 5.7%
Median Sales Price* $1,757,500 $1,470,000 - 16.4% $2,200,000 $1,708,750 - 22.3%
Average Sales Price* $2,143,125 $1,501,667 - 29.9% $2,821,074 $2,575,139 - 8.7%
Percent of Original List Price Received* 85.0% 94.9% + 11.6% 85.1% 89.5% + 5.2%
Inventory of Homes for Sale 65 24 - 63.1% -- -- --
Months Supply of Inventory 18.3 3.7 - 79.8% -- -- --
* Does not account for seller concessions and/or down payment assistance. Note: Activity for one month can sometimes look extreme due to small sample size.
Key Metrics 2012 2013 Percent Change Thru 4-2012 Thru 4-2013 Percent Change
New Listings 3 1 - 66.7% 13 12 - 7.7%
Pending Sales 1 0 - 100.0% 5 7 + 40.0%
Local Market Update for April 2013A Research Tool Provided by the Pacific West Association of REALTORS®
92661 – Newport BeachOrange County
April Last 12 Months
April Last 12 MonthsSingle Family
Townhouse-Condo
Pending Sales 1 0 100.0% 5 7 + 40.0%
Closed Sales 0 1 -- 6 7 + 16.7%
Days on Market Until Sale 0 83 -- 183 117 - 36.1%
Median Sales Price* $0 $1,150,000 -- $795,000 $1,100,000 + 38.4%
Average Sales Price* $0 $1,150,000 -- $794,167 $960,245 + 20.9%
Percent of Original List Price Received* 0.0% 92.0% -- 86.9% 90.1% + 3.7%
Inventory of Homes for Sale 6 4 - 33.3% -- -- --
Months Supply of Inventory 6.0 3.4 - 43.3% -- -- --
* Does not account for seller concessions and/or down payment assistance. Note: Activity for one month can sometimes look extreme due to small sample size.
Current as of May 6, 2013. All data comes from CRMLS. Powered by 10K Research & Marketing. Percent changes are calculated using rounded figures.
92661 – Newport Beach — All PWR Areas — All PWR Areas —
92661 – Newport Beach —
$0
$500,000
$1,000,000
$1,500,000
$2,000,000
$2,500,000
$3,000,000
1-2008 1-2009 1-2010 1-2011 1-2012 1-2013
Median Sales Price – Single FamilyRolling 12-Month Calculation
$200,000
$400,000
$600,000
$800,000
$1,000,000
$1,200,000
$1,400,000
$1,600,000
1-2008 1-2009 1-2010 1-2011 1-2012 1-2013
Median Sales Price – Townhouse-Condo Rolling 12-Month Calculation
Current as of May 6, 2013. All data comes from CRMLS. Powered by 10K Research & Marketing. Percent changes are calculated using rounded figures.
Winner
Typewritten text
Jay Valento, Realtor® Main Street Realtors 877-300-9959 direct line
Winner
Typewritten text
www.HomeTourJay.com Free Home Value Report

Key Metrics 2012 2013 Percent Change Thru 4-2012 Thru 4-2013 Percent Change
New Listings 5 5 0.0% 65 63 - 3.1%
Pending Sales 6 5 - 16.7% 43 49 + 14.0%
Closed Sales 6 7 + 16.7% 41 50 + 22.0%
Days on Market Until Sale 91 79 - 13.2% 103 99 - 3.9%
Median Sales Price* $1,575,000 $1,825,000 + 15.9% $1,825,000 $1,802,500 - 1.2%
Average Sales Price* $1,656,667 $1,815,571 + 9.6% $2,153,620 $2,273,531 + 5.6%
Percent of Original List Price Received* 95.3% 103.5% + 8.6% 90.1% 93.9% + 4.2%
Inventory of Homes for Sale 17 10 - 41.2% -- -- --
Months Supply of Inventory 4.3 2.4 - 44.2% -- -- --
* Does not account for seller concessions and/or down payment assistance. Note: Activity for one month can sometimes look extreme due to small sample size.
Key Metrics 2012 2013 Percent Change Thru 4-2012 Thru 4-2013 Percent Change
New Listings 0 0 -- 1 0 - 100.0%
Pending Sales 0 0 -- 0 1 --
Local Market Update for April 2013A Research Tool Provided by the Pacific West Association of REALTORS®
92662 – Newport BeachOrange County
April Last 12 Months
April Last 12 MonthsSingle Family
Townhouse-Condo
Pending Sales 0 0 0 1
Closed Sales 0 0 -- 0 1 --
Days on Market Until Sale 0 0 -- 0 508 --
Median Sales Price* $0 $0 -- $0 $950,000 --
Average Sales Price* $0 $0 -- $0 $950,000 --
Percent of Original List Price Received* 0.0% 0.0% -- 0.0% 79.2% --
Inventory of Homes for Sale 1 0 - 100.0% -- -- --
Months Supply of Inventory 0.0 0.0 -- -- -- --
* Does not account for seller concessions and/or down payment assistance. Note: Activity for one month can sometimes look extreme due to small sample size.
Current as of May 6, 2013. All data comes from CRMLS. Powered by 10K Research & Marketing. Percent changes are calculated using rounded figures.
92662 – Newport Beach — All PWR Areas — All PWR Areas —
92662 – Newport Beach —
$0
$500,000
$1,000,000
$1,500,000
$2,000,000
$2,500,000
$3,000,000
1-2008 1-2009 1-2010 1-2011 1-2012 1-2013
Median Sales Price – Single FamilyRolling 12-Month Calculation
$0
$200,000
$400,000
$600,000
$800,000
$1,000,000
$1,200,000
$1,400,000
1-2008 1-2009 1-2010 1-2011 1-2012 1-2013
Median Sales Price – Townhouse-Condo Rolling 12-Month Calculation
Current as of May 6, 2013. All data comes from CRMLS. Powered by 10K Research & Marketing. Percent changes are calculated using rounded figures.
Winner
Typewritten text
Jay Valento, Realtor® Main Street Realtors 877-300-9959 direct line
Winner
Typewritten text
www.HomeTourJay.com Free Home Value Report

Key Metrics 2012 2013 Percent Change Thru 4-2012 Thru 4-2013 Percent Change
New Listings 24 41 + 70.8% 313 293 - 6.4%
Pending Sales 22 13 - 40.9% 146 198 + 35.6%
Closed Sales 12 19 + 58.3% 135 207 + 53.3%
Days on Market Until Sale 121 108 - 10.7% 120 130 + 8.3%
Median Sales Price* $1,130,000 $1,115,000 - 1.3% $1,177,000 $1,500,000 + 27.4%
Average Sales Price* $1,612,000 $1,502,539 - 6.8% $1,526,733 $1,808,594 + 18.5%
Percent of Original List Price Received* 87.6% 91.6% + 4.6% 90.0% 90.8% + 0.9%
Inventory of Homes for Sale 115 79 - 31.3% -- -- --
Months Supply of Inventory 9.5 4.8 - 49.5% -- -- --
* Does not account for seller concessions and/or down payment assistance. Note: Activity for one month can sometimes look extreme due to small sample size.
Key Metrics 2012 2013 Percent Change Thru 4-2012 Thru 4-2013 Percent Change
New Listings 12 19 + 58.3% 176 144 - 18.2%
Pending Sales 9 10 + 11.1% 111 124 + 11.7%
Local Market Update for April 2013A Research Tool Provided by the Pacific West Association of REALTORS®
92663 – Newport BeachOrange County
April Last 12 Months
April Last 12 MonthsSingle Family
Townhouse-Condo
Pending Sales 9 10 + 11.1% 111 124 + 11.7%
Closed Sales 11 11 0.0% 109 130 + 19.3%
Days on Market Until Sale 143 72 - 49.7% 141 89 - 36.9%
Median Sales Price* $350,000 $375,000 + 7.1% $444,600 $513,500 + 15.5%
Average Sales Price* $374,818 $585,900 + 56.3% $495,697 $578,691 + 16.7%
Percent of Original List Price Received* 93.4% 98.7% + 5.7% 90.8% 95.8% + 5.5%
Inventory of Homes for Sale 51 20 - 60.8% -- -- --
Months Supply of Inventory 5.5 1.9 - 65.5% -- -- --
* Does not account for seller concessions and/or down payment assistance. Note: Activity for one month can sometimes look extreme due to small sample size.
Current as of May 6, 2013. All data comes from CRMLS. Powered by 10K Research & Marketing. Percent changes are calculated using rounded figures.
92663 – Newport Beach — All PWR Areas — All PWR Areas —
92663 – Newport Beach —
$0
$500,000
$1,000,000
$1,500,000
$2,000,000
$2,500,000
1-2008 1-2009 1-2010 1-2011 1-2012 1-2013
Median Sales Price – Single FamilyRolling 12-Month Calculation
$200,000
$300,000
$400,000
$500,000
$600,000
$700,000
1-2008 1-2009 1-2010 1-2011 1-2012 1-2013
Median Sales Price – Townhouse-Condo Rolling 12-Month Calculation
Current as of May 6, 2013. All data comes from CRMLS. Powered by 10K Research & Marketing. Percent changes are calculated using rounded figures.
Winner
Typewritten text
Jay Valento, Realtor® Main Street Realtors 877-300-9959 direct line
Winner
Typewritten text
www.HomeTourJay.com Free Home Value Report