Newham SFRA - Volume 2 Technical Report
116
LONDON BOROUGH OF NEWHAM STRATEGIC FLOOD RISK ASSESSMENT VOLUME 2: TECHNICAL REPORT Final Report May 2010
Transcript of Newham SFRA - Volume 2 Technical Report

LONDON BOROUGH OF NEWHAM STRATEGIC FLOOD RISK ASSESSMENT
VOLUME 2: TECHNICAL REPORT
Final Report
May 2010

London Borough of Newham SFRA
London Borough of Newham i May 2010
London Borough of Newham
Strategic Flood Risk Assessment
Technical Report
FINAL Report REV 2.0 / May 2010
This document is the property of the London Borough of Newham. If
you have received it in error, please return it immediately to the above
named Local Authority.
Job Number: CS/028262
PD: Scott Ferguson
PM: James Reddish
Report status: FINAL REV 2.0
Date of issue: 27/05/2010
CSL Main author(s): James Reddish
CSL Checked: Alastair Dale
Client Approval: -
This report has been prepared by Capita Symonds Limited with all
reasonable skill, care and diligence within the terms of the Contract with
the Client, incorporating our General Terms and Conditions of Business
and taking account of the resources devoted to it by agreement with the
client. We disclaim any responsibility to the client and others in respect
of any matters outside the scope of the above. This report is
confidential to the client and we accept no responsibility of whatsoever
nature to third parties to whom this report, or any part thereof, is made
known. Any such party relies on the report at their own risk

London Borough of Newham SFRA
London Borough of Newham ii May 2010
PREFACE
It is accepted that the technical content of the London Borough of Newham SFRA will need to be reviewed and amended as new information becomes available.
Although there is no statutory consultation requirement at this stage the nature of the intended end use for the information makes it appropriate to obtain feedback relating to the report in order to contribute to the overall robustness and credibility of this work. This information will also be an aid when formulating the necessary next steps in engaging those parties who will be involved in the future.
It is the responsibility of the reader to be satisfied that they are using the most up to date information and that this has been included within the London Borough of Newham SFRA.

London Borough of Newham SFRA
London Borough of Newham iii May 2010
FOREWORD
The London Borough of Newham is required to prepare a Strategic Flood Risk Assessment (SFRA) to support their Local Development Framework (LDF). This has been done in response to the guidance in Planning Policy Statement 25 – Development and Flood Risk that states that a sequential risk based approach should be applied to decision making at all levels of the planning process. The principle stages being the Regional Level (London Plan), the Local Level (this assessment) and the site level (planning applications).
The SFRA creates a strategic framework for the consideration of flood risk when making planning decisions at Local Level. It has been developed with reference to Planning Policy Statement 25 (PPS25), the PPS 25 Practice Guide (CLG, June 2008) and previously the Practice Guide Companion to PPS 25 “Living Draft” (DCLG, February 2007) and additional guidance provided by the Environment Agency.
The fundamental concepts that underpin the SFRA are outlined in PPS 25. The guidance provided in this document requires local authorities and those responsible for development decisions to demonstrate that they have applied a risk based, sequential approach in preparing development plans and consideration of flooding through the application of a sequential test and exception test (where applicable). Failure to demonstrate that such a test has been undertaken at this level potentially leaves planning decisions and land allocations open to challenge during the planning process.
The underlying objective of the risk based sequential allocation of land is to reduce the exposure of new development to flooding and reduce the reliance on long-term maintenance of built flood defences. Within areas at risk from flooding, it is expected that development proposals will contribute to a reduction in the magnitude of the flood risk.
SFRAs are essential to enable a strategic and proactive approach to be applied to flood risk management. The assessment allows us to understand current flood risk on a wide-spatial scale and how this is likely to change in the future.
The main objectives of the Newham SFRA are to provide flood information:
• As the evidence base for the application of the risk based sequential approach, including assessing site allocation within flood zones;
• to support planning decisions through the assessment of all sources of flooding;
• that is strategic as it covers a wide spatial area, considering both present and future risk;
• that supports sustainability appraisals and local development documents by informing local policy decisions and the requirements to satisfy the Exception Test;
• that identifies what further investigations may be required in flood risk assessments for specific development proposals; and
• that informs decisions on local emergency planning with respect to flooding.
The SFRA is presented in a number of documents:
• VOLUME 1 – Decision Support Document (this document);
• VOLUME 2 – Technical Report; and,
• VOLUME 3 – Mapping.
The SFRA is a live document that is intended to be updated as new information and guidance becomes available. The outcomes and conclusions of the SFRA may not be valid in the event of

London Borough of Newham SFRA
London Borough of Newham iv May 2010
future changes to legislation, policy of revised government guidance on flood risk, the data or the baseline flooding situation. Decisions also require the inclusive assessment of wider planning issues and the user should be aware that changes to decision making principles affecting other planning issues can potentially affect the outcome of the risk based sequential test. The contents of this document are also dependant on the content of the Regional Flood Risk Appraisal. It is the responsibility of the user to ensure they are using the best available information. The Practice Guide (CLG, June 2008) identifies a strategic approach to the preparation of SFRAs so that the level of details of assessment matches the significance of the risk. This SFRA describes the outcome of a combined ‘Level 1’ and ‘Level 2’ assessment. It contains a general assessment of risk from all sources over the whole Newham and also detailed analysis for locations where flood risk is a significant issue.

London Borough of Newham SFRA
London Borough of Newham v May 2010
London Borough of Newham STRATEGIC FLOOD RISK ASSESSMENT - Structure
SFRA VOLUME 1 – DECISION SUPPORT
1. Introduction
2. Flooding in London Borough of Newham
3. How to Use the SFRA in Forward Planning
5. How to Use the SFRA in Flood Warning and Emergency Planning
4. How to Use the SFRA in Development Control
6. Other Possible Users of the SFRA
7. Flood Risk at Key Development Sites
SFRA VOLUME 2 – TECHNICAL REPORT
1. Introduction and catchment summary
2. Flood Warning and Emergency Planning
3. Asset and Structure Data
4. Flooding from Rivers
5. Tidal Flooding
6. Flooding from Land, Surface Water, Sewers and SUDS
7. Groundwater Flooding
8. Flooding from Artificial Sources
SFRA VOLUME 3 - MAPS
8. Policy Recommendations and Guidance
9. SFRA Maintenance and Management

London Borough of Newham SFRA
London Borough of Newham Page vi May 2010
Document Register
It is accepted that the technical content of the London Borough of Newham SFRA will need to be reviewed and amended as new information becomes available.
It is the responsibility of the reader to be satisfied that they are using the most up to date information and that this has been included within the London Borough of Newham SFRA.
The London Borough of Newham SFRA (this document) is a live document requiring review in the event of an improvement or change in the fundamental principles or best available data underpinning the strategy. This is likely to include, but should not be limited to:
• An improvement in the best available information or a reduction in uncertainty;
• Revision to relevant policy, plans or guidance at national, regional and local level;
• Outcomes of neighbouring strategies; and
• Changes to the parent guidance contained in the London Plan or the regional flood Risk Appraisal.
Revisions to this document should be recorded below in Table 1.0 to maintain clarity for those making decisions involving flood risk issues.
Table 1.0 Document Register
Version Date Issued by Issued to
Draft V1 20th November 2009
Capita Symonds Ltd
LB Newham, EA, ODA
Draft V1.1 1st February 2010
Capita Symonds Ltd
LB Newham, EA
Final V2.0 16th April 2010
Capita Symonds Ltd
LB Newham

London Borough of Newham SFRA
London Borough of Newham Page vii May 2010
CONTENTS PREFACE .................................................................................................................... ii FOREWORD................................................................................................................ iii Document Register .................................. .............................................................. vi
1 INTRODUCTION AND CATCHMENT SUMMARY................. .............................. 1-1 Introduction ....................................... ................................................................... 1-1 Study Area ......................................... ................................................................... 1-2 Infrastructure..................................... ................................................................... 1-3 Regional Geology ................................... ............................................................. 1-4 Topography ......................................... ................................................................. 1-4 River Catchments ................................... ............................................................. 1-5 Sources of flooding ................................ ............................................................. 1-7
2 FLOOD WARNING AND EMERGENCY PLANNING............... ............................ 2-1 Introduction ....................................... ................................................................... 2-1 Flood warning ...................................... ................................................................ 2-1 Emergency planning................................. ........................................................... 2-2 References......................................... ................................................................... 2-4
3 ASSET & STRUCTURE DATA ............................. ................................................ 3-1 Introduction ....................................... ................................................................... 3-1 Data collection and Manipulation................... .................................................... 3-1 System Asset Management Plans (SAMPs).............. ........................................ 3-2 Summary of key flood defences...................... ................................................... 3-2 Maintenance ........................................ ................................................................. 3-6
4 FLOODING FROM RIVERS.................................................................................. 4-1 Description ........................................ ................................................................... 4-1 Data Collection.................................... ................................................................. 4-1 Methods for assessing flooding from rivers......... ............................................ 4-8 Climate Change..................................... ............................................................. 4-11 Flood Hazard ....................................... ............................................................... 4-12 Results ............................................ .................................................................... 4-13 Uncertainty in flood risk assessment ............... ............................................... 4-16 Managing flooding from rivers ...................... ................................................... 4-18 Planning considerations ............................ ....................................................... 4-19 References......................................... ................................................................. 4-19
5 TIDAL FLOODING ..................................... ........................................................... 5-1 Description ........................................ ................................................................... 5-1 Data Collection.................................... ................................................................. 5-1 Methods for assessing flooding from tidal sources .. ...................................... 5-3 Climate Change..................................... ............................................................... 5-9 Results ............................................ .................................................................... 5-11

London Borough of Newham SFRA
London Borough of Newham Page viii May 2010
Uncertainty in flood risk assessment ............... ............................................... 5-15 Managing flooding from tidal sources............... .............................................. 5-16 Planning considerations ............................ ....................................................... 5-16 References......................................... ................................................................. 5-17
6 FLOODING FROM LAND, SURFACE WATER, SEWER, AND SUDS . .............. 6-1 FLOODING FROM LAND AND SURFACE WATER .......................................................... 6-1 Description ........................................ ................................................................... 6-1 Causes and classifications......................... ........................................................ 6-1 Impacts of surface water flooding .................. ................................................... 6-2 Data collection .................................... ................................................................. 6-2 Assessment of flood risk ........................... ......................................................... 6-4 Results ............................................ ...................................................................... 6-4 Climate change ..................................... ............................................................... 6-4 Uncertainty in flood risk assessment ............... ................................................. 6-5 FLOODING FROM SEWERS ........................................................................................ 6-5 Description ........................................ ................................................................... 6-5 Causes of sewer flooding ........................... ........................................................ 6-6 Impacts of sewer flooding .......................... ........................................................ 6-6 Data collection .................................... ................................................................. 6-7 Methods for assessing flooding from sewers ......... ......................................... 6-7 Climate Change..................................... ............................................................... 6-8 Results ............................................ ...................................................................... 6-8 Uncertainties in flood risk assessment ............. ................................................ 6-9 MANAGING FLOODING FROM LAND, SURFACE WATER AND SEWERS .......................... 6-9 Planning considerations ............................ ....................................................... 6-19 References......................................... ................................................................. 6-22
7 GROUNDWATER FLOODING............................... ............................................... 7-1 Description ........................................ ................................................................... 7-1 Causes of high groundwater levels .................. ................................................. 7-1 Impacts of groundwater flooding.................... ................................................... 7-5 Data collection .................................... ................................................................. 7-6 Methods for assessing flood risk................... .................................................... 7-7 Methods used in the SFRA ........................... ...................................................... 7-8 Climate change ..................................... ............................................................. 7-10 Results ............................................ .................................................................... 7-11 Uncertainties in flood risk assessment ............. .............................................. 7-12 Management of groundwater flooding ................. ........................................... 7-13 Planning considerations ............................ ....................................................... 7-13 References......................................... ................................................................. 7-14
8 FLOODING FROM ARTIFICIAL SOURCES ................... ..................................... 8-1 Description ........................................ ................................................................... 8-1 Overview of flooding from artificial sources ....... ............................................. 8-1 Assessment of Flood Risk........................... ....................................................... 8-2

London Borough of Newham SFRA
London Borough of Newham Page ix May 2010
Climate change ..................................... ............................................................... 8-4 Management of flooding from artificial sources ..... ......................................... 8-4 Planning considerations ............................ ......................................................... 8-5
9 GLOSSARY AND NOTATION .............................. ................................................ 9-1

London Borough of Newham SFRA
London Borough of Newham Page x May 2010
[This page has been left blank to enable double sided printing]

London Borough of Newham SFRA
London Borough of Newham 1-1 May 2010
1 Introduction and Catchment Summary 1.1 Introduction
The London Borough of Newham SFRA provides a broad scale assessment of flood risk. The need for Local Planning Authorities to consider flood risk when preparing Local Development Documents (LDDs) and to produce SFRAs is outlined in Planning Policy Statement 25 (PPS25, DCLG 2006).
This document is the Volume 2: Technical Report of the London Borough of Newham SFRA, and should be read in conjunction with the London Borough of Newham SFRA Volume 1: Decision Support Document. Volume 1 (Support Document) provides a summary of the SFRA and guidance on how to use the SFRA. The structure of this SFRA is explained in the diagram shown in the foreword to this report.
This document (Volume 2: Technical Report) outlines and describes the strategy adopted to assess strategic flood risk issues within the borough. The principal requirement for adopting a strategic approach to the assessment and consideration of flood risk is in accordance with advice given in PPS25.
The approach adopted has primarily been developed in recognition of the need to provide flood risk information to support appropriate land use allocations within Newham, and to support the application of the Sequential Approach.
The underlying objective is to initiate a strategy that provides a framework for the consistent consideration of flood risk in seeking to accommodate current best practice and best available data for the lifetime of the planning process. This framework will be used to inform the policies and plans described in the emerging Local Development Frameworks (LDF).
The assessment evaluates risk as the product of the probability and the consequence of particular events. Probability is defined as the frequency and magnitude of floods that are generated by fluvial flows, storm surges and intense rainfall activity. The consequence is defined as the impact of floodwater on receptors (people, property, land, etc). This approach is sympathetic to the concept of source, pathway and receptor now adopted for flood risk management.
The reader requiring specific information is directed to the following chapters:
• Chapter 1 – Catchment Summary
• Chapter 2 – Flood Warning and Emergency Planning
• Chapter 3 – Asset and Structure Data
• Chapter 4 – Flooding from Rivers
• Chapter 5 – Tidal Flooding
• Chapter 6 – Flooding from Land, Surface Water and SuDS
• Chapter 7 – Groundwater Flooding
• Chapter 8 – Flooding from Artificial Sources
• Chapter 9 – Flood Risk at Allocation Sites and Strategic Options

London Borough of Newham SFRA
London Borough of Newham 1-2 May 2010
This document does not replace, and should be read in conjunction with, national and regional policy including PPS25 and relevant regional policy. The SFRA does not replace the responsibility at a broader level to consider wider catchment flood risk management approaches and solutions, nor does it remove the requirement for appropriately focused local/site FRA’s.
This Strategic Flood Risk Assessment (SFRA) is a combination of Level 1 and Level 2 assessment as described by the PPS 25 Practice Guide (CLG, June 2008). The study uses the best available information to assess flood risk. This includes the Flood Zones (EA), and other information, which enables a broad assessment of the Flood Risk for the existing conditions within Newham. The combined Level 1 and Level 2 approach presents a broad scale assessment of flood risk across the whole Borough (Level 1) with additional, more detailed, information provided for areas identified as at risk of fluvial and tidal flooding (Level 2).
This report is a full technical report documenting the assumptions, processes and assessment undertaken in the development of the SFRA. It is intended to serve as a transparent record of the decisions and methodology that led to the outcomes of the SFRA.
1.2 Study Area
The London Borough of Newham is situated on the north side of the River Thames approximately 3 miles from the City of London, and is a focal point of the East End. The Borough covers an area of approximately 36km2, a significant portion of which is in a high risk of flooding. The Borough is also ranked as the most ethnically diverse district in England and Wales1.
The River Lea forms the boroughs western boundary with the London Borough of Newham and the River Roding forms the eastern boundary with the London Borough of Barking and Dagenham. The River Thames forms the southern boundary, and to the north are Wanstead Flats which take in Newham’s border with the London Boroughs of Hackney, Waltham Forest and Redbridge. Signification regeneration is already underway within the borough, including a large portion of Olympic and Legacy facilities, Stratford City, and Canning Town and Custom House regeneration.
Historically, farming was the significant land use across Newham until the mid 19th century. Although some industries emerged along the River Lea between the 13th and 19th centuries, significant changes within the borough did not occur until the Royal Docks were constructed in the 1850s. The railway links to the Royal Docks encouraged other industries to the area, and Newham grew to be one of the most important manufacturing centre in southern England.2
As industries declined, and after the devastation of the World War II bombing of the borough, many new council houses were constructed, and the population became increasingly diverse as new immigrants were recruited to help with post - War reconstruction.
Newham is a completely urban area of mixed commercial, residential and some industrial land uses. The built form is mixed, but consist largely post war housing estates that are undergoing regeneration, traditional terraced house and increasingly a mix of modern, high density mixed-use development. There are some areas of parkland and open space including West Ham Park, Beckton District Park and Thames Barrier Park, but the majority of the Borough is developed. The total population of Newham is approximately 244,000 and is expected to grow by approximately 10% over the next 15 years3. It currently also has the second highest unemployment rate in London (6.7%), and the largest average household size in England Wales (2.64)4.
There are significant targets for new jobs and new homes in Newham, with more than 55,000 new jobs expected through the Opportunity Areas in the Lower Lea Valley (including Stratford) and the Royal
1 Simpson's Diversity Index on the 2001 census results, http://www.wikipedia.org 2 http://www.newham.gov.uk/AboutNewham/History/History.htm 3 Newham’s Housing Strategy Statement, Update 2003/05 4 http://www.newham.gov.uk/Services/CensusInformation/AboutUs/censussynopsis.htm

London Borough of Newham SFRA
London Borough of Newham 1-3 May 2010
Docks. The target for number of new homes within Newham is 35,100 over the next ten years (3,510 per year between 2007/08 to 2016/17)5.
There are two designated opportunity areas within Newham, identified by the Mayor in the London Plan6. The Lower Lea including Stratford and the Royal Docks/City East are identified as areas of opportunity which are key areas to contribute to the overall aims of the London Plan by:
� Exceeding the minimum guidelines for housing and with regard to indicative estimates for employment set out in the sub-regional tables;
� Maximising access by public transport;
� Take account of the community, environment and other distinctive local characteristics of each area; and
� Promoting social inclusion and relate development to any nearby Areas for Regeneration.
The GLA have produced the Lower Lea Valley Opportunity Area Planning Framework. The document includes the 2012 Olympic and Paralympics Park and overall it is anticipated that the area should accommodate between 30,000 and 40,000 new homes and a significant number of jobs. It is also made clear that this growth needs to be adequately supported by infrastructure including public transport, schools, health facilities and open space. To date Newham have not endorsed this document as it is considered to contain a number of drawbacks related to land use and transport requirements in the borough. The study is being considered in the Newham commissioned Stratford and Lower Lea Valley Action Plan (AAP), due to be finalised in 2010.
1.3 Infrastructure
There are a number of major infrastructure routes within the London Borough of Newham including underground and national rail lines and the Docklands Light Railway.
The Docklands Light Railway runs in an east-west direction through the southern part of Newham, entering at the Limmo Peninsula Ecological Park near Canning Town Station where it then runs along the northern edge of the Royal Victoria and Albert Docks before finishing at the DLR’s most easterly stop in Beckton. There is also another short section of DLR which runs alongside the national rail route into Stratford in the northwest of Newham. There are a number of DLR stations within the Borough. Much of the DLR route is within areas with a high risk of flooding from tidal surge events in the River Thames, however is significantly raised above the ground.
The District and Hammersmith & City underground lines cross the centre of the London Borough of Newham in a north-easterly direction. There are a number of stations on these lines within the Borough. The underground lines are above ground within Newham.
There are also a number of national rail lines travelling through Newham. Three of the lines converge at Stratford and then disperse from there. The ‘London Overground’ line runs from Richmond around the north of London and down to North Woolwich. After passing north-south through Stratford it runs along the southern boundary of Newham, providing a link to City Airport before finishing at North Woolwich station. The second branch of the ‘London Overground’ between Gospel Oak and Barking passes through the north east of Newham, in the vicinitry of Manor Park. The national rail c2c railway between London and Southend/Tilbury runs east-west through the centre of Newham. Additionally, there are many bus routes passing through the Borough.
City Airport, located at the Royal Docks, is regionally important transport infrastructure, providing connection to over 30 cities across Europe.
5 Annex 10, The London Plan (consolidated with alternations since 2004) 6 Map 5c-1, The London Plan (consolidated with alternations since 2004)

London Borough of Newham SFRA
London Borough of Newham 1-4 May 2010
There is one hospital within the London Borough of Newham, the Newham University Hospital located on Glen Road in the centre of the borough. There are four fire stations and five police stations located around the borough. Figure 2.1 shows the location of the hospitals, fire and police stations within the London Borough of Newham.
Thames Water Utilities’ Beckton Sewage Treatment Works is located within the London Borough of Newham. This is the largest sewage treatment works in the UK receiving sewage from 3.4 million Londoners located within North and East London.
Much of the sewage arrives on the site through the gravity fed Northern Outfall Sewer which crosses Newham in an east-west direction from Wick Lane in Tower Hamlets, south of Stratford and West Ham, before reaching the Sewage Treatment Works at Beckton. It was originally constructed in the mid 19th Century as a result of the “Big Stink” and cholera outbreak at the time. Low level sewers pump into the Northern Outfall Sewer at Abbey Mill Pumping Station, located on Abbey Lane in Newham between the Channelsea River and Prescott Channel. The Northern Outfall Sewer has been constructed raised above ground level and has been developed as a ‘Greenway’ for pedestrians and cyclists.
Thames Water are proposing significant new sewerage infrastructure in the London Borough of Newham over the next 10 years. It is proposed to construct a 7.2m diameter tunnel under the Thames from Hammersmith through to Crossness Sewage Treatment Works (Thames Tideway Project), and a new sewer along the same route as the Northern Outfall Sewer through Newham from Abbey Mills Pump Station to Beckton Sewage Treatment Works (The Lee Tunnel). The purpose of the two projects is to significantly reduce the volume of sewage that overflows from combined sewer outfalls (CSO’s) into the River Lee and River Thames. The timetable for construction is currently likely to be from 2012 through to 2020.
1.4 Regional Geology
Newham lies within the London Basin, which has been shaped by a relatively thick (few hundred metres) chalk syncline. The basin has been infilled over time by a series of clays and sands, the most notable deposit being the fossil rich and impermeable London Clay. The clay layer can be up to a maximum of 150m thick beneath the city. More recently in geological terms, the London Clay has been overlain by drift deposits from river terraces. As the Rivers Thames, Roding and Lea have altered path and scoured channels deeper through time, they have left deposits of sand and gravel in terrace formations upon the underlying geology.
1.5 Topography
LiDAR and photogrammetry data was used to generate a Digital Terrain Model (DTM) within Newham, this is shown in Volume 3, Figure 1.2. LiDAR is a remotely sensed topographic data set held by the Environment Agency and can provide vertical accuracies in the region of 250mm. Photogrammetry was flown of the Lower Lea Valley in 2006. The vertical accuracies of photogrammetry are approximately 10mm on soft surfaces and 6mm on hard surfaces.
The data source and area of coverage in the DTM is presented in Table 1.1, and have been agreed as suitable sources at the time of writing this SFRA. As conditions change, in particular in the Lower Lea Valley as a result of the 2012 Olympic development, there will be a need to revisit the source data and update the SFRA.
Recent and proposed topographic changes in the Olympic Park that are expected to influence flood risk in the Lower Lea Valley include:
• Raising
• Infilling of Pudding Mill River;

London Borough of Newham SFRA
London Borough of Newham 1-5 May 2010
• Culverting of Hennickers Ditch;
• Culverting of part of the Channelsea River; and
• Channel works and bank reprofiling along the course of the River Lea and Waterworks River.
The implications of these changes on flood risk are discussed in Chapter 4.
Table 1.1 - DTM Source Data and Coverage
Data Source Area of Coverage Date
Photogrammetry Lower Lea Valley and Docklands March 2006
LiDAR Lower Roding catchment and remaining area of Newham not within the LLV.
March 2007
LiDAR Minor areas where there is incomplete photogrammetry or 2007 LiDAR data
2003
The topography shows Newham generally sloping in a southerly direction towards the River Thames. The highest parts of the Borough are in the north, along the boundaries with the London Boroughs of Waltham Forest and Redbridge, where ground elevations are typically above 12m AOD. The lowest parts of the Borough are the south eastern parts of the borough, with ground elevations as low as 0.8m AOD. Other areas of low ground include Plaistow, Canning Town, Custom House, Silver Town, North Woolwich, North Beckton and parts of Beckton, where ground elevations typically no greater than 2m AOD.
Much of this low lying land in the south of the Borough is potentially associated with a high risk of tidal flooding from the River Thames and fluvial flooding from the River Lea and Roding.
1.6 River Catchments
The River Thames, forming Newham’s southern boundary, drains a catchment of approximately 13,000km2 from it’s source in Gloucestershire, through to it’s mouth near Southend-on-sea on the North Sea coast. In the west the river flows through a rural landscape, predominantly in its natural channel, however in the urban London landscape the Thames and its tributaries have been heavily modified, partly to provide flood protection. The stretch of the Thames bordering Newham is tidally dominated with the tidal influence stretching to Teddington Weir in west London. The Thames catchment has a slow response to rainfall and together with the tidal domination of the North through East London mean fluvial flood risk to Newham directly from the River Thames is negligible compared to the tidal flood risk. Large portions of Newham also lie within the catchments of the River Lea and the River Roding, tributaries of the River Thames.
Figure 1.3 shows the Tidal River Thames, Lower Lea and River Roding catchments in relation to the London Borough of Newham. The River Lea has a catchment of approximately 1400km2 including large parts of North London, Essex, Hertfordshire and Bedfordshire. Downstream of Feildes Weir (between Harlow and Hertford), the River Lea is known as the Lower Lea and flows downstream from here to the confluence with the River Thames. The catchment area of the Lower Lea is approximately 370 km2 and is highly urbanised and heavily anthropogenically influenced.
The Lower Lea flows for 34 km from Feildes Weir in a southerly direction through North London, entering the Thames at Canning Town, just upstream of the Thames Barrier at the boundary between the London Boroughs of Tower Hamlets and Newham. There are five reservoirs in the Lea Valley within North London, and further up the valley many smaller lakes and marshy areas of nature conservation interest. The Lea Valley Regional Park (LVRP) stretches over 40 km along both sides of

London Borough of Newham SFRA
London Borough of Newham 1-6 May 2010
the River Lea from Ware to Temple Mills near Stratford, covering an area of about 4,000 ha including the northern section of the LLV Regeneration Area and parts of the London Borough of Newham.
The catchment of the River Roding is approximately 380 km2. The source of the river is at Molehill Green west of Great Dunmow and east of Stansted Airport. The river flows through Epping, Uttlesford, and Redbridge prior to flowing along the boundaries of Newham and Barking and Dagenham, and discharging into the Thames. There are a number of tributaries discharging into the River Roding, however there are no significant tributaries within the London Borough of Newham. The River Roding includes a distinct land use divide between the upper and lower portions of the river. The upper catchment is predominantly rural with the majority being utilised for arable farming. The lower catchment, including Newham, is a stark contrast in that it is highly urbanised and supports manufacturing and industrial uses. The combination of urbanisation and geology contribute to the flashy response to rainfall and the catchment is prone to flooding after prolonged episodes of heavy rain and large storm events. The Lower River Roding flows from the A12 at Redbridge and approximately defines the tidal limit of the River Roding.
The River Lea is tidal as far upstream as the Lea Bridge sluices. The tidally dominated area between the River Thames and the River Roding is known as the Barking Creek and includes the Barking Barrier, constructed to reduce the risk of tidal flooding to land upstream of the structure (refer Chapter 4). The flood mechanics in both the Lower River Lea and Lower River Roding area are therefore influenced by fluvial inflows from the north and the tidal regime of the River Thames including the operation of the Thames Barrier and Barking Barrier.
The Tidal River Thames catchment in Newham is drained by a series of main rivers and ordinary watercourses that discharge directly into the Thames or the Docks. In many instances these watercourses have been culverted or form part of the underground drainage network. The low-lying nature of the area means that ‘tidelocking’ of the area can occur. This is discussed further in Section 6.
Watercourses within the London Borough of Newham
The Lower Lea forms the boundary between the London Boroughs of Tower Hamlets (to the west) and Newham (to the east). The Lower Lea flows into the River Thames in the Blackwall area, to the west of the Docklands.
In its lower reaches adjacent to Newham the channel of the Lower Lea is constrained within man made banks as it passes through a highly urbanised area, its natural path disrupted by historic development and industry. Figure 1.1 in Volume 3 of this SFRA shows the various watercourses in the lower reaches of the River Lea within the London Borough of Newham, including:
• River Lea • Bowback River
• River Lea Navigation • Prescott Channel
• Waterworks River • Channelsea River
• City Mill River • Three Mills River
• Pudding Mill River • Hennickers Ditch.
The hydraulic model used to inform this SFRA begins at Lea Bridge Sluices where the River Lea divides into the River Lea and the River Lea Navigation Canal. These watercourses flow in a south-easterly direction towards Newham and the Lower Lea Valley (LLV) Regeneration Area.
The River Lea enters Newham on the northern boundary of the Borough near Temple Mills and the A106. Within the Borough, the river splits into the Waterworks River, River Lea and City Mill River around Marshgate Lane, before rejoining to the west of the River Lea, the River Lea Navigation canal also enters the Borough flowing approximately parallel with the River Lea before rejoining with the

London Borough of Newham SFRA
London Borough of Newham 1-7 May 2010
river at Old Ford Locks. The Bow Back River system of navigable waterways is to the east of the River Lea, and is also shown on Figure 1.1.
Also forming part of the Lower River Lea system is the Limehouse Cut and the Hertford Union Canal. Both are artificial watercourses which connect to the River Lea in Tower Hamlets and are shown in Figure 1.1 (Volume 3). Bow Locks are situated at the junction between the Limehouse Cut and the River Lea. At the other end of the Limehouse Cut is the Limehouse Basin which is connected via lock gates to the River Thames. The Hertford Union Canal runs along the southern side of Victoria Park and connects the Grand Union to the River Lea Navigation Canal near to the Bow Industrial Park. Flood risk from these artificial sources of flooding is covered in more detail in Chapter 8 of this SFRA (Volume 2).
The only ‘main river’ tributary of the Lower Roding within the London Borough of Newham is the Whitings Sewer, in the vicinity of the A13 and East Ham. The Mayes Brook and Loxford Water discharge into the Lower River Roding, however both are located in the London Borough of Redbridge. The Beckton Sewage Treatment Plant outfall discharges into the Barking Creek.
There are a number of culverted ordinary watercourses that drain the low areas around Canning Town and Custom House and discharge into the Royal Docks (refer Figure 1.1 in Volume 3).
1.7 Sources of flooding
Flooding is heavily dependent on the interaction of rainfall, catchment characteristics and the sea. PPS25 identifies six sources of flooding to be investigated in an SFRA:
• Flooding from rivers
• Flooding from the sea (tidal and coastal)
• Flooding from groundwater
• Flooding from land
• Flooding from sewers
• Flooding from artificial sources (docks, canals, reservoirs, lakes, pumping).
The London Borough of Newham contains localised areas that are prone to flooding from a range of processes including: fluvial, tidal, surface water, sewer, groundwater, and flooding from artificial sources. Each source of flooding is analysed in more detail in chapters 4 to 8 of this report. The corresponding chapters in Volume 3 contain the relevant flood risk maps.

London Borough of Newham SFRA
London Borough of Newham 1-8 May 2010
[This page has been left blank to enable double sided printing]

London Borough of Newham SFRA
London Borough of Newham 2-1 May 2010
2 Flood Warning and Emergency Planning 2.1 Introduction
PPS25 states 'the receipt of and response to warnings of floods is an essential element in the management of the residual risk of flooding'. Thus it recognises that flood warning and emergency planning makes a significant contribution to the management of flood risk during extreme events.
In exceptional cases where land allocation within flood risk areas is unavoidable, new development should be designed so that flood warning complements other measures and minimises residual risk. It should not be the primary means of protection.
Flood warning and evacuation procedures can reduce the risk of people being exposed to flood waters and minimise the consequences of flooding. Effective land use planning will reduce the requirement for flood warning and emergency planning as new development is steered away from flood risk areas.
2.2 Flood warning
The Environment Agency is responsible for monitoring flood events and for issuing warnings to people in properties and businesses at risk of flooding. In order to fulfil their responsibilities, the Environment Agency operates a coded warning system.
This is a four stage warning system and each stage will trigger a set of procedures for various organisations. Definitions and symbols for each warning code are described in Table 2-1.
Table 2-1 Environment Agency flood warning stages
Alert state Symbol Action
Flood Watch
Flooding of low-lying land and roads is expected in the (XXXX) Area. Be aware, be prepared, watch out!
Flood Warning
Flooding of homes and businesses is expected in the (XXXX) Area. Act Now!
Severe Flood Warning
Severe Flooding is expected in the (XXXX) Area. There is extreme danger to life and property. Act now!
All Clear
Flood Watches or Warnings are no longer in force for this area.
River flood forecasting in the Lea and Roding Valleys is undertaken by the Environment Agency's regional flood warning office in Reading. Tidal flood forecasting is undertaken by the EA Thames Barrier Control Room. Forecasting uses a combination of Meteorological Office weather forecasts and real-time data (rainfall, flow, level and soil moisture).
The Environment Agency maintains a website (www.environment-agency.gov.uk/subjects/flood) that carries the latest information on alert states as well as a series of advice publications A telephone FLOODLINE where the public can call for similar information is also available (0845 988 1188). Alert categories of 'Flood Warning' and higher may also be broadcast on television and radio.

London Borough of Newham SFRA
London Borough of Newham 2-2 May 2010
The London Borough of Newham is covered by the river flood warning areas listed in Table 2-2 (The Environment Agency have advised these are to be updated in late spring/early summer 2010)
Table 2-2 Environment Agency flood warning service
Short area code Flood warning area Source of Flooding
062FWF53Walthams The Lower River Lee at Walthamstow, Hackney and Stratford
Fluvial
062FWB53TidalLee The Lower River Lee from West Ham to Canning Town
Fluvial
062FWB543 The River Roding from Loughton to Barking (due to change in Aug 2009)
Fluvial
063FWT23RoylDock
174313
The River Thames from Beckton Sewage Works to the River Lee including Beckton, Custom House, North Woolwich, Silvertown, Canning Town, Plaistow, Three Mill Meads and South Stratford
Tidal
063FWT23Roding
174312
The River Thames at Beckton Sewage Works including East Ham
Tidal
Short area code Flood watch area Source of Flooding
062WAF53LowerLee The Lower River Lee from Hoddesdon to Canning Town Fluvial
062WAFN11 The River Roding catchment. Fluvial
063WAT233N Tidal Thames including areas in the boroughs of Havering, Barking and Dagenham and Newham
Tidal
2.3 Emergency planning
Local Planning Authorities (LPAs) have a defined role in emergency planning. They are listed as Category 1 Responders along with Emergency and Health Services. The role and responsibilities for emergency planning are set out by legislation following the implementation of the Civil Contingencies Act 2004. The Act defines the term 'emergency' as:
'an event or situation which threatens serious damage to human welfare;
an event or situation which threatens serious damage to the environment, or
war, or terrorism, which threatens serious damage to security'.
There are a number of documents that outline the roles and responsibilities of different sectors at both regional and local levels. The Strategic Emergency Plan is a comprehensive overview of London's co-ordinated response to a catastrophic incident, produced by the London Resilience Partnership. The aim of this document is to set out the strategic regional response of the agencies that make up the

London Borough of Newham SFRA
London Borough of Newham 2-3 May 2010
London Resilience Partnership to incidents requiring multi-agency co-ordination on a pan-London basis.
It should be read in conjunction with the LESLP Major Incident Procedure Manual as the agreed basis upon which the emergency services work in London.
The document provides a general overview of plans and the outline roles and responsibilities. Further details are available within specific plans, such as the London Flood Plan.
The London Flood Response Strategic Plan sits alongside the Strategic Emergency Plan for London and the relevant emergency plans of all Category 1 responders and other organisations concerned with supporting the community when a flood occurs.
The aim of the London Flood Response Strategic Plan is to outline the principles that govern the combined multi-agency response to a significant flood event in London and to communicate these principles to the organisations involved in the response. It is designed to ensure a coordinated response to a flood event which ‘protects life and well-being’ as well as mitigating property and environmental damage. The procedures set out in this plan are intended primarily for tidal and fluvial flooding, with a few that also relate to surface water flooding. These procedures are then fed down to the Local Authorities and response units to devise their own emergency response plans. As ‘emergencies’ often affect more than one borough, sharing of information between boroughs is vital. One of the ways cooperation and information sharing is achieved is through Local Resilience Forums (LRFs). In London there are six LRFs, bringing together groups of five or six boroughs. Newham is a part of the Central London LRF.
The roles and responsibilities7 of an LPA comprise of preplanning, emergency response and recovery. In the preplanning stage, the LPA’s responsibilities include:
• Communication strategy for informing residents;
• Allocation of rest, reception and media centres;
• Location of vulnerable people and sites.
During an emergency response event, the LPA’s responsibilities include:
• Co-operation with emergency services and EA to coordinate response;
• Assist in warning and informing residents;
• Provision of anti-flooding measures and a workforce to construct and maintain these defences (i.e. sandbags); and
• Liaison with Water Authority to ensure provision of clean drinking water.
Subsequent to a flood event, the LPA is responsible for the recovery of the local area. This includes:
• Cleaning up of debris;
• Provision of accommodation for those made homeless by the event;
• Assisting residents in removal of damaged goods; and
• Ensuring continuing education of pupils if schools are affected.
7 London Flood Response Strategic Plan, London Resilience, March 2007

London Borough of Newham SFRA
London Borough of Newham 2-4 May 2010
The generic methods through which Newham implement these responsibilities are presented in the Corporate Emergency Plan (2005). A specific Flood Plan (a multi agency flood plan) will be produced in early to mid 2010. The information contained within this SFRA will be considered in the formulation of the Newham Multi Agency Flood Plan.
In order for emergency response to be effective, the key locations during a flood emergency such as Police / Fire / Ambulance stations, control centres (Folkestone Road Depot, East Ham), telecommunications installations, and rest, reception and media centres should be located in low risk areas. As PPS 25 states, these are highly vulnerable to flood risk, as they required to be operational during flooding. The current locations of the fire stations and control centre in Newham are shown in Figure 2.1.
2.4 References London Resilience Strategic Emergency Plan (2007)
http://www.londonprepared.gov.uk/londonsplans/emergencyplans/strategy.jsp
The London Flood Response Strategic Plan (2007)
http://www.londonprepared.gov.uk/londonsplans/emergencyplans/flooding.jsp
London Borough of Newham Response to Major and Catastrophic Incidents (May 2005)
http://www.newham.gov.uk/Services/EmergencyPlanning/AboutUs/AboutEmergencyPlan.htm
Civil Contingencies Act 2004

London Borough of Newham SFRA
London Borough of Newham 3-1 May 2010
3 Asset & Structure Data 3.1 Introduction
Traditional defences such as raised banks and walls are built to help reduce the occurrence, and therefore frequency of flooding. Some other structures provide flood defence benefits, however they are also built to manage low flows or are part of the infrastructure network. These assets can be owned, operated and maintained by the Environment Agency, Local Authorities, private business and/or local residents. This Chapter summarises the defences identified and reviewed in the Newham study area.
In addition to defences, infrastructure such as major roads and railway lines can influence river flows and perform a function as being ‘defacto defences’. Although these features are not considered formal flood defences they influence river flows and floodplain extents.
In some instances, river processes can be modified over time by defences (such as river walls, flood storage areas, flood alleviation channels and embankments) and by undertaking maintenance activities (such as river dredging). Therefore to fully understand flood risk, it is necessary to assess the area at risk of flooding:
• with the flood defences in place;
• with the flood defences removed; and
• with a breach or failure of the flood defence.
To do so, the existing flood defences must be identified and defined in terms of their type and physical characteristics. In addition, information on ownership, condition and maintenance arrangements are required to assess the likelihood of failure. However, it should be remembered that it is extremely difficult to assign statistical probabilities to failure events and the real benefit of such analyses is to comprehend the scale of an emergency if it occurred. By understanding the potential consequences during ‘emergency failures’ it is possible to identify strategic measures that enhance the capability of the emergency services to protect the community and improve the sustainability and safety of infrastructure.
3.2 Data Collection and Manipulation
Sources of data
The Environment Agency’s National Flood and Coastal Defence Database (NFCDD) has been the primary source of information for identifying flood defences. NFCDD contains flood defence and asset data for the whole of England and Wales. Other information from the Environment Agency, relating to the operation of the Thames Barrier, has been used to supplement NFCDD.
NFCDD contains details of a number of structures across Newham. Many of these, including lock gates, do not have a major impact on flooding during large events. Environment Agency National Guidance provides information by which to define flood defences. Only flood defences such as flood alleviation channels and raised defences have been identified as flood defences for the purposes of the SFRA.
NFCDD structures not considered flood defences include surface water outfalls, natural banks, raising of ground levels and maintained channels (dredged and weed cut).
The main type of defence used within Newham, as identified from the NFCDD, are the Thames Tidal Defences (including the Thames Barrier and Barking Barrier) which are designed to protect London

London Borough of Newham SFRA
London Borough of Newham 3-2 May 2010
from flooding by a tidal surge in the River Thames. The Thames tidal defences are typically man-made embankments.
The Lower Lea Valley (LLV) Regeneration Model and the Lower Roding Tuflow Model used to assess fluvial flooding in this SFRA (see Chapter 4) include additional information on defence heights from channel cross-sections surveyed for the London Development Agency in 2006 and defence crest levels surveyed for the London Thames Gateway Development Corporation (LTGDC) in 2007.
3.3 System Asset Management Plans (SAMPs)
The Environment Agency is revising how it manages its flood defences. It is now recognised that flood defences should be analysed as groups of structures, rather than individual assets. These groups are termed 'management units' and will be identified and managed through System Asset Management Plans (SAMPs).
Each SAMP is identified by reviewing geographical, hydrological and operational factors, including how the system can be managed as a whole to deliver an acceptable level of flood risk. Each SAMPs should take into account the Catchment Flood Management Plan (CFMP) policies for the area and other strategic drivers for the catchment.
SAMPs are being piloted nationally and following the completion of this pilot scheme the guidance will be reviewed and delivery schedules for SAMPs set. There are currently no SAMPs within the London Borough of Newham. The EA have indicated that they are expecting completion within the next three years.
SAMPs will change with time as the Environment Agency develops a better understanding of how their assets are operated and maintained. Currently the SAMPs are an internal tool for managing flood defence assets.
3.4 Summary of key flood defences
Historically the traditional methods of flood protection were to build up the embankments and walls of a river. Long stretches of riverbank were raised after the Thames Flood Act of 1879 was passed. Additional measures were introduced after the 1928 floods and the official inquiry into the 1953 floods recommended “apart from erecting further walls and banks, an investigation should be made into the building of a flood barrier across the Thames”. Figure 3.1 in Volume 3 of this SFRA shows the flood defences and assets in Newham. The key flood defences are summarised below.
River Lea Flood Relief Channel
Although it is not located in Newham, the River Lea Flood Relief Channel (RLFRC) is a dominant feature in the discharge of flows through the Lower Lea Valley. It was constructed in sections between the 1940s and 1970s (in response to the 1947 floods) and was completed in 1976. It has significantly improved flood defence in the upper parts of the Lower Lea Valley, although not specifically in Newham. It was constructed to give protection during events with return periods up to 1 in 70 years and since 1976 has been successful in containing flooding along the Lower Lea, although it was almost full in the storms of October 1987 and October 1993 and overtopped in October 2000 and in 1993 at Chingford. The River Lea flows through the RLFRC for 25 km downstream of Feildes Weir, before becoming part of the River Lea again for the remaining 9 km to the Thames. For most of its length the RLFRC flows parallel to the River Lee Navigation and the old River Lea system. There are several links between the River Lee Navigation and the flood relief channel control structures that keep the water level in the relief channel constant, except in times of flood when the sluices open to allow discharge of flood waters.

London Borough of Newham SFRA
London Borough of Newham 3-3 May 2010
Thames Tidal Defences
The Thames and Medway estuaries are protected from tidal flooding by a system comprising the Thames Barrier, seven other major flood barriers owned and operated by the EA, over 400 minor moveable defences and 487 km of tidal walls and embankments. The standard of protection provided is greater than the 1 in 1000 year return period, and the design has an allowance for sea level rise built in to the year 2030 to account for the effect of global warming. Future refurbishment and replacement work may be required to as yet undecided levels because of the uncertainty inherent in climate change predictions. The strategy for managing tidal flood risk in the Thames Estuary is due to be published by Thames Estuary 2100 in late 2009. The outcomes of the Thames Estuary 2100 strategy will need to be included in future revisions of this SFRA.
The embankments along the River Thames in Newham are part of the system of the Thames Tidal Defences and were improved to match the standard of protection offered by the Thames Barrier, as described below. These defences generally comprise of raised man-made defences. In Newham, the Thames tidal defences have a statutory defence level of 5.18m AOD from the confluence of the River Lea and the River Thames downstream as far as the Thames Tidal Barrier. Immediately downstream of the Thames Tidal Barrier the statutory defence level is 7.2m AOD.
There is a ‘staircase’ of statutory tidal defence levels on the River Lea in Newham between 5.23mAOD and 5.49mAOD, and a ‘staircase’ of levels up the River Roding between 5.5mAOD and 5.6mAOD. These act in combination with the Thames Barrier and Barking Barrier to provide protection to Newham from a tidal flood event.
The NFCDD defence data supplied by the EA provides details of the design upstream and downstream crest levels of all the defence sections and the event to which they are designed to protect to, which area all designed to a 1000 year standard.
Thames Barrier
The Thames Barrier is a significant feature of the Thames Tidal Defences and is located between Newham and Greenwich. It became operational in October 1982 and was closed for the first time in February 1983. The Barrier is part of a system of tidal defences that currently protect London to extremely high standards. However this level of protection is expected to decline in the future and by 2030 the level of protection is estimated to reduce to 1 in 1000 year return period. This is still much higher than the standard of protection offered to most coastal areas of the UK although lesser than the standard of protection afforded by defences protecting significant areas of Holland from inundation. The EA’s website describes 32 km of defences downstream of the Barrier, with bank levels 2 m higher than previously existed, including the 60 m high Barking Barrier. Defences in Newham and other Boroughs upstream of the Barrier were also raised to provide the same standard of protection.
The decision to close the Barrier is taken by the EA Barrier Controller based on information on the predicted height of the incoming tide as estimated by the Storm Tide Forecasting Service at the Meteorological Office and information from the Barrier’s own computer analysis. The Barrier is normally closed 1-3 hours after low water, which is 3-4 hours before the peak of the incoming surge tide reaches the Lower Lea.
The Environment Agency has provided the following information on the operation of the Thames Barrier8:
The operation of the Thames Barrier and it’s Associated Gates is governed by the Thames Barrier and Flood Prevention Act 1972.
Three models contribute to the forecast procedure for Tidal Thames.
8 The Operation of The Thames Barrier, Environment Agency, provided October 2007

London Borough of Newham SFRA
London Borough of Newham 3-4 May 2010
o North Sea Model
o Continental Shelf Model
o River Thames Model, known as the ISIS model
These models have been in operation, modified and refined over a number of years. This process is ongoing. The information provided by the models is supplemented by information supplied by the Meteorological Office and real time information provided by the National Tidegauge Network around the east and south coast and tide gauges located on the tidal Thames. Tides are tracked as they travel down the East Coast (approx. 36 hrs in advance of reaching the Thames Estuary). The decision to close or not is based on three major factors:
o The height of the tide (usually a spring tide) measured at the Thames Estuary
o The tidal surge, which naturally accompanies each tide.
o The fluvial flow entering the tidal Thames, measured as it passes over Teddington Weir.
In general terms the Thames Barrier would start to close approx. 1.5 hours after low water at North Woolwich. Closure of all 10 gates takes approx. 1.24 hours and creates an ‘empty reservoir’ for fluvial flow entering the tidal Thames at Teddington. The Thames Barrier will then remain closed over high water until the water level down stream of the Thames Barrier has reduced to the same level as upstream. This is a managed process to provide for different circumstances and takes approx. 5 hours to achieve. The Thames Barrier is then opened, allowing the water upstream to flow out to sea with the outward-bound tide.
The Barrier has no individual trigger level for closure. Hydrological and meteorological data is fed to our control room every 20minutes by telemetry. The closing regime is guided by a mathematical matrix considering fluvial flow, tide and surge from this data. The end decision for closure lies with the Thames Barrier duty controller at the time.
Since its first closure in 1982, the barrier has closed with increasing frequency as sea levels have risen. The barrier now closes, on average, five times a year, compared to once or twice a year when it first became operational. By 2030 it is expected to close 30 times per year9. The 100th closure of the Barrier was recorded in March 2007 and a significant recent closure, which made national news, was on the 8th/9th November 2007 when the Barrier closed to protect London against the North Sea surge tide which threatened flooding along much of the coastline of eastern England10.
Thames Estuary 2100 is the Environment Agency project to develop a tidal flood risk management strategy for the Thames up to 2100 taking into account the increasing flood risk caused by rising sea levels and the ageing of the defence infrastructure. The project has now been published for consultation and has identified estuary wide approaches to managing water levels and local options for managing flood risk. These options are now being appraised in Stage 3 of the project and a final plan for managing flood risk have been submitted to Defra in late 2009.
The current understanding of the TE2100 management options are that11:
• The Thames Barrier, with some modification, could continue to provide protection to London through this century (based on current climate guidance).
9 http://www.environment-agency.gov.uk/news/1725683 10 http://news.bbc.co.uk/1/hi/england/7085394.stm 11 http://www.environment-agency.gov.uk/homeandleisure/floods/104697.aspx

London Borough of Newham SFRA
London Borough of Newham 3-5 May 2010
• We are unlikely to see major changes to the existing system of defences until some time after 2070 though we will have to invest more in upgrading the current defence system from around 2030.
• As our worst case climate change scenario has been revised down we are very unlikely to require an outer estuary barrage (tide excluding) in the estuary.
• Spatial planning and emergency preparedness will have an increasing role to play in reducing the risks associated with development in the defended floodplain.
The Environment Agency considers it unlikely that the final recommendations for Newham will change significantly. The recommended actions for Newham from TE2100 are identified in Appendix A of Volume 1 of this SFRA, however in summary include:
• Agree a programme [with Newham] to provide local flood protection, resilience and emergency plans for vulnerable key sites;
• To agree partnership arrangements and principles to ensure that new development in the east
London zone is safe, and reduce the consequence of flood risk;
• To maintain, enhance, improve or replace the river defence walls and active structures through east London;
• To agree a programme [with Newham] of managing flooding from other sources in the
defended tidal floodplain; and
• To implement a programme of defence raising through east London from 2065 to 2070.
Barking Barrier
The Barking Barrier consists of three wing gates and one 60m high guillotine style ‘drop gate’ structure to allow shipping to the Town Quay area on the River Roding. The Barrier was constructed over a period of four years and completed in 1983. Advice from the Environment Agency is that the Barking Barrier is closed at the same time, and under the same conditions (i.e. the same operational rules), as the Thames Barrier.
King George V Dock Gate
The King George V (KGV) Gate provides protection to the Royal Docks and low lying land in Newham from extreme tidal events in the River Thames that exceed the retained water level in the Docks. The mitre lock gates of the dock entrance, which enable shipping to pass, can only hold water in - higher water levels in the Thames will push them open. The KGV gate therefore removes the need to raise the lock gates to the statutory defence level of 7.2m AODN. The lock is approximately 30 metres wide and the sill (base) level is -10m AOD. The impounded water level inside the dock is 4.26m AOD. Giving a depth in the lock of 14.26m. The KGV gate is owned and operated by the Environment Agency and is closed according the Thames Barrier closure rule.. It normally sits on the north side of the lock entrance and to close it rolls out across the lock with a controlled flap dropping into place, blocking the full width and depth of the lock. The gate cannot be closed remotely like the Thames Barrier and Barking Barrier – it requires Environment Agency staff on site to operate it.
Other assets
Other defence structures and assets in Newham are also shown on Figure 3.1, and play an important role in controlling river levels on the River Lea and River Roding within the borough. These structures

London Borough of Newham SFRA
London Borough of Newham 3-6 May 2010
have an effect on the flood mechanisms in the Lea and Roding and have been incorporated within the hydraulic modelling used to assess fluvial and tidal flood risk. Other assets within Newham include:
River Lea
•••• Old Ford Locks on the River Lea Navigation Canal, near to the point where the Navigation Canal rejoins the River Lea;
•••• Three Mills Culvert and Sluice at the confluence of the Rvier Lea and Three Mills River;
•••• City Mills Lock and Sluice connecting the City Mills River and Three Mills River (the sluice is disused);
•••• Carpenters Road Lock where City Mill River diverges from the River Lea;
•••• Bow Locks at the junction of the River Lea and the Limehouse Cut (within Tower Hamlets); and
•••• The construction of Three Mills Lock on Prescott Channel and Three Mills River by British Waterways has recently been completed (June 2009), and restores navigation within the Bow Back Rivers. The control structure excludes tidal influence upstream and is intended to control river levels at a navigable level. The Lock will also allow the movement of construction materials to the Olympic and Legacy facilities area by water, rather than by road.
River Roding
•••• The Barking Barrage consists of a weir and gates on the River Roding adjacent to the Abbey Road industrial estate. It is used to retain water for amenity and shipping purposes. The Barrage is wholly located within, and is owned and maintained by, the London Borough of Barking and Dagenham under the Barking Barrage Order 1995.
3.5 Maintenance
The Environment Agency and Local Authority carry out annual inspections of flood defence assets and update NFCDD. The data from these inspections is used to inform the owner of their duty to maintain assets to an appropriate level. As a result, information about flood defences is constantly changing.
GIS layers provided within the SFRA must be reviewed to obtain all of the defence information when considering the condition and standard of protection offered by flood defences at specific locations. It is important that users of the SFRA recognise issues with data quality and consistency of the source NFCDD datasets. The most current and correct information should be used. NFCDD is a live database, which is continually updated by the Environment Agency. Future updates of NFCDD should rectify any omissions and errors in the current dataset.
The management of the river defences and assets within the London Borough of Newham is divided between a number of different parties including local authorities and private owners. Private land owners bordering main rivers are responsible for the majority of the river defences. The Environment Agency has a supervisory duty over all flood defences under the Environment Act 1995, however, notably, is responsible for the management and maintenance of the Thames Barrier, Barking Barrier, and KGV Gate.
The Environment Agency has permissive powers to maintain and improve watercourses designated as 'Main River' and associated structures for the efficient passage of river flow and the management of

London Borough of Newham SFRA
London Borough of Newham 3-7 May 2010
water levels. The Environment Agency also has a general supervisory duty for all flood risk management activities.
As the operating authority, Councils have the regulatory and supervisory role for flood defences on all ordinary watercourses which are not within the area of an internal drainage board (IDB). Culverts under roads are generally the responsibility of the relevant Highways Authority.
British Waterways has a number of assets within Newham, including a series of lock gates. These lock gates are primarily in place to maintain navigable levels on the waterways. Whilst not principally for the purposes of flood defence, some of these structures might affect flooding during an extreme tidal event. Further information on these BW assets is presented in Chapter 8 of this SFRA (Volume 2).
The Port of London Authority (PLA) primary responsibilities relate to the Tidal Thames. The PLA is charged with ensuring the safety of navigation along 95 miles of the Tidal Thames from the Estuary upstream to Teddington. The PLA are therefore responsible for dredging and for all navigation buoys. Upstream of Teddington, the Environment Agency is responsible for navigation on the river. The PLA issue licences for river works under Section 66 of the Port of London Act. This states that "… a River Works Licence is required for any works in the River Thames, riverward of the mean high water mark including any works under the river or overhanging the river. This process ensures that all developments in the river are assessed for their potential effect on safety of navigation and the environment." The PLA must therefore be consulted for works relating to the existing Thames tidal defences. The Environment Agency informs the PLA in the event of closure of the Thames Barrier. A team at the PLA manages traffic through the barrier twenty-four hours a day and provide pilotage to assist the passage of larger ships through the Barrier. The Barrier team at the PLA inform incoming/outgoing boats of which spans of the Barrier to use.

London Borough of Newham SFRA
London Borough of Newham 4-1 May 2010
4 Flooding From Rivers 4.1 Description
Flooding from rivers occurs when water levels rise higher than bank levels, causing floodwater to spill across adjacent land (floodplain). The main reasons for water levels rising in rivers are:
• intense or prolonged rainfall causing runoff rates and flow to increase in rivers, exceeding the capacity of the channel. This can be exacerbated by wet antecedent (the preceding time period) conditions and where there are significant contributions of groundwater;
• constrictions in the river channel causing flood water to backup;
• blockage of structures or the river channel causing flood water to backup; and
• high water levels and/or locked flood gates preventing discharge at the outlet of the river.
The consequence of river flooding depends on how hazardous the flood waters are and what the receptor of flooding is. The hazard of river flood water is related to the depth and velocity, which depends on:
• the magnitude of flood flows;
• size, shape and slope of the river channel;
• width and roughness of the floodplain; and
• types of structures that cross the channel.
Flood hazard can vary greatly throughout catchments and even across floodplain areas. The hazard posed by floodwater is proportional to the depth of exposure, the velocity of flow and the speed of onset of flooding. Hazardous river flows can pose a significant risk to exposed people, property and infrastructure.
Whilst low hazard flows are less of a risk to life (shallow, tranquil water), they can disrupt communities, require significant post-flood cleanup and can cause costly and possibly structural damage to property.
The western parts of Newham are within the Lower Lea Valley and are likely to be affected by flooding on the lower reaches of the River Lea. The River Lea forms the western boundary of Newham. The eastern parts of Newham are within the Lower River Roding and are likely to be affected by flooding. The River Roding forms the eastern boundary of Newham.
This chapter described the risk of flooding in Newham from the Lower Lea and River Roding in defended and undefended scenarios using results from the London Development Agency’s Lower Lea Valley Regeneration model and EA River Roding TUFLOW model.
4.2 Data Collection
Record of Historic Flood Events
The Environment Agency has provided a GIS layer showing the extent of flooding in the 1947 flood event. This is shown in Figure 4.1 (Volume 3). The March 1947 floods affected nearly all of the main rivers in the south of England and caused the greatest flood event on the River Lea and River Roding since records began 100 years earlier. The floods were caused by snowmelt followed by rainfall and

London Borough of Newham SFRA
London Borough of Newham 4-2 May 2010
were unique in their volume and persistence. Rainfall on 12 March 1947 triggered the thaw that led to rapid snowmelt and an extremely high runoff rate that caused a rise in water levels in the tributaries of the River Lea and then in the Lea itself. By midday the next day all sluice gates were fully raised but water levels had continued to rise causing extensive flooding. By the morning of 15 March 1947 water levels had reached their peak and fell until the evening of 17 March 1947 when additional rainfall caused the levels to rise a second time. By the afternoon of 18 March 1947 a further peak flooded many areas for the second time. Water levels returned to normal by the evening of 19 March 1947. Flows of 113m3/s were recorded at Feildes Weir and 156m3/s at Lea Bridge, approximately twenty times greater than normal flow12. The extent of flooding in this event is discussed below in the Results section of this chapter. Flooding also occurred in Ilford, Wanstead and Woodford on the River Roding, however did not result in significantly overtopping of the river banks in the Lower River Roding or Newham.
Following the 1947 floods, flood defence structures were put in place in the Lower Lea and Lower Roding designed to prevent a repeat of the consequences. The main flood events to occur in the area since 1947 were witnessed in 1968, 1978, 1983, 1987 and 2000. On these occasions, the worst flooding was restricted to the upper catchment and did not seriously affect Newham, however flooding did occur in 1987 in the vicinity of Jenkins Lane and the A13 around the Waste Transfer Station.
Existing Hydraulic Models - Lower Lea Valley Regene ration Model
The London Development Agency has a linked 1d-2d hydraulic model of the Lower Lea Valley (LLV) Regeneration Area (known as the LLV Regeneration Model) which has been used to inform the flood risk assessments for the Olympic and Legacy facilities planning applications. This computational model is based on the latest available information including channel survey, photogrammetry of the floodplain and valley and Environment Agency hydrological analyses (all 2006). A version of this model has been licensed to Newham for use in this SFRA (Version V2_071) and results from this model are discussed in this chapter of the SFRA and shown in maps in Volume 3 of this report.
It is important to recognise that this model is the ‘baseline’ model before construction of the Olympic and Legacy proposals. The recent and ongoin g changes to the waterways, including construction of additional storage within the Olymp ic Park, will result in changes (most likely reduction) to the flood extents and depths shown on the mapped outputs. Once the LLV Regeneration hydraulic model has been updated, it i s recommended the Newham SFRA is updated to reflect this improved data .
Topographic Information
Surveyed channel cross-sections are used in the LLV Regeneration Model to represent the 1d channel sections. Within the area of the Olympic and Legacy facilities planning application, the channel sections are from survey data obtained on behalf of the LDA in 2006. The remainder of the cross-sections are from older surveyed data as used in the Environment Agency iSIS model of the Lower Lea. The topography of the 2d model area (for out of bank flow) has been based on photogrammetry data commissioned by the LDA and flown in 2006.
The floodplain has been modelled as 2D grids, extending from Hackney in the west to the Royal London Docklands in the east. Two dynamically linked grids define the floodplain; a 15m grid defines the main area of the model and a 30m grid defines the area surrounding the Royal London Docklands. The Royal London Docklands have been included in the modelled area as this location is flooded by an overland flow path. However, the results in this area are not required to a high level of precision.
Model boundaries
The inflow hydrographs used to provide the upstream boundary of the LLV Regeneration Model have been provided from the Environment Agency, from the River Lea: Hydrology and Mapping Study,
12 Dundee University Chronology of British Hydrological Events http://www.dundee.ac.uk/geography/cbhe/
London Borough of Newham SFRA
London Borough of Newham 4-3 May 2010
200613. Inflow hydrographs were provided for the 5%, 1% and 0.1% AEP (annual exceedance probability) flood events and for the 1% AEP flood event with a 20% increase to account for climate change impacts.
The downstream boundary of the LLV Regeneration Model has been represented by a tide curve boundary applied at the confluence of the River Lea and the River Thames. The downstream tide levels have been provided by the Environment Agency for the 5%, 0.5% and 0.1% AEP tidal surge levels.
For the assessment of fluvial flood risk, the 5% AEP tidal surge level has been used as the model downstream boundary for all fluvial events assessed.
Roughness
Manning’s n coefficients have been used in the model to represent the roughness of the proposed open channel and floodplain. Roughness values are a means of representing the effect on the conveyance capacity of vegetative growth, channel and floodplain composition. Since the vegetative growth changes seasonally, it is usual for channel and floodplain roughness to follow such changes. A number of established reference works including Chow (1959), Hicks & Mason (1998) and USGS (2001) give advice on the selection of roughness coefficients for channels and floodplains. These have been used as guidance for the selection of appropriate values.
The values of the Manning’s n coefficient have been chosen to reflect the different channel and floodplain roughness and vegetation conditions along the modelled reaches of the River Lea and associated watercourses. Roughness values for the floodplain have been delimited using Ordnance Survey MasterMap data and the resulting roughness values used in the model can be seen in Table 4.1.
Buildings within the floodplain have not been modelled as raised land, but instead as areas with high roughness values. This assumption was made on the basis that whilst buildings impede flow, they are generally permeable and water would gradually permeate through and be stored in the structure. Therefore by reducing flow rates through these areas by increasing the Manning’s n roughness value, the general flood behaviour has been modelled appropriately.
13 Environment Agency Thames Region, River Lea Hydrology and Mapping, 2006, Halcrow Group Ltd

London Borough of Newham SFRA
London Borough of Newham 4-4 May 2010
Table 4.1 –Roughness Values
Land use Manning’s n Value
Grass 0.04
Building 1.00
General Surface 0.03 – 0.05
Structure 0.10
Inland Water 0.03
Light Woodland/shrubbery 0.075
Dense Trees 0.10
Paths 0.025
Railway 0.04
Road or Track 0.016
Roadside 0.04
Tidal water 0.02
Model Calibration and Verification
It is generally recommended that a hydraulic model is calibrated and verified using at least three flood events. The level of calibration undertaken is limited by the availability of appropriate recorded data.
Since the last large flood event recorded in the Lower Lea Valley in 1947, very few events have been recorded in the Valley. In response to the 1947 event, significant hydraulic modifications were undertaken in the area to reduce the consequences of such an event, including the construction of the LLV Flood Relief Channel and improvement to the flood defences throughout the Lower Lea Valley, significantly changing the hydraulics in the area
The Lower River Lee Flood Risk Management Strategy (EA, 2006) recommends structural and non-structural options for flood management in the region. One option currently being implemented is the upgrade and installation of hydrometric gauging stations within the lower part of the Lea catchment. The data collected by the gauges may provide information that can verify model results, which would be beneficial for future developments within the Lower Lea Valley.
At present, there is insufficient recorded gauged flow and level data of reliable quality to enable calibration of the model. In addition, limited aerial photography of flood extents is available for this region to verify the model results. Therefore, to make the model robust for the prediction of the extent of flooding in the region, the following measures were undertaken:
• Realistic values were used for model parameters such as roughness values and model boundaries;
• Sensitivity testing was conducted on model parameters that were known to have potentially significant hydraulic effects; and
• Model results were analysed to check that the extent of flooding was realistic and comparisons were made between the modelled flood extents, historic flooding and the existing Flood Zone maps.

London Borough of Newham SFRA
London Borough of Newham 4-5 May 2010
Model Sensitivity
The results of a sensitivity analysis give an indication of the level of confidence that can be placed in the water level estimates obtained from a computational hydraulic model. This analysis is important when sufficient data for effective calibration is not available, as is the case for the LLV Regeneration Model.
Sensitivity analysis was undertaken on four model parameters. The parameters that were investigated were:
• Level of Carpenters Road lock gate;
• 2D domain grid size;
• Roughness values (represented in the model by materials files); and
• The type of boundary unit selected for the 1D/2D model interaction.
The level of Carpenters Road Lock gate has been assumed as being at 4.0mAOD as per guidance during the consultation phase of the Flood Risk Assessment for the Olympic and Legacy Planning applications. This is due to the understanding that stop planks, presently in place would be removed in the event of a flood. The planks raise the level of the gate to 4.8mAOD, so the sensitivity of the model to the level of the Carpenters Road lock gate was tested to examine the effect of not removing the planks. It was found that modelling the gate at a level of 4.8mAOD increased the flood levels and extents for the 1% AEP event. For the higher return period events tested, the level of the gate did not have an effect on flood levels or extents as the gate was drowned. This is considered a residual risk.
The sensitivity of the model to grid size was determined by reducing the grid size in the 15m domain to 5m. The results of this test showed that the differences between the flood extents and water levels were marginal for the flood events examined. The minor differences in flood extents can be explained by the outline being more detailed as the grid size decreased, but the overall outline remained very similar. This is to be expected, as larger grid sizes will tend to average out small changes in elevation and if the cell becomes ‘wet’, the outline will automatically increase over what would be seen with a smaller grid size. As such, the grid cell size of 15m was considered appropriate in the LLV Regeneration model.
Sensitivity to roughness values was examined by refining the roughness areas and values used around Dagenham Brook in the north eastern section of this model. Altering this particular area of the model was considered appropriate as significant overland flow is known to occur in this area. The results of the sensitivity testing of roughness values showed that there were negligible differences in flood extents and maximum differences of ± 0.1m to the water level.
The sensitivity of the model to the schematisation of the 1D/2D boundary was also investigated by examining the difference between using HX lines and SX points to define the boundary. HX lines are water level boundaries which provide a water level from the 1d node to the 2d model domain every half time step. Flow is returned to the 1d node, from the 2d model, every half time step. HX lines are typically used at channel banks to represent the boundary between the 1d network and 2d domain of the model. SX points are typically used for 1d features (such as culverts) embedded within the 2d domain. SX points are a source of flow into or out of the 2d model. These analyses showed that the flood extents and water levels were generally greater when HX lines were used to define the 1D/2D boundary. This is due to greater connectivity between the 1D network and 2D domain due to the higher number of cells into which water can flow from the 1D network compared to the use of discrete SX cells. HX lines were used to define the 1D/2D boundary in the LLV Regeneration model.
The TUFLOW model of the Lower Lea Valley has been continually updated since its inception in 2004 so that best available data is used at each point in time. During this process it has been found the model extents are most sensitive to small changes in water elevation within the 1D network when the
London Borough of Newham SFRA
London Borough of Newham 4-6 May 2010
representation of certain structures within the model have been updated. Therefore it is considered that a key driver of water levels, and therefore model sensitivity, is the representation of structures.
Existing Hydraulic Models - Lower Roding TUFLOW Mod el
The EA has a linked 1d-2d hydraulic model of the Lower River Roding (known as the Lower Roding TUFLOW Model) which was originally developed to inform the flood risk assessment for the Barking Town Centre Development Framework by LTGDC, and has subsequently passed to the Environment Agency. As part of the SFRA this model has been extended north to the Redbridge Gauging Station to include potential fluvial flood risk to Newham further upstream. This computational model is based on the latest available information including channel survey, LiDAR and survey of the floodplain, and Environment Agency hydrological analyses. A version of this model has been licensed to Newham for use in this SFRA (Version V032) and results from this model are discussed in this chapter of the SFRA and shown in maps in Volume 3 of this report.
Topographic Information
Surveyed channel cross-sections are used in the Lower Roding TUFLOW Model to represent the 1d channel sections. The cross-sections are from surveyed data undertaken in 1987 and as used in the Environment Agency iSIS model of the Lower Roding. During on site verification some of the channel cross sections were suspected of being constructed after 1987. Additional crest level survey was commissioned by LTGDC in October 2007 between the A13 and rail bridge south of Little Ilford Park (NGR 543581, 184783), and included in the Lower Roding TUFLOW Model. The EA have also provided information regarding the raising of defences in the vicinity of New England Estates in Barking and Dagenham. Construction drawings show a defence crest level of approximately 6.2mAOD, whereas 1987 survey indicates a defence crest level of 5.2mAOD.
The topography of the 2d model area (for out of bank flow) has been based on LiDAR data commissioned by the EA and flown in 2007. The floodplain has been modelled as 2D grids, extending from East Ham in the west to Rainham in the east. Two dynamically linked grids define the floodplain; a 5m grid defines the main area of the model and a 15m grid defines the Dagenham floodplain area. The Dagenham area has been included in the model as this location is flooded should the Barking Barrier fail to operate during an extreme tidal event. However, the results in this area are not required to a high level of precision.
Model boundaries
The inflow hydrographs used to provide the upstream boundary of the Lower Roding TUFLOW Model have been provided from the Environment Agency, from the River Roding: Hydrology and Mapping Study, 200614. Inflow hydrographs were provided for the 5%, 1% and 0.1% AEP (annual exceedance probability) flood events and for the 1% AEP flood event with a 20% increase to account for climate change impacts.
The downstream boundary of the Lower Roding TUFLOW model has been represented by a tide curve boundary applied at the confluence of the River Roding and the River Thames. The downstream tide levels have been provided by the Environment Agency for the 5%, 0.5% and 0.1% AEP tidal surge levels.
As with the LLV Regeneration Model, this assessment of fluvial flood risk uses the 5% AEP tidal surge level as the model downstream boundary for all fluvial events assessed.
Roughness
Manning’s n coefficients applied to this model are the same as those discussed above for the LLV Regeneration Model.
14 Environment Agency Thames Region, River Lea Hydrology and Mapping, 2006, Halcrow Group Ltd

London Borough of Newham SFRA
London Borough of Newham 4-7 May 2010
Model Calibration and Verification
The Environment Agency have previously carried out calibration of the Thames model (on which the Lower River Roding iSIS model is based) in 2004. The report accompanying this calibration states that the model was calibrated for all type of flow and tidal conditions, also including flood warning and barrier closure events. The Lower River Roding iSIS model was not further calibrated as stated in the hydraulic modelling report for the River Roding Flood Risk Management Strategy. The report advises that only small changes were made to the model and calibration was unnecessary due to the work done by the EA in 2004.
The results of the Lower Roding TUFLOW model have been compared to the Lower River Roding ISIS model (LR_Org_fluvial.DAT). The results of this analysis show that the TUFLOW model has higher maximum water levels than that produced by the Lower River Roding iSIS model. Examination of the boundary conditions has revealed that the iSIS model utilises a set water level of 0.2mAOD as its downstream tidal boundary. Therefore, this model only shows the fluvial influence in the area and does not take into account the combination of fluvial and tidal events as in the Lower Roding Tuflow model. The Tuflow model uses a tidal curve as its downstream boundary with a peak level of 5.41mAOD for the 5% annual probability tidal event. This is considered a reasonable combined probability scenario, in agreement with the Environment Agency. For this reason, it is to be expected that results of the Lower Roding Tuflow model would exhibit higher maximum water levels.
The results of the Lower Roding Tuflow model were also compared to the results of the Lower River Roding iSIS model for the combined probability scenarios as detailed in Appendix B of the hydraulic modelling report for the River Roding Flood Risk Management Strategy. The Lower Roding Tuflow model showed higher maximum water levels. The combined probability scenarios modelled assume a flap valve at the location of the Barking Barrier. This scenario assumes that fluvial waters are permitted to flow into the River Thames, however flow from the Thames is not permitted to flow back up into the River Roding. The Barrier is closed when water levels in the Thames exceed those in the Roding, thereby protecting the site during a high tide. When the Barrier is closed, some flood waters are stored behind the barrier consequently explaining why the results for this scenario are higher than for the “fluvial only” case. The results for the Lower Roding Tuflow model assumes the Barking Barrier as open for the duration of the model simulation. Therefore the site is not protected during a high tide, and thus maximum water levels are higher in this case than for the Lower River Roding iSIS model combined probability scenarios. This scenario was agreed with the Environment Agency to maintain a precautionary approach to assessing flood risk.
Model Sensitivity
Sensitivity analysis was undertaken on four model parameters in the Lower Roding Tuflow Model. The results were compared with the results for a 1% annual probability fluvial event combined with a 5% annual probability tidal event. The parameters that were investigated were:
• 2D domain grid size; • Roughness values (represented in the model by materials files); • hydrological inflows; • downstream tidal boundary.
The sensitivity of the model to grid size was determined by comparing the results of a two domain, 5m and 15m grid sized model to a single domain, 15m grid sized model. The results of this test showed that there were differences between the flood extents. The single domain model showed a larger extent and higher water levels most noticeably at the edges of the flood extent. These differences can be attributed to the loss of detail in the model when using a larger grid size. Close examination showed the smaller grid size was able to pick up small changes in elevation such as ridges or troughs thereby altering the flow mechanism. A larger grid size will tend to average out the ground elevation thereby resulting in a smoother surface allowing the flood waters to potentially extend further. Additionally, once a cell is calculated as being “wet” a cell size of 15m will display a larger area as “wet” compared to a model with a grid size of 5m.

London Borough of Newham SFRA
London Borough of Newham 4-8 May 2010
Even though there are noticeable differences between the smaller and larger grid sized models, the method adopted of modelling with a smaller grid is appropriate. The smaller grid size is more accurate and appropriate for the purpose of this FRA. It is not necessary to model the floodplain to the east of Newham using a smaller grid size as precise results in this region are beyond the scope of this project.
Sensitivity to roughness values was examined by altering the roughness values used in the channel sections of the River Roding and the floodplains to the east and west of the watercourse. The results of the sensitivity testing of roughness values showed that there were negligible differences in flood extents and maximum differences of ± 0.1m to the water level.
Sensitivity to changes in the hydrological inflows was examined by increasing and decreasing the inflows by 20%. The results showed that there were minor differences in flood extents and water depths across Newham.
Sensitivity to changes in the downstream tidal boundary were examined by an increase and decrease of 20% in peak tide level. The results showed changes to water levels downstream of the Barking Barrage to the confluence of the River Roding with the Thames. From examination of the results, it can be seen that this stretch of the watercourse is tidally influenced. The Barking Barrage diminishes this influence on water levels upstream.
Detailed assessments
The detailed assessment of fluvial flood risk described in this chapter is based on the results from version V2_071 of the LLV Regeneration Model and version V032 of the Lower Roding TUFLOW Model. The outputs from this model are used to assess fluvial flood risk in Newham.
Topographic data
The topographical information used in the LLV Regeneration model version V2_071 and Lower Roding TUFLOW Model version V032 is considered the best currently available information as of November 2009. The LLV Regeneration Model includes surveyed channel sections and photogrammetry from 2006 as well as LiDAR data of the Borough flown in 2003. The Lower Roding TUFLOW Model uses surveyed channel section and LiDAR data of the Borough flown in 2007. The coverage of each data source is discussed in Table 1.1 (see also Table 6-1 in Volume 1 of the SFRA).
4.3 Methods for assessing flooding from rivers
A three staged approach has been used to assess the risk of fluvial flooding in Newham. This approach used existing data from the Environment Agency to undertake a broadscale assessment of risk using Flood Zones. More detailed assessments of the actual and residual risk of flooding with defences in place were then undertaken using the outputs from the two models described above.
Flood Zones
Fluvial flood zones show the extent of flooding that would be expected from a flood event in the Lower Lea or Lower Roding for an undefended scenario. This assessment considers Flood Zones 1, 2 and 3 (see Table 4.2) and has assumed that the extent of Functional Floodplain is limited to the actual river channel (as defined by the river bank and existing flood defences) within Newham. The PPS 25 definition of Functional Floodplain is
“land where water has to flow or be stored in times of flood15.”
In consultation with the Environment Agency, it has been agreed that there are no areas within Newham which would be classified as Functional Floodplain outside of the river channel.
15 Table D1, PPS25: Development and Flood Risk, DCLG, December 2006.

London Borough of Newham SFRA
London Borough of Newham 4-9 May 2010
Table 4.2 Definition of fluvial flood zones (Table D 1, PPS 25)
Flood Zone Definition
Flood Zone 1 – Low probability of fluvial flooding
Land assessed as having a less than 1 in 1000 annual probability of river flooding in any year (<0.1%)
Flood Zone 2 – Medium probability of fluvial flooding
Land assessed as having between a 1 in 100 and a 1 in 1000 annual probability of river flooding in any year (1% to 0.1%)
Flood Zone 3 – High probability of fluvial flooding
Land assessed as having a 1 in 100 or greater annual probability of river flooding in any year (>1%)
The fluvial Flood Zones for the Lower Lea and Lower Roding are shown in Figure 4.1 (Volume 3). These Flood Zones have been provided by the Environment Agency for use in this assessment. These Flood Zones should be used in the application of the Sequential Test, further information on the application of this test is provided in Volume 1 of this SFRA.
Actual Risk
A substantial area of Newham lies within Flood Zones 2 and 3 and a more detailed assessment of the flood hazard in these areas has been undertaken for a situation with the defences in place. The actual risk of flooding is typically assessed for a defended scenario for flood events with a 5% and 1% AEP. This provides a more realistic estimate of likely flooding than that provided by the Flood Zones. The actual risk of fluvial flooding in Newham has been assessed using outputs from the LLV Regeneration Model and Lower Roding TUFLOW Model, which have been run for 5% and 1% AEP flood events (combined with a 5% AEP tidal surge as the downstream boundary). The flood risk has been assessed with all existing defences, including the Thames Barrier, included in the modelling. The flood hazard maps produced (Figures 4.2 to 4.3) can be used to provide further detail on the actual risk of flooding and the degree of hazard within the Flood Zones. After undertaking the Sequential Test, this information on the actual risk of flooding can be used to inform the application of the Exception Test, where necessary.
Residual Risk
The residual risk of extreme events greater than that for which defences have been designed has been considered as the third step of this SFRA. The residual risk assessment has assumed two different scenarios:
1. The existing defences including the Thames Barrier are in place and operational at the time of a flood. The residual risk of flooding caused by the overtopping of defences in an extreme flood event in the Lower Lea and Lower Roding has been considered. An additional modelling scenario was assessed using a defended scenario (the same as for the assessment of actual risk) for the 0.1% AEP flood event (combined with a 5% AEP tidal surge as the downstream boundary). The flood hazard map for this scenario is shown in Figure 4.6
2. The Thames Barrier is operational at the time of fluvial flood, however a breach occurs in the defences on either the River Lea or the River Roding. A breach can occur at any location, therefore a precautionary approach has been following in establishing the potential residual risk during a 1% AEP flood event with allowance for climate change (combined with a 5% AEP tidal surge in 2107 at the downstream boundary). The methodology is described below. The flood extent and depth for this scenario is show on Figure 4.7.
This information can be used to provide further information required if applying the Exception Test.

London Borough of Newham SFRA
London Borough of Newham 4-10 May 2010
Fluvial Residual Risk – Breach Capture
The extensive lengths of raised defences and interconnected watercourses in Newham, particularly on the River Lea, mean a significant number of breach scenarios would need to be modelled to understand the area of Newham that may be within a breach hazard area during the design fluvial flood event (1% AEP fluvial event with allowance for climate change combined with a 20% AEP tidal boundary on the River Thames). There is also the potential that this approach may result in development allocated in areas at potentially high residual risk due to a data gap. In order to more comprehensively capture the potential extent and depth of flooding should a breach occur an alternative, precautionary approach has been adopted in consultation with the Environment Agency. The methodology adopted involves:
• Transposing river levels along the channel of the River Lea and River Roding perpendicular across the floodplain and subtracting the digital terrain model from the water level (effectively ignoring the presence of defences). In areas of the River Lea where areas are defined by topography, or other watercourses, levels have been applied to regions based on the maximum water level in the adjacent watercourses.
• Levels transposed across the floodplain were selected based on an approximate 200-300mm change in water level along the river channel, or at significant changes in level (e.g. at structures), then interpolated between sections. This flood extent is expected to capture potential breach scenario flood extents along either watercourse during the design fluvial flood event.
• The raised Northern Outfall Sewer provides a defined boundary between the River Roding and River Lea floodplains and where necessary this has been used to limit the extent of flooding.
• In order to provide clear differentiation between fluvial and tidal flooding, high water levels in the River Thames have been ignored.
Figure 4A below provides an example of how this methodology has been applied using ‘regions’ and cross section on the River Lea and Figure 4B an example of how this has been applied using ‘cross sections’ along the River Roding.
Figure 4A – Residual Fluvial Risk – Breach Capture: River Lea

London Borough of Newham SFRA
London Borough of Newham 4-11 May 2010
Figure 4B – Residual Fluvial Risk – Breach Capture: River Roding
This method differs from Flood Zone Mapping, which also ignores the presence of defences, by using river levels based on a constrained river channel (i.e. potentially higher water levels caused by flood defences), as well as considering the effects of climate change in accordance with PPS 25.
The outputs are flood extent and depth, however this method does not provide velocity or flood hazard. This provides a useful guide to understand the potential risk of fluvial breach across Newham and guide where more detailed breach analysis may be required.
A similar exercise has been undertaken to assess the potential ‘worst case’ breach during an extreme tidal event. This is discussed in Chapter 5.
4.4 Climate Change
The latest government guidance for climate change and flood risk is contained within FCDPAG3 Economic Appraisal: Supplementary Note to Operating Authorities – Climate Change Impacts October 2006. The note was issued in November 2006 and informs appraisers and decision makers of new climate change allowances and broadly how these should be considered when assessing flood risk. Defra expects this note to be applied to all future appraisals, strategies and management plans that have started after November 2006. Further guidance (UKCP09) was issued in June 2009, however, this latest information has not been used in this assessment.
The guidance is referred to in PPS25 Annex B where it states that '…the most up to date guidance on climate change…should be considered in the preparation of Regional Flood Risk Assessments, Strategic Flood Risk Assessments…'.
The latest guidance recommends a 20% increase in flows is used to assess the impacts of climate change on rivers for time horizons between 2025 and 2115. Climate change has been investigated to provide more detailed information upon which to make land use planning decisions. It will be up to the decision-maker to select the most appropriate time horizon for the specific land use they are investigating.

London Borough of Newham SFRA
London Borough of Newham 4-12 May 2010
The location of the River Lea and River Roding upstream and downstream of the Thames Barrier results in a marked difference in the effects of climate change on flooding in Newham. Because the Thames at Newham is tidal, the ability of both the River Lea and River Roding to discharge fluvial flows is effected by how high the tide is. As climate change increases sea levels, water levels in the Thames will be higher. However, as noted in Section 3.4 and 5.4, advice from the Environment Agency is that the Thames Barrier will actually close more frequently as the effects of climate change are realised, meaning peak levels during extreme events are actually lower upstream of the Barrier.
The Thames River upstream of the Thames Barrier provides a large storage basin for the River Lea to discharge into during large fluvial events. The River Roding does not benefit from a downstream storage basin. The Barking Barrier is located at the mouth of the river and is either closed, preventing fluvial flooding discharging into the Thames; or open, meaning there is a raised water level in the Thames and less fluvial water is able to discharge from the River Roding.
The actual operation of the Barking Barrier will be more complex than this, however the current limitations in modelling how the Barking Barrier may actually operate in the future means some assumptions must be made in the modelling. To demonstrate compliance with PPS 25, these assumptions should be precautionary and in agreement with the Environment Agency.
To assess the actual risk of flooding, including the effects of climate change, the Barking Barrier has been assessed as open for the duration of the fluvial flood event. The Environment Agency considered the ‘Barrier open’ scenario was a better representation of the actual operation during a large fluvial event than the ‘Barrier closed’ scenario, which meant no discharge into the Thames for the duration of the event and considered overly conservative.
The defended flood extents for a 1% AEP flood event adjusted for climate change are shown in Figures 4.2 and 4.6 (Volume 3).
4.5 Flood Hazard
The PPS 25 Practice Guide states that flood hazard should be considered taking account of the presence of flood risk management measures such as defences. The catchments of the Lower Lea Valley and Lower Roding, including Newham are defended from fluvial flooding by a system of defences. The predicted results from the above scenarios have been classified into areas of low, moderate, significant and extreme hazard based upon an empirical measure of velocity and depth. The assessment of Flood Hazard shown in Figures 4.3, 4.4, 4.5 and 4.6 is based on the methodology provided in the Defra/Environment Agency Flood Risks to People report16.
The following flood hazard formula (developed through the Flood Risks to People project) has been used in this assessment to quantify the flood hazard to people, vehicles and property;
Flood Hazard Rating (HR) = d x (v +0.5) + DF
where, d = depth of flooding (m)
v = velocity of floodwaters (m/s)
DF is a debris factor based on the land cover in the area which reflects the likelihood of floodwaters carrying debris and leading to a significantly greater flood hazard. In urban areas, the debris factor is 0 for flood depths less than 0.25m and 1 for flood depths greater than 0.25m (or velocities greater than 2m/s).
The basis of hazard rating classification is outlined below in Table 4.3.
16 Defra / Environment Agency Flood and Coastal Defence R&D Programme. R&D Outputs: Flood Risks to People. Phase 2. FD2321/TR1 The Flood Risks to People Methodology, March 2006.

London Borough of Newham SFRA
London Borough of Newham 4-13 May 2010
Table 4.3 Flood Hazard to people: Definitions
Degree of Flood Hazard
Hazard Rating (HR) Description
Low <0.75 Caution Flood [zone] with shallow flowing water or deep standing water
Moderate 0.75 – 1.25 Dangerous for some (i.e. children)
Danger: Flood [zone] with deep or fast flowing water
Significant 1.25 -2.5 Dangerous for most people
Danger: Flood [zone] with deep fast flowing water
Extreme >2.5 Dangerous for all Extreme danger: Flood [zone] with deep fast flowing water
Source: DEFRA R&D Outputs: Flood Risk to People Phase 2 Draft FD2321/TR1
The hazard maps produced for the actual and residual risk scenarios in this assessment should be used by the Strategic Planners in Newham to provide further detail on the level of risk from fluvial flooding within the Flood Zones.
4.6 Results
Historical flooding
The London Borough of Newham has been affected by flooding in the past noticeably by the events of 1947 and 1987, the flood extents for which are shown within Figure 1.4.
The worst of these floods occurred in March 1947 and resulted in the flooding of areas in the west of Newham, principally around Stratford but also affected the areas of Silvertown. As recorded within the publication ‘The official story of the great floods of 1947 and their sequel HMSO’17, "The flood of the Lea, of which records have been kept continuously for a hundred years, was greater than ever previously noted". The inundated area covers large infrastructure routes such as rail routes through Canning Town station and the adjacent section of the A13. It also covers a large section of the A11 and a small section of the A12 near Stratford. Most significantly the flood extent appears to include the London International Freight Terminal at Stratford. In this event, flooding from the Lower Lea was also significant in the neighbouring London Boroughs of Hackney, Tower Hamlets and Waltham Forest.
As described in Chapter 3 of this assessment, the fluvial and tidal defences in the Lower Lea Valley have been significantly improved since the 1947 event and such extensive flooding is considered less likely if an event of similar magnitude were to occur today.
Flood Zones
The Flood Zones shown in Figure 4.1 demonstrate that there are areas of Newham at risk of fluvial flooding from the Lower Lea and Lower Roding. The area of the Borough within fluvial Flood Zones 2 and 3 is extensive, covering most of Canning Town, and the Royal Docks, as well as the Lower Lea Valley.
17 British Hydrological Society’s hydrochronology database

London Borough of Newham SFRA
London Borough of Newham 4-14 May 2010
Fluvial flooding without defences across the borough is predominantly from the River Lea. EA Flood Zones extend through Stratford, Plaistow and covering most of the low-lying land in Canning Town, Custom House and Beckton – large areas of housing, and the A12, a key transport route in the area.
The fluvial Flood Zones from the River Roding are smaller by comparison, however still covers a large area of land adjacent to the river in Little Ilford and East Ham. The majority of this area is at high probability of flooding (Flood Zone 3). Existing development is predominantly housing, however flooding does occur on and around the A406 – a major transport route in the area.
For the purposes of applying the Sequential Test, combined fluvial and tidal flood zones for the Borough should be used.
Actual risk of flooding
The actual risk of flooding caused by overtopping of the defences during a fluvial flood event on the Lower Lea is reduced compared to the extent of flooding shown in the Flood Zones.
Figures 4.2 to 4.5 in the mapping volume of this SFRA show the extent and predicted hazard of fluvial flooding in Newham in the 5% and 1% AEP flood events on the Lower Lea. The actual risk of fluvial flooding has been modelled using the LLV Regeneration Model and Lower Roding Tuflow Model with all defences in place. Newham is not at risk from the 5% AEP event, however there is extensive out of bank flooding originating from both the Lower River Lea and Lower Roding in the 1% AEP event.
Actual risk of flooding from the River Lea
Fluvial flooding in Newham from the River Lea originates from two sources to the north that interact to create an ‘overland flowpath’ that flows through the borough, flooding large areas during the 1% AEP event.
Floodwater overtops the River Lea Flood Relief Channel just south of Low Hall Recreational Ground in the London Borough of Waltham Forest. Floodwaters flow in an easterly and southerly direction, combining with flows in the Dagenham Brook, a tributary of the River Lea. The Dagenham Brook overtops its banks as it becomes culverted near New Spitalfields Market, and combined with flow from the River Lea Flood Relief Channel to the north creates the ‘overland flowpath’ flood mechanism. The overland flowpath generally flows in a southerly direction, towards the historic floodplain of the River Lea and Thames confluence, however the actual route is restricted by infrastructure, artificially raised ground and urban growth through Newham. During the 1% AEP event, floodwaters on the overland flowpath enter Newham along the mainline railway, pass (essential infrastructure) through Stratford City and over the Stratford Box, before flooding parts of the proposed Olympic and Legacy development. Floodwaters continue south along the road network and railway, flooding residential and commercial areas of Stratford and Plaistow.
The overland flowpath is a significant flood mechanism within the Lower Lea Valley, the extent of flooding along the overland flowpath is directly related to the magnitude and duration of the storm event in the Lower Lea Valley. Subtle changes to ground level or capacity along the flowpath can potentially having significant effects on the extent and depth of flooding elsewhere. The predicted flood depths and velocities along the route mean that the risk to people is considered to be moderate to significant.
The recent and proposed changes in the Lower Lea Valley through the Olympic Park are expected to result in changes to the flood mechanisms on the ‘overland flowpath’ – including an overall reduction in flood risk. The final proposals are not currently available to inform the SFRA. Future revisions of the SFRA should consider including update model outputs when they become available.
Actual risk of Flooding from the River Roding

London Borough of Newham SFRA
London Borough of Newham 4-15 May 2010
Fluvial flooding in Newham from the River Roding is relatively limited during the 1% AEP event. Some flooding does occur around Reynolds Avenue and Millias Avenue in Little Ilford as a result of a lower areas of the river bank however flooding is generally limited to open space and allotments. Fluvial flooding also occurs south of the mainline railway – flooding parts of the London Borough of Barking and Dagenham in the Hertford Road Industrial Estate, but also passing into Newham and flooding areas of the Stevenage Road sports ground. The risk to Newham residents from this flooding is considered low to moderate in the 1% AEP event.
As the Lower River Roding approaches the Thames the 1% AEP event generally remains within bank, with areas of out of bank flooding limited to Barking and Dagenham.
Residual risk of flooding
To assess the residual risk of flooding in Newham from an extreme fluvial flood event on the River Lea and River Roding, two scenarios have been considered:
The 0.1% AEP flood event has been considered and the predicted flood hazard in this event is shown in Figure 4.6 (Volume 3).
In an extreme event such as this, more floodwater is passing along the ‘overland flowpath’ originating from the River Lea, extending flooding in Newham beyond the A13 and into the low ground in Canning Town. Flood hazard to people in this residual risk event is generally moderate to significant. There is some additional overtopping of flood defences along the Waterworks River.
Similar to the Lower River Lea catchment, flooding on the River Roding generally flows in a southerly direction developing into an ‘overland flowpath’ that follows the historic floodplain, albeit restricted by existing infrastructure, artificially raised ground and urban growth. Flooding through the Hertford Road Industrial Estate in Barking and Dagenham extends into Newham, inundating the Stevenage Road sports ground before flooding south through existing residential areas and inundating Lady Trower Trust Playing Fields and the Wallend Recreational Ground. Floodwaters flow as far south as Langdon Secondary School playing fields. Flood hazard to people in this residual risk event is generally moderate to significant in existing residential areas.
The 1% AEP flood event including climate change allowance, assuming flood defence failure on the River Lea or River Roding shown on Figure 4.7 (Volume 3).
Should a breach occur in the defences on the River Lea in the Stratford area there are low lying areas that may be inundated. In many cases the areas of low ground are isolated by watercourses or defences, therefore flooding is likely to be relatively restricted.
Similar to the 0.1% AEP flood event, further south in the Lea Valley, around Canning Town, there is the potential that a breach could result in more extensive flooding due to the low lying nature of land behind the defences. This could extend as far as Custom House and parts of Beckton, with potential flood depths of 4-5m, however it is likely that more detailed site specific breach analyses will reduce these depths.
A similar effect is possible on the River Roding, with the low lying ground near the A13 particularly susceptiable, however flooding has the potential to extend into East Ham as well as effecting the Beckton Sewage Treatment Works. The Northern Outfall Sewer acts as an artificial boundary to fluvial flooding between the River Lea and River Roding.
Climate change
Flooding mechanisms resulting from increased river flows in the River Lea are similar to those described under Actual risk and Residual risk. Flooding extends through the residential and commercial areas of Stratford and Plaistow as far as Canning Town, however not as far as during the 0.1% AEP event. Flood hazards to people are generally moderate to significant.

London Borough of Newham SFRA
London Borough of Newham 4-16 May 2010
On the Lower River Roding there is further overtopping of defences that contributes to the Lower Roding overland flowpath and results in additional flooding in Newham over the A13 and as far as the Northern Outfall Sewer, which acts as an informal flood defence. The effects of climate change on tidal levels in the Thames downstream of the Thames Barrier mean flooding during the 1% AEP plus climate change event is actually greater than during the 0.1% AEP event (present day tide levels).
4.7 Uncertainty in flood risk assessment
The assessment of fluvial flood risk in Newham has been based on outputs from the LLV Regeneration Model and Lower Roding TUFLOW Model. As with any hydraulic model, these models have been based on a number of assumptions which may introduce uncertainties into the assessment of risk. The assumptions within the models should be noted and understood such that informed decisions can be made when using model results.
The key assumptions and associated constraints to the LLV Regeneration model include:
• Cross sections in the model, with the exception of those in Dagenham Brook, are sourced from Masons 2006 survey;
• Cross sections defining Dagenham Brook are sourced from the older EA Section 105 ISIS model;
• Defence and bank crest levels have been sourced from Masons crest level survey, cross section survey and photogrammetry (2006);
• Structure details have been sourced from the Masons Structures survey, October 2006 with some updates provided from the Olympic and Legacy Facilities FRA Technical Group in October 2006. Structures along Dagenham Brook have been sourced from the Section 105 ISIS model;
• Photogrammetry is generally accurate to ±0.10m, however in urban areas, the accuracy can be lower due to the high degree of filtering that is required to remove structures;
• The hydrology used in the model was developed for the Environment Agency by Halcrow in 2006 and provided to CSL in December, 2006;
• The surface water inflows from the EA ISIS model of the Lower Lea have been incorporated into the TUFLOW model. The surface water inflows make up approximately 5% of the overall flow and do not significantly affect flood levels and extents; and
• The tidal boundary levels were supplied by the Environment Agency to Capita Symonds in October 2006 and these levels are assumed to be correct for the various return periods.
The key assumptions and associated constraints to the Lower Roding TUFLOW Model include:
• Cross sections are sourced from the EA Lower River Roding ISIS model (1999);
• Structure losses have been sourced from the EA Lower River Roding ISIS model and structure details have been sourced from the survey carried out in 1987;
• Defence and bank crest levels between the railway crossing to the north and A13 to the south are based on survey undertaken by EDL Surveys in October 2007. Bank and defences crest levels in the remaining areas of the model have been sourced from the survey carried out in 1987;

London Borough of Newham SFRA
London Borough of Newham 4-17 May 2010
• LiDAR is generally accurate to ±0.25m, however in urban areas, the accuracy can be lower due to the high degree of filtering that is required to remove structures;
• The hydrology used in the model was developed by Halcrow in 2006 and provided to CSL in May 2007 as part of the EA Lower River Roding ISIS model;
• The tidal boundary levels have been supplied by the Environment Agency and these levels are assumed to be correct for the various return periods;
• The tidal defences located at the downstream end of the model have a crest level of 7.2mAOD such that they will not overtop for all scenarios considered for this project;
• During a Barrier closed scenario, the crest level of the Barrier is assumed to be 7.2mAOD such that fluvial waters are not able to overtop the Barrier.
• The floodplain to the east of Newham has been included within the Lower Roding TUFLOW model in order to demonstrate flood extents and depths in Newham are not affected by limitations on flood storage. It should be noted that the Beam River and Gores Brook are located within the model extent. Flow within the two rivers has not been considered within the Lower Roding TUFLOW model as it was assessed as unlikely to have a material impact on extents and levels in Newham. Flood extents and levels from the Lower Roding TUFLOW model should not be used to assess flood risk in this area without considering the Beam River and Gores Brook.
In addition to the modelling assumptions above, the key assumptions and associated constraints with the Fluvial Residual Risk – Breach Capture methodology include:
• Flood levels in the channel remain at the same height across the floodplain and the effect flow over the floodplain has on water levels is not taken into consideration.
• The highest flood level is perpendicular to the watercourse.
• All land below the transposed flood level is at risk of flooding.
• Defences would not be repaired within the indicative timeframes currently adopted for breach modelling (i.e. 18 hours for hard defences and 30 hours for embankments).
• Flood defences could fail at any location, regardless of condition.
The limits of the modelling include:
• The proposed topographic and river channel works in the LLV through the Olympic Park are not currently available in this version of the LLV Regeneration hydraulic model;
• The flood extents shown in this SFRA do not show localised flooding resulting from intense rainfall and where surface flow might exceed the capacity of the drainage system. This has been assessed separately (refer Chapter 6);
• The LLV Regeneration model used to inform this assessment (version V2_071) does not contain details of the water control structure currently being constructed by British Waterways on the Prescott Channel and Three Mills River. This structure is designed to exclude tidal influences and to maintain a depth of water for navigation upstream of here. The structure is not yet complete and will not be included in the hydraulic model until fully operational. Details of the proposed operational rules of the structure are not yet available and would be required in order to provide a realistic representation of the structure in the model. It is likely that the structure will have impacts on flood levels and velocities in the Lower Lea Valley. Therefore

London Borough of Newham SFRA
London Borough of Newham 4-18 May 2010
when the structure is fully operational, it should be included in the model and the assessment in this chapter of the SFRA will need revision to take account of its impacts;
• This study has assessed flood risk along the River Lea, River Roding and associated main watercourses within the study reaches. Flooding may occur along other minor tributaries of the River Lea or Roding that have not been included in the study;
• With the exception of the Beckton Sewage outfall, surface water inflows within the modelled areas have not been included. These are considered small in comparison to the total volume of water entering the river systems from upstream;
• The downstream extent of the River Lea and River Roding may be sensitive to elevated water levels in the River Thames and the effect of the Thames Barrier/Barking Barrier operating conditions;
• The risk of blockage in other structures throughout the model area may affect flood levels and extents;
• Data available for calibration of the model used to estimate flood levels and extents is limited and there is therefore some uncertainty regarding the absolute accuracy of the model results. The model results should therefore be used with caution and reference made to the results of the sensitivity analysis when quoting estimated flood levels; and
• Due to the large extent of the combined 2D domains, the complexity of the watercourses and the prevalence of short sections within the 1D network, the LLV Regeneration model is prone to sensitivity that require the results from the model to be used with care.
• The water levels and depths in the Fluvial Residual Risk – Breach Capture method described on Figure 4.7 should not be used in development design remote from the river frontage, as this method does not take into account obstructions in the floodplain that will slow the flow of water and reduce flood depth and is expected to over-estimate the actual level of risk.
Taking these uncertainties and constraints into consideration, the estimation of risk of flooding from rivers presented in this report is considered robust for the level of assessment required in the SFRA.
4.8 Managing flooding from rivers
Flooding from rivers can be managed in a number of ways, including:
• Avoidance - developing outside of the floodplain.
• Prevention - walls and embankments used to exclude water from a site, improved channel conveyance, pumping or flood storage areas used to attenuate/retain peak flood flows upstream.
• Management - flood resilient design, flood warning, evacuation and emergency planning, and flood awareness.
The most suitable type of flood management for a site depends on site specific conditions, the receptor of flooding and the type of flooding. Currently fluvial flooding in Newham is prevented by the existing defences on the Lower Lea and the Lower Roding. The preferred strategies in the respective Flood Risk Management Strategies18 indicate defences will be maintained in the future.
18 River Roding Flood Risk Management Strategy, Environment Agency, March 2006 Lower River Lee Flood Risk Management Strategy, Environment Agency, 2006

London Borough of Newham SFRA
London Borough of Newham 4-19 May 2010
It is possible that ‘strategic flood risk interventions’ (e.g. improving the existing standard of defences) on both the Lower River Lea and Lower Roding may reduce existing flood risk in Newham. On the River Lea reducing out of bank flooding from both the River Lea Flood Relief Channel and Dagenham Brook would require works within the London Borough of Waltham Forest. On the River Roding improvement works would be required in the London Borough of Barking and Dagenham. As these interventions are probably out of the control of Newham managing flood risk in the borough is most achievable through planning controls.
There is an opportunity for London boroughs bordering both the Lower Lea Valley and Lower Roding to work together using regeneration to deliver measures that reduce the existing and future risk of flooding.
The Environment Agency is currently reviewing its assets and developing System Asset Management Plans (SAMPs). These will identify and provide information on existing assets, and help to decide where investment is most needed.
CFMPs provide a large-scale assessment of the risks associated with river flooding. They present a policy framework to address the risks to people and the developed, historic and natural environment in a sustainable manner. In doing so, a CFMP is a high-level document that forms an important part of the Department for Environment, Food and Rural Affairs (Defra) strategy for flood and coastal defence.
CFMPs provide the management plan for the next 100 years and the policies required for it to be implemented. This is intended for general readership and is the main tool for communicating intentions. Whilst the justification for decisions is presented, it does not provide all of the information behind the recommendations, this being contained in the supporting documents. Key messages from the Thames CFMP relevant to Newham (provided by the EA) are discussed in Chapter 9 of this Volume and shown in full in Appendix C of Volume 1 of the SFRA.
4.9 Planning considerations
PPS 25 requires that decision makers use the SFRA to inform their knowledge of flooding, refine the information on the Flood Map and determine the variations in flood risk from all sources of flooding across and from their area. These should form the basis for preparing appropriate policies for flood risk management for these areas.
Flooding from rivers is one of the most destructive forms of flooding in England and Wales. As such, areas liable to flood are usually more refined than other sources. A large amount of information can be obtained from local authority or Environment Agency staff, and/or National datasets, such as the Environment Agency Flood Zones. Any potential land use planning decisions should be made after consulting these sources.
PPS25 requires a precautionary approach to be undertaken when making land use planning decisions regarding flood risk. This is partly due to the considerable uncertainty surrounding flooding mechanisms and how flooding may respond to climate change. It is also due to the potentially devastating consequences of flooding to the people and property affected. Consideration also needs to be given to planning policies in adjacent Boroughs as increased urbanisation along the River Lea and River Roding in the London Borough of Newham may increase flood risk in London Borough of Barking and Dagenham or London Borough of Tower Hamlets if not managed appropriately.
4.10 References
R & D Outputs: Flood Risks to People, Defra/Environment Agency Flood and Coastal Defence R & D programme, March 2006.

London Borough of Newham SFRA
London Borough of Newham 4-20 May 2010
Communities and Local Government (2007) 'Practice Companion Guide to PPS25' A consultation paper, February 2007
Communities and Local Government (2006) 'Planning Policy Statement 25: Development and Flood Risk' Published in December 2006

London Borough of Newham SFRA
London Borough of Newham 5-1 May 2010
5 Tidal Flooding 5.1 Description
There is a risk of tidal flooding in Newham caused by a storm surge in the North Sea and the associated impacts in the River Thames. Surge conditions develop in the North Sea during times of low pressure and, due to the funnelling effect caused by the shape of the coastline, surges can build to significant heights as they move south towards mainland Europe. If these surges coincide with a high tide, the risk of tidal flooding to the east coast of England is high. Surge conditions at the mouth of the Thames Estuary are amplified upstream in central London creating a risk of tidal flooding in the city if defences are overtopped or breached.
The Thames Tidal Defences (see Chapter 3) protect London from flooding during an extreme tidal event. In combination with the Thames Barrier, the defences are high enough that they should not be overtopped in an extreme event, such as the 0.1% AEP surge event.
This chapter considers the risk of tidal flooding in the Borough in both defended and undefended scenarios and also includes an assessment of the hazard if the defences were to be breached during a surge event. As with fluvial flooding, this assessment will consider the risk to people in a tidal surge event using the hazard rating categorisation from the EA/Defra Flood Risks to People study.
5.2 Data Collection
Record of Historic Flood Events
The 1953 flood event affected parts of the London Borough of Newham around the confluence of the River Lea and the River Thames. The storm surge hit the east coast of the UK on 31 January / 1 February 1953 and breached flood defences, knocked out tide gauges between The Wash and Southend and devastated Canvey Island in the Thames Estuary. By the time the storm surge reached central London the winds were abating but the surge still caused serious flooding in the Docklands area. This area was mostly industrial at the time and there were no recorded fatalities. Figure 1.4 shows the extent of the flooding.
Existing Hydraulic Models
The Environment Agency has provided predicted tidal surge levels in the River Thames for a range of return period events. Levels have been provided for conditions in 2005, 2055 and 2107. The levels have been provided for a series of nodes in Newham from the Environment Agency iSIS joint probability model of the tidal Thames and take into account the probability of tidal surge events in the North Sea and the operation of the Thames Barrier.
The 2005 levels provided by the Environment Agency are shown in Table 5.1. The locations of the nodes for which levels are provided are shown below in Figure 5A.

London Borough of Newham SFRA
London Borough of Newham 5-2 May 2010
Table 5.1. Predicted tidal surge levels from the T hames tidal model
Node Return Periods (Years) 2005 Condition Label Location 10 20 50 100 200 1000
2.47 4.63 4.67 4.71 4.73 4.75 4.78 2.49 u/s Barrier 4.61 4.64 4.68 4.70 4.72 4.75
d/s Barrier with Barrier closure 3.1 d/s Barrier 5.35 5.55 5.82 6.04 6.26 6.73
3.4 King George
V Dock 5.32 5.51 5.76 5.97 6.17 6.63 3.5 Roding 5.31 5.55 5.75 5.95 6.15 6.61
Figure 5A. iSIS node locations in the Thames tidal model
Detailed assessments
A detailed assessment of the breach hazard in the Royal Docks and Canning Town area has been undertaken for this SFRA using information from the Lower Lea Valley Regeneration hydraulic model (photogrammetry) and .provided by the Environment Agency (LiDAR topographical data and predicted tide curves and surge levels on the River Thames to assess the risk from six breach scenarios. The breach scenarios have been decided in consultation with the Environment Agency and are discussed in further detail later in this chapter.
Topographic data
The breach assessments prepared for this SFRA have used the LiDAR topographic information provided by the EA, as well as the LiDAR and photogrammetry data that make up the inputs of the LLV Regeneration hydraulic model, shown in Figure 1.2 (Volume 3) and discussed in Chapter 1 of this report.

London Borough of Newham SFRA
London Borough of Newham 5-3 May 2010
5.3 Methods for assessing flooding from tidal sourc es
The risk of tidal flooding in Newham caused by a surge event in the River Thames has been assessed in a four stage process providing an increasing level of detail for use in the planning process.
Flood Zones
The assessment of tidal Flood Zones in Newham has considered an undefended scenario where the Thames tidal defences have been removed and the Thames Barrier is assumed to be non-operational during a storm surge event. This assessment considered three Flood Zones as described in PPS 25 and summarised in Table 5.2 below.
Table 5.2. Tidal Flood Zone definition
Flood Zone Definition
Flood Zone 1 – Low probability of tidal flooding
Land assessed as having a less than 1 in 1000 annual probability of tidal flooding in any year (<0.1%)
Flood Zone 2 – Medium probability of tidal flooding
Land assessed as having between a 1 in 200 and a 1 in 1000 annual probability of tidal flooding in any year (0.5% to 0.1%)
Flood Zone 3 – High probability of tidal flooding
Land assessed as having a 1 in 200 or greater annual probability of tidal flooding in any year (>0.5%)
The Environment Agency has provided separate datasets for fluvial and tidal flood zones for this assessment. However, for the purposes of applying the Sequential Test, combined fluvial and tidal flood zones for the Borough should be used.
Actual Risk
The assessment of actual risk of tidal flooding in Newham has not required any hydraulic modelling. The actual risk of tidal flooding is considered with the defences in place. Newham is protected from tidal flooding by the Thames tidal defences, including the Thames Barrier and Barking Barrier. Further information on these defences is given in Chapter 3. The risk of overtopping of the existing defences by a storm surge event with a 0.5% AEP has been considered. The predicted tidal surge levels in this reach of the River Thames have been provided by the Environment Agency (Table 5.1) and have been compared to the statutory defence heights (Volume 3, Figure 3.1).
Residual Risk
A number of residual risk tidal scenarios have been assessed in Newham, including:
• An extreme tidal surge;
• Failure of tidal flap valves to close; and
• Breach Analysis – using both detailed breach analysis modelling and the broad scale Tidal Residual Risk – Breach Capture method.
An extreme tidal surge
The residual risk of flooding from overtopping in a tidal surge event has been investigated by comparing statutory defence levels to the predicted tide levels in an extreme tidal surge (0.1% AEP

London Borough of Newham SFRA
London Borough of Newham 5-4 May 2010
event) on the River Thames. The predicted tide levels used in this assessment are shown in Table 5.1 for the node locations shown in Figure 5A.
Failure of tidal flap valves to close
There are surface water and sewer overflow outfalls along Newham’s frontage with the River Thames. These are fitted with tidal ‘flap’ valves that prevent tidal flows from the Thames entering the drainage system. There is a residual risk the tidal flap valves could be blocked or jammed and remain open during a tidal surge event. This would create a flood flow pathway through the sewerage system that could potentially result in surcharging of manholes and flooding of low lying areas in Newham. The risk of tidal flap valves not opening, resulting in surface water backing up in the sewer network, is discussed in Chapter 6.
Breach Analysis
There is an additional risk of tidal flooding in Newham caused by a breach in the tidal defences during a tidal surge event in the River Thames. This risk of breach has been investigated in this SFRA as a residual risk.
As much of Newham is low lying land (below the 0.1% AEP tidal surge level) protected from flooding by the presence of defences, there is a significant residual risk of flooding from a breach occurring in the existing defences during a tidal surge event. A two stage breach analysis has therefore been undertaken as the fourth step in this strategic flood risk assessment:
1. Tidal Residual Risk – Breach Capture; and
2. Detailed Breach Modelling
Assigning an accurate probability to a breach or failure of a defence in combination with a fluvial or tidal flood event is particularly difficult and often contentious and can be misleading, therefore this has not been included as part of this assessment. The breach event is considered to be an ‘emergency incident’. It not only provides information that is relevant to the capacity of the emergency services to respond but also on the resilience of critical civil infrastructure.
The results should not be considered an ‘all encompassing’ assessment of breach across Newham, rather they should be used to highlight areas particularly at risk when applying the Exception Test. A breach has the potential to occur at any location i n a raised flood defence . Development sites in low lying areas, or behind raised defences, will need to undertake a detailed assessment based on the ‘worst case’ scenario for that site, in consultation with the Environment Agency.
Tidal Residual Risk – Breach Capture
The extensive lengths of raised defences and interconnected watercourses in Newham, particularly on the River Lea, mean a significant number of breach scenarios would need to be modelled to understand the extent of Newham that may be within a breach hazard area during the design tidal flood event (0.5% AEP tidal event on the River Thames with allowance for climate change to 2107 combined with a 20% AEP fluvial event on the River Lea and River Roding). There is also the potential that this approach may result in development allocated in areas at potentially high residual risk due to a data gap. In order to more comprehensively capture the potential extent and depth of flooding should a breach occur an alternative, precautionary approach has been adopted in consultation with the Environment Agency. The methodology adopted involves:
• Transposing river levels along the channel of the River Lea perpendicular across the floodplain and subtracting the digital terrain model from the water level (effectively ignoring the presence of defences). In areas of the River Lea where areas are defined by topography, or other watercourses, levels have been applied to regions based on the maximum water level in the adjacent watercourses.

London Borough of Newham SFRA
London Borough of Newham 5-5 May 2010
• Transposing tidal surge levels in the River Thames across the Docklands area – the flood level upstream of the Thames Barrier has been adopted, following the precautionary approach.
• On the River Roding breach model results for failure of the Barking Barrier (Breach Location 6, discussed below) have been adopted as this area has a relatively short length of ‘tidal’ flood defence and is considered a ‘worst case’ scenario for the assessment of tidal breach in this area of Newham.
• Levels transposed across the floodplain of the River Lea and River Thames were selected based on an approximate 200-300mm change in water level along the river channel, or at significant changes in level (e.g. at structures), then interpolated between sections. This flood extent is expected to capture potential breach scenario flood extents along either watercourse during the design fluvial flood event.
• The raised Northern Outfall Sewer provides a defined boundary between the River Roding and River Lea floodplains and where necessary this has been used to limit the extent of flooding.
Figure 5B below demonstrates how this methodology has been applied using levels from the River Lea, River Thames and River Roding. The area between these regions has ‘interpolated’ levels between all three regions.
Figure 5B –Tidal Residual Risk – Breach Capture
This method differs from Flood Zone Mapping, which also ignores the presence of defences, by using river levels based on a constrained river channel (i.e. potentially higher water levels caused by flood defences), as well as considering the effects of climate change in accordance with PPS 25.
The outputs are flood extent and depth, however this method does not provide velocity or flood hazard. This provides a useful guide to understand the potential risk of fluvial breach across Newham and guide where more detailed breach analysis may be required.

London Borough of Newham SFRA
London Borough of Newham 5-6 May 2010
A similar exercise has been undertaken to assess the potential ‘worst case’ breach during an extreme fluvial event. This is discussed in Chapter 4.
Detailed Breach Modelling
The second approach to assessing the residual risk of tidal flooding from a breach using detailed breach modelling at a number of locations across Newham. This technique has been used to provide more detailed information on potential flood levels and hazard to inform the assessment of development sites, as well as used as a reality check for the Tidal Residual Risk – Breach Capture Method.
The breach investigation is an assessment of hazard rather than probability of occurrence. The assessment of risk includes an understanding of the frequency of occurrence, as outlined in Figure 5.C below.
Figure 5.C Conceptual definition of risk
The breach hazard analysis methodology used in this SFRA has been developed in consultation with the EA.
Six breach locations were identified in consideration of the following:
• The most likely point of breaching, i.e. overtopping will occur at the lowest point of a tidal defence wall before a breach occurs at the highest point along the same wall.
• The proximity of low-lying land to tidal defence and accessible flow paths.
Table 5.3 provides details of the six breach locations that were considered for inclusion in this assessment, and confirmed with the Environment Agency. The breach locations are shown in the maps of predicted breach hazard in Volume 3.
RISK FREQUENCY HAZARD VULNERABILITY = ● ●

London Borough of Newham SFRA
London Borough of Newham 5-7 May 2010
Table 5.3 Breach Scenarios
Breach Scenario Grid Reference
Breach details
Probability Sill Level
1 Canning Town 539420 181370
20 year fluvial, 200 year plus climate change tidal
0.1mAOD
2 Thameside West 539920 180140
200 year plus climate change tidal
3.0mAOD
3 North Woolwich 542950 179740
200 year plus climate change tidal
3.5mAOD
4 Royal Docks 543910 180200
200 year plus climate change tidal
n/a
5 Beckton 544750, 181340
200 year plus climate change tidal
4.5mAOD
6 Barking Barrier
failure to operate
545590, 181710
20m wide, 18 hour duration in accordance with guidance
for breach/failure
in hard defences
20 year fluvial, 200 year plus climate change tidal
n/a
These breach locations were chosen due to their potential to generate significant hazards across a wide area.
A 1 in 200 year tide plus climate change level (to 2107) has been used for breach modelling both downstream and upstream of the Thames Barrier. The Thames Joint Probability Level has been provided by the Environment Agency (Table 5.1, 5.4 and 5.5) and assumes the Thames Barrier would likely be closed for a surge event of this magnitude. Thames tide curves have been provided by the Environment Agency for nodes upstream and downstream of the Thames Barrier (see Figure 5A) and are shown below in Figure 5D.
Figure 5D. Predicted tidal curves for 0.5% AEP tida l surge

London Borough of Newham SFRA
London Borough of Newham 5-8 May 2010
The events run for each breach scenario were developed primarily to produce the greatest possible impact in order to investigate and understand the possible consequence of such events. The probability associated with the water level required to produce this impact, in combination with a structural defence failure has not been calculated, therefore the results of this breach investigation should be reviewed as a consideration of consequence and resulting hazard.
Breach Model schematisation
The model is a 2d (Tuflow) model developed solely to assess the predicted extent and velocity of inundation caused by the breach scenarios. The models are not linked to the mechanics generated by fluvial flooding and there are no watercourses within the model areas, so no 1d modelling was required.
The extent of the models was determined using the LiDAR/photogrammetry DTM and the EA Flood Zones to estimate the maximum inundation expected. A 10m grid has been applied for each of the breaches, with the exception of the Canning Town breach (Breach 1), where model stability due to the significant level difference meant a 15m grid has to be used.
Topographic data
The LiDAR data and photogrammetry informing the LLV Regeneration hydraulic model has been used as the topographic base for the breach assessment. This data has been filtered to produce a Digital Terrain Model (DTM). The filtering process removes buildings and trees etc. to provide a ‘bare earth’ representation of the topography.
Flood defence data and breach location
The Environment Agency has provided details of defence locations and statutory defence heights. These defences have been incorporated into the model as linear features with an elevation set to equal the statutory defence height provided.
The six breach locations assessed are described in Table 5.3 of this report. At these locations the breach in defences was modelled by lowering 20m wide stretch of defence to the ‘natural’ ground level behind the wall. At the location of Breach 4 (Royal Docks) the possible failure of the dock gates during a tidal surge event has been assessed. At Breach 6, the failure of the Barking Barrier to close has been assessed.
Tidal boundary
A tidal boundary based on the predicted surge levels and the tidal curve provided by the Environment Agency has been used in the model as a time varying stage (level) boundary. As the predicted tide level varies along the Thames, including either side of the Thames Barrier (assumed to be closed) the tide curve applied was spatially varied along the boundary of this model.
The breach models were run for a period of 18 hours which includes the two highest surge tide peaks in the cycle provided.
Manning's n value
The roughness of the land use and ground cover in the Royals and Canning Town SFRA breach analysis model has been represented using Manning’s n values. Manning’s n roughness values have been assigned by landuse type. The Manning’s n values used are the same in both models. The Manning’s n roughness values used in the models are shown below in Table 5.4.

London Borough of Newham SFRA
London Borough of Newham 5-9 May 2010
Table 5.4. Manning's n values used in the model
Land Use Manning's n value
Urban 0.08
Roads 0.016
Grass / parks 0.04
Inland water 0.03
Hard surface work yards / standing areas
0.05
Buildings 1.0
5.4 Climate Change
The latest government guidance for climate change and flood risk is contained within FCDPAG3 Economic Appraisal: Supplementary Note to Operating Authorities – Climate Change Impacts, October 2006. The note was issued in November 2006 and informs appraisers and decision makers of new climate change allowances and broadly how these should be considered when assessing flood risk. Defra expects this note to be applied to all future appraisals, strategies and management plans that have started after October 2006. Further guidance (UKCP09) was issued in June 2009, however, this latest information has not been used in this assessment. The Environment Agency have advised they hope to obtain new extreme water levels for the River Thames in 2010/2011 that include the UKCP09 climate change allowances.
The guidance is referred to in PPS25 Annex B where it states that '…the most up to date guidance on climate change…should be considered in the preparation of Regional Flood Risk Assessments, Strategic Flood Risk Assessments…'.
As a consequence of global climate change, it is predicted that there will be a rise in sea level and an increased probability of tidal surges in the North Sea and the Thames Estuary. The climate change guidance in PPS 25 is based on the Defra PAG3 report and recommends the following allowances for sea level rise in London over the next century:
• 1990 - 2025 net sea level rise relative to 1990 = 4.0 mm/yr
• 2025 - 2055 net sea level rise relative to 1990 = 8.5 mm/yr
• 2055 - 2085 net sea level rise relative to 1990 = 12 mm/yr
• 2085 - 2115 net sea level rise relative to 1990 = 15 mm/yr
Over the next fifty years this represents an increase in sea level in the Thames Estuary of approximately 0.35m. With this rise in sea level, there is predicted to be an increase in the probability of extreme tidal surge events in the River Thames.
The climate change tidal surge levels provided by the Environment Agency for use in this SFRA are shown in Table 5.4 and Table 5.5. The node locations for these results are shown above in Figure 5A and the predicted levels can be compared to the current day levels in Table 5.1.

London Borough of Newham SFRA
London Borough of Newham 5-10 May 2010
Table 5.4. Predicted climate change tidal surge le vels from the Thames tidal model in 2055
Node Return Periods (Years) 2055 Condition Label Location 10 20 50 100 200 1000
2.47 4.71 4.72 4.73 4.73 4.74 4.75 2.49 u/s Barrier 4.68 4.69 4.70 4.71 4.72 4.73
d/s Barrier with Barrier closure 3.1 d/s Barrier 5.77 5.96 6.19 6.38 6.58 7.04
3.4 King George
V Dock 5.71 5.88 6.11 6.29 6.48 6.94 3.5 u/s Roding 5.70 5.87 6.09 6.26 6.45 6.91
Table 5.5. Predicted climate change tidal surge le vels from the Thames tidal model in 2107
Node Return Periods (Years) 2107 Condition Label Location 10 20 50 100 200 1000
2.47 4.73 4.73 4.74 4.75 4.75 4.86 2.49 u/s Barrier 4.70 4.70 4.71 4.72 4.73 4.85
d/s Barrier with Barrier closure 3.1 d/s Barrier 6.39 6.54 6.75 6.92 7.11 7.60
3.4 King George
V Dock 6.30 6.45 6.65 6.81 6.99 7.48 3.5 u/s Roding 6.28 6.42 6.63 6.79 6.98 7.46
Note: The latest climate change guidance, as defined in UKCP09, and issued in June 2009, has not been used in this assessment.
For lower probability surge events (such as the 0.5% AEP / 200 year return period event), the predicted surge levels in 2055 upstream of the Barrier are slightly lower than those given for current conditions (Table 5.1). With the predicted tide levels provided, the Environment Agency has provided the following explanation for why this is the case:
“The levels are lower for greater return periods when including climate change because the hydraulic model used to produce these levels takes into account the barrier closure rule (circumstances/conditions of closure) and assumes that it remains unchanged up to 2107. Sea levels are rising therefore the barrier is closed more often. In turn this means that the ratio of actual closures to no closures will increase. Fewer no closures means fewer near closure events. As near closure events have the highest water levels upstream of the barrier, if there are fewer near closure events, then extreme water levels upstream of the barrier also decrease.”
The situation described above assumes that the Thames Barrier will be maintained into the future and will continue operate in the same way as currently.
Upstream of the Thames Barrier the present day levels are higher than future levels considering climate change. This is based on the assumption in the Thames hydraulic model that the Thames Barrier operating rules remain unchanged, and the closure rule will become more frequent. Advice from the EA on this matter is that:
This means that a smaller number of tides will be allowed to flow up into central London each year. The highest tides experienced upstream of the Thames Barrier occur when the circumstances are within a fine margin of meeting the closure rule, and the decision is taken not to close (a near closure event). As there will be fewer tides per year upstream of the Barrier, and the ratio of near closures to regular tidal levels within this smaller number of tides remains constant, the number of near closure events will decrease, and therefore so do the modelled levels.

London Borough of Newham SFRA
London Borough of Newham 5-11 May 2010
Breach analysis data available to inform this SFRA has been sourced from the Royal and Canning Town SFRA prepared for the LDA. To present a consistent approach in this SFRA only present day 0.5% AEP flood levels have been used in the assessment of breach (Table 5.1). Using the higher predicted water levels from current conditions provides a precautionary approach to assessing the future level of risk from tidal flooding in for Breach locations 1 – 3. Breach location 4 is downstream of the Thames Barrier and therefore climate change levels are higher than present day levels. Site specific flood risk assessments will need to consider breach hazard over the lifetime of the development.
As discussed in Section 5.6, the latest Defra guidance has not been used in the determination of climate change flood levels in the Thames. This assessment of the risk of tidal flooding in Newham caused by a surge tide in the River Thames will have to be revisited as part of the ongoing SFRA management and maintenance when the EA Tidal Thames model has been re-run using the latest climate change predictions for rising sea level.
5.5 Results
Historical flooding
The largest tidal flooding event in the Thames Estuary in recent history was the 1953 flood. The flood event was due to the largest storm surge experienced in the North Sea in the 20th Century. The surge had an amplitude of 2.74m in Southend, Essex, 2.97m in Kings Lynn, Norfolk, and 3.36m in the Netherlands (Met-Office, 2007). Overall, 307 people died in the UK along the east coast, and 1,800 people perished in the Netherlands. There is little record as to the destruction within Newham. However, the following is noted on the Met Office website:
“From Tilbury to London's docklands, oil refineries, factories, cement works, gasworks and electricity generating stations were flooded and brought to a standstill.”
As much of Newham was industrial at the time of the 1953, there was no loss of life. Other reports state that only the banks on the south of the River Thames were breached, but the River Lea was also observed to break its banks during this event and flooding occurred around Town Quay and Highbridge Road on the River Roding.
Flood Zones
The tidal Flood Zones in Newham are shown in Figure 5.1 (Vol. 3). The zones show that parts of the borough, including all of the Royal Docks (and City Airport), Beckton, and the majority of Canning Town lies within Flood Zone 3. These zones are produced for an undefended scenario assuming that the Thames Barrier and Barking Barrier are non-operational during the time of a surge tide. The majority of flooding is directly from overtopping along the boundary with the Thames.
In Newham, Flood Zone 3 (area with a high probability of tidal flooding, greater than 0.5% AEP) also includes low lying land at Mill Meads in Stratford and Wallend in East Ham. This is a result of tidal surge passing up the River Lea and River Roding respectively, and overtopping the river banks.
In Newham the area of Flood Zone 2 is generally not extensive (because there is only a small difference between the predicted tide levels for the 0.5% and 0.1% AEP surge events. The only exception is Custom House, where the flat nature of the topography results in a large area of Flood Zone 2 in the borough.
There are pockets of land within Flood Zone 2 and 3 which are located in Flood Zone 1. This is likely to be a result of land that has historically been artificially raised. This includes land around the junction of the A13 and A406 and around Twelvetrees Crescent.
It must be noted that these tidal flood zones assume there are no defences in place and they do not represent a scenario which is likely to occur. These tidal flood zones should be used in conjunction

London Borough of Newham SFRA
London Borough of Newham 5-12 May 2010
with the fluvial flood zones shown in Figure 4.1 by the Borough to apply the Sequential Test to their spatial planning.
Actual risk of flooding from tidal sources
The actual risk of tidal flooding in Newham is much reduced (compared to the Flood Zones) by the presence of the Thames tidal defences, including the Thames Barrier and Barking Barrier on the River Roding. The 0.5% AEP tidal surge level in the River Thames along the boundary of Newham is between 4.72 and 4.75m AOD upstream of the Thames Barrier and between 6.15 and 6.26 mAOD downstream of the Thames Barrier.
The statutory defence levels upstream of the Thames Barrier are 5.18 to 5.23m AOD and downstream of the Thames Barrier are 7.2mAOD (Figure 3.1, Volume 3).
As the predicted surge levels are below the statutory level of defence, there is no actual risk of tidal flooding in Newham. In this event there is at least 0.31m of freeboard upstream of the Thames Barrier and 1.31m downstream of the Thames Barrier based on the existing defences.
The Barking Barrier does provide protection against tidal surge events to a similar standard and similar operational rules as the Thames Barrier. However, unlikely the River Lea, the River Roding is unable to discharge into the River Thames should a heavy rainfall event coincide with a tidal surge.
Residual risk of flooding from tidal sources
The risk of tidal flooding in Newham from an extreme surge event has been considered as a residual risk. The 0.1% AEP tidal surge levels along this reach of the River Thames (see Table 5.1) are 4.90 to 4.94m AOD upstream of the Thames Barrier and 6.05 to 6.20m AOD downstream of the Thames Barrier. These levels are below the statutory level of defence and so the residual risk of overtopping causing flooding in Newham is considered to be extremely low. In this event there is approximately 0.28m of freeboard on the defences upstream of the Thames Barrier and 1m downstream of the Thames Barrier.
Failure of tidal flap valves to close
This can create a flood flow pathway where tidal water can fill the drainage network, potentially leading to surcharging manholes and flooding of low lying land. This is a particular consideration in Newham given the extent of low lying land in the Canning Town and Custom House area. Although it is difficult to quantify the probability of this occurring, those responsible for managing and maintaining sewer outfalls (most commonly Thames Water or private land owners) should be aware of potential for wide spread flooding. The hazard associated with this risk is unlikely to result in a maximum hazard worse than that represented by a breach in defences, however awareness of the cause and potentially difficult to define location may mean it takes time to undertake remedial action. The hazard should be managed in a similar way to managing hazard from a breach in defences.
Breach Analysis
Tidal Residual Risk – Breach Capture
Similar to a breach during a fluvial flood event on the River Lea, should a breach occur in the defences in the Stratford area there are low lying areas that may be inundated (Figure 5.2A). In many cases the areas of low ground are isolated by watercourses or defences, therefore flooding is likely to be relatively restricted.
There is the potential that a breach in defences has the potential to effect nearly any location in the low lying Canning Town and Custom House area, with flood depths of up to 6-6.5m possible (Figure 5.2B, C, and D). However it is likely that more detailed site specific breach analyses will reduce these

London Borough of Newham SFRA
London Borough of Newham 5-13 May 2010
depths and in some locations on the edge of the area of potential breach, particularly remote from the river frontages, be outside an area considered at risk.
A similar effect is possible on the River Roding, with the low lying ground near the A13 particularly susceptible; however flooding has the potential to extend into East Ham as well as effecting the Beckton Sewage Treatment Works (Figure 5.2E). The Northern Outfall Sewer acts as an artificial boundary to breach flooding between the River Lea and River Roding.
Detailed Breach Modelling
Six breach scenarios have been considered for Newham. An assessment of the breach hazard from the breach scenarios is shown in Figures 5.4 to 5.9. The six scenarios assessed show that there are areas within the Borough that would experience significant or extreme flood hazard ratings in the event of a breach occurring. In these areas there may be deep and fast flowing flood water which would be dangerous to most people. There is also the potential that flooding during a breach could extend over a significant area. The scenarios have been selected in consultation with the Environment Agency, as areas where the consequences of a breach are likely to be the most severe. This assessment has assumed that the breaches flow for a fixed number of tidal cycles. If the breach remains open for further tide peaks, the extent of flooding would be greater.
Breach 1. Canning Town
The extent of flooding and predicted hazard rating in this scenario is shown in Figure 5.4 (Vol. 3).
In this scenario water very rapidly floods Canning Town Station (essential infrastructure), with water flowing along the railway line to the north, and Silvertown Way to the south. Deep water and high velocities result in extreme hazard in close proximity to the breach location. Large areas of Canning Town, Plaistow and West Ham are very low lying (approximately 0 - 2mAOD) meaning floodwater through the breach is potentially able to spread over a large distance, resulting in significant hazard over an extensive area of existing residential land use.
Breach 2. Thameside West
The extent of flooding and predicted hazard rating in this scenario is shown in Figure 5.5 (Vol. 3).
In the event of a breach in the vicinity of Silvertown, the extent of floodwater is controlled by the high ground immediately surrounding the Royal Docks, and the Thames tidal defences. This result in potentially deep fast flowing water (significant to extreme hazard) extending along North Woolwich Road for the length of the Royal Docks.
Breach 3. North Woolwich
The extent of flooding and predicted hazard rating in this scenario is shown in Figure 5.6 (Vol. 3).
Similar to Breach 2, the extent of flooding is limited by higher ground immediately surrounding the Docks and Thames Tidal Defences. The higher tidal surge levels downstream of the Thames Barrier mean more water flows through the breach, and as it is unable to extend over a significant area results in very deep water and extreme hazard. Breach 4. Royal Docks
The extent of flooding and predicted hazard rating in this scenario is shown in Figure 5.7 (Vol. 3).
A breach in the Dock Gate results in an immediate filling of the Royal Docks basins prior to any flooding on adjacent land. This additional storage, although not preventing flooding in the Docks area, does provide some ‘lag’ in the event of a breach and could provide time to evacuate the area if necessary.

London Borough of Newham SFRA
London Borough of Newham 5-14 May 2010
Once the Royal Docks basins have overtopped, floodwater flow into the lower areas to the north and south of the Royal Docks, however the extent of extreme hazard is minimal. Some areas will still experience deep flooding due to the low lying land. Breach 5. Beckton
The extent of flooding and predicted hazard rating in this scenario is shown in Figure 5.8 (Vol. 3).
The extent of flooding in Beckton is controlled by the raised Northern Outfall Sewer. This means water is forced in a westerly direction towards the low lying land in Beckton resulting in significant hazard to existing development, and areas of very deep and fast flowing water on Winsor Terrace. Breach 6. Barking Barrier Failure
The extent of flooding and predicted hazard rating in this scenario is shown in Figure 5.9 (Vol. 3).
The failure of the Barking Barrier to close during a tidal surge event is considered very low probability, as the structure is continually operated by the Environment Agency. However the failure of the Barrier has been assessed to provide a fuller coverage of residual tidal flood risk across Newham,
The Barrier failure results in significant overtopping of the defences along the River Roding, resulting in extreme flood hazard to both the Beckton Sewerage Treatment Works (critical infrastructure), as well as parts of East Ham and neighbouring Barking and Dagenham. The extent of flooding is limited by the raised Northern Outfall Sewer.
Summary
Figure 5.3 provides a summary of the data used in this assessment of residual tidal breach risk. It demonstrates that site-specific breach analyses may result in reduced flood extents, depths and hazard when compared to the Tidal Residual Risk – Breach Capture method, however on their own do not identify the full extent of the potential risk across Newham. This demonstrates the importance of undertaken site specific breach analyses.
In addition to the risk to residents and businesses, the assessment demonstrates the potential risk to critical infrastructure. City Airport is ‘essential transport infrastructure’, not just for Newham, but Greater London as well. Ensuring the airport remains resilient to tidal flooding during ‘worst case’ flooding scenarios should be considered for both existing and future development at the airport. Similarly, although Beckton Sewage Treatment Works needs to be located near the River Thames for operational reasons, there is a potentially high flood hazard should a breach in defences occur. Guidance is presented in Volume 1 of this SFRA on the use of these breach hazard results in land use planning, development control and emergency planning.
Figure 5.10 provides an indication of the potential water levels associated with a breach across Newham in order to provide a guide on the scale of risk at a strategic level, and a precautionary approach when considering development. These water levels are expected to decrease through more detailed site specific breach analysis, In some instances the data used to inform the site specific breach analyses will be appropriate for use, however it is recommended the Environment Agency are consulted on the most appropriate data to use on a case-by-case basis.
Figure 5.11 provides an indication of the potential time to inundation based on the available site specific breach modelling.

London Borough of Newham SFRA
London Borough of Newham 5-15 May 2010
5.6 Uncertainty in flood risk assessment
There are several assumptions inherent in this assessment of tidal risk which must be considered when using this SFRA. The assessment here is based on the best available information at the time of assessment. The assumptions within this model should be understood such that informed decisions can be made when using model results.
The key assumptions and associated constraints to this assessment of tidal flood risk in Newham include:
• The predicted tidal surge levels provided by the EA for existing conditions, 2052 and 2102 are derived from the EA Thames tidal joint probability model and take into account predicted surge levels and the probability of barrier closure. The prediction of these levels therefore requires assumptions to be made about the operation of the Barrier today and in the future. Details of these assumptions have been provided by the EA and are noted in this report.
• The tidal surge levels provided by the Environment Agency for 2052 and 2102 with an allowance for climate change do not use the latest Defra guidance. The EA Tidal Thames joint probability model has not been re-run with the latest Defra FCDPAG3 guidance. Given that tidal surge levels in the River Thames are determined by the joint probability of surge events and barrier closure, it is not appropriate to just add the FCDPAG3 recommended increases to existing levels. The assessment of risk from tidal flooding will need to be revisited as part of the ongoing SFRA management and maintenance when revised tidal levels are available from the EA.
• The assessment of actual and residual risk of overtopping in a tidal surge event has assumed the statutory defence level provided by the EA in the NFCDD dataset.
• The assessment of tidal flood risk is based on still water levels and does not take account of the potential effects of waves which may be significant during a surge event in the River Thames.
• The key assumptions and associated constraints with the Fluvial Residual Risk – Breach Capture methodology include:
o Flood levels in the channel remain at the same height across the floodplain and the effect flow over the floodplain has on water levels is not taken into consideration.
o The highest flood level is perpendicular to the watercourse.
o Similarly all land below the transposed flood level is at risk of flooding.
o Defences would not be repaired within the indicative timeframes currently adopted for breach modelling (i.e. 18 hours for hard defences and 30 hours for embankments).
o Flood defences could fail at any location, regardless of condition.
• The water levels and depths in the Fluvial Residual Risk – Breach Capture method described on Figures 5.2 (A-E) and 5.10 should not be used in development design remote from the river frontage, as this method does not take into account obstructions in the floodplain that will slow the flow of water and reduce flood depth and is expected to over-estimate the actual level of risk.

London Borough of Newham SFRA
London Borough of Newham 5-16 May 2010
5.7 Managing flooding from tidal sources
Flooding from tidal sources can be managed in a number of ways, including:
• Avoidance - developing outside of the tidal flood zones and areas of rapid inundation.
• Prevention - walls and embankments used to exclude water from a site, continued maintenance of Thames Barrier and other defences.
• Management - flood resilient design, flood warning, evacuation and emergency planning, and flood awareness.
The most suitable type of flood management for a site depends on site specific conditions, the receptor of flooding and the type of flooding.
The Thames Tidal Defences prevent tidal flooding in Newham even in an extreme tidal surge event (0.1% AEP) on the River Thames. It is not possible to prevent a breach in the tidal defences but this risk can be managed through flood resilient design, evacuation and emergency planning and flood awareness. Furthermore, through the process of land use planning and in designing the site layout on individual allocations, areas of the greatest flood hazard can be avoided.
Thames Estuary 2100 is the Environment Agency project tasked with developing a strategy for managing flood risk in the estuary up to 2100. This strategy, due to be presented to Defra in late 2009, will contain the strategy for managing tidal flood risk in this area.
The Newham LDF can contain more locally focussed strategies for managing tidal flood risk in the Borough, as long as they are consistent with the high level strategies in the TE2100 report.
5.8 Planning considerations
PPS25 requires that decision makers use the SFRA to inform their knowledge of flooding, refine the information on the Flood Map and determine the variations in flood risk from all sources of flooding across and from their area. These should form the basis for preparing appropriate policies for flood risk management for these areas.
Tidal flooding in London is a low probability but high consequence event. A large amount of information can be obtained from local District Council or Environment Agency staff, and/or National datasets, such as the Environment Agency Flood Zones. Any potential land use planning decisions should be made after consulting these sources.
PPS25 requires a precautionary approach to be undertaken when making land use planning decisions regarding flood risk. This is partly due to the considerable uncertainty surrounding flooding mechanisms and how flooding may respond to climate change. It is also due to the potentially devastating consequences of flooding to the people and property affected.
The assessment presented in this SFRA shows that the majority of the Plaistow, Canning Town and the Royal Docks are in Flood Zone 3 and has a high probability of tidal flooding if the Thames tidal defences and the Thames Barrier are removed. Further detail on flood risk within this zone is provided through the assessment of actual risk and breach hazard. The assessment of breach hazard highlights areas where rapid inundation or significant depths of flooding might be experienced during a breach event and should be considered when planning for development in these locations.
A river works licence from the Port of London Authority is required for all works on the river-side of the mean high water mark. This includes works that overhang the river or are underneath the river. The process is in place to ensure that all developments in the river are assessed for their potential impact on the safety of navigation and the environment. Further information on obtaining this licence is

London Borough of Newham SFRA
London Borough of Newham 5-17 May 2010
available on the PLA’s website19. The PLA recommend preliminary consultation with licensing officer before submitting a formal application for any major projects. A separate dredging licence is required from the PLA for any works involving dredging or bed levelling. Further information on managing dredging and dredging licences is also available on the PLA website20.
5.9 References
Defra FCDPAG3 Economic Appraisal Supplementary Note to Authorities – Climate Change Impacts, October 2006
19 http://www.portoflondon.co.uk/display_fixedpage.cfm/id/2271/site/pla 20 http://www.portoflondon.co.uk/display_dynamic.cfm/id/254/site/environment

London Borough of Newham SFRA
London Borough of Newham 6-1 May 2010
6 Flooding from Land, Surface Water, Sewer, and SUDS
This Chapter considers the risk of flooding from land, surface water and sewers and the management of this source of flooding through the use of Sustainable Drainage Systems (SUDS). The assessment of risk has been divided into two sections:
• Flooding from land and surface water
• Flooding from sewers
The recommendations for managing flood risk and the planning considerations for these sources of flood risk have been considered together.
Chapter 5 of the PPS 25 Practice Guide provides guidance on the management of surface water and highlights the responsibility of LPAs to identify surface water drainage issues and the types of measures which may be needed in a Surface Water Management Plan (SWMP), if appropriate. A SWMP for London (‘Drain London’) is to begin in February 2010 (refer to Section 6.3). This SFRA highlights areas at highest risk of surface water flooding in Newham by assessing a range of information gathered from a variety of sources and this assessment should then be taken into account by Newham when applying the Sequential Test to land allocation and developing the Drain London SWMP.
FLOODING FROM LAND AND SURFACE WATER
6.1 Description
Flooding from land occurs when intense, often short duration rainfall is unable to soak into the ground or enter drainage systems. It is made worse when soils are saturated so that they cannot accept any more water. The excess water then ponds in low points, overflows or concentrates in minor drainage paths that are usually dry. This type of flooding is usually short lived and associated with heavy downpours of rain. Often there is limited warning before this type of localised flooding occurs. Surface water runoff can cause localised flooding in natural valleys and in natural low spots where water may collect or where normally dry areas become inundated.
Surface runoff in catchments is directly related to the size and shape of the basin. The amount of runoff is also a function of geology, slope, climate, rainfall, saturation, soil type, urbanisation and vegetation. Geological considerations include rock and soil types and characteristics, and the degree of weathering. Porous material (sand, gravel, and soluble rock) absorbs water more readily than fine-grained, dense clay or unfractured rock and has a lower runoff potential. Poorly drained material has a higher runoff potential and is more likely to cause flooding.
6.2 Causes and classifications
Distinguishing between flooding from land and flooding from groundwater can be complicated. Rainfall that infiltrates into the soil but resurfaces further down the hill is classified as surface water. The water in lakes, marshes and reservoirs is also classified as surface water. Water flowing over the ground surface that has not entered a natural channel or artificial drainage system is classified as surface water runoff or overland flow.
Flooding from land can occur in rural and urban areas, but usually causes more damage in the latter. Flood pathways include the land and water features over which floodwater flows. These pathways include drainage channels, rail and road cuttings. Flood management infrastructure can also serve as a flood pathway. Developments that include significant impermeable surfaces, such as roads and car

London Borough of Newham SFRA
London Borough of Newham 6-2 May 2010
parks may increase the volume and rate of surface water runoff. Urban areas usually have extensive drainage or sewer systems.
Developments which are close to artificial drainage systems, or located at the bottom of hillslopes, in valley bottoms and hollows, may be more prone to flooding. This may especially be the case in areas that are downslope of land that has a high runoff potential including impermeable areas and compacted ground.
6.3 Impacts of surface water flooding
Surface water flooding can affect all forms of the built environment, including:
• Residential, commercial and industrial properties;
• Infrastructure, such as roads and railways, telecommunication systems and sewer systems;
• Agriculture;
• Amenity and recreation facilities.
Flooding from land is usually short-lived and may only last as long as the rainfall event. However flooding may persist in low-lying areas where ponding occurs. Due to the typically short duration, flooding from land tends not to have as serious consequences as other forms of flooding, such as flooding from rivers or the sea.
Urban land use changes are likely to alter the amount of surface water in the future. Future development is also likely to change the position and numbers of people and/or developments exposed to flooding (Defra 2004).
6.4 Data collection
Sources of data
Data collected to assess flooding from land in this SFRA has included geology, soil, landcover, and digital terrain data.
Broad scale mapping of ‘Areas susceptible to surface water flooding’ in Newham has been provided by the Environment Agency. The mapping covers the whole of England and Wales to assist in identifying areas susceptible to surface water flooding. The document Areas Susceptible to Surface Water Flooding – Guidance for Local Planning Authorities in England for land use planning and other purposes (not emergency planning) v1, July 2009 provides further information on how the data should be used.
The document provides the following guidance on using the mapping SFRAs:
The maps are most appropriate for use at this level of the development planning system where they will provide the greatest benefit in terms of the identification, management and avoidance of surface water flooding.
The maps will act as a starting point to highlight areas where the potential for surface water flooding needs particular assessment and scrutiny within SFRAs and Surface Water Management Plans (SWMPs). The output from these assessments should in turn inform development allocations within the LDD and outline the requirements for site-specific Flood Risk Assessments (FRAs) to be carried out by developers.
Methodology

London Borough of Newham SFRA
London Borough of Newham 6-3 May 2010
The modelling uses LiDAR and Geoperspective data (derived from aerial photography) to create a digital terrain model (DTM) and a standardised storm event (0.5% AEP, 6.5 hour duration) to indicatively determine how surface water will flow across the ground and where it might result in flooding. Surface water flooding has been classified into three bands ranging from ‘more’ to ‘less’.
Records of Historic Flood Events
The London Borough of Newham and the Environment Agency were unable to provide any record of surface water flooding. This does not necessarily mean that surface water flooding has not occurred in the Borough, just that it has not been recorded.
Thames Water has provided sewer record flooding, discussed further in this section.
Existing studies
It is envisaged the Flood and Water Bill, currently in draft for consultation, will confirm overall responsibility for monitoring or responding to surface water flood events. Defra’s Making Space for Water Strategy (MSW) aims to provide clarity for the public and professional bodies impacted by and involved in the management of flooding. MSW recognises the need for an integrated understanding of flooding from all sources including surface water.
As a consequence, Defra have instigated a series of investigations into flooding from other sources (Defra 2006). The research project aims were to:
…'assess the feasibility of mapping flood risk from different types of flooding (including overland flow), together with the practicalities of implementing flood modelling methods considered for the significant types of flooding’.
The research project identified that the greatest barrier to producing accurate flood risk maps for other sources of flooding was:
• The availability of data for ground-truthing in consistent and useable formats.
• The modelling methods required to capture all the observed processes were complex and may not be realistic in the immediate future. Furthermore while there is a general understanding of the causes of flooding from land, the location, timing and extent were difficult to predict because of the poorly understood processes, localised nature of drivers of flooding and lack of available datasets.
The mapping of areas susceptible to surface water flooding provides an indication of where surface water flooding may occur however, as identified, is not a reliable data source for determining the ‘actual risk’ of flooding.
Current Studies – Drain London
The GLA are leading on the development of SWMPs across London through the ‘Drain London’ Consortium. The project is expected to run through to early-mid 2011. Newham are feeding into this process through the London Councils organisation, however are likely to become more directly involved as the project develops. Drain London will be delivered in a number of stages:
• Initially dividing London into a number of manageable areas, collate strategic information and develop frameworks for data and modelling quality, stakeholder and consultant interaction and prioritisation of more detailed SWMPs at the area or local level.
• Following this area-level SWMPs will identify flooding hotspots, define critical drainage areas and develop strategic-scale SMWPs.

London Borough of Newham SFRA
London Borough of Newham 6-4 May 2010
• A final level of assessment is likely to include detailed local-level SWMPs for high priority critical drainage areas.
6.5 Assessment of flood risk
The existing Environment Agency Flood Zones only indicate areas liable to flood from rivers or the sea. Other data must therefore be used to determine the areas susceptible to flooding from other sources, such as flooding from land.
The following data sets have sets have been used to assess surface water flooding in Newham and jointly inform the discussion in Section 6.6 below:
1. Review of the Areas Susceptible to Surface Water Flooding mapping;
2. Review of postcode-level data on surface water flooding (provided by Thames Water); and
3. These two data sets are supported by qualitative review of the physical, hydrological and environmental characteristics of Newham (Geology, Soil, Topography and Land Cover) on the premise that these factors are most influential in surface water flooding.
6.6 Results
Figure 6.2 indicates that areas in the Lower Lea Valley, and Lower Roding are most likely to result in surface water flooding. These areas are also susceptible to fluvial flooding. Railway lines in ‘cuttings’ may also be particularly susceptible. The uncertainties in modelling methodology used mean that it is difficult to accurately predict the susceptible of surface water flooding in particularly in low lying, flat areas (such as Canning Town and Custom House).
A broad scale assessment suggests that the overlying soil (groundwater gley soils) and drift geology (Figure 7B in Chapter 7) of the fluvial floodplain in Newham may allow for some infiltration of rainfall during a storm event. However, due to the highly urbanised nature of the borough, the potential for infiltration is limited and the rate and volume of surface water runoff is increased. Surface water runoff from the northern part of the Borough is likely to be channelled along roads and other linear features and will flow towards the lower parts of the Borough, near to the River Thames (refer topography in Figure 1.2 in Volume 3). There is also the potential for surface water runoff to enter the network of artificial waterways (e.g. Royal Docks).
There are limited records of surface water flooding in Newham (Figure 6.1) that can be used to verify the broad scale modelling, however there are a number of records of combined sewer flooding (discussed further in this chapter). The risk of surface water flooding is expected to be greatest in the low-lying areas of the Borough, where ponding might occur due to the impervious nature of the dense urban area. These areas are predominantly in close proximity to the River Thames and Royal Docks towards the south of the borough.
Detailed flood risk assessments should consider the risk from overland flow on a site specific basis, with particular regard given to developments in the low areas around Canning Town, Custom House, and Beckton.
6.7 Climate change
There is no research which specifically considers the impact of climate change on surface water flooding in Newham. Nationally, future climate change projections indicate that more frequent short-duration, high intensity rainfall and more frequent periods of long duration rainfall are to be expected. These kinds of changes will have significant implications for flooding from land. Table 6.1 shows the predicted increases in rainfall intensities expected as a result of climate change.

London Borough of Newham SFRA
London Borough of Newham 6-5 May 2010
Table 6-1 Recommended precautionary sensitivity ranges for peak rainfall intensities.
Year 1990 to 2025 2025 to 2055 2055 to 2085 2085 to 2115
Peak rainfall intensity
+5% +10% +20% +30%
Source: Defra FCDPAG3 Economic Appraisal Supplementary Note to Operating Authorities – Climate change Impacts, October 2006 (reproduced in PPS25).
In the absence of certainty, Planning Policy Statement 25: Development and Flood Risk, (PPS25) advocates a precautionary approach. Sensitivity ranges are suggested for peak rainfall intensities over various time horizons. As our understanding of the impacts of climate change improves, these guidelines are likely to be revised. It is imperative that the SFRA is reviewed appropriately.
6.8 Uncertainty in flood risk assessment
The causes of flooding from land are generally understood. However it is difficult to predict the actual location, timing and extent of flooding, which are dependent upon the characteristics of the site specific land use, local variations in topography, geology, soils and the hydrological conditions.
There is a lack of reliable measured datasets and the estimation of AEP for flood events is therefore difficult to verify. The broad scale ‘Areas susceptible to surface water flooding’ data set provides an initial guide to areas that may be at risk, however the Environment Agency has advised there are a number of limitations to using the information:
• The mapping does not include underground sewerage and drainage systems;
• It uses a single rainfall event and therefore does not consider local rainfall patterns or catchment characteristics;
• The mapping should not be used as sole evidence in making decisions for specific planning applications without further supporting evidence;
• The mapping should not be used in a scale to identify individual properties at risk of surface water flooding. It can be used as a general indication of areas potentially at risk that require further assessment either through SWMPs or detailed FRAs.
• Similarly, the mapping should not be used on it’s own. This SFRA considered the mapping in conjunction with the available records of historic flooding discussed below.
The impact of climate change on this type of flooding is uncertain and likely to be very site specific. More intense short duration rainfall and higher more prolonged winter rainfall are likely to exacerbate flooding in the future. In Newham the dense urban nature of the area increases the potential for significant increases in runoff.
FLOODING FROM SEWERS
6.9 Description
Flooding from foul and combined sewers occurs when rainfall exceeds the capacity of networks or when there is an infrastructure failure. In Newham, and more generally in London, the sewer network is a combined foul and surface water sewer system, much of which was built in Victorian times.

London Borough of Newham SFRA
London Borough of Newham 6-6 May 2010
6.10 Causes of sewer flooding
The main causes of sewer flooding are:
• Lack of capacity in sewer drainage networks due to original under-design.
• Lack of capacity in sewer drainage networks due to an increase in demand (such as climate change and/or new developments).
• Lack of capacity in sewer drainage networks due to events larger than the system designed event.
• Lack of capacity in sewer drainage networks when a watercourse is fully culverted (lost watercourses), thus removing floodplain capacity.
• Lack of maintenance or failure of sewer networks which leads to a reduction in capacity and can sometimes lead to total sewer blockage.
• Failure of sewerage infrastructure such as pump stations or flap valves leading to surface water or combined foul/surface water flooding.
• Groundwater infiltration into poorly maintained or damaged pipe networks.
• Restricted outflow from the sewer systems due to high water or tide levels in receiving watercourses (‘tide locking’).
6.11 Impacts of sewer flooding
The impact of sewer flooding is usually confined to relatively small localised areas. When flooding is associated with blockage or failure of the sewer network, flooding can be rapid and unpredictable.
Drainage systems often rely on gravity assisted dendritic systems, which convey water in trunk sewers located at the lower end of the catchment. Failure of these trunk sewers can have serious consequences, which are often exacerbated by topography, as water from surcharged manholes will flow into low-lying urban areas.
The modification of watercourses into culverted or piped structures can result in a reduced capacity. Excess water may be sent along unexpected routes as its original channel is no longer present and the new system cannot absorb it.
Whilst an area affected by sewer flooding is often localised, the quality of water can be poor. Flooding of combined sewers can lead to contaminated water entering properties and watercourses. This form of flooding has adverse health implications for the local population. If this kind of flooding happens on a regular basis the spread of illness and disease are also a risk.
Sewer flooding is likely to have a high concentration of solid, soluble and insoluble contaminants. This can lead to a reduction in the environmental quality of receiving watercourses. Flooding of contaminated land (such as landfills, motorways, and petrol station forecourts) will transport contaminants such as organics and metals to vulnerable receptors if the respective drainage systems are not designed to treat the water. The dense urban nature of Newham heightens the impact that sewer flooding may have on surrounding properties and population.

London Borough of Newham SFRA
London Borough of Newham 6-7 May 2010
6.12 Data collection
Records of historic flood incidents
Thames Water has provided information at a post-code level scale which collates their records of flooding from overloaded sewers in the last ten years. The records are divided into incidents of surface water, foul water and combined flooding.
The Environment Agency and the London Borough of Newham do not have any records of historic flood incidents of sewer flooding.
Data Processing
There are many causes of sewer flooding and therefore information on the cause is required to determine whether the probability of re-occurrence is high. Detailed records of flooding from water companies are required to further analyse the significance of sewer flooding across Newham. Flood data is sent by water companies to Ofwat annually, however for the purposes of a SFRA, no exact location can be obtained as this information is considered commercially sensitive.
As there are no historic datasets available other than the Thames Water records the assessment that can be carried out on sewer flooding is limited.
6.13 Methods for assessing flooding from sewers
Currently Environment Agency Flood Zones only indicate areas liable to flood from rivers or the sea. Other data must therefore be used to determine the area at risk of flooding from other sources, such as sewers.
As the SFRA investigates flood risk over a large spatial area, it is not practical to undertake a detailed assessment of all sewer networks across Newham. The three most appropriate methods for assessing the risk of flooding from sewers within the SFRA are:
• Review of historical data - qualitative review of areas at risk and/or GIS analysis to create a buffer zone around locations of known risk. This method was used during the SFRA.
• Reference to existing studies carried out by water companies, the Environment Agency and private developers. No studies of this kind were provided during the SFRA.
• Urban drainage modelling – modelling of the urban drainage network to determine locations likely to flood. Historically urban drainage models have been unable to provide a representation of the integrated impact of different flood mechanisms (i.e. river flooding with sewer flooding), however software packages such as TUFLOW are now able to jointly model these sources. This is considered too detailed for the requirements of a SFRA.
The majority of incidents of flooding which are from sewers are clustered in the northern parts of Newham, however it should be noted that there was no data available for large areas of the borough, which does not necessarily mean these areas have not experience flooding from sewers. The results of the data review should be viewed with caution as the sewer network is constantly being maintained, upgraded and improved. Thus flooding issues may be relatively short lived (<10 years).
The effects of sewer flooding are relatively local and there is little warning. If identified by the Environment Agency or the water company as a major risk, sewer flooding will need to be assessed in greater detail in individual flood risk assessments.

London Borough of Newham SFRA
London Borough of Newham 6-8 May 2010
6.14 Climate Change
Climate change is expected to impact sewer flooding as a result of increases in rainfall intensity. An increase in rainfall intensity is likely to increase the volume of surface water runoff in a storm event. This will in turn increase runoff reaching the sewer network causing sewers to surcharge more frequently than currently experienced. This may require the upgrading of existing infrastructure to maintain the same level of service and for new infrastructure to be designed with greater capacities. Table 6.2 shows climate change predictions for increasing rainfall intensities, taken from PPS 25.
Table 6-2 Recommended precautionary sensitivity ranges for peak rainfall intensities.
Year 1990 to 2025 2025 to 2055 2055 to 2085 2085 to 2115
Peak rainfall intensity
+5% +10% +20% +30%
Source: Defra FCDPAG3 Economic Appraisal Supplementary Note to Operating Authorities – Climate change Impacts, October 2006 (reproduced in PPS25).
6.15 Results
The risk of flooding from sewers is increasing due to the increasing urbanisation of areas and rising rainfall intensities. Several recent flood events across the country have been attributed to the failure of the drainage network to contain runoff during severe storm events. The combined surface water and foul water drainage system in London dates from Victorian times and cannot cope with runoff from the ever-growing city and increasing rainfall intensities.
The data provided by Thames Water for use in this SFRA contains a record of 630 incidents of sewer flooding in the last ten years. The majority of these incidents were caused by the overloading of the combined surface water and foul drainage systems. The data was provided by postcode area and shows that the majority of the incidents of sewer flooding are clustered in the northern and central parts of Newham – post codes E7 0, E7 8, and E7 9. The areas worst affected are in the Forest Gate and Plashet area. The topography in these areas is generally higher than across the majority of the borough, therefore the incidents are likely a result of undersized, ageing or poorly functioning combined sewers, rather than as a constraint of low-lying ground or a shallow-gradient system.
Although there is a lack of recorded sewer flooding incidents in Canning Town, Custom House and Beckton, the area is particularly low lying and in close proximity to the Thames which may cause the sewer system to back up at high tide. A summary of these incidents are shown in Figure 6.1 (Volume 3).
It is recommended that particular consideration of sewer flooding is made in Forest Gate, Plashet, Canning Town, Custom House and Beckton as part of detailed site-based Flood Risk Assessments. However as it is difficult to draw precise conclusions on the risk of flooding from sewers in Newham at a strategic scale it is recommended that all site based Flood Risk Assessments consider the risk on specific sites. This information can then be used to feed into future updates of the SFRA.

London Borough of Newham SFRA
London Borough of Newham 6-9 May 2010
6.16 Uncertainties in flood risk assessment
Assessing the risk of sewer flooding over a wide area is limited by lack of data and the quality of data that is available. Furthermore, flood events may be a combination of surface water, groundwater and sewer flooding.
An integrated modelling approach is required to assess and identify the potential for sewer flooding but these models are complex and require detailed information. Obtaining this information can be problematic as datasets held by stakeholders are often confidential, contain different levels of detail and may not be complete. Sewer flood models require a greater number of parameters to be input and this increases the uncertainty of the model predictions.
Existing sewer models are generally not capable of predicting flood routing (flood pathways and receptors) in the 'major system' (i.e. the above ground network of flow routes - streams, dry valleys, highways etc).
Use of historic data to estimate the probability of sewer flooding is the most practical approach, however does not take account of possible future changes due to climate or future development.
MANAGING FLOODING FROM LAND, SURFACE WATER AND SEWERS
At present there is no government body with a clear responsibility for managing these three sources of flooding (land, surface water and sewers). As of spring 2006 the Environment Agency assumed a strategic overview role for monitoring flooding from land but the extent and the legislative details remain to be clarified. The Environment Agency and Meteorological Office provide a limited warning service for flooding from land in some areas, and include records of known surface water flooding in the Historic Flood Map. However, flood warning is complicated for this source due to the highly varied, localised and generally short lead in times.
A review of historical maps may provide evidence that a site has experienced flooding problems in the past, and may therefore experience flooding problems in the future. Historical maps may show the presence of springs, areas of bog or marsh or sewer flooding hotspots.
Surface water flooding is often highly localised and complex. Management is therefore highly dependent upon the characteristics of the site. The implications of surface water flooding should be considered and managed through development control and building design.
Possible management and responses to flooding include:
• Major ground works (such as new or improved drainage systems, including drains, dams and embankments).
• Appropriate site selection for developments or re-developments.
• Development zoning including the use of green space and planting to manage runoff (if appropriate).
• Flood proofing of developments (including land raising and raising floor levels) and flood warning.
• Management of development runoff (such as the inclusion of SUDS).
Long-term operation and maintenance requirements and responsibilities are a key consideration. The appropriateness of sustainable drainage techniques (SUDS) should be assessed.
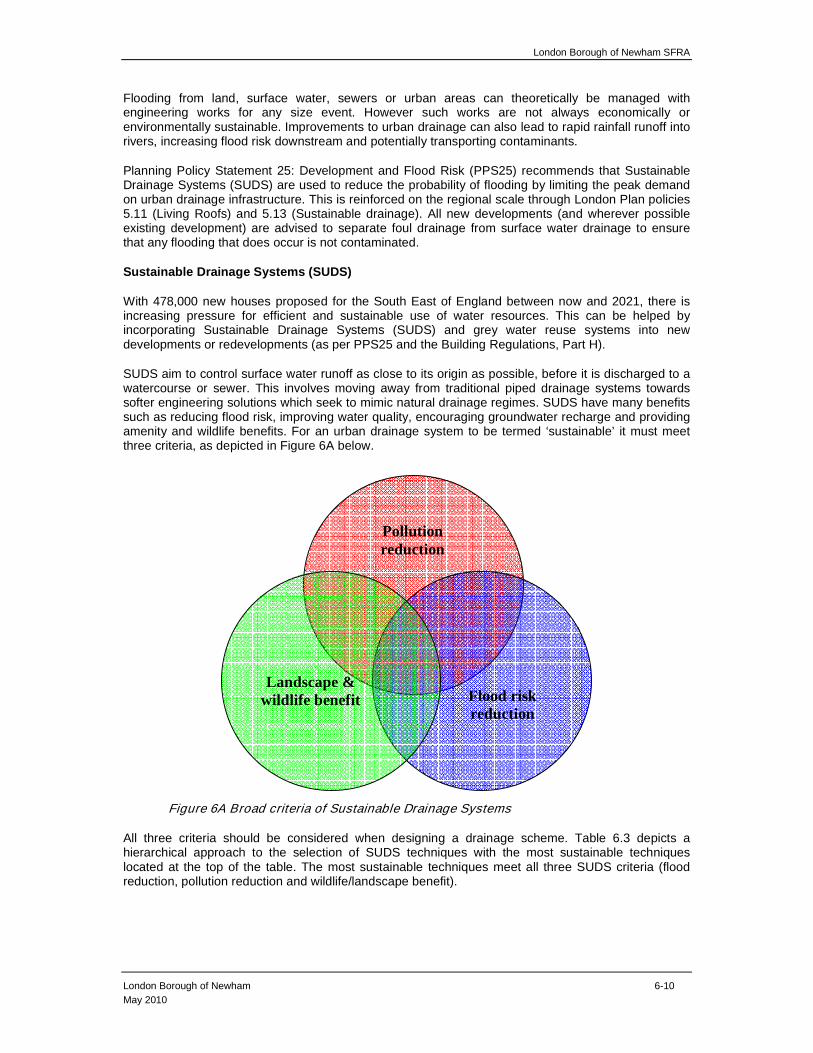
London Borough of Newham SFRA
London Borough of Newham 6-10 May 2010
Flooding from land, surface water, sewers or urban areas can theoretically be managed with engineering works for any size event. However such works are not always economically or environmentally sustainable. Improvements to urban drainage can also lead to rapid rainfall runoff into rivers, increasing flood risk downstream and potentially transporting contaminants.
Planning Policy Statement 25: Development and Flood Risk (PPS25) recommends that Sustainable Drainage Systems (SUDS) are used to reduce the probability of flooding by limiting the peak demand on urban drainage infrastructure. This is reinforced on the regional scale through London Plan policies 5.11 (Living Roofs) and 5.13 (Sustainable drainage). All new developments (and wherever possible existing development) are advised to separate foul drainage from surface water drainage to ensure that any flooding that does occur is not contaminated.
Sustainable Drainage Systems (SUDS)
With 478,000 new houses proposed for the South East of England between now and 2021, there is increasing pressure for efficient and sustainable use of water resources. This can be helped by incorporating Sustainable Drainage Systems (SUDS) and grey water reuse systems into new developments or redevelopments (as per PPS25 and the Building Regulations, Part H).
SUDS aim to control surface water runoff as close to its origin as possible, before it is discharged to a watercourse or sewer. This involves moving away from traditional piped drainage systems towards softer engineering solutions which seek to mimic natural drainage regimes. SUDS have many benefits such as reducing flood risk, improving water quality, encouraging groundwater recharge and providing amenity and wildlife benefits. For an urban drainage system to be termed ‘sustainable’ it must meet three criteria, as depicted in Figure 6A below.
Figure 6A Broad criteria of Sustainable Drainage Systems
All three criteria should be considered when designing a drainage scheme. Table 6.3 depicts a hierarchical approach to the selection of SUDS techniques with the most sustainable techniques located at the top of the table. The most sustainable techniques meet all three SUDS criteria (flood reduction, pollution reduction and wildlife/landscape benefit).
Pollution reduction
Flood risk reduction
Landscape & wildlife benefit

London Borough of Newham SFRA
London Borough of Newham 6-11 May 2010
Where appropriate, surface Water Management Plans (SWMPs) prepared by Newham as part of the Drain London project for critical drainage areas will provide locally specific guidance on the provision of SUDS and on the most cost-beneficial solutions for managing surface water. All probable SUDS options should be explored as part of a site investigation. Before the site layout is decided, it is important that land is first allocated to accommodate these SUDS requirements. A drainage design can be made up of a combination of SUDS techniques. SUDS systems need to be carefully designed to ensure that they provide habitat for flora and fauna as well as reducing flood risk and improving water quality.
Table 6-3 The SUDS hierarchy21
SUDS technique Flood reduction
Pollution reduction
Landscape & wildlife benefit
Most sustainable
Basins and ponds - Constructed wetlands - Balancing ponds - Detention basins - Retention ponds
a a a
Filter strips and swales a a a Infiltration devices
- soakaways - infiltration trenches and basins
a a a
Permeable surfaces and filter drains - gravelled areas - solid paving blocks - porous paving
a a
Least Sustainable
Tanked systems - over-sized pipes/tanks - storms cells
a
Whereas conventional piped networks can be accurately sized using scientific and empirical calculations, SUDS are not so accurate due to the many ‘natural’ variables that exist, such as soil permeability, the effect of vegetation, irregular channel shapes, etc. There are no definitive design codes or standards for SUDS although design guidance is available. CIRIA offers the following design documents:
• C522 – Sustainable Urban Drainage Systems – design manual for England and Wales
• C523 – Sustainable Urban Drainage Systems – best pr actise for England, Scotland, Wales and Northern Ireland
• C609 – Sustainable Drainage Systems – Hydraulic, st ructural and water quality advise
• CIRIA 697 - The SUDS Manual
21 Source: Sustainable Drainage Systems, A Practical Guide (Draft), Environment Agency - Thames Region, October 2006

London Borough of Newham SFRA
London Borough of Newham 6-12 May 2010
The suitability of particular SUDS techniques to a specific development should be assessed on a site-by-site basis. A matrix like the one shown at the end of this chapter (Tables 6-4 and 6-5) is a useful tool in assessing where SUDS could be implemented. The technique assesses the optimum SUDS solution for the area by ranking the local geology, groundwater and contamination risk, topography and land use cover. The matrix acts as a decision framework for choosing the most applicable SUDS option.
Table 6.4 provides a qualitative guide on the relative weighting of the different factors for particular SUDS Groups. For example, geology (5) and groundwater/contamination (4) are relatively more significant factors in the use of infiltration techniques than land cover (2) or site slope (1). Similarly, topography (4) and land use (5) and relatively more significant factors in using wetlands than geology (1) or groundwater (2). Geology and groundwater are factors to be considered in the use of a wetland, but any issues can be ‘engineered out’ (e.g. through use of an impermeable liner) more easily than ‘regrading’ an entire site. Each relative weighting is out of 12.
A specific site can then be ranked on a score from 1-3 for each of the four factors – geology, topography, land use and groundwater/contamination. High values (3) indicate a SUDS solution is particularly well suited to a specific site. Table 6.5 provides a guide on how each factor could be scored. For example, in scoring land use a densely developed site may be given a score of 1 out of 3, whereas a low density development may be scored 3 out of 3 – this would indicate SUDS solutions such as wetlands, or detention basins may be a suitable solution. Multiplying each factor against each weighting in each Group of SUDS can provide a quick indication of the SUDS potential for a site.
This method is useful to carry out a broad scale assessment across Newham, however does not remove the need to consider each site on its own specific conditions. This approach should not be used as a definitive justification for particular SUDS techniques and it is recommended that appropriately qualified drainage engineers are employed to make decisions on drainage on a site specific basis. In general terms the method looks at where SUDS techniques that rely on permeable material will be appropriate and where swales and balancing ponds may be more appropriate to store and manage the controlled discharge of water.
Based on the geology and soils of Newham there are limited areas within the catchment with soils that would be suitable to implement infiltration based SUDS techniques. The gley soils that cover all of Newham are defined by the 1:250,00 Soil Map of England and Wales (Soil Survey of England and Wales) as normally developed within or over permeable materials, that have prominently mottled or uniformly grey subsoils resulting from periodic waterlogging by a fluctuating groundwater table. Gley soils generally develop where drainage is poor, however can include layers of well-draining material (e.g. sands and gravels).
Figures 1.2 and 7.1 in Volume 3 and Figures 7A-D in Section 7 indicate the underlying geology close to the main watercourses of the River Thames and Lea are moderately permeable (with pockets of sands and gravels), which could allow infiltration, although development/redevelopment should, where possible, be located outside the floodplain. Areas where groundwater gley soils have been removed, or are relatively shallow may mean that more permeable underlying geology (e.g. Kempton Park or Taplow Gravel Formations) may be able to be directly infiltrate runoff. Where the geology is less permeable, swales and balancing ponds may be suitable where space is available.
Depth to the water table in Newham varies between 4-6m below ground level close to the River Thames and up to 20m below ground levels in the north of the borough. Groundwater is generally 10-18m below ground level across the majority of the borough. The groundwater table is unlikely to be a significant constraint to infiltration drainage, however perched water tables and the generally waterlogged groundwater gley soils could result in locally higher groundwater.
In addition, the extensive historical industrial land use in Newham has resulted in a legacy of contaminated land. Where contamination occurs in unacceptable concentrations it is likely to preclude the use of infiltration techniques.

London Borough of Newham SFRA
London Borough of Newham 6-13 May 2010
Non infiltration based SUDS techniques are recommended for use across Newham. There is the potential for infiltration to be used and this should be considered on a site-by-site basis informed by site investigation where necessary.
Figure 6B and 6C examples of how the matrix can work to provide initial SUDS guidance for two conceptual sites. The matrix does not consider ‘at source’ SUDS techniques as these will be particular to the site proposals, however should be considered in accordance with London Plan policy. Green (living) roofs are at the top of the sustainability hierarchy for SUDS techniques and are suitable in this area. As well as flood reduction benefits, green (living) roofs also provide pollution control and landscape and wildlife benefits. The attenuation provided by green (living) roofs on redeveloped Brownfield sites has been shown to provide a 40% reduction in surface water runoff. The Environment Agency would like to see runoff from development sites in the Lower Lea Valley (including Newham) restricted to Greenfield runoff rates. The use of green (living) roofs can play a significant role in this management of runoff. Permeable surfaces and filter drains are another non infiltration based SUDS technique that should be considered in all new development in Newham.

London Borough of Newham SFRA
London Borough of Newham 6-14 May 2010
[This page has been left blank to enable double sided printing]

London Borough of Newham SFRA
London Borough of Newham 6-15 May 2010
Table 6-4. Sustainable Drainage Solutions Analysis - Data Set Weighting Criteria
SUDS Solution Data Set
Group Technique Geology Comment
Land Use/
Cover Comment DTM/ Slope Comment
Groundwater/ Contamination
Risk Comment Retention Retention Ponds
and Subsurface Storage
1 In permeable geology a liner (or other impermeable material such as puddled clay) will be required to prevent the pond drying out.
3 Ponds should be located in, or adjacent to, non-intensively managed landscapes where natural sources of native species are likely to be good.
7 Ponds should not be located on steep slopes, or on unstable ground.
1 The soil below a wet pond should be sufficiently impermeable to maintain the water levels within tpermanent pool at the required level, unless a continuous upstream baseflow can be guaranteed.
Wetland Shallow Wetland, Extended Detention Wetland, Pond/Wetland, Pocket Wetland, Submerged Gravel and Wetland Channel
1 In permeable geology a liner (or other impermeable material such as puddled clay) will be required to prevent the wetland drying out.
5 Usually requiring a high land take, the location of a wetland should take account the natural site features that might be used as additional temporary storage when the wetland capacity is exceeded.
4 Wetland basins require a near-zero (almost horizontal) longitudinal slope, which can be provided using embankments.
2 The soil below a wetland should be sufficiently impermeable to maintain wet conditions, unless the wetland intersects with the water table.
Infiltration Infiltration Trench/Basin and Soakaways
5 Infiltration measures are generally appropriate for catchments with small impermeable areas.
2 Infiltration measures should be integrated into the site planning and should take account of the location and use of other site features.
1 Infiltration measures are usually restricted to sites without significant slopes, unless they can be placed parallel to contours.
4 The seasonally high groundwater table must be more than 1m below the base of the facility. Infiltration measures are designed for intermittent flow and should be allowed to drain and re-areate between rainfall events.
Filtration Surface Sand Filter, Sub-surface Filter, Perimeter sand Filter, Bioretention/filter Strips and Filter Trench
5 Filtration measures should not be used to drain hotspot runoff if soils are permeable and groundwater may be put at risk.
2 Filtration measures should be sited next to and alongside its drainage area. They should be integrated with the overall site design and landscaping. However they are not suitable where pedestrian traffic is expected.
2 Site gradients should not exceed 1 in 20 to prevent erosion and channel flows across the filtration measures.
3 The maximum 'length' of impervious area draining to filtration measures should be controlled to reduce risk of 'sheet flows' changing to concentrated flows, although this is dependant on slope.
Detention Detention Basin 1 Geology is not a significant issue in use of detention basins
4 Detention basins should be integrated into the site planning process and take into account the location, use of other site features and undisturbed natural areas.
5 The basin floor should be as level as possible to minimise flow velocities, maximise pollution removal efficiencies and minimise risks of erosion.
2 Groundwater level records should be checked toensure that during periods of high groundwater, the storage capacity of the retention pond is maintained.
Open Channels
Swales 2 Swales are generally appropriate for catchments with small impermeable areas.
4 Swales should be integrated into the site planning and should take account of the location and use of other site features.
4 Swales are usually restricted to sites without significant slopes, though careful planning enable their use in steeper areas by considering the contours of the site.
2 The seasonally high groundwater table must be more than 1m below the base of the facility.

London Borough of Newham SFRA
London Borough of Newham 6-16 May 2010
Table 6-5. Sustainable Drainage Solutions Analysis - Data Set Significance Criteria
SUDS Solution Data Set
Group Technique Geology Comment Land
Use/Cover Comment DTM/Slope Comment
Groundwater/ Contamination
Risk Comment
3 Impermeable Geology would assist retention 1
Low density development and/or
green field development 3
Relatively flat ground levels are advantageous for retention
measures 3 Low groundwater preferable
2
Mildly permeable Geology, which may
require an impermeable
membrane at various locations 2
Urban areas where landscaping/open
space can be multi-functional 2
Ground levels that are a mixture of steep and shallow should
altered to flat gradient for retention measures 2
Fluctuating groundwater levels or moderate contamination may mean additional
remedial work is required
Retention Subsurface Storage 1
Permeable Geology, which would require an
impermeable membrane 3
High density urban or commercial/industrial
environment 1 Steep ground levels are not
advisable for retention measures 1
High groundwater and/or site contamination may mean impermeable membrane is
required
3 1
High density urban or commercial/industrial
environment 3 3
Relatively flat ground levels are advantageous for wetland areas
2 2
Urban areas where landscaping/open
space can be multi-functional 2
Wetland
Ponds, Shallow Wetland, Extended Detention Wetland, Pond/Wetland, Pocket Wetland, Submerged Gravel and Wetland Channel 1
In permeable geology a liner (or other
impermeable material such as puddled clay)
will be required to prevent the wetland
drying out. 3
Low density development and/or
green field development 1
Steep ground levels are not advisable for wetland areas 1
Groundwater not a significant factor, may require liner in contaminated site
1
Low permeability (e.g. clay) means infiltration
is unlikely to be suitable 2
High density urban or commercial/industrial
environment 3 Relatively flat ground levels are
advantageous 1
Permanently high ground water or significant contamination is inadvisable in
locations with infiltration and likely to require significant remedial works
2
Moderate permeability would mean infiltration
may be possible in conjunction with other
techniques 3
Urban areas where landscaping/open
space can be multi-functional 2
Slopes should be kept to a minimum, although ground
contours can be used in locations with significant gradients 2
Varying ground water or contamination 'hot spots' will require monitoring prior to
decision on using infiltration
Infiltration
Infiltration Trench/Basin and Soakaways 3
Permeable geology required for infiltration
measures 3
Low density development and/or
green field development 2
Steep ground levels are not advisable for infiltration basins or trenches, but may be designed
out in soakaways 3 Permanently low ground water is preferable
in locations with infiltration
3
Impermeable Geology, which would assist filtration measures 1
High density urban or commercial/industrial
environment 3
Relatively flat ground levels are advantageous for retention
measures and to keep sheet flow to a minimum 3
High groundwater and/or site contamination may mean filtration will mobilise
contaminants
2
Mildly permeable Geology, which may
require an impermeable
membrane at various locations 3
Urban areas where landscaping/open
space can be multi-functional 2
Slopes should be kept to a minimum, although ground
contours can be used in locations with significant gradients 2
Varying ground water or contamination 'hot spots' mean filtration locations will have to
be carefully selected
Filtration
Surface Sand Filter, Sub-surface Filter, Perimeter sand Filter, Bioretention/filter Strips and Filter Trench 1
Permeable Geology, which would require an
impermeable membrane 3
Low density development and/or
green field development 1
Steep ground levels are not advisable for retention measures
and limited filtration will be possible on steep slopes 1
High groundwater and/or site contamination may mean filtration will mobilise
contaminants Detention Detention Basin 1 Geology is not
1 High density urban or 3 A virtually flat gradient is essential 3 Low groundwater preferable

London Borough of Newham SFRA
London Borough of Newham 6-17 May 2010
SUDS Solution Data Set
Group Technique Geology Comment Land
Use/Cover Comment DTM/Slope Comment
Groundwater/ Contamination
Risk Comment commercial/industrial
environment
3
Urban areas where landscaping/open
space can be multi-functional 2
Ground levels that are a mixture of steep and shallow should be
altered to flat gradient for detention measures 2
Fluctuating groundwater levels or moderate contamination may mean additional
remedial work is required
considered a significant issue 3
Low density development and/or
green field development 1
Steep ground levels are not advisable for detention measures 1
High groundwater and/or site contamination may mean impermeable membrane is
required
1
Large impermeable areas should be
avoided 2
High density urban or commercial/industrial
environment 3 Relatively flat ground levels are
advantageous for swales 3 Low groundwater preferable
2
A 50/50 split in geological permeability would be acceptable if this was the deciding
factor 3
Urban areas where landscaping/open
space can be multi-functional 2
Slopes should be kept to a minimum, although ground
contours can be used in locations with significant gradients 2
Fluctuating groundwater levels or moderate contamination may mean additional
remedial work is required
Open Channels Swales 3
Large areas of permeable geology
would be advantageous 3
Low density development and/or
green field development 1
Steep ground levels should be avoided, however 'check dams' may be able to be used to slow
flow 1
High groundwater and/or site contamination may mean impermeable membrane is
required

London Borough of Newham SFRA
London Borough of Newham 6-18 May 2010
[This page has been left blank to enable double sided printing]

London Borough of Newham SFRA
London Borough of Newham 6-19 May 2010
Figure 6A – Example 1 Application of SUDS Matrix
Site A – Large site proposed for mixed use development, not particularly high density. Underlain by clay soils, but with low groundwater. Some ‘hot spot’ contamination. Generally flat topography.
Geology Score = 1
Land Use Score = 2
Topography Score = 3
Groundwater/Contamination Score = 2
Retention
Wetlands
Infiltration
Filtration
Detention
Open channels
Overall Score
83%
75%
56%
58%
78%
72%
Retention, wetlands and detention basins should be considered, along with the use of swales. Infiltration unlikely to be suitable. Further investigation of contamination likely to be required. Consider source control measures (e.g. green roofs)
Initial Guidance
Multiple Score by Weighting

London Borough of Newham SFRA
London Borough of Newham 6-20 May 2010
Figure 6B – Example 2 Application of SUDS Matrix
6.17 Planning considerations
The Environment Agency Flood Map does not include flooding from land, surface water or sewers. The Flood Zones cover only river and sea flooding but PPS25 requires that consideration be given to other forms of flooding during the decision making process. PPS25 requires that decision makers use the SFRA to inform their knowledge of flooding. The SFRA refines the information on the Flood Map and determines the variations in flood risk from all sources of flooding across the area. The information then forms the basis for preparing appropriate policies for flood risk management for these areas. PPS25 states that local planning authority should further the use of SUDS by, amongst other things, adopting 'policies for incorporating SUDS requirements in local development documents’.
Where appropriate, Thames Water should be consulted as early as possible in the formulation of development proposals to determine the available sewerage capacity, in particular as new legislation may remove the automatic right to connect to the network.
Assessments of flooding from land, surface water and sewers are therefore needed. A probabilistic approach to the assessment of surface water flooding requires an understanding of hydrological and hydraulic processes. These processes are highly variable at the local scale and cannot meaningfully be performed at a strategic level. Thus the assessment should be undertaken using site and upstream catchment characteristics and historic incidents of flooding.
Site B – Small site proposed for high density development. Underlain by semi-permeable soils and low groundwater. Moderate slope across the site.
Geology Score = 2
Land Use Score = 1
Topography Score = 2
Groundwater/Contamination Score = 3
Retention
Wetlands
Infiltration
Filtration
Detention
Open channels
Overall Score
61%
58%
72%
69%
61%
61%
Infiltration and filtration potential on site. Consider site testing. Retention and wetland unlikely to be suitable based on site area and density. Consider source control measures (e.g. green roofs)
Initial Guidance
Multiple Score by Weighting

London Borough of Newham SFRA
London Borough of Newham 6-21 May 2010
Box 1. Surface Water Management Plans: purposes and outcom es (from PPS 25: Practice Guide, paragraphs 5.37 and 5.38) Defra’s Water Strategy identifies the key purposes of a SWMP as:
• Ensuring that allocations within an area are properly supported by adequate surface water management;
• Providing a common framework for stakeholders to agree responsibilities for tackling existing drainage problems and preventing future problems;
• Where development pressures are high it can be part of a Water Cycle Strategy; and • Demonstrating how capital investment, infrastructure and maintenance can deliver the
required surface water management. It is envisaged that SWMPs should:
• Be developed in a partnership of all relevant stakeholders for surface water management in which all data is shared and responsibilities are clarified;
• Map and quantify current and future surface water flood risks which will apply to existing as well as new development;
• Influence planning policy so that new development is directed away from areas of high surface water flood risk (sequential approach, PPS 25 paragraphs 14 and 15), or to ensure that flood risk can be managed effectively) making development without increasing flood risk and where possible reducing it overall (PPS 25, paragraph 5);
• Masterplan the provision of drainage for new development e.g. through planning of strategic SUDS or similar;
• Contain a prioritised delivery plan that comprises a coordinated series of investments in infrastructure (or operations and maintenance) that can be proven to be the most cost beneficial means of reducing flood risk for new and existing development; and
• Be reviewed periodically to update delivery plans in the light of new or improved information.
The Government’s Water Strategy ‘Future Water’ (Defra 2008) considers the use of Surface Water Management Plans (SWMPs) as a mechanism for developing a strategic approach to the management of surface water and reducing flood risk as part of the planning process. The aim of SWMPs, highlighted in Chapter 5 of the PPS 25 Practice Guide, is to deliver cost-beneficial solutions for the areas at greatest risk of surface water flooding. After identifying critical drainage areas the Drain London SWMPs will be informed by SFRAs and CFMPs and will inform the LDF Core Strategy. The Drain London SWMPs will also be used to influence the location and design of new development, emergency planning and future investment. Guidance in the PPS 25 Practice Guide explains what SWMPs should do and is reproduced in Box 1 below.
As well as informing land use planning, flooding should be managed through the flood risk assessment process. Further collation of relevant data is required, such as land use, runoff rates, existing drainage systems, past events and consultation with relevant bodies. Specific factors that should be considered when undertaking a flood risk assessment include:
• Areas liable to flooding (based on site and catchment characteristics).
• The extent, standard and effectiveness of existing drainage systems.
• The likely runoff rates.
• The likely impacts to other areas (such as increases in surface water runoff rates).
• The likely extent, depth and velocity of flooding.
• The effects of climate change.
• The suitability of different sustainable drainage system options.

London Borough of Newham SFRA
London Borough of Newham 6-22 May 2010
• Capacity of the existing drainage system.
• Increase in surface water runoff rates.
• Effects of climate change.
• Suitable sustainable drainage systems.
It must be recognised that many of the typical approaches to SUDS will not work in low-lying areas, which suffer from high groundwater levels or seasonally waterlogged soils. This should be considered in Newham when assessing drainage proposals as part of planning applications as some areas are particularly susceptible to this type of situation.
6.18 References
Defra 2006 (2006a) 'Flooding from other sources' Technical report HA4a, prepared by Jacobs, November 2006
Communities and Local Government (2006) 'Planning Policy Statement 25: Development and Flood Risk' Published in December 2006
Communities and Local Government (2008) PPS 25: Practice Guide, June 2008

London Borough of Newham SFRA
London Borough of Newham 7-1 May 2010
7 Groundwater Flooding 7.1 Description
Groundwater flooding is caused by the emergence of water originating from sub-surface permeable strata. A groundwater flood event results from a rise in groundwater level sufficient for the water table to intersect the ground surface and inundate low lying land. Groundwater floods may emerge from either point or diffuse locations. They tend to be long in duration developing over weeks or months and prevailing for days or weeks.
There are many mechanisms associated with groundwater flooding, which are linked to high groundwater levels, and can be broadly classified as:
• Direct contribution to channel flow.
• Springs erupting at the surface.
• Inundation of drainage infrastructure.
• Inundation of low-lying property (basements).
Groundwater levels rise and fall in response to rainfall patterns and distribution, with a time scale of months rather than days. The significance of this rise and fall for flooding, depends largely on the type of rock it occurs in, i.e. how permeable to water the rock is, and whether the water level comes close to or meets the ground surface.
Groundwater flood events have been recorded in various aquifer units (including Cretaceous Chalk, Limestones, river terrace gravels). Compared to other aquifer units, Chalk is more vulnerable to groundwater flooding because of its geological formation (chalk geology is located in Newham near the River Thames – refer Figure 7A). It contains many pores and fissures which can result in rapid rises in groundwater levels, which take a long time to recede.
The primary control on the distribution and timing of groundwater flooding include:
• Spatial and temporal distribution of rainfall.
• Spatial distribution of aquifer properties.
• Recharge mechanisms.
• Spatial distribution of geological structures (drift deposits, stratigraphy).
• Efficiency of the surface drainage network.
The likelihood of an area experiencing groundwater flooding can largely be determined on a broad scale through an analysis of the previous meteorological conditions and geological knowledge. This can be helped by the analysis of groundwater boreholes and historic information.
7.2 Causes of high groundwater levels
High groundwater levels can result from the combination of geological, hydrogeological, topographic and recharge phenomena and can mostly be associated with the seven mechanisms described in Table 7-1. Each has been described using the source-pathway-receptor model.

London Borough of Newham SFRA
London Borough of Newham 7-2 May 2010
[This page has been left blank to enable double sided printing]

London Borough of Newham SFRA
London Borough of Newham 7-3 May 2010
Table 7-1 Groundwater mechanisms and processes
Flooding phenomenon Sources Pathways Receptors Hazard Characteristics
Rising groundwater levels in response to prolonged extreme rainfall (often near or beyond the head of ephemeral streams)
Long duration rainfall
Permeable geology, mainly chalk
People, properties, environment
Basement flooding/rural ponding
Responsible for the large majority of groundwater flooding.
May occur a few days after the rainfall or up to several weeks after. Usually lasts for a number of weeks.
An increase in the baseflow of channels, which drain aquifers, is often associated with elevated groundwater levels and may lead to an exceedence of the carrying capacity of these channels.
Floodwaters are most often clear and so this form of groundwater flooding may be referred to as 'clear water flooding'.
High groundwater levels may also inundate sewer and storm water drainage networks, exceed capacity and lead to flooding in locations, which would otherwise be unaffected. This flooding can be associated with pollution.
Rising groundwater levels due to leaking sewers, drains and water supply mains
Water in water mains, drainage and sewerage networks
Cracks in pipes/permeable strata
People, properties, environment
Basement flooding/water quality issues
Leakage from sewer, storm water and water supply networks can lead to a highly localised elevation in groundwater levels, particularly where the leak is closely associated with chalk bedrock.
Increased groundwater levels due to artificial obstructions
Groundwater Permeable near surface geology e.g. gravels
Property, environment
Basement flooding/routing of floodwaters
Structures such as building foundations can present an impermeable barrier to groundwater flow causing localised backing up or diversion of groundwater flow.
Groundwater rebound owing to rising water table and failed or ceased pumping
Groundwater
Permeable geology and artificial pathways e.g. adits
Property, commercial
Basement flooding/flooding of underground infrastructure
Where historic heavy abstraction of groundwater for industrial purposes has ceased, a return of groundwater levels to their natural state can lead to groundwater flooding.
This process can potentially cover large areas or maybe associated

London Borough of Newham SFRA
London Borough of Newham 7-4 May 2010
with local abstraction points.
Upward leakage of groundwater driven by artesian head
Groundwater emerging from boreholes or through permeable geology
Artesian aquifer and connection to surface
Property Basement flooding/flooding at surface
Mainly associated with short duration and localised events this process can lead to significant volumes of discharge.
It can occur in locations where boreholes have been drilled through a confining layer of clay to reach the underlying aquifer.
Inundation of trenches intercepting high groundwater levels
Groundwater Permeable geology Property
Routing of floodwaters
The excavation and fill of engineering works with permeable material can create groundwater flow paths.
High groundwater levels maybe intercepted, resulting in flooding of trenches and land to which they drain.
Other – alluvial aquifers, aquifer, sea level rise
Rivers, rainfall, sea
Floodplain gravels, permeable geology
Property, environment
Basement flooding/flooding at surface/saline intrusion.
Other mechanisms of groundwater flooding include leakage of fluvial flood waters through river gravels to surrounding floodplains e.g. behind flood defences; and a rise in groundwater levels as a result of adjacent sea level rise as a result of the discharge boundary rising.

London Borough of Newham SFRA
London Borough of Newham 7-5 May 2010
For the purposes of the SFRA it is appropriate to consider the geographical scale, social and economic cost and certainty of prediction when considering groundwater flood risk. Of the groundwater flooding mechanisms experienced in the SFRA study area, rising groundwater levels in major aquifers as a result of long duration rainfall presents the most extensive level of risk. However impacts of the other forms of groundwater flooding are considered, although they cannot be easily identified at the strategic level. Although the hazard associated with other forms of groundwater flooding can be notable, these are commonly localised and very difficult to identify.
7.3 Impacts of groundwater flooding
The main impacts of groundwater flooding are:
• Flooding of basements of buildings below ground level – in the mildest case this may involve seepage of small volumes through walls, temporary loss of services etc. In more extreme cases larger volumes may lead to the catastrophic loss of stored items and failure of structural integrity.
• Overflowing of sewers and drains – surcharging of drainage networks can lead to overland flows causing significant but localised damage to property. Sewer surcharging can lead to inundation of property by polluted water. Note: it is complex to separate this flooding from other sources, notably surface water or sewer flooding.
• Flooding of buried services or other assets below ground level – prolonged inundation of buried services can lead to interruption and disruption of supply.
• Inundation of roads, commercial, residential and amenity areas – inundation of grassed areas can be inconvenient, however the inundation of hard-standing areas can lead to structural damage and the disruption of commercial activity. Inundation of agricultural land for long durations can have financial consequences.
• Flooding of ground floors of buildings above ground level – can be disruptive, and may result in structural damage. The long duration of flooding can outweigh the lead time which would otherwise reduce the overall level of damages.
Additionally groundwater flooding can cause a change in the structural properties of clay overlying chalk aquifers. This may cause costly damage to structures in the ground and the buildings that they support.
Groundwater flooding has always occurred. It generally occurs more slowly than river flooding and in specific locations. The rarity of groundwater flooding combined with the mobility of the population means that people often do not know there is a groundwater flood risk.
New developments are particularly at risk because little consideration is given to groundwater as a source of flooding in the planning process. The sparse frequency of groundwater flood events can contribute to poor decision-making. The economic and social costs of groundwater flooding are compounded by the relative long duration of events.
The nature and occurrence of groundwater flooding in England is highly variable. 1.7 million properties are vulnerable to groundwater flooding in England (Jacobs 2006). The occurrence of groundwater flooding is very local and often results from the interaction of very site specific factors, e.g. aquifer properties, topography, man made structures etc.
In general terms groundwater flooding rarely poses a risk to life. However groundwater flooding can be associated with significant damage to property.

London Borough of Newham SFRA
London Borough of Newham 7-6 May 2010
7.4 Data collection
Sources of data
Data collected to assess flooding from land included geology, soil, aquifer, Groundwater Emergence Mapping, and digital terrain data. Historic records of flooding were provided by the Environment Agency.
Record of Historic Flood Events
The Environment Agency maintains a record of flooding incidents that are reported to them, that are not considered to be a result of direct river flooding. This includes incidents of groundwater flooding, and the data provided by the EA indicate that a total of ten incidents of groundwater flooding were reported to have occurred within the London Borough of Newham between January 2003 and June 2006 (Figure 7.1 in Volume 3).
The records of historic flooding available from Thames Water do not contain any flooding incidents related to groundwater. The lack of historic records however does not prove that there have not been other incidents of groundwater flooding in Newham, only that such events have not been recorded or have not been attributed to groundwater.
Topography, geology, soils and groundwater flooding
The majority of groundwater in London lies within a deep chalk aquifer, which forms part of the ‘London Basin’. The basin is so called due to its bowl like formation. The chalk which is deep beneath the centre of London, outcrops (comes to the surface) to form the edges of the basin and a more hilly topography both to the north in the Chilterns, and to the south in the North Downs. London Clay, River Terrace Gravels, sands and silts overlie the centre of this bowl.
The solid geology of the London Basin is mostly London Clay which is up to 80m thick and which confines the chalk aquifer. London Clay is observed across most of Newham with the exception of Bexton and the majority of the Royal Docks area where the solid geology is exposure of layers of the Lambeth Group (sand, silts and clay) and the Thanet Sand formation (sands and gravels), and a limited area of exposure of the underlying chalk in the south east corner of the Royal Docks and North Woolwich. There are also areas of Lambeth Group under Stratford and Forest Gate in the north of the borough. This can be seen in the solid geology mapping of London provided by the EA as a GIS layer for use in this assessment (Table 7.2 and Figure 7A).
Overlaying the solid geology, the drift geology maps (see Table 7.2 and Figure 7B) indicate that the Lambeth Group and London Clay in the northern portion of the borough (higher ground) is overlain by gravels (Taplow and Kempton), whereas the solid geology in the south of the borough – the historic floodplains of the Thames, River Lea and River Roding - are predominantly overlain by tidal river or creek deposits (silts).
Newham is underlain by two distinct aquifers (Figure 7C). First is the aforementioned deep chalk aquifer (Major Aquifer). The second is a shallow aquifer within the River Terrace Gravels (Minor Aquifer), which overlies the London Clay formation. The depth to the aquifers range from 4-6m close to the River Thames, up to 20m below ground level in the north of the borough (Figure 7D).
Historically groundwater from the north-west and south-west of London would have flowed towards the central London basin, naturally discharging through the chalk outcrops near to the River Thames in Hackney and in the Lea Valley. This natural path of groundwater flow has been modified over time by development in the city.
The soil map provided by the EA for use in this assessment indicates that the main soil type in Newham and across central and eastern London is that of Groundwater Gley soils. Soil

London Borough of Newham SFRA
London Borough of Newham 7-7 May 2010
data has not been mapped in this SFRA as the data provided indicates the soil type is consistent across Newham. Groundwater gley soils are typically grey in colour and may be mottled. This colour is due to the reduction of ferric iron compounds to form ferrous iron compounds in low oxygen environments. Groundwater gley soils are seasonally waterlogged due to high groundwater levels and are therefore typically found in low lying areas adjacent to rivers or in local depressions.
Abstraction from the deep chalk aquifer during the industrial 19th century resulted in a draw down of groundwater levels. However in the later half of the 20th century abstractions reduced and the water level began to rebound. The rise in groundwater within the chalk aquifer presented a potential problem for structures and buildings with foundations within the London clay. The General Aquifer Research, Development and Investigation team was appointed by a group of stakeholders to monitor and study the problem. The team made a number of recommendations and through increased abstraction of the groundwater, notably by Thames Water, groundwater levels are now relatively stable and the Environment Agency is maintaining a regular monitoring regime.
The risk from the deep basin chalk aquifer is being managed on a strategic level and is therefore considered low. However the risk from groundwater within the drift deposits also needs consideration and is the focus of the remainder of this chapter.
7.5 Methods for assessing flood risk
Identifying groundwater flood risk
No single government body is responsible for monitoring or responding to groundwater flooding. Defra’s Making Space for Water Strategy (MSW) aims to provide greater clarity for the public and professional bodies impacted by and involved in the management of flooding. MSW recognises the need for an integrated understanding of flooding from all sources including groundwater.
As a consequence Defra have instigated a series of investigations into groundwater flooding such as:
• HA5 Groundwater Flooding Records Collation, Monitoring and Risk Assessment, March 2006 - aims to make recommendations for effective collation and monitoring of groundwater flooding information and identify organisational and funding arrangements required to implement this. It has identified that a national database for groundwater flooding is desirable and that scientific research into improving the understanding of groundwater flood processes is required.
• HA4a Flooding from Other Sources, November 2006 - aims to assess the feasibility of mapping flood risk from different types of flooding (including groundwater), together with the practicalities of implementing flood modelling methods considered for the significant types of flooding (including groundwater flooding). It has identified that the greatest barrier to producing accurate flood risk maps of other sources of flooding is the availability of data for ground-truthing in consistent and useable formats. Furthermore, the modelling methods that would be required to capture all the observed processes are complex and may not be realistic in the immediate future
Although there is a general understanding of the causes of groundwater flooding, the location, timing and extent is difficult to predict because of the localised nature of drivers of groundwater flooding and lack of available datasets.
Predicting groundwater flooding
The estimation of annual exceedance probability (AEP) for groundwater flooding is complicated due to the various factors which influence groundwater levels. Studies therefore tend to present the incidents of high groundwater levels or flooding, rather than frequency

London Borough of Newham SFRA
London Borough of Newham 7-8 May 2010
analyses. There have been a number of approaches adopted for the prediction of groundwater flooding including:
• Determining the depth of the water table using regional groundwater levels and topographic models (Jackson 2004). Estimate level of risk based on the depth to the water table.
• Production of groundwater emergence maps (GEMs) using historical datasets and predictive techniques (Jacobs 2004). Maps for England were produced using observations of groundwater flooding in 2000/1. Where insufficient observations existed, representative rises in groundwater levels were mapped and used to determine locations where the water table would have neared the ground surface during this period. Note: the resulting maps provide an indication of where groundwater may emerge not where groundwater flooding might occur.
• Simple mass balance spreadsheet models which relate rainfall to groundwater levels. These models predict the emergence of groundwater at different spring line elevations based on different rainfall conditions. Regional numerical groundwater models may also be used although these are often calibrated against periods of low groundwater levels for abstraction management, reducing the applicability for flood prediction.
• GIS analysis of spatial datasets to determine areas more likely to be at risk of groundwater flooding. This was the method adopted in the SFRA.
7.6 Methods used in the SFRA
Overlaying GIS datasets can produce a better understanding of groundwater emergence and therefore an indicative overview of groundwater flood risk. Initially historic groundwater flooding data was collated and analysed. However there were few records of flooding from groundwater as discussed previously.
An analysis of physical, hydrological and environmental spatial data sets within a Geographical Information System (GIS) platform was undertaken for the SFRA. The analysis allowed areas that had not previously been identified, but had a greater likelihood of experiencing groundwater flooding, to be identified. This analysis permits identification of areas which are considered to be at a relatively high, medium and low risk of groundwater flooding. This analysis does not indicate the absolute risk of groundwater flooding but highlights areas which may be considered to be at medium or high risk of groundwater flooding, and which may require further investigation on a site specific scale.
The first stage of the spatial analysis was to identify drivers of groundwater flooding for which GIS datasets were available. These were identified as:
• Base Geology
• Drift Geology
• Aquifer/Groundwater Vulnerability
• DTM
• Soils
Datasets for each driver were collected and assembled in a GIS platform. Table 7.2 indicates the sources of data used in the GIS assessment. A full list of all data used in this SFRA is included in Chapter 6 of Volume 1 of this SFRA, Tables 6.1 and 6.2 in Volume 1 of the SFRA show the source and ownership of all data used in this SFRA.

London Borough of Newham SFRA
London Borough of Newham 7-9 May 2010
Table 7.2. Sources of data used in GIS based assess ment of risk of flooding from groundwater.
Driver of flooding Data set used Source of data
Base geology Solid geology GIS data set for London. The GIS layer provided indicated the classification of the solid geology including rock type and the names given to local formations.
Environment Agency
(Geology_Solid.shp)
Drift geology Drift geology GIS data set for London. The GIS layer provided included a classification of the types of drift material overlying the solid geology. The information in the GIS data set included the type of drift material and the names given to local deposits.
Environment Agency
(Geology_drift.shp)
Aquifer / groundwater vulnerability
The Aquifers GIS layer provided indicated the presence of underlying aquifers and the classification by the Environment Agency as major or minor aquifers.
(The predictive GEM map was also provided by the EA for use in this SFRA. This is reviewed in the results section of this assessment but was not included in the GIS based spatial analysis).
Environment Agency
(Aquifers.shp)
Depth to groundwater The Depth to Groundwater layer provides an indication of the level of the groundwater table below the ground surface in Newham.
Environment Agency
(Newham_Depth_to_ Groundwater.shp)
DTM A LiDAR DTM was used to represent the ‘bare earth’ ground surface. Buildings and other features were removed through the LiDAR filtering process.
Environment Agency
Soils A GIS layer showing the main soil types across London was used. This layer showed a classification of soil types and a brief description of the soil characteristics.
Environment Agency (Soil.shp)
The soils layer provided by the EA for use in this assessment showed that groundwater gleys were the dominant soil type across all of Newham. There were no variations in soil type across the borough which could be considered to drive differing levels of relative risk of groundwater flooding. Consequently, the soils layer was not incorporated into the GIS analysis.

London Borough of Newham SFRA
London Borough of Newham 7-10 May 2010
The aquifer layer provided by the EA showed areas considered to be underlain by a minor aquifer and this covered most of Newham apart from a limited area around North Woolwich where the underlying chalk is exposed. The presence of the minor aquifer was considered to be a driver of relatively high risk of groundwater flooding in this GIS spatial analysis. This area is also subject to relatively shallow groundwater table (4-6m below ground level), compared to the rest of the borough. It must also be noted that all of Newham is underlain by the London basin chalk aquifer and that this layer only indicates the presence of minor aquifers (in the overlying sands and gravels).
The base and drift geology layers were also used in the GIS spatial analysis technique in this SFRA. The tidal river or creek deposits were considered less likely to be a driver of groundwater flooding than the sands and gravels and alluvium silts indicated on the drift geology mapping. Using the solid geology mapping the risk of groundwater flooding was considered to be highest on the Chalk and Thanet Sands formation in the south and lowest in the London Clay. The Lambeth Group of sandstones and mudstones was considered to be a medium risk driver of groundwater flooding.
Using the information provided in the data sets described in Table 7.2, three new GIS layers were created, one for each of the three key drivers of groundwater flooding in Newham: aquifers; solid geology and drift geology. These layers showed indicative areas of high, medium and low likelihood of groundwater flooding based on each driver. For example, sand and gravel areas were assigned a value of 3 (high likelihood of driving groundwater flooding) whereas areas of clay geology were assigned a value of 1 (low likelihood of driving groundwater flooding). Areas overlying a known aquifer were assigned a value of 3, representing a high likelihood of driving groundwater flooding.
The likelihood of groundwater flooding was then assessed on a strategic scale by combining the three GIS layers. This assessment was based on a grid of 25m cells across Newham. In each cell, the three data sets were interrogated to provide a combined value indicating the likelihood of groundwater flooding by summing the values assigned for each of the three key drivers. In this way a cell could have a combined value of between 3 and 9, with higher numbers indicating a higher probability of groundwater flooding. This information was then contoured within the GIS platform to create a layer showing areas with a high, medium, or low likelihood of flooding from groundwater. This final assessment of risk is shown in Figure 7.1 in Volume 3 of this SFRA and Figures 7A to 7C at the end of this chapter show the layers used within this assessment.
This GIS based analysis was based on three of the key drivers of groundwater flooding listed in Table 7.2. When reviewing the results of this GIS analysis there are other drivers of groundwater flooding which should also be considered. These additional drivers were not used in the GIS based analysis because strategic scale quantitative datasets were not available. These additional drivers of groundwater flooding include:
• Observed groundwater levels;
• Historic water courses; and
• Proximity to local watercourses (where groundwater may be shallower).
These additional drivers have been reviewed alongside the map produced from the GIS spatial analysis (Figure 7.1) and the results are discussed later in this chapter. The results of the GIS analyses were also sensibility checked against the record of historic groundwater flooding incidents provided by the Environment Agency and some broad conclusions were drawn.
7.7 Climate change
There is currently no research specifically considering the impact of climate change on groundwater flooding. The mechanisms of flooding from aquifers are unlikely to be affected by

London Borough of Newham SFRA
London Borough of Newham 7-11 May 2010
climate change, however if winter rainfall becomes more frequent and heavier, groundwater levels may increase. Higher winter recharge may however be balanced by lower recharge during the predicted hotter and drier summers.
7.8 Results
The risk of groundwater flooding from the deep basin chalk aquifer is being managed on a strategic level and is generally considered to be low. The potential for groundwater emergence within the drift deposits has been considered based on spatial and temporal analysis of the groundwater datasets (see below). In general terms groundwater flooding is more likely to occur:
• after above average rainfall (and recharge), causing groundwater levels to rise; and
• in areas where there is insufficient surface drainage;
Local controls which appear to affect the distribution of groundwater flooding include the:
• spatial and temporal distribution of rainfall;
• spatial distribution of aquifer properties (geological structures and drift deposits);
• recharge mechanisms; and
• efficiency of the surface water and groundwater drainage network.
The areas that may be susceptible to groundwater flooding in Newham are shown in Figure 7.1 (Volume 3) together with historic records of flooding which have been identified as related to groundwater.
There are few areas within Newham where the risk of groundwater flooding is assessed as low, with the majority of the borough shown at medium risk of groundwater flooding, indicating a potential risk of groundwater emerging due to geology, soils, elevation and the presence of shallow aquifers. Two areas have been identified as at high risk of groundwater flooding – parts of Stratford and Forest Gate, predominantly a result of the underlying gravels; and Silvertown and North Woolwich, predominantly as a result of the shallow groundwater associated with the major aquifer. Most at risk will be deep foundations, basements and underground infrastructure. A number of recorded incidents of groundwater flooding in Newham support the potentially high and medium risk area around Forest Gate and the gravel geology of the higher ground in the borough (refer Figure 7.1). This analysis was restricted to the boundaries of Newham and does not cover the locations of other, nearby, records of groundwater flooding.
Review of additional drivers for groundwater flooding generally supports the spatial analysis undertaken. However does provide some additional areas of potential risk that may require further investigation on the development scale (groundwater emergence mapping near the River Roding).
The Environment Agency 2008 annual report on the management of the chalk aquifer in London indicates that groundwater levels in Newham vary between 0 and -20m AOD. Major aquifer groundwater levels in 2008 were highest in the Silvertown and North Woolwich area where levels are approximately -3m AOD (Victoria Docks observational borehole) and 1mAOD (North Woolwich observational borehole) – similar to the surrounding ground levels and supporting the classification of this area as potentially high risk. Groundwater levels are lowest in the north of Newham where levels are approximately -10 to -15m AOD, where gravels (minor aquifer) overlay the chalk aquifer.

London Borough of Newham SFRA
London Borough of Newham 7-12 May 2010
The historic record of groundwater levels in London is discussed earlier in this chapter. The EA annual report shows the variation in groundwater levels between 2007 and 2008 and between 2000 and 2008. The maps included in the EA annual monitoring report indicate that between 2000 and 2008 there has been a fall in groundwater levels across Newham (-2 to -6m), most significantly in the east near the River Roding. In the north and west of Newham the fall in groundwater levels is less significant. The change in groundwater levels over this period is far greater to the south of the River Thames than in Newham.
Figure 7.1 shows that most of Newham is considered to be at a medium risk of groundwater flooding. If groundwater levels continue to fall, in particular around the Royal Docks and North Woolwich, the boundary of high and medium risk may change. There are five observation boreholes in Newham that can be used by the EA for monitoring the groundwater levels in the aquifer in this area. The 2008 annual monitoring report indicates that where redevelopment or ground investigations offer the opportunity of monitoring one-off or short-term ground levels, these opportunities should be taken and the EA will use the results where possible.
The Predictive Groundwater Emergence Map of London provided by the Environment Agency for use in this assessment indicates three areas of potential groundwater emergence in Newham. Groundwater emergence in Forest Gate and Stratford correlates well with the areas indicated at high risk in the SFRA. Groundwater emergence in the east of Newham has been linked to the boundary of the alluvium deposits of the River Roding, however is restricted by the Northern Outfall Sewer route. The location of the emergence points cannot be accurately located. Groundwater can often emerge over a large or diffuse area, but can also emerge at single points. Therefore it is only possible to identify a broad area over which emergence may occur.
It should be noted that this assessment is broad scale and does not provided a detailed analysis of groundwater, it only aims to provide an indication of where more detailed consideration of the risks may be required. This assessment was undertaken at a borough wide scale using available information from the Environment Agency and other sources. The extent and scale of this assessment is considered appropriate for a SFRA. Historic records of groundwater flooding were provided by the EA. Other sources of historic flooding records were investigated (see above) but did not show any further incidents of groundwater flooding in Newham. This assessment can be updated in the future if further data or records become available.
This broad scale analysis has identified areas where there is a low and medium risk of groundwater flooding. Consideration should be given to the potential for groundwater flooding in all site specific Flood Risk Assessment in Newham. A more detailed assessment of the risk from groundwater flooding should be made in areas identified by this SFRA as being at a high risk of groundwater flooding.
7.9 Uncertainties in flood risk assessment
The spatial analysis undertaken in the SFRA is highly qualitative. The maps do not indicate specific areas that will flood, but instead indicate areas where the risk of emergence may be relatively higher and therefore further analysis is recommended. Local factors that cannot be assessed without more reliable quantitative data can affect groundwater and the potential for emergence.
The causes of groundwater flooding are generally understood. However groundwater flooding is dependent on local variations in topography, geology and soils. It is difficult to predict the actual location, timing and extent of groundwater flooding without comprehensive datasets.
There is a lack of reliable measured datasets to undertake flood frequency analysis and even with datasets this analysis is complicated due to the non-independence of groundwater level data. Studies therefore tend to analyse historic flooding which means that it is difficult to assign a level of certainty.

London Borough of Newham SFRA
London Borough of Newham 7-13 May 2010
The impact of climate change on groundwater levels is highly uncertain. More winter rainfall may increase the frequency of groundwater flooding incidents, but drier summers and lower recharge of aquifers may counteract this
7.10 Management of groundwater flooding
At present there is no government body with a clear responsibility for groundwater flooding, having a statutory obligation for measuring and reporting events or providing advice and affording protection to those at risk. As of spring 2006 the Environment Agency assumed a strategic overview for monitoring groundwater flooding but the extent and the legislative details remain to be clarified. The Environment Agency currently provides some data of known groundwater flooding incidents in the form of the Historic Flood Map.
Groundwater flooding is often highly localised and complex. Management is highly dependent upon the characteristics of the specific situation. The costs associated with the management of groundwater flooding are highly variable. The implications of groundwater flooding should be considered and managed through development control and building design. Possible responses include:
• Raising property ground or floor levels or avoiding the building of basements in areas considered to be at risk of groundwater flooding.
• Provide local protection for specific problem areas such as flood proofing properties (such as tanking or sealing of building basements).
• Replacement and renewal of leaking sewers, drains and water supply reservoirs. Water companies have a programme to address leakage from infrastructure, so there is clear ownership of the potential source.
• Major ground works (such as construction of new or enlarged watercourses) and improvements to the existing surface water drainage network to improve conveyance of floodwater from surface water of fluvial events through and away from areas prone to groundwater flooding.
Most options involve the management of groundwater levels. It is important to assess the impact of managing groundwater with regard to water resources, and environmental designations. Likewise, placing a barrier to groundwater movement can shift groundwater flooding from one location to another. The appropriateness of infiltration based drainage techniques should also be questioned in areas where groundwater levels are high or where source protection zones are close by.
7.11 Planning considerations
The Environment Agency Flood Map does not include groundwater flooding. The SFRA is required to build on the Flood Map by investigating other sources of flooding. PPS25 requires that decision makers use the SFRA to inform their knowledge of flooding across the area. These should form the basis for preparing appropriate policies for flood risk management. The propensity for groundwater flooding should be a material consideration when making land use allocation decisions.
Groundwater flood risk should be investigated, identified, quantified and managed where possible by the flood risk assessment process. Assessments of groundwater flooding must therefore always be included at all levels of future flood risk assessment. However a probabilistic approach to mapping groundwater flooding is not currently possible given the current datasets. Building on the broad scale approach taken in this SFRA, further collation of all relevant data, such as spring flows, borehole water levels, and recorded flood levels, past history and photographs of events and consultation with local residents should be undertaken when preparing site specific flood risk assessments (FRA).

London Borough of Newham SFRA
London Borough of Newham 7-14 May 2010
In particular, the factors that should be taken into account during the preparation of a site specific FRA are:
• Areas liable to flood based on the best available information.
• Extent, standard and effectiveness of existing flood defences (if present).
• Likely rates of water level rise within the aquifer, and if possible, trigger levels for the onset of overland flow
• Quantities and velocities of overland flow.
• Likely depth of flooding.
• Likelihood of impacts to other areas.
• Possible impacts of climate change.
Indicators that the site may be at risk from groundwater flooding include:
• If the development site is near to the junction between geological strata of differing permeability.
• If the development site is located at a similar level to nearby springs, or stream headwaters.
• If the development proposals include basements or excavation into the ground.
• If the vegetation on the site suggests periodic waterlogging due to high groundwater levels.
• If nearby recorded borehole levels reach those of the site.
If the FRA concludes that the risk of groundwater flooding on a site is particularly significant, a more detailed assessment of groundwater flooding may then be required. Such an assessment should be undertaken by specialist hydrogeologists and may involve further hydrogeological monitoring and statistical analyses of recorded borehole water levels. The results of this more detailed analysis should be incorporated into the next revision of the SFRA by updating this Chapter and Figure 7.1 as appropriate. This will ensure that the SFRA is continually updated to present the best available data on groundwater flooding across the whole borough. Additionally, the outcomes of these detailed assessments may be used by the Environment Agency to inform their strategies for the management of groundwater throughout London.
7.12 References
Conservation Technology Information Center (2005) 'Know Your Watershed' West Lafayette, Indiana 47906-1383
Defra (2004) 'Making Space for Water: Developing a New Government Strategy for Flood & Coastal Erosion Risk Management' Physical Drivers Behind Flood and Coastal Erosion Risks. Department for Environment, Food and Rural Affairs
Defra 2006 (2006a) 'Flooding from other sources' Technical report HA4a, prepared by Jacobs, November 2006
Environment Agency (2008) Management of the London Basin Chalk Aquifer. http://www.environment-agency.gov.uk/commondata/acrobat/2008london_1831580.pdf

London Borough of Newham SFRA
London Borough of Newham 7-15 May 2010
Jackson, I. (editor) (2004). Britain beneath our feet. British Geological Survey Occasional Publication No. 4
Jacobs. (2004). Strategy for Flood and Coastal Erosion Risk Management: Groundwater Flooding Scoping Study (LDS 23). Final Report, Volumes 1 and 2. May 2004. Defra
Jacobs (2006) Groundwater flooding records collation, monitoring and risk assessment (reference HA5) Initial Statement (Chalk Aquifers) Final Report, March 2006. Defra.
Lancaster, J.W., Preene, M. and Marshall, C. T. (2004) Development and flood risk: guidance for the construction industry. CIRIA, London, 182pp.
Marsh, T.J. & Dale, M., (2002). The UK Floods of 2000-2001: A Hydrometeorological Appraisal. Jnl. CIWEM, 16, p180 – p188
Summerfield, M.A. (1991) 'Global geomorphology' Wiley & Sons, New York
Balmforth, D, CJ Digman, D Butler and P Schaffer, (2006). Defra Integrated Urban Drainage Pilots. Scoping Study March 2006

London Borough of Newham SFRA
London Borough of Newham 7-16 May 2010
Figure 7A – Solid Geology
Figure 7B – Drift Geology

London Borough of Newham SFRA
London Borough of Newham 7-17 May 2010
Figure 7C - Aquifers
Figure 7D - Depth to Groundwater

London Borough of Newham SFRA
London Borough of Newham 8-1 May 2010
8 Flooding from Artificial Sources 8.1 Description
PPS25 requires an assessment of non-natural or artificial sources of flooding such as reservoirs, canals and lakes where water is retained above natural ground level. PPS25 also includes operational and redundant industrial processes including mining, quarrying, and sand and gravel extraction as they may increase water depths and velocities in adjacent areas. In addition to this the impacts of flood management infrastructure and other structures need to be considered. Flooding may result from a facility being overwhelmed or from failure of a structure. Failure of structures can result in rapid, deep flowing water, which poses a serious hazard, threatening life and potentially causing major property damage. Failure of pumps may also result in flooding.
For the purpose of the SFRA, flooding from artificial sources has been defined as that arising from failure of man-made infrastructure or human intervention that causes flooding. This includes failure of canals or reservoir embankments, as well as activities such as ground water pumping. To understand flooding from artificial sources the whole hydrological and drainage system must be considered, along with the potential for interaction with other sources of flooding.
The spatial and temporal extent of flooding from artificial sources is highly variable. For example the likelihood of a new reservoir failing is very low compared to that of a canal embankment that is more than one hundred years old. However the consequences of a reservoir failing is potentially catastrophic in comparison to a local canal embankment breaching.
Increased urbanisation, aging infrastructure and the impacts of climate change all result in the requirement for consideration of flooding from artificial sources within the development process.
Newham contains a number artificial water bodies. These include docks and basins, canals, and canalised rivers within the Borough, which should be considered as a potential source or mechanism of flooding.
8.2 Overview of flooding from artificial sources
Canals
Canals are man-made waterways, usually connected to (and sometimes connecting) existing lakes, rivers, or seas. There are two main types of canals: irrigation canals for the delivery of water, and transportation canals for passage of goods and people. Canals are sometimes part of a waterway, which is not entirely artificial (usually where a river has been canalised to make it navigable).
The main canal located in Newham is the River Lea Navigation canal, on the western boundary of the borough (Figure 1.1), however there are a number of tributaries of the River Lea that have been canalised and are navigable. These are considered a fluvial source of flooding, and are discussed in detail in Chapter 4, however for reference are listed below. All of these waterways are vulnerable to flooding during times of high flow in the Lower Lea catchment, in particular the River Lea Navigation (refer Figures 4.3 – 4.6). At Old Ford Locks on the River Lea Navigation Canal, there is typically a 2 metre difference between the normal retained upstream and downstream water levels.
British Waterways have responsibility for the canals that form part of the Lea Navigation and Bow Back Rivers system. These include all or parts of:

London Borough of Newham SFRA
London Borough of Newham 8-2 May 2010
• River Lea • Bowback River
• River Lea Navigation • Prescott Channel
• Waterworks River • Channelsea River
• City Mill River • Three Mills River
British Waterways must be consulted in relation to any development related to inland waterways and land adjacent to waterways.
British Waterways do not have responsibility for the navigable section of the River Roding. The Barking Barrage is owned and maintained by the London Borough of Barking and Dagenham under the Barking Barrage Order 1995.
Royal Docks
Newham is home to the Royal Docks (Figure 1.1) – made up of the Royal Victoria (opened 1855), Royal Albert (1880), and King George V (1921) Docks and have a water area of approximately 100ha. They were originally constructed to provide a berth for large vessels, and a railway connection for imported goods to the rest of the country. The Docks were rebuilt after World War II, but were eventually closed to commercial traffic in 1981. Since their closure the land surrounding the Royal Docks has slowly been redeveloped with commercial, residential, and transport infrastructure (such as City Airport opened in 1988 and the Docklands Light Railway opened in 1994).
The water area of the Royal Docks, including the lock and bridge connections to the Thames, are navigable, however are primarily used for recreational purposes. Unlike the docks in neighbouring local authorities, the management of the water area is undertaken by the Royal Docks Management Authority Limited (RoDMA), not British Waterways. The Environment Agency operates and maintains the flood defence barriers at the Royal Docks locks.
The land immediately around the docks has been elevated above natural ground level and is becoming increasing intense and including significant increases in residential land use.
Becton Lake Becton Lake is an artificial water body located in Beckton District Park and is operated and maintained by the London Borough of Newham Parks Department. Its predominant use is for fishing and recreation and is a valuable breeding ground for wildlife both in the water and surrounding habitat. It also performs as a local educational resource for schools. The lake is not directly connected to any of the main rivers or ordinary watercourses in the borough, but is connected to a storm drain in the form of an overflow weir along its northern bank, although this only expels water from the lake as a result of rainfall or surface water draining in the lake. The main water supply for Becton Lake is from a borehole at the northern edge, but rainfall and surface water runoff from the surrounding park also enter the lake. The main supply operates automatically via a combination of a float valve which corresponds with the rim of the overflow weir and timers set to operate the pump between 12 midnight and 6am. This method prevents the Parks Department from extracting any more than the Abstraction License permits.
8.3 Assessment of Flood Risk
The assessment of flood risk in relation to the Lea Navigation and Bow Back River system of navigable waterways has been considered in Chapter 4 (Flooding from Rivers) and is shown

London Borough of Newham SFRA
London Borough of Newham 8-3 May 2010
in the Actual Risk maps in Volume 3, specifically Figures 4.2 to 4.6. The River Lea Navigation has not been raised above natural ground levels through Newham, however there is an actual risk of flooding from the canal at Old Ford Locks during extreme events, as the canal does convey some floodwater, however this flooding is more significant in Tower Hamlets and Hackney to the west rather than in Newham, where ground levels adjacent to the canal are generally higher. The flood defences on the navigable sections of the Bow Back Rivers provide protection to the adjacent land during extreme events. Information was provided by British Waterways regarding the canals management and maintenance and by RoDMA regarding the Royal Docks management and maintenance.
The assessment of flood risk in relation to the Royal Docks has been considered in Chapter 5 (Tidal Flooding), and is shown in the Actual and Residual Risk Maps in Volume 3, specifically Figures 5.4, 5.5 and 5.6. The water levels within the docks are controlled by a series of lock gates and do not normally fluctuate with the tide level in the River Thames. There is a residual risk that during tidal flood events, the lock gates at the entrances to the docks may fail or be breached. If this were to occur, water levels in the locks would reach equilibrium with tide levels on the Thames which may cause overtopping of the dock walls and flooding in this area. Analysis of this potential breaching mechanism has been described in Chapter 5 of this report. The locks are not single structures and are a series of regularly maintained double gates so the probability of failure is low. The results of Breach 4 (Chapter 5) indicate that the potential hazard in such an event would initially be low as the Docks filled with water, however water could eventually overtop the Docks, resulting in significant hazard as water flows into areas of low ground immediately around the Docks.
Failure of the Royal Docks gates and locks is of particular concern and should be addressed in a similar manner to tidal flood risk in the Borough (Chapter 5 addresses failure of the dock gates during an extreme tidal event). Land immediately adjacent to the Royal Docks has been artificially raised in comparison to the low-lying land around Canning Town and Custom House. This has assisted in providing some artificial flood storage in the water area of the Royal Docks, however in the event of a failure of the locks and gates it is likely that the flow route of any flood waters from eventual overtopping would be down towards the rivers natural floodplain, thus increasing the risk to development within this path. Similarly the failure of the dock sides is likely to result in extensive flooding of the low-lying area of Canning Town and Custom House. similar to a breach of the Thames Tidal Defences discussed in Chapter 5 and this concept is summarised in Figure 8A. The likelihood of this mechanism occurring is very low as the docks are a low energy water environment with slow moving shipping and the docks are maintained by the PLA.
Figure 8A. Conceptual diagram indicating the increa sed risk to development on the floodplain surrounding the Royal Docks
Royal Docks Low lying ground
Thames

London Borough of Newham SFRA
London Borough of Newham 8-4 May 2010
8.4 Climate change
Artificial sources of water should be controlled under a management regime. Therefore, climate change should not significantly increase flood risk. There may be some requirement to adapt the management regime to accommodate the potential increase in rainfall and storm intensity particularly for water bodies which receive surface water drainage, either formally or informally.
8.5 Management of flooding from artificial sources
Flooding from artificial sources can be managed through regular inspections of structural integrity, development of emergency procedures, development design and emergency escape routes.
The canals described above are managed and maintained by British Waterways. They are regularly inspected on three different levels.
1. Length Inspections – Operative
• The whole length is walked every four weeks.
• Every three months the length is walked and travelled by boat and structures are operated.
• Engineers monitor and action repairs.
2. Length Inspections – Asset Engineers
• Annual inspections by Chartered Inspection Engineers who may request other types of inspection, closures etc.
3. Structure Specific Inspections – Visual inspections of each structure on the canal
• Frequency of these inspections depends on age and condition grading of structure. Structures are graded according to their age. The newest structures are Grade A, and the oldest, Grade E. Grade A structures are inspected approximately every 20 years, and E grade structures are inspected annually.
There are no specific emergency protocols in place, but there are generic protocols in place for managing incidents which would apply to flooding or breach events.
The RoDMA have advised they operate a full planned and preventative maintenance programme on all the major assets in the Royal Docks, including the locks and gates.
Watermains
Burst watermains occur regularly across London, however generally only result in localised flooding. Low lying land where water can build up can be vulnerable to this source, in a similar way to surface water flooding. Developments in close proximity to trunk watermains, or in low lying areas, should consider site layout and building thresholds to manage this residual risk.

London Borough of Newham SFRA
London Borough of Newham 8-5 May 2010
8.6 Planning considerations
The Environment Agency Flood Map typically does not include flooding from artificial sources. The Flood Zones cover only river and sea flooding but PPS 25 requires that consideration be given to other forms of flooding during the decision making process. The Flood Zone Maps and Residual Risk maps contained within Volume 3 of this SFRA do consider the risk of failure of the Royal Docks locks and gates. This area is classed as at risk of tidal flooding and flooding from artificial source as the locks and gates form part of the Thames Tidal Defences. For the purposes of this assessment, this flooding mechanism is discussed in detail in Chapter 5 (Tidal Flooding) shown in the tidal flood risk maps and is only summarised in this chapter of the SFRA.
PPS25 requires that decision makers use the SFRA to inform their knowledge of flooding. The SFRA refines the information on the Flood Map and determines the variations in flood risk from all sources of flooding across their area. The information then should form the basis for preparing appropriate policies for flood risk management for these areas. The propensity for flooding from artificial sources should be a material consideration when making land use allocation decisions.
Flooding from canals should be treated differently from river floodplain flooding and in particular any development near canals should be considered on the basis that:
• Small changes to bank or ground levels close to canals can potentially change the pattern and extent of flooding quite significantly;
• The land that is at risk from flooding from canals will potentially be a flow route for water returning to the flood plain – hence there is a need to consider development form carefully and the vulnerability of particular forms of development to such flooding;
• The concepts used to maintain flood volume storage might not be applicable to circumstances where there is “overland flow” from canals to the flood plain; and
• The flooding could seriously overload sewer and drainage systems and cause significant secondary flooding at locations that are remote from the canal.
Assessments of artificial sources of flooding on a site specific basis are therefore needed as part of the FRA process. A probabilistic approach to artificial sources of flooding requires an understanding of hydrological, hydraulic, and structural and geotechnical engineering processes. These processes are highly variable at the local scale and so do not warrant a strategic assessment. . The characteristics of Newham suggest that there are limited opportunities for flooding from artificial sources. Since the phenomenon is highly localised and complex it is not possible to undertake detailed risk mapping. A more detailed assessment of the risk of flooding from artificial sources is required for individual proposed developments
Further collation of all relevant data, such as asset information, measured water levels, operating regimes, past history and photographs of events and consultation with operating authorities should be undertaken when preparing more detailed assessments. More specifically, factors that should be taken into account during these detailed assessments are the:
• area liable to flooding;
• extent, standard and effectiveness of existing impoundment structures;
• likely depth of flooding;
• likelihood of impacts to other areas;
• effects of climate change.

London Borough of Newham SFRA
London Borough of Newham 8-6 May 2010
Local planning authorities within the Borough currently consult with British Waterways regarding development within 50 metres of a canal and should continue to do so for future planning applications. The RoDMA are a statutory consultee for planning applications in the Royal Docks area. British Waterways is also a statutory consultee on the Local Development Framework.
Flood defence consents from the Environment Agency are required for all works within 16m of an existing tidal defence, this includes the dock walls in the Royal Docks (and elsewhere in the Borough). The consents are required to ensure that the development does not create or make worse an existing flooding problem, or cause damage to existing structures or interfere with Agency work. Developers are required to apply for this consent from the Agency when preparing detailed design and further information can be obtained from the EA website22.
A river works licence from the Port of London Authority is required for all works on the river-side of the mean high water mark, this applies to the length of Newham’s boundary with the Thames. The process is in place to ensure that all developments in the river are assessed for their potential impact on the safety of navigation and the environment. Further detail on the river works licence is included in Chapter 5 (Tidal Flooding) of this volume of the SFRA.
22 http://www.environment-agency.gov.uk/subjects/flood/362926/362984/362988/

London Borough of Newham SFRA
London Borough of Newham 8-1 November 2009
[This page has been left blank to enable double sided printing]

London Borough of Newham SFRA
London Borough of Newham May 2010
9 Glossary and Notation
Actual risk The risk that has been estimated based on a qualitative assessment of the performance
capability of the existing flood defences
AEP Annual exceedence of probability. The annual chance of experiencing a flood with the
corresponding flood magnitude, i.e. a 1% AEP flood is a flood with a flow magnitude
that has a 1% chance of occurring in each and every year
AAP Area Action Plan
Breach or failure
hazard
Hazards attributed to flooding caused by a breach or failure of flood defences or other
infrastructure which is acting as a flood defence.
CFMP Catchment Flood Management Plan
CLG Communities and Local Government. Government Department responsible for issuing
Planning Policy Statement 25: Development and Flood Risk
Consequence Impact that the flood event would cause if it occurred
DPD Development Plan Document
Flood defence Natural or man-made infrastructure used to prevent flooding
Floodplain Area of land that borders a watercourse, an estuary or the sea, over which waterflows in
time of flood, or would flow but for the presence of flood defences where they exist.
Flood risk Flood risk is a combination of two components: the chance (or probability) of a particular flood event and the impact (or consequence) that the event would cause if it
occurred (EA 2003).
FRA Flood Risk Assessment
FRSA Flood Risk Standard Advice
Flood risk management
Flood risk management can reduce the probability of occurrence through the
management of land, river systems and flood defences, and reduce the impact through influencing development in flood risk areas, flood warning and emergency response (EA
2003).
Flood Zones This refers to the Flood Zones in accordance with Table D1 of PPS25. For the purpose
of the SFRA, the definition of flood zones varies slightly from PPS25 in that it shows the extent of flooding ignoring the presence of flooding defences, "except where the 'actual
risk' extent is greater"
Fluvial Relating to a watercourse (rivers or streams)
GOL Government Office of London
Groundwater Groundwater is the term used to describe the water stored underground in areas of
permeable rocks, known as aquifers. Consistently high levels of groundwater can lead to groundwater flooding.

London Borough of Newham SFRA
London Borough of Newham May 2010
LDD Local Development Documents
LDF Local Development Framework
LPA Local Planning Authority
PPS25 Planning Policy Statement Note 25: Development and Flood Risk (December 2006).
Precautionary
principle
‘’Where there are threats of serious or irreversible damage, lack of full scientific
certainty shall not be used as a reason for postponing cost effective measures to
prevent environmental degradation’’. The precautionary principle was stated in the Rio
Declaration in 1992. Its application in dealing with the hazard of flooding acknowledges
the uncertainty inherent in flood estimation.
Probability of
Consequence
The probability of a flood event being met or exceeded in any one year. For example, a
probability of 1 in 100 corresponds to a 1 per cent or 100:1 chance of an event
occurring in any one year.
Residual risk Flood risks resulting from an event more severe than for which particular flood defences
have been designed to provide protection.
RFRA Regional Flood Risk Appraisal
RPB Regional Planning Body
RSS Regional Spatial Strategy
SFRA Strategic Flood Risk Assessment
SPD Supplementary Planning Document
SREP Strategic Risk Evaluation Procedure
SUDs Sustainable Drainage Systems
Surface water Any body of water that is not groundwater (for example rivers, estuaries, ponds etc) as
well as temporary waters resulting from flooding, run-off etc.
UDP Unitary Development Plan
Windfall Sites Sites which become available for development unexpectedly and are therefore not
included as allocated land in a planning authority’s development plan