Newfoundland Power:Newfoundland Power: Capital Structure ... · monopoly in electricity...
29
Newfoundland Power: Newfoundland Power: Capital Structure Recommendations April 2016 Dr. Sean Cleary, CFA Bank of Montreal Professor of Finance Smith School of Business Queen’s University NP 2016/2017 General Rate Application Information - #34 Filed: 2016-04-11 Board Secretary: SK
Transcript of Newfoundland Power:Newfoundland Power: Capital Structure ... · monopoly in electricity...
Newfoundland Power:Newfoundland Power: Capital Structure Recommendations
April 2016
Dr. Sean Cleary, CFABank of Montreal Professor of Finance
Smith School of BusinessQueen’s University
NP 2016/2017 General Rate Application Information - #34 Filed: 2016-04-11 Board Secretary: SK
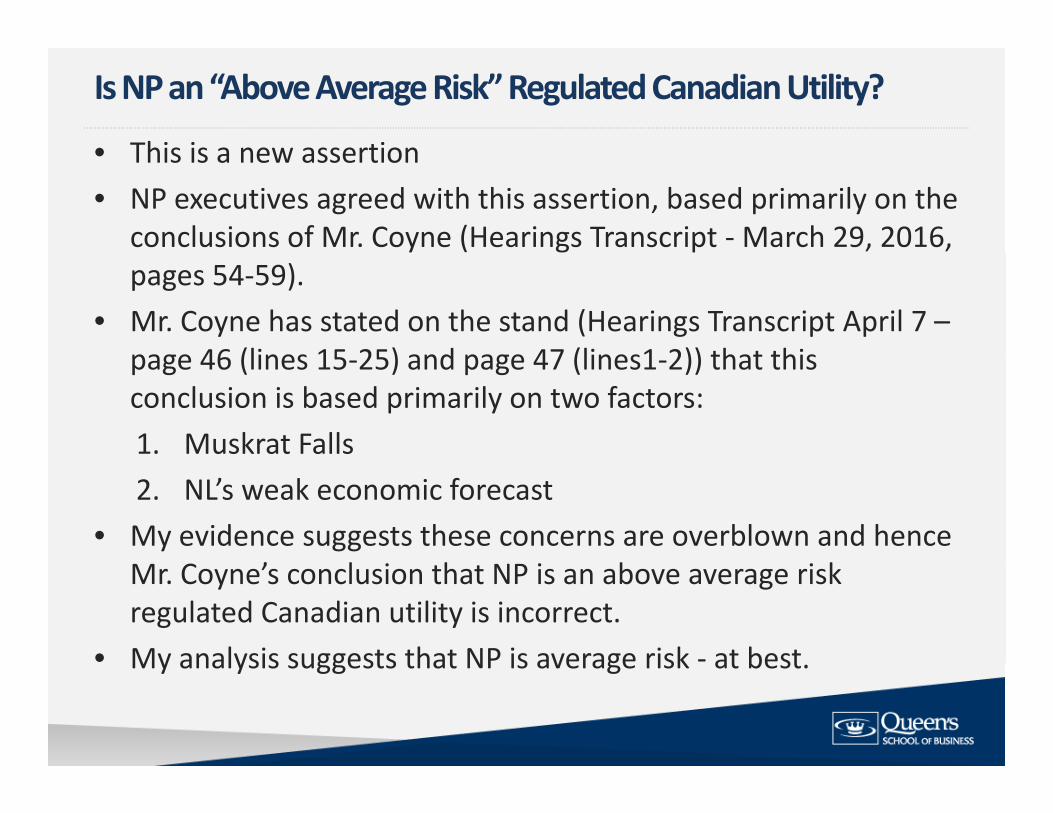
• This is a new assertion
Is NP an “Above Average Risk” Regulated Canadian Utility?
• This is a new assertion• NP executives agreed with this assertion, based primarily on the
conclusions of Mr. Coyne (Hearings Transcript ‐March 29, 2016, pages 54‐59).
• Mr. Coyne has stated on the stand (Hearings Transcript April 7 –page 46 (lines 15 25) and page 47 (lines1 2)) that thispage 46 (lines 15‐25) and page 47 (lines1‐2)) that this conclusion is based primarily on two factors:1. Muskrat Falls 2. NL’s weak economic forecast
• My evidence suggests these concerns are overblown and hence Mr. Coyne’s conclusion that NP is an above average risk regulated Canadian utility is incorrect.
• My analysis suggests that NP is average risk ‐ at bestMy analysis suggests that NP is average risk at best.

• Diverse growth prospects both globally and within Canada:
Economic Outlook
• Diverse growth prospects – both globally and within Canada:• Globally
– U.S. versus Euro and JapanU.S. versus Euro and Japan– China slowing growth to just over 6%– Oil importers versus exporters
• Real GDP Growth Forecasts (2016‐2017) – Table 2
Real GDP 2016 2017
Growth (%)2016 2017
ConsensusBank of
dConsensus
Bank of
dCanada Canada
World 2.7 3.3 3.0 3.6
U.S. 2.4 2.4 2.5 2.5
Euro Zone 1.7 1.6 1.7 1.6
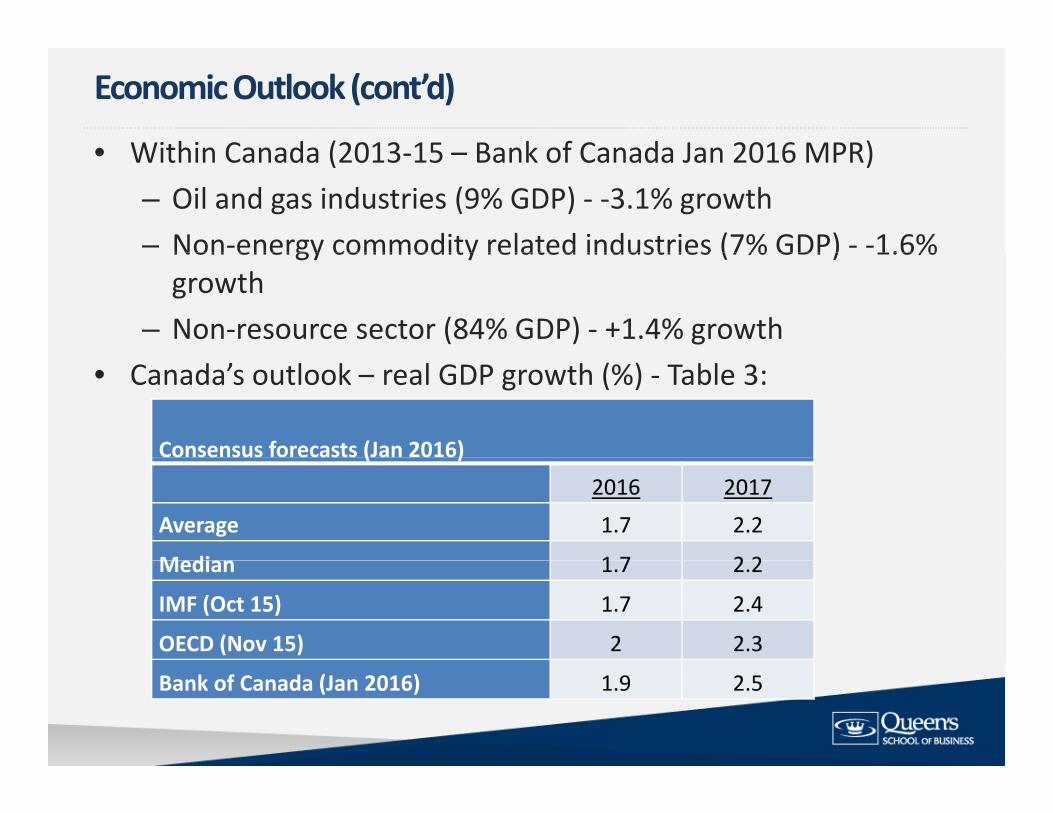
• Within Canada (2013 15 Bank of Canada Jan 2016 MPR)
Economic Outlook (cont’d)
• Within Canada (2013‐15 – Bank of Canada Jan 2016 MPR)– Oil and gas industries (9% GDP) ‐ ‐3.1% growth– Non‐energy commodity related industries (7% GDP) ‐ ‐1.6%Non energy commodity related industries (7% GDP) 1.6% growth
– Non‐resource sector (84% GDP) ‐ +1.4% growth• Canada’s outlook – real GDP growth (%) ‐ Table 3:
Consensus forecasts (Jan 2016)( )
2016 2017
Average 1.7 2.2
Median 1 7 2 2Median 1.7 2.2
IMF (Oct 15) 1.7 2.4
OECD (Nov 15) 2 2.3
Bank of Canada (Jan 2016) 1.9 2.5
• Conference Board real GDP growth forecasts for NL as per Fall
Economic Outlook (cont’d)
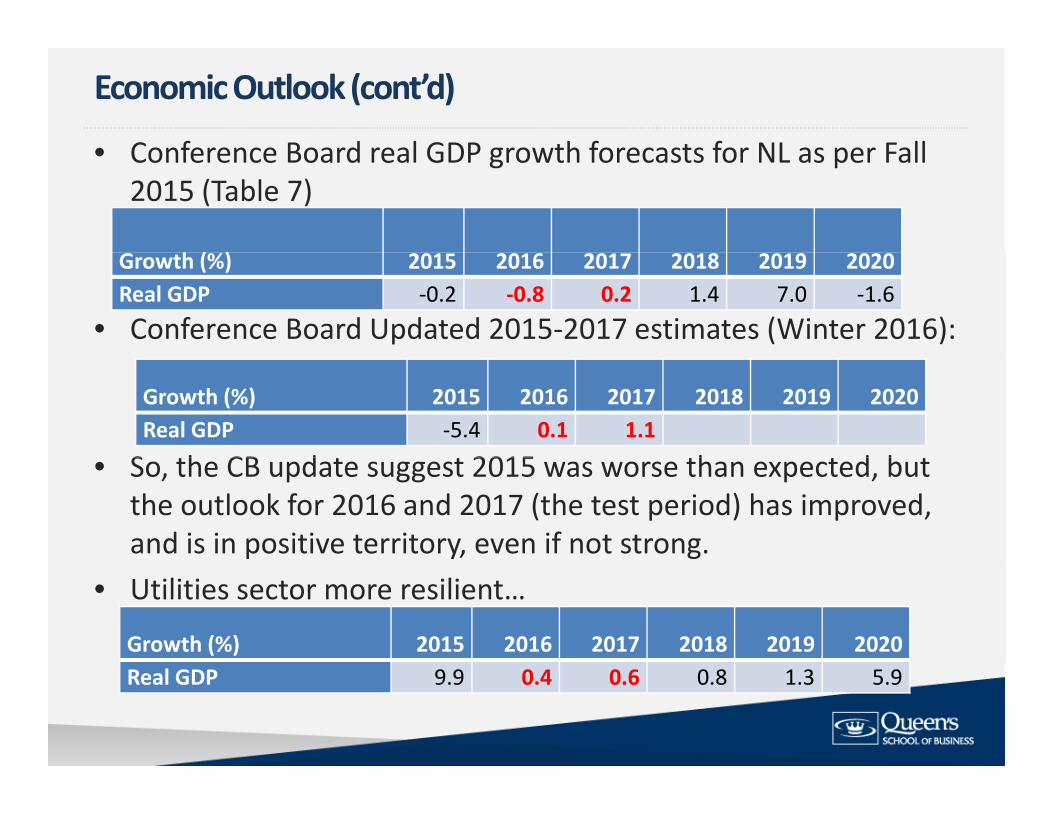
• Conference Board real GDP growth forecasts for NL as per Fall 2015 (Table 7)
h ( )
• Conference Board Updated 2015‐2017 estimates (Winter 2016):
Growth (%) 2015 2016 2017 2018 2019 2020Real GDP ‐0.2 ‐0.8 0.2 1.4 7.0 ‐1.6
S h CB d 2015 h d b
Growth (%) 2015 2016 2017 2018 2019 2020Real GDP ‐5.4 0.1 1.1
• So, the CB update suggest 2015 was worse than expected, but the outlook for 2016 and 2017 (the test period) has improved, and is in positive territory, even if not strong.
• Utilities sector more resilient…
Growth (%) 2015 2016 2017 2018 2019 2020Real GDP 9.9 0.4 0.6 0.8 1.3 5.9

• While the economic outlook could certainly be better
The Economy and NP• While the economic outlook could certainly be better, NP has demonstrated resiliency to previous downturns.downturns.– In fact, in 2015, despite slower than expected real GDP growth of ‐5.4% (CB estimate), NP’s revenues grew by 3.7%, its operating earnings grew, and it earned an 8.98% ROE, 0.18% above its allowed ROE
• This is consistent with the evidence provided in• This is consistent with the evidence provided in Figures 5 and 6 of my evidence – as shown on the next two slides…two slides…
• This evidence also suggests the NL economic outlook does not make NP an above‐average‐risk utility.g y
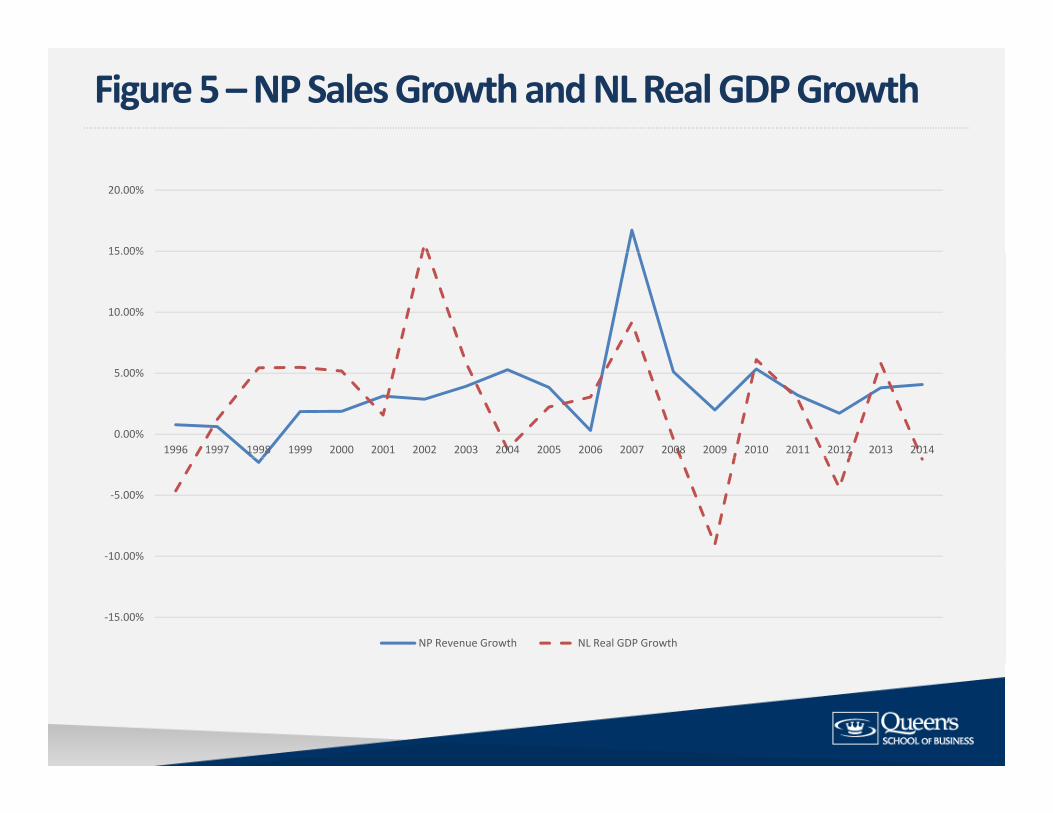
Figure 5 –NP Sales Growth and NL Real GDP Growth
15 00%
20.00%
10.00%
15.00%
0.00%
5.00%
1996 1997 1998 1999 2000 2001 2002 2003 2004 2005 2006 2007 2008 2009 2010 2011 2012 2013 2014
‐10.00%
‐5.00%
‐15.00%
NP Revenue Growth NL Real GDP Growth
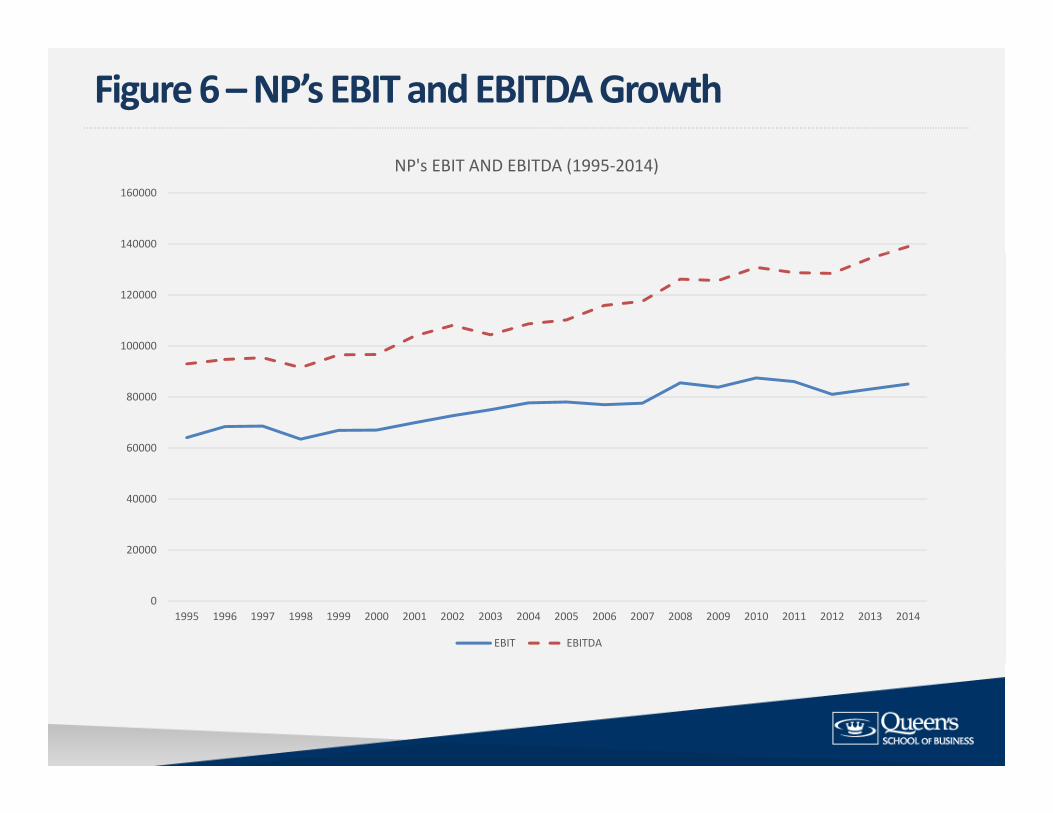
Figure 6 –NP’s EBIT and EBITDA Growth
140000
160000
NP's EBIT AND EBITDA (1995‐2014)
100000
120000
60000
80000
20000
40000
01995 1996 1997 1998 1999 2000 2001 2002 2003 2004 2005 2006 2007 2008 2009 2010 2011 2012 2013 2014
EBIT EBITDA

• No clear evidence that NP would not be able to pass on cost
Muskrat Falls • No clear evidence that NP would not be able to pass on cost
increases that might occur through to consumers:• COS arrangement, pass through mechanisms in place,
supportive regulator• Nor that rate increases would cause any significant loss in
customer base (i e refer to response to PUB CA 022):customer base (i.e., refer to response to PUB‐CA‐022):• Significant switching costs, evidence during the 1990s…
• No clear evidence that supply reliability will be reduced (i.e.,No clear evidence that supply reliability will be reduced (i.e., refer to response to PUB‐CA‐023) – i.e., the matter is currently under study, as acknowledged by Mr. Coyne…
• NP has always been considered an average risk regulated
Qualitative Conclusions re NP’s Business RiskNP has always been considered an average risk regulated Canadian utility
• This is consistent with the fact that it operates a virtual monopoly in electricity distribution, is well protected through various procedures and mechanisms, and operates under an extremely supportive regulatory regime.y pp g y g
• For example, DBRS (Aug 21, 2015) states that the procedures and mechanisms in place “allows Newfoundland Power to
ll d l i drecover all prudently spent operating expenses and earn a reasonable return.”
• The discussion above suggests that neither the NL economic outlook nor Muskrat Falls makes NP an above‐average risk
di ili h i i i h hiCanadian utility – the rating agencies appear to agree with this assertion.
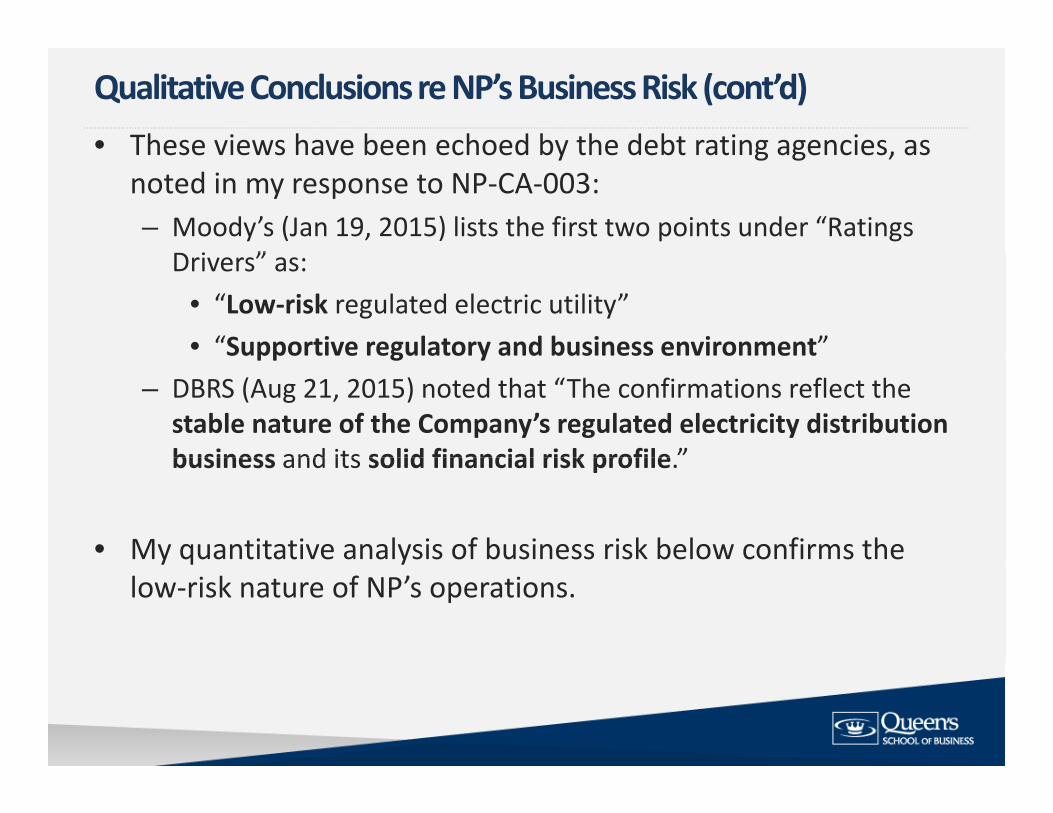
• These views have been echoed by the debt rating agencies as
Qualitative Conclusions re NP’s Business Risk (cont’d)These views have been echoed by the debt rating agencies, as noted in my response to NP‐CA‐003:– Moody’s (Jan 19, 2015) lists the first two points under “Ratings
D i ”Drivers” as:• “Low‐risk regulated electric utility”• “Supportive regulatory and business environment”Supportive regulatory and business environment
– DBRS (Aug 21, 2015) noted that “The confirmations reflect the stable nature of the Company’s regulated electricity distribution business and its solid financial risk profile ”business and its solid financial risk profile.
• My quantitative analysis of business risk below confirms the y q ylow‐risk nature of NP’s operations.
• “Business risk is the risk associated with operating earnings
Business RiskBusiness risk is the risk associated with operating earnings. Operating earnings are risky because total revenues are risky, as are the costs of producing revenues.”– 2013 CFA curriculum (Reading 38, page 82).
• “Refers to the relative variability of operating profits induced by the external forces of demand for and supply of the firm’sby the external forces of demand for and supply of the firm s products, by the presence of fixed costs, by the extent of diversification or lack thereof of services, and by the character f l i ”of regulation.”– Dr. Morin in the 2003 hearings, as noted on page 31 of Order No. P.U. 19 (2003).No. P.U. 19 (2003).
– Was accepted by the Board at that time.• Mr. Coyne agreed with the premise that operating risk shows up
in earnings (Transcript – April 6, 2016, page 173, lines 6‐10)

• A common measure of Operating Income Volatility is the
Business Risk and Operating Income Volatility
• A common measure of Operating Income Volatility is the Coefficient of Variation (CV) in EBIT.”
• CV ‐ Divide the Std. Dev. by the average (or expected value)• Rationale – accounts for “volatility” after adjusting for scaling
differences (e g larger EBIT larger EBIT/Sales averages etc )differences (e.g., larger EBIT, larger EBIT/Sales averages, etc.).
• Measures Used:1. CV(EBIT): Std. Dev. of EBIT (1995‐2014) / Expected EBIT 2. CV(EBIT)‐5 year: The average of 5‐year “rolling” estimates of
CV(EBIT) 3. CV (EBIT/Sales): Std. Dev. (EBIT/Sales) / Average (EBIT/Sales)
over (1995‐2014)over (1995 2014)
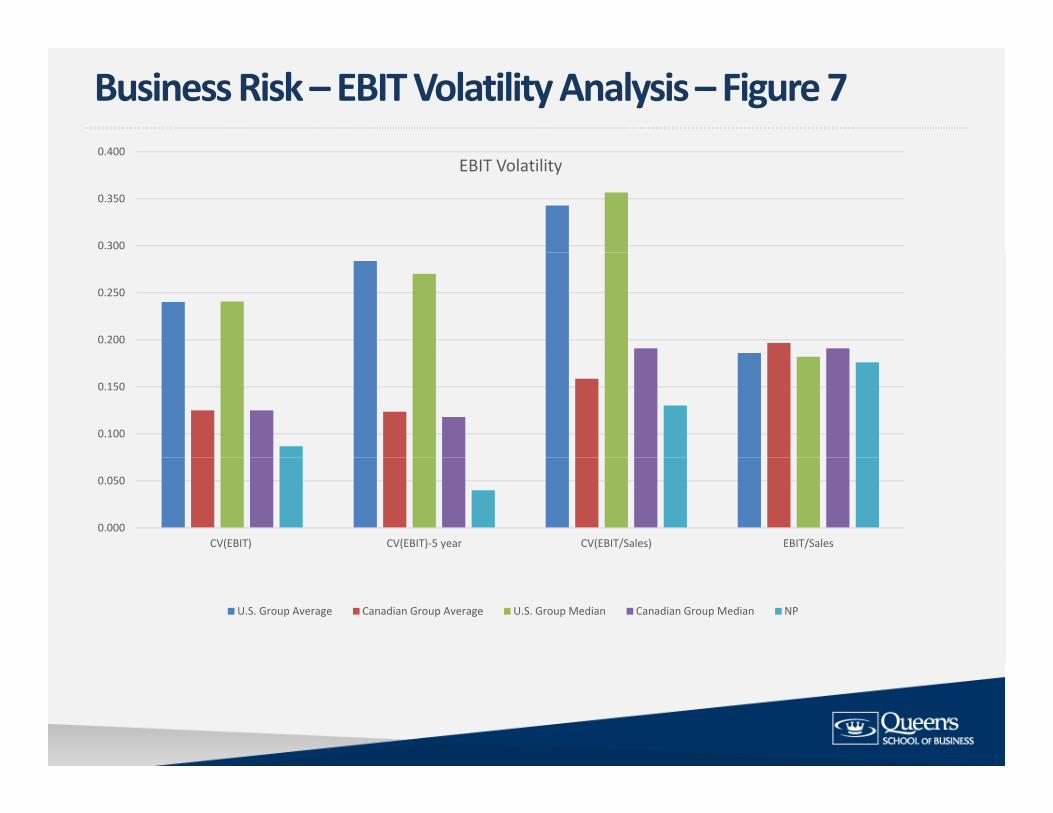
Business Risk –EBIT Volatility Analysis –Figure 70 400
0.300
0.350
0.400EBIT Volatility
0.200
0.250
0.100
0.150
0.000
0.050
CV(EBIT) CV(EBIT)‐5 year CV(EBIT/Sales) EBIT/Sales
U.S. Group Average Canadian Group Average U.S. Group Median Canadian Group Median NP
• Figure 7 and Table 8 show that NP possesses: Business Risk Conclusions
g p– much lower business risk than Mr. Coyne’s U.S. proxy group comprised of holding companies
– slightly lower business risk than other similar Canadian operating utilities
• This confirms the inappropriateness of Mr Coyne’s U S sampleThis confirms the inappropriateness of Mr. Coyne s U.S. sample – as expected given differences in structures, operating environments, etc.
• Also consistent with higher betas for U.S. sample even though they have less leverage (i.e., if had the same business risk, we would expect firms with less financial risk to have lower betas –pyet the U.S. betas are higher, despite less leverage.
• It also confirms that NP displays low business risk according to bj i i i hi h li iobjective quantitative measures – which supports qualitative
assessments by debt rating agencies

• NP has slightly above average allowed ROEs andmuch higher
Financial Risk –Allowable ROEs and ERs (Tables 9 and 10)
• NP has slightly above average allowed ROEs and much higher allowed ERs
Allowed ROEsCanadian G&E Distributors Average 8.83 8.72 8.57 8.73 8.67Median 8.75 8.75 8.75 8.75 8.50
Newfoundland Power 8.38 8.80 8.80 8.80 8.80
Allowed ERsCanadian G&E DistributorsAverage 39 36 39 16 38 82 38 80 38 73Average 39.36 39.16 38.82 38.80 38.73Median 40.00 40.00 38.50 38.50 38.50
Newfoundland Power 45.00 45.00 45.00 45.00 45.00

• Mr Coyne suggests in his evidence (Appendix A page 10 lines
Financial Risk
• Mr. Coyne suggests in his evidence (Appendix A, page 10, lines 1‐4) that NP’s debt rating is “one notch lower than the Canadian proxy group average of A‐.”
• This statement is misleading:1. Mr. Coyne compares NP’s Moody’s “issuer rating” to S&P
ratings ignoring the fact that the First Mortgage bonds issuedratings, ignoring the fact that the First Mortgage bonds issued by NP are rated A2, as noted by Fortis in its investor presentation (as per page 94 of Booth’s evidence).
2. It also ignores the fact that NP is rated A by DBRS.3. Assuming a Moody’s rating is comparable to an S&P rating is
i i t F l F ti Alb t I i tlinappropriate. For example, Fortis Alberta Inc. is currently rated A(low) by DBRS, A‐ (stable) by S&P, and Baa1(stable) by Moody’s.

• My analysis using DBRS metrics suggest that NP actually has
Financial Risk –DBRS Metrics Comparison (Table 11)
• My analysis using DBRS metrics suggest that NP actually has much stronger credit metrics than similar Canadian distributors and in the A(high) to AA(low) DBRS range
Issuer Rating
Total Debt to Capital CF/Debt
EBIT Interest Coverage
Canadian Regulated Utilities1 CU Inc A (high) 60 20% 12 60% 2 671. CU Inc. A (high) 60.20% 12.60% 2.672. Enbridge Gas Distribution Inc. A 55.70% 16.40% 2.603. FortisAlberta Inc. A (low) 56.70% 17.00% 2.184. FortisBC Inc. A (low) 58.40% 14.10% 2.445. Gaz Metro Limited Partnership A 67.20% 15.70% 1.826. Nova Scotia Power Inc. A (low) 61.20% 15.80% 2.19
Average 60.88% 15.65% 2.16Average 60.88% 15.65% 2.16Median 59.80% 15.75% 2.19DBRS “A” range for Canadian Utilities 55‐65% 12.5‐17.5% 1.8‐2.8Newfoundland Power (Aug 21, 2015 DBRS)DBRS)2014 A 55.30% 17.70% 3.06
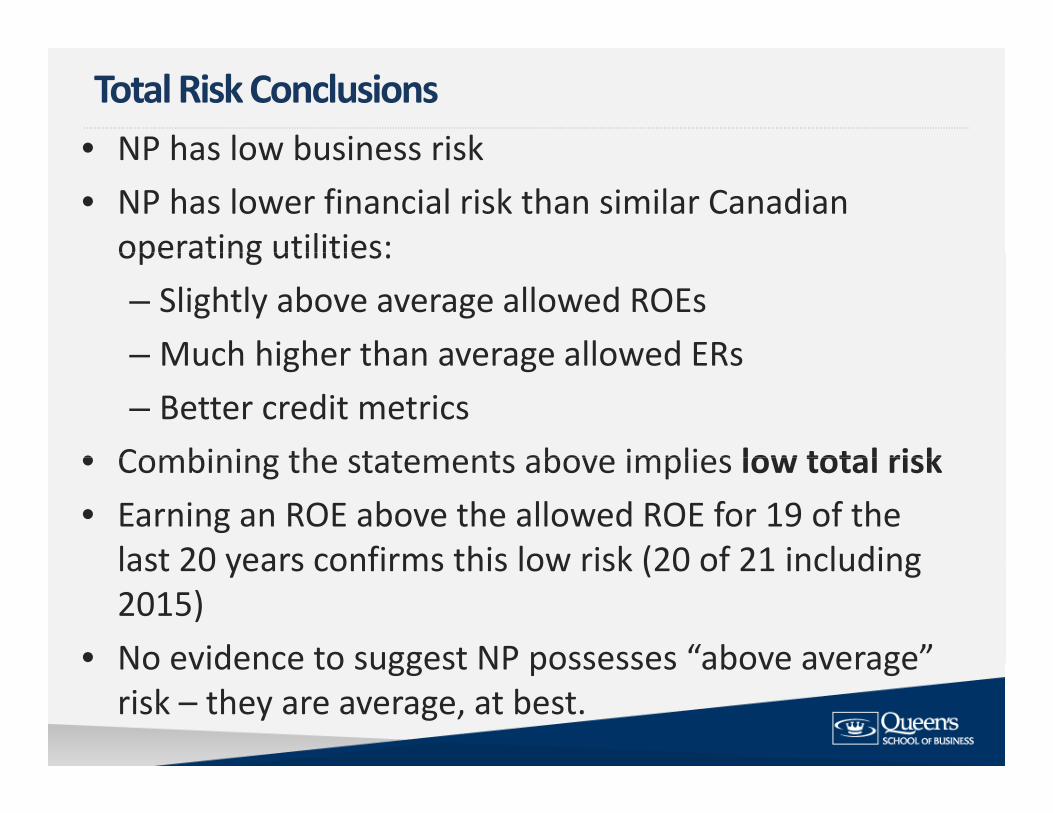
• NP has low business riskTotal Risk Conclusions
• NP has low business risk• NP has lower financial risk than similar Canadian operating utilities:operating utilities:– Slightly above average allowed ROEs– Much higher than average allowed ERs– Much higher than average allowed ERs– Better credit metrics
• Combining the statements above implies low total risk• Combining the statements above implies low total risk• Earning an ROE above the allowed ROE for 19 of the last 20 years confirms this low risk (20 of 21 includinglast 20 years confirms this low risk (20 of 21 including 2015)
• No evidence to suggest NP possesses “above average”No evidence to suggest NP possesses above average risk – they are average, at best.

• NP’s metrics would remain in the upper half of Moody’s Baa
Credit Metric Scenarios –under existing rates (Table 13)
• NP s metrics would remain in the upper half of Moody s Baa range and DBRS’s A(high) to AA(low) range at existing rates. Very strong.
Moody's Metrics 2013 2014 2015E 2016E 2017E NP(CFO pre‐WC + Interest)/Interest 3.61 3.65 3.77 3.90 3.78 Baa(mid‐high)
18.75 18.40 18.01 18.20CFO pre‐WC/Debt
18.75%
18.40%
18.01%
18.20% 17.43% Baa(high)
(CFO pre‐WC ‐ Dividends) /Debt 14.14%
13.95%
16.20%
14.88% 15.41%
Baa(high) to A(low)
Debt/Capitalization 54.07%
54.51%
54.45%
54.12% 54.15% Baa(mid)
DBRS Metrics ‐ calculatedDBRS Metrics calculated
Cash flow to debt18.75%
18.40%
18.01%
18.20% 17.43%
A(high) to AA(low)
54.34 54.85 54.72 54.38Debt to Capital % % % % 54.39% AA(low)EBIT to Interest 2.48 2.52 2.57 2.49 2.36 A(high)
• NP’s metrics would remain in Moody’s Baa range and DBRS’s A
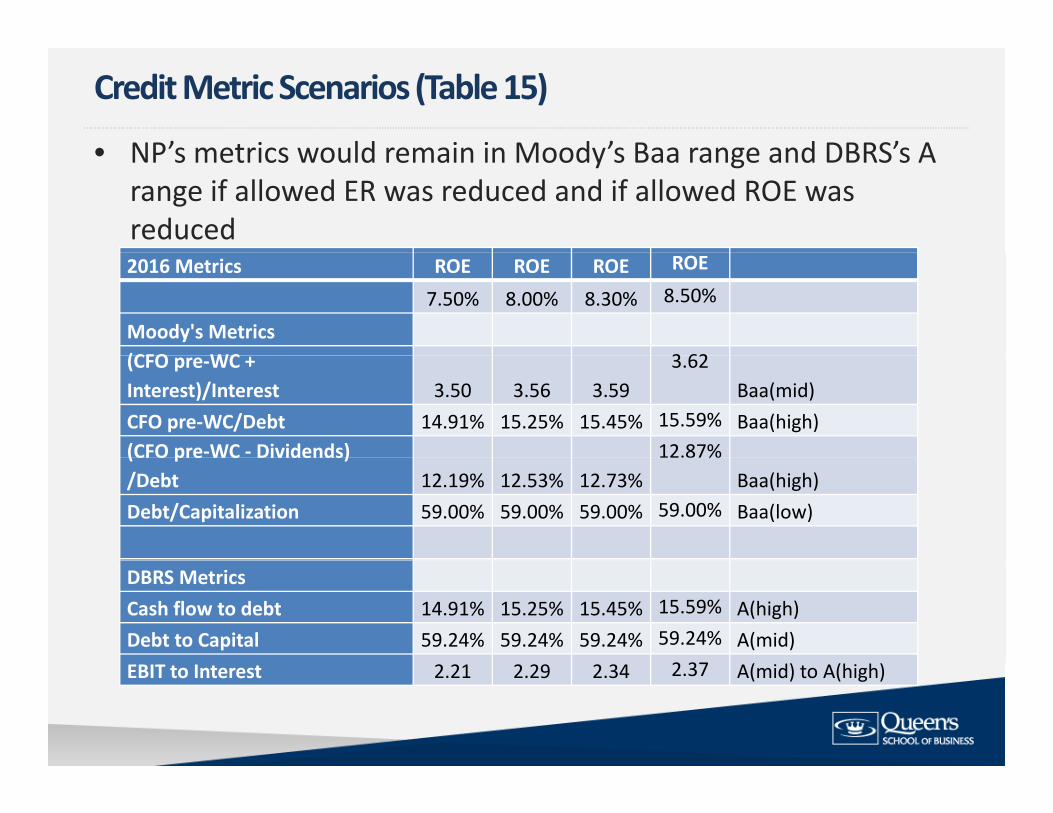
Credit Metric Scenarios (Table 15)
• NP s metrics would remain in Moody s Baa range and DBRS s A range if allowed ER was reduced and if allowed ROE was reduced2016 Metrics ROE ROE ROE ROE
7.50% 8.00% 8.30% 8.50%
Moody's Metrics (CFO WC 3 62(CFO pre‐WC + Interest)/Interest 3.50 3.56 3.59
3.62Baa(mid)
CFO pre‐WC/Debt 14.91% 15.25% 15.45% 15.59% Baa(high)(CFO pre‐WC ‐ Dividends) 12.87%( p )/Debt 12.19% 12.53% 12.73%
%Baa(high)
Debt/Capitalization 59.00% 59.00% 59.00% 59.00% Baa(low)
DBRS MetricsCash flow to debt 14.91% 15.25% 15.45% 15.59% A(high)Debt to Capital 59.24% 59.24% 59.24% 59.24% A(mid)
2 37EBIT to Interest 2.21 2.29 2.34 2.37 A(mid) to A(high)

Credit Metric Scenarios (Table 15) ‐continued
2017 Metrics ROE ROE ROE ROE
7 50% 8 00% 8 30% 8 50%7.50% 8.00% 8.30% 8.50%
Moody's Metrics NP(CFO pre‐WC + Interest)/Interest 3 49 3 55 3 58 3 61 Baa(mid)Interest)/Interest 3.49 3.55 3.58 3.61 Baa(mid)
CFO pre‐WC/Debt 14.78% 15.12% 15.32% 15.46% Baa(high)
(CFO pre‐WC ‐ Dividends) /Debt 13.13% 13.46% 13.67% 13.80% Baa(high)
Debt/Capitalization 59 04% 59 04% 59 04% 59.04% Baa(low)Debt/Capitalization 59.04% 59.04% 59.04% 59.04% Baa(low)
DBRS Metrics15 46%Cash flow to debt 14.78% 15.12% 15.32% 15.46% A(high)
Debt to Capital 59.28% 59.28% 59.28% 59.28% A(mid)
EBIT to Interest 2.22 2.30 2.35 2.38 A(mid) to A(high)
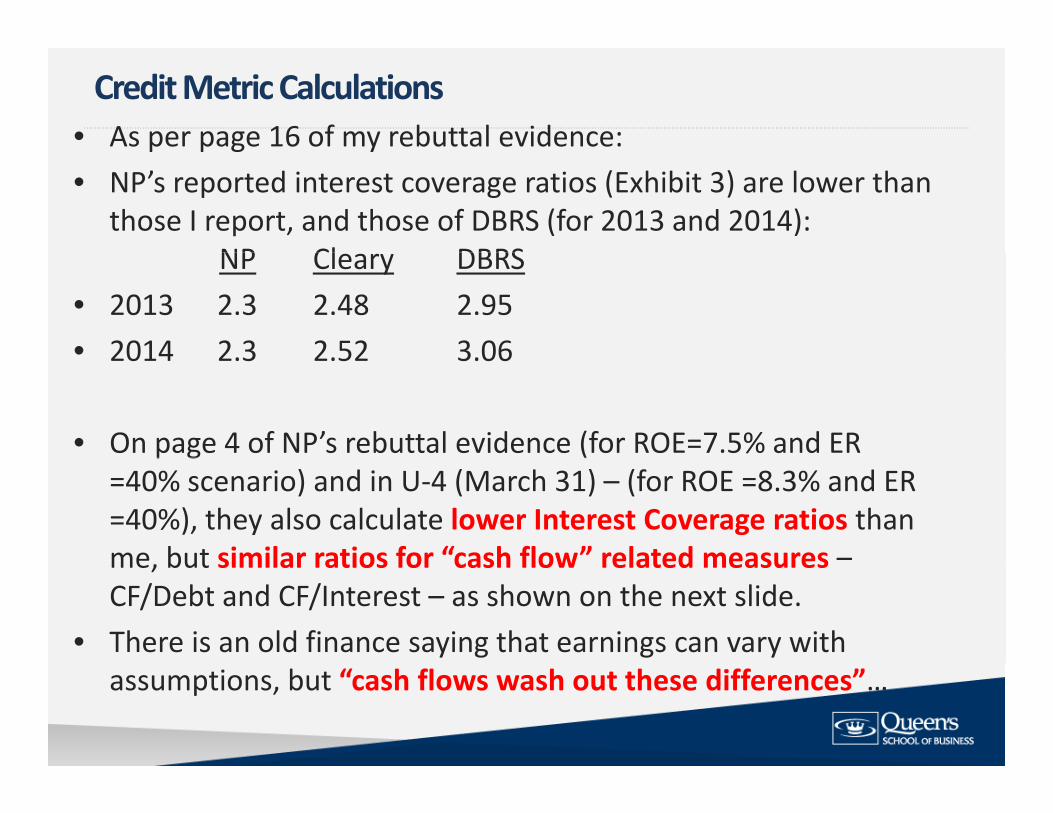
• As per page 16 of my rebuttal evidence:Credit Metric Calculations
p p g y• NP’s reported interest coverage ratios (Exhibit 3) are lower than
those I report, and those of DBRS (for 2013 and 2014): NP Cl DBRSNP Cleary DBRS
• 2013 2.3 2.48 2.95• 2014 2 3 2 52 3 062014 2.3 2.52 3.06
• On page 4 of NP’s rebuttal evidence (for ROE=7.5% and ER p g (=40% scenario) and in U‐4 (March 31) – (for ROE =8.3% and ER =40%), they also calculate lower Interest Coverage ratios than me but similar ratios for “cash flow” related measures –me, but similar ratios for cash flow related measures CF/Debt and CF/Interest – as shown on the next slide.
• There is an old finance saying that earnings can vary with assumptions, but “cash flows wash out these differences”…
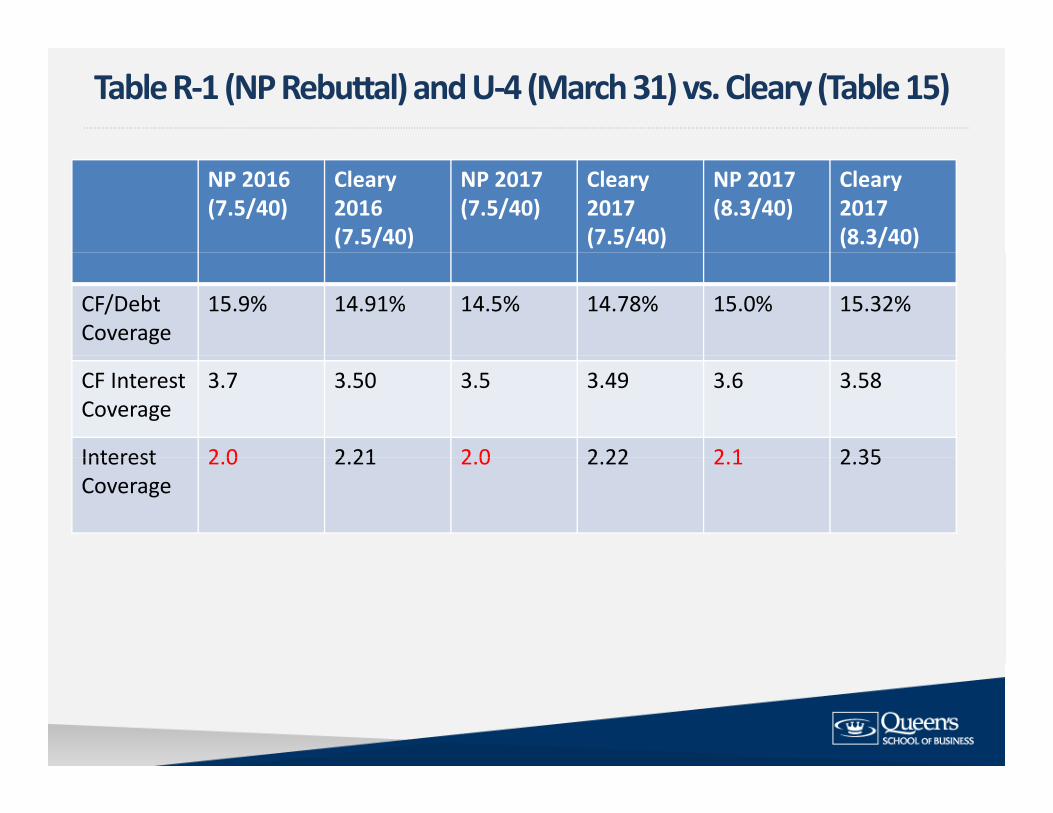
Table R‐1 (NP Rebuttal) and U‐4 (March 31) vs. Cleary (Table 15)
NP 2016(7.5/40)
Cleary2016(7.5/40)
NP 2017(7.5/40)
Cleary 2017(7.5/40)
NP 2017(8.3/40)
Cleary 2017(8.3/40)
CF/Debt Coverage
15.9% 14.91% 14.5% 14.78% 15.0% 15.32%
CF InterestCoverage
3.7 3.50 3.5 3.49 3.6 3.58
Interest 2 0 2 21 2 0 2 22 2 1 2 35Interest Coverage
2.0 2.21 2.0 2.22 2.1 2.35

• Two ways to construct EBIT (for interest coverage (EBIT/I)):Interest coverage (EBIT/I)
y ( g ( / ))– Top‐Down – Start with sales and subtract oper. costs, etc.– (e.g., 100 – 60 ‐ 18 = 22)– Bottom‐Up – start with income before taxes (or net income) and
add back interest (and taxes) (e.g., 12 + 4 + 6 = 22) Revenue 100‐ Oper costs ‐60EBITDA 40‐ Deprec and Amortiz ‐18EBIT 22‐ Interest ‐6EBT 16Taxes (25%) 4‐ Taxes (25%) ‐4
NI 12

• Table 1 in U‐7 calculates “Net Earnings” (to use as EBIT) using a U‐7 March 31, 2016
g ( ) g“top‐down” approach of $80,199 – NI or EBT data not provided.
• However, if we subtract the Interest figure (after new issue) of $41 454 id d b NP t EBT f $38 745$41,454 provided by NP, we get EBT of $38,745
• If we then apply a 29.14% tax rate to EBT (from NP’s Exhibit 3 assumptions), we get an implied net income available to p ), g pcommon shareholders figure of $27,455.
• Using CE figure of $440,199 (which is the $495,199 for 2017E f E hibit 3 6 i th $55 illi ) thi i lifrom Exhibit 3 page 6 minus the $55 million), this implies an ROE of 6.24% ??? – (Note: using the implied debt figure of $674,539 (which = the ( g p g , (
2017E figure + $75 million), we get an equity ratio of 39.5%, so close to 40%)
• Or if assume $27 455 is an 8 3% ROE this implies Equity =• Or if assume $27,455 is an 8.3% ROE, this implies Equity = 330,780 and implies an equity ratio of 32.9%???

• In contrast I use a “bottom up” approach based on a net
U‐7 March 31, 2016 (cont’d)
• In contrast, I use a bottom‐up approach, based on a net income available to common shareholders that corresponds to an 8.3% ROE and a 40% equity ratio
• I leave common equity unchanged, so a $102 million debt issue is required to obtain a 40% equity ratio.
• For metric calculations I then add back taxes (at 29 14%) and• For metric calculations, I then add back taxes (at 29.14%) and interest (based on 2017E interest forecast + new interest on $102 million bond issue at 4.45%) to determine EBIT
• Obviously, there are numerous combinations of debt issues, or common dividend payments to achieve a 40% equity ratio, and NP could decide what makes the most sense for itNP could decide what makes the most sense for it…
• But it would seem that the credit metrics and EBIT used to calculate such, should be consistent with an 8.3% ROE and a 40% equity ratio…
• NP is low business risk
Conclusions• NP is low business risk
• Virtual monopoly in low risk distribution• Very strong regulatory supportVery strong regulatory support• Resiliency in revenue and EBIT/EBITDA through time• Low volatility in operating income (EBIT)
• NP also possesses low financial risk• Allowable ROEs about average; equity ratios (ERs) well
babove average• Credit metrics above average
• Have earned an ROE above allowed for 20 of last 21 years –• Have earned an ROE above allowed for 20 of last 21 years –confirms low total risk…
• NP is NOT above average risk – it is average risk at best.

• I recommend a decrease in equity ratio (ER) to 40%
Conclusions (cont’d)
• I recommend a decrease in equity ratio (ER) to 40% ‐in line with Canadian peers• 45% is overly conservative and is not necessary• 45% is overly conservative and is not necessary
• Credit metric scenario analysis confirms that such a reduction will allow NP to retain financial integrityreduction will allow NP to retain financial integrity