Newell Highway potential overtaking lanes study - March …€¦ · Newell Highway Potential...
77
NEWELL HIGHWAY Potential overtaking lanes study Draft final report MARCH 2011
Transcript of Newell Highway potential overtaking lanes study - March …€¦ · Newell Highway Potential...
NEWELL HIGHWAY Potential overtaking lanes study Draft final report MARCH 2011
Newell Highway Potential Overtaking Lanes Study Final Draft Report
9 March 2011 i
NEWELL HIGHWAY POTENTIAL OVERTAKING LANES STUDY
FINAL DRAFT REPORT 9 MARCH 2010
Prepared for
Roads and Traffic Authority of New South Wales Western Region and South West Region
Prepared by
Newell Highway Potential Overtaking Lanes Study Final Draft Report
9 March 2011 ii
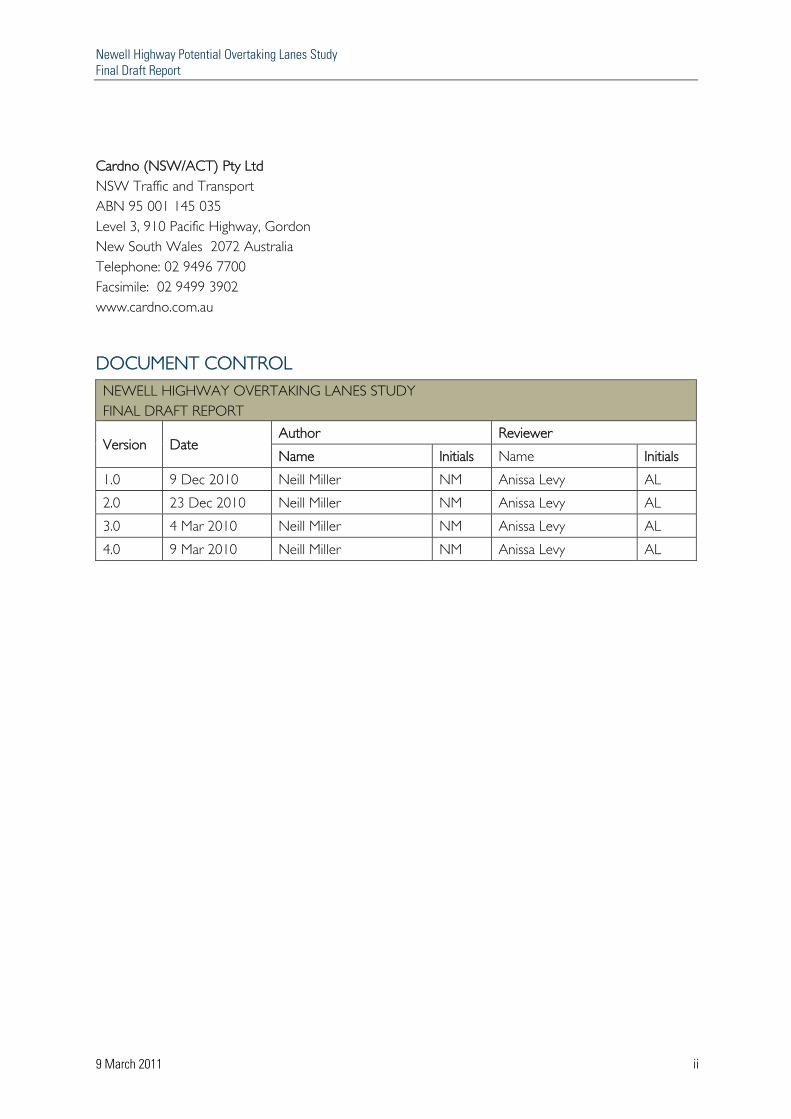
Cardno (NSW/ACT) Pty Ltd NSW Traffic and Transport ABN 95 001 145 035 Level 3, 910 Pacific Highway, Gordon New South Wales 2072 Australia Telephone: 02 9496 7700 Facsimile: 02 9499 3902 www.cardno.com.au
DOCUMENT CONTROL NEWELL HIGHWAY OVERTAKING LANES STUDY FINAL DRAFT REPORT
Version Date Author Reviewer Name Initials Name Initials
1.0 9 Dec 2010 Neill Miller NM Anissa Levy AL 2.0 23 Dec 2010 Neill Miller NM Anissa Levy AL 3.0 4 Mar 2010 Neill Miller NM Anissa Levy AL 4.0 9 Mar 2010 Neill Miller NM Anissa Levy AL
Newell Highway Potential Overtaking Lanes Study Final Draft Report
9 March 2011 iii
TABLE OF CONTENTS Executive summary vi Section 1: Introduction 1 1.1 Background 1 1.2 Terms of reference 2 1.3 The study process 2
1.3.1 The study team 2 1.3.2 Desk based inspections 2 1.3.3 Data collection 2 1.3.4 Modelling 3 1.3.5 Workshops 3
Section 2: The highway in context 4 2.1 Description of the highway 4
2.1.1 Analysis sections 6 2.2 Speed zones 8 2.3 Existing overtaking lanes 10 2.4 Centre barriers 14 2.5 Road geometry and sight lines 15
2.5.1 Curve radii 15 2.5.2 Vertical grades 16 2.5.3 Sight lines 17
2.6 Road train routes 18 2.7 Crash statistics 18 2.8 Traffic types and volumes 21
2.8.1 Daily traffic 21 2.8.2 Peak hour traffic 23 2.8.3 Mix of vehicles 26
2.9 Calculated mean travel speeds 28 2.10 Demographics 28 Section 3: Existing highway performance 29 3.1 Definitions 29 3.2 Performance overview 29 3.3 Per cent following on the Newell Highway 32 3.4 Travel speeds on the Newell Highway 34
3.4.1 Mean travel speeds 34 3.4.2 Mean travel times 34 3.4.3 Vehicle operating time 34
3.5 Performance on the Newell Highway 34 Section 4: Criteria 40 4.1 Criteria for selection of overtaking lanes 40 4.2 Criteria for prioritisation of overtaking lanes 41 Section 5: Potential locations 43 5.1 List of potential locations 43 5.2 Highway performance improvements 48
Newell Highway Potential Overtaking Lanes Study Final Draft Report
9 March 2011 iv
5.3 Sensitivity testing 54 Section 6: Conclusion 58
Appendices Appendix A Austroads Vehicle Classification System Appendix B Overtaking Lane Location Prioritisation Scoring
List of Tables Table 2.1 Newell Highway analysis sections 6 Table 2.2 Newell Highway speed zones 8 Table 2.3 Newell Highway existing northbound overtaking lanes 10 Table 2.4 Newell Highway existing southbound overtaking lanes 11 Table 2.5 Newell Highway existing barrier lines 14 Table 2.6 Newell Highway curve radii 15 Table 2.7 Newell Highway vertical grades 16 Table 2.8 Newell Highway sight lines 17 Table 2.9 2010 peak hourly traffic volumes 24 Table 2.10 Vehicle classification 26 Table 3.1 2010 highway performance - northbound 30 Table 3.2 2010 highway performance - southbound 31 Table 4.1 Prioritisation scoring system 42 Table 4.2 Prioritisation bands 42 Table 5.1 Potential overtaking lane locations 44 Table 5.2 2010 Highway performance with improvements - northbound 49 Table 5.3 2010 highway performance with improvements - southbound 50 Table 5.4 2010 to 2020 growth rates by vehicle type 54 Table 5.5 Projected 2020 peak hourly traffic volumes 55 Table 5.6 2020 highway performance with improvements - northbound 56 Table 5.7 2020 highway performance with improvements - southbound 57
List of Figures Figure 2.1 Location Map 5 Figure 2.2 Analysis sections 7 Figure 2.3 Existing speed zones 9 Figure 2.4 Existing northbound overtaking lanes 12 Figure 2.5 Existing southbound overtaking lanes 13 Figure 2.6 Fatal crashes 2005 to 2009 19 Figure 2.7 Casualty crashes 2005 to 2009 20 Figure 2.8 Average daily traffic volumes on the Newell Highway (2010) 21 Figure 2.9 Traffic survey sites 22 Figure 2.10 Peak hour volumes on the Newell Highway (2010) 23 Figure 2.11 Traffic volumes on the Newell Highway (2010) 25 Figure 2.12 Northbound peak hour mix of vehicles on the Newell Highway (2010) 27 Figure 2.13 Southbound peak hour mix of vehicles on the Newell Highway (2010) 27 Figure 3.1 2010 highway performance - northbound 30
Newell Highway Potential Overtaking Lanes Study Final Draft Report
9 March 2011 v
Figure 3.2 2010 highway performance - southbound 31 Figure 3.3 Sections that exceed the rural network planning target 33 Figure 5.1 Potential northbound overtaking lanes 46 Figure 5.3 2010 highway performance with improvements - northbound 49 Figure 5.4 2010 highway performance with improvements - southbound 50 Figure 5.5 2020 highway performance with improvements - northbound 56 Figure 5.6 2020 highway performance with improvements - southbound 57
Newell Highway Potential Overtaking Lanes Study Final Draft Report
9 March 2011 vi
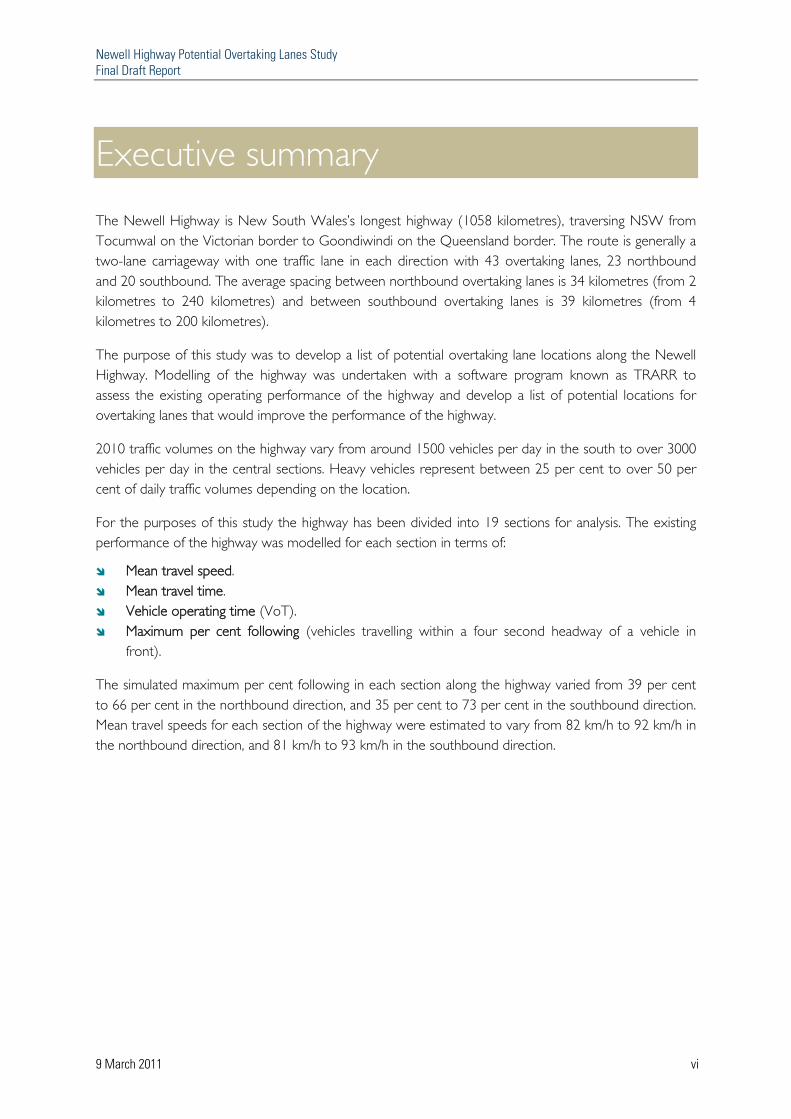
Executive summary The Newell Highway is New South Wales’s longest highway (1058 kilometres), traversing NSW from Tocumwal on the Victorian border to Goondiwindi on the Queensland border. The route is generally a two-lane carriageway with one traffic lane in each direction with 43 overtaking lanes, 23 northbound and 20 southbound. The average spacing between northbound overtaking lanes is 34 kilometres (from 2 kilometres to 240 kilometres) and between southbound overtaking lanes is 39 kilometres (from 4 kilometres to 200 kilometres).
The purpose of this study was to develop a list of potential overtaking lane locations along the Newell Highway. Modelling of the highway was undertaken with a software program known as TRARR to assess the existing operating performance of the highway and develop a list of potential locations for overtaking lanes that would improve the performance of the highway.
2010 traffic volumes on the highway vary from around 1500 vehicles per day in the south to over 3000 vehicles per day in the central sections. Heavy vehicles represent between 25 per cent to over 50 per cent of daily traffic volumes depending on the location.
For the purposes of this study the highway has been divided into 19 sections for analysis. The existing performance of the highway was modelled for each section in terms of:
Mean travel speed. Mean travel time. Vehicle operating time (VoT). Maximum per cent following (vehicles travelling within a four second headway of a vehicle in
front).
The simulated maximum per cent following in each section along the highway varied from 39 per cent to 66 per cent in the northbound direction, and 35 per cent to 73 per cent in the southbound direction. Mean travel speeds for each section of the highway were estimated to vary from 82 km/h to 92 km/h in the northbound direction, and 81 km/h to 93 km/h in the southbound direction.

Newell Highway Potential Overtaking Lanes Study Final Draft Report
9 March 2011 vii
Two workshops were held with RTA review team members to establish criteria for selection of locations and for determining a prioritisation criteria for the overtaking lanes:
Criteria for the selection of the overtaking lane locations: - Per cent following – locations that would address a high per cent following. - Spacing – long distances between existing overtaking lanes. - Geometry – consideration for horizontal and vertical curvature (sight distance).
Criteria for determining the prioritisation of the overtaking lanes: - Per cent following – a score was allocated to each location based on the maximum per
cent following that the location addressed. - Travel time saving – a score was assigned to each location based on travel time saving over
a section, when comparing total vehicle operating time before and after the location was included.
- Spacing – a score was assigned to each location based on the spacing between the potential overtaking lane and the existing overtaking lane.
The demand for State road improvements across the State far exceeds the RTA’s ability to provide upgrades. To aid the process of prioritisation, the RTA has defined Network Planning Targets to guide future development by ensuring the effective allocation of scarce funding resources. These Network Planning Targets are outlined in the recently produced RTA document titled “Network Performance Measures and Network Planning Targets” which was approved for use in July 2010.
Overtaking lanes can be provided at locations where vehicles spend more than:
65 per cent of their time following behind another vehicle. or 50 per cent of their time following behind another vehicle when the proportion of heavy vehicles
is also 50 per cent or greater.
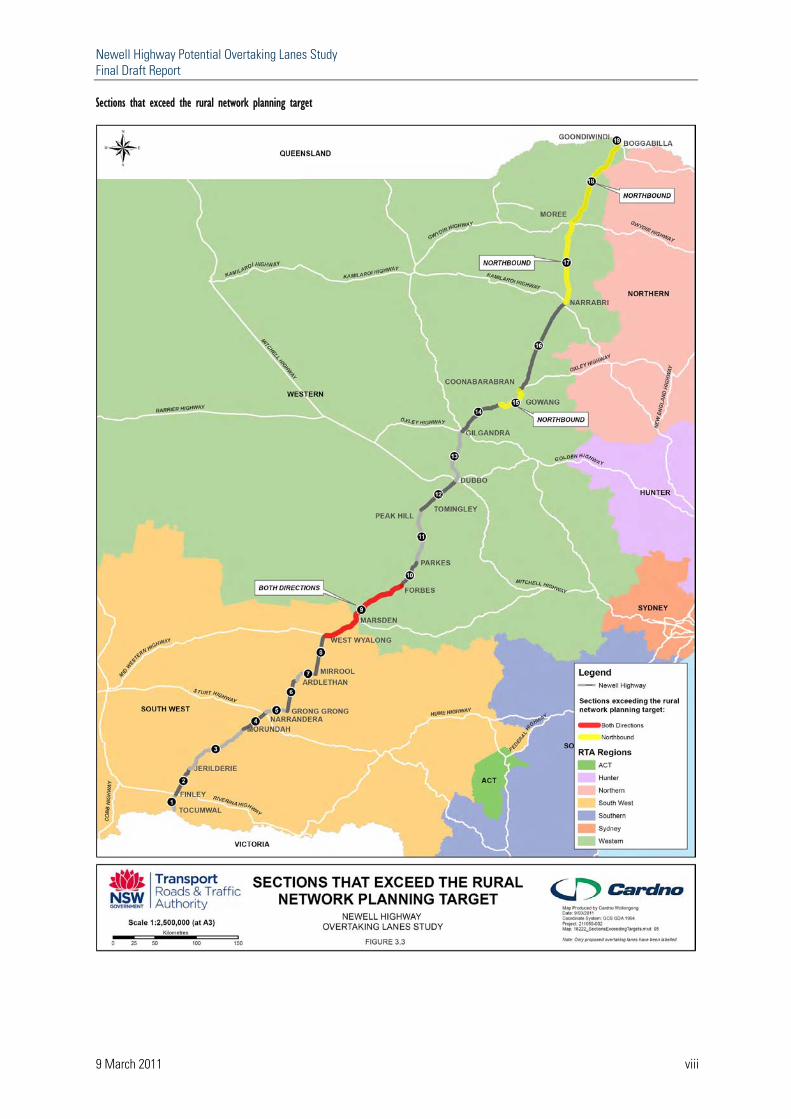
Five sites within four sections along the Newell Highway currently exceed the criteria, as shown in the following table.
Sections that exceed the rural network planning target
Section No. Towns/Localities
Mean travel time (min)
Mean speed (km/h)
Vehicle operating time (VoT) (hour)
Maximum % following
Proportion of Heavy Vehicles
(ADT) From To
Northbound Section 9 West Wyalong Forbes 73.8 85.9 107.0 65.1 42% Section 15 Gowang Coonabarabran 27.8 82.4 48.6 65.4 35% Section 17 Narrabri Moree 71.8 84.3 122.0 65.5 43% Section 18 Moree Boggabilla 78.1 88.2 118.5 64.3 51% Southbound Section 9 West Wyalong Forbes 79.1 81.2 122.7 73.3 41%
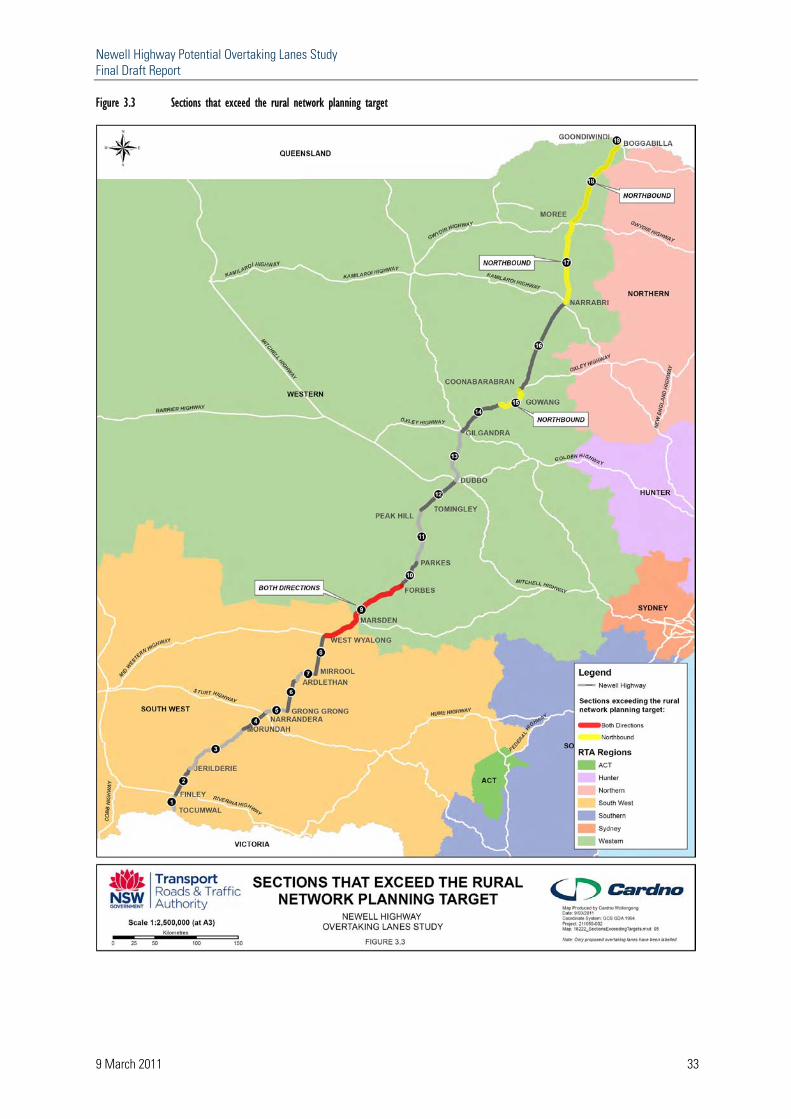
The sections that exceed the Rural Network Planning Target can be seen on the figure provided on following page. Three northbound sections and one southbound section of the Newell Highway have a modelled performance greater than 65 per cent following. One additional northbound section has a percentage of heavy vehicles greater than 50 per cent with a per cent following also greater than 50%. A number of other sections are approaching these figures and would be expected to exceed them in the medium term due to continued traffic growth.
Newell Highway Potential Overtaking Lanes Study Final Draft Report
9 March 2011 viii
Sections that exceed the rural network planning target

Newell Highway Potential Overtaking Lanes Study Final Draft Report
9 March 2011 ix
The scoring criteria developed for prioritising the locations was applied to develop a banded list of locations, shown in the table below.
Potential overtaking lane locations
Location Direction Route Chainage
(km)
From To Higher Priority Locations
13.1 north of West Wyalong Northbound 314.05 315.55 55.2 north of West Wyalong Northbound 356.15 357.65 78.0 north of West Wyalong Northbound 378.95 380.45 34.6 north of West Wyalong Southbound 335.55 337.05 56.6 north of West Wyalong Southbound 357.65 359.15 79.4 north of West Wyalong Southbound 380.45 381.95 15.1 north of Parkes Southbound 453.63 455.13 57.4 north of Parkes Southbound 495.53 497.03 48.4 north of Coonabarabran Northbound 765.10 366.60 68.5 north of Narrabri Northbound 904.3 905.80 89.8 north of Narrabri Southbound 925.60 927.10 19.8 north of Narrabri Southbound 855.6 857.10 40.8 north of Narrabri Southbound 876.6 878.10 60.8 north of Narrabri Southbound 896.6 898.10 32.4 north of Moree Northbound 968.65 970.15 85.0 north of Moree Northbound 1021.25 1022.75
Medium Priority Locations 18.5 north of Finley Southbound 39.82 41.32 19.3 north of Jerilderie Northbound 75.61 77.11 58.1 north of Jerilderie Southbound 114.41 115.91 14.5 north of West Wyalong Southbound 315.45 316.95 42.5 north of Parkes Northbound 481.03 482.53 56.0 north of Parkes Northbound 494.53 496.03 43.9 north of Parkes Southbound 482.23 483.73 13.1 north of Dubbo Southbound 567.71 569.21 9.3 north of Gilgandra Northbound 631.88 633.38 24.0 north of Gilgandra Northbound 646.38 647.88 26.2 north of Gilgandra Southbound 648.78 650.28 5.6 north of Gowang Northbound 683.79 685.29 78.6 north of Coonabarabran Northbound 795.3 796.80 16.7 north of Coonabarabran Southbound 733.4 734.90 13.6 north of Narrabri Northbound 849.4 850.90 47.8 north of Narrabri Northbound 883.6 885.10 91.2 north of Narrabri Northbound 927 928.50 33.8 north of Moree Southbound 970.05 971.55
Location Direction Route Chainage
(km)
From To Lower Priority Locations
11.1 north of Tocumwal Northbound 11.56 13.06 9.7 north of Tocumwal Southbound 10.16 11.66 17.1 north of Finley Northbound 38.42 39.92 20.7 north of Jerilderie Southbound 77.01 78.51 14.0 north of Morundah Northbound 148.04 149.54 13.2 north of Narrandera Southbound 178.47 179.97 13.1 north of Grong Grong Northbound 200.48 201.98 14.8 north of Ardlethan Southbound 241.85 243.35 37.7 north of Mirool Northbound 288.8 290.30 22.2 north of Mirool Southbound 273.3 274.80 33.2 north of West Wyalong Northbound 334.15 335.65 6.5 north of Forbes Southbound 411.98 413.48 13.7 north of Parkes Northbound 452.23 453.73 56.7 north of Dubbo Northbound 613.31 614.81 58.1 north of Dubbo Southbound 614.71 616.21 10.7 north of Gilgandra Southbound 633.28 634.78 13.3 north of Gowang Northbound 691.49 692.99 14.2 north of Coonabarabran Northbound 730.9 732.40 49.8 north of Coonabarabran Southbound 766.5 768.00 80.0 north of Coonabarabran Southbound 796.7 798.20 28.0 north of Narrabri Northbound 863.8 865.30 11.7 north of Moree Southbound 947.95 949.45 86.4 north of Moree Southbound 1022.65 1024.15
The locations shown in the above table are indicative and detailed investigations would need to be undertaken when considering specific locations. It should be noted that no priorities exist within the banded list above, and further project specific assessment is required for more detailed prioritisation.
A comparison of the simulated mean travel speed, mean travel time and maximum per cent following over each road section with and without the potential overtaking lanes is provided in the following graphs. This assessment was quantitative and project specific issues such as environmental impacts and constructability were not considered in the locating of the overtaking lanes. The study was strategic in nature but in broad terms is a reasonable representation of overtaking lane priorities along the Newell Highway.

Newell Highway Potential Overtaking Lanes Study Final Draft Report
9 March 2011 ii
The simulated improved 2010 performance of the highway along each of the 19 analysis sections is summarised in the figures on the following pages for northbound and southbound travel.
2010 highway performance with improvements - northbound
2010 highway performance with improvements - southbound
Newell Highway Potential Overtaking Lanes Study Final Draft Report
9 March 2011 iii
The assumed unit rate for provision of overtaking lanes is typically in the range of $1.5 to $2.5 million (2010 dollars) per lane kilometre. Hence, a 1.5 kilometre overtaking lane could cost in the range of $2.25 to $3.75 million per site. Costs will vary at each site depending on a number of constraints such as road geometry, available shoulder width, surrounding terrain and other issues discovered during detailed investigations. Therefore the estimated range could be exceeded.
Newell Highway Potential Overtaking Lanes Study Final Draft Report
9 March 2011 1
Section 1: Introduction
1.1 Background The RTA appointed Cardno to undertake a study to develop a list of potential overtaking lane locations along the Newell Highway. This report describes characteristics of the highway, the existing operating performance of the highway and develops a program of potential locations for overtaking lanes to improve the performance of the highway.
A road safety strategy for the Newell Highway was developed following the RTA study entitled Newell Highway Safety Review 20091. The road safety strategy’s overarching goal is to achieve a substantial reduction in the incidence and severity of road crashes on the Newell Highway. The Newell Highway Safety Upgrade is a $30 million package of works to improve safety, including:
New line marking and signposting to provide motorists with better guidance. Upgrading a number of minor intersections. Dedicated turning lanes. New signs to warn drivers of coming intersections. Sealing alongside roads on the approaches to the highway. Removing roadside hazards such as light posts and utilities. Installing safety barriers where roadside assets cannot be relocated.
Another safety measure implemented by the RTA was the reduction of the speed limit on the Newell Highway to 100 km/h. The RTA has also recently undertaken a trial use of an innovative centre line marking, which helps to separate traffic travelling in opposite directions. This involves the use of tactile line marking, as well as a wider painted centre line to help prevent crashes where cars cross the centre line.
A number of safety works projects have been completed already and others are currently underway. This overtaking lane report has been developed separately to the safety upgrade package. The overtaking lane locations are aimed at improving road network performance along the highway.
1 The Newell Highway Safety Review 2009 was prepared by the RTA and contents of this document have been used in this document.
Newell Highway Potential Overtaking Lanes Study Final Draft Report
9 March 2011 2
1.2 Terms of reference The study was established to examine and report on the following issues:
The existing physical characteristics of the Newell Highway. An assessment of existing road operating performance along the highway from the Victorian
border to the Queensland border. Criteria for selection of potential overtaking lane sites and for prioritisation of the locations. A prioritised list of potential overtaking lane locations along the Newell Highway.
1.3 The study process 1.3.1 The study team
The study team included transport planners and traffic engineers from Cardno and the review team included RTA Regional Road Safety Managers, Traffic Managers, Asset Managers and Development Planners for the South West and Western Regions as well as Strategic Planners for RTA corporate office in North Sydney, who are experts from the areas of strategic planning road safety, traffic management and road design.
1.3.2 Desk based inspections
Inspections of the highway have been conducted by Cardno staff using the 'Gipsicam' system, which allows viewing of film footage of the highway on a desktop computer. The system is coded with Geographic Positioning System (GPS) data, enabling identification of locations and analysis of road environment characteristics, such as:
Number of traffic lanes. Presence of centre line barriers. Presence of auxiliary lanes (overtaking lanes). Road speed zones.
Use of this system provided valuable additional information, such as curve radii, road gradient and road surface condition.
1.3.3 Data collection
Full classification traffic volume and speed data was provided by RTA Western Region and South West Region at key locations along the Newell Highway. The locations where the data was collected were in rural locations, generally at local government boundaries.

Newell Highway Potential Overtaking Lanes Study Final Draft Report
9 March 2011 3
1.3.4 Modelling
Modelling of the highway performance was undertaken with a software program known as TRARR (which stands for TRAffic on Rural Roads). The TRARR program is a micro-simulation model of traffic flow on two-lane roads, which was originally developed by the Australian Road Research Board (ARRB) in the late 1970s and updated in 2006 for research into two-lane road traffic flow and capacity. TRARR is used to simulate the traffic operations on a real road in detail, and to investigate the effects of changes in road and traffic characteristics. Calculated traffic characteristics include speed, travel time, vehicle bunching or platooning, time spent following, overtaking rate and fuel consumption.
TRARR is a micro simulation model. The progress of each vehicle along the road is reviewed at one (1) second intervals. Decision rules for overtaking, merging, catching up and other manoeuvres are determined by the driver/vehicle characteristics supplied as input. An observation routine records interval information for each direction of travel between two designated observation points on the road (e.g. travel times and fuel consumption). Further observation points along the road record point information (e.g. spot speed and the proportion of vehicles following in bunches).
1.3.5 Workshops
Two workshops were held with the full study and review team members. The workshops were held so key RTA personnel could input into the study and to guide the study team. The objectives and attendees of these workshops are detailed following.
Workshop 1
Date: 6 October 2010
Attendees: Anissa Levy, Neill Miller - Cardno Ian Alcorn, Phil Standen, Douglas Moore, Tony Hendry - RTA Western Region Neale Irons, Tim Wilson, Chris Bamberry – RTA South West Region
Objectives: To review the initial road network performance modelling and to establish criteria for the selection of potential overtaking lane locations.
Workshop 2
Date: 15 November 2010
Attendees: Anissa Levy, Neill Miller - Cardno Ian Alcorn, Phil Standen, Douglas Moore, Tony Hendry, Neil Peden - RTA Western Region Neale Irons, Tim Wilson, Chris Bamberry – RTA South West Region
Objectives: To review the revised road network performance modelling, review the potential overtaking lane locations and to establish criteria for the prioritisation of the overtaking lane sites.
Newell Highway Potential Overtaking Lanes Study Final Draft Report
9 March 2011 4
Section 2: The highway in context This section of the report provides a general description of the highway physical and traffic characteristics. A technical addendum has been produced that provides a detailed description of the route on a section by section basis.
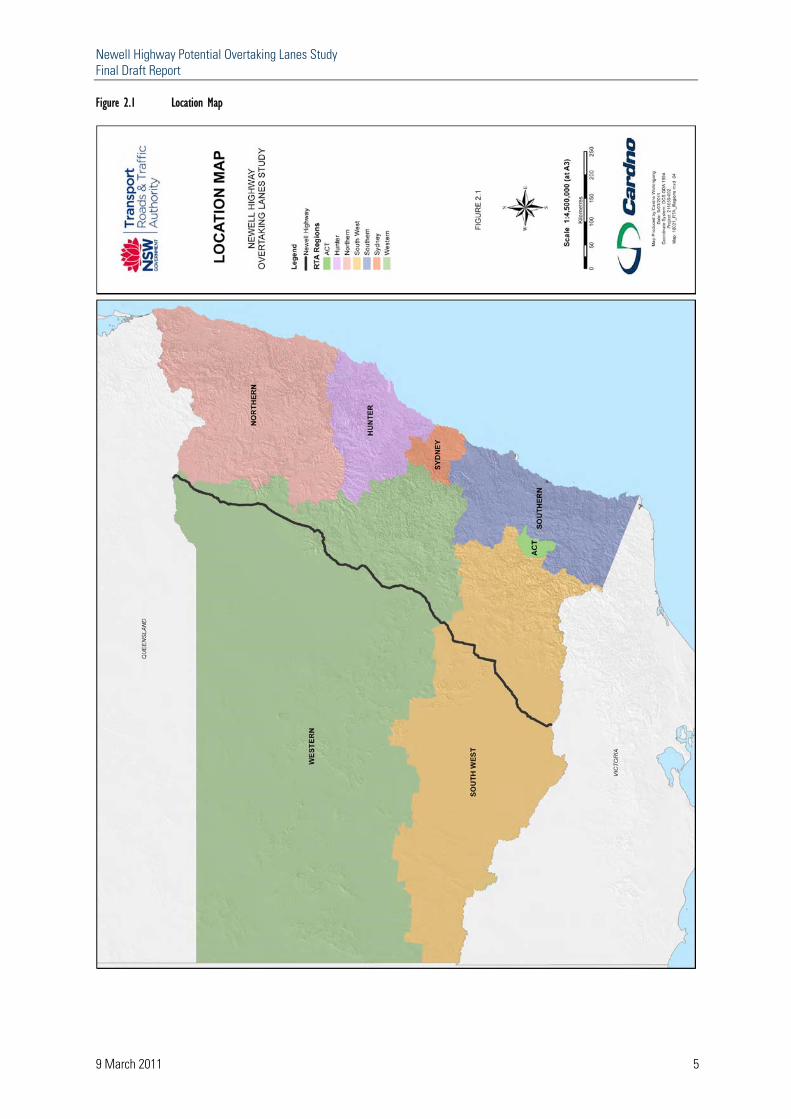
2.1 Description of the highway The Newell Highway is New South Wales’s longest highway (1058 kilometres), traversing NSW from Tocumwal on the Victorian border to Goondiwindi on the Queensland border (refer to Figure 2.1). The Newell Highway is part of the Federal Government's National Land Transport Network and is an integral part of the national road network. The Newell Highway is managed and maintained by the RTA with funding assistance for major infrastructure and maintenance provided by the Federal Government through the National Land Transport Network program. The highway passes through two RTA regions with 68 per cent of the route in Western Region and 32 per cent in South West Region, as shown in Figure 2.1.
Approximately 150,000 people live in the regions adjoining the Newell Highway in NSW. Some sections of the highway have a poor record for crashes and fatalities involving both light and heavy vehicles. The Newell Highway safety review 2009 has identified a number of improvements along the highway in order to safely carry current and projected traffic volumes and traffic types.
The highway between the Victorian and the Queensland borders has varying vertical and horizontal alignment, usage, standards, junctions and roadside objects. However, the road geometry does vary only slightly and is generally a two-lane rural road with infrequent overtaking lanes. Local residents have suggested that additional overtaking lanes are required along the highway to improve operating performance and safety. It should be noted that the Newell Highway Safety Review 2009 did not recommend overtaking lanes to address safety issues.
The Newell Highway corridor is influenced by the generally flat terrain through which it passes. Overall the road is characterised by long lengths of straights joined by occasional curved sections. The lengths passing through the Warrumbungle Ranges, near Coonabarabran, have generally steeper grades and tighter curves than the rest of the road. The road is speed limited to 100 km/h, with speed zones reducing to as low as 50 km/h through towns and urban areas.
Travelling from south to north, the route starts at the NSW town of Tocumwal on the Victorian border and passes through the western cities, towns and localities of Finley, Jerilderie, Morundah, Narrandera, Grong Grong, Ardlethan, Mirool, West Wyalong, Forbes, Parkes, Tomingley, Dubbo, Gilgandra, Gowang, Coonabarabran, Narrabri, Moree, Boggabilla and crosses the Queensland Border at Goondiwindi.
Newell Highway Potential Overtaking Lanes Study Final Draft Report
9 March 2011 5
Figure 2.1 Location Map
Newell Highway Potential Overtaking Lanes Study Final Draft Report
9 March 2011 6
The road passes through mainly agricultural land with the main land uses being wheat growing, sheep, cattle and mixed cropping. The route is used as a major heavy vehicle transport corridor between Victoria and Queensland and subsequently the percentage of vehicles registered in other States, especially heavy vehicles is high. The road also carries a seasonally high proportion of caravan and tourist traffic travelling between Victoria and Queensland. There are significant urban lengths of the Newell Highway as it passes through a number of cities, towns and localities.
2.1.1 Analysis sections
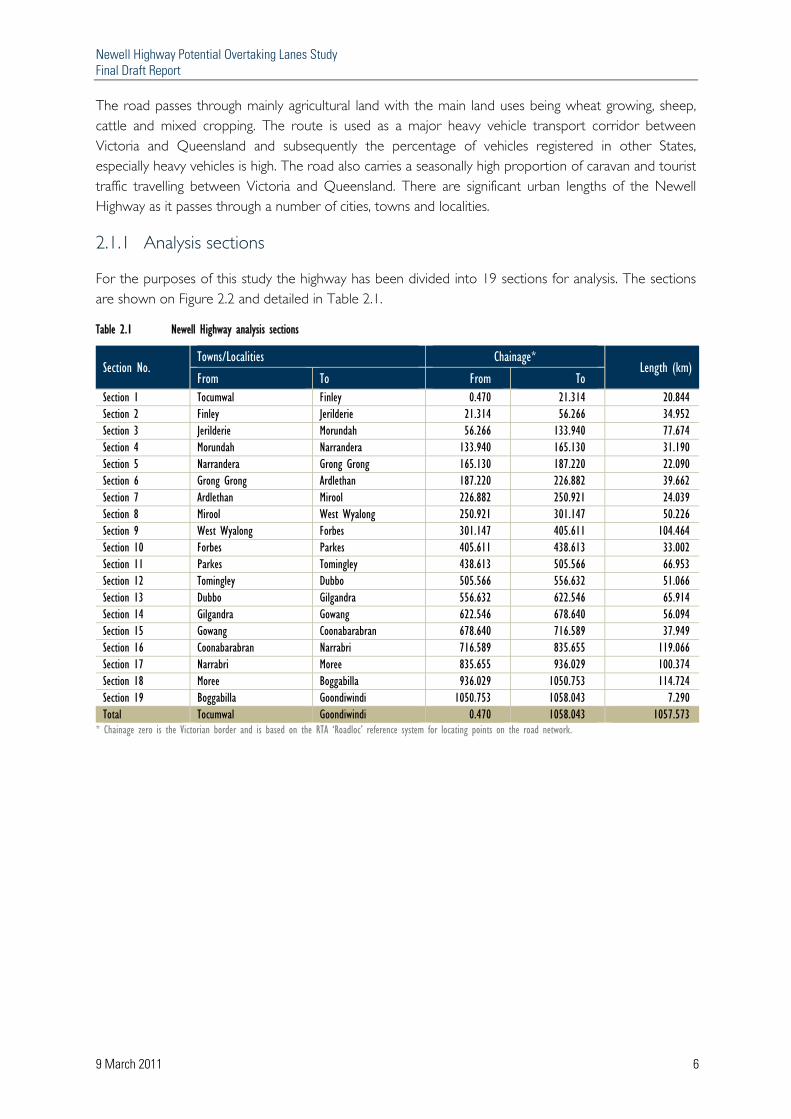
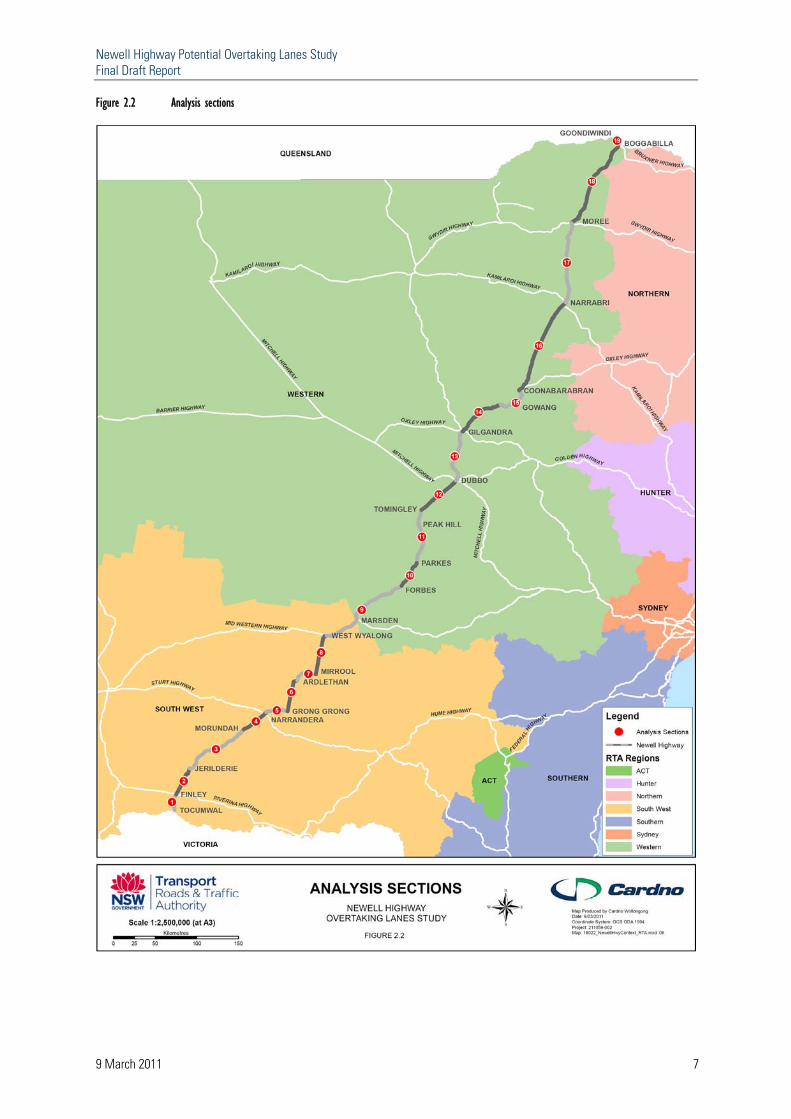
For the purposes of this study the highway has been divided into 19 sections for analysis. The sections are shown on Figure 2.2 and detailed in Table 2.1.
Table 2.1 Newell Highway analysis sections
Section No. Towns/Localities Chainage*
Length (km) From To From To
Section 1 Tocumwal Finley 0.470 21.314 20.844 Section 2 Finley Jerilderie 21.314 56.266 34.952 Section 3 Jerilderie Morundah 56.266 133.940 77.674 Section 4 Morundah Narrandera 133.940 165.130 31.190 Section 5 Narrandera Grong Grong 165.130 187.220 22.090 Section 6 Grong Grong Ardlethan 187.220 226.882 39.662 Section 7 Ardlethan Mirool 226.882 250.921 24.039 Section 8 Mirool West Wyalong 250.921 301.147 50.226 Section 9 West Wyalong Forbes 301.147 405.611 104.464 Section 10 Forbes Parkes 405.611 438.613 33.002 Section 11 Parkes Tomingley 438.613 505.566 66.953 Section 12 Tomingley Dubbo 505.566 556.632 51.066 Section 13 Dubbo Gilgandra 556.632 622.546 65.914 Section 14 Gilgandra Gowang 622.546 678.640 56.094 Section 15 Gowang Coonabarabran 678.640 716.589 37.949 Section 16 Coonabarabran Narrabri 716.589 835.655 119.066 Section 17 Narrabri Moree 835.655 936.029 100.374 Section 18 Moree Boggabilla 936.029 1050.753 114.724 Section 19 Boggabilla Goondiwindi 1050.753 1058.043 7.290 Total Tocumwal Goondiwindi 0.470 1058.043 1057.573
* Chainage zero is the Victorian border and is based on the RTA ‘Roadloc’ reference system for locating points on the road network.
Newell Highway Potential Overtaking Lanes Study Final Draft Report
9 March 2011 7
Figure 2.2 Analysis sections

Newell Highway Potential Overtaking Lanes Study Final Draft Report
9 March 2011 8
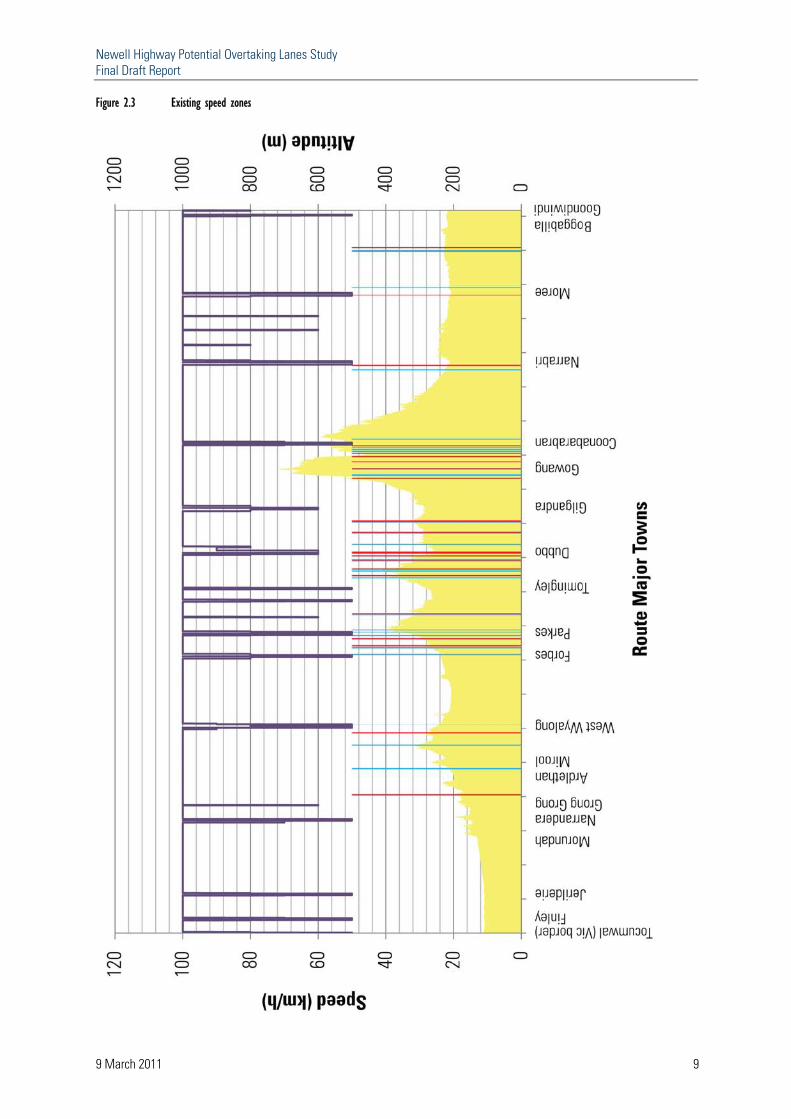
2.2 Speed zones The majority of the highway has a speed limit of 100 km/h, sections of the highway reduce to between 90 km/h and 50 km/h. The length of highway within each of the speed zones is summarised in Table 2.2
Table 2.2 Newell Highway speed zones
Section No. Towns/Localities Length
(km) Length of highway with particular speed limit (km)
From To 50km/h 60km/h 70km/h 80km/h 90km/h 100km/h Section 1 Tocumwal Finley 20.8 2.4 0.0 0.0 1.5 0.0 17.1 Section 2 Finley Jerilderie 35.0 1.3 0.0 1.3 0.0 0.0 32.4 Section 3 Jerilderie Morundah 77.7 2.1 0.0 0.0 0.7 0.0 74.9 Section 4 Morundah Narrandera 31.2 0.4 0.4 2.5 0.0 0.0 28.4 Section 5 Narrandera Grong Grong 22.1 2.4 0.3 0.0 0.0 0.0 19.5 Section 6 Grong Grong Ardlethan 39.7 0.0 0.8 0.0 0.0 0.0 39.0 Section 7 Ardlethan Mirool 24.0 0.0 0.0 0.0 0.0 0.0 24.1 Section 8 Mirool West Wyalong 50.2 0.4 0.0 0.0 0.0 2.2 47.3 Section 9 West Wyalong Forbes 104.5 4.8 0.0 0.0 3.0 1.2 95.5 Section 10 Forbes Parkes 33.0 3.4 0.0 0.0 2.8 0.0 27.0 Section 11 Parkes Tomingley 67.0 5.9 0.6 0.0 2.4 0.0 58.1 Section 12 Tomingley Dubbo 51.1 0.3 1.6 0.0 1.5 0.0 47.7 Section 13 Dubbo Gilgandra 65.9 0.0 5.9 0.0 3.8 4.5 51.8 Section 14 Gilgandra Gowang 56.1 0.0 0.5 0.0 2.6 0.0 52.5 Section 15 Gowang Coonabarabran 37.9 1.5 0.0 1.0 0.0 0.0 36.1 Section 16 Coonabarabran Narrabri 119.1 5.1 0.0 1.2 0.3 0.0 112.6 Section 17 Narrabri Moree 100.4 4.9 2.0 0.0 2.9 0.0 90.7 Section 18 Moree Boggabilla 114.7 1.6 0.0 0.0 1.0 0.0 112.2 Section 19 Boggabilla Goondiwindi 7.3 0.7 0.0 0.0 0.8 0.0 5.7 Total Tocumwal Goondiwindi 1057.6 37.2 11.7 6 23.3 7.9 972.6 3.5% 1.1% 0.6% 2.2% 0.7% 92.0%
Over 92 per cent (973 kilometres) of the highway is within a 100 km/h speed zone. The location of speed zones are depicted graphically on Figure 2.3.
Newell Highway Potential Overtaking Lanes Study Final Draft Report
9 March 2011 9
Figure 2.3 Existing speed zones
Newell Highway Potential Overtaking Lanes Study Final Draft Report
9 March 2011 10
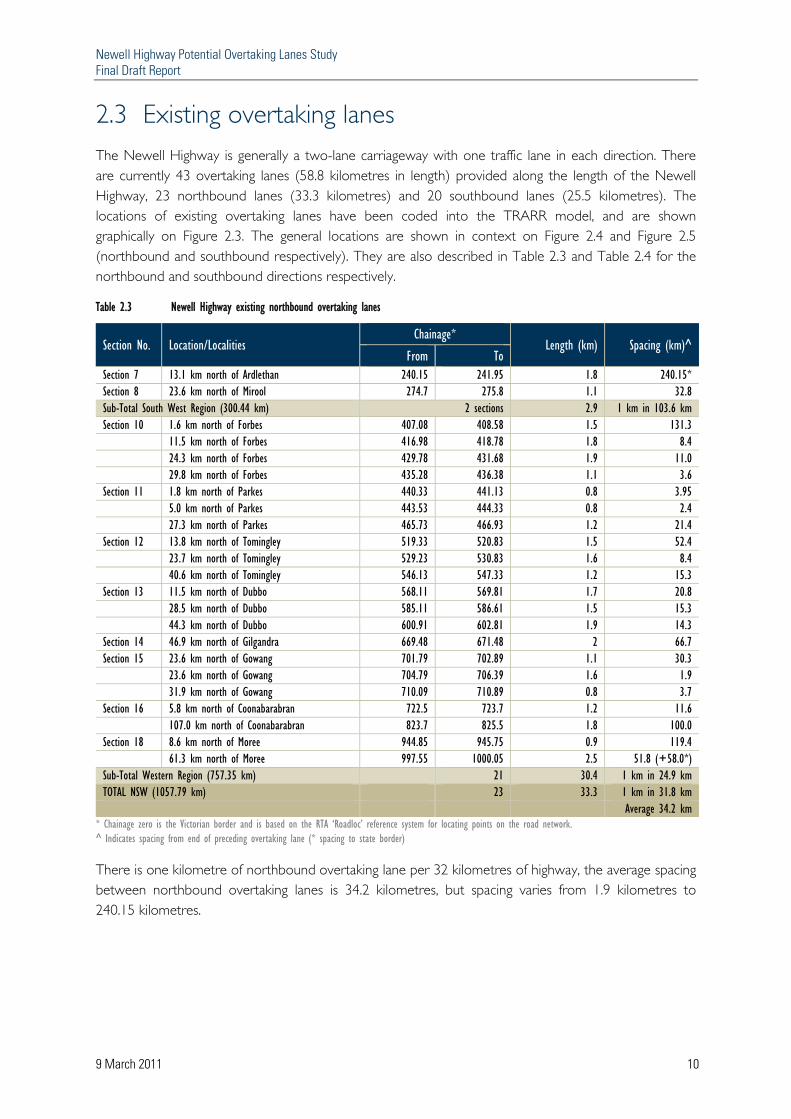
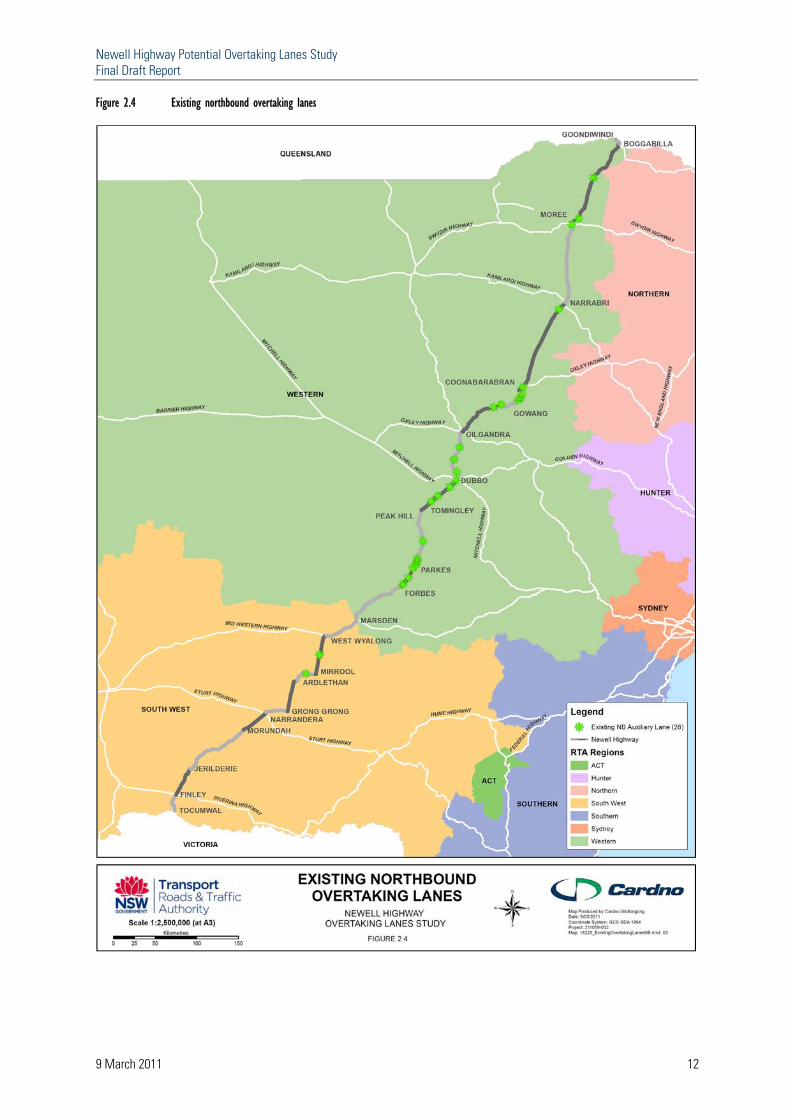
2.3 Existing overtaking lanes The Newell Highway is generally a two-lane carriageway with one traffic lane in each direction. There are currently 43 overtaking lanes (58.8 kilometres in length) provided along the length of the Newell Highway, 23 northbound lanes (33.3 kilometres) and 20 southbound lanes (25.5 kilometres). The locations of existing overtaking lanes have been coded into the TRARR model, and are shown graphically on Figure 2.3. The general locations are shown in context on Figure 2.4 and Figure 2.5 (northbound and southbound respectively). They are also described in Table 2.3 and Table 2.4 for the northbound and southbound directions respectively.
Table 2.3 Newell Highway existing northbound overtaking lanes
Section No. Location/Localities Chainage*
Length (km) Spacing (km)^ From To
Section 7 13.1 km north of Ardlethan 240.15 241.95 1.8 240.15* Section 8 23.6 km north of Mirool 274.7 275.8 1.1 32.8 Sub-Total South West Region (300.44 km) 2 sections 2.9 1 km in 103.6 km Section 10 1.6 km north of Forbes 407.08 408.58 1.5 131.3 11.5 km north of Forbes 416.98 418.78 1.8 8.4 24.3 km north of Forbes 429.78 431.68 1.9 11.0 29.8 km north of Forbes 435.28 436.38 1.1 3.6 Section 11 1.8 km north of Parkes 440.33 441.13 0.8 3.95 5.0 km north of Parkes 443.53 444.33 0.8 2.4 27.3 km north of Parkes 465.73 466.93 1.2 21.4 Section 12 13.8 km north of Tomingley 519.33 520.83 1.5 52.4 23.7 km north of Tomingley 529.23 530.83 1.6 8.4 40.6 km north of Tomingley 546.13 547.33 1.2 15.3 Section 13 11.5 km north of Dubbo 568.11 569.81 1.7 20.8 28.5 km north of Dubbo 585.11 586.61 1.5 15.3 44.3 km north of Dubbo 600.91 602.81 1.9 14.3 Section 14 46.9 km north of Gilgandra 669.48 671.48 2 66.7 Section 15 23.6 km north of Gowang 701.79 702.89 1.1 30.3 23.6 km north of Gowang 704.79 706.39 1.6 1.9 31.9 km north of Gowang 710.09 710.89 0.8 3.7 Section 16 5.8 km north of Coonabarabran 722.5 723.7 1.2 11.6 107.0 km north of Coonabarabran 823.7 825.5 1.8 100.0 Section 18 8.6 km north of Moree 944.85 945.75 0.9 119.4 61.3 km north of Moree 997.55 1000.05 2.5 51.8 (+58.0*) Sub-Total Western Region (757.35 km) 21 30.4 1 km in 24.9 km TOTAL NSW (1057.79 km) 23 33.3 1 km in 31.8 km Average 34.2 km
* Chainage zero is the Victorian border and is based on the RTA ‘Roadloc’ reference system for locating points on the road network. ^ Indicates spacing from end of preceding overtaking lane (* spacing to state border)
There is one kilometre of northbound overtaking lane per 32 kilometres of highway, the average spacing between northbound overtaking lanes is 34.2 kilometres, but spacing varies from 1.9 kilometres to 240.15 kilometres.
Newell Highway Potential Overtaking Lanes Study Final Draft Report
9 March 2011 11
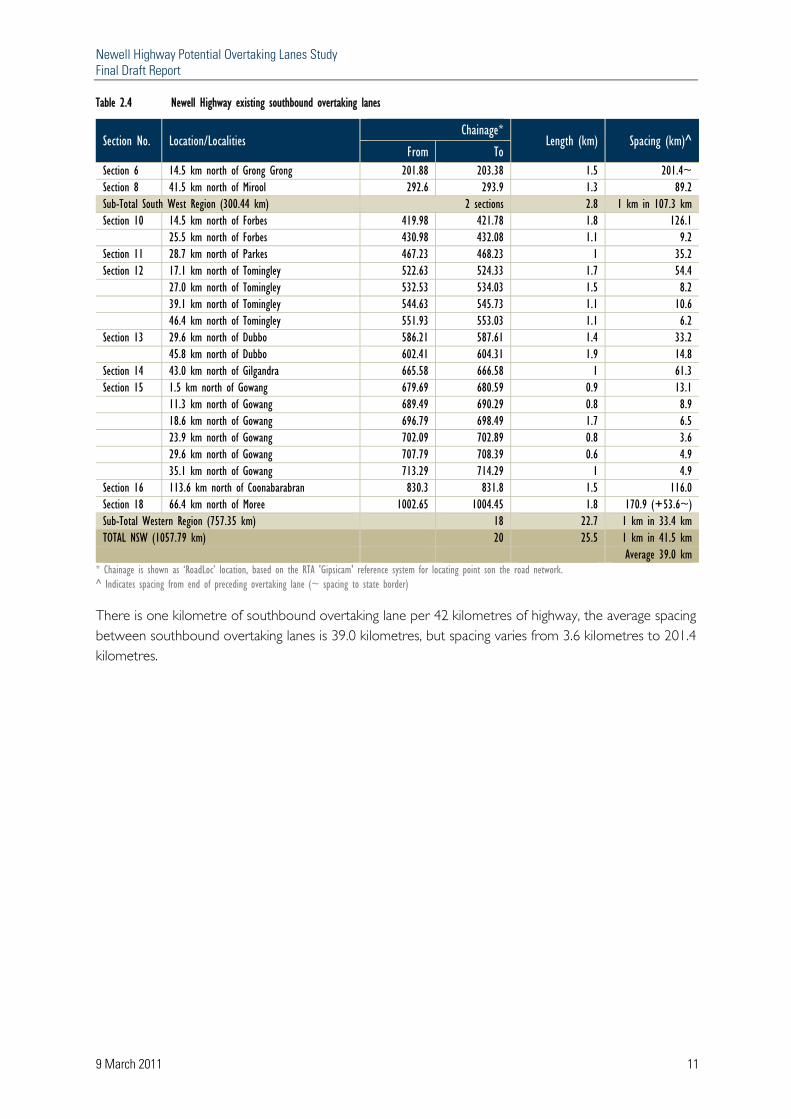
Table 2.4 Newell Highway existing southbound overtaking lanes
Section No. Location/Localities Chainage*
Length (km) Spacing (km)^ From To
Section 6 14.5 km north of Grong Grong 201.88 203.38 1.5 201.4~ Section 8 41.5 km north of Mirool 292.6 293.9 1.3 89.2 Sub-Total South West Region (300.44 km) 2 sections 2.8 1 km in 107.3 km Section 10 14.5 km north of Forbes 419.98 421.78 1.8 126.1 25.5 km north of Forbes 430.98 432.08 1.1 9.2 Section 11 28.7 km north of Parkes 467.23 468.23 1 35.2 Section 12 17.1 km north of Tomingley 522.63 524.33 1.7 54.4 27.0 km north of Tomingley 532.53 534.03 1.5 8.2 39.1 km north of Tomingley 544.63 545.73 1.1 10.6 46.4 km north of Tomingley 551.93 553.03 1.1 6.2 Section 13 29.6 km north of Dubbo 586.21 587.61 1.4 33.2 45.8 km north of Dubbo 602.41 604.31 1.9 14.8 Section 14 43.0 km north of Gilgandra 665.58 666.58 1 61.3 Section 15 1.5 km north of Gowang 679.69 680.59 0.9 13.1 11.3 km north of Gowang 689.49 690.29 0.8 8.9 18.6 km north of Gowang 696.79 698.49 1.7 6.5 23.9 km north of Gowang 702.09 702.89 0.8 3.6 29.6 km north of Gowang 707.79 708.39 0.6 4.9 35.1 km north of Gowang 713.29 714.29 1 4.9 Section 16 113.6 km north of Coonabarabran 830.3 831.8 1.5 116.0 Section 18 66.4 km north of Moree 1002.65 1004.45 1.8 170.9 (+53.6~) Sub-Total Western Region (757.35 km) 18 22.7 1 km in 33.4 km TOTAL NSW (1057.79 km) 20 25.5 1 km in 41.5 km Average 39.0 km
* Chainage is shown as ‘RoadLoc’ location, based on the RTA 'Gipsicam' reference system for locating point son the road network. ^ Indicates spacing from end of preceding overtaking lane (~ spacing to state border)
There is one kilometre of southbound overtaking lane per 42 kilometres of highway, the average spacing between southbound overtaking lanes is 39.0 kilometres, but spacing varies from 3.6 kilometres to 201.4 kilometres.
Newell Highway Potential Overtaking Lanes Study Final Draft Report
9 March 2011 12
Figure 2.4 Existing northbound overtaking lanes

Newell Highway Potential Overtaking Lanes Study Final Draft Report
9 March 2011 13
Figure 2.5 Existing southbound overtaking lanes
Newell Highway Potential Overtaking Lanes Study Final Draft Report
9 March 2011 14
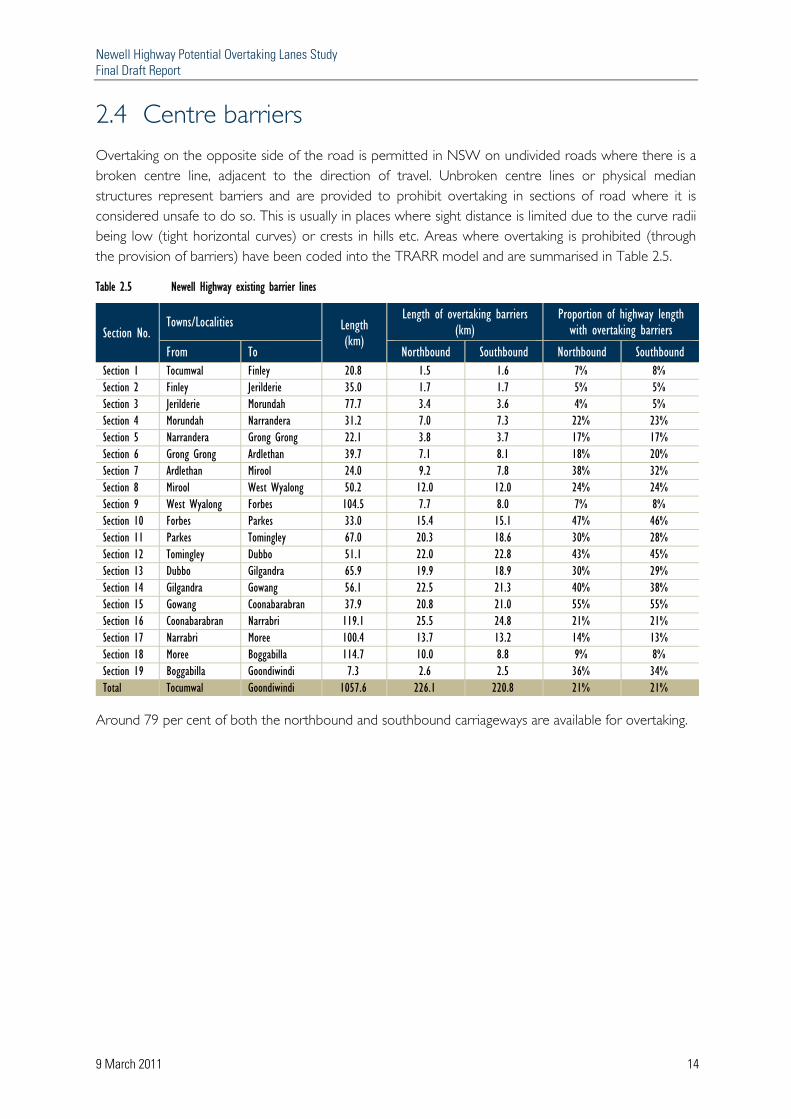
2.4 Centre barriers Overtaking on the opposite side of the road is permitted in NSW on undivided roads where there is a broken centre line, adjacent to the direction of travel. Unbroken centre lines or physical median structures represent barriers and are provided to prohibit overtaking in sections of road where it is considered unsafe to do so. This is usually in places where sight distance is limited due to the curve radii being low (tight horizontal curves) or crests in hills etc. Areas where overtaking is prohibited (through the provision of barriers) have been coded into the TRARR model and are summarised in Table 2.5.
Table 2.5 Newell Highway existing barrier lines
Section No. Towns/Localities Length
(km)
Length of overtaking barriers (km)
Proportion of highway length with overtaking barriers
From To Northbound Southbound Northbound Southbound Section 1 Tocumwal Finley 20.8 1.5 1.6 7% 8% Section 2 Finley Jerilderie 35.0 1.7 1.7 5% 5% Section 3 Jerilderie Morundah 77.7 3.4 3.6 4% 5% Section 4 Morundah Narrandera 31.2 7.0 7.3 22% 23% Section 5 Narrandera Grong Grong 22.1 3.8 3.7 17% 17% Section 6 Grong Grong Ardlethan 39.7 7.1 8.1 18% 20% Section 7 Ardlethan Mirool 24.0 9.2 7.8 38% 32% Section 8 Mirool West Wyalong 50.2 12.0 12.0 24% 24% Section 9 West Wyalong Forbes 104.5 7.7 8.0 7% 8% Section 10 Forbes Parkes 33.0 15.4 15.1 47% 46% Section 11 Parkes Tomingley 67.0 20.3 18.6 30% 28% Section 12 Tomingley Dubbo 51.1 22.0 22.8 43% 45% Section 13 Dubbo Gilgandra 65.9 19.9 18.9 30% 29% Section 14 Gilgandra Gowang 56.1 22.5 21.3 40% 38% Section 15 Gowang Coonabarabran 37.9 20.8 21.0 55% 55% Section 16 Coonabarabran Narrabri 119.1 25.5 24.8 21% 21% Section 17 Narrabri Moree 100.4 13.7 13.2 14% 13% Section 18 Moree Boggabilla 114.7 10.0 8.8 9% 8% Section 19 Boggabilla Goondiwindi 7.3 2.6 2.5 36% 34% Total Tocumwal Goondiwindi 1057.6 226.1 220.8 21% 21%
Around 79 per cent of both the northbound and southbound carriageways are available for overtaking.
Newell Highway Potential Overtaking Lanes Study Final Draft Report
9 March 2011 15
2.5 Road geometry and sight lines 2.5.1 Curve radii
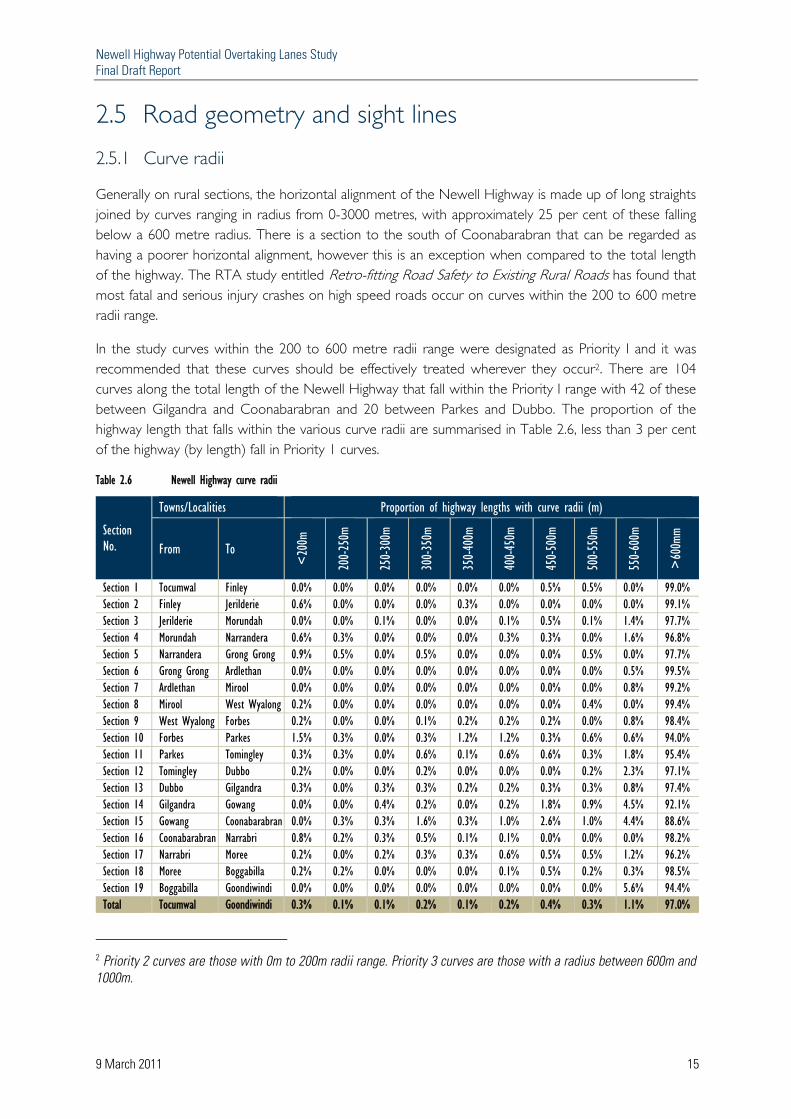
Generally on rural sections, the horizontal alignment of the Newell Highway is made up of long straights joined by curves ranging in radius from 0-3000 metres, with approximately 25 per cent of these falling below a 600 metre radius. There is a section to the south of Coonabarabran that can be regarded as having a poorer horizontal alignment, however this is an exception when compared to the total length of the highway. The RTA study entitled Retro-fitting Road Safety to Existing Rural Roads has found that most fatal and serious injury crashes on high speed roads occur on curves within the 200 to 600 metre radii range.
In the study curves within the 200 to 600 metre radii range were designated as Priority I and it was recommended that these curves should be effectively treated wherever they occur2. There are 104 curves along the total length of the Newell Highway that fall within the Priority I range with 42 of these between Gilgandra and Coonabarabran and 20 between Parkes and Dubbo. The proportion of the highway length that falls within the various curve radii are summarised in Table 2.6, less than 3 per cent of the highway (by length) fall in Priority 1 curves.
Table 2.6 Newell Highway curve radii
Section No.
Towns/Localities Proportion of highway lengths with curve radii (m)
From To
<20
0m
200-25
0m
250-30
0m
300-35
0m
350-40
0m
400-45
0m
450-50
0m
500-55
0m
550-60
0m
>60
0mm
Section 1 Tocumwal Finley 0.0% 0.0% 0.0% 0.0% 0.0% 0.0% 0.5% 0.5% 0.0% 99.0% Section 2 Finley Jerilderie 0.6% 0.0% 0.0% 0.0% 0.3% 0.0% 0.0% 0.0% 0.0% 99.1% Section 3 Jerilderie Morundah 0.0% 0.0% 0.1% 0.0% 0.0% 0.1% 0.5% 0.1% 1.4% 97.7% Section 4 Morundah Narrandera 0.6% 0.3% 0.0% 0.0% 0.0% 0.3% 0.3% 0.0% 1.6% 96.8% Section 5 Narrandera Grong Grong 0.9% 0.5% 0.0% 0.5% 0.0% 0.0% 0.0% 0.5% 0.0% 97.7% Section 6 Grong Grong Ardlethan 0.0% 0.0% 0.0% 0.0% 0.0% 0.0% 0.0% 0.0% 0.5% 99.5% Section 7 Ardlethan Mirool 0.0% 0.0% 0.0% 0.0% 0.0% 0.0% 0.0% 0.0% 0.8% 99.2% Section 8 Mirool West Wyalong 0.2% 0.0% 0.0% 0.0% 0.0% 0.0% 0.0% 0.4% 0.0% 99.4% Section 9 West Wyalong Forbes 0.2% 0.0% 0.0% 0.1% 0.2% 0.2% 0.2% 0.0% 0.8% 98.4% Section 10 Forbes Parkes 1.5% 0.3% 0.0% 0.3% 1.2% 1.2% 0.3% 0.6% 0.6% 94.0% Section 11 Parkes Tomingley 0.3% 0.3% 0.0% 0.6% 0.1% 0.6% 0.6% 0.3% 1.8% 95.4% Section 12 Tomingley Dubbo 0.2% 0.0% 0.0% 0.2% 0.0% 0.0% 0.0% 0.2% 2.3% 97.1% Section 13 Dubbo Gilgandra 0.3% 0.0% 0.3% 0.3% 0.2% 0.2% 0.3% 0.3% 0.8% 97.4% Section 14 Gilgandra Gowang 0.0% 0.0% 0.4% 0.2% 0.0% 0.2% 1.8% 0.9% 4.5% 92.1% Section 15 Gowang Coonabarabran 0.0% 0.3% 0.3% 1.6% 0.3% 1.0% 2.6% 1.0% 4.4% 88.6% Section 16 Coonabarabran Narrabri 0.8% 0.2% 0.3% 0.5% 0.1% 0.1% 0.0% 0.0% 0.0% 98.2% Section 17 Narrabri Moree 0.2% 0.0% 0.2% 0.3% 0.3% 0.6% 0.5% 0.5% 1.2% 96.2% Section 18 Moree Boggabilla 0.2% 0.2% 0.0% 0.0% 0.0% 0.1% 0.5% 0.2% 0.3% 98.5% Section 19 Boggabilla Goondiwindi 0.0% 0.0% 0.0% 0.0% 0.0% 0.0% 0.0% 0.0% 5.6% 94.4% Total Tocumwal Goondiwindi 0.3% 0.1% 0.1% 0.2% 0.1% 0.2% 0.4% 0.3% 1.1% 97.0%
2 Priority 2 curves are those with 0m to 200m radii range. Priority 3 curves are those with a radius between 600m and 1000m.

Newell Highway Potential Overtaking Lanes Study Final Draft Report
9 March 2011 16
2.5.2 Vertical grades
The vertical alignment along the full length of the Newell Highway is generally flat to rolling with the only exception being in the 100 kilometre length of the Newell Highway immediately south of Coonabarabran. A summary of the proportion of the highway length with particular vertical grades is shown in Table 2.7.
Table 2.7 Newell Highway vertical grades
Section No.
Towns/Localities Proportion of highway lengths with grades (per cent)
From To
<+
/-1
+/-1
to +
/-2
+/-2
to +
/-3
+/-3
to +
/-4
+/-4
to +
/-5
+/-5
to +
/-6
+/-6
to +
/-7
+/-7
to +
/-8
Section 1 Tocumwal Finley 100.0% 0.0% 0.0% 0.0% 0.0% 0.0% 0.0% 0.0% Section 2 Finley Jerilderie 100.0% 0.0% 0.0% 0.0% 0.0% 0.0% 0.0% 0.0% Section 3 Jerilderie Morundah 99.4% 0.3% 0.4% 0.0% 0.0% 0.0% 0.0% 0.0% Section 4 Morundah Narrandera 74.8% 14.7% 7.7% 2.9% 0.0% 0.0% 0.0% 0.0% Section 5 Narrandera Grong Grong 73.0% 14.9% 8.1% 2.3% 1.4% 0.5% 0.0% 0.0% Section 6 Grong Grong Ardlethan 71.4% 19.6% 7.8% 1.0% 0.3% 0.0% 0.0% 0.0% Section 7 Ardlethan Mirool 79.3% 14.9% 3.3% 1.2% 1.2% 0.0% 0.0% 0.0% Section 8 Mirool West Wyalong 72.3% 22.0% 4.6% 1.0% 0.0% 0.0% 0.0% 0.0% Section 9 West Wyalong Forbes 93.7% 5.0% 0.8% 0.4% 0.2% 0.0% 0.0% 0.0% Section 10 Forbes Parkes 71.7% 19.0% 6.9% 2.4% 0.0% 0.0% 0.0% 0.0% Section 11 Parkes Tomingley 63.9% 21.2% 9.3% 3.6% 1.8% 0.3% 0.0% 0.0% Section 12 Tomingley Dubbo 46.4% 23.9% 20.4% 5.9% 3.1% 0.2% 0.2% 0.0% Section 13 Dubbo Gilgandra 75.6% 20.2% 3.2% 0.8% 0.3% 0.0% 0.0% 0.0% Section 14 Gilgandra Gowang 49.1% 23.4% 11.5% 5.8% 4.9% 4.3% 0.9% 0.2% Section 15 Gowang Coonabarabran 32.4% 25.9% 15.3% 12.2% 4.9% 6.7% 2.1% 0.5% Section 16 Coonabarabran Narrabri 62.3% 21.7% 11.2% 3.5% 1.3% 0.0% 0.0% 0.0% Section 17 Narrabri Moree 92.5% 5.6% 1.6% 0.2% 0.1% 0.0% 0.0% 0.0% Section 18 Moree Boggabilla 99.2% 0.7% 0.1% 0.0% 0.0% 0.0% 0.0% 0.0% Section 19 Boggabilla Goondiwindi 100.0% 0.0% 0.0% 0.0% 0.0% 0.0% 0.0% 0.0% Total Tocumwal Goondiwindi 77.7% 12.9% 5.6% 2.1% 1.0% 0.5% 0.1% 0.0%
Overall, less than one per cent of the highway has a grade of greater than five per cent. However as previously mentioned there are sections of the highway through the Warrumbungles with much higher proportions of higher grade sections.
Newell Highway Potential Overtaking Lanes Study Final Draft Report
9 March 2011 17
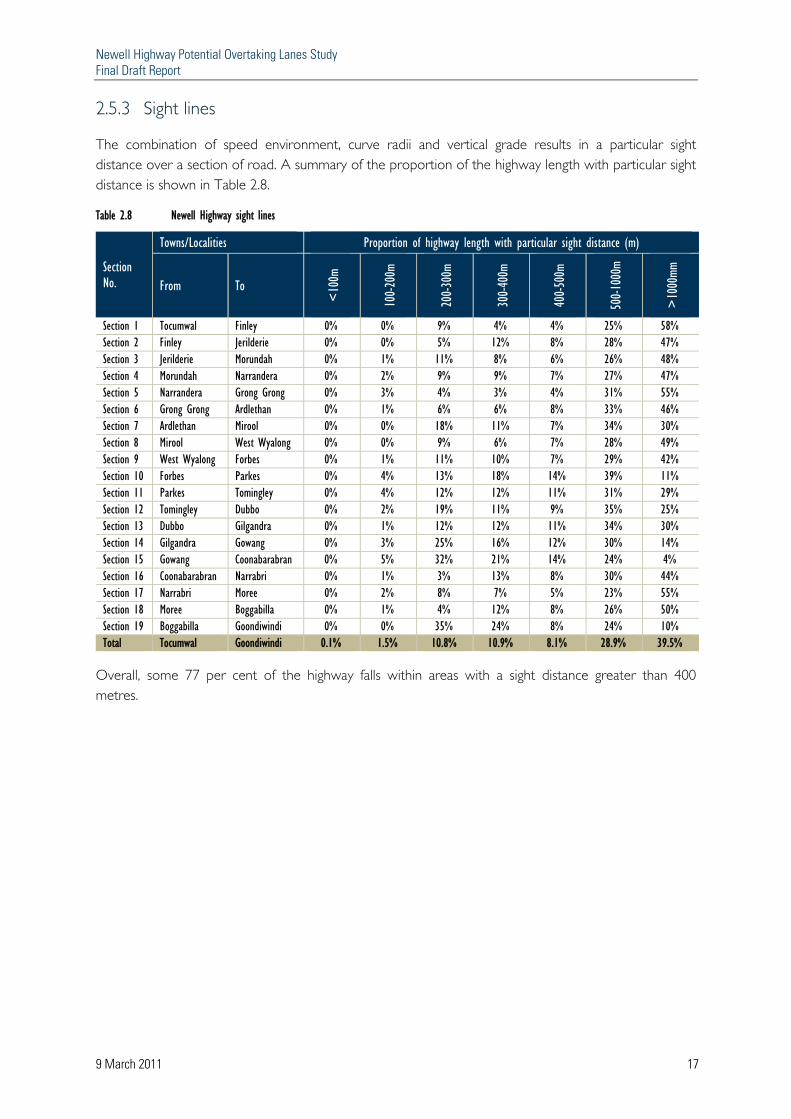
2.5.3 Sight lines
The combination of speed environment, curve radii and vertical grade results in a particular sight distance over a section of road. A summary of the proportion of the highway length with particular sight distance is shown in Table 2.8.
Table 2.8 Newell Highway sight lines
Section No.
Towns/Localities Proportion of highway length with particular sight distance (m)
From To
<10
0m
100-20
0m
200-30
0m
300-40
0m
400-50
0m
500-10
00m
>10
00mm
Section 1 Tocumwal Finley 0% 0% 9% 4% 4% 25% 58% Section 2 Finley Jerilderie 0% 0% 5% 12% 8% 28% 47% Section 3 Jerilderie Morundah 0% 1% 11% 8% 6% 26% 48% Section 4 Morundah Narrandera 0% 2% 9% 9% 7% 27% 47% Section 5 Narrandera Grong Grong 0% 3% 4% 3% 4% 31% 55% Section 6 Grong Grong Ardlethan 0% 1% 6% 6% 8% 33% 46% Section 7 Ardlethan Mirool 0% 0% 18% 11% 7% 34% 30% Section 8 Mirool West Wyalong 0% 0% 9% 6% 7% 28% 49% Section 9 West Wyalong Forbes 0% 1% 11% 10% 7% 29% 42% Section 10 Forbes Parkes 0% 4% 13% 18% 14% 39% 11% Section 11 Parkes Tomingley 0% 4% 12% 12% 11% 31% 29% Section 12 Tomingley Dubbo 0% 2% 19% 11% 9% 35% 25% Section 13 Dubbo Gilgandra 0% 1% 12% 12% 11% 34% 30% Section 14 Gilgandra Gowang 0% 3% 25% 16% 12% 30% 14% Section 15 Gowang Coonabarabran 0% 5% 32% 21% 14% 24% 4% Section 16 Coonabarabran Narrabri 0% 1% 3% 13% 8% 30% 44% Section 17 Narrabri Moree 0% 2% 8% 7% 5% 23% 55% Section 18 Moree Boggabilla 0% 1% 4% 12% 8% 26% 50% Section 19 Boggabilla Goondiwindi 0% 0% 35% 24% 8% 24% 10% Total Tocumwal Goondiwindi 0.1% 1.5% 10.8% 10.9% 8.1% 28.9% 39.5%
Overall, some 77 per cent of the highway falls within areas with a sight distance greater than 400 metres.
Newell Highway Potential Overtaking Lanes Study Final Draft Report
9 March 2011 18
2.6 Road train routes Road trains are permitted along the Newell Highway in certain sections3:
North of Coonabarabran, including through the towns of Narrabri and Moree. Between Gilgandra and Dubbo (with restrictions). Through parts of Dubbo. Through Tomingley Village from the Main Road 89 junction to the truck stop. Through Forbes (with restrictions). Through Narrandera. Between Narrandera and Tocumwal (including Jerilderie).
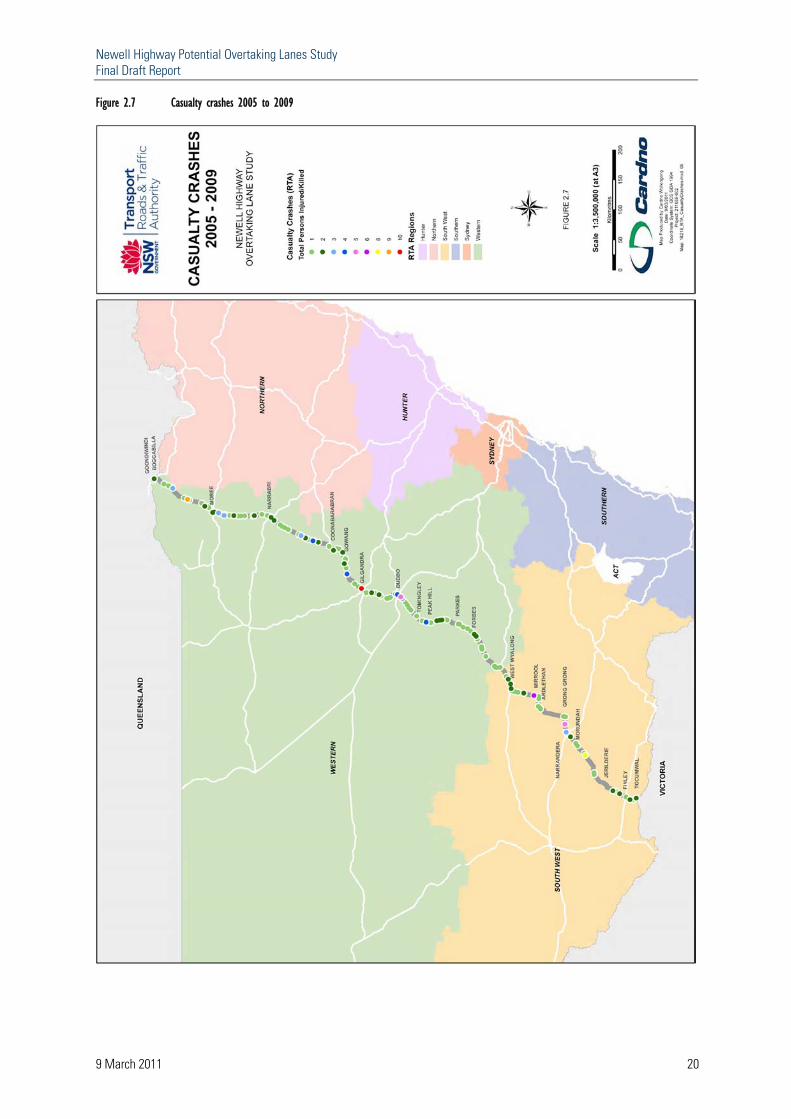
2.7 Crash statistics A detailed review of crash statistics and types has been undertaken in the Newell Highway safety review 2009. For the purposes of this report a summary of the fatalities resulting from vehicle crashes in the five year period 2005 to 2009 has been provided in Figure 2.6. The number of casualty crashes, ie crashes resulting in a fatality or injury, is shown in Figure 2.7.
3 Source: RTA Western Region

Newell Highway Potential Overtaking Lanes Study Final Draft Report
9 March 2011 19
Figure 2.6 Fatal crashes 2005 to 2009
Newell Highway Potential Overtaking Lanes Study Final Draft Report
9 March 2011 20
Figure 2.7 Casualty crashes 2005 to 2009
Newell Highway Potential Overtaking Lanes Study Final Draft Report
9 March 2011 21
2.8 Traffic types and volumes Traffic surveys were undertaken along the Newell Highway between 2006 and 2010 to determine traffic volumes, mix of vehicle classes, travel speeds and headways (distance between vehicles). 2010 traffic volumes have been estimated for all sites. It should be noted that all traffic data used in this study is based on a two week sample from the above mentioned time period.
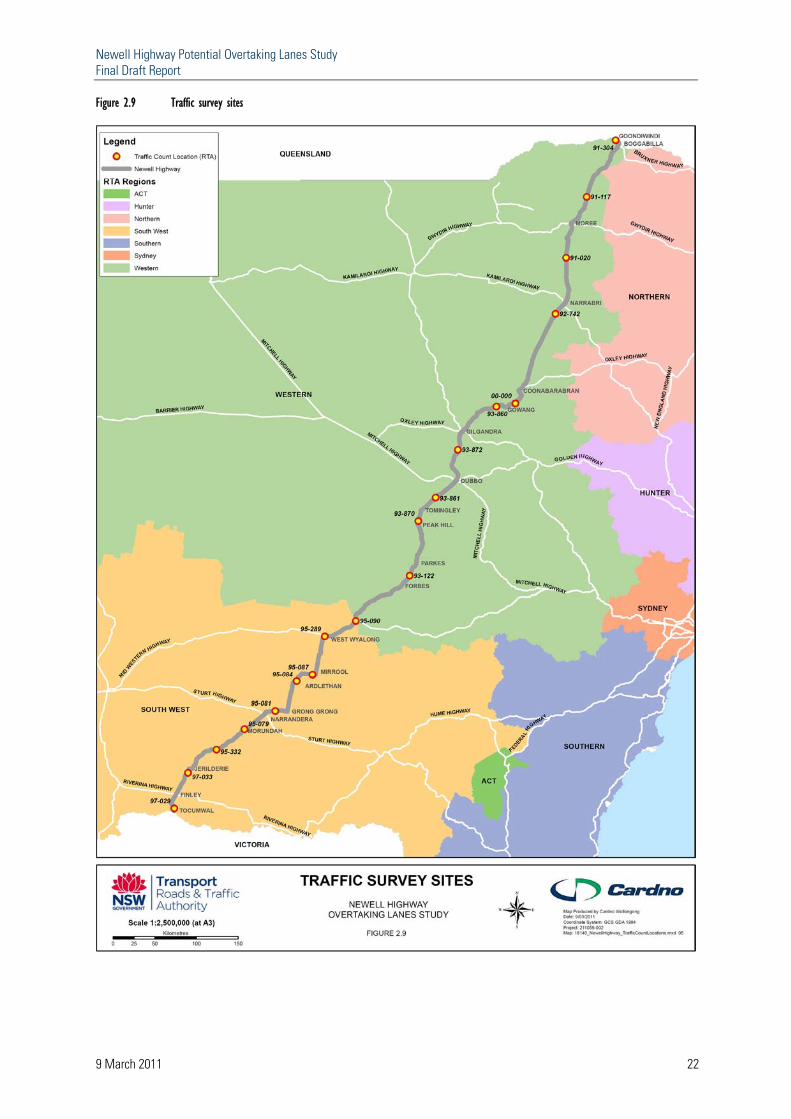
This study focus is on the traffic travelling between towns and hence most survey locations are between towns at the local government area (LGA) boundaries. The specific location of traffic surveys is provided in Figure 2.9.
2.8.1 Daily traffic
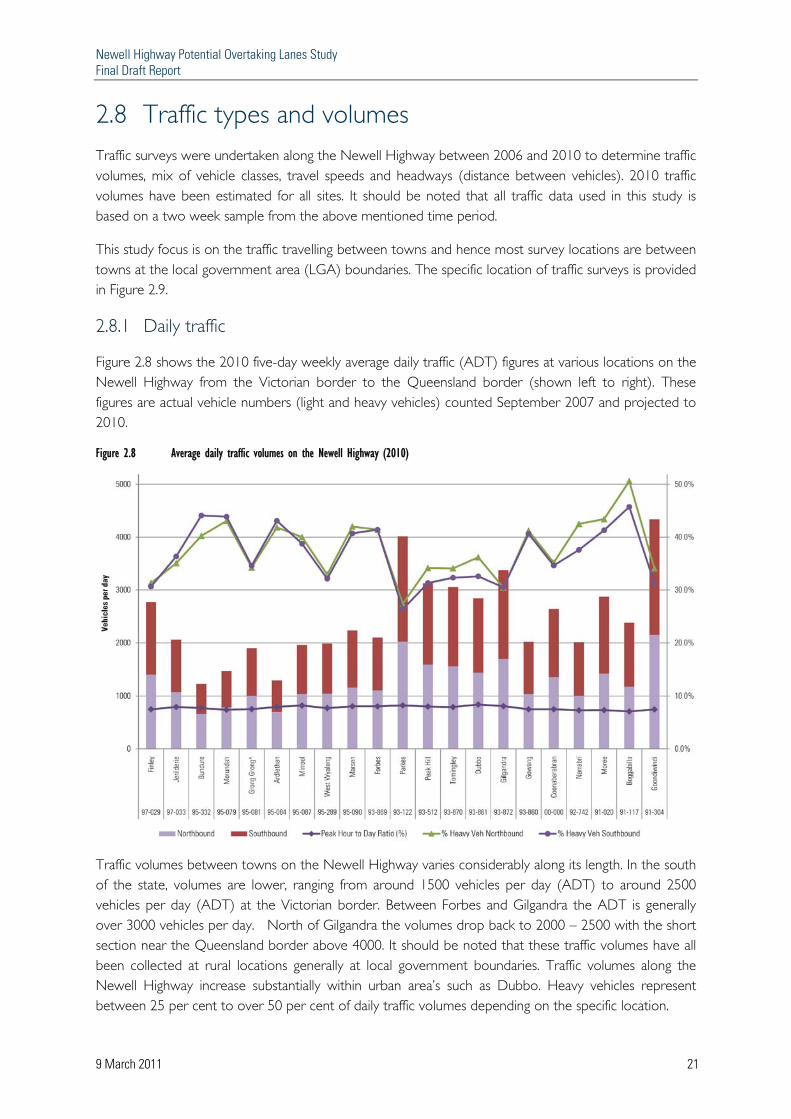
Figure 2.8 shows the 2010 five-day weekly average daily traffic (ADT) figures at various locations on the Newell Highway from the Victorian border to the Queensland border (shown left to right). These figures are actual vehicle numbers (light and heavy vehicles) counted September 2007 and projected to 2010.
Figure 2.8 Average daily traffic volumes on the Newell Highway (2010)
Traffic volumes between towns on the Newell Highway varies considerably along its length. In the south of the state, volumes are lower, ranging from around 1500 vehicles per day (ADT) to around 2500 vehicles per day (ADT) at the Victorian border. Between Forbes and Gilgandra the ADT is generally over 3000 vehicles per day. North of Gilgandra the volumes drop back to 2000 – 2500 with the short section near the Queensland border above 4000. It should be noted that these traffic volumes have all been collected at rural locations generally at local government boundaries. Traffic volumes along the Newell Highway increase substantially within urban area’s such as Dubbo. Heavy vehicles represent between 25 per cent to over 50 per cent of daily traffic volumes depending on the specific location.
Newell Highway Potential Overtaking Lanes Study Final Draft Report
9 March 2011 22
Figure 2.9 Traffic survey sites
Newell Highway Potential Overtaking Lanes Study Final Draft Report
9 March 2011 23
2.8.2 Peak hour traffic
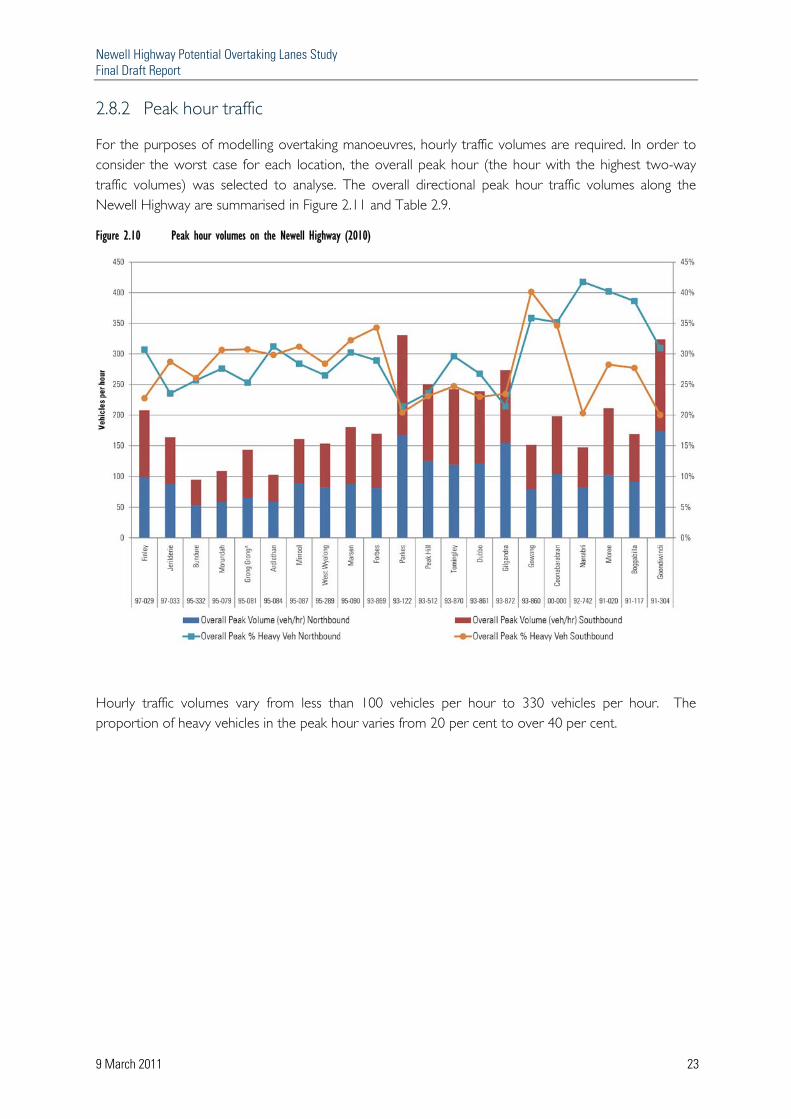
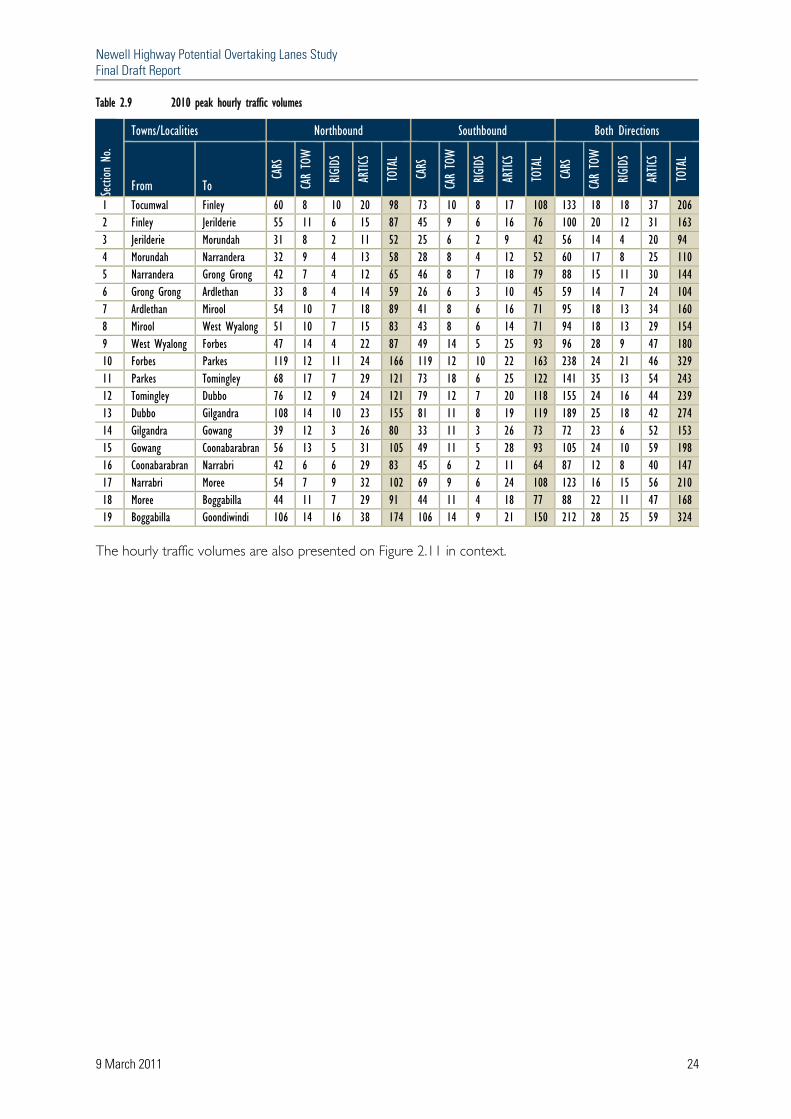
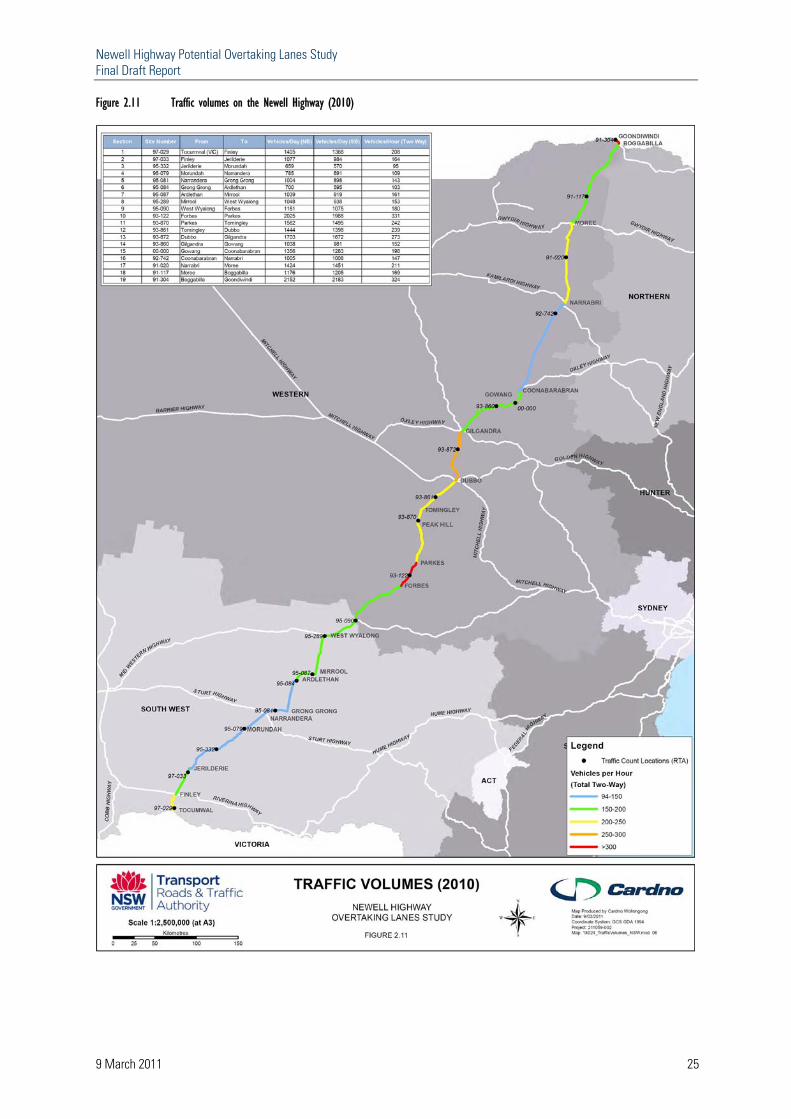
For the purposes of modelling overtaking manoeuvres, hourly traffic volumes are required. In order to consider the worst case for each location, the overall peak hour (the hour with the highest two-way traffic volumes) was selected to analyse. The overall directional peak hour traffic volumes along the Newell Highway are summarised in Figure 2.11 and Table 2.9.
Figure 2.10 Peak hour volumes on the Newell Highway (2010)
Hourly traffic volumes vary from less than 100 vehicles per hour to 330 vehicles per hour. The proportion of heavy vehicles in the peak hour varies from 20 per cent to over 40 per cent.
Newell Highway Potential Overtaking Lanes Study Final Draft Report
9 March 2011 24
Table 2.9 2010 peak hourly traffic volumes Sec
tion
No.
Towns/Localities Northbound Southbound Both Directions
From To
CARS
CAR
TOW
RIGIDS
ARTIC
S
TOTAL
CARS
CAR
TOW
RIGIDS
ARTIC
S
TOTAL
CARS
CAR
TOW
RIGIDS
ARTIC
S
TOTAL
1 Tocumwal Finley 60 8 10 20 98 73 10 8 17 108 133 18 18 37 206 2 Finley Jerilderie 55 11 6 15 87 45 9 6 16 76 100 20 12 31 163 3 Jerilderie Morundah 31 8 2 11 52 25 6 2 9 42 56 14 4 20 94 4 Morundah Narrandera 32 9 4 13 58 28 8 4 12 52 60 17 8 25 110 5 Narrandera Grong Grong 42 7 4 12 65 46 8 7 18 79 88 15 11 30 144 6 Grong Grong Ardlethan 33 8 4 14 59 26 6 3 10 45 59 14 7 24 104 7 Ardlethan Mirool 54 10 7 18 89 41 8 6 16 71 95 18 13 34 160 8 Mirool West Wyalong 51 10 7 15 83 43 8 6 14 71 94 18 13 29 154 9 West Wyalong Forbes 47 14 4 22 87 49 14 5 25 93 96 28 9 47 180 10 Forbes Parkes 119 12 11 24 166 119 12 10 22 163 238 24 21 46 329 11 Parkes Tomingley 68 17 7 29 121 73 18 6 25 122 141 35 13 54 243 12 Tomingley Dubbo 76 12 9 24 121 79 12 7 20 118 155 24 16 44 239 13 Dubbo Gilgandra 108 14 10 23 155 81 11 8 19 119 189 25 18 42 274 14 Gilgandra Gowang 39 12 3 26 80 33 11 3 26 73 72 23 6 52 153 15 Gowang Coonabarabran 56 13 5 31 105 49 11 5 28 93 105 24 10 59 198 16 Coonabarabran Narrabri 42 6 6 29 83 45 6 2 11 64 87 12 8 40 147 17 Narrabri Moree 54 7 9 32 102 69 9 6 24 108 123 16 15 56 210 18 Moree Boggabilla 44 11 7 29 91 44 11 4 18 77 88 22 11 47 168 19 Boggabilla Goondiwindi 106 14 16 38 174 106 14 9 21 150 212 28 25 59 324
The hourly traffic volumes are also presented on Figure 2.11 in context.
Newell Highway Potential Overtaking Lanes Study Final Draft Report
9 March 2011 25
Figure 2.11 Traffic volumes on the Newell Highway (2010)
Newell Highway Potential Overtaking Lanes Study Final Draft Report
9 March 2011 26
2.8.3 Mix of vehicles
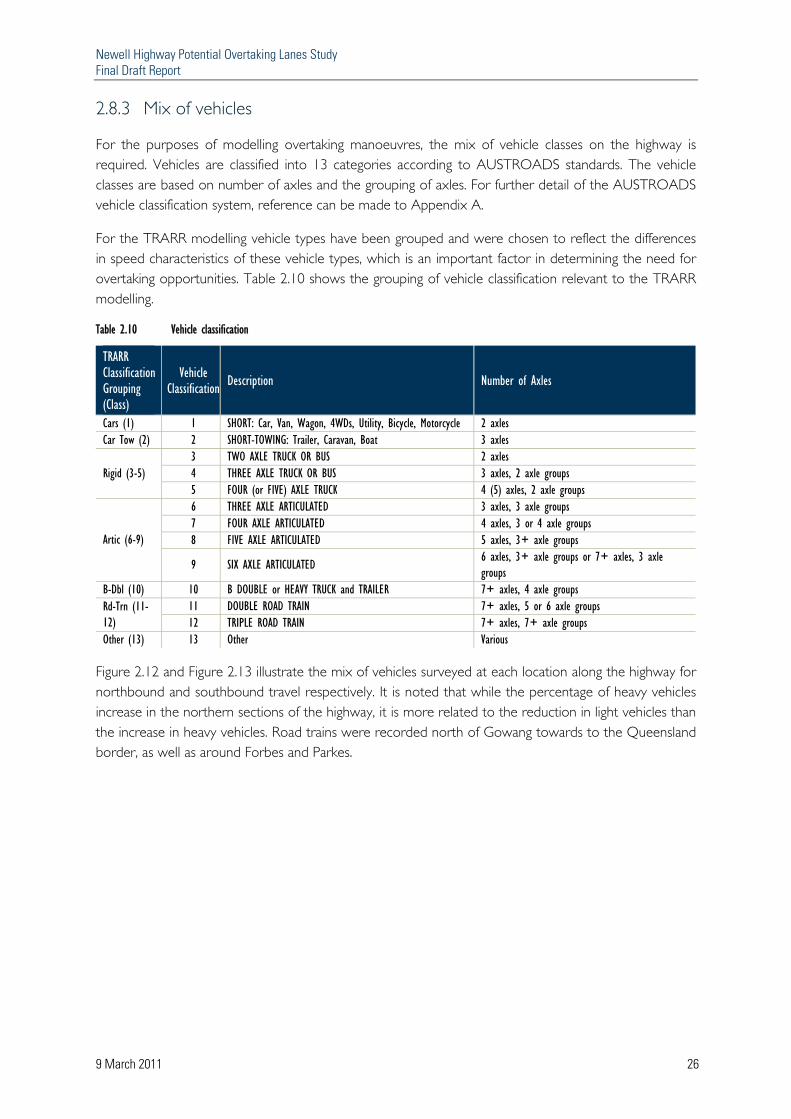
For the purposes of modelling overtaking manoeuvres, the mix of vehicle classes on the highway is required. Vehicles are classified into 13 categories according to AUSTROADS standards. The vehicle classes are based on number of axles and the grouping of axles. For further detail of the AUSTROADS vehicle classification system, reference can be made to Appendix A.
For the TRARR modelling vehicle types have been grouped and were chosen to reflect the differences in speed characteristics of these vehicle types, which is an important factor in determining the need for overtaking opportunities. Table 2.10 shows the grouping of vehicle classification relevant to the TRARR modelling.
Table 2.10 Vehicle classification
TRARR Classification Grouping (Class)
Vehicle Classification Description Number of Axles
Cars (1) 1 SHORT: Car, Van, Wagon, 4WDs, Utility, Bicycle, Motorcycle 2 axles Car Tow (2) 2 SHORT-TOWING: Trailer, Caravan, Boat 3 axles
Rigid (3-5) 3 TWO AXLE TRUCK OR BUS 2 axles 4 THREE AXLE TRUCK OR BUS 3 axles, 2 axle groups 5 FOUR (or FIVE) AXLE TRUCK 4 (5) axles, 2 axle groups
Artic (6-9)
6 THREE AXLE ARTICULATED 3 axles, 3 axle groups 7 FOUR AXLE ARTICULATED 4 axles, 3 or 4 axle groups 8 FIVE AXLE ARTICULATED 5 axles, 3+ axle groups
9 SIX AXLE ARTICULATED 6 axles, 3+ axle groups or 7+ axles, 3 axle groups
B-Dbl (10) 10 B DOUBLE or HEAVY TRUCK and TRAILER 7+ axles, 4 axle groups Rd-Trn (11-12)
11 DOUBLE ROAD TRAIN 7+ axles, 5 or 6 axle groups 12 TRIPLE ROAD TRAIN 7+ axles, 7+ axle groups
Other (13) 13 Other Various
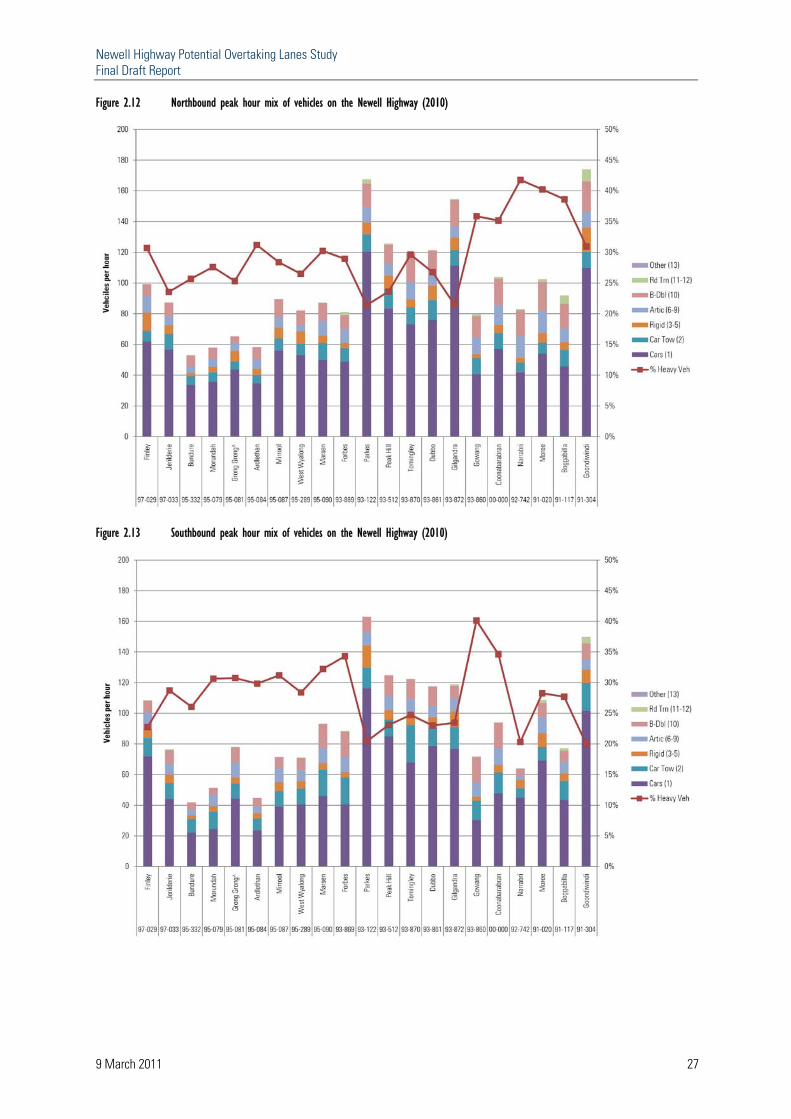
Figure 2.12 and Figure 2.13 illustrate the mix of vehicles surveyed at each location along the highway for northbound and southbound travel respectively. It is noted that while the percentage of heavy vehicles increase in the northern sections of the highway, it is more related to the reduction in light vehicles than the increase in heavy vehicles. Road trains were recorded north of Gowang towards to the Queensland border, as well as around Forbes and Parkes.
Newell Highway Potential Overtaking Lanes Study Final Draft Report
9 March 2011 27
Figure 2.12 Northbound peak hour mix of vehicles on the Newell Highway (2010)
Figure 2.13 Southbound peak hour mix of vehicles on the Newell Highway (2010)
Newell Highway Potential Overtaking Lanes Study Final Draft Report
9 March 2011 28
2.9 Calculated mean travel speeds Travel speeds were calculated at each survey site. The mean travel speeds varied across each section of highway, with lower mean travel speeds being recorded through the Warrumbungle ranges. The mean travel speeds varied from 89 km/h to 107 km/h in the northbound direction, and 85 km/h to 104 km/h in the southbound direction.
It should be noted that these speeds are spot speeds, and hence represent the mean travel speed at a particular location and not along the length of a section of highway.
2.10 Demographics The population for the local government areas along the Newell Highway in 2006 was estimated to be around 150,000. The Newell Highway is the main link between Melbourne (population 3.6 million) and South East Queensland (population 2.6 million).
The Newell Highway is expected to continue to serve as a major transport and traffic corridor and a key link between Victoria and Queensland, as well as providing a link between communities along its length.
Newell Highway Potential Overtaking Lanes Study Final Draft Report
9 March 2011 29
Section 3: Existing highway performance This section of the report provides a general description of the existing highway traffic operational performance characteristics. A technical addendum has been produced that provides a detailed description of the route performance on a section by section basis.
3.1 Definitions The performance of the road network between towns is represented using key performance measures, including:
Mean travel speed – the average travel speed for vehicles travelling across a section of the highway. 85th percentile travel speed – the 85th percentile travel speed is based on the road geometry and
speed limit. It is the speed 85 per cent of the total vehicle fleet is likely to travel without restrictions due to traffic volumes and vehicle class operational characteristics at a particular location.
Mean travel time – the average time taken for vehicles to travel along a section of the highway. Vehicle operating time (VoT) – is a measure of total travel time across a road section or how
much time all vehicles spend travelling on the road. It is calculated by multiplying the average travel time across a road section by the number of vehicles travelling along that section of road. Hence the differences in vehicle operating time can be calculated as time savings across the network.
Vehicle class – identifies the type of vehicle travelling along the highway. The vehicle is classified based on the number of axles and their groupings in accordance with the Austroads Vehicle Classification System.
Mean travel time and speeds are provided for the following vehicles categories: - Light vehicles – cars and cars towing (classes 1 and 2). - Heavy vehicles – rigid trucks, articulated trucks, b-doubles and road trains (classes 3 to 13).
Per cent following – is the proportion of total vehicles that are travelling within a four second headway of a vehicle in front, or are assumed to be following the vehicle in front.
3.2 Performance overview The existing simulated performance of the highway along each of the 19 analysis sections is summarised in Figure 3.1 and Table 3.1 for northbound travel and in Figure 3.2 and Table 3.2 for southbound travel, in terms of:
Mean travel speed for all vehicles along each road section. Mean travel time for all vehicles along each road section. Vehicle operating time (VoT) across each road section. Maximum per cent following over each road section.
Newell Highway Potential Overtaking Lanes Study Final Draft Report
9 March 2011 30
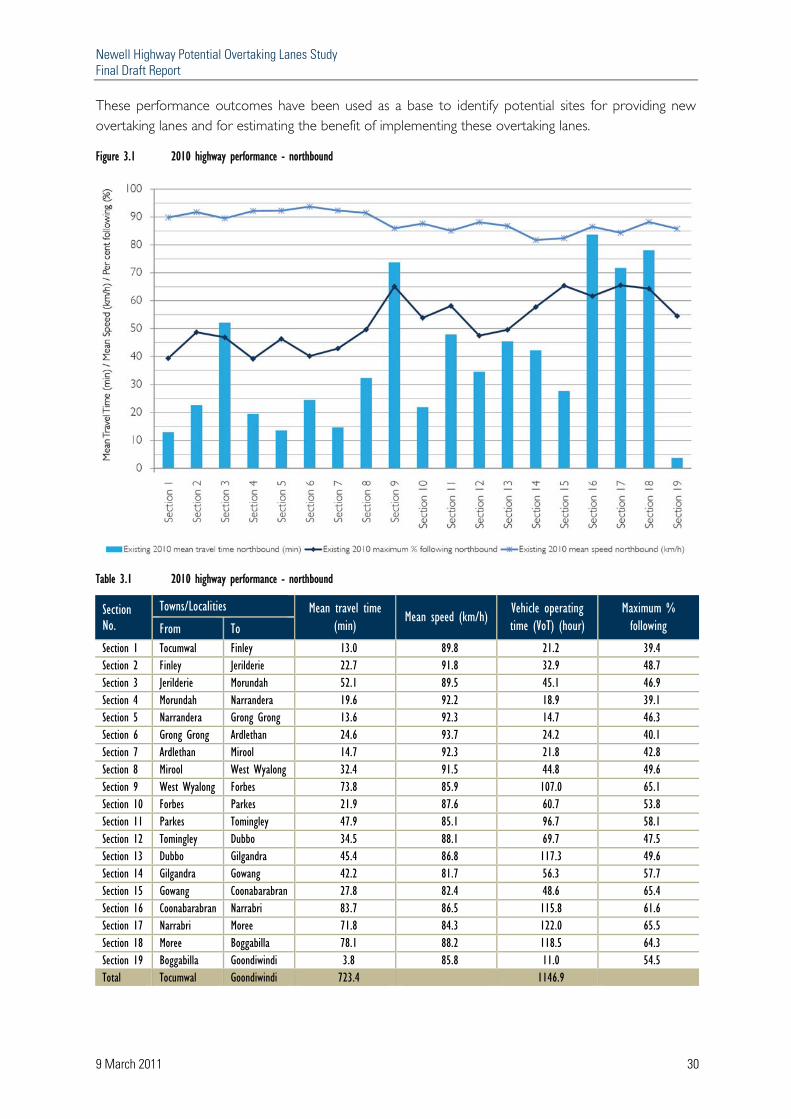
These performance outcomes have been used as a base to identify potential sites for providing new overtaking lanes and for estimating the benefit of implementing these overtaking lanes.
Figure 3.1 2010 highway performance - northbound
Table 3.1 2010 highway performance - northbound
Section No.
Towns/Localities Mean travel time (min)
Mean speed (km/h) Vehicle operating time (VoT) (hour)
Maximum % following From To
Section 1 Tocumwal Finley 13.0 89.8 21.2 39.4 Section 2 Finley Jerilderie 22.7 91.8 32.9 48.7 Section 3 Jerilderie Morundah 52.1 89.5 45.1 46.9 Section 4 Morundah Narrandera 19.6 92.2 18.9 39.1 Section 5 Narrandera Grong Grong 13.6 92.3 14.7 46.3 Section 6 Grong Grong Ardlethan 24.6 93.7 24.2 40.1 Section 7 Ardlethan Mirool 14.7 92.3 21.8 42.8 Section 8 Mirool West Wyalong 32.4 91.5 44.8 49.6 Section 9 West Wyalong Forbes 73.8 85.9 107.0 65.1 Section 10 Forbes Parkes 21.9 87.6 60.7 53.8 Section 11 Parkes Tomingley 47.9 85.1 96.7 58.1 Section 12 Tomingley Dubbo 34.5 88.1 69.7 47.5 Section 13 Dubbo Gilgandra 45.4 86.8 117.3 49.6 Section 14 Gilgandra Gowang 42.2 81.7 56.3 57.7 Section 15 Gowang Coonabarabran 27.8 82.4 48.6 65.4 Section 16 Coonabarabran Narrabri 83.7 86.5 115.8 61.6 Section 17 Narrabri Moree 71.8 84.3 122.0 65.5 Section 18 Moree Boggabilla 78.1 88.2 118.5 64.3 Section 19 Boggabilla Goondiwindi 3.8 85.8 11.0 54.5 Total Tocumwal Goondiwindi 723.4 1146.9
Newell Highway Potential Overtaking Lanes Study Final Draft Report
9 March 2011 31
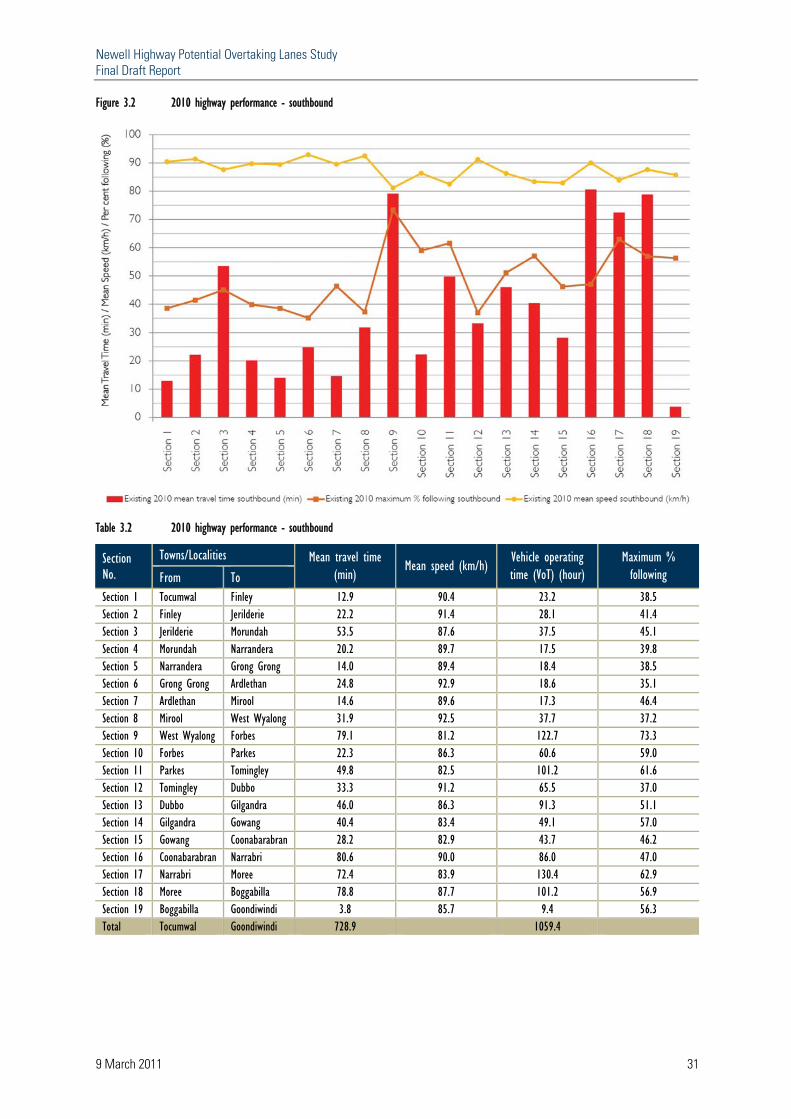
Figure 3.2 2010 highway performance - southbound
Table 3.2 2010 highway performance - southbound
Section No.
Towns/Localities Mean travel time (min)
Mean speed (km/h) Vehicle operating time (VoT) (hour)
Maximum % following From To
Section 1 Tocumwal Finley 12.9 90.4 23.2 38.5 Section 2 Finley Jerilderie 22.2 91.4 28.1 41.4 Section 3 Jerilderie Morundah 53.5 87.6 37.5 45.1 Section 4 Morundah Narrandera 20.2 89.7 17.5 39.8 Section 5 Narrandera Grong Grong 14.0 89.4 18.4 38.5 Section 6 Grong Grong Ardlethan 24.8 92.9 18.6 35.1 Section 7 Ardlethan Mirool 14.6 89.6 17.3 46.4 Section 8 Mirool West Wyalong 31.9 92.5 37.7 37.2 Section 9 West Wyalong Forbes 79.1 81.2 122.7 73.3 Section 10 Forbes Parkes 22.3 86.3 60.6 59.0 Section 11 Parkes Tomingley 49.8 82.5 101.2 61.6 Section 12 Tomingley Dubbo 33.3 91.2 65.5 37.0 Section 13 Dubbo Gilgandra 46.0 86.3 91.3 51.1 Section 14 Gilgandra Gowang 40.4 83.4 49.1 57.0 Section 15 Gowang Coonabarabran 28.2 82.9 43.7 46.2 Section 16 Coonabarabran Narrabri 80.6 90.0 86.0 47.0 Section 17 Narrabri Moree 72.4 83.9 130.4 62.9 Section 18 Moree Boggabilla 78.8 87.7 101.2 56.9 Section 19 Boggabilla Goondiwindi 3.8 85.7 9.4 56.3 Total Tocumwal Goondiwindi 728.9 1059.4
Newell Highway Potential Overtaking Lanes Study Final Draft Report
9 March 2011 32
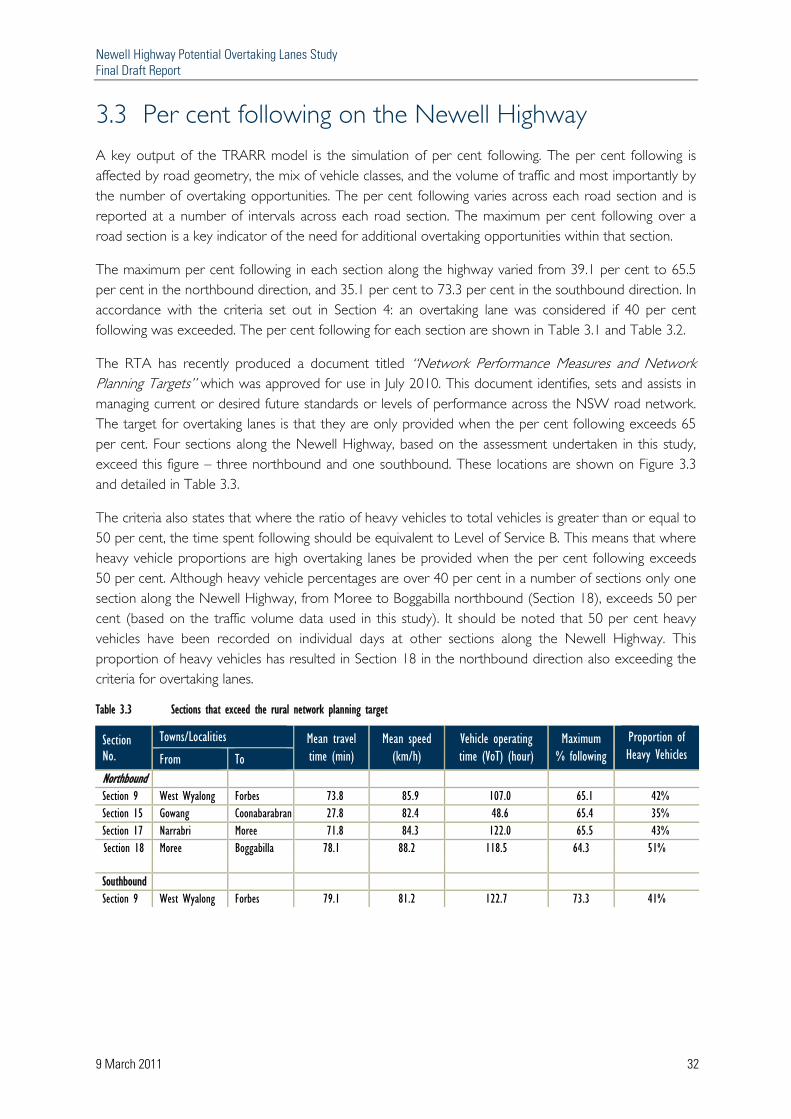
3.3 Per cent following on the Newell Highway A key output of the TRARR model is the simulation of per cent following. The per cent following is affected by road geometry, the mix of vehicle classes, and the volume of traffic and most importantly by the number of overtaking opportunities. The per cent following varies across each road section and is reported at a number of intervals across each road section. The maximum per cent following over a road section is a key indicator of the need for additional overtaking opportunities within that section.
The maximum per cent following in each section along the highway varied from 39.1 per cent to 65.5 per cent in the northbound direction, and 35.1 per cent to 73.3 per cent in the southbound direction. In accordance with the criteria set out in Section 4: an overtaking lane was considered if 40 per cent following was exceeded. The per cent following for each section are shown in Table 3.1 and Table 3.2.
The RTA has recently produced a document titled “Network Performance Measures and Network Planning Targets” which was approved for use in July 2010. This document identifies, sets and assists in managing current or desired future standards or levels of performance across the NSW road network. The target for overtaking lanes is that they are only provided when the per cent following exceeds 65 per cent. Four sections along the Newell Highway, based on the assessment undertaken in this study, exceed this figure – three northbound and one southbound. These locations are shown on Figure 3.3 and detailed in Table 3.3.
The criteria also states that where the ratio of heavy vehicles to total vehicles is greater than or equal to 50 per cent, the time spent following should be equivalent to Level of Service B. This means that where heavy vehicle proportions are high overtaking lanes be provided when the per cent following exceeds 50 per cent. Although heavy vehicle percentages are over 40 per cent in a number of sections only one section along the Newell Highway, from Moree to Boggabilla northbound (Section 18), exceeds 50 per cent (based on the traffic volume data used in this study). It should be noted that 50 per cent heavy vehicles have been recorded on individual days at other sections along the Newell Highway. This proportion of heavy vehicles has resulted in Section 18 in the northbound direction also exceeding the criteria for overtaking lanes.
Table 3.3 Sections that exceed the rural network planning target
Section No.
Towns/Localities Mean travel time (min)
Mean speed (km/h)
Vehicle operating time (VoT) (hour)
Maximum % following
Proportion of Heavy Vehicles From To
Northbound Section 9 West Wyalong Forbes 73.8 85.9 107.0 65.1 42% Section 15 Gowang Coonabarabran 27.8 82.4 48.6 65.4 35% Section 17 Narrabri Moree 71.8 84.3 122.0 65.5 43% Section 18 Moree Boggabilla 78.1 88.2 118.5 64.3 51% Southbound Section 9 West Wyalong Forbes 79.1 81.2 122.7 73.3 41%
Newell Highway Potential Overtaking Lanes Study Final Draft Report
9 March 2011 33
Figure 3.3 Sections that exceed the rural network planning target

Newell Highway Potential Overtaking Lanes Study Final Draft Report
9 March 2011 34
3.4 Travel speeds on the Newell Highway 3.4.1 Mean travel speeds
The mean travel speeds for each section of the highway were estimated from the TRARR model outputs. The mean travel speed along the highway varied from 81.7 km/h to 93.7 km/h in the northbound direction, and 81.2 km/h to 92.9 km/h in the southbound direction. The simulated mean travel speeds for each section are shown in Table 3.1and Table 3.2.
3.4.2 Mean travel times
The mean travel times for each section of highway were estimated from the TRARR model outputs. The mean travel times for each section of the highway were used to determine the vehicle operating time (refer to Section 3.4.3 below). The simulated mean travel times for each section are shown in Table 3.1and Table 3.2.
3.4.3 Vehicle operating time
The total vehicle operating time for the peak hour has been calculated for each section of highway based on outputs from the TRARR model. This measure is important for estimating the total travel time savings in relation to the vehicle operating time as a result of the additional overtaking lanes.
The simulated vehicle operating time varied in individual sections from 14.7 hours to 122.0 hours in the northbound direction and 17.5 hours to 130.4 hours in the southbound direction. The total vehicle operating time for each section are provided in Table 3.1 and Table 3.2.
3.5 Performance on the Newell Highway Section 1: Tocumwal to Finley
In the northbound direction the per cent following remained constant at approximately 35 per cent along its length. In the southbound direction the per cent following gradually increased at a slow rate to reach about 40 per cent near the Victorian Border.
The mean travel speeds in the section remained constant along the entire length.
Section 2: Finley to Jerilderie
In the northbound direction the per cent following gradually increased from approximately 30 per cent near Finley to a maximum of approximately 40 per cent. In the southbound direction the per cent following increased to a maximum of approximately 40 per cent in the middle of the section and remained constant for the rest of the length to Finley.
The mean travel speeds in the section remained constant along the entire length.
Newell Highway Potential Overtaking Lanes Study Final Draft Report
9 March 2011 35
Section 3: Jerilderie to Morundah
In the northbound direction the per cent following between Jerilderie and Morundah increased at a constant rate to a maximum of 47 per cent before levelling off for the rest of the section to Morundah. Similarly, in the southbound direction the per cent following experienced a constant rate of increase to a maximum of 45 per cent before levelling out on approach to Jerilderie.
Small drops in mean speeds were noted along the section, which correspond to areas with reduced sight lines.
Section 4: Morundah to Narrandera
In the northbound direction the per cent following was lower in the southern part of the section before gradually increasing to a maximum of 39 per cent near Narrandera. Approximately 22% of the section contains barrier lines, resulting in a lack of overtaking opportunities. In the southbound direction the per cent following remained constant, staying between 25 to 30 per cent along its length.
Small drops in mean speeds were noted along the section, which correspond to gradients and reduced sight lines. Larger speed differentials between light and heavy vehicles were noted at locations with uphill gradients, more specifically in the northern part of the section.
Section 5: Narrandera to Grong Grong
In the northbound direction on departure from Narrandera, the per cent following settled and remained constant at approximately 25 per cent. In the southbound direction the per cent following gradually increased at a slow rate to 39 per cent near Narrandera. This is mainly due to 17 per cent of the section containing barrier lines and restricted overtaking opportunities.
Mean travel speeds remained constant along the section, except in the southern part near Narrandera, where speed differentials were noted between light and heavy vehicles.
Section 6: Grong Grong to Ardlethan
In the northbound direction the per cent following remained constant between 25 to 30 per cent. In the southbound direction the per cent following gradually increased due to lack of overtaking opportunities, however an overtaking lane located in the southern half of the section reduced the per cent following to approximately 20 per cent, where it remained constant through to Grong Grong.
Mean travels speeds remained constant along the section with small speed differentials between light and heavy vehicles at locations with uphill gradients in the northern part of the section.
Section 7: Ardlethan to Mirool
In the northbound direction the per cent following gradually increased to above 40 per cent before an overtaking lane located half way along the section reduced the level of per cent following to approximately 25 per cent. From this point the per cent following remained constant through to Mirool. Overtaking opportunities are restricted by barrier lines along 38 per cent of the section.
Newell Highway Potential Overtaking Lanes Study Final Draft Report
9 March 2011 36
In the southbound direction the per cent following gradually increased along the length of this section to approximately 40 per cent mainly due to a lack of overtaking opportunities, with barrier lines along 32 per cent of the section. Dips in mean travel speeds were noted along the section, which correspond to reduced sight lines.
Section 8: Mirool to West Wyalong
In the northbound direction the per cent following settled at approximately 30 per cent in the southern part of the section. There is an overtaking lane in the middle of the section. In the northern part of the section the per cent following gradually increased to approximately 40 per cent due to a lack of overtaking opportunities, as barrier lines are located along 24 per cent of the section.
In the southbound direction, an overtaking lane located near West Wyalong resulted in a low per cent following. South of the overtaking lane the per cent following gradually increased to approximately 35 per cent near Mirool due to a lack of overtaking opportunities.
Mean travels speeds remained constant along the section with small speed differentials between light and heavy vehicles at locations with uphill gradients.
Section 9: West Wyalong to Forbes
In the northbound direction the per cent following increased rapidly to a reach 65 per cent near Forbes due to the increase in the proportion of heavy vehicles approaching Forbes. Similarly, in the southbound direction the per cent following increased quickly to reach 73 per cent near West Wyalong.
The mean travel speeds in the northbound and southbound directions were 85.9 km/h and 81.2 km/h, respectively. In both directions the mean travel speeds gradually reduced as the per cent following increased.
Section 10: Forbes to Parkes
In the northbound direction there are four overtaking lane sections between Forbes and Parkes. Between each of these overtaking lane sections the per cent following gradually increased to between 40 and 50 per cent before being reduced by the next overtaking lane opportunity.
In the southbound direction there are two overtaking lane sections, which provide good opportunities for following vehicles to pass. The per cent following remained relatively constant between the first and second overtaking lane sections at approximately 40 per cent, while there was a steep increase in the per cent following in the southern part of the section on the approach to Forbes reaching a maximum of 55 per cent following.
The mean travel speeds in the northbound and southbound directions were 87.6 km/h and 86.3 km/h, respectively. In both directions the mean travel speeds drop in the northern part of the section, where smaller curve radii are more frequent. The mean travel speeds correlate with drops in the 85th percentile speeds. Speed differentials were noted between light and heavy vehicles at locations where existing overtaking lanes exist.
Newell Highway Potential Overtaking Lanes Study Final Draft Report
9 March 2011 37
Section 11: Parkes to Tomingley
In the northbound direction there are overtaking lane opportunities in the southern part of the section, which help restrict the per cent following to below 50 per cent. However, the per cent following increased at a fast rate in the northern part of the section to a maximum of 58 per cent due to the lack of overtaking opportunities, as well as the impact of a lower speed environment through Peak Hill (18 kilometres south of Tomingley).
In the southbound direction a lack of overtaking opportunities resulted in the per cent following gradually increasing to approximately 55 per cent, before it was reduced due to the presence of an overtaking lane. The per cent following quickly increased again to a maximum of 62 per cent on approach to Parkes.
The mean travel speeds in the northbound and southbound directions were 85.1 km/h and 82.5 km/h, respectively. The mean travel speeds drop in both directions in the middle part of the section, where smaller curve radii are more frequent. The mean travel speeds correlate with drops in the 85th percentile speeds. The lower mean speeds through the section are also a result of the lower speed environment at Peak Hill.
Section 12: Tomingley to Dubbo
In the northbound direction there are three overtaking lane opportunities between Tomingley and Dubbo. Between each overtaking lane the per cent following increased to between 40 and 50 per cent, before being reduced by the next overtaking opportunity.
Similarly, in the southbound direction, the presence of overtaking lanes reduced the level of per cent following. Between each overtaking lane the per cent following gradually increased, to about 37 per cent following.
Variance in mean speeds along the section corresponded to the steeper gradients and reduced sight lines. Speed differentials were noted between light and heavy vehicles at locations where existing overtaking lanes exist.
Section 13: Dubbo to Gilgandra
Currently, overtaking lanes are located evenly along this section between Dubbo and Gilgandra in the northbound direction. In the southern part of the section the per cent following is restricted to 40 per cent by the overtaking opportunities present. In the northern part of the section the per cent following increases at a faster rate between the overtaking lanes, reaching approximately 45 per cent.
The per cent following gradually increases between the existing overtaking lanes in the southbound direction. In the northern part of the section, where the spacing of overtaking lanes is closer than in the southern part, the per cent following is kept to below 45 per cent. In the southern part of the section the per cent following reaches a maximum of 51 per cent near Dubbo.
Variance in mean speeds along the section corresponded to the steeper gradients and reduced sight lines.
Newell Highway Potential Overtaking Lanes Study Final Draft Report
9 March 2011 38
Section 14: Gilgandra to Gowang
In the northbound direction the per cent following gradually increases to a maximum of 58 per cent due to minimal overtaking opportunities. The per cent following is also affected by the steeper grades as vehicles approach the Warrumbungle ranges. This is relieved by an overtaking lane on approach to Gowang.
An overtaking lane in the northern part of the section reduces the level of per cent following; however it gradually increases at a relatively constant rate to a maximum of 57 per cent. This is mainly due to a lack of overtaking opportunities, with barrier lines along 48 per cent of the section.
The Warrumbungle Ranges have a significant impact on the mean travel speeds in the northbound and southbound directions where they are the lowest along the highway. In the northbound direction the mean travel speeds drop significantly on approach to the Warrumbungle Ranges with large speed differentials between light and heavy vehicles. In the southbound direction the mean travel speeds increase along the section as the vehicles move away from the steeper grades.
Section 15: Gowang to Coonabarabran
This section passes through the Warrumbungle Ranges, which have a large impact on the level of per cent following.
In the northbound direction, in the southern part of the section the per cent following increased to a maximum of 65 per cent. In the northern part of the section the per cent following is managed by the presence of closely spaced overtaking lanes which kept the per cent following to below 40 per cent.
In the southbound direction overtaking lanes exist at regular intervals, which keep the level of per cent following to below 46 per cent. In between the overtaking lanes the per cent following gradually increased, with higher increases where there was a larger spacing between overtaking opportunities.
The Warrumbungle Ranges have a significant impact on the mean travel speeds. The mean travel speeds vary considerably due to the change in horizontal and vertical curvatures in the road alignment. Large drops in the mean travel speeds are noted in the middle part of the section where grades are the steepest. This resulted in large speed differentials between light and heavy vehicles.
Section 16: Coonabarabran to Narrabri
In the northbound direction there are minimal overtaking opportunities, which results in the per cent following gradually increasing to 61 per cent. An overtaking lane on approach to Narrabri reduced the per cent following entering town.
In the southbound direction the per cent following gradually increased on the approach to Coonabarabran where overtaking opportunities are minimal. The maximum per cent following in the southbound direction was 47 per cent.
Newell Highway Potential Overtaking Lanes Study Final Draft Report
9 March 2011 39
The mean travel speeds are also affected by the Warrumbungle ranges. The mean travel speeds were 86.5 km/h and 90 km/h in the northbound and southbound directions, respectively. There was a drop in the mean travel speeds in the southern part of the section coming in and out of the Warrumbungle Ranges, where there are steeper gradients and smaller turn radii.
Section 17: Narrabri to Moree
In the northbound direction the per cent following gradually increased from approximately 30 per cent to 65 per cent mainly due to the lack of overtaking opportunities, as well as the presence of lower speed environments throughout the section.
Similarly in the southbound direction, the per cent following gradually increased to a maximum of 63 per cent due to lack of overtaking opportunities and lower speed environments.
The mean travel speeds in the northbound and southbound directions were 84.3 km/h and 83.9 km/h, respectively. The lower mean travel speeds are influenced more by the lower speed limits in this section passing through the small towns than by restraints caused by the road geometry.
Section 18: Moree to Boggabilla
In the northbound direction the per cent following increased at a fast rate to about 55 per cent, before being reduced by an existing overtaking lane opportunity. The per cent following gradually increased again in the northern part of the section to a maximum of 64 per cent.
In the southbound direction the per cent following was relatively constant in the northern part of the section, with a gradual increase before being reduced by an existing overtaking lane. In the southern part of the section the per cent following increases at a faster rate to a maximum of 57 per cent on approach to Moree.
The variance in mean travel speeds along the section corresponded to reductions in sight lines.
Section 19: Boggabilla to Goondiwindi
In the northbound direction the per cent following increased slowly in the northbound direction to a maximum of 54 per cent. In the southbound direction the per cent following is relatively constant at around 50 to 55 per cent.
The variance in mean travel speeds along the section corresponded to reductions in sight lines.
Newell Highway Potential Overtaking Lanes Study Final Draft Report
9 March 2011 40
Section 4: Criteria This section of the report provides a description of the criteria that were used to identify and locate sites for overtaking lanes and for prioritisation of these locations.
4.1 Criteria for selection of overtaking lanes The main criteria for the selection of the overtaking lane locations were as follows:
Per cent following – locations that would address a high per cent following (generally assumed to be 40 per cent for the purposes of this assessment).
Spacing – long distances between existing overtaking lanes. Geometry – consideration for horizontal and vertical curvature (sight distance).
The demand for State Road improvements across the State far exceeds the RTA’s ability to provide upgrades. To aid the process of prioritisation, the RTA has defined network planning targets to guide future development by ensuring the effective allocation of scarce funding resources. Overtaking lanes are normally only provided at locations where vehicles spend more than 65 per cent of their time following behind another vehicle. Three northbound sections and one southbound section on the Newell Highway have a modelled performance greater than 65 per cent following.
At locations where the mix of heavy vehicles is greater than or equal to 50 per cent, overtaking lanes can be provided at locations where vehicles spend more than 50 per cent of their time following behind another vehicle. There is one section of the Newell Highway where the proportion of heavy vehicles is greater than or equal to 50 per cent. A number of other sections are approaching this figure and would be expected to exceed it in the medium term due to continued traffic growth.
The sections of the Newell Highway that exceed the rural network planning target can be seen in Figure 3.3.
The following principles were applied when adding the potential overtaking lanes:
All potential overtaking lanes were assumed to be 1.5 kilometres in length. Where appropriate and relevant overtaking lanes were provided in pairs. Either adding an
overtaking lane north or south of an existing overtaking lane or adding in to back to back overtaking lanes.
Preference to locate overtaking lanes on the departure from towns over approaches to towns.
A first pass assessment was undertaken to establish a list of overtaking lane locations, which was based on locations with high per cent following. Sites were selected to have the greatest impact on the per cent following. Road design guide principles were considered when selecting sites to ensure they were generally appropriate. Overtaking lanes were iteratively added to address sections of the highway with a high per cent following. Overtaking lanes were added until the operation was relatively consistent along the length of the highway.
Newell Highway Potential Overtaking Lanes Study Final Draft Report
9 March 2011 41
A second pass assessment followed, which considered the spacing between overtaking lane locations and aiming at reducing the total per cent following across the highway. The aim was to achieve an average of one overtaking lane per 10 kilometres in either direction, resulting in a total of 100 locations, including the existing sites.
It is important to note that the analysis was quantitative and strategic in nature. The assessment was based on purely operational performance, with some reference to design principles. The following project specific criteria were not considered in this analysis:
Adjacent land uses. Constructability. Environmental impacts.
Detailed project assessments should be carried out to identify the most appropriate locations for specific sites. The locations determined are indicative at this stage. The selection criteria was developed by the study team and RTA review team at workshop 1 (refer to Section 1.3.5).
4.2 Criteria for prioritisation of overtaking lanes The prioritisation of the overtaking lane locations was assessed using a multi-criteria assessment developed by the by the study team and RTA review team at workshop 2 (refer to Section 1.3.5):
Selection criteria were established. A scoring system for each criteria was developed and the methodology for applying the scoring. Weighting for the criteria was agreed.
The criteria for determining the prioritisation of the overtaking lane locations were as follows:
Per cent following – a score was allocated to each location based on the maximum per cent following that the location addressed.
Travel time saving – a score was assigned to each location based on travel time saving over a section, when comparing total vehicle operating time before and after the location was included. The total vehicle operating time was calculated for each section by multiplying the mean travel time (all vehicles) by the number of vehicles (hourly) in the section. The vehicle operating time (VoT) saving is the difference in VoT before and after the adding the overtaking lane.
Spacing – a score was assigned to each location based on the spacing between an overtaking lane and the one prior to it. The spacing is based on each individual location in relation to the previous existing overtaking lane.
Similar to the selection criteria for the overtaking lane locations, project specific factors were not considered in the prioritisation process such as adjacent land uses, constructability and environmental impacts.
Each location received a score out of 100 based on the above mentioned criteria. The scores were used to place each location within a score band to determine whether the location was high, medium or low priority. The scores attributed to each of the criterion and the score bands are shown in Table 4.1.
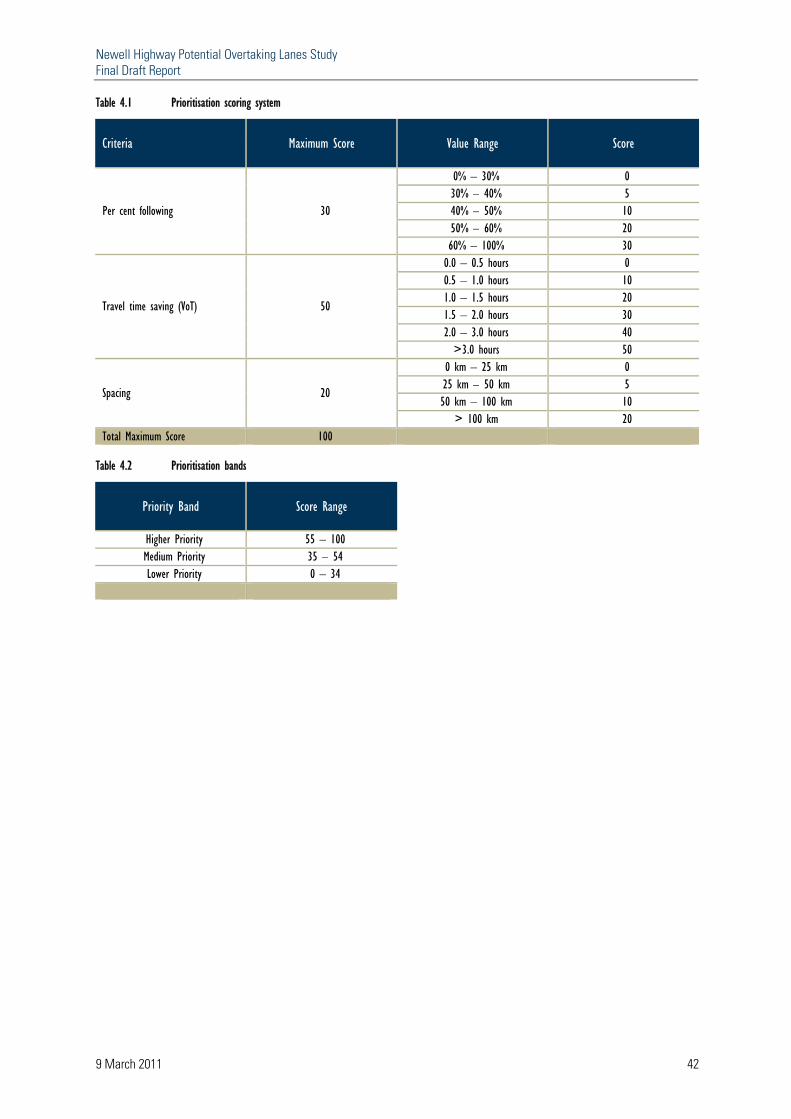
Newell Highway Potential Overtaking Lanes Study Final Draft Report
9 March 2011 42
Table 4.1 Prioritisation scoring system
Criteria Maximum Score Value Range Score
Per cent following 30
0% – 30% 0 30% – 40% 5 40% – 50% 10 50% – 60% 20 60% – 100% 30
Travel time saving (VoT) 50
0.0 – 0.5 hours 0 0.5 – 1.0 hours 10 1.0 – 1.5 hours 20 1.5 – 2.0 hours 30 2.0 – 3.0 hours 40
>3.0 hours 50
Spacing 20
0 km – 25 km 0 25 km – 50 km 5 50 km – 100 km 10
> 100 km 20 Total Maximum Score 100
Table 4.2 Prioritisation bands
Priority Band Score Range
Higher Priority 55 – 100 Medium Priority 35 – 54 Lower Priority 0 – 34
Newell Highway Potential Overtaking Lanes Study Final Draft Report
9 March 2011 43
Section 5: Potential locations This section of the report provides a general description of the potential overtaking lane locations and the estimated highway traffic operational performance characteristics after all locations are included. A technical addendum has been produced that provides a detailed description of the potential route performance on a section by section basis.
5.1 List of potential locations Application of the criteria for selection of potential locations (refer to Section 4.1) for new overtaking lanes led to the identification of 57 potential overtaking lane locations (28 northbound and 29 southbound). Ultimately, this would result in 51 northbound overtaking lanes and 49 southbound. The scoring criteria developed for prioritising the locations (refer to Section 4.2) into priority bands was applied to develop a banded list of locations. The priority banded list of locations is detailed in Table 5.1. It should be noted that sites within each band are not listed in priority order. The detailed location scoring is provided in Appendix B.
The demand for State Road improvements across the State far exceeds the RTA’s ability to provide upgrades. To aid the process of prioritisation, the RTA has defined network planning targets to guide future development by ensuring the effective allocation of scarce funding resources. Overtaking lanes are normally only provided at locations where vehicles spend more than 65 per cent of their time following behind another vehicle. Three northbound sections and one southbound section on the Newell Highway have a modelled performance greater than 65 per cent following.
At locations where the mix of heavy vehicles is greater than or equal to 50 per cent, overtaking lanes can be provided at locations where vehicles spend more than 50 per cent of their time following behind another vehicle. There is one section of the Newell Highway where the proportion of heavy vehicles is greater than or equal to 50%. A number of other sections are approaching this figure and would be expected to exceed it in the medium term due to continued traffic growth.
The sections of the Newell Highway that exceed the rural network planning target can be seen in Figure 3.3.
The locations shown in Table 5.1 are indicative and detailed investigations will need to be undertaken when considering the specific locations. The indicative northbound overtaking lane locations are shown on Figure 5.1 and the southbound locations on Figure 5.2. It should be noted that as stated earlier no priorities exist within the banded list above, and further project specific assessment is required for more detailed prioritisation.

Newell Highway Potential Overtaking Lanes Study Final Draft Report
9 March 2011 44
Table 5.1 Potential overtaking lane locations
Section No.
Towns/Localities Location ID No. Location Direction
Route Chainage (km) Length (km) From To From To
Higher Priority Locations
Section 9 West Wyalong Forbes
9.02 13.1 north of West Wyalong Northbound 314.05 315.55 1.5 9.03 55.2 north of West Wyalong Northbound 356.15 357.65 1.5 9.05 78.0 north of West Wyalong Northbound 378.95 380.45 1.5 9.04 34.6 north of West Wyalong Southbound 335.55 337.05 1.5 9.06 56.6 north of West Wyalong Southbound 357.65 359.15 1.5 9.01 79.4 north of West Wyalong Southbound 380.45 381.95 1.5
Section 11 Parkes Tomingley 11.03 15.1 north of Parkes Southbound 453.63 455.13 1.5 11.01 57.4 north of Parkes Southbound 495.53 497.03 1.5
Section 16 Coonabarabran Narrabri 16.01 48.4 north of Coonabarabran Northbound 765.10 366.60 1.5
Section 17 Narrabri Moree
17.04 68.5 north of Narrabri Northbound 904.3 905.80 1.5 17.02 89.8 north of Narrabri Southbound 925.60 927.10 1.5 17.03 19.8 north of Narrabri Southbound 855.6 857.10 1.5 17.06 40.8 north of Narrabri Southbound 876.6 878.10 1.5 17.08 60.8 north of Narrabri Southbound 896.6 898.10 1.5
Section 18 Moree Boggabilla 18.01 32.4 north of Moree Northbound 968.65 970.15 1.5 18.02 85.0 north of Moree Northbound 1021.25 1022.75 1.5
Medium Priority Locations Section 2 Finley Jerilderie 2.01 18.5 north of Finley Southbound 39.82 41.32 1.5
Section 3 Jerilderie Morundah 3.01 19.3 north of Jerilderie Northbound 75.61 77.11 1.5 3.02 58.1 north of Jerilderie Southbound 114.41 115.91 1.5
Section 9 West Wyalong Forbes 9.07 14.5 north of West Wyalong Southbound 315.45 316.95 1.5
Section 11 Parkes Tomingley 11.02 42.5 north of Parkes Northbound 481.03 482.53 1.5 11.05 56.0 north of Parkes Northbound 494.53 496.03 1.5 11.06 43.9 north of Parkes Southbound 482.23 483.73 1.5
Section 13 Dubbo Gilgandra 13.03 13.1 north of Dubbo Southbound 567.71 569.21 1.5
Section 14 Gilgandra Gowang 14.01 9.3 north of Gilgandra Northbound 631.88 633.38 1.5 14.02 24.0 north of Gilgandra Northbound 646.38 647.88 1.5 14.03 26.2 north of Gilgandra Southbound 648.78 650.28 1.5
Section 15 Gowang Coonabarabran 15.01 5.6 north of Gowang Northbound 683.79 685.29 1.5
Section 16 Coonabarabran Narrabri 16.02 78.6 north of Coonabarabran Northbound 795.3 796.80 1.5 16.03 16.7 north of Coonabarabran Southbound 733.4 734.90 1.5
Section 17 Narrabri Moree 17.01 13.6 north of Narrabri Northbound 849.4 850.90 1.5 17.05 47.8 north of Narrabri Northbound 883.6 885.10 1.5 17.07 91.2 north of Narrabri Northbound 927 928.50 1.5
Section 18 Moree Boggabilla 18.03 33.8 north of Moree Southbound 970.05 971.55 1.5 Lower Priority Locations
Section 1 Tocumwal Finley 1.02 11.1 north of Tocumwal Northbound 11.56 13.06 1.5 1.01 9.7 north of Tocumwal Southbound 10.16 11.66 1.5
Section 2 Finley Jerilderie 2.02 17.1 north of Finley Northbound 38.42 39.92 1.5 Section 3 Jerilderie Morundah 3.03 20.7 north of Jerilderie Southbound 77.01 78.51 1.5 Section 4 Morundah Narrandera 4.01 14.0 north of Morundah Northbound 148.04 149.54 1.5 Section 5 Narrandera Grong Grong 5.01 13.2 north of Narrandera Southbound 178.47 179.97 1.5 Section 6 Grong Grong Ardlethan 6.01 13.1 north of Grong Grong Northbound 200.48 201.98 1.5 Section 7 Ardlethan Mirool 7.01 14.8 north of Ardlethan Southbound 241.85 243.35 1.5
Section 8 Mirool West Wyalong 8.01 37.7 north of Mirool Northbound 288.8 290.30 1.5 8.02 22.2 north of Mirool Southbound 273.3 274.80 1.5
Section 9 West Wyalong Forbes 9.08 33.2 north of West Wyalong Northbound 334.15 335.65 1.5 Section 10 Forbes Parkes 10.01 6.5 north of Forbes Southbound 411.98 413.48 1.5
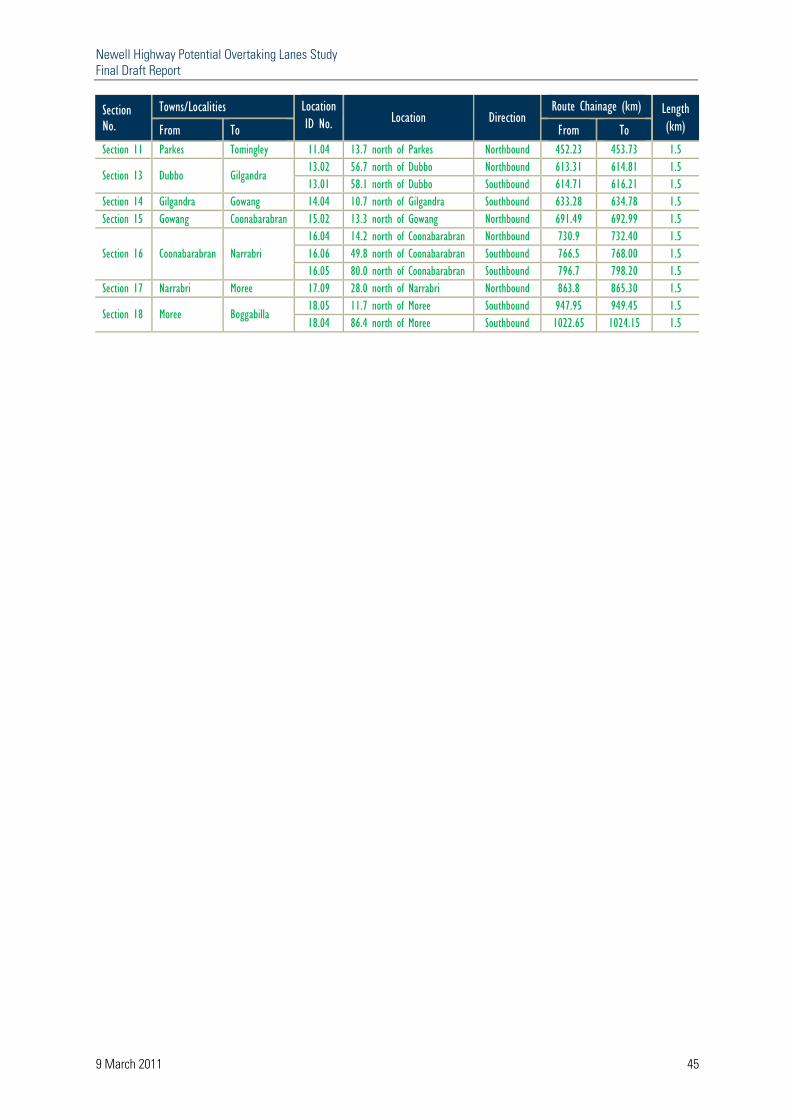
Newell Highway Potential Overtaking Lanes Study Final Draft Report
9 March 2011 45
Section No.
Towns/Localities Location ID No. Location Direction
Route Chainage (km) Length (km) From To From To
Section 11 Parkes Tomingley 11.04 13.7 north of Parkes Northbound 452.23 453.73 1.5
Section 13 Dubbo Gilgandra 13.02 56.7 north of Dubbo Northbound 613.31 614.81 1.5 13.01 58.1 north of Dubbo Southbound 614.71 616.21 1.5
Section 14 Gilgandra Gowang 14.04 10.7 north of Gilgandra Southbound 633.28 634.78 1.5 Section 15 Gowang Coonabarabran 15.02 13.3 north of Gowang Northbound 691.49 692.99 1.5
Section 16 Coonabarabran Narrabri 16.04 14.2 north of Coonabarabran Northbound 730.9 732.40 1.5 16.06 49.8 north of Coonabarabran Southbound 766.5 768.00 1.5 16.05 80.0 north of Coonabarabran Southbound 796.7 798.20 1.5
Section 17 Narrabri Moree 17.09 28.0 north of Narrabri Northbound 863.8 865.30 1.5
Section 18 Moree Boggabilla 18.05 11.7 north of Moree Southbound 947.95 949.45 1.5 18.04 86.4 north of Moree Southbound 1022.65 1024.15 1.5
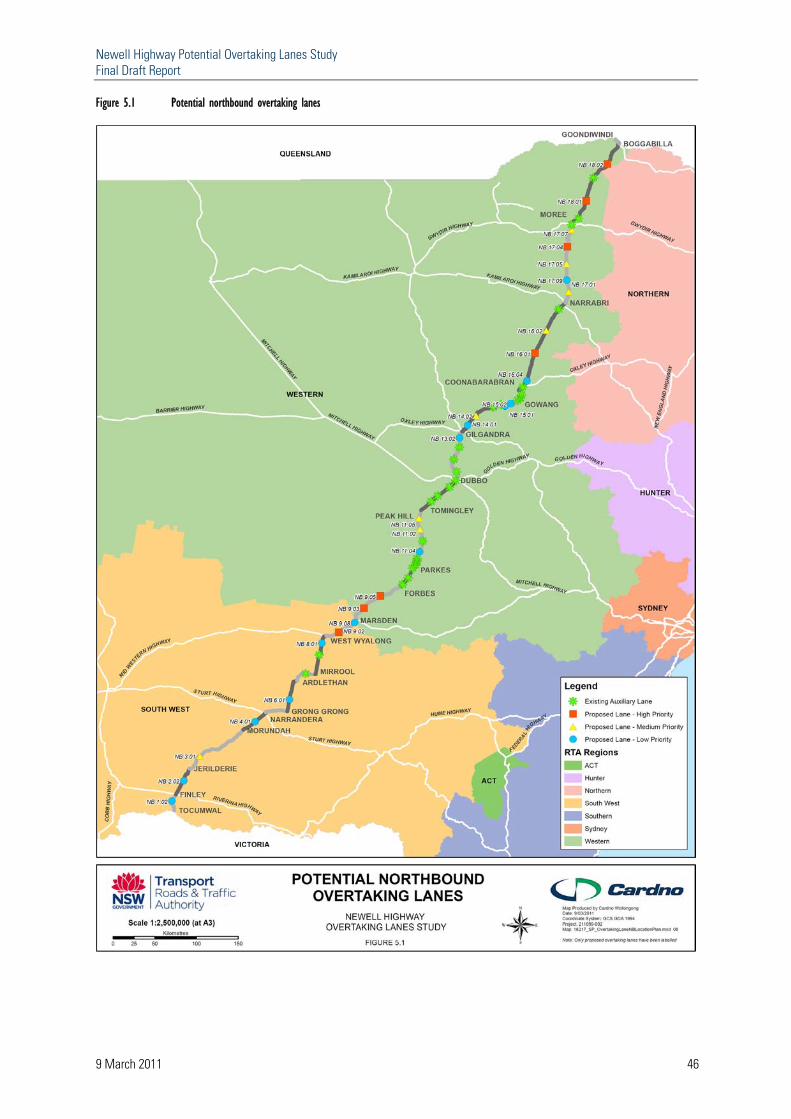
Newell Highway Potential Overtaking Lanes Study Final Draft Report
9 March 2011 46
Figure 5.1 Potential northbound overtaking lanes
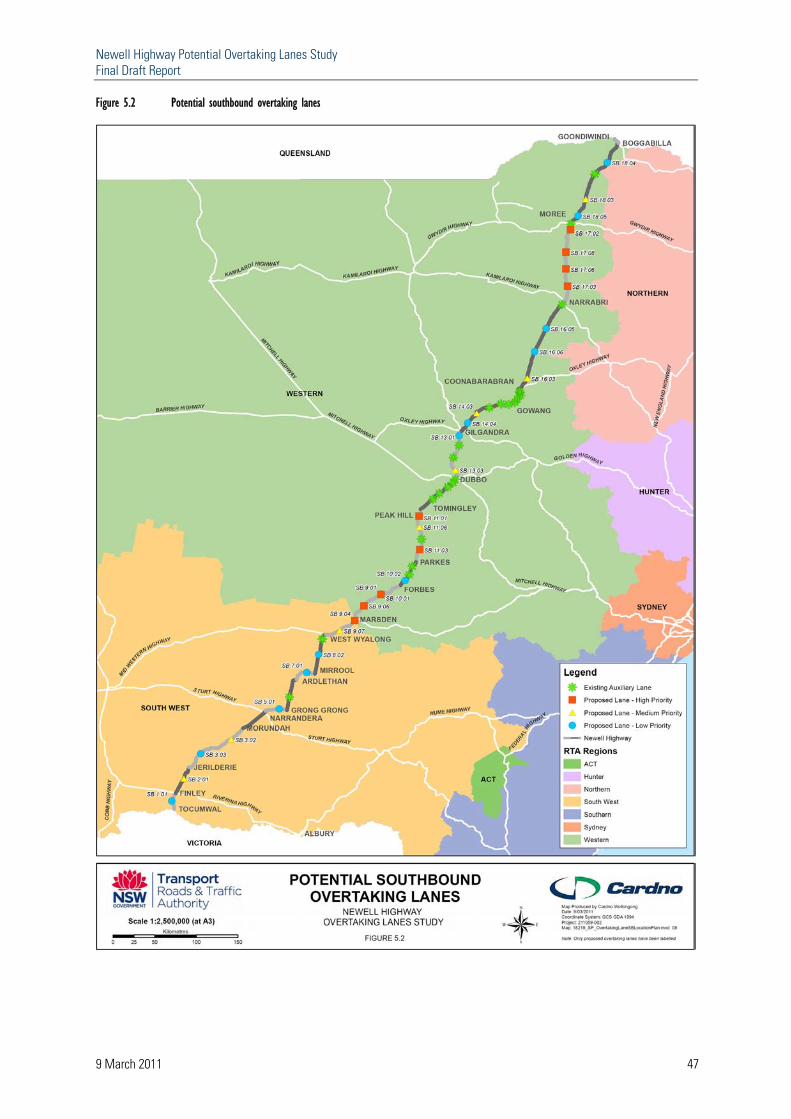
Newell Highway Potential Overtaking Lanes Study Final Draft Report
9 March 2011 47
Figure 5.2 Potential southbound overtaking lanes
Newell Highway Potential Overtaking Lanes Study Final Draft Report
9 March 2011 48
A quantitative process was implemented to determine the list of locations for additional overtaking lanes shown in Table 5.1 above. Each section of the highway was addressed individually, taking into account the key criteria outlined in Section 4. A first pass assessment was undertaken, where overtaking lanes were added to a section if the per cent following within the section was generally above 40 per cent.
A second pass was then undertaken, where by an overtaking lane was added to lengths with a large spacing between existing and/or potential overtaking lanes. This process continued until there were 100 overtaking lanes, including existing sites, resulting in an average spacing of approximately 10 kilometres between overtaking lanes in either direction along the length of the highway.
It is important to note that this assessment was purely quantitative and project specific issues such as environmental impacts and constructability were not considered in the locating of the overtaking lanes. This assessment was strategic in nature and in broad terms is a reasonable representation of overtaking lane priorities along the Newell Highway.
5.2 Highway performance improvements The addition of the 57 overtaking lanes to the model is expected to result in improvements in the simulated highway performance in terms of:
Mean travel speed for all vehicles along each road section. Mean travel time for all vehicles along each road section. Vehicle operating time (VoT) across each road section. Maximum per cent following over each road section.
The simulated improved 2010 performance of the highway along each of the 19 analysis sections is summarised in Figure 5.3 and Table 5.2 for northbound travel and in Figure 5.4 and Table 5.3 for southbound travel.
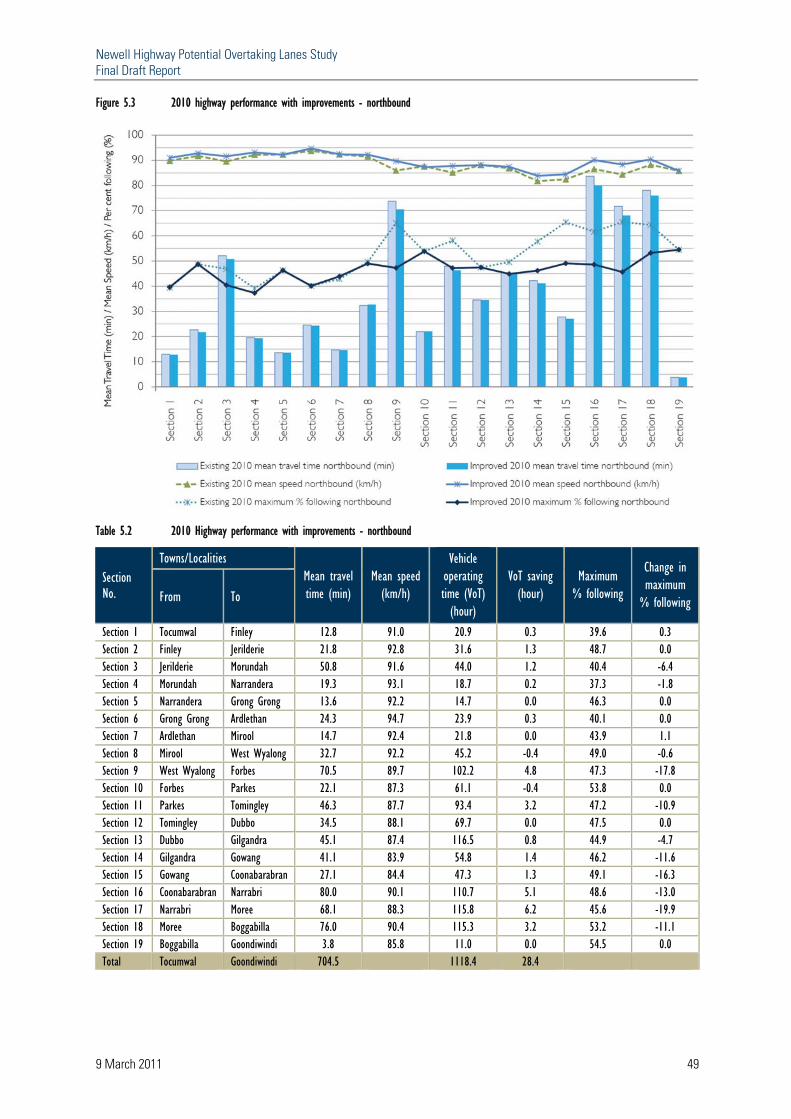
Newell Highway Potential Overtaking Lanes Study Final Draft Report
9 March 2011 49
Figure 5.3 2010 highway performance with improvements - northbound
Table 5.2 2010 Highway performance with improvements - northbound
Section No.
Towns/Localities Mean travel time (min)
Mean speed (km/h)
Vehicle operating time (VoT) (hour)
VoT saving (hour)
Maximum % following
Change in maximum
% following From To
Section 1 Tocumwal Finley 12.8 91.0 20.9 0.3 39.6 0.3 Section 2 Finley Jerilderie 21.8 92.8 31.6 1.3 48.7 0.0 Section 3 Jerilderie Morundah 50.8 91.6 44.0 1.2 40.4 -6.4 Section 4 Morundah Narrandera 19.3 93.1 18.7 0.2 37.3 -1.8 Section 5 Narrandera Grong Grong 13.6 92.2 14.7 0.0 46.3 0.0 Section 6 Grong Grong Ardlethan 24.3 94.7 23.9 0.3 40.1 0.0 Section 7 Ardlethan Mirool 14.7 92.4 21.8 0.0 43.9 1.1 Section 8 Mirool West Wyalong 32.7 92.2 45.2 -0.4 49.0 -0.6 Section 9 West Wyalong Forbes 70.5 89.7 102.2 4.8 47.3 -17.8 Section 10 Forbes Parkes 22.1 87.3 61.1 -0.4 53.8 0.0 Section 11 Parkes Tomingley 46.3 87.7 93.4 3.2 47.2 -10.9 Section 12 Tomingley Dubbo 34.5 88.1 69.7 0.0 47.5 0.0 Section 13 Dubbo Gilgandra 45.1 87.4 116.5 0.8 44.9 -4.7 Section 14 Gilgandra Gowang 41.1 83.9 54.8 1.4 46.2 -11.6 Section 15 Gowang Coonabarabran 27.1 84.4 47.3 1.3 49.1 -16.3 Section 16 Coonabarabran Narrabri 80.0 90.1 110.7 5.1 48.6 -13.0 Section 17 Narrabri Moree 68.1 88.3 115.8 6.2 45.6 -19.9 Section 18 Moree Boggabilla 76.0 90.4 115.3 3.2 53.2 -11.1 Section 19 Boggabilla Goondiwindi 3.8 85.8 11.0 0.0 54.5 0.0 Total Tocumwal Goondiwindi 704.5 1118.4 28.4
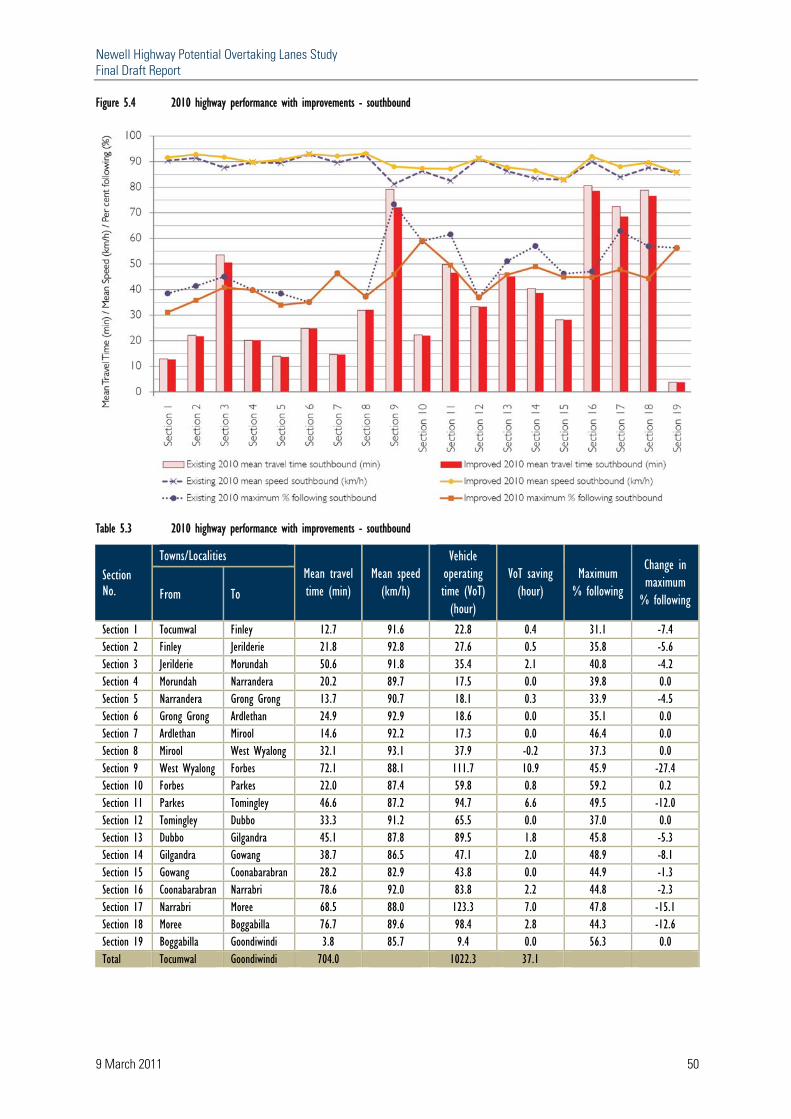
Newell Highway Potential Overtaking Lanes Study Final Draft Report
9 March 2011 50
Figure 5.4 2010 highway performance with improvements - southbound
Table 5.3 2010 highway performance with improvements - southbound
Section No.
Towns/Localities Mean travel time (min)
Mean speed (km/h)
Vehicle operating time (VoT) (hour)
VoT saving (hour)
Maximum % following
Change in maximum
% following From To
Section 1 Tocumwal Finley 12.7 91.6 22.8 0.4 31.1 -7.4 Section 2 Finley Jerilderie 21.8 92.8 27.6 0.5 35.8 -5.6 Section 3 Jerilderie Morundah 50.6 91.8 35.4 2.1 40.8 -4.2 Section 4 Morundah Narrandera 20.2 89.7 17.5 0.0 39.8 0.0 Section 5 Narrandera Grong Grong 13.7 90.7 18.1 0.3 33.9 -4.5 Section 6 Grong Grong Ardlethan 24.9 92.9 18.6 0.0 35.1 0.0 Section 7 Ardlethan Mirool 14.6 92.2 17.3 0.0 46.4 0.0 Section 8 Mirool West Wyalong 32.1 93.1 37.9 -0.2 37.3 0.0 Section 9 West Wyalong Forbes 72.1 88.1 111.7 10.9 45.9 -27.4 Section 10 Forbes Parkes 22.0 87.4 59.8 0.8 59.2 0.2 Section 11 Parkes Tomingley 46.6 87.2 94.7 6.6 49.5 -12.0 Section 12 Tomingley Dubbo 33.3 91.2 65.5 0.0 37.0 0.0 Section 13 Dubbo Gilgandra 45.1 87.8 89.5 1.8 45.8 -5.3 Section 14 Gilgandra Gowang 38.7 86.5 47.1 2.0 48.9 -8.1 Section 15 Gowang Coonabarabran 28.2 82.9 43.8 0.0 44.9 -1.3 Section 16 Coonabarabran Narrabri 78.6 92.0 83.8 2.2 44.8 -2.3 Section 17 Narrabri Moree 68.5 88.0 123.3 7.0 47.8 -15.1 Section 18 Moree Boggabilla 76.7 89.6 98.4 2.8 44.3 -12.6 Section 19 Boggabilla Goondiwindi 3.8 85.7 9.4 0.0 56.3 0.0 Total Tocumwal Goondiwindi 704.0 1022.3 37.1
Newell Highway Potential Overtaking Lanes Study Final Draft Report
9 March 2011 51
Section 1: Tocumwal to Finley
This 21 kilometre section between the Victorian border and Finley showed good performance under existing conditions. One overtaking lane in each direction was identified based on spacing, resulting in an estimated decrease in the maximum per cent following of 7.4 per cent in the southbound direction and travel time savings during the peak hour (VoT) of 0.3 hours and 0.4 hours in the northbound and southbound directions, respectively.
Section 2: Finley to Jerilderie
The 35 kilometre section between Finley and Jerilderie showed good performance under existing conditions. One overtaking lane in each direction was identified based on spacing, resulting in an estimated decrease in the maximum per cent following of 5.6 per cent in the southbound direction and travel time savings during the peak hour (VoT) of 1.3 hours and 0.5 hours in the northbound and southbound directions, respectively.
Section 3: Jerilderie to Morundah
The 78 kilometre section between Jerilderie and Morundah operated with a maximum per cent following of 47 per cent and 45 per cent in the northbound and southbound directions, respectively, under existing conditions. Two overtaking lanes in the northbound direction and one overtaking lane in the southbound direction were identified, resulting in an estimated decrease in the per cent following of 6.4 per cent and 4.2 per cent, and travel time savings during the peak hour (VoT) of 1.2 hours and 2.1 hours in the northbound and southbound directions, respectively.
Section 4: Morundah to Narrandera
The 31 kilometre section between Morundah and Narrandera showed good performance under existing conditions. One overtaking lane was identified in the northbound direction based on spacing, resulting in an estimated decrease in the per cent following of 1.8 per cent and travel time savings during the peak hour (VoT) of 0.2 hours in the northbound direction.
Section 5: Narrandera to Grong Grong
The 22 kilometre section between Narrandera and Grong Grong showed good performance under existing conditions. One overtaking lane was identified in the southbound direction based on spacing, resulting in an estimated decrease in the per cent following of 4.5 per cent and travel time savings during the peak hour (VoT) of 0.3 hours in the southbound direction.
Section 6: Grong Grong to Ardlethan
The 40 kilometre section between Grong Grong and Ardlethan showed good performance under existing conditions, with one existing overtaking lane in the southbound direction. One overtaking lane was identified in the northbound direction based on spacing, resulting in an estimated travel time savings during the peak hour (VoT) of 0.3 hours.
Newell Highway Potential Overtaking Lanes Study Final Draft Report
9 March 2011 52
Section 7: Ardlethan to Mirool
The 24 kilometre section between Ardlethan and Mirool showed good performance in the northbound direction under existing conditions, with one existing overtaking lane. In the southbound direction the section operated with a maximum per cent following of 43 per cent, which led to the recommendation of one overtaking lane being added in the southbound direction.
Section 8: Mirool to West Wyalong
The 50 kilometre section between Mirool and West Wyalong operated with a maximum per cent following of 40 per cent in the northbound direction with one existing overtaking lane. In the southbound direction the section showed good performance, however a gradual increase in per cent following was a result of a lack of overtaking opportunities. One overtaking lane was identified in each direction. This was estimated to result in minor improvements in VoT in each direction.
Section 9: West Wyalong to Forbes
The 105 kilometre section between West Wyalong and Forbes operated with a maximum per cent following of 64 per cent and 73 per cent in the northbound and southbound directions, respectively. The model also showed a low mean travel speed of 85.9 km/h and 81.2 km/h in the northbound and southbound directions, respectively. The below average performance was due mainly to the increase in the percentage of heavy vehicles. Four overtaking lanes in each direction were identified, resulting in an estimated decrease in the per cent following of 17.8 per cent in the northbound direction and 27.4 per cent in the southbound direction. These overtaking lanes also resulted in potential travel time savings during the peak hour (VoT) of 4.8 hours and 10.9 hours in the northbound and southbound directions, respectively.
Section 10: Forbes to Parkes
The 33 kilometre section between Forbes and Parkes operated with a maximum per cent following of approximately 50 per cent in the northbound direction with four existing overtaking lanes. In the southbound direction the section operated at a maximum per cent following of 55 per cent with two existing overtaking lanes. Only one overtaking lane in the southbound direction was identified because overtaking lanes already existed at regular intervals along this section. This was calculated to result in minor improvements in the VoT.
Section 11: Parkes to Tomingley
The 67 kilometre section between Parkes and Tomingley operated with a maximum per cent following of 55 per cent in the northbound direction with three existing overtaking lanes. The model showed a low mean travel speed of 85.1 km/h and 82.5 km/h in the northbound and southbound directions, respectively, due to the small curve radii and the low speed environment through Peak Hill. The section operated with a maximum per cent following of 59 per cent in the southbound direction with one existing overtaking lane. Three overtaking lanes in each direction were identified, resulting in an estimated decrease in the per cent following of 10.9 per cent in the northbound direction and 12.0 per cent in the southbound direction. These overtaking lanes also resulted in estimated travel time savings during the peak hour (VoT) of 3.2 hours and 6.6 hours in the northbound and southbound directions, respectively.
Newell Highway Potential Overtaking Lanes Study Final Draft Report
9 March 2011 53
Section 12: Tomingley to Dubbo
The 51 kilometre section between Tomingley and Dubbo operated with a maximum per cent following of around 50 per cent in the northbound direction and 37 per cent in the southbound direction. No overtaking lanes were identified because overtaking lanes already existed at regular intervals along the section, with three overtaking lanes in the northbound direction and four overtaking lanes in the southbound direction.
Section 13: Dubbo to Gilgandra
The 66 kilometre section between Dubbo and Gilgandra operated with a maximum per cent following of 51 per cent in the northbound direction and 53 per cent in the southbound direction. Currently there are three overtaking lanes in the northbound direction and two overtaking lanes in the southbound direction. One overtaking lane in the northbound direction and two in the southbound direction were identified, resulting in an estimated decrease in the per cent following of approximately 5 per cent in each direction.
Section 14: Gilgandra to Gowang
The 56 kilometre section between Gilgandra and Gowang is located on the southern side of the Warrumbungle ranges, which has a large impact on the performance of this section. The steeper grades result in a maximum per cent following of 58 per cent in the northbound direction and 49 per cent in the southbound direction. The model showed mean travel speeds of 81.7 km/h and 83.4 km/h in the northbound and southbound directions, respectively, which are the lowest along the highway. Two overtaking lanes were identified for each direction, resulting in an estimated decrease in the per cent following of 11.6 per cent and 8.1 per cent in the northbound and southbound directions, respectively.
Section 15: Gowang to Coonabarabran
The 38 kilometre section between Gowang and Coonabarabran is located in the Warrumbungle ranges, resulting in below average performance. The section operates with a maximum per cent following of 65 per cent in the northbound direction and 46 per cent in the southbound direction. The model shows a mean travel speed of 82.4 km/h and 82.9 km/h in the northbound and southbound directions, respectively. Only one overtaking lane in the northbound direction was identified because overtaking lanes already existed at regular intervals along the section. This resulted in a potential decrease in the per cent following of 16.3 per cent and travel time savings during the peak hour (VoT) of 1.3 hours in the northbound direction.
Section 16: Coonabarabran to Narrabri
The 119 kilometre section between Coonabarabran and Narrabri is located at the northern side of the Warrumbungle ranges. The lack of overtaking opportunities resulted in a maximum per cent following of 62 per cent in the northbound direction and 52 per cent in the southbound direction. The model showed a drop in the mean travel speed coming in and out of the Warrumbungle ranges in the southern part of the section. Three overtaking lanes were identified in each direction, resulting in an estimated decrease in the per cent following of 13 per cent and travel time savings during the peak hour (VoT) of 5.1 hours in the northbound direction. Minor improvements were shown in the southbound direction.
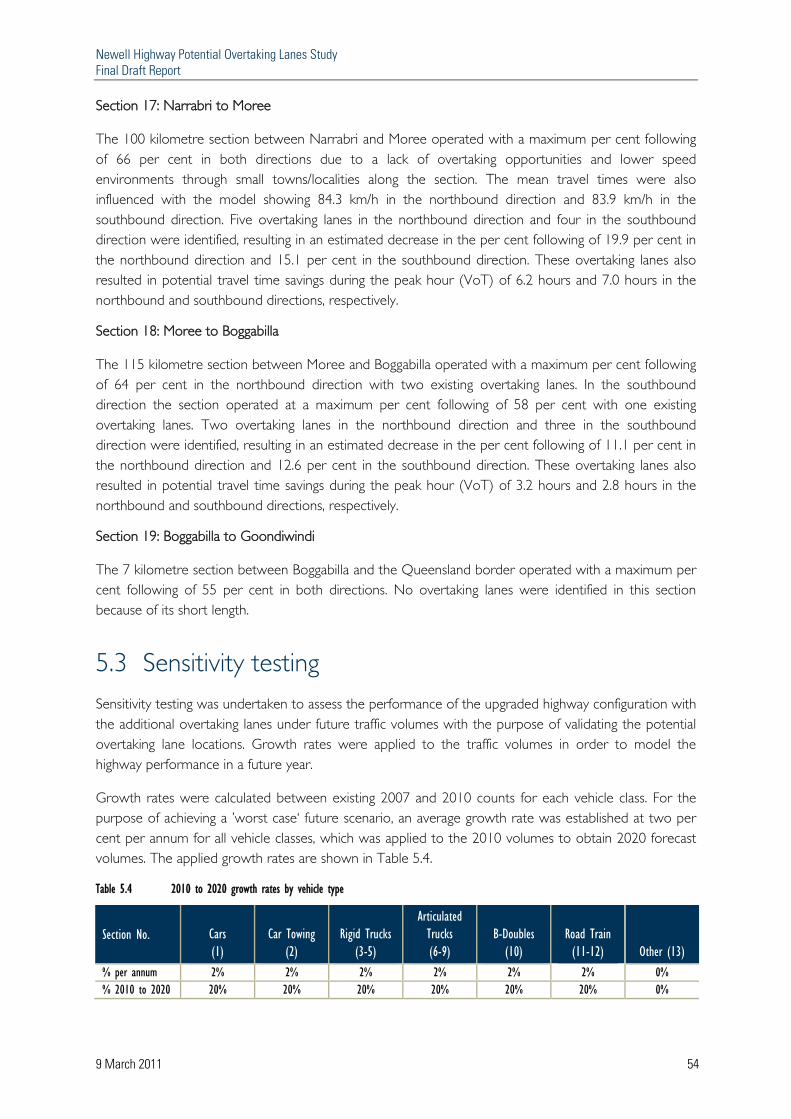
Newell Highway Potential Overtaking Lanes Study Final Draft Report
9 March 2011 54
Section 17: Narrabri to Moree
The 100 kilometre section between Narrabri and Moree operated with a maximum per cent following of 66 per cent in both directions due to a lack of overtaking opportunities and lower speed environments through small towns/localities along the section. The mean travel times were also influenced with the model showing 84.3 km/h in the northbound direction and 83.9 km/h in the southbound direction. Five overtaking lanes in the northbound direction and four in the southbound direction were identified, resulting in an estimated decrease in the per cent following of 19.9 per cent in the northbound direction and 15.1 per cent in the southbound direction. These overtaking lanes also resulted in potential travel time savings during the peak hour (VoT) of 6.2 hours and 7.0 hours in the northbound and southbound directions, respectively.
Section 18: Moree to Boggabilla
The 115 kilometre section between Moree and Boggabilla operated with a maximum per cent following of 64 per cent in the northbound direction with two existing overtaking lanes. In the southbound direction the section operated at a maximum per cent following of 58 per cent with one existing overtaking lanes. Two overtaking lanes in the northbound direction and three in the southbound direction were identified, resulting in an estimated decrease in the per cent following of 11.1 per cent in the northbound direction and 12.6 per cent in the southbound direction. These overtaking lanes also resulted in potential travel time savings during the peak hour (VoT) of 3.2 hours and 2.8 hours in the northbound and southbound directions, respectively.
Section 19: Boggabilla to Goondiwindi
The 7 kilometre section between Boggabilla and the Queensland border operated with a maximum per cent following of 55 per cent in both directions. No overtaking lanes were identified in this section because of its short length.
5.3 Sensitivity testing Sensitivity testing was undertaken to assess the performance of the upgraded highway configuration with the additional overtaking lanes under future traffic volumes with the purpose of validating the potential overtaking lane locations. Growth rates were applied to the traffic volumes in order to model the highway performance in a future year.
Growth rates were calculated between existing 2007 and 2010 counts for each vehicle class. For the purpose of achieving a ’worst case‘ future scenario, an average growth rate was established at two per cent per annum for all vehicle classes, which was applied to the 2010 volumes to obtain 2020 forecast volumes. The applied growth rates are shown in Table 5.4.
Table 5.4 2010 to 2020 growth rates by vehicle type
Section No. Cars (1)
Car Towing (2)
Rigid Trucks (3-5)
Articulated Trucks (6-9)
B-Doubles (10)
Road Train (11-12) Other (13)
% per annum 2% 2% 2% 2% 2% 2% 0% % 2010 to 2020 20% 20% 20% 20% 20% 20% 0%
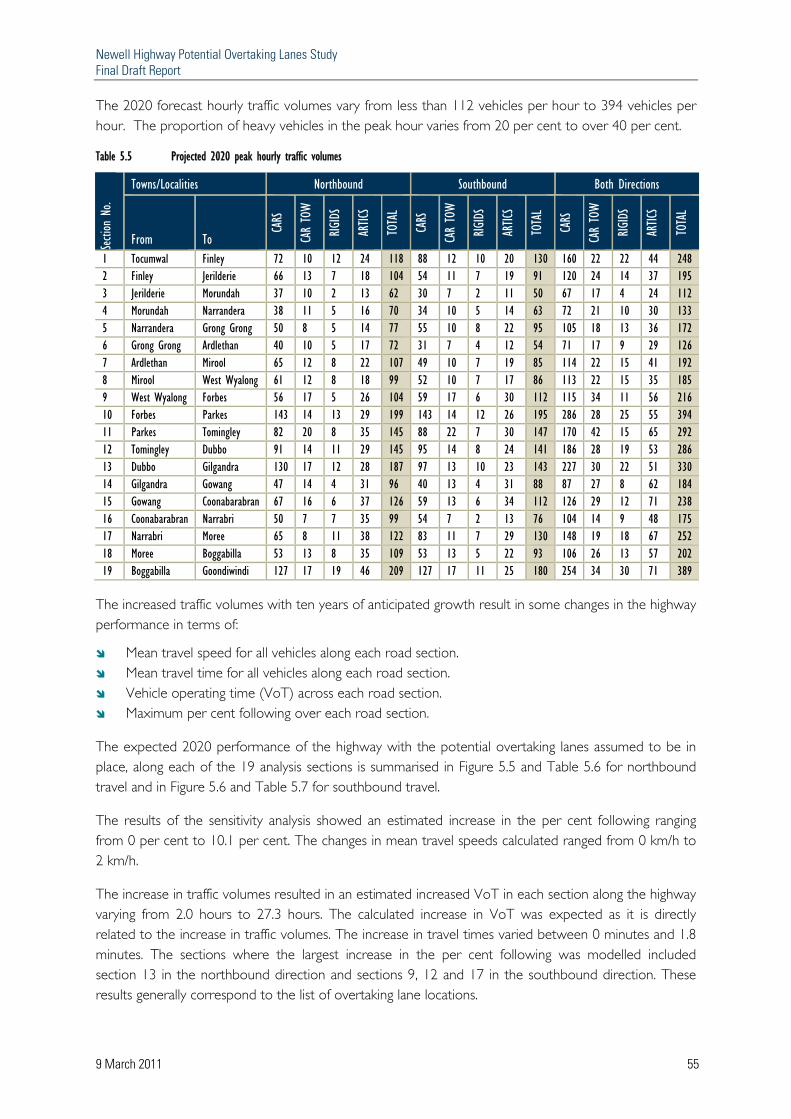
Newell Highway Potential Overtaking Lanes Study Final Draft Report
9 March 2011 55
The 2020 forecast hourly traffic volumes vary from less than 112 vehicles per hour to 394 vehicles per hour. The proportion of heavy vehicles in the peak hour varies from 20 per cent to over 40 per cent.
Table 5.5 Projected 2020 peak hourly traffic volumes
Sectio
n No
.
Towns/Localities Northbound Southbound Both Directions
From To
CARS
CAR
TOW
RIGIDS
ARTIC
S
TOTAL
CARS
CAR
TOW
RIGIDS
ARTIC
S
TOTAL
CARS
CAR
TOW
RIGIDS
ARTIC
S
TOTAL
1 Tocumwal Finley 72 10 12 24 118 88 12 10 20 130 160 22 22 44 248 2 Finley Jerilderie 66 13 7 18 104 54 11 7 19 91 120 24 14 37 195 3 Jerilderie Morundah 37 10 2 13 62 30 7 2 11 50 67 17 4 24 112 4 Morundah Narrandera 38 11 5 16 70 34 10 5 14 63 72 21 10 30 133 5 Narrandera Grong Grong 50 8 5 14 77 55 10 8 22 95 105 18 13 36 172 6 Grong Grong Ardlethan 40 10 5 17 72 31 7 4 12 54 71 17 9 29 126 7 Ardlethan Mirool 65 12 8 22 107 49 10 7 19 85 114 22 15 41 192 8 Mirool West Wyalong 61 12 8 18 99 52 10 7 17 86 113 22 15 35 185 9 West Wyalong Forbes 56 17 5 26 104 59 17 6 30 112 115 34 11 56 216 10 Forbes Parkes 143 14 13 29 199 143 14 12 26 195 286 28 25 55 394 11 Parkes Tomingley 82 20 8 35 145 88 22 7 30 147 170 42 15 65 292 12 Tomingley Dubbo 91 14 11 29 145 95 14 8 24 141 186 28 19 53 286 13 Dubbo Gilgandra 130 17 12 28 187 97 13 10 23 143 227 30 22 51 330 14 Gilgandra Gowang 47 14 4 31 96 40 13 4 31 88 87 27 8 62 184 15 Gowang Coonabarabran 67 16 6 37 126 59 13 6 34 112 126 29 12 71 238 16 Coonabarabran Narrabri 50 7 7 35 99 54 7 2 13 76 104 14 9 48 175 17 Narrabri Moree 65 8 11 38 122 83 11 7 29 130 148 19 18 67 252 18 Moree Boggabilla 53 13 8 35 109 53 13 5 22 93 106 26 13 57 202 19 Boggabilla Goondiwindi 127 17 19 46 209 127 17 11 25 180 254 34 30 71 389
The increased traffic volumes with ten years of anticipated growth result in some changes in the highway performance in terms of:
Mean travel speed for all vehicles along each road section. Mean travel time for all vehicles along each road section. Vehicle operating time (VoT) across each road section. Maximum per cent following over each road section.
The expected 2020 performance of the highway with the potential overtaking lanes assumed to be in place, along each of the 19 analysis sections is summarised in Figure 5.5 and Table 5.6 for northbound travel and in Figure 5.6 and Table 5.7 for southbound travel.
The results of the sensitivity analysis showed an estimated increase in the per cent following ranging from 0 per cent to 10.1 per cent. The changes in mean travel speeds calculated ranged from 0 km/h to 2 km/h.
The increase in traffic volumes resulted in an estimated increased VoT in each section along the highway varying from 2.0 hours to 27.3 hours. The calculated increase in VoT was expected as it is directly related to the increase in traffic volumes. The increase in travel times varied between 0 minutes and 1.8 minutes. The sections where the largest increase in the per cent following was modelled included section 13 in the northbound direction and sections 9, 12 and 17 in the southbound direction. These results generally correspond to the list of overtaking lane locations.
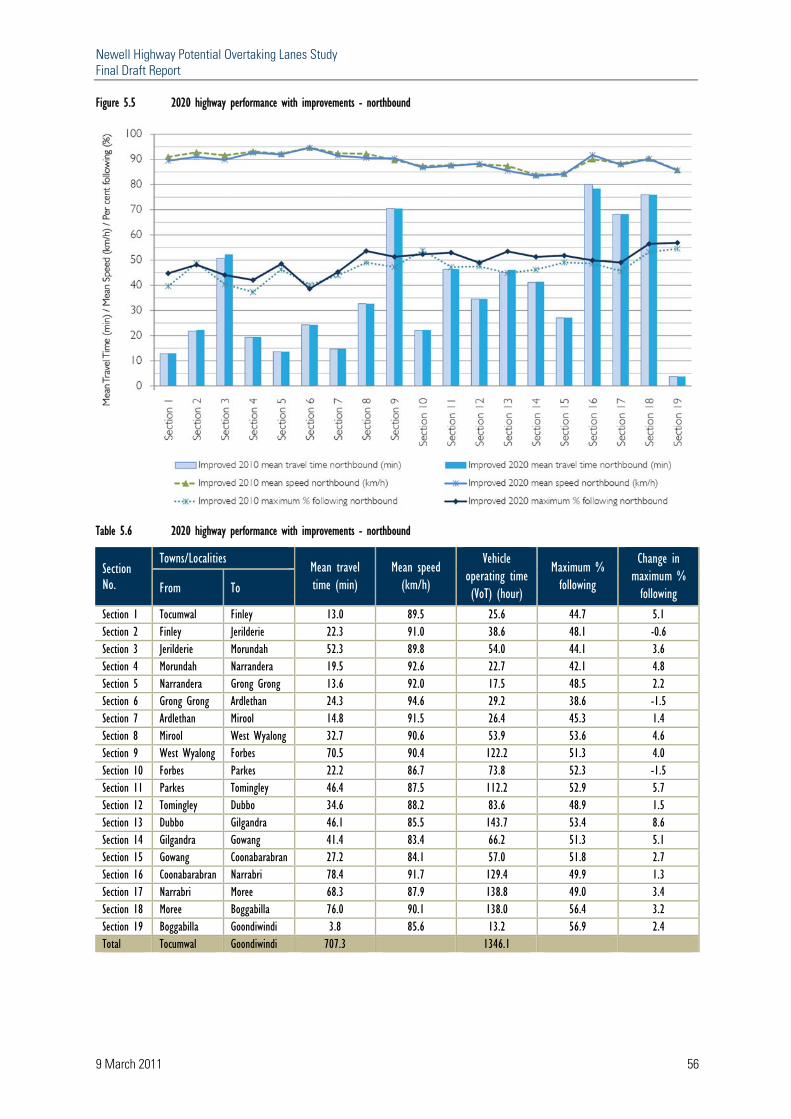
Newell Highway Potential Overtaking Lanes Study Final Draft Report
9 March 2011 56
Figure 5.5 2020 highway performance with improvements - northbound
Table 5.6 2020 highway performance with improvements - northbound
Section No.
Towns/Localities Mean travel time (min)
Mean speed (km/h)
Vehicle operating time (VoT) (hour)
Maximum % following
Change in maximum % following From To
Section 1 Tocumwal Finley 13.0 89.5 25.6 44.7 5.1 Section 2 Finley Jerilderie 22.3 91.0 38.6 48.1 -0.6 Section 3 Jerilderie Morundah 52.3 89.8 54.0 44.1 3.6 Section 4 Morundah Narrandera 19.5 92.6 22.7 42.1 4.8 Section 5 Narrandera Grong Grong 13.6 92.0 17.5 48.5 2.2 Section 6 Grong Grong Ardlethan 24.3 94.6 29.2 38.6 -1.5 Section 7 Ardlethan Mirool 14.8 91.5 26.4 45.3 1.4 Section 8 Mirool West Wyalong 32.7 90.6 53.9 53.6 4.6 Section 9 West Wyalong Forbes 70.5 90.4 122.2 51.3 4.0 Section 10 Forbes Parkes 22.2 86.7 73.8 52.3 -1.5 Section 11 Parkes Tomingley 46.4 87.5 112.2 52.9 5.7 Section 12 Tomingley Dubbo 34.6 88.2 83.6 48.9 1.5 Section 13 Dubbo Gilgandra 46.1 85.5 143.7 53.4 8.6 Section 14 Gilgandra Gowang 41.4 83.4 66.2 51.3 5.1 Section 15 Gowang Coonabarabran 27.2 84.1 57.0 51.8 2.7 Section 16 Coonabarabran Narrabri 78.4 91.7 129.4 49.9 1.3 Section 17 Narrabri Moree 68.3 87.9 138.8 49.0 3.4 Section 18 Moree Boggabilla 76.0 90.1 138.0 56.4 3.2 Section 19 Boggabilla Goondiwindi 3.8 85.6 13.2 56.9 2.4 Total Tocumwal Goondiwindi 707.3 1346.1
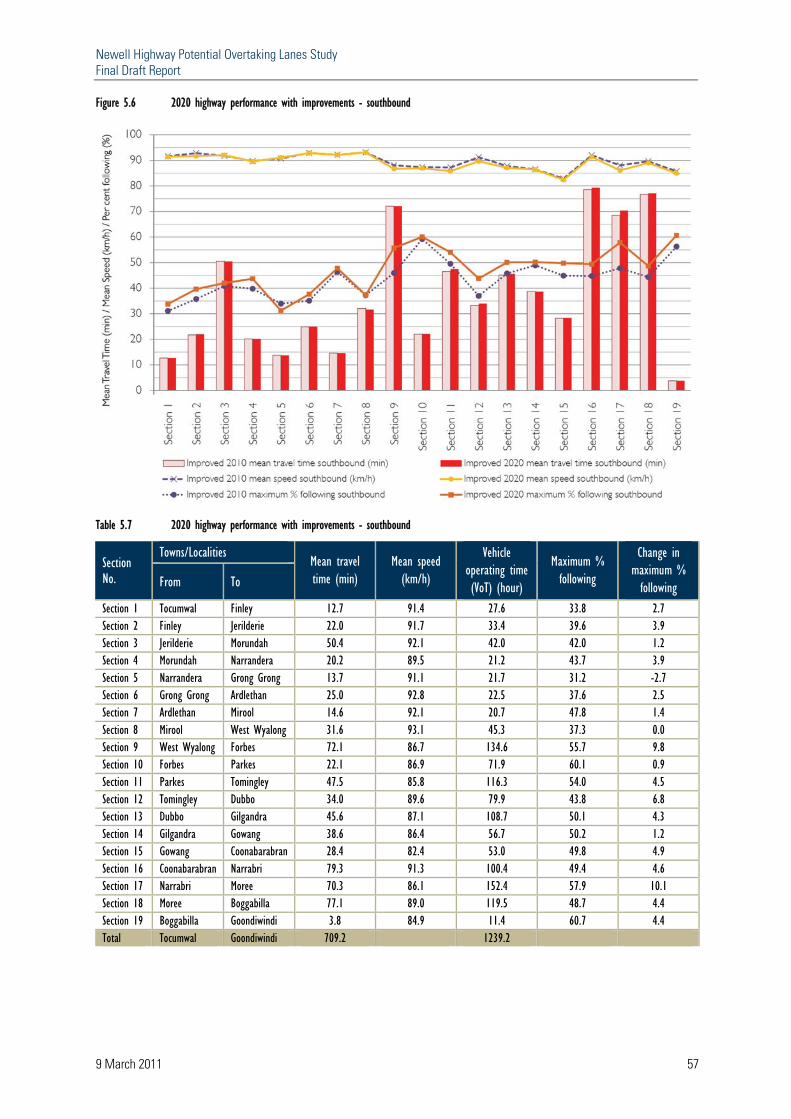
Newell Highway Potential Overtaking Lanes Study Final Draft Report
9 March 2011 57
Figure 5.6 2020 highway performance with improvements - southbound
Table 5.7 2020 highway performance with improvements - southbound
Section No.
Towns/Localities Mean travel time (min)
Mean speed (km/h)
Vehicle operating time (VoT) (hour)
Maximum % following
Change in maximum % following From To
Section 1 Tocumwal Finley 12.7 91.4 27.6 33.8 2.7 Section 2 Finley Jerilderie 22.0 91.7 33.4 39.6 3.9 Section 3 Jerilderie Morundah 50.4 92.1 42.0 42.0 1.2 Section 4 Morundah Narrandera 20.2 89.5 21.2 43.7 3.9 Section 5 Narrandera Grong Grong 13.7 91.1 21.7 31.2 -2.7 Section 6 Grong Grong Ardlethan 25.0 92.8 22.5 37.6 2.5 Section 7 Ardlethan Mirool 14.6 92.1 20.7 47.8 1.4 Section 8 Mirool West Wyalong 31.6 93.1 45.3 37.3 0.0 Section 9 West Wyalong Forbes 72.1 86.7 134.6 55.7 9.8 Section 10 Forbes Parkes 22.1 86.9 71.9 60.1 0.9 Section 11 Parkes Tomingley 47.5 85.8 116.3 54.0 4.5 Section 12 Tomingley Dubbo 34.0 89.6 79.9 43.8 6.8 Section 13 Dubbo Gilgandra 45.6 87.1 108.7 50.1 4.3 Section 14 Gilgandra Gowang 38.6 86.4 56.7 50.2 1.2 Section 15 Gowang Coonabarabran 28.4 82.4 53.0 49.8 4.9 Section 16 Coonabarabran Narrabri 79.3 91.3 100.4 49.4 4.6 Section 17 Narrabri Moree 70.3 86.1 152.4 57.9 10.1 Section 18 Moree Boggabilla 77.1 89.0 119.5 48.7 4.4 Section 19 Boggabilla Goondiwindi 3.8 84.9 11.4 60.7 4.4 Total Tocumwal Goondiwindi 709.2 1239.2
Newell Highway Potential Overtaking Lanes Study Final Draft Report
9 March 2011 58
Section 6: Conclusion The RTA appointed Cardno to undertake a study to develop a list of potential overtaking lane locations along the Newell Highway. Modelling of the highway performance was undertaken using TRARR to obtain key performance measures to determine the priority for overtaking lane locations. The key performance measures were as follows:
Per cent following. Mean travel speed. Mean travel time. Vehicle operating time (VoT).
The model showed that the maximum per cent following in each section along the highway varied from 39.1 per cent to 65.5 per cent in the northbound direction, and 37.0 per cent to 62.9 per cent in the southbound direction.
The demand for State Road improvements across the State far exceeds the RTA’s ability to provide upgrades. To aid the process of prioritisation, the RTA has defined network planning targets to guide future development by ensuring the effective allocation of scarce funding resources. Overtaking lanes are normally only provided at locations where vehicles spend more than 65 per cent of their time following behind another vehicle. Three northbound sections and one southbound section on the Newell Highway have a modelled performance greater than 65 per cent following.
Where the mix of heavy vehicles is greater than or equal to 50 per cent, overtaking lanes can be provided at locations where vehicles spend more than 50 per cent of their time following behind another vehicle. There is one section of the Newell Highway where the proportion of heavy vehicles is greater than or equal to 50 per cent. A number of other sections are approaching this figure and would be expected to exceed it in the medium term due to continued traffic growth.
The sections of the Newell Highway that exceed the rural network planning target can be seen in Figure 3.3.
The mean travel speeds for each section of the highway were estimated from the TRARR model outputs. The mean travel speed along the highway varied from 81.7 km/h to 93.7 km/h in the northbound direction, and 81.2 km/h to 92.9 km/h in the southbound direction.
The total simulated vehicle operating time (over the peak hour) varied from 14.7 hours to 122.0 hours in the northbound direction and 17.5 hours to 130.4 hours in the southbound direction.
Two workshops were held with the study and RTA review team members. The workshops were held so key RTA personnel could input into the study and guide the study team.
Application of the criteria for selection of potential locations for new overtaking lanes led to the identification of 57 potential overtaking lane locations (28 northbound and 29 southbound).
Newell Highway Potential Overtaking Lanes Study Final Draft Report
9 March 2011 59
The 57 potential overtaking lane locations were placed into banded priority groups based on the key performance measures. The process resulted in 16 higher priority locations, 18 medium priority locations and 23 lower priority locations.
Sensitivity testing was undertaken to assess the performance of the upgraded highway configuration with the additional overtaking lanes. Growth rates were applied to the traffic volumes in order to model the highway performance in a future year. The purpose of the sensitivity analysis was to validate the potential overtaking lane locations. This was achieved.
This assessment was quantitative and project specific issues such as environmental impacts and constructability were not considered in the locating of the overtaking lanes. The study was strategic in nature and in broad terms is a reasonable representation of overtaking lane priorities along the Newell Highway. This study has provided a framework to guide decision making in the future with further investigations required to determine the feasibility of each individual project.
APPENDICES
Appendix A Austroads Vehicle Classification System
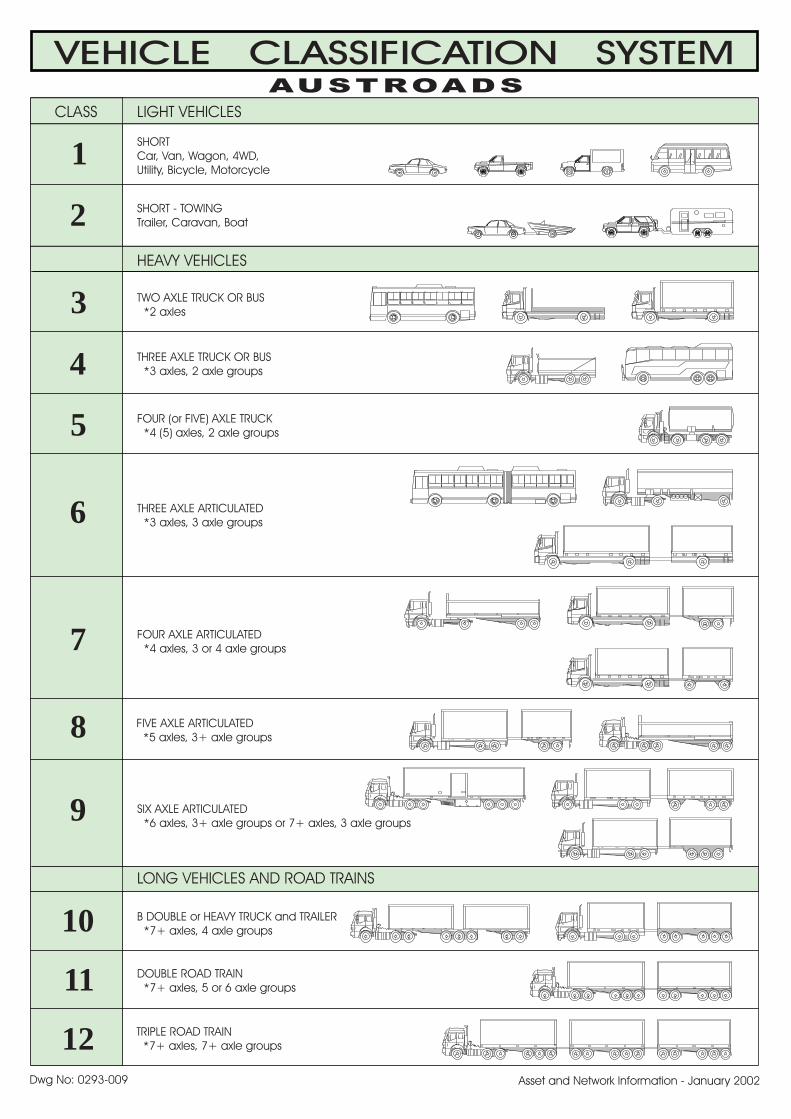
SHORT
Car, Van, Wagon, 4WD,
Utility, Bicycle, Motorcycle1
2
3
4
5
6
7
8
9
10
11
12
SHORT - TOWING
Trailer, Caravan, Boat
TWO AXLE TRUCK OR BUS
*2 axles
THREE AXLE TRUCK OR BUS
*3 axles, 2 axle groups
FOUR (or FIVE) AXLE TRUCK
*4 (5) axles, 2 axle groups
THREE AXLE ARTICULATED
*3 axles, 3 axle groups
FOUR AXLE ARTICULATED
*4 axles, 3 or 4 axle groups
FIVE AXLE ARTICULATED
*5 axles, 3+ axle groups
B DOUBLE or HEAVY TRUCK and TRAILER
*7+ axles, 4 axle groups
TRIPLE ROAD TRAIN
*7+ axles, 7+ axle groups
DOUBLE ROAD TRAIN
*7+ axles, 5 or 6 axle groups
VEHICLE CLASSIFICATION SYSTEMAUSTROADS
CLASS LIGHT VEHICLES
HEAVY VEHICLES
LONG VEHICLES AND ROAD TRAINS
SIX AXLE ARTICULATED
*6 axles, 3+ axle groups or 7+ axles, 3 axle groups
Dwg No: 0293-009 Asset and Network Information - January 2002
Appendix B Overtaking Lane Location
Prioritisation Scoring
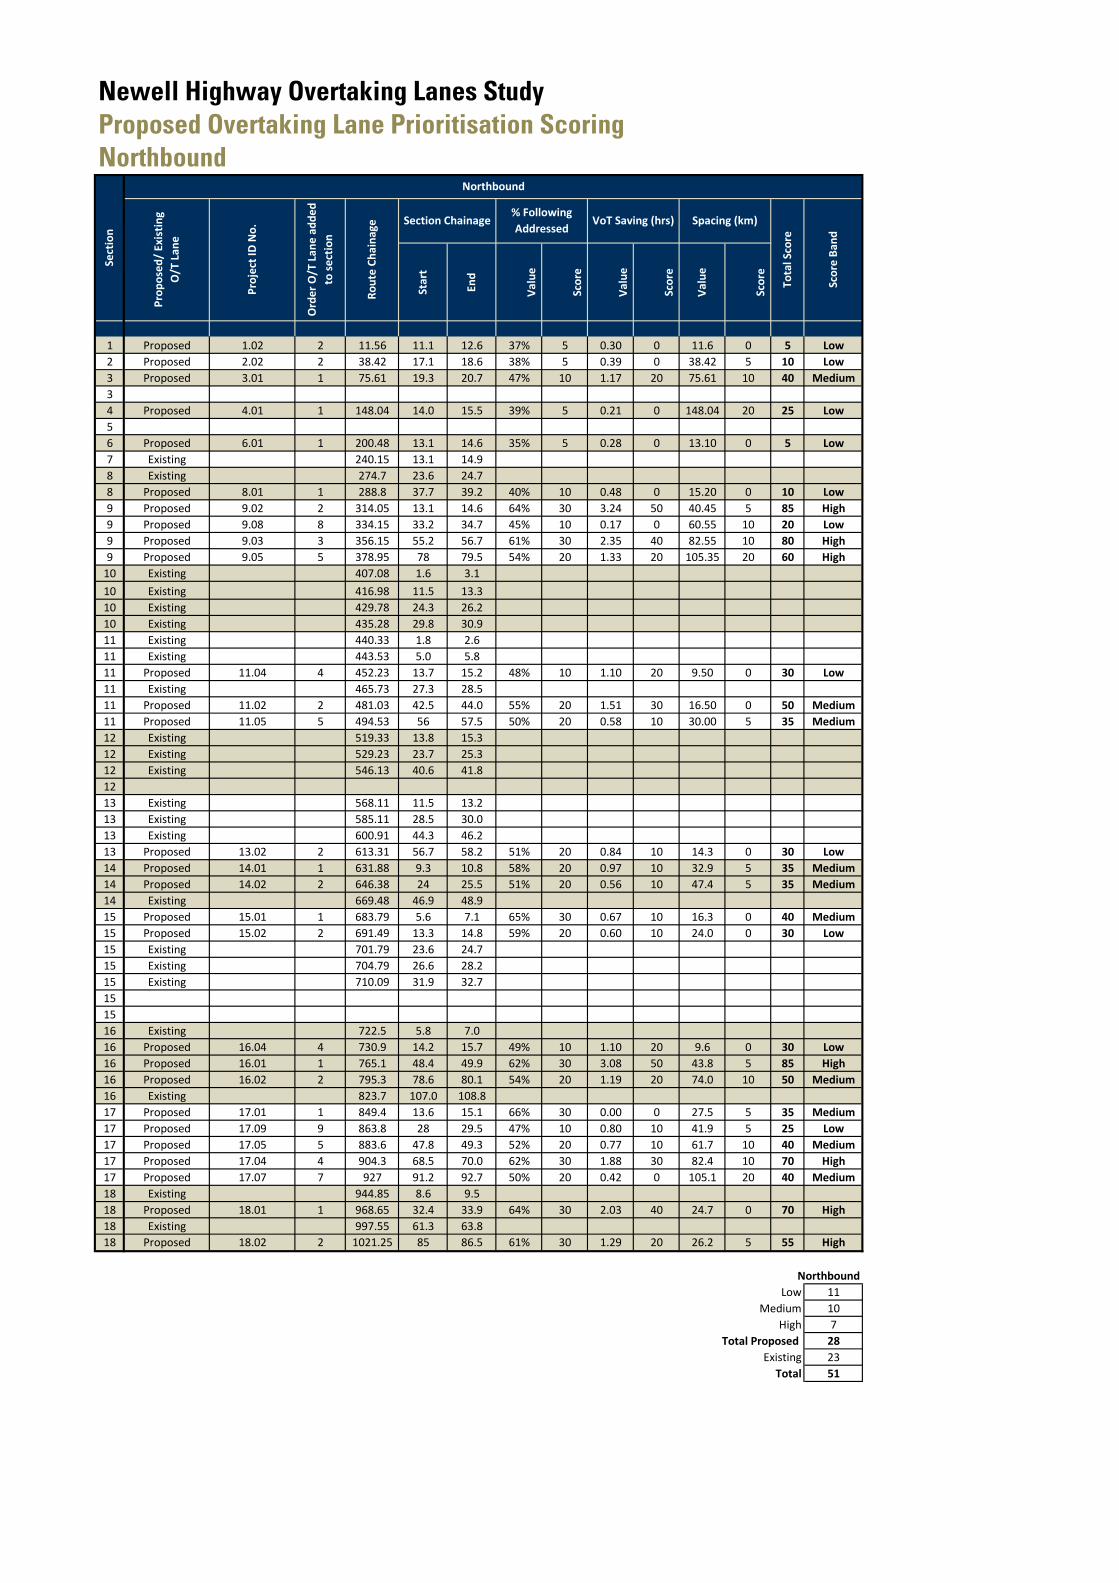
Newell Highway Overtaking Lanes Study
Proposed Overtaking Lane Prioritisation Scoring
Northbound
Star
t
End
Val
ue
Sco
re
Val
ue
Sco
re
Val
ue
Sco
re
1 Proposed 1.02 2 11.56 11.1 12.6 37% 5 0.30 0 11.6 0 5 Low
2 Proposed 2.02 2 38.42 17.1 18.6 38% 5 0.39 0 38.42 5 10 Low
3 Proposed 3.01 1 75.61 19.3 20.7 47% 10 1.17 20 75.61 10 40 Medium
3
4 Proposed 4.01 1 148.04 14.0 15.5 39% 5 0.21 0 148.04 20 25 Low
5
6 Proposed 6.01 1 200.48 13.1 14.6 35% 5 0.28 0 13.10 0 5 Low
7 Existing 240.15 13.1 14.9
8 Existing 274.7 23.6 24.7
8 Proposed 8.01 1 288.8 37.7 39.2 40% 10 0.48 0 15.20 0 10 Low
9 Proposed 9.02 2 314.05 13.1 14.6 64% 30 3.24 50 40.45 5 85 High
9 Proposed 9.08 8 334.15 33.2 34.7 45% 10 0.17 0 60.55 10 20 Low
9 Proposed 9.03 3 356.15 55.2 56.7 61% 30 2.35 40 82.55 10 80 High
9 Proposed 9.05 5 378.95 78 79.5 54% 20 1.33 20 105.35 20 60 High
10 Existing 407.08 1.6 3.1
10 Existing 416.98 11.5 13.3
10 Existing 429.78 24.3 26.2
10 Existing 435.28 29.8 30.9
11 Existing 440.33 1.8 2.6
11 Existing 443.53 5.0 5.8
11 Proposed 11.04 4 452.23 13.7 15.2 48% 10 1.10 20 9.50 0 30 Low
11 Existing 465.73 27.3 28.5
11 Proposed 11.02 2 481.03 42.5 44.0 55% 20 1.51 30 16.50 0 50 Medium
11 Proposed 11.05 5 494.53 56 57.5 50% 20 0.58 10 30.00 5 35 Medium
12 Existing 519.33 13.8 15.3
12 Existing 529.23 23.7 25.3
12 Existing 546.13 40.6 41.8
12
13 Existing 568.11 11.5 13.2
13 Existing 585.11 28.5 30.0
13 Existing 600.91 44.3 46.2
13 Proposed 13.02 2 613.31 56.7 58.2 51% 20 0.84 10 14.3 0 30 Low
14 Proposed 14.01 1 631.88 9.3 10.8 58% 20 0.97 10 32.9 5 35 Medium
14 Proposed 14.02 2 646.38 24 25.5 51% 20 0.56 10 47.4 5 35 Medium
14 Existing 669.48 46.9 48.9
15 Proposed 15.01 1 683.79 5.6 7.1 65% 30 0.67 10 16.3 0 40 Medium
15 Proposed 15.02 2 691.49 13.3 14.8 59% 20 0.60 10 24.0 0 30 Low
15 Existing 701.79 23.6 24.7
15 Existing 704.79 26.6 28.2
15 Existing 710.09 31.9 32.7
15
15
16 Existing 722.5 5.8 7.0
16 Proposed 16.04 4 730.9 14.2 15.7 49% 10 1.10 20 9.6 0 30 Low
16 Proposed 16.01 1 765.1 48.4 49.9 62% 30 3.08 50 43.8 5 85 High
16 Proposed 16.02 2 795.3 78.6 80.1 54% 20 1.19 20 74.0 10 50 Medium
16 Existing 823.7 107.0 108.8
17 Proposed 17.01 1 849.4 13.6 15.1 66% 30 0.00 0 27.5 5 35 Medium
17 Proposed 17.09 9 863.8 28 29.5 47% 10 0.80 10 41.9 5 25 Low
17 Proposed 17.05 5 883.6 47.8 49.3 52% 20 0.77 10 61.7 10 40 Medium
17 Proposed 17.04 4 904.3 68.5 70.0 62% 30 1.88 30 82.4 10 70 High
17 Proposed 17.07 7 927 91.2 92.7 50% 20 0.42 0 105.1 20 40 Medium
18 Existing 944.85 8.6 9.5
18 Proposed 18.01 1 968.65 32.4 33.9 64% 30 2.03 40 24.7 0 70 High
18 Existing 997.55 61.3 63.8
18 Proposed 18.02 2 1021.25 85 86.5 61% 30 1.29 20 26.2 5 55 High
Northbound
Low 11
Medium 10
High 7
Total Proposed 28
Existing 23
Total 51
Pro
ject
ID N
o.
% Following
AddressedVoT Saving (hrs) Spacing (km)
Tota
l Sco
re
Section Chainage
Sect
ion
Northbound
Sco
re B
and
Pro
po
sed
/ Ex
isti
ng
O/T
Lan
e
Ord
er
O/T
Lan
e a
dd
ed
to s
ect
ion
Ro
ute
Ch
ain
age
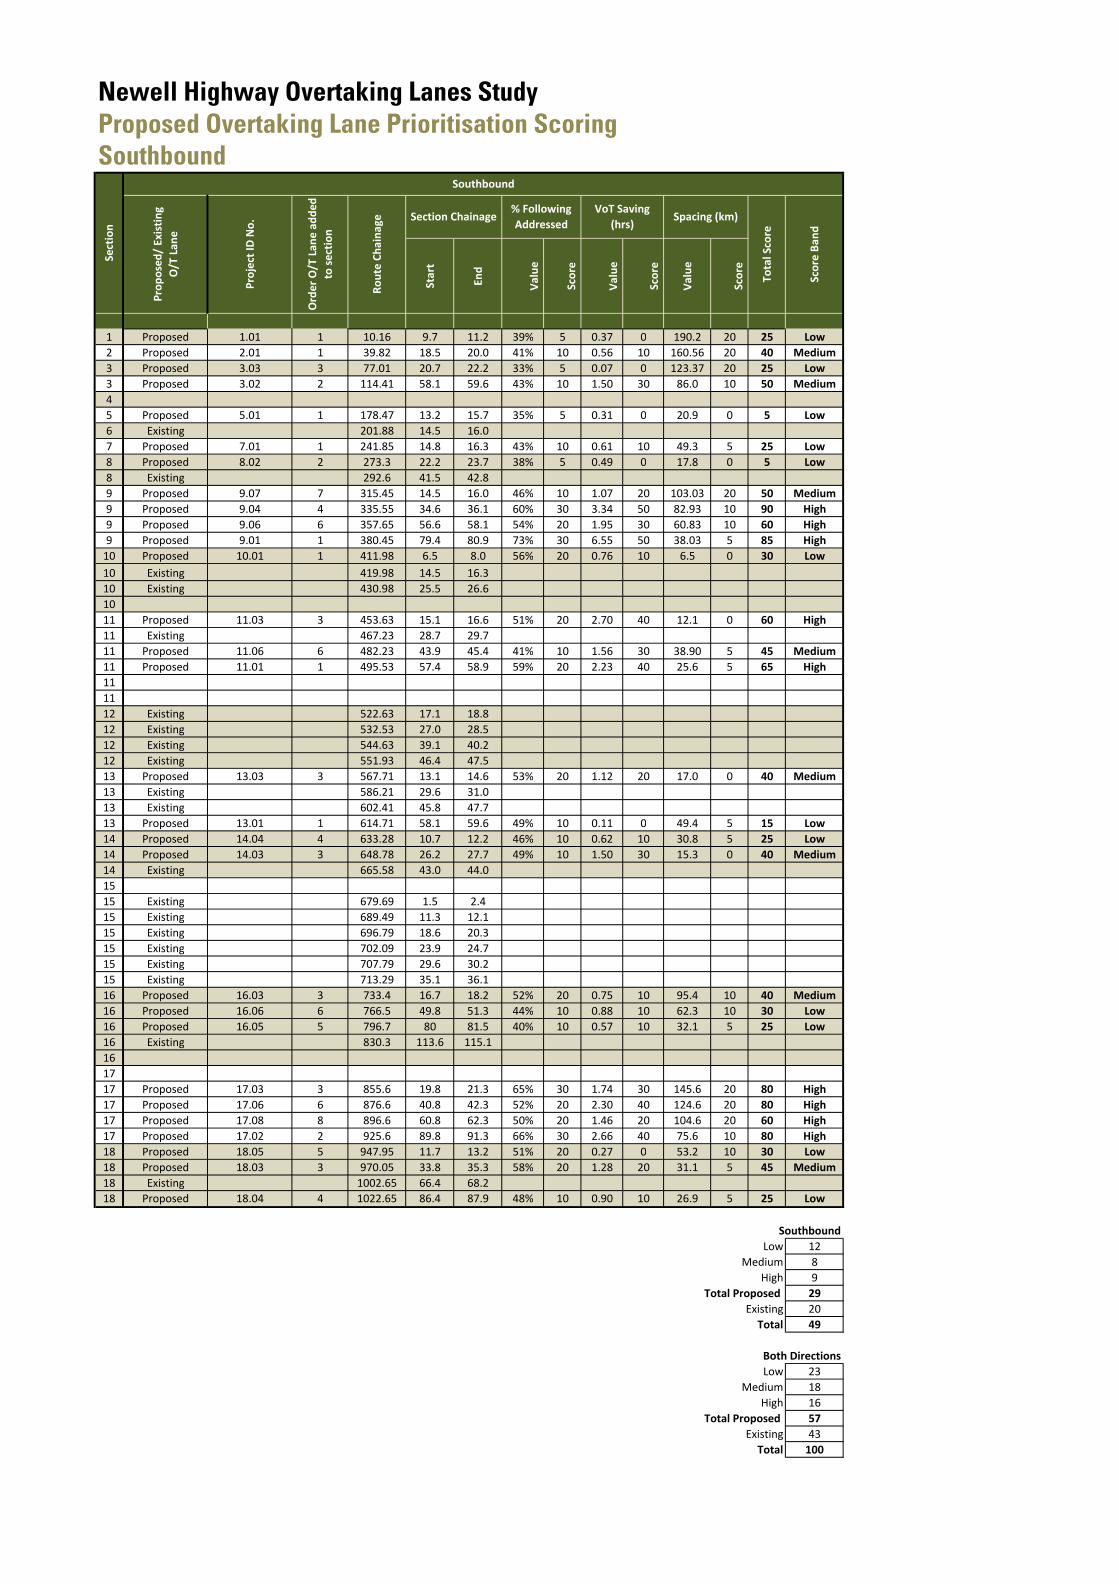
Newell Highway Overtaking Lanes Study
Proposed Overtaking Lane Prioritisation Scoring
Southbound
Sta
rt
En
d
Va
lue
Sco
re
Va
lue
Sco
re
Va
lue
Sco
re
1 Proposed 1.01 1 10.16 9.7 11.2 39% 5 0.37 0 190.2 20 25 Low
2 Proposed 2.01 1 39.82 18.5 20.0 41% 10 0.56 10 160.56 20 40 Medium
3 Proposed 3.03 3 77.01 20.7 22.2 33% 5 0.07 0 123.37 20 25 Low
3 Proposed 3.02 2 114.41 58.1 59.6 43% 10 1.50 30 86.0 10 50 Medium
4
5 Proposed 5.01 1 178.47 13.2 15.7 35% 5 0.31 0 20.9 0 5 Low
6 Existing 201.88 14.5 16.0
7 Proposed 7.01 1 241.85 14.8 16.3 43% 10 0.61 10 49.3 5 25 Low
8 Proposed 8.02 2 273.3 22.2 23.7 38% 5 0.49 0 17.8 0 5 Low
8 Existing 292.6 41.5 42.8
9 Proposed 9.07 7 315.45 14.5 16.0 46% 10 1.07 20 103.03 20 50 Medium
9 Proposed 9.04 4 335.55 34.6 36.1 60% 30 3.34 50 82.93 10 90 High
9 Proposed 9.06 6 357.65 56.6 58.1 54% 20 1.95 30 60.83 10 60 High
9 Proposed 9.01 1 380.45 79.4 80.9 73% 30 6.55 50 38.03 5 85 High
10 Proposed 10.01 1 411.98 6.5 8.0 56% 20 0.76 10 6.5 0 30 Low
10 Existing 419.98 14.5 16.3
10 Existing 430.98 25.5 26.6
10
11 Proposed 11.03 3 453.63 15.1 16.6 51% 20 2.70 40 12.1 0 60 High
11 Existing 467.23 28.7 29.7
11 Proposed 11.06 6 482.23 43.9 45.4 41% 10 1.56 30 38.90 5 45 Medium
11 Proposed 11.01 1 495.53 57.4 58.9 59% 20 2.23 40 25.6 5 65 High
11
11
12 Existing 522.63 17.1 18.8
12 Existing 532.53 27.0 28.5
12 Existing 544.63 39.1 40.2
12 Existing 551.93 46.4 47.5
13 Proposed 13.03 3 567.71 13.1 14.6 53% 20 1.12 20 17.0 0 40 Medium
13 Existing 586.21 29.6 31.0
13 Existing 602.41 45.8 47.7
13 Proposed 13.01 1 614.71 58.1 59.6 49% 10 0.11 0 49.4 5 15 Low
14 Proposed 14.04 4 633.28 10.7 12.2 46% 10 0.62 10 30.8 5 25 Low
14 Proposed 14.03 3 648.78 26.2 27.7 49% 10 1.50 30 15.3 0 40 Medium
14 Existing 665.58 43.0 44.0
15
15 Existing 679.69 1.5 2.4
15 Existing 689.49 11.3 12.1
15 Existing 696.79 18.6 20.3
15 Existing 702.09 23.9 24.7
15 Existing 707.79 29.6 30.2
15 Existing 713.29 35.1 36.1
16 Proposed 16.03 3 733.4 16.7 18.2 52% 20 0.75 10 95.4 10 40 Medium
16 Proposed 16.06 6 766.5 49.8 51.3 44% 10 0.88 10 62.3 10 30 Low
16 Proposed 16.05 5 796.7 80 81.5 40% 10 0.57 10 32.1 5 25 Low
16 Existing 830.3 113.6 115.1
16
17
17 Proposed 17.03 3 855.6 19.8 21.3 65% 30 1.74 30 145.6 20 80 High
17 Proposed 17.06 6 876.6 40.8 42.3 52% 20 2.30 40 124.6 20 80 High
17 Proposed 17.08 8 896.6 60.8 62.3 50% 20 1.46 20 104.6 20 60 High
17 Proposed 17.02 2 925.6 89.8 91.3 66% 30 2.66 40 75.6 10 80 High
18 Proposed 18.05 5 947.95 11.7 13.2 51% 20 0.27 0 53.2 10 30 Low
18 Proposed 18.03 3 970.05 33.8 35.3 58% 20 1.28 20 31.1 5 45 Medium
18 Existing 1002.65 66.4 68.2
18 Proposed 18.04 4 1022.65 86.4 87.9 48% 10 0.90 10 26.9 5 25 Low
Southbound
Low 12
Medium 8
High 9
Total Proposed 29
Existing 20
Total 49
Both Directions
Low 23
Medium 18
High 16
Total Proposed 57
Existing 43
Total 100
Pro
ject
ID
No
.
Se
ctio
n
Southbound
Pro
po
sed
/ E
xis
tin
g
O/T
La
ne
Ord
er
O/T
La
ne
ad
de
d
to s
ect
ion
Ro
ute
Ch
ain
ag
e Section Chainage% Following
Addressed
VoT Saving
(hrs)Spacing (km)
To
tal
Sco
re
Sco
re B
an
d