Newell Brands Inc. -...
60
SCHEDULE 14A (Rule 14a-101) INFORMATION REQUIRED IN PROXY STATEMENT Proxy Statement Pursuant to Section 14(a) of the Securities Exchange Act of 1934 (Amendment No. ) Filed by the Registrant ☒ Filed by a Party other than the Registrant ☐ Check the appropriate box: ☐ Preliminary Proxy Statement ☐ Confidential, for Use of the Commission Only (as permitted by Rule 14a-6(e)(2)) ☐ Definitive Proxy Statement ☐ Definitive Additional Materials ☒ Soliciting material Pursuant to Rule 14a-12 Newell Brands Inc. (Name of Registrant as Specified In Its Charter) (Name of Person(s) Filing Proxy Statement, if other than the Registrant) PAYMENT OF FILING FEE (Check the appropriate box): ☒ No fee required. ☐ Fee computed on table below per Exchange Act Rules 14a-6(i)(1) and 0-11. 1) Title of each class of securities to which transaction applies: 2) Aggregate number of securities to which transaction applies: 3) Per unit price or other underlying value of transaction computed pursuant to Exchange Act Rule 0-11 (Set forth the amount on which the filing fee is calculated and state how it was determined): 4) Proposed maximum aggregate value of transaction: 5) Total fee paid: ☐ Fee paid previously with preliminary materials. ☐ Check box if any part of the fee is offset as provided by Exchange Act Rule 0-11(a)(2) and identify the filing for which the offsetting fee was paid previously. Identify the previous filing by registration statement number, or the Form or Schedule and the date of its filing. 1) Amount Previously Paid: 2) Form, Schedule or Registration Statement No.:
Transcript of Newell Brands Inc. -...
SCHEDULE 14A(Rule 14a-101)
INFORMATION REQUIRED IN PROXY STATEMENT
Proxy Statement Pursuant to Section 14(a) of theSecurities Exchange Act of 1934
(Amendment No. )
Filed by the Registrant ☒ Filed by a Party other than the Registrant ☐
Check the appropriate box:
☐ Preliminary Proxy Statement
☐ Confidential, for Use of the Commission Only (as permitted by Rule 14a-6(e)(2))
☐ Definitive Proxy Statement
☐ Definitive Additional Materials
☒ Soliciting material Pursuant to Rule 14a-12
Newell Brands Inc.(Name of Registrant as Specified In Its Charter)
(Name of Person(s) Filing Proxy Statement, if other than the Registrant)
PAYMENT OF FILING FEE (Check the appropriate box):
☒ No fee required.
☐ Fee computed on table below per Exchange Act Rules 14a-6(i)(1) and 0-11.
1)
Title of each class of securities to which transaction applies:
2)
Aggregate number of securities to which transaction applies:
3)
Per unit price or other underlying value of transaction computed pursuant to Exchange Act Rule 0-11 (Set forth the amount on which the filing fee iscalculated and state how it was determined):
4)
Proposed maximum aggregate value of transaction:
5)
Total fee paid:
☐ Fee paid previously with preliminary materials.
☐
Check box if any part of the fee is offset as provided by Exchange Act Rule 0-11(a)(2) and identify the filing for which the offsetting fee was paidpreviously. Identify the previous filing by registration statement number, or the Form or Schedule and the date of its filing.
1)
Amount Previously Paid:
2)
Form, Schedule or Registration Statement No.:

3)
Filing Party:
4)
Date Filed:
Michael Polk, Chief Executive Officer, participated in a presentation to the Consumer Analyst Group of New York Conference on February 22, 2018 (the“Conference”). The investor presentation used by Mr. Polk at the Conference is attached as Exhibit 1. Also on February 22, 2018, the employeecommunication attached as Exhibit 2 was provided to employees of Newell Brands Inc.
Exhibit 1
Consumer Analyst Group of New York Michael B. Polk - Chief Executive Officer February 22, 2018 live. learn. work. play.

Forward-looking Statements Forward-looking statements in this presentation are made in reliance upon the safe harbor provisions of the Private Securities Litigation Reform Act of 1995. Such forward-looking statements may relate to, but are not limited to, information or assumptions about the effects of sales (including pricing), income/(loss), earnings per share, return on equity, return on invested capital, operating income, operating margin or gross margin improvements or declines, Project Renewal, capital and other expenditures, working capital, cash flow, dividends, capital structure, debt to capitalization ratios, debt ratings, availability of financing, interest rates, restructuring and other project costs, impairment and other charges, potential losses on divestitures, impacts of changes in accounting standards, pending legal proceedings and claims (including environmental matters), future economic performance, costs and cost savings, inflation or deflation with respect to raw materials and sourced products, productivity and streamlining, changes in foreign exchange rates, product recalls, expected benefits and synergies and financial results from recently completed acquisitions and planned acquisitions and divestitures and management’s plans, goals and objectives for future operations, performance and growth or the assumptions relating to any of the forward-looking statements. These statements generally are accompanied by words such as “intend,” “anticipate,” “believe,” “estimate,” “project,” “target,” “plan,” “expect,” “will,” “should,” “would” or similar statements. The Company cautions that forward-looking statements are not guarantees because there are inherent difficulties in predicting future results. Actual results could differ materially from those expressed or implied in the forward-looking statements. Important factors that could cause actual results to differ materially from those suggested by the forward-looking statements include, but are not limited to, uncertainties regarding further actions that may be taken by Starboard Value and Opportunity Master Fund L.P. (“Starboard”) in furtherance of its stated intention to nominate directorcandidates for election at the company’s 2018 Annual Meeting; potential operational disruptions caused by Starboard’s actions that may make it more difficult to maintain relationships with customers, employees or suppliers; the Company’s dependence on the strength of retail, commercial and industrial sectors of the economy in light of the continuation of challenging economic conditions, particularly outside of the United States; competition with other manufacturers and distributors of consumer products; major retailers’ strong bargaining power and consolidation of the Company’s customers; the Company’s ability to improve productivity, reduce complexity and streamline operations; the Company’s ability to develop innovative new products and to develop, maintain and strengthen its end-user brands, including the ability to realize anticipated benefits of increased advertising and promotion spend; risks related to the substantial indebtedness that the Company incurred in connection with the Jarden Acquisition; the Company’s ability to effectively accelerate its transformation plan and explore and execute its strategic options; risks related to a potential increase in interest rates; the Company’s ability to complete planned acquisitions and divestitures; difficulties integrating Jarden and other acquisitions and unexpected costs or expenses associated with acquisitions or dispositions; changes in the prices of raw materials and sourced products and the Company’s ability to obtain raw materials and sourced products in a timely manner from suppliers; the risks inherent in the Company’s foreign operations, including currency fluctuations, exchange controls and pricing restrictions; a failure of one of the Company’s key information technology systems or related controls; future events that could adversely affect the value of the Company’s assets and require impairment charges; United States and foreign regulatory impact on the Company’s operations including environmental remediation costs; the potential inability to attract, retain and motivate key employees; the imposition of tax liabilities greater than the Company’s provisions for such matters; productliability, product recalls or regulatory actions; the Company’s ability to protect its intellectual property rights; changes to the Company’s credit ratings; significant increases in the funding obligations related to the Company’s pension plans due to declining asset values, declining interest rates or otherwise; and those factors listed in our filings with the Securities and Exchange Commission (including the information set forth under the caption “Risk Factors” in the Company’s and Jarden Corporation’s Annual Report on Form 10-K). Changes in such assumptions or factors could produce significantly different results. The information contained in this presentation is as of the date indicated. The Company assumes no obligation to update any forward-looking statements contained in this presentation as a result of new information or future events or developments. In addition, there can be no assurance that the Company has correctly identified and assessed all of the factors affecting the Company or that the publicly available and other information the Company receives with respect to these factors is complete or correct. This presentation contains non-GAAP financial measures within the meaning of Regulation G promulgated by the Securities and Exchange Commission and to the extent available without unreasonable effort or expense includes a reconciliation of these non-GAAP financial measures to the most directly comparable financial measures calculated in accordance with GAAP. While the Company believes that these non-GAAP financial measures are useful in evaluating the Company’s performance, this information should be considered as supplemental in nature and not as a substitute for or superior to the related financial information prepared in accordance with GAAP. Additionally, these non-GAAP financial measures may differ from similar measures presented by other companies.
Additional information Additional Information In connection with Newell’s 2018 Annual Meeting of Shareholders, Newell will file with the U.S. Securities and Exchange Commission and mail to the shareholders of record entitled to vote at the 2018 Annual Meeting a definitive proxy statement and other documents, including a WHITE proxy card. SHAREHOLDERS ARE ENCOURAGED TO READ THE PROXY STATEMENT AND ALL OTHER RELEVANT DOCUMENTS WHEN FILED WITH THE SEC AND WHEN THEY BECOME AVAILABLE BECAUSE THOSE DOCUMENTS WILL CONTAIN IMPORTANT INFORMATION. When filed with the SEC, the definitive proxy statement and WHITE proxy card will also be mailed to shareholders of record. Investors and other interested parties will be able to obtain the documents free of charge at the SEC’s website, www.sec.gov, or from Newell at its website, www.newellbrands.com, or through a request in writing sent to Newell at 221 River Street, Hoboken, New Jersey, 07030, Attention: General Counsel Participants in Solicitation The Company and its directors and executive officers may be deemed to be participants in the solicitation of proxies in connection with the 2018 Annual Meeting. Certain information concerning certain of these participants is set forth in the Company’s definitive proxy statement, dated March 30, 2017, for its 2017 annual meeting of shareholders as filed with the SEC on Schedule 14A and the Company’s Current Reports, dated August 24, 2017, January 21, 2018 and February 16, 2018, as filed with the SEC on Form 8-K. Additional information regarding the interests of these participants in the solicitation of proxies in respect of the 2018 Annual Meeting and other relevant materials will be filed with the SEC when they become available.
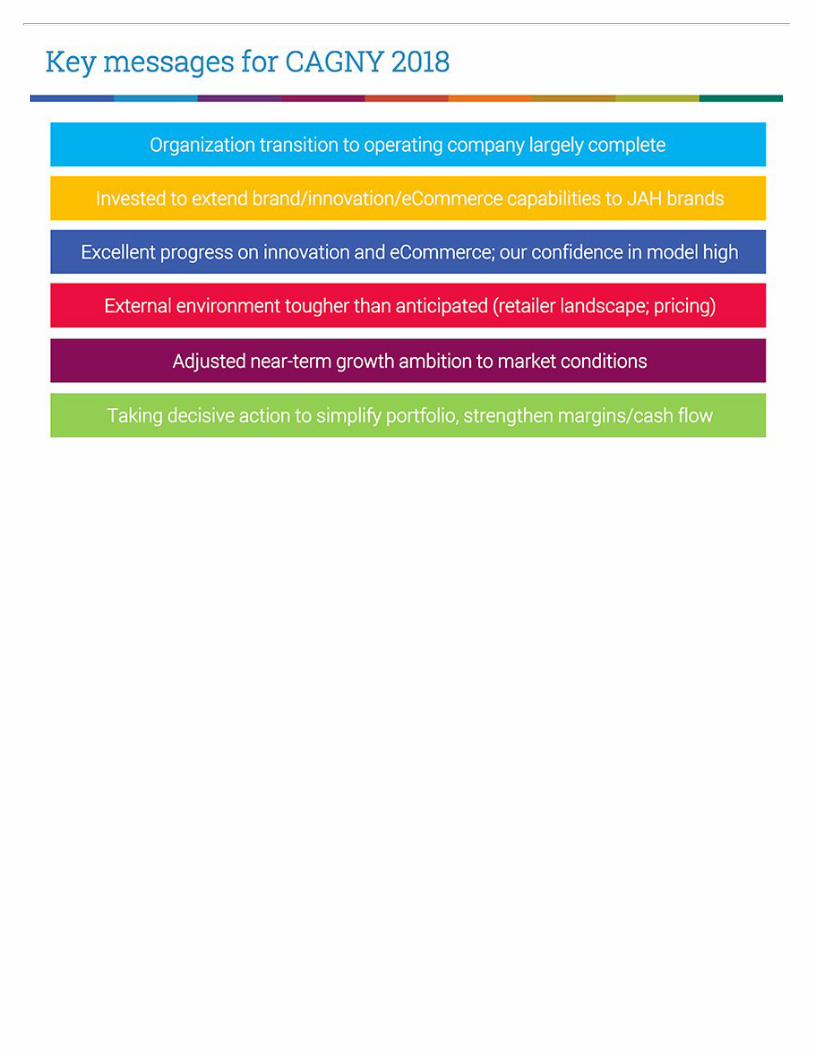
Key messages for CAGNY 2018 Organization transition to operating company largely complete Invested to extend brand/innovation/eCommerce capabilities to JAH brands Excellent progress on innovation and eCommerce; our confidence in model high External environment tougher than anticipated (retailer landscape; pricing) Adjusted near-term growth ambition to market conditions Taking decisive action to simplify portfolio, strengthen margins/cash flow
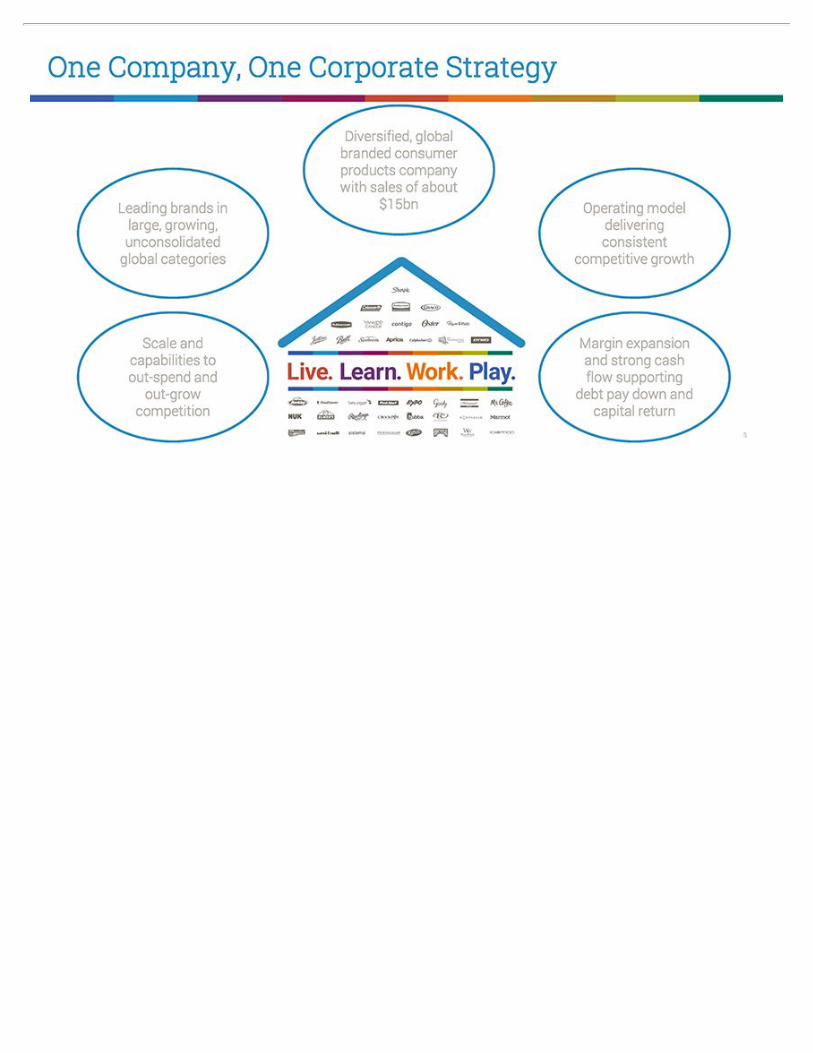
One Company, One Corporate Strategy Leading brands in large, growing, unconsolidated global categories Scale and capabilities to out-spend and out-grow competition Diversified, global branded consumer products company with sales of about $15bn Operating model delivering consistent competitive growth Margin expansion and strong cash flow supporting debt pay down and capital return
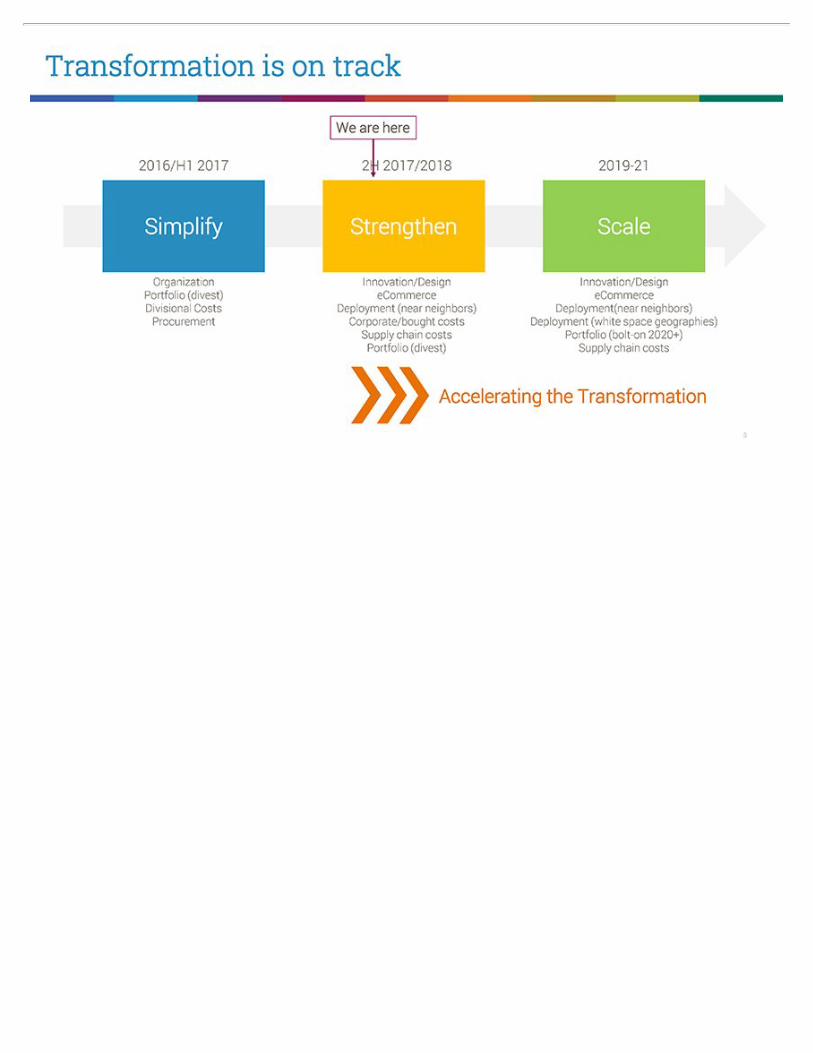
Transformation is on track We are here 2016/H1 2017 Simplify Organization Portfolio (divest) Divisional Costs Procurement 2H 2017/2018 Strengthen Innovation/Design eCommerce Deployment (near neighbors) Corporate/bought costs Supply chain costs Portfolio (divest) 2019-21 Scale Innovation/Design eCommerce Deployment(near neighbors) Deployment (white space geographies) Portfolio (bolt-on 2020+) Supply chain costs Accelerating the Transformation

Why reshape the portfolio now? Sharpens focus on core and enables quicker response to market conditions Maximizes growth and margin potential via 20% US eCommerce exposure Reduces future fixed cost margin exposure to B&M consolidation Simplification accelerates margin development and strengthens FCF productivity Accelerates de-leveraging (~$4 billion available for debt repayment by 2019) Reduces industrial/commercial exposure when multiples are at all time high levels U.S. Tax Reform creates a unique opportunity to maximize value creation
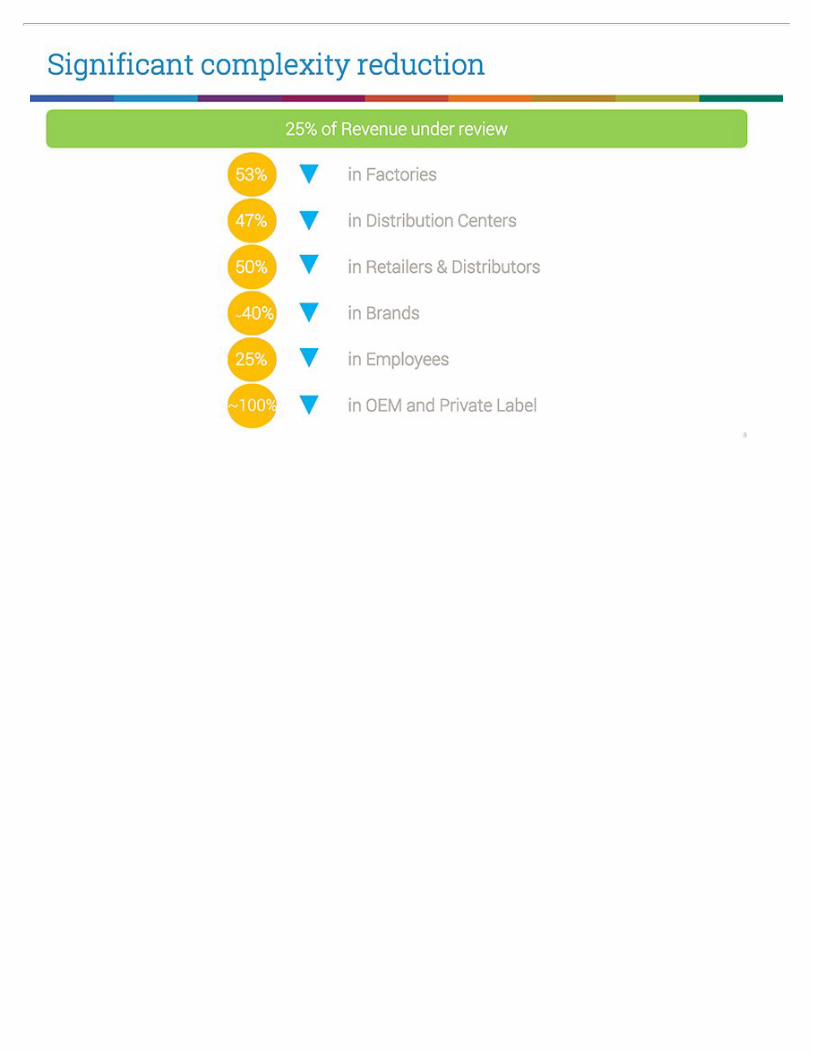
Significant complexity reduction 25% of Revenue under review 53% in Factories 47% in Distribution Centers 50% in Retailers & Distributors ~40% in Brands 25% in Employees ~100% in OEM and Private Label
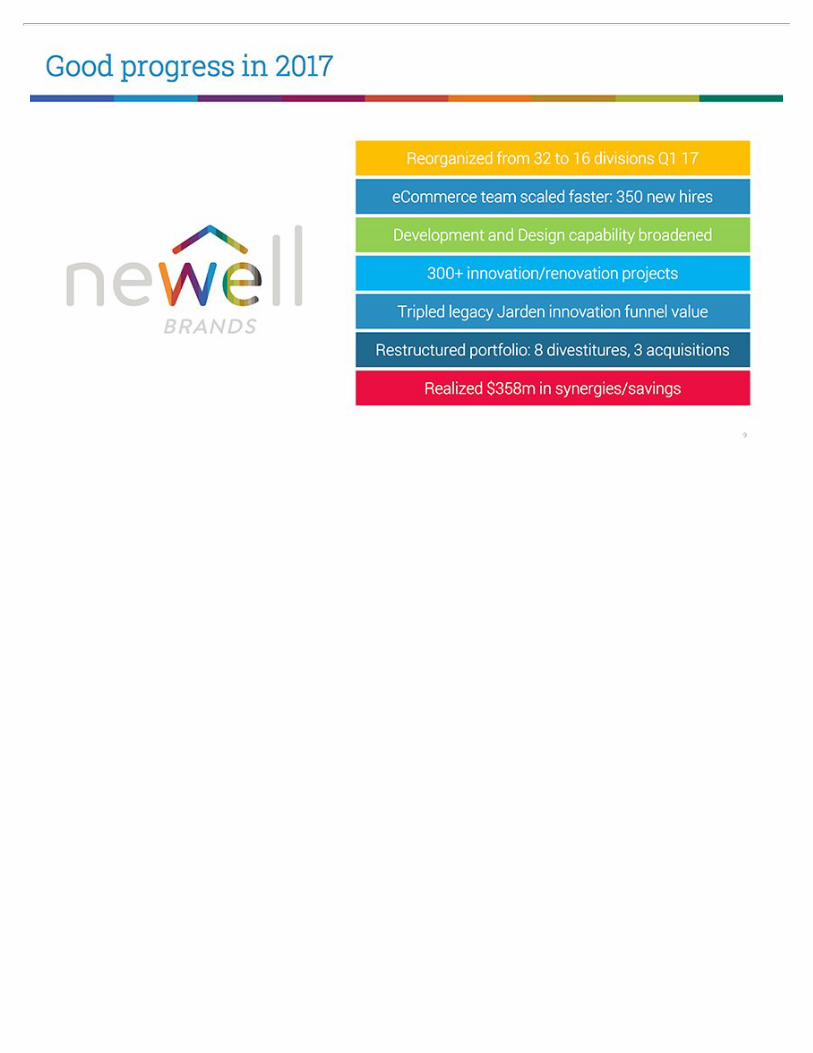
Good progress in 2017 Reorganized from 32 to 16 divisions Q1 17 eCommerce team scaled faster: 350 new hires Development and Design capability broadened 300+ innovation/renovation projects Tripled legacy Jarden innovation funnel value Restructured portfolio: 8 divestitures, 3 acquisitions Realized $358m in synergies/savings
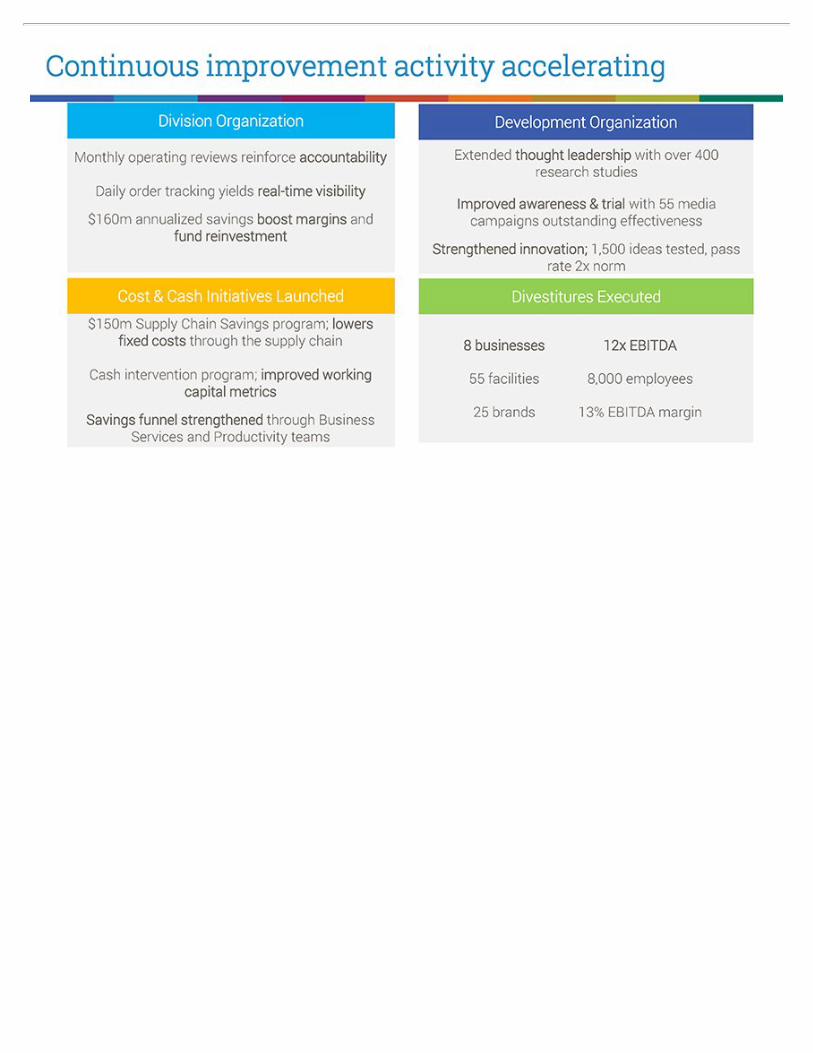
Continuous improvement activity accelerating Division Organization Monthly operating reviews reinforce accountability Daily order tracking yields real-time visibility $160m annualized savings boost margins and fund reinvestment Cost & Cash Initiatives Launched $150m Supply Chain Savings program; lowers fixed costs through the supply chain Cash intervention program; improved working capital metrics Savings funnel strengthened through Business Services and Productivity teams Development Organization Extended thought leadership with over 400 research studies Improved awareness & trial with 55 media campaigns outstanding effectiveness Strengthened innovation; 1,500 ideas tested, pass rate 2x norm Divestitures Executed 8 businesses 12x EBITDA 55 facilities 8,000 employees 25 brands 13% EBITDA margin
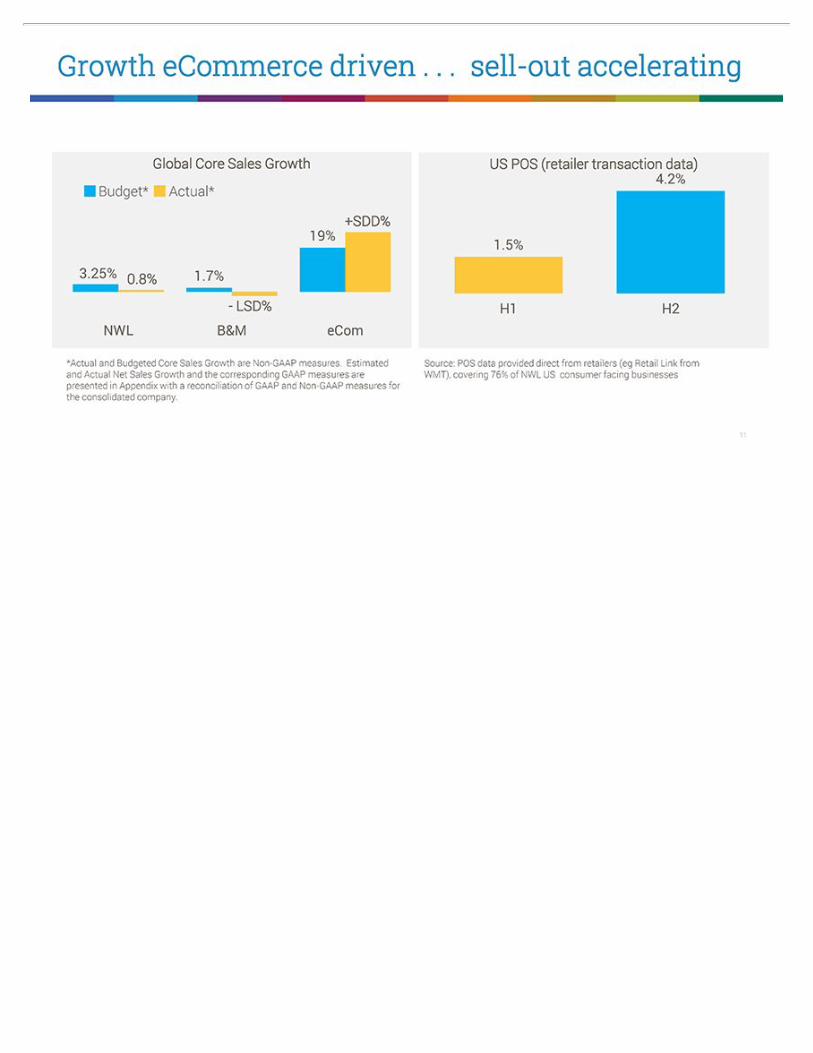
Growth eCommerce driven . . . sell-out accelerating Global Core Sales Growth Budget* Actual* 19% +SDD% 3.25% 0.8% 1.7% - LSD% NWL B&M eCom *Actual and Budgeted Core Sales Growth are Non-GAAP measures. Estimated and Actual Net Sales Growth and the corresponding GAAP measures are presented in Appendix with a reconciliation of GAAP and Non-GAAP measures for the consolidated company. US POS (retailer transaction 4. data) 2% 1.5% H1 H2 Source: POS data provided direct from retailers (eg Retail Link from WMT), covering 76% of NWL US consumer facing businesses
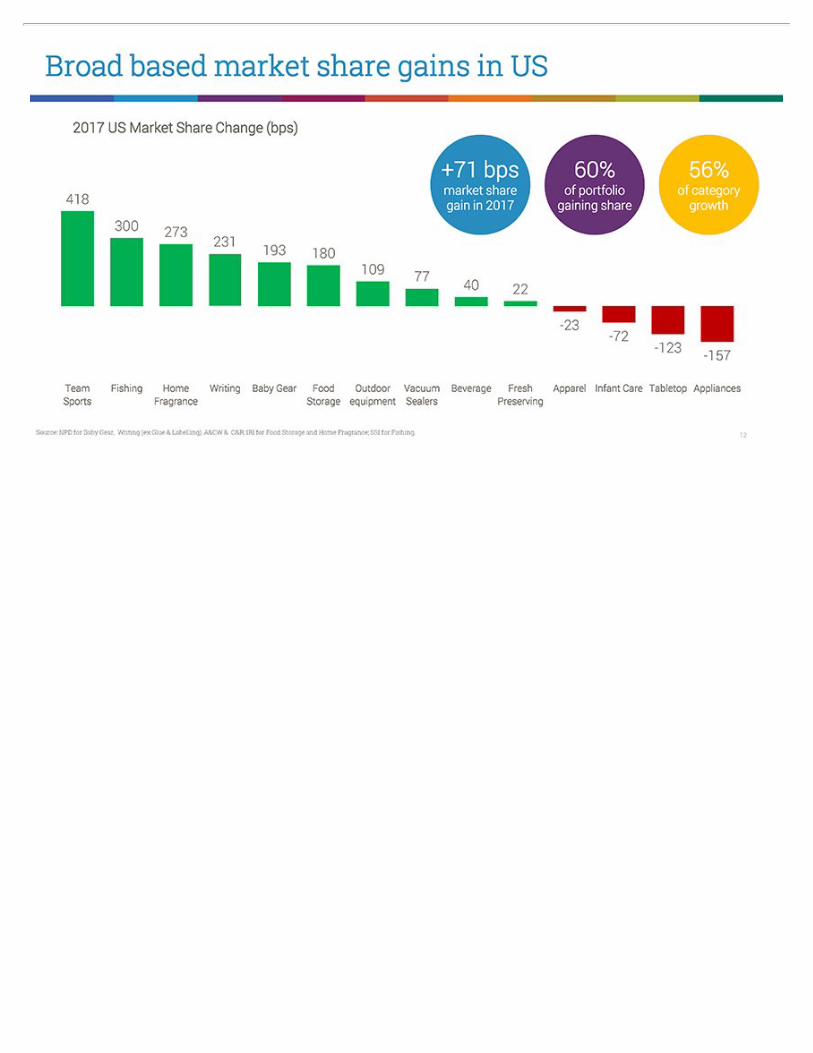
Broad based market share gains in US 2017 US Market Share Change (bps) +71 bps market share gain in 2017 60% of portfolio gaining share 56% of category growth Source: NPD for Baby Gear, Writing (ex Glue & Labelling), A&CW & O&R; IRI for Food Storage and Home Fragrance; SSI for Fishing.
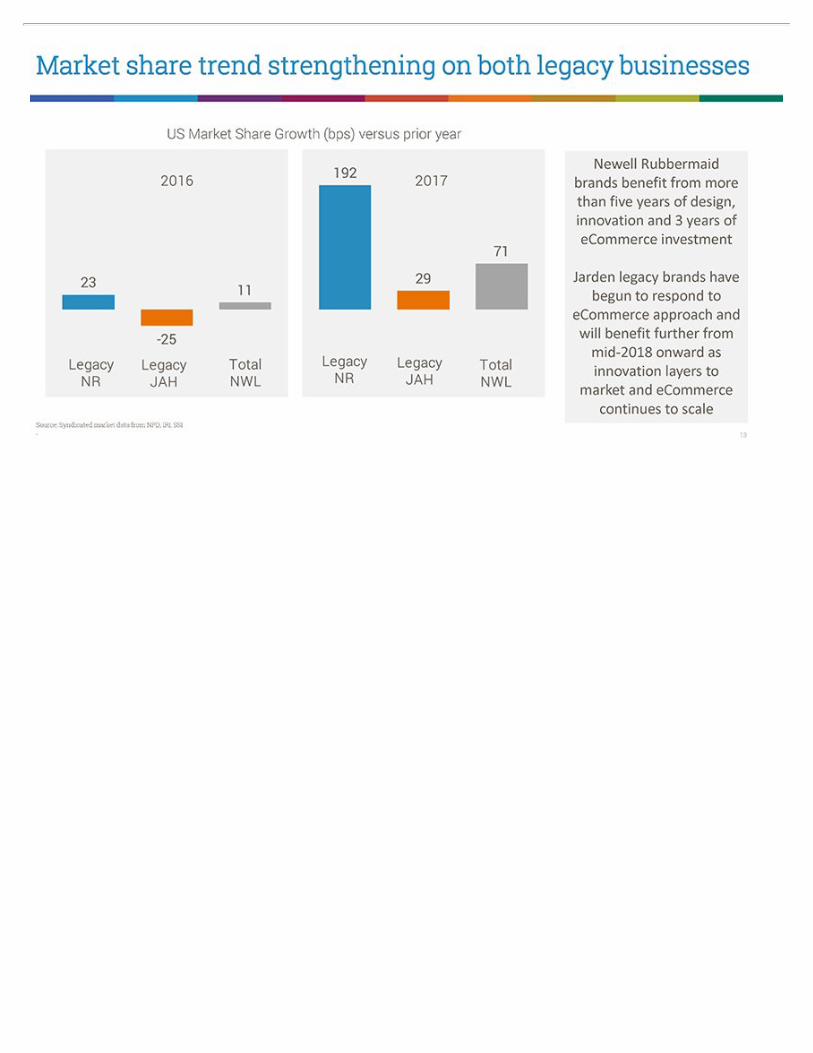
Market share trend strengthening on both legacy businesses US Market Share Growth (bps) versus prior year Newell Rubbermaid brands benefit from more than five years of design, innovation and 3 years of eCommerce investment Jarden legacy brands have begun to respond to eCommerce approach and will benefit further from mid-2018 onward as innovation layers to market and eCommerce continues to scale Source: Syndicated market data from NPD, IRI, SSI .
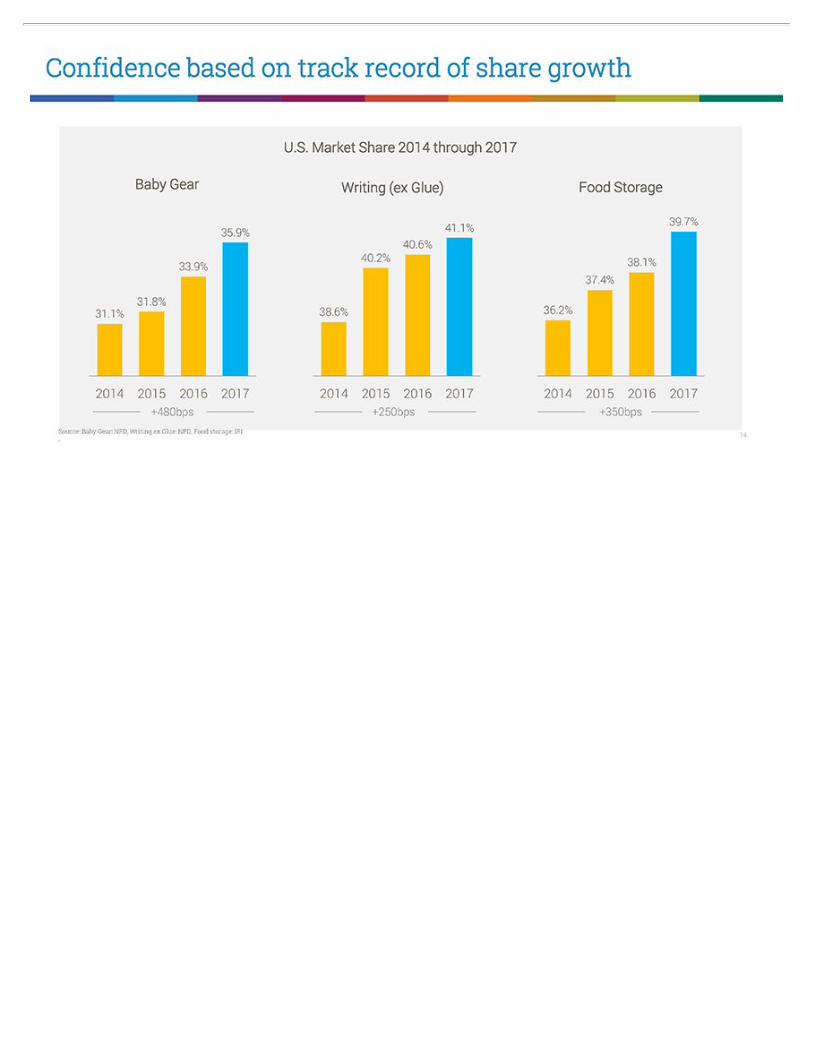
Confidence based on track record of share growth U.S. Market Share 2014 through 2017 Baby Gear Writing (ex Glue) Food Storage Source: Baby Gear: NPD, Writing ex Glue: NPD, Food storage: IRI .
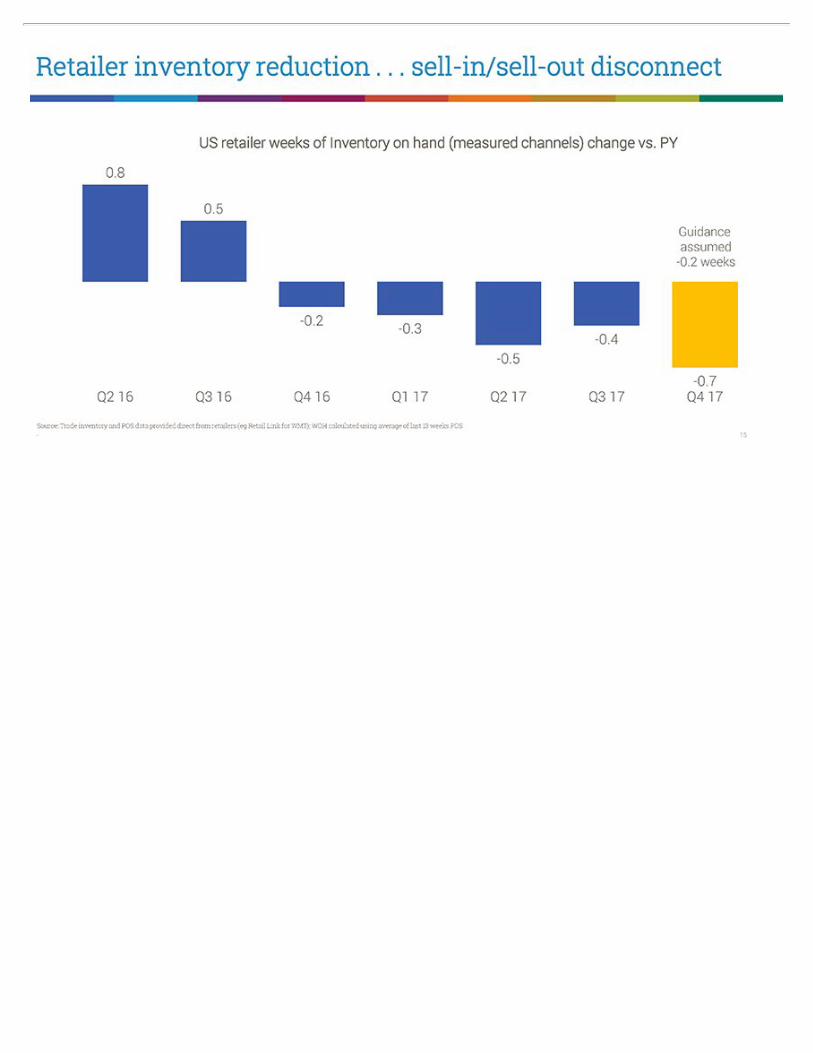
Retailer inventory reduction . . . sell-in/sell-out disconnect US retailer weeks of Inventory on hand (measured channels) change vs. PY Source: Trade inventory and POS data provided direct from retailers (eg Retail Link for WMT); WOH calculated using average of last 13 weeks POS
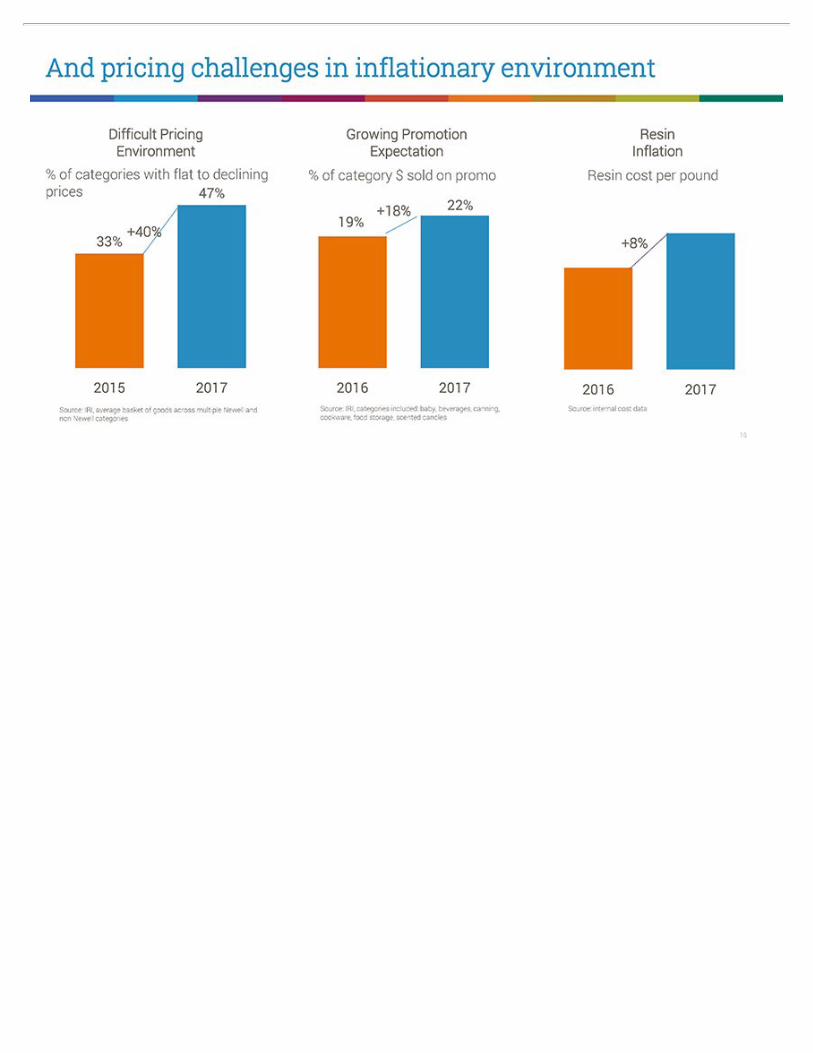
And pricing challenges in inflationary environment Difficult Pricing Environment % of categories with flat to declining prices Growing Promotion Expectation % of category $ sold on promo Resin Inflation Resin cost per pound Source: IRI, average basket of goods across multiple Newell and non Newell categories Source: IRI, categories included: baby, beverages, canning, cookware, food storage, scented candles Source: internal cost data
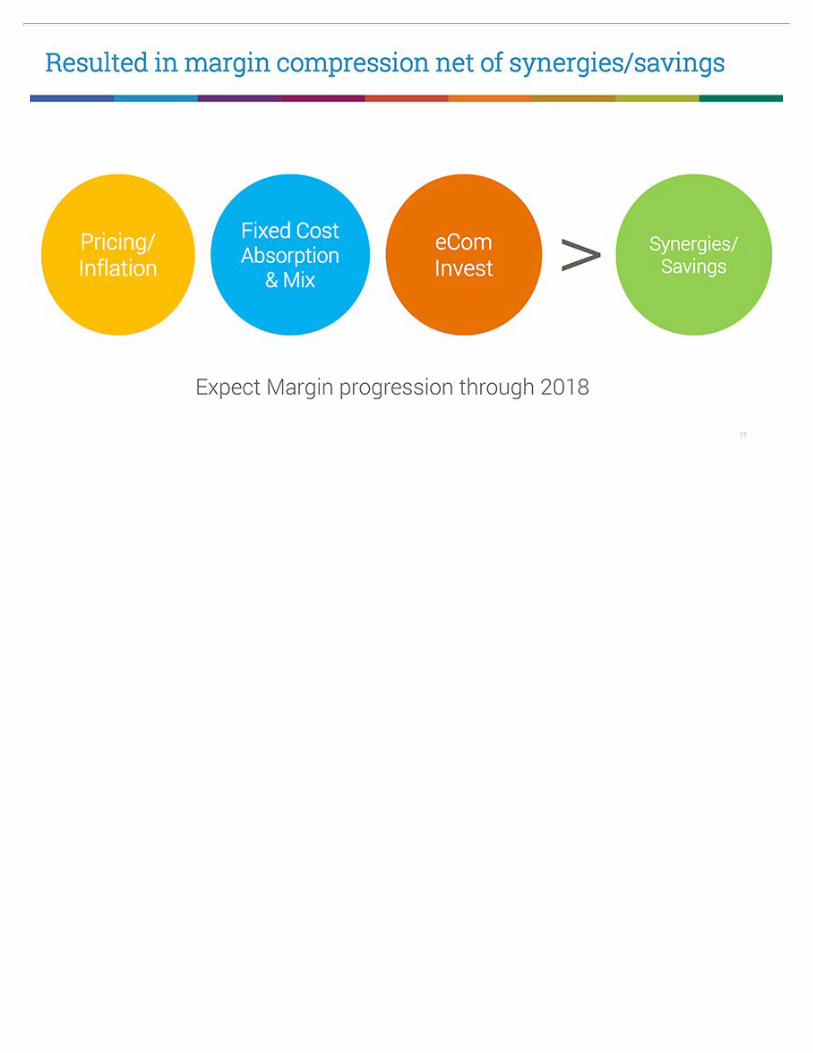
Resulted in margin compression net of synergies/savings Pricing/ Inflation Fixed Cost Absorption & Mix eCom Invest Synergies/ Savings Expect Margin progression through 2018
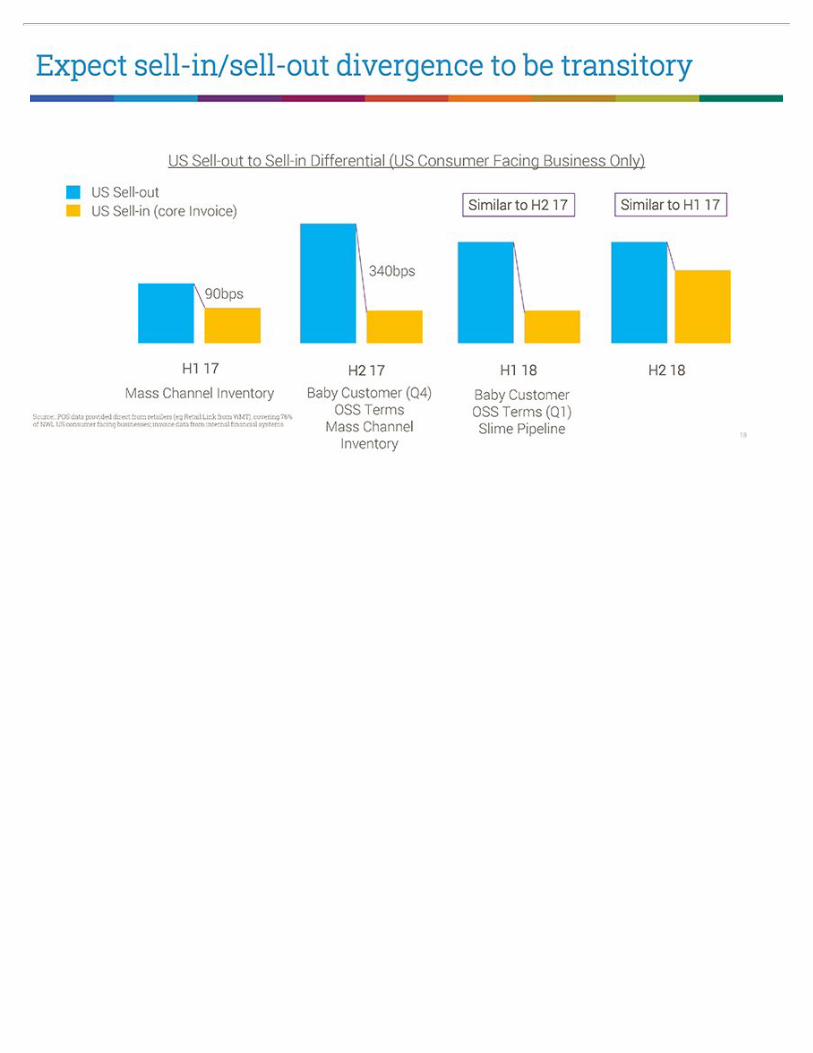
Source:. POS data provided direct from retailers (eg Retail Link from WMT), covering 76% of NWL US consumer facing businesses; invoice data from internal financial systems Expect sell-in/sell-out divergence to be transitory US Sell-out to Sell-in Differential (US Consumer Facing Business Only)
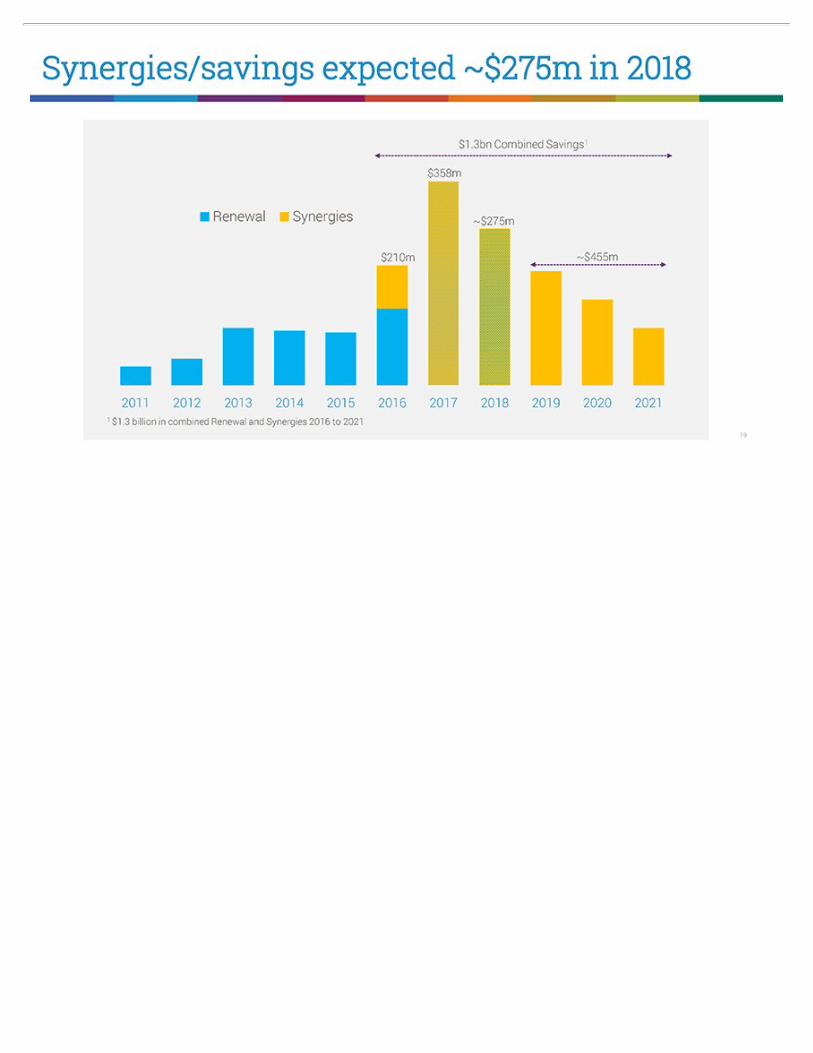
Synergies/savings expected ~$275m in 2018 1 $1.3 billion in combined Renewal and Synergies 2016 to 2021
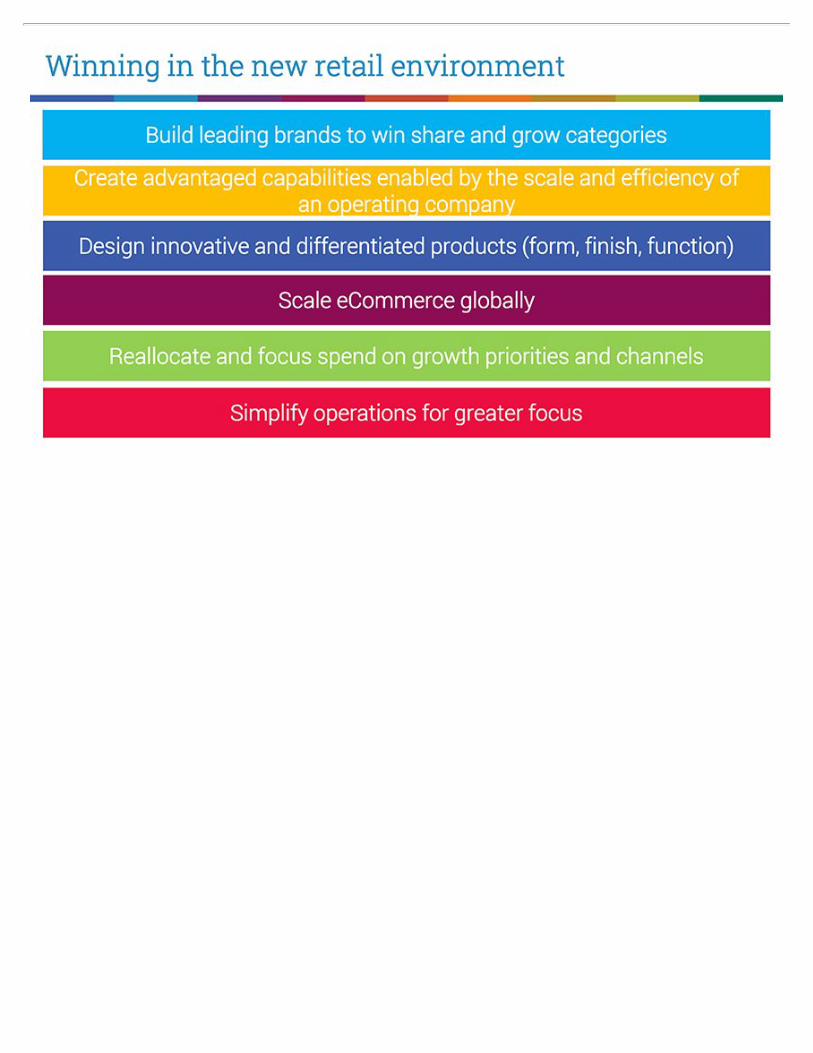
Winning in the new retail environment Build leading brands to win share and grow categories Create advantaged capabilities enabled by the scale and efficiency of an operating company Design innovative and differentiated products (form, finish, function) Scale eCommerce globally Reallocate and focus spend on growth priorities and channels Simplify operations for greater focus
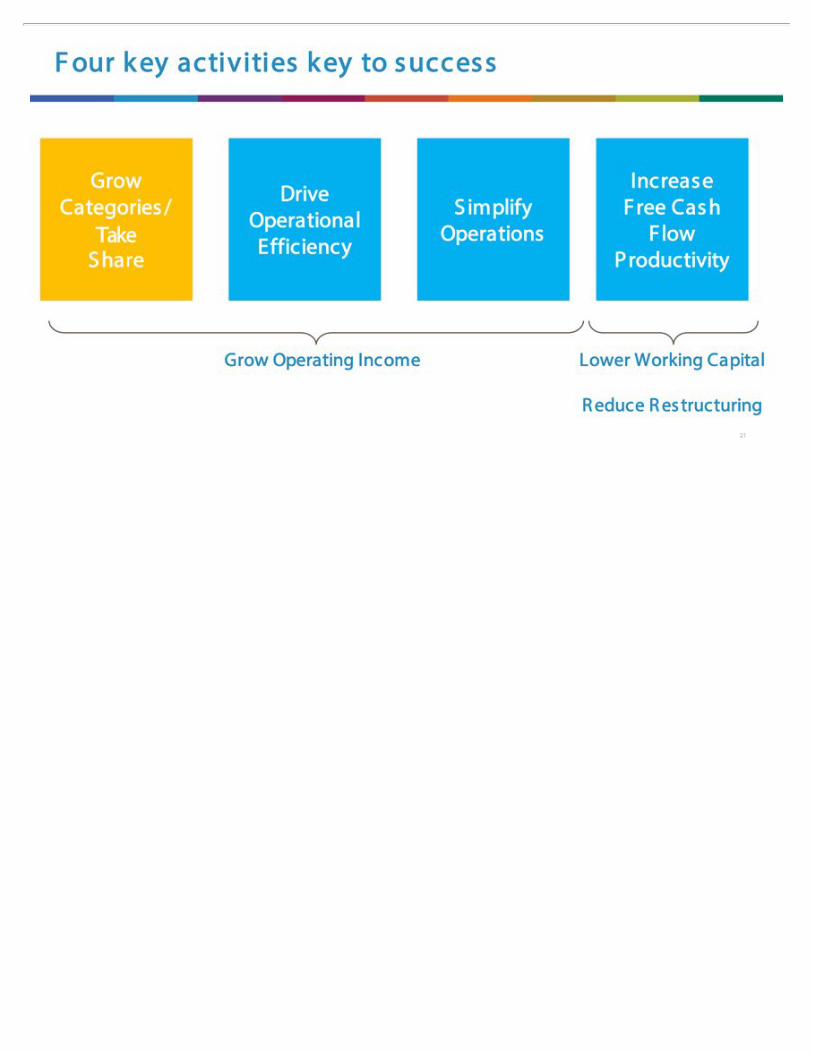
Four key activities key to success Grow Categories/ Take Share Drive Operational Efficiency Simplify Operations Increase Free Cash Flow Productivity Grow Operating Income Lower Working Capital Reduce Restructuring
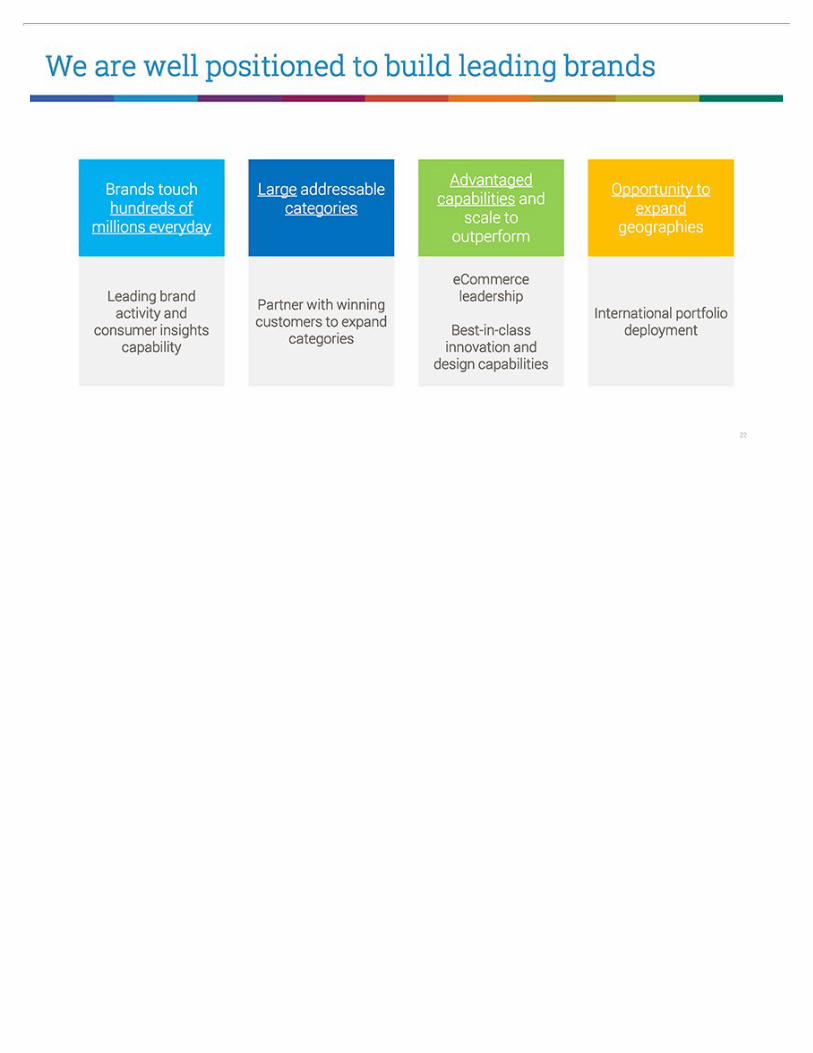
We are well positioned to build leading brands Brands touch hundreds of millions everyday Leading brand activity and consumer insights capability Large addressable categories Partner with winning customers to expand categories Advantaged capabilities and scale to outperform eCommerce leadership Best-in-class innovation and design capabilities Opportunity to expand geographies International portfolio deployment
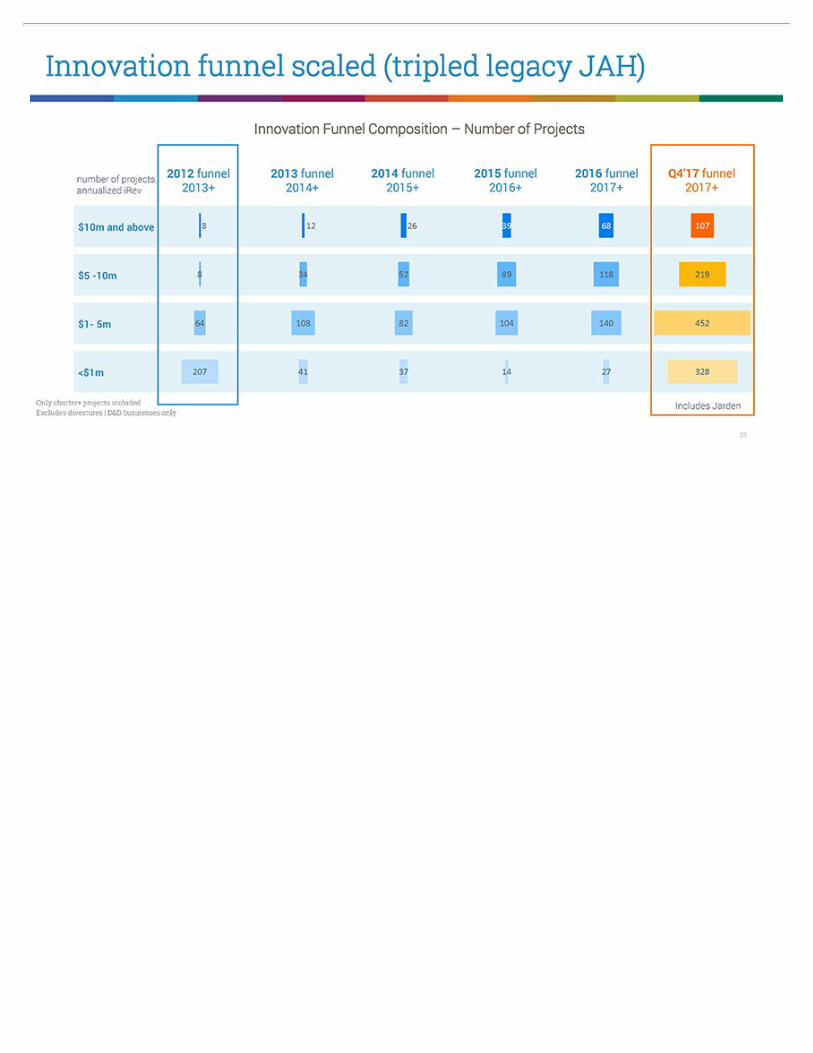
Innovation funnel scaled (tripled legacy JAH) Innovation Funnel Composition – Number of Projects Only charter+ projects included Excludes divestures | D&D businesses only
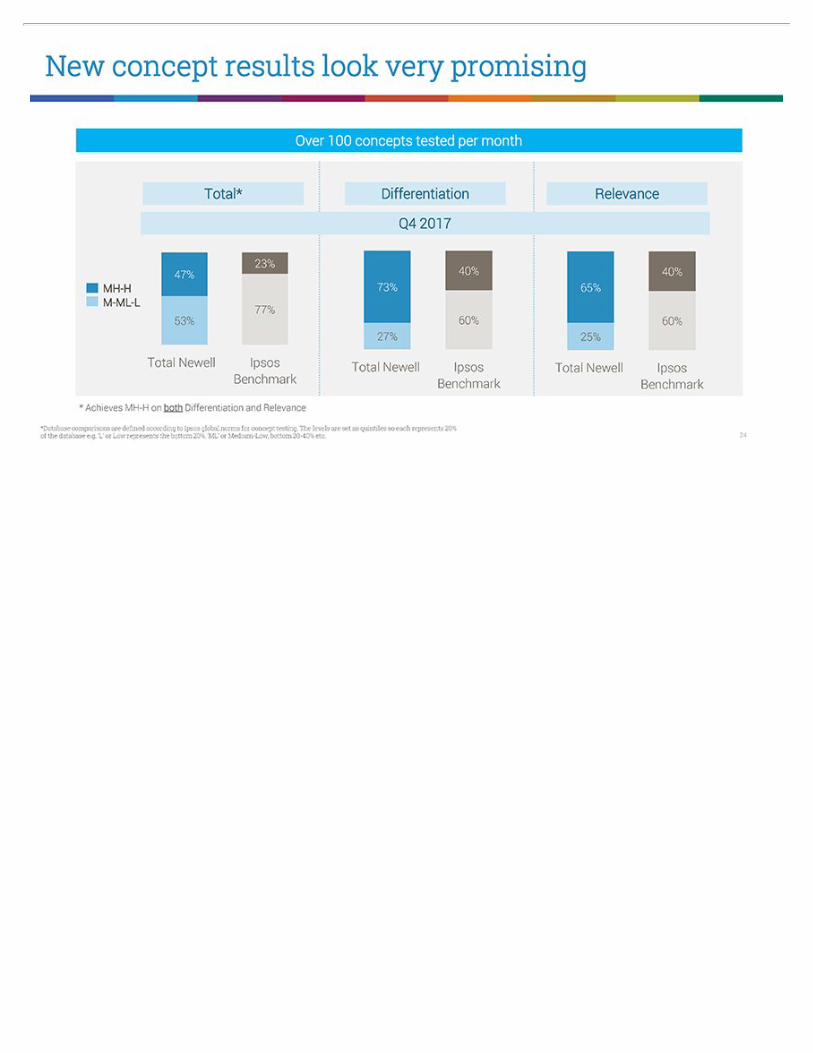
New concept results look very promising Over 100 concepts tested per month Total* Differentiation Relevance Q4 2017 * Achieves MH-H on both Differentiation and Relevance *Database comparisons are defined according to Ipsos global norms for concept testing. The levels are set as quintiles so each represents 20% of the database e.g. ‘L’ or Low represents the bottom 20%, ‘ML’ or Medium-Low, bottom 20-40% etc.

Coleman® Dark Room™ Tents Blocks 90% of sunlight, reducing the heat within the tent. Sleep in after the sun rises or put the kids to bed early while the sun is still up.

Graco® UNO2DUO™ Travel System A single stroller that extends 5 inches into a double stroller for two children as families grow from one to two, giving parents and children 18 customizable ways to ride.

Marmot® Featherless With warmth equal to 700 fill power down, Featherless’ synthetic insulation is ultralight, packable and stays warm when wet, so adventure-minded athletes will never think twice about the weather.

Candle Power Pop-Up Shop An experiential boutique featuring Yankee Candle®, WoodWick® and Chesapeake Bay Candle® complete with immersive, multi-sensory installations, personalized candles, a scent test bar, craftsmanship area and gift bar.

First Alert® Onelink Safe & Sound Combines intelligent protection from smoke, fire and carbon monoxide with superior audio capabilities, compatibility with connected home platforms, premium home speakers and hands-free voice commands.

Crock-Pot® Express Crock Multi-Cooker 8-in-1 Multi-Cooker that can cook meals up to 70% faster than traditional cooking, while also offering the versatility of slow cooking, steaming and sautéing.

Calphalon Premier™ Space Saving Cookware Securely stacks to save 30% more space*. The unique design allows for the cookware to stack and nest in any order**, saving space and helping to organize the kitchen cupboard. *Average space saved vs. like non-stacking Calphalon® cookware items when stacked with like diameter Premier Space Saving items **Cookware must have same diameter

2H 2018 – Calphalon Appliances
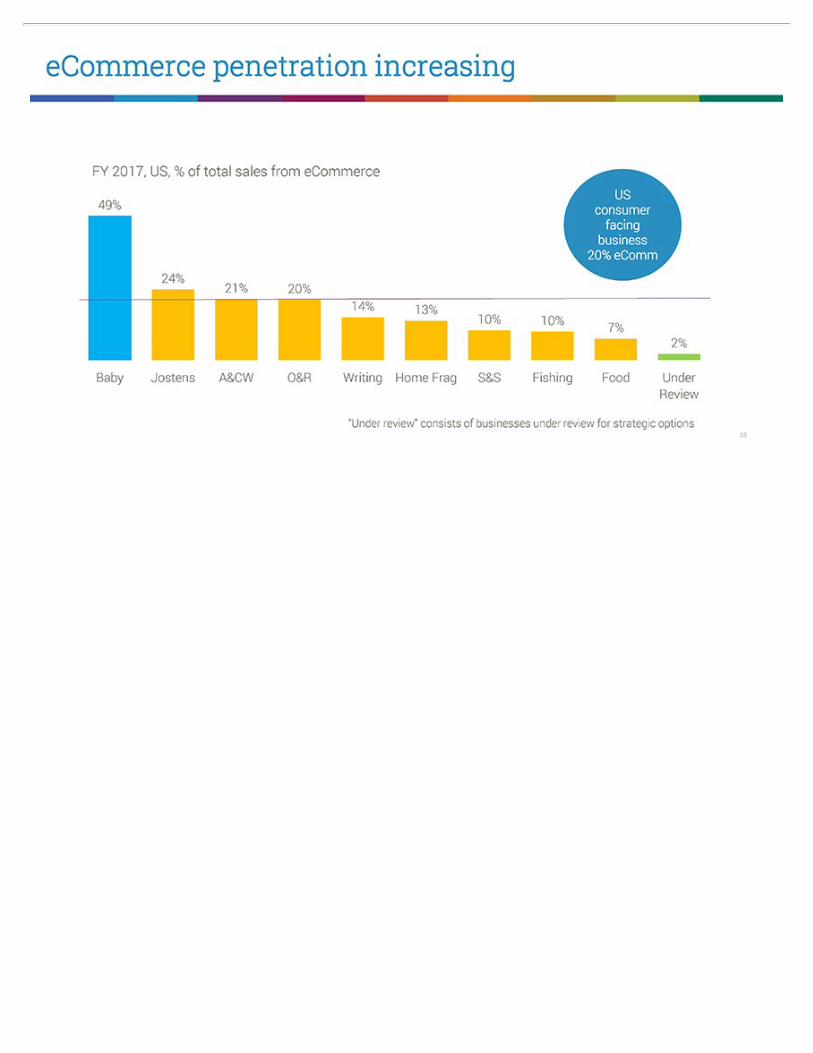
eCommerce penetration increasing FY 2017, US, % of total sales from eCommerce US consumer facing business 20% eComm “Under review” consists of businesses under review for strategic options
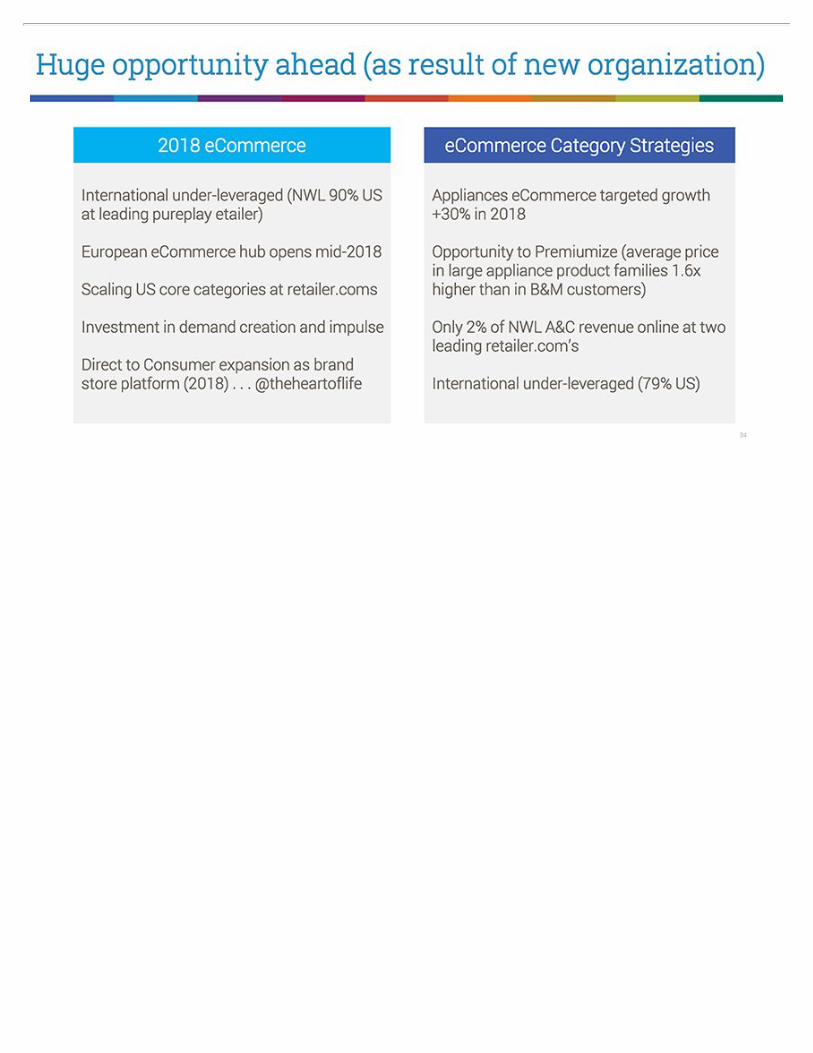
Huge opportunity ahead (as result of new organization) 2018 eCommerce International under-leveraged (NWL 90% US at leading pureplay etailer) European eCommerce hub opens mid-2018 Scaling US core categories at retailer.coms Investment in demand creation and impulse Direct to Consumer expansion as brand store platform (2018) . . . @theheartoflife eCommerce Category Strategies Appliances eCommerce targeted growth +30% in 2018 Opportunity to Premiumize (average price in large appliance product families 1.6x higher than in B&M customers) Only 2% of NWL A&C revenue online at two leading retailer.com’s International under-leveraged (79% US)

New Brand Direct-to- Consumer Brand Store @theheartoflife brand store to launch in the fourth quarter of 2018 leveraging common infrastructure and integrated learning out of eCommerce DTC team.
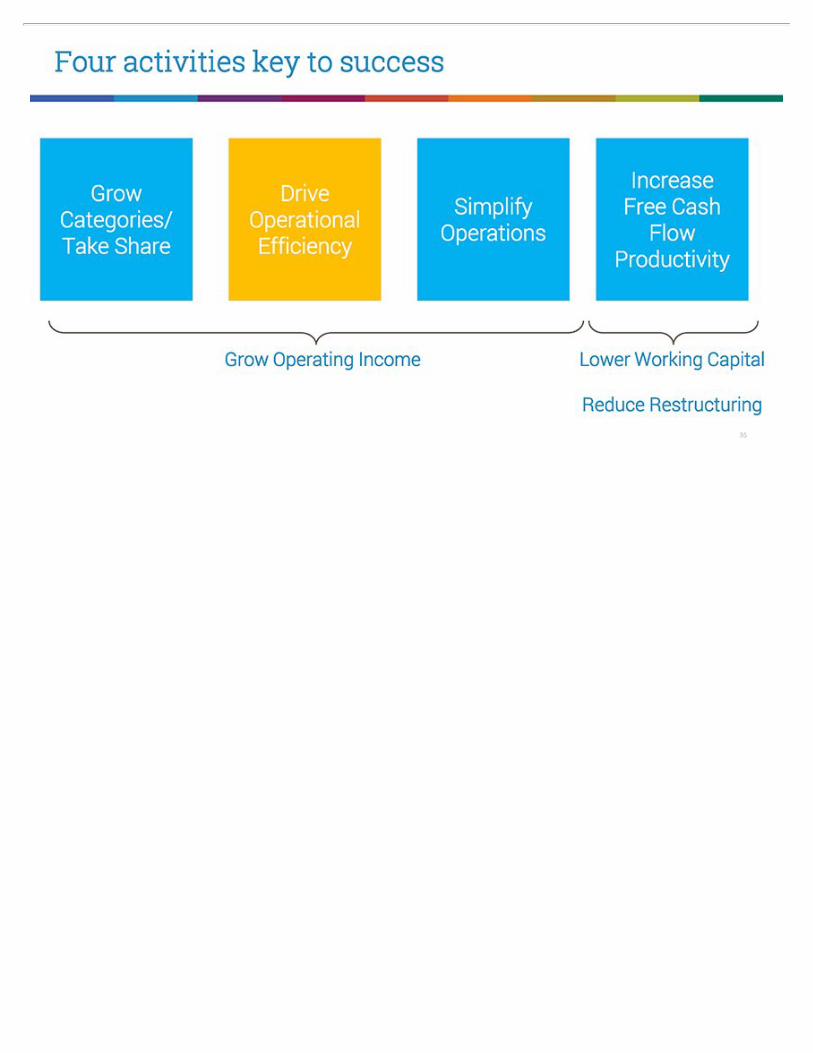
Four activities key to success Grow Categories/ Take Share Drive Operational Efficiency Simplify Operations Increase Free Cash Flow Productivity Grow Operating Income Lower Working Capital Reduce Restructuring
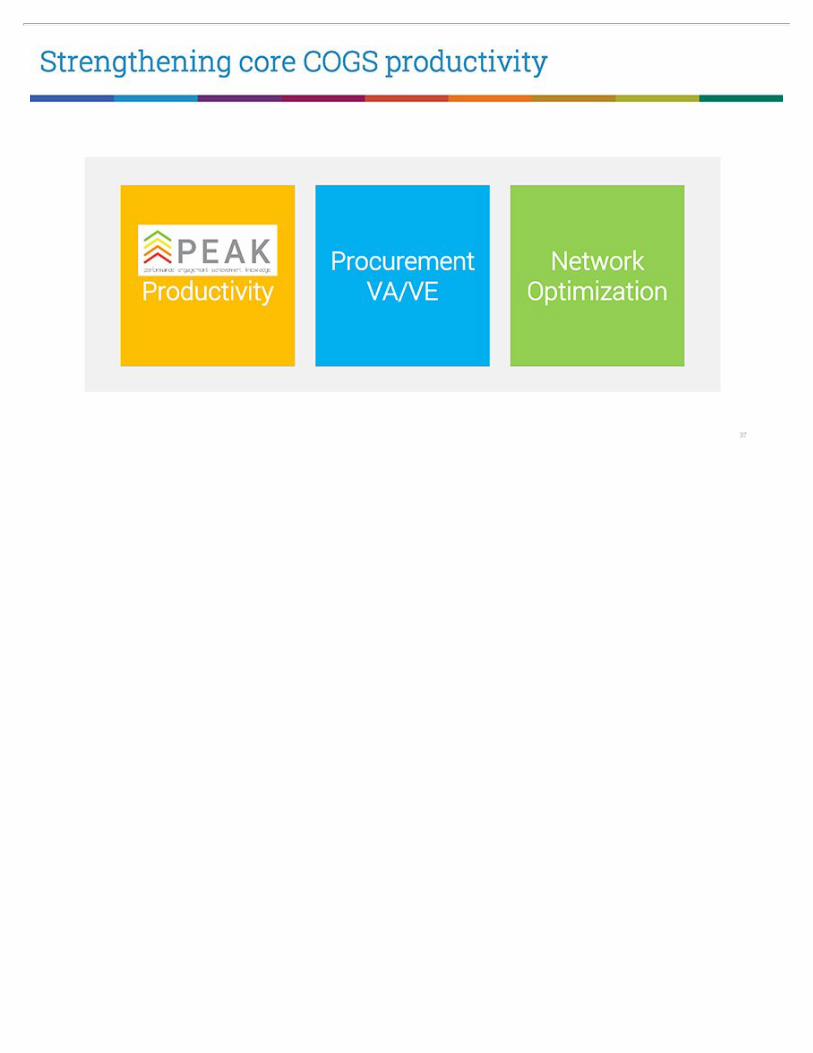
Strengthening core COGS productivity Productivity Procurement VA/VE Network Optimization
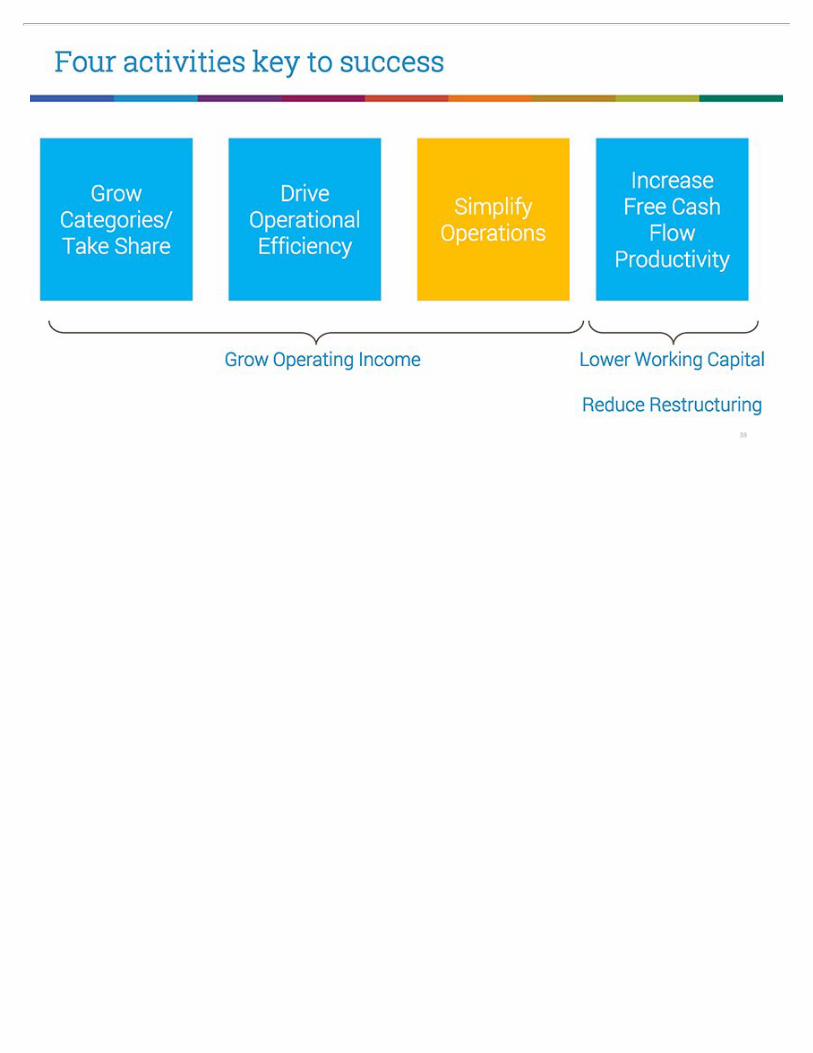
Four activities key to success Grow Categories/ Take Share Drive Operational Efficiency Simplify Operations Increase Free Cash Flow Productivity Grow Operating Income Lower Working Capital Reduce Restructuring
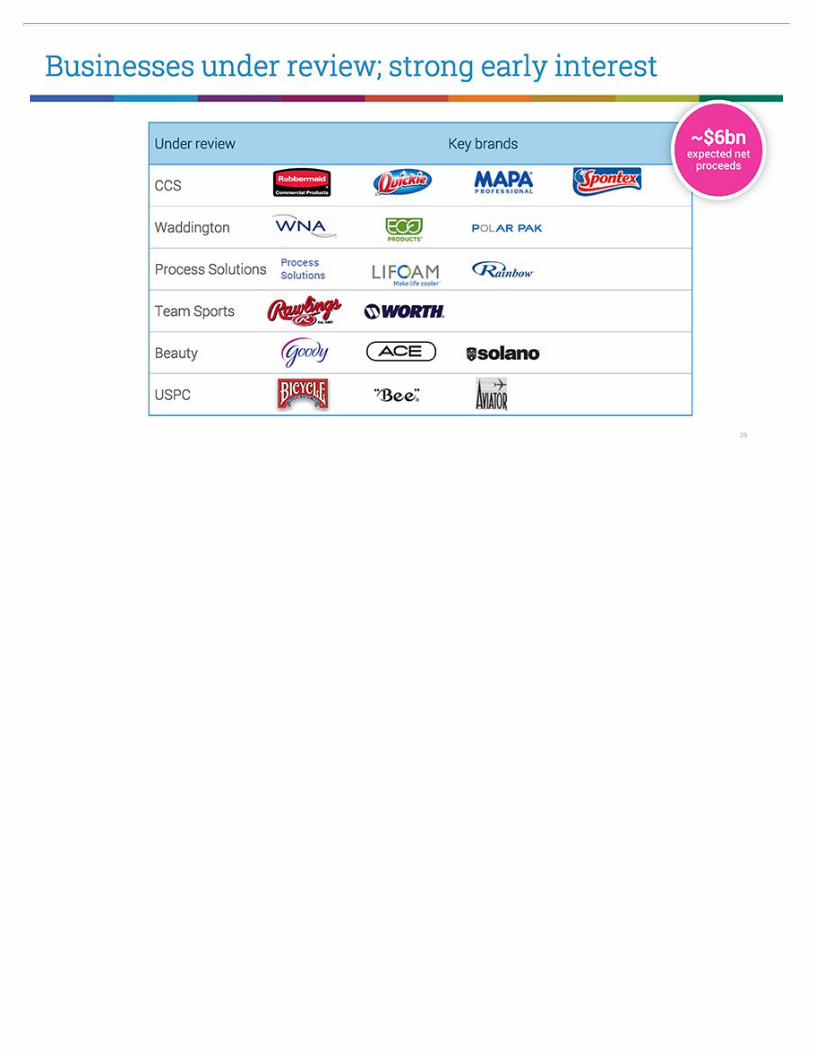
Under review Key brands CCS Waddington Process Solutions Team Sports Beauty USPC
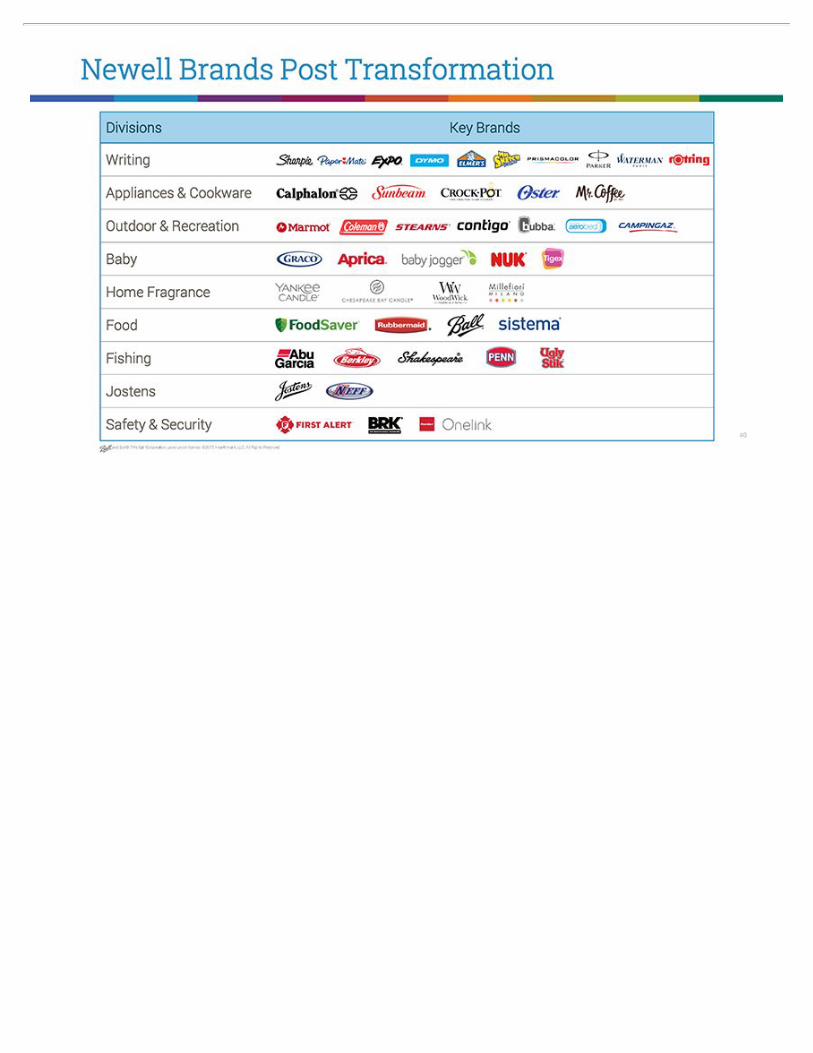
Newell Brands Post Transformation Divisions Key Brands Writing Appliances & Cookware Outdoor & Recreation Baby Home Fragrance Food Fishing Jostens Safety & Security and Ball® TMs Ball Corporation, used under license. ©2015 Hearthmark, LLC. All Rights Reserved.
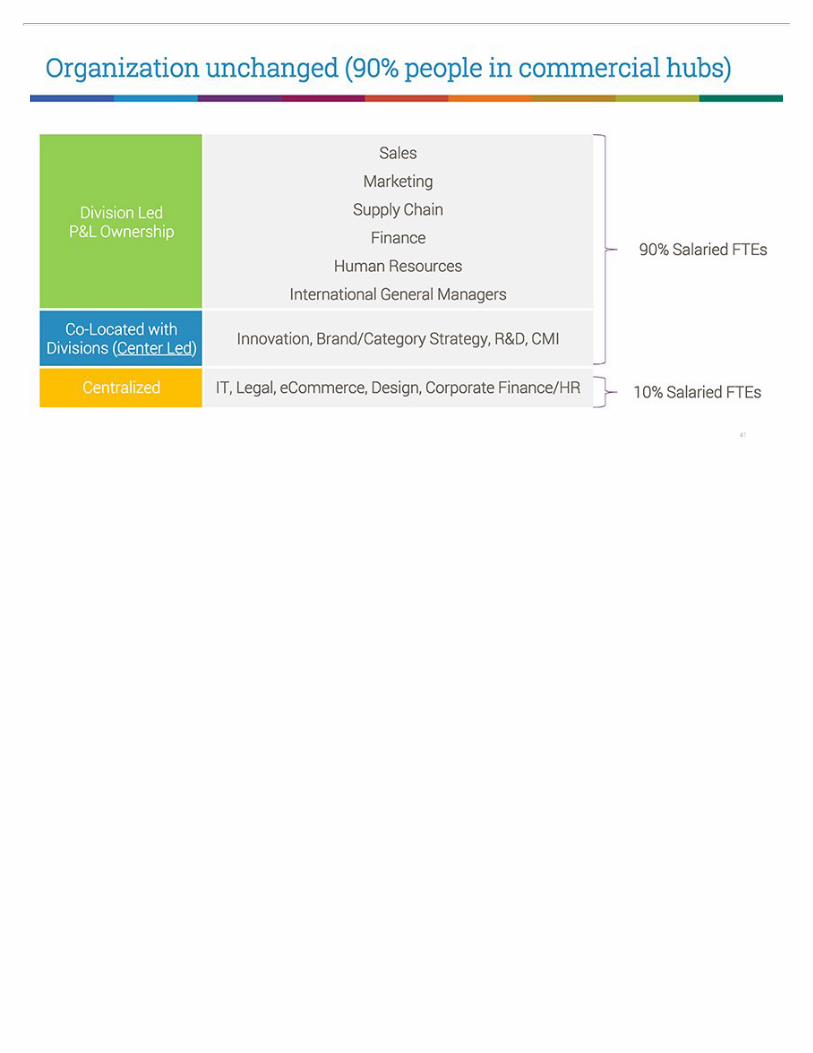
Organization unchanged (90% people in commercial hubs) Division Led P&L Ownership Co-Located with Divisions (Center Led) Centralized Sales Marketing Supply Chain Finance Human Resources International General Managers Innovation, Brand/Category Strategy, R&D, CMI IT, Legal, eCommerce, Design, Corporate Finance/HR 90% Salaried FTEs 10% Salaried FTEs
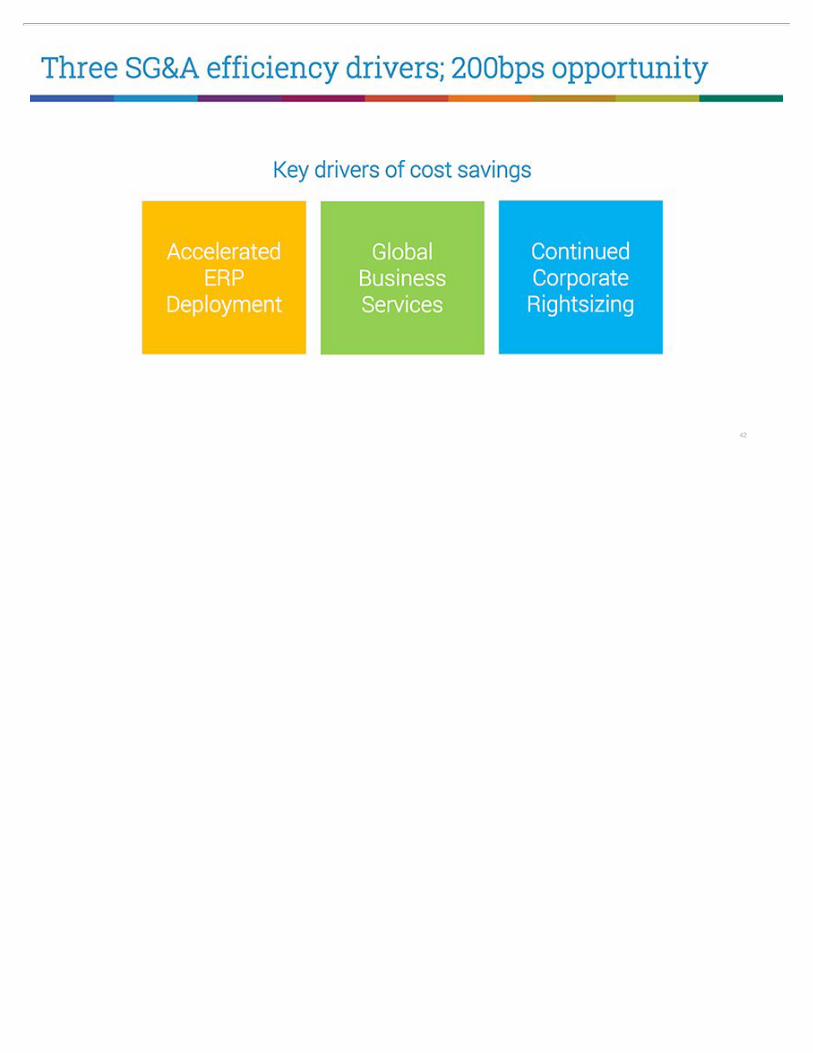
Three SG&A efficiency drivers; 200bps opportunity Key drivers of cost savings Accelerated ERP Deployment Global Business Services Continued Corporate Rightsizing
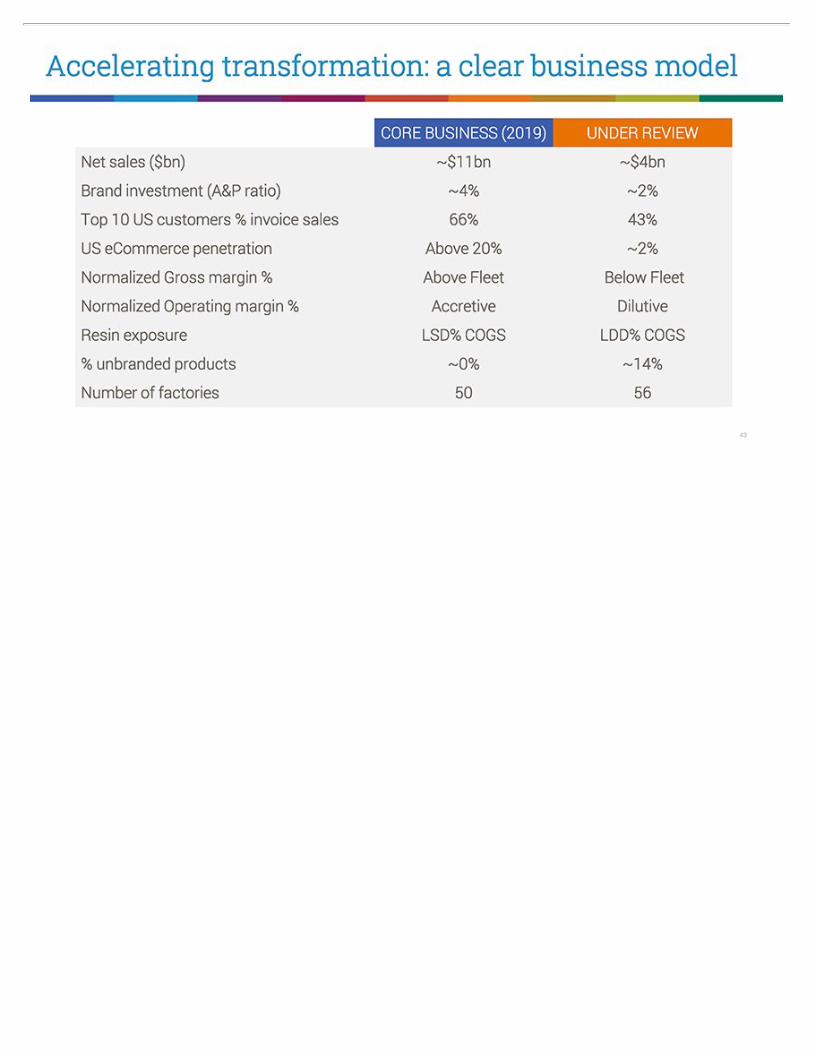
Accelerating transformation: a clear business model CORE BUSINESS (2019) UNDER REVIEW Net sales ($bn) ~$11bn ~$4bn Brand investment (A&P ratio) ~4% ~2% Top 10 US customers % invoice sales 66% 43% US eCommerce penetration Above 20% ~2% Normalized Gross margin % Above Fleet Below Fleet Normalized Operating margin % Accretive Dilutive Resin exposure LSD% COGS LDD% COGS % unbranded products ~0% ~14% Number of factories 50 56
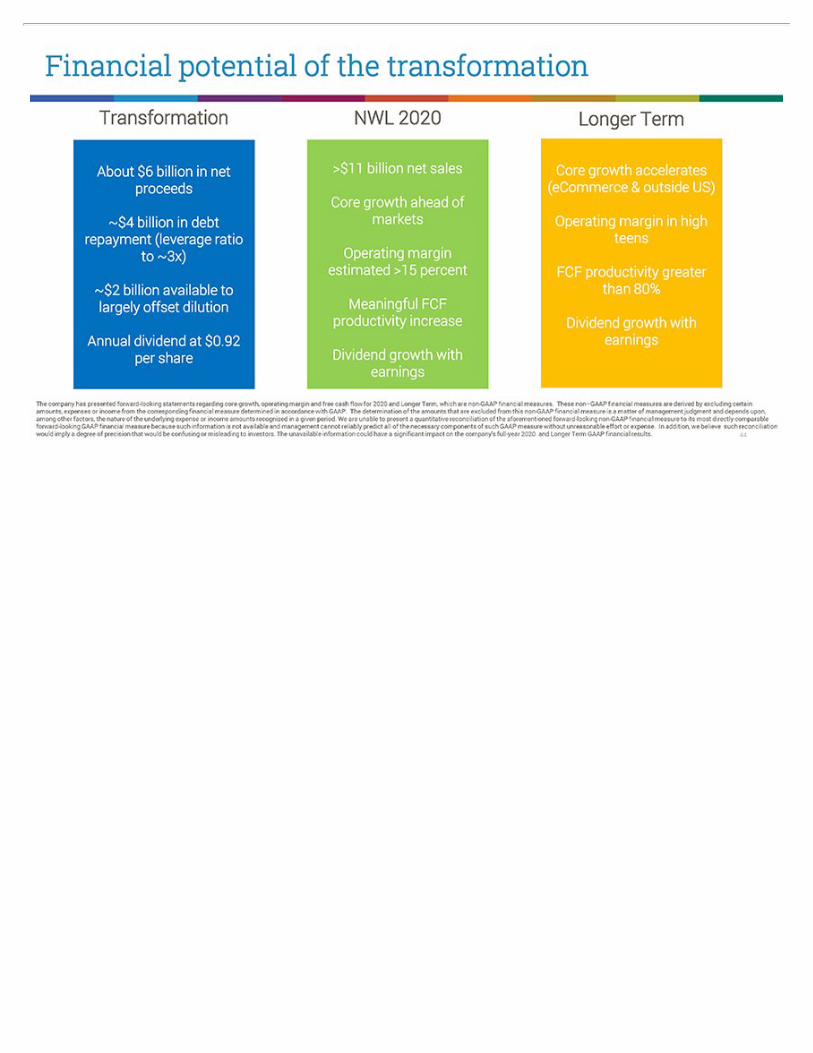
Financial potential of the transformation Transformation About $6 billion in net proceeds ~$4 billion in debt repayment (leverage ratio to ~3x) ~$2 billion available to largely offset dilution Annual dividend at $0.92 per share NWL 2020 >$11 billion net sales Core growth ahead of markets Operating margin estimated >15 percent Meaningful FCF productivity increase Dividend growth with earnings Longer Term Core growth accelerates (eCommerce & outside US) Operating margin in high teens FCF productivity greater than 80% Dividend growth with earnings The company has presented forward-looking statements regarding core growth, operating margin and free cash flow for 2020 and Longer Term, which are non-GAAP financial measures. These non–GAAP financial measures are derived by excluding certain amounts, expenses or income from the corresponding financial measure determined in accordance with GAAP. The determination of the amounts that are excluded from this non-GAAP financial measure is a matter of management judgment and depends upon, among other factors, the nature of the underlying expense or income amounts recognized in a given period. We are unable to present a quantitative reconciliation of the aforementioned forward-looking non-GAAP financial measure to its most directly comparable forward-looking GAAP financial measure because such information is not available and management cannot reliably predict all of the necessary components of such GAAP measure without unreasonable effort or expense. In addition, we believe such reconciliation would imply a degree of precision that would be confusing or misleading to investors. The unavailable information could have a significant impact on the company’s full-year 2020 and Longer Term GAAP financial results.
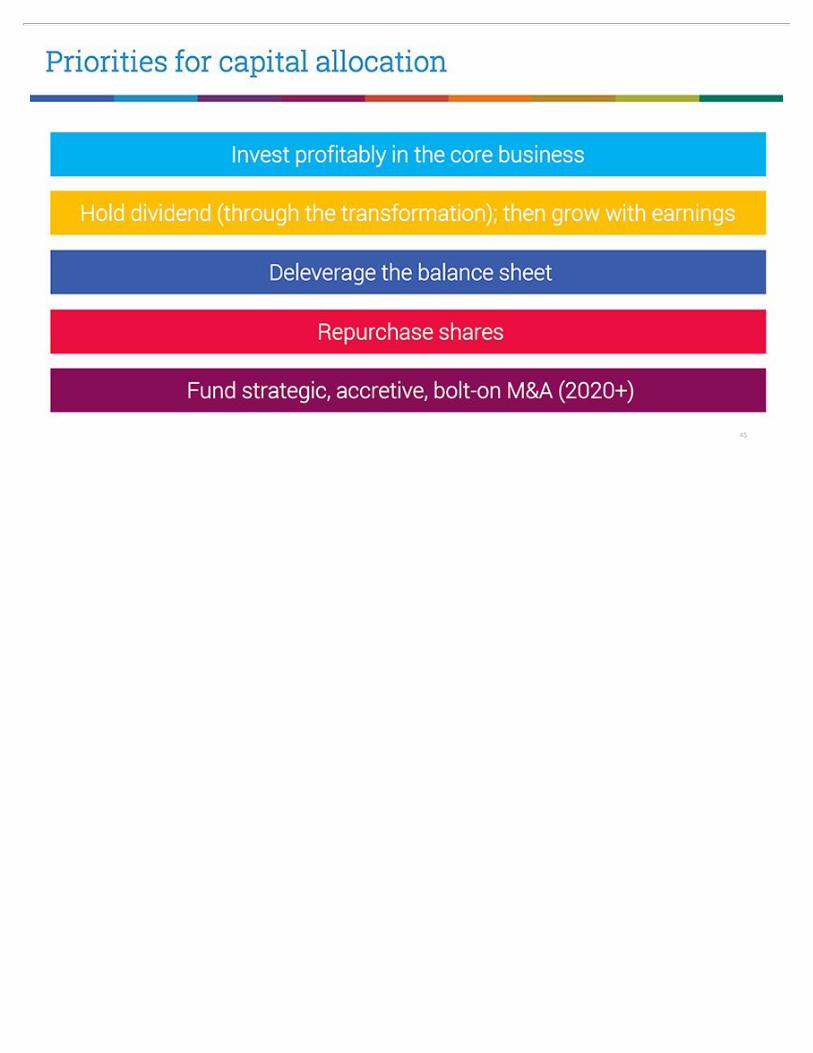
Priorities for capital allocation Invest profitably in the core business Hold dividend (through the transformation); then grow with earnings Deleverage the balance sheet Repurchase shares Fund strategic, accretive, bolt-on M&A (2020+)
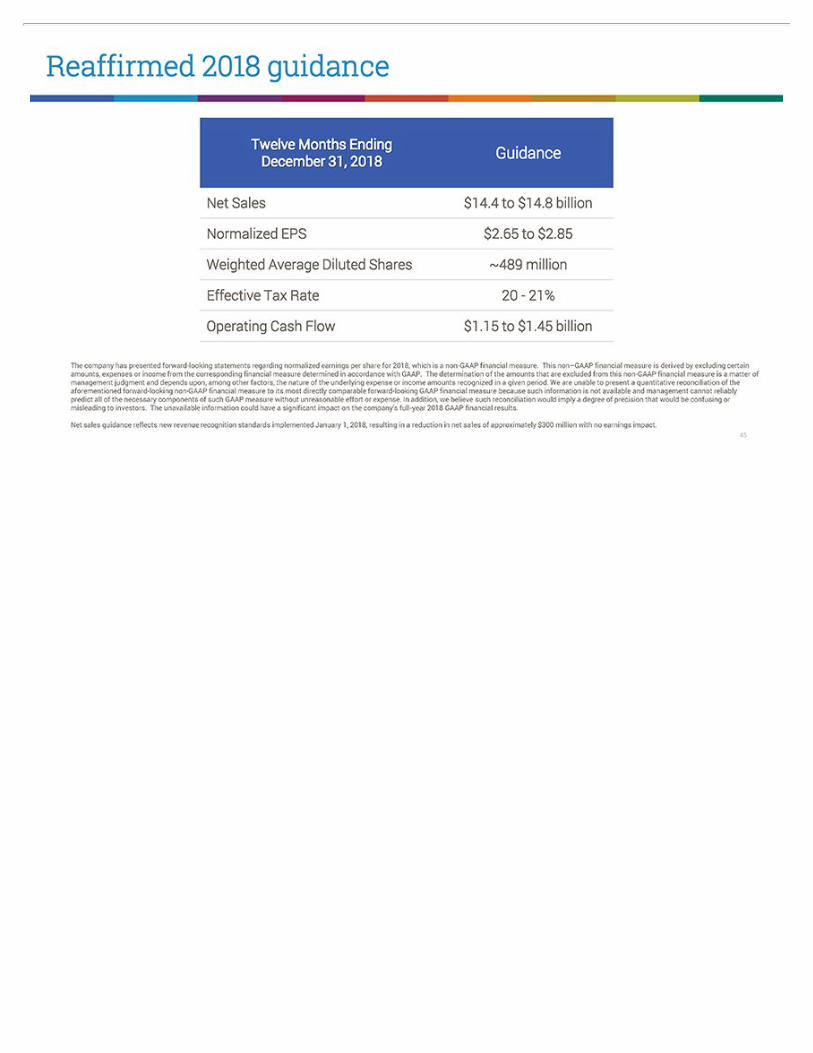
Reaffirmed 2018 guidance Net Sales $14.4 to $14.8 billion Normalized EPS $2.65 to $2.85 Weighted Average Diluted Shares ~489 million Effective Tax Rate 20 - 21% Operating Cash Flow $1.15 to $1.45 billion The company has presented forward-looking statements regarding normalized earnings per share for 2018, which is a non-GAAP financial measure. This non–GAAP financial measure is derived by excluding certain amounts, expenses or income from the corresponding financial measure determined in accordance with GAAP. The determination of the amounts that are excluded from this non-GAAP financial measure is a matter of management judgment and depends upon, among other factors, the nature of the underlying expense or income amounts recognized in a given period. We are unable to present a quantitative reconciliation of the aforementioned forward-looking non-GAAP financial measure to its most directly comparable forward-looking GAAP financial measure because such information is not available and management cannot reliably predict all of the necessary components of such GAAP measure without unreasonable effort or expense. In addition, we believe such reconciliation would imply a degree of precision that would be confusing or misleading to investors. The unavailable information could have a significant impact on the company’s full-year 2018 GAAP financial results. Net sales guidance reflects new revenue recognition standards implemented January 1, 2018, resulting in a reduction in net sales of approximately $300 million with no earnings impact.
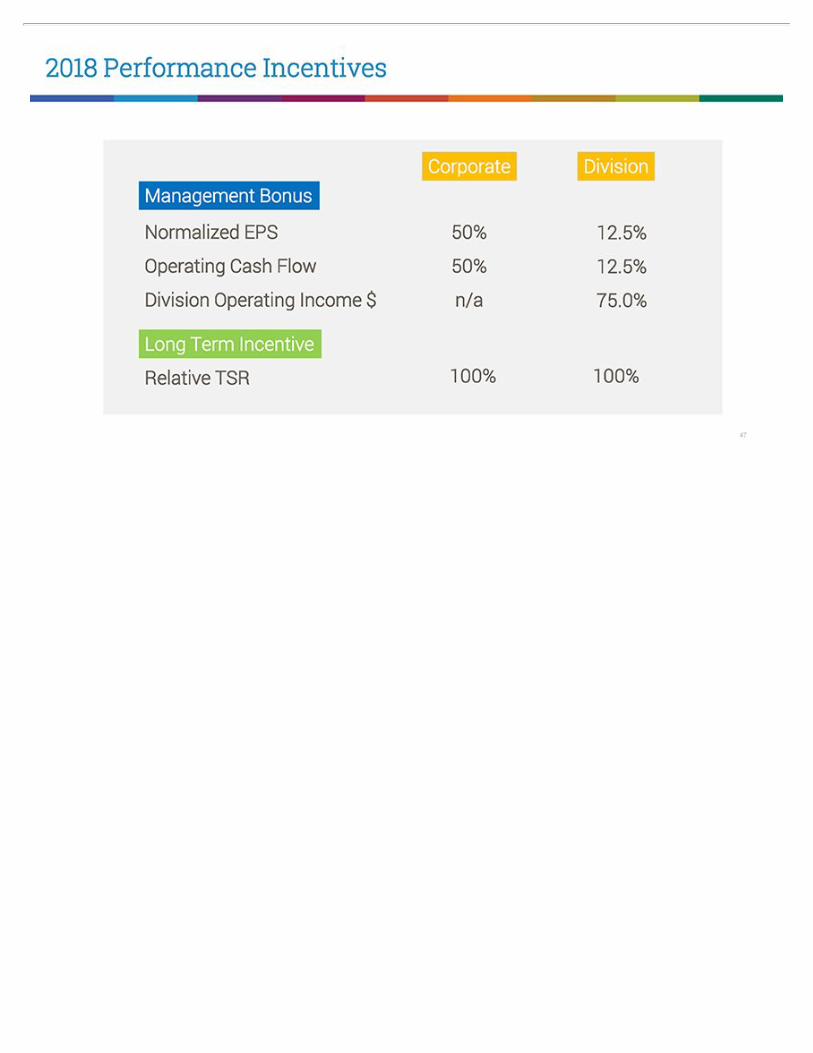
2018 Performance Incentives Corporate Division Management Bonus Normalized EPS 50% 12.5% Operating Cash Flow 50% 12.5% Division Operating Income $ n/a 75.0% Long Term Incentive Relative TSR 100% 100%

Strengthening the Board with experienced operators Jim Craigie Non-exec Chairman Church & Dwight Former Chairman & CEO CHD Debra Crew Former President & CEO Reynolds American Judy Sprieser Former President & CEO Transora.com
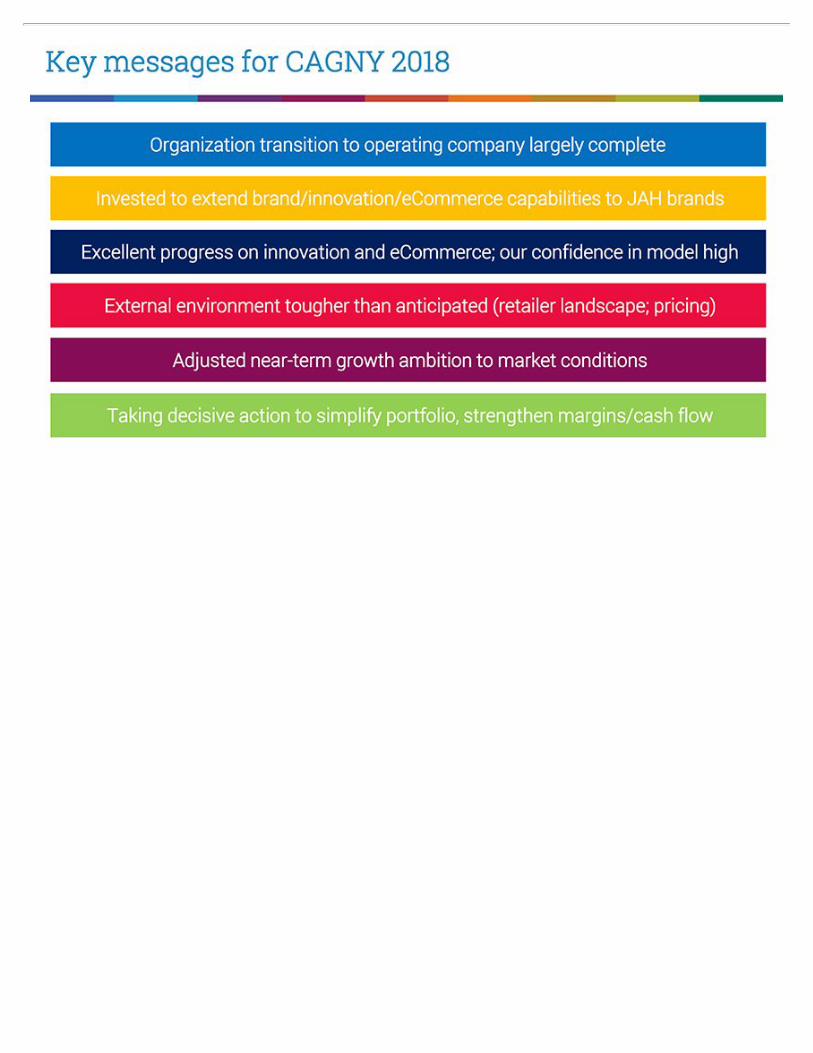
Key messages for CAGNY 2018 Organization transition to operating company largely complete Invested to extend brand/innovation/eCommerce capabilities to JAH brands Excellent progress on innovation and eCommerce; our confidence in model high External environment tougher than anticipated (retailer landscape; pricing) Adjusted near-term growth ambition to market conditions Taking decisive action to simplify portfolio, strengthen margins/cash flow
Consumer Analyst Group of New York Michael B. Polk - Chief Executive Officer February 22, 2018 live. learn. work. play.
Appendix: Non-GAAP Reconciliations
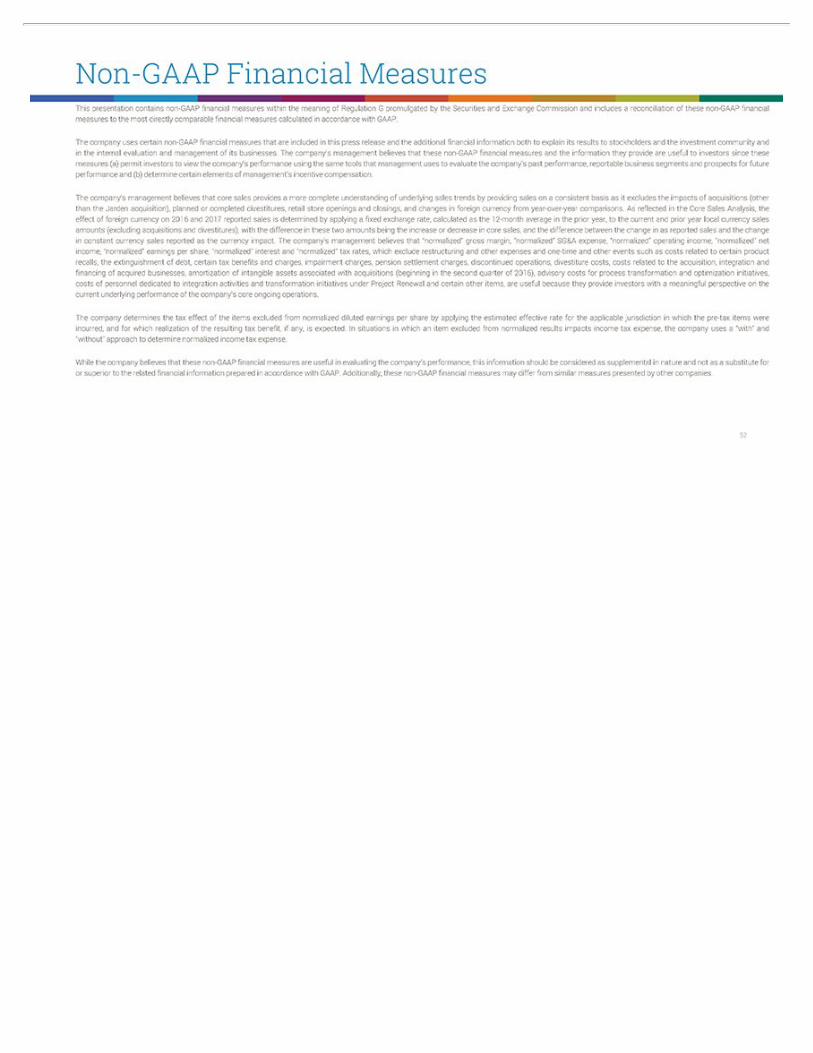
Non-GAAP Financial Measures This presentation contains non-GAAP financial measures within the meaning of Regulation G promulgated by the Securities and Exchange Commission and includes a reconciliation of these non-GAAP financial measures to the most directly comparable financial measures calculated in accordance with GAAP. The company uses certain non-GAAP financial measures that are included in this press release and the additional financial information both to explain its results to stockholders and the investment community and in the internal evaluation and management of its businesses. The company’s management believes that these non-GAAP financial measures and the information they provide are useful to investors since these measures (a) permit investors to view the company’s performance using the same tools that management uses to evaluate the company’s past performance, reportable business segments and prospects for future performance and (b) determine certain elements of management’s incentive compensation. The company’s management believes that core sales provides a more complete understanding of underlying sales trends by providing sales on a consistent basis as it excludes the impacts of acquisitions (other than the Jarden acquisition), planned or completed divestitures, retail store openings and closings, and changes in foreign currency from year-over-year comparisons. As reflected in the Core Sales Analysis, the effect of foreign currency on 2016 and 2017 reported sales is determined by applying a fixed exchange rate, calculated as the 12-month average in the prior year, to the current and prior year local currency sales amounts (excluding acquisitions and divestitures), with the difference in these two amounts being the increase or decrease in core sales, and the difference between the change in as reported sales and the change in constant currency sales reported as the currency impact. The company’s management believes that “normalized” gross margin, “normalized” SG&A expense, “normalized” operating income, “normalized” net income, “normalized” earnings per share, “normalized” interest and“normalized” tax rates, which exclude restructuring and other expenses and one-time and other events such as costs related to certain product recalls, the extinguishment of debt, certain tax benefits and charges, impairment charges, pension settlement charges, discontinued operations, divestiture costs, costs related to the acquisition, integration and financing of acquired businesses, amortization of intangible assets associated with acquisitions (beginning in the second quarter of 2016), advisory costs for process transformation and optimization initiatives, costs of personnel dedicated to integration activities and transformation initiatives under Project Renewal and certain other items, are useful because they provide investors with a meaningful perspective on the current underlying performance of the company’s core ongoing operations. The company determines the tax effect of the items excluded from normalized diluted earnings per share by applying the estimated effective rate for the applicable jurisdiction in which the pre-tax items were incurred, and for which realization of the resulting tax benefit, if any, is expected. In situations in which an item excluded from normalized results impacts income tax expense, the company uses a “with” and “without” approach to determine normalized income tax expense. While the company believes that these non-GAAP financial measures are useful in evaluating the company’s performance, this information should be considered as supplemental in nature and not as a substitute for or superior to the related financial information prepared in accordance with GAAP. Additionally, these non-GAAP financial measures may differ from similar measures presented by other companies.
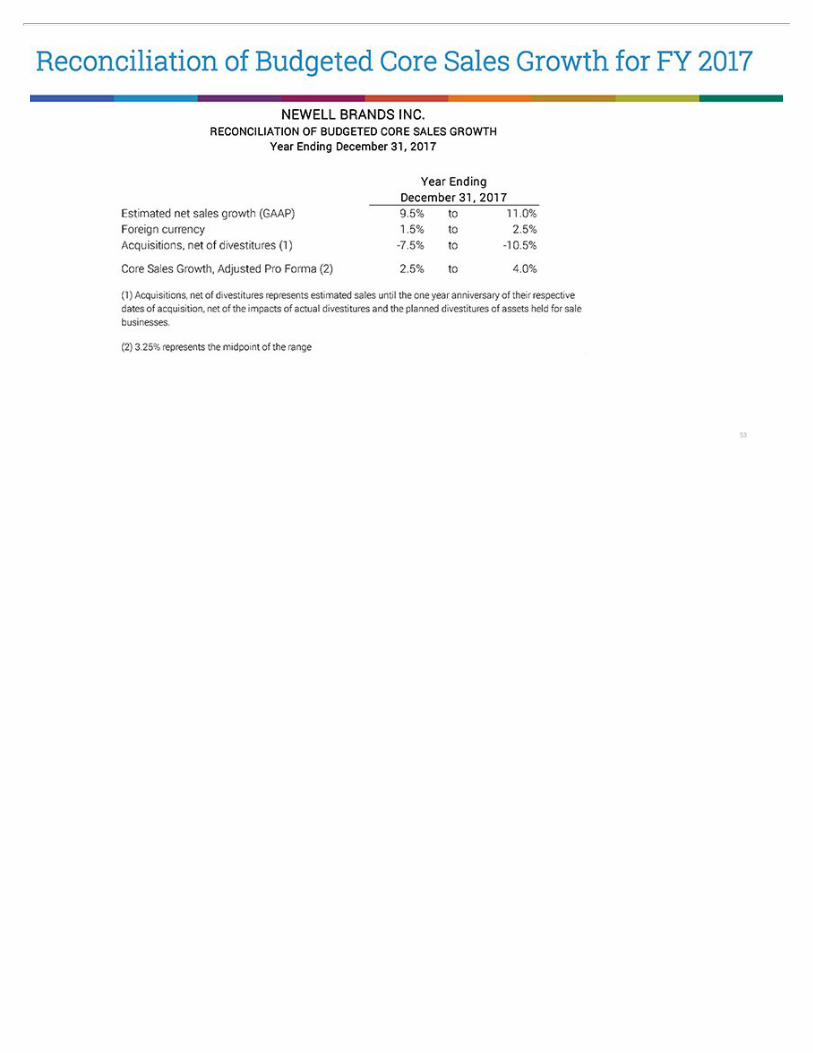
Reconciliation of Budgeted Core Sales Growth for FY 2017 NEWELL BRANDS INC. RECONCILIATION OF BUDGETED CORE SALES GROWTH Year Ending December 31, 2017 Year Ending December 31, 2017 Estimated net sales growth (GAAP) 9.5% to 11.0% Foreign currency 1.5% to 2.5% Acquisitions, net of divestitures (1) -7.5% to -10.5% Core Sales Growth, Adjusted Pro Forma (2) 2.5% to 4.0% (1) Acquisitions, net of divestitures represents estimated sales until the one year anniversary of their respective dates of acquisition, net of the impacts of actual divestitures and the planned divestitures of assets held for sale businesses. (2) 3.25% represents the midpoint of the range
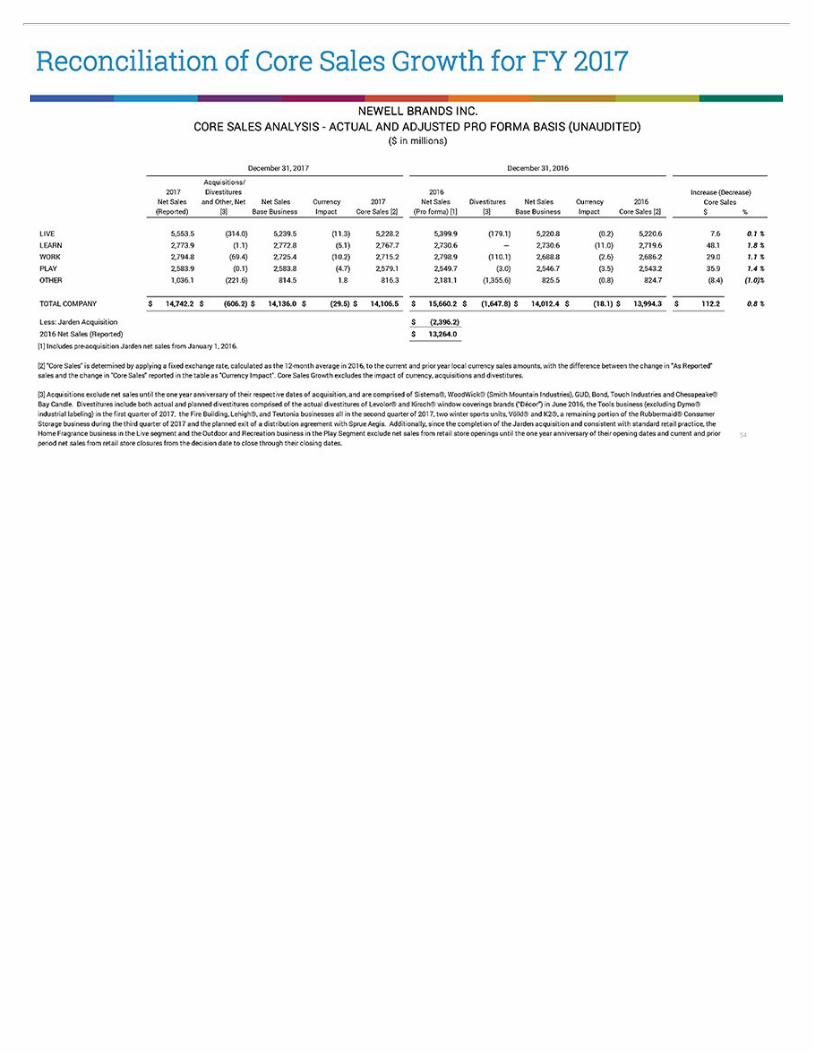
Reconciliation of Core Sales Growth for FY 2017 NEWELL BRANDS INC. CORE SALES ANALYSIS - ACTUAL AND ADJUSTED PRO FORMA BASIS (UNAUDITED) ($ in millions) December 31, 2017 December 31, 2016 Acquisitions/ 2017 Divestitures 2016 Increase (Decrease) Net Sales and Other, Net Net Sales Currency 2017 Net Sales Divestitures Net Sales Currency 2016 Core Sales (Reported) [3] Base Business Impact Core Sales [2] (Pro forma) [1] [3] Base Business Impact Core Sales [2] $ % LIVE 5,553.5 (314.0) 5,239.5 (11.3) 5,228.2 5,399.9 (179.1) 5,220.8 (0.2) 5,220.6 7.6 0.1 % LEARN 2,773.9 (1.1) 2,772.8 (5.1) 2,767.7 2,730.6 ? 2,730.6 (11.0) 2,719.6 48.1 1.8 % WORK 2,794.8 (69.4) 2,725.4 (10.2) 2,715.2 2,798.9 (110.1) 2,688.8 (2.6) 2,686.2 29.0 1.1 % PLAY 2,583.9 (0.1) 2,583.8 (4.7) 2,579.1 2,549.7 (3.0) 2,546.7 (3.5) 2,543.2 35.9 1.4 % OTHER 1,036.1 (221.6) 814.5 1.8 816.3 2,181.1 (1,355.6) 825.5 (0.8) 824.7 (8.4) (1.0)% TOTAL COMPANY $ 14,742.2 $ (606.2) $ 14,136.0 $ (29.5) $ 14,106.5 $ 15,660.2 $ (1,647.8) $ 14,012.4 $ (18.1) $ 13,994.3 $ 112.2 0.8 % Less: Jarden Acquisition $ (2,396.2) 2016 Net Sales (Reported) $ 13,264.0 [1] Includes pre-acquisition Jarden net sales from January 1, 2016. [2] “Core Sales” is determined by applying a fixed exchange rate, calculated as the 12-month average in 2016, to the current and prior year local currency sales amounts, with the difference between the change in “As Reported” sales and the change in “Core Sales” reported in the table as “Currency Impact”. Core Sales Growth excludes the impact of currency, acquisitions and divestitures. [3] Acquisitions exclude net sales until the one year anniversary of their respective dates of acquisition, and are comprised of Sistema®, WoodWick® (Smith Mountain Industries), GUD, Bond, Touch Industries and Chesapeake® Bay Candle. Divestitures include both actual and planned divestitures comprised of the actual divestitures of Levolor® and Kirsch® window coverings brands (“Décor”) in June 2016, the Tools business (excluding Dymo® industrial labeling) in the first quarter of 2017, the FireBuilding, Lehigh®, and Teutonia businesses all in the second quarter of 2017, two winter sports units, Völkl® and K2®, a remaining portion of the Rubbermaid® Consumer Storage business during the third quarter of 2017 and the planned exit of a distribution agreement with Sprue Aegis. Additionally, since the completion of the Jarden acquisition and consistent with standard retail practice, the Home Fragrance business in the Live segment and the Outdoor and Recreation business in the Play Segment exclude net sales from retail store openings until the one year anniversary of their opening dates and current and prior period net sales from retail store closures from the decision date to close through their closing dates.
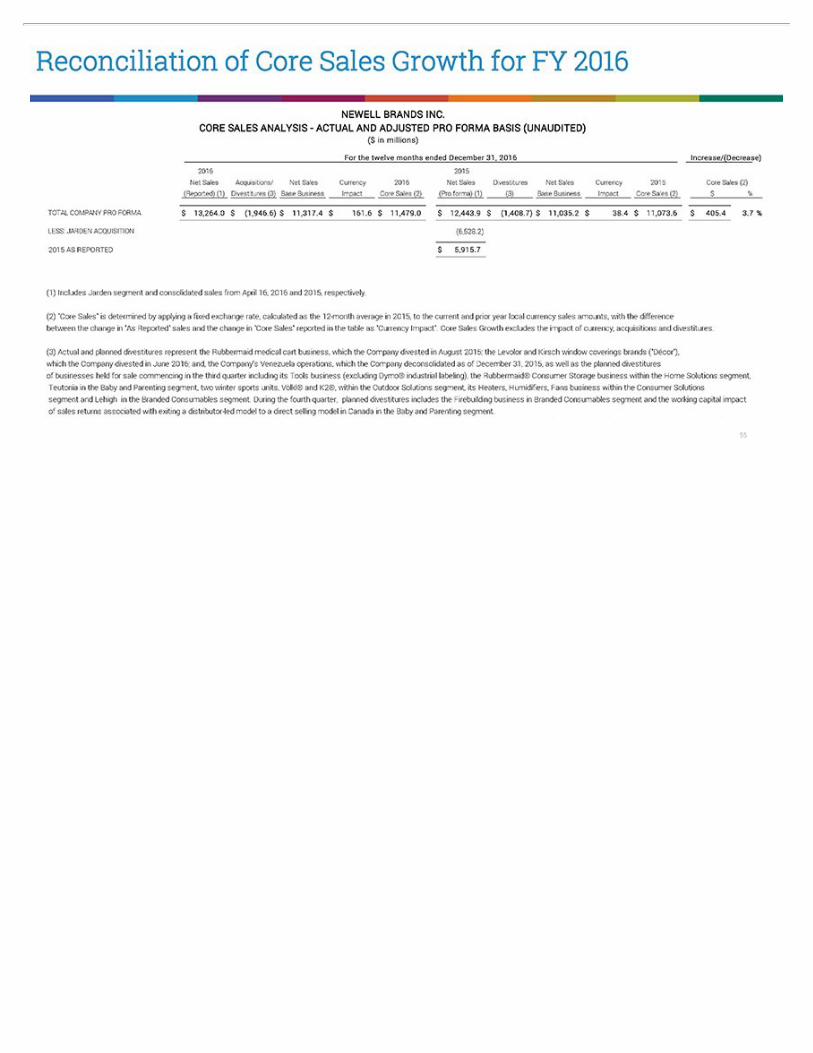
Reconciliation of Core Sales Growth for FY 2016 NEWELL BRANDS INC. CORE SALES ANALYSIS - ACTUAL AND ADJUSTED PRO FORMA BASIS (UNAUDITED) ($ in millions) For the twelve months ended December 31, 2016 Increase/(Decrease) 2016 2015 Net Sales Acquisitions/ Net Sales Currency 2016 Net Sales Divestitures Net Sales Currency 2015 Core Sales (2) (Reported) (1) Divestitures (3) Base Business Impact Core Sales (2) (Pro forma) (1) (3) Base Business Impact Core Sales (2) $ % TOTAL COMPANY PRO FORMA $ 13,264 . 0 $ (1,946 . 6) $ 11,317 . 4 $ 161 . 6 $ 11,479 . 0 $ 12,443 . 9 $ (1,408 . 7) $ 11,035 . 2 $ 38 . 4 $ 11,073 . 6 $ 405 . 4 3 . 7 % LESS: JARDEN ACQUISITION (6,528.2) 2015 AS REPORTED $ 5,915 . 7 (1) Includes Jarden segment and consolidated sales from April 16, 2016 and 2015, respectively. (2) “Core Sales” is determined by applying a fixed exchange rate, calculated as the 12-month average in 2015, to the current and prior year local currency sales amounts, with the difference between the change in “As Reported” sales and the change in “Core Sales” reported in the table as “Currency Impact”. Core Sales Growth excludes the impact of currency, acquisitions and divestitures. (3) Actual and planned divestitures represent the Rubbermaid medical cart business, which the Company divested in August 2015; the Levolor and Kirsch window coverings brands (“Décor”), which the Company divested in June 2016; and, the Company’s Venezuela operations, which the Company deconsolidated as of December 31, 2015, as well as the planned divestitures of businesses held for sale commencing in the third quarter including its Tools business (excluding Dymo® industrial labeling), the Rubbermaid® Consumer Storage business within the Home Solutions segment, Teutonia in the Baby and Parenting segment, two winter sports units, Völkl® and K2®, within the Outdoor Solutions segment, its Heaters, Humidifiers, Fans business within the Consumer Solutions segment and Lehigh in the Branded Consumables segment. During the fourth quarter, planned divestitures includes the Firebuildingbusiness in Branded Consumables segment and the working capital impact of sales returns associated with exiting a distributor-led model to a direct selling model in Canada in the Baby and Parenting segment.
Exhibit 2
Michael B. Polk
Chief Executive Officer
February 22, 2018
Colleagues,
Today we announced exciting updates to our Board of Directors with the appointment of James R. Craigie and Debra A. Crew , as independent directors,effective immediately. Additionally, we intend to nominate Judith A. Sprieser to the Board of Directors at our 2018 Shareholder Meeting. You can view the pressrelease here .
• James Craigie is the Non-Executive Chairman and former Chief Executive Officer of Church & Dwight, a developer and marketer of a broad range ofhousehold and personal care consumer products and specialty products. He is a recognized leader in consumer brands with deep brand building experience.Prior to Church & Dwight, Jim was the President and Chief Executive Officer of Spalding Sports and held various senior management positions with KraftFoods for 15 years.
• Debra Crew is the former Chief Executive Officer of Reynolds American and a seasoned packaged goods operating executive, who brings a broad range of
experience in branding, marketing, operations and strategy at some of the world’s leading consumer products companies. Before joining Reynolds, Debraspent five years at Pepsi, where she served in various leadership positions.
• Judith Sprieser is the founder and former Chief Executive Officer of Transora, Inc., and has decades of experience in both financial and operations
management of consumer packaged goods companies. Previously, Judy was an Executive with Sara Lee Corporation from 1987 to 2000, serving as ChiefExecutive Officer of Sara Lee’s Food Group and Chief Financial Officer of Sara Lee Corporation.
With these new directors, Newell Brands is even more strongly positioned to accelerate our transformation plan and evolve our business for the future. In additionto a diversity of perspectives and experiences, these new directors will provide the Board with international operations and financial management experience in ourindustry, knowledge of innovation-planning processes and success in growing global consumer brands across a variety of channels, including e-commerce. We areconfident that we have the right plan—and the right team—to deliver results and enhance value for our shareholders.
Today, I will be speaking at the Consumer Analyst Group of New York’s (CAGNY) 2018 Conference to provide our investment community with a more in-depthunderstanding of the accelerated transformation we announced on January 25. I encourage you to tune in at 1 p.m. ET. The presentation will be webcast live andmay be accessed by selecting Events & Presentations from the Investor Relations tab of the Newell Brands website at www.newellbrands.com . The webcast willalso be archived and available for replay following the live presentation.
I look forward to speaking with you at our Global Meeting, next Tuesday, February 27, at 11 a.m. ET.
Sincerely,
Confidential - Internal Use Only
Additional Information
In connection with Newell Brands’ 2018 Annual Meeting of Shareholders, Newell Brands will file with the U.S. Securities and Exchange Commission (the “SEC”)and mail to the shareholders of record entitled to vote at the 2018 Annual Meeting a definitive proxy statement and other documents, including a WHITE proxycard. SHAREHOLDERS ARE ENCOURAGED TO READ THE PROXY STATEMENT AND ALL OTHER RELEVANT DOCUMENTS WHEN FILED WITHTHE SEC AND WHEN THEY BECOME AVAILABLE BECAUSE THOSE DOCUMENTS WILL CONTAIN IMPORTANT INFORMATION. When filed withthe SEC, the definitive proxy statement and WHITE proxy card will also be mailed to shareholders of record. Investors and other interested parties will be able toobtain the documents free of charge at the SEC’s website, www.sec.gov , or from Newell Brands at its website, www.newellbrands.com , or through a request inwriting sent to Newell Brands at 221 River Street, Hoboken, New Jersey, 07030, Attention: General Counsel.
Participants in Solicitation
The Company and its directors and executive officers may be deemed to be participants in the solicitation of proxies in connection with the 2018 Annual Meeting.Certain information concerning certain of these participants is set forth in the Company’s definitive proxy statement, dated March 30, 2017, for its 2017 annualmeeting of shareholders as filed with the SEC on Schedule 14A and the Company’s Current Reports, dated August 24, 2017, January 21, 2018 and February 16,2018, as filed with the SEC on Form 8-K. Additional information regarding the interests of these participants in the solicitation of proxies in respect of the 2018Annual Meeting and other relevant materials will be filed with the SEC when they become available.
Caution Concerning Forward-Looking Statements
Statements in this email, other than those of historical fact, particularly those anticipating future financial performance, business prospects, growth, operatingstrategies and similar matters, are forward-looking statements within the meaning of the U.S. Private Securities Litigation Reform Act of 1995 and other federalsecurities laws. These statements generally can be identified by the use of words such as “intend,” “anticipate,” “believe,” “estimate,” “project,” “target,” “plan,”“expect,” “will,” “should,” “would” or similar statements. The Company cautions that forward-looking statements are not guarantees because there are inherentdifficulties in predicting future results. In addition, there are no assurances that the Company will complete any or all of the potential transactions, and otherinitiatives referenced in this release. Actual results may differ materially from those expressed or implied in the forward-looking statements. Important factors thatcould cause actual results to differ materially from those suggested by the forward-looking statements include, but are not limited to:
◾ uncertainties regarding future actions that may be taken by Starboard in furtherance of its stated intention to nominate director candidates for election atNewell Brands’ 2018 Annual Meeting;
◾ potential operational disruption caused by Starboard’s actions that may make it more difficult to maintain relationships with customers, employees orsuppliers;
◾ the Company’s dependence on the strength of retail, commercial and industrial sectors of the economy in various parts of the world;
◾ competition with other manufacturers and distributors of consumer products;
◾ major retailers’ strong bargaining power and consolidation of the Company’s customers;
◾ the Company’s ability to improve productivity, reduce complexity and streamline operations;
◾ the Company’s ability to develop innovative new products, to develop, maintain and strengthen end-user brands and to realize the benefits of increasedadvertising and promotion spend;
◾ risks related to the Company’s substantial indebtedness, potential increases in interest rates or changes in the Company’s credit ratings;
◾ the Company’s ability to effectively accelerate its transformation plan and explore and execute its strategic options; ◾ the Company’s ability to complete planned acquisitions and divestitures, to integrate Jarden and other acquisitions and unexpected costs or expenses
associated with acquisitions or dispositions;
◾ changes in the prices of raw materials and sourced products and the Company’s ability to obtain raw materials and sourced products in a timely manner;
◾ the risks inherent to the Company’s foreign operations, including currency fluctuations, exchange controls and pricing restrictions;
◾ a failure of one of the Company’s key information technology systems or related controls;
◾ future events that could adversely affect the value of the Company’s assets and require impairment charges;
◾ the impact of United States or foreign regulations on the Company’s operations, including environmental remediation costs;
◾ the potential inability to attract, retain and motivate key employees;
◾ the resolution of tax contingencies resulting in additional tax liabilities;

◾ product liability, product recalls or related regulatory actions;
◾ the Company’s ability to protect its intellectual property rights;
◾ significant increases in the funding obligations related to the Company’s pension plans; and
◾ other factors listed from time to time in the Company’s filings with the SEC including, but not limited to, the Company’s most recent Annual Report onForm 10-K.
The information contained in this email is as of the date indicated. The Company assumes no obligation to update any forward-looking statements as a result ofnew information, future events or developments.