NEW ZEALAND NATIONAL GAMBLING STUDY: WAVE 4 (2015) · Web viewThe New Zealand National Gambling...
290
NEW ZEALAND NATIONAL GAMBLING STUDY: WAVE 4 (2015) REPORT NUMBER 6 Provider Number: 467589 Agreement Number: 349827/00 FINAL REPORT 29 March 2018 Prepared for: Ministry of Health PO Box 5013 Wellington
-
Upload
phungkhanh -
Category
Documents
-
view
214 -
download
0
Transcript of NEW ZEALAND NATIONAL GAMBLING STUDY: WAVE 4 (2015) · Web viewThe New Zealand National Gambling...

NEW ZEALAND NATIONAL GAMBLING STUDY: WAVE 4 (2015)
REPORT NUMBER 6
Provider Number: 467589
Agreement Number: 349827/00
FINAL REPORT
29 March 2018
Prepared for:Ministry of HealthPO Box 5013Wellington
Authors:Professor Max AbbottDr Maria BellringerDr Nick Garrett

ACKNOWLEDGEMENTS
This report has been prepared by the Gambling and Addictions Research Centre, National Institute for Public Health and Mental Health Research, School of Public Health and Psychosocial Studies, Faculty of Health and Environmental Sciences, Auckland University of Technology, Private Bag 92006, Auckland 1142, New Zealand.
The authors are highly appreciative of, and would like to thank, the National Research Bureau (NRB) who led and conducted the field work. For four consecutive years, NRB has contacted and interviewed participants, and maintained the study database. Without NRB’s commitment to the study, this research would not have been possible. Special thanks go to Ken Sutton, Janette Simpson, Andy Heinemann and the team of field workers at NRB.
Sincere thanks are also due to Professor Denise Wilson who advised on Māori cultural aspects throughout the study; Rebecca Coombes and Hannah Thorne who managed the study at the Gambling and Addictions Research Centre from initiation until mid-2013; Dr Stuart Mundy-McPherson who assisted in the conduct of the study from 2013 to 2016; and to Professor David Hodgins and Christine Stone who peer reviewed the report and provided helpful comments.
Grateful acknowledgement is made of all the participants who have remained in the study and who agreed to be interviewed for a fourth time.
Disclaimer
This report was prepared under contract to the New Zealand Ministry of Health. The copyright in this article is owned by the Crown and administered by the Ministry. The views of the authors do not necessarily represent the views or policy of the New Zealand Ministry of Health. The Ministry makes no warranty, express or implied, nor assumes any liability or responsibility for use of, or reliance on, the contents of this report.
Suggested citation
Abbott, M., Bellringer, M., & Garrett, N. (2018). New Zealand National Gambling Study: Wave 4 (2015). Report number 6. Auckland: Auckland University of Technology, Gambling and Addictions Research Centre.
1New Zealand National Gambling Study: Wave 4 (2015)Provider No: 467589, Agreement No: 349827/00Auckland University of Technology, Gambling and Addictions Research Centre Final Report Number 6, 29 March 2018

CONTENTS
ACKNOWLEDGEMENTS........................................................................................................1
EXECUTIVE SUMMARY........................................................................................................6
1 OVERVIEW AND PURPOSE........................................................................................13
1.1 Introduction.............................................................................................................131.2 Study objectives......................................................................................................131.3 Background.............................................................................................................14
2 RESEARCH METHODS................................................................................................28
2.1 Ethics approval........................................................................................................282.2 Survey instrument...................................................................................................282.3 Overview of the survey methodology.....................................................................29
2.3.1 Baseline (Wave 1 assessment)............................................................................292.3.2 Follow-up assessments (Wave 2 to Wave 4).......................................................30
2.4 Survey population...................................................................................................302.4.1 Sample size.........................................................................................................302.4.2 Sample composition by gender and age groups.................................................322.4.3 Sample composition by ethnicity........................................................................32
2.5 Weighting................................................................................................................332.5.1 Weighting............................................................................................................332.5.2 Census benchmark..............................................................................................332.5.3 Attrition-specific weights....................................................................................33
2.6 Data analysis...........................................................................................................342.6.1 Attrition analyses................................................................................................342.6.2 Descriptive statistics...........................................................................................342.6.3 Inferential statistics............................................................................................352.6.4 Inference on specific transitions.........................................................................35
3 RESULTS........................................................................................................................37
3.1 Attrition analyses.....................................................................................................373.2 Descriptive statistics................................................................................................37
3.2.1 Sociodemographic variables that could have changed over time......................373.2.2 Gambling participation......................................................................................383.2.3 Online/remote gambling.....................................................................................423.2.4 Methods used to stop gambling too much and help-seeking behaviour.............443.2.5 Health status.......................................................................................................45
3.3 Gambling type games not played for money or prizes............................................483.4 EGM expenditure trends.........................................................................................49
3.4.1 Typical monthly EGM expenditure by gambling risk level................................493.4.2 Estimated annual EGM expenditure by gambling risk level..............................503.4.3 Typical monthly Class 4 expenditure by selected demographics.......................51
3.5 Gambling risk trends...............................................................................................513.5.1 Gambling risk.....................................................................................................513.5.2 Gambling risk levels by sociodemographic variables........................................523.5.3 Gambling risk levels by gambling behaviour.....................................................533.5.4 Past year participation in gambling type games not played for money by gambling risk level...........................................................................................................543.5.5 Gambling risk levels by methods used to stop gambling too much and help-seeking behaviour............................................................................................................543.5.6 Gambling risk levels by major life events and psychological distress...............55
3.6 Incidence.................................................................................................................552
New Zealand National Gambling Study: Wave 4 (2015)Provider No: 467589, Agreement No: 349827/00Auckland University of Technology, Gambling and Addictions Research Centre Final Report Number 6, 29 March 2018

3.7 Gambling risk level transitions...............................................................................563.8 Associations with the chance of being a past year gambler vs. not gambling across Waves 1 to 4.........................................................................................................................60
3.8.1 Bivariate associations........................................................................................603.8.2 Multiple logistic regression................................................................................61
3.9 Associations with the chance of being a past year low-risk/moderate-risk/ problem gambler vs. being a non-problem gambler/non-gambler across Waves 1 to 4....................63
3.9.1 Bivariate associations........................................................................................633.9.2 Multiple logistic regression................................................................................643.9.3 Multiple logistic regression - Māori...................................................................673.9.4 Multiple logistic regression - Pacific people......................................................69
3.10 Associations with the chance of being a past year moderate-risk/problem gambler vs. being a low-risk/non-problem/non-gambler across Waves 1 to 4..................................71
3.10.1 Bivariate associations....................................................................................713.10.2 Multiple logistic regression............................................................................723.10.3 Multiple logistic regression - Māori..............................................................753.10.4 Multiple logistic regression - Pacific people.................................................76
3.11 Recovery from moderate-risk/problem gambling...................................................773.11.1 Bivariate associations....................................................................................783.11.2 Multiple logistic regression............................................................................78
3.12 Relapse into moderate-risk/problem gambling.......................................................793.12.1 Bivariate associations....................................................................................793.12.2 Multiple logistic regression............................................................................80
4 SUMMARY, DISCUSSION AND CONCLUSIONS.....................................................81
5 REFERENCES...............................................................................................................101
APPENDIX 1: Categorical values covered by attrition analyses...........................................111
APPENDIX 2: Covariates for descriptive analysis................................................................112
APPENDIX 3: Covariate for gambling risk level descriptive analysis..................................113
APPENDIX 4: Covariates for consideration in the inferential analyses................................114
APPENDIX 5: Gambling activities for analysis....................................................................115
APPENDIX 6: Wave 4 attrition from Wave 1 (unweighted numbers)..................................116
APPENDIX 7: Sociodemographic variables that could have changed over time..................118
APPENDIX 8: Past year and past month gambling in Waves 1, 2, 3 and 4...........................120
APPENDIX 9: Gambling behaviour in Waves 1, 2, 3 and 4..................................................122
APPENDIX 10: Gambling behaviour in Waves 1, 2, 3 and 4 - Māori...................................125
APPENDIX 11: Gambling behaviour in Waves 1, 2, 3 and 4 - Pacific.................................128
APPENDIX 12: Gambling behaviour in Waves 1, 2, 3 and 4 - Asian...................................131
APPENDIX 13: Time spent gambling on EGMs in an average day in Waves 1, 2, 3 and 4. 134
APPENDIX 14: Time spent gambling on EGMs in an average day in Waves 1, 2, 3 and 4 - Māori.......................................................................................................................................135
APPENDIX 15: Health status in Waves 1, 2, 3 and 4............................................................136
APPENDIX 16: Health status in Waves 1, 2, 3 and 4 - Māori...............................................138
APPENDIX 17: Health status in Waves 1, 2, 3 and 4 - Pacific.............................................140
APPENDIX 18: Health status in Waves 1, 2, 3 and 4 - Asian...............................................1423
New Zealand National Gambling Study: Wave 4 (2015)Provider No: 467589, Agreement No: 349827/00Auckland University of Technology, Gambling and Addictions Research Centre Final Report Number 6, 29 March 2018

APPENDIX 19: Typical month EGM expenditure by gambling risk level for Waves 1, 2, 3 and 4........................................................................................................................................144
APPENDIX 20: Estimated annual EGM expenditure by gambling risk level for Waves 1, 2, 3 and 4........................................................................................................................................145
APPENDIX 21: Typical month Class 4 expenditure by demographics for Waves 1, 2, 3 and 4................................................................................................................................................147
APPENDIX 22: Gambling risk levels by sociodemographic variables for Waves 1, 2, 3 and 4................................................................................................................................................148
APPENDIX 23: Gambling risk levels by gambling behaviour for Waves 1, 2, 3 and 4........151
APPENDIX 24: Gambling risk levels by methods used to stop gambling too much and help-seeking behaviour for Waves 1, 2, 3 and 4.............................................................................155
APPENDIX 25: Gambling risk levels by major life events experienced and psychological distress for Waves 1, 2, 3 and 4..............................................................................................156
APPENDIX 26: Transitions between gambling risk levels between the waves....................158
APPENDIX 27: Transitions between gambling risk levels between the waves by Māori and Pacific ethnicity......................................................................................................................159
APPENDIX 28: Statistically significant bivariate associations with the chance of being a past year gambler vs. not gambling across Waves 1 to 4...............................................................162
APPENDIX 29: Statistically significant bivariate associations with the chance of being a past year low-risk/moderate-risk/problem gambler vs. being a non-problem/non-gambler across Waves 1 to 4...........................................................................................................................164
APPENDIX 30: Statistically significant bivariate associations with the chance of being a past year moderate-risk/problem gambler vs. being a low-risk/non-problem/non-gambler across Waves 1 to 4...........................................................................................................................169
APPENDIX 31: Statistically significant bivariate associations for recovery from moderate-risk/problem gambling............................................................................................................173
APPENDIX 32: Statistically significant bivariate associations for relapse into moderate-risk/problem gambling............................................................................................175
4New Zealand National Gambling Study: Wave 4 (2015)Provider No: 467589, Agreement No: 349827/00Auckland University of Technology, Gambling and Addictions Research Centre Final Report Number 6, 29 March 2018

LIST OF TABLES
Table 1: Gender and age of participants in Waves 1 to 4.........................................................32Table 2: Ethnicity of participants in Waves 1 to 4...................................................................32Table 3: Recovery and relapse from Waves 1 to 4...................................................................36Table 4: Online/remote gambling in Waves 1, 2, 3 and 4........................................................43Table 5: Methods used to stop gambling too much and help-seeking behaviour in Waves 1, 2, 3 and 4.......................................................................................................................................44Table 6: Methods used to stop gambling too much and help-seeking behaviour in Waves 1, 2, 3 and 4 - Māori.........................................................................................................................45Table 7: Participation in gambling type games not for money or prizes in Waves 1, 2, 3 and 4..................................................................................................................................................48Table 8: Participation in gambling type games not for money or prizes by ethnicity in Waves 1, 2, 3 and 4...............................................................................................................................49Table 9: Percentage of total estimated EGM expenditure by gambling risk level and venue in Waves 1, 2, 3 and 4...................................................................................................................50Table 10: Gambling risk in Waves 1, 2, 3 and 4......................................................................52Table 11: Participation in gambling type games not for money or prizes by gambling risk level in Waves 1, 2, 3 and 4......................................................................................................54Table 12: Transitions between gambling risk levels between the waves.................................56Table 13: Transitions between gambling risk levels between the waves by Māori and Pacific ethnicity....................................................................................................................................59Table 14: Multiple logistic regression for associations with chance of being a past year gambler vs. not gambling across Waves 1 to 4........................................................................61Table 15: Multiple logistic regression for the chance of being a past year low-risk/moderate-risk/problem gambler versus being a non-problem gambler/non-gambler across Waves 1 to 4..................................................................................................................................................64Table 16: Multiple logistic regression for the chance of being a past year low-risk/moderate-risk/problem gambler versus being a non-problem gambler/non-gambler across Waves 1 to 4 - Māori......................................................................................................................................67Table 17: Multiple logistic regression for the chance of being a past year low-risk/moderate-risk/ problem gambler versus being a non-problem gambler/non-gambler across Waves 1 to 4 - Pacific people.........................................................................................................................70Table 18: Multiple logistic regression for the chance of being a past year moderate-risk/problem gambler vs. being a low-risk/non-problem/non gambler across Waves 1 to 4.........................................................................................................................................73Table 19: Multiple logistic regression for the chance of being a past year moderate-risk/problem gambler vs. being a low-risk/non-problem/non-gambler across Waves 1 to 4 - Māori............................................................................................................................75Table 20: Multiple logistic regression for the chance of being a past year moderate-risk/problem gambler vs. being a low-risk/non-problem/non-gambler across Waves 1 to 4 - Pacific people...............................................................................................................76Table 21: Multiple logistic regression for recovery from moderate-risk/problem gambling...79Table 22: Multiple logistic regression for relapsing into moderate-risk/problem gambling....80
LIST OF FIGURES
Figure 1: Past year gambling participation by number of activities (1985 - 2012)..................21Figure 2: Past year gambling participation by number of activities (1985 - 2012)..................21Figure 3: Number of participants interviewed over time..........................................................31Figure 4: Past year gambling participation by activity across Waves 1 to 4............................39Figure 5: Past month gambling participation by activity across Waves 1 to 4.........................40
5New Zealand National Gambling Study: Wave 4 (2015)Provider No: 467589, Agreement No: 349827/00Auckland University of Technology, Gambling and Addictions Research Centre Final Report Number 6, 29 March 2018

Figure 6: Regular continuous and regular non-continuous gambling, over time.....................41
1 EXECUTIVE SUMMARY
The National Gambling Study is a national population study
The National Gambling Study has interviewed annually a national sample of the New Zealand population over four years from 2012 to 2015. In 2012, 6,251 randomly selected adults (18 years and older) were interviewed face-to-face in their homes. In 2013, 3,745 participants were re-contacted and re-interviewed. The numbers re-interviewed were 3,115 in 2014 and 2,770 in 2015. The Ministry of Health has funded all phases of the study.
The study participant profile changed slightly over time
Although the same participants were interviewed annually, because of drop-outs from the study (attrition), the overall profile of the participants changed from 2012 to 2015.
In 2015 there were less people retained in the study (higher attrition) who: Were younger (aged 18 to 24 years and, to a lesser extent, 25 to 34 years) Had gambled on 10 or more activities in the past year Had experienced five or more major life events in the past year.
There were more people retained in the study (lower attrition) who: Were of European/Other ethnicity Lived in Wellington or Christchurch Were non-problem gamblers or problem gamblers.
The study used weights to adjust for attrition
All data analyses took account of the change in participant profile and made adjustments (weighted the data) to allow the findings to be generalised to the New Zealand general population.
The study investigated gambling behaviour changes over the four years
The study examined findings across the four years (2012 to 2015) assessing gambling prevalence trends, electronic gaming machine expenditure trends, gambling risk level (no gambling, non-problem gambling, low-risk gambling, moderate-risk gambling and problem gambling) trends, incidence of risk (number of new cases of problem, moderate-risk and low-risk gamblers), and transitions between gambling risk levels. Risk and resiliency factors for moderate-risk and problem gambling over time are also presented.
The study found that...
There were proportionally fewer gamblers in 2015 than in 2012
In 2015, the percentage of adults who had not gambled in the past year was 25%, compared with 20% in 2012. Put another way, the percentage of gamblers reduced from 80% in 2012 to 75% in 2015.
6New Zealand National Gambling Study: Wave 4 (2015)Provider No: 467589, Agreement No: 349827/00Auckland University of Technology, Gambling and Addictions Research Centre Final Report Number 6, 29 March 2018

There was also a decrease in the proportion of adults gambling on multiple activities: Gambling on four to six activities reduced from 18% in 2012 to 14% in 2015 Gambling on seven to nine activities reduced from 3.3% in 2012 to 2.0% in 2015.
Online gambling occurred at a low level
Online/remote gambling occurred substantially less than the same gambling via land based means. Total participation in New Zealand online gambling (Lotto and TAB) was 9% in 2015; this was essentially similar to 2012 when it was 8%. In 2015, total participation in overseas online gambling was 0.7%; this was a decrease from 1.7% in 2012.
In 2015, 13% of adults took part in gambling-type games not for money and Māori were more likely to play these games
The proportion of adults who participated in gambling-type games not for money reduced from 16% in 2012 to 13% in 2015. In 2015, skill games were the most common (7.2%), followed by fantasy football (2.6%) and internet poker (2.3%). Online casino games not for money were played by 1.5% of adults.
Māori were more likely to play gambling-type games not for money - 21% in 2015. The higher participation by Māori was constant across the years.
More people gambled on pub EGMs than club or casino EGMs, but the percentage was less in 2015 than 2012
In 2015, 13% of adults had gambled on EGMs (pub, club and casino) in the past year; this was a reduction from 18% in 2012. In 2015, 8.2% had gambled on pub EGMs compared with 5.9% on casino EGMs and 3.7% on club EGMs.
Moderate-risk/problem gamblers typically spent more per month on EGM gambling than low-risk and non-problem gamblers
In 2015, overall typical monthly EGM expenditure was $51 for casino EGM gambling, $35 for pub EGMs and $37 for club EGMs. This was similar to 2012. In total in 2015, 58% of EGM expenditure was on pub and club EGMs and 42% on casino EGMs. About three-quarters of the expenditure by moderate-risk/problem gamblers was on pub and club EGMs compared with about one-quarter on casino EGMs.
Moderate-risk/problem gamblers had higher expenditure than low-risk gamblers and non-problem gamblers. Monthly expenditure by moderate-risk/problem gamblers in 2015 was $107 on casino EGMs, $92 on pub EGMs and $110 on club EGMs. For low-risk gamblers it was $93, $45 and $25, and for non-problem gamblers $33, $25 and $22. The differences in expenditure between moderate-risk/problem gamblers and non-problem gamblers were substantial and were apparent from 2012 to 2015.
7New Zealand National Gambling Study: Wave 4 (2015)Provider No: 467589, Agreement No: 349827/00Auckland University of Technology, Gambling and Addictions Research Centre Final Report Number 6, 29 March 2018

Problem gambling risk did not change significantly from 2012 to 2015
In 2015, 0.2% of participants were problem gamblers, 1.8% were moderate-risk gamblers, 4.6% were low-risk gamblers and 68% were non-problem gamblers. Twenty-five percent had not gambled in the prior 12 months. The percentages in 2012 were, respectively: 0.6%, 1.7%, 4.9% and 73% with 20% non-gamblers.
Moderate-risk/problem gamblers were more likely to: Be aged 18 to 39 years Be of Māori or Pacific ethnicity Experience 5 or more individual levels of deprivation Have severe or high levels of psychological distress.
Moderate-risk/problem gamblers were also more likely to gamble: On multiple activities (7 to 9) Weekly or more often Regularly on continuous activities At higher expenditure levels ($101 or more per month) For a longer time on EGMs (more than 60 minutes).
Moderate-risk/problem gamblers were more likely to use methods to stop gambling too much
Moderate-risk/problem gamblers were more likely to set a money limit for gambling, separating betting money from other money and stopping when it was used up, leaving ATM and credit cards at home, and avoiding betting/gambling venues.
Only 1.6% of moderate-risk/problem gamblers sought professional help
Very few participants had sought help from a professional gambling treatment service in the prior year. In 2015, only 1.6% of moderate-risk/problem gamblers had sought help. This was similar in 2012.
Seventy percent of people becoming moderate-risk/problem gamblers were ‘new’ cases and 30 percent were relapsing
In 2015, the incidence rate (rate of new cases) was 0.1% for problem gambling, 1.15% for moderate-risk gambling and 3.25% for low-risk gambling.
Of the people who developed problem gambling, 33% were new problem gamblers and the remaining 67% were people who had previously had problems with gambling. Of moderate-risk gamblers, 71% were new. The estimate for new cases of moderate-risk and problem gamblers combined was 70%.
Low-risk and moderate-risk gamblers were more likely to move to a higher or lower risk level over time
8New Zealand National Gambling Study: Wave 4 (2015)Provider No: 467589, Agreement No: 349827/00Auckland University of Technology, Gambling and Addictions Research Centre Final Report Number 6, 29 March 2018

The low-risk and moderate-risk gambler groups were the least stable over time (i.e. people were more likely to move to a higher or lower risk level), the non-problem and non-gambling groups were the most stable, and the problem gambling group was in the middle.About two-thirds of non-gamblers stayed as non-gamblers and about four-fifths of non-problem gamblers stayed non-problem from 2012 to 2015. Problem gamblers were the next most stable group with 44% staying in that category over time. About one-quarter to one-third of low-risk and moderate-risk gamblers remained in those categories across the years.
Changes in risk level were bi-directional with movement to higher risk and lower risk levels. It was not sequential. Whilst a majority of movement was either to the next higher or lower risk level, some participants became problem gamblers from non-gambler, non-problem or low-risk groups in the previous year, and some problem gamblers and moderate-risk gamblers stopped gambling or became non-problem gamblers.
Risk factors for gambling participation were age, income, major life events and substance use
Statistically significant independent risk factors associated (in multiple logistic regression analyses) with being a past year gambler vs. not gambling across 2012 to 2015 were:
Being aged 40 to 64 years vs. being aged 18 to 39 years (OR 1.97) Having an annual personal income greater than $20,000 vs. less than $20,000 (OR
1.55 to 2.44) Experiencing 3 or more major life events in the prior year vs. no events (OR 1.30 to
1.41) Hazardous alcohol consumption vs. non-hazardous consumption (OR 1.73) Ever smoking more than 100 cigarettes in lifetime vs. not having smoked this many
(OR 1.39).
Factors associated with a lower chance of gambling participation were ethnicity, migrant status, religion and psychological distress
Factors significantly independently associated (in multiple logistic regression analyses) with a lower chance of being a past year gambler vs. not gambling across 2012 to 2015 were:
Being of Asian ethnicity vs. being of European/Other ethnicity (OR 0.30) Being affiliated with a religion vs. not having a religion (OR 0.74) Being a migrant (OR 0.59), particularly a recent migrant (arrived after 2008) (OR
0.13) vs. being born in New Zealand Having moderate or high levels of psychological distress vs. having a low level
(OR 0.71 to 0.35).
Risk factors for being a risky gambler were ethnicity, deprivation, major life events, psychological distress, cannabis use and various gambling behaviours
Statistically significant independent risk factors associated (in multiple logistic regression analyses) with being a low-risk/moderate-risk/problem gambler vs. being a non-problem gambler/non-gambler across 2012 to 2015 were:
Being of Māori (OR 2.92) or Pacific (OR 2.50) ethnicity vs. being of European/Other ethnicity
Experiencing one or more individual levels of deprivation vs. no deprivation (OR 1.43 to 3.18)
9New Zealand National Gambling Study: Wave 4 (2015)Provider No: 467589, Agreement No: 349827/00Auckland University of Technology, Gambling and Addictions Research Centre Final Report Number 6, 29 March 2018

Experiencing 3 or more major life events in the prior year vs. no events (OR 1.74 to 1.79)
Experiencing moderate, high or severe levels of psychological distress vs. a low level (OR 1.75 to 6.25)
Using cannabis vs. not using cannabis (OR 1.59).
Gambling-related risk factors were: Gambling at least once in the past year on EGMs vs. not gambling on EGMs
(OR 2.79) Gambling at least monthly on card games, sports betting, pub or club EGMs, short-
term speculative investments, and playing on gambling-type games not for money vs. not participating in these activities (OR 1.72 to 4.87)
Having a typical monthly gambling expenditure of more than $50 vs. $20 or less (OR 2.57)
Gambling on club (OR 4.38) and casino (OR 2.43) EGMs for more than 60 minutes in a typical day vs. not gambling on EGMS in these venues
Various methods for controlling gambling behaviour vs. not doing these things:o Setting a dollar limit for gambling before leaving home (OR 1.54)o Getting someone trustworthy to manage gambling money (OR 5.13)o Separating money for betting from other money and stopping when it is used
(OR 2.37)o Leaving ATM and credit cards at home (OR 2.38)o Avoiding places that have betting or gambling (OR 5.46).
Risk factors for Māori that were not found for the total population were: Being a current tobacco smoker vs. being a non-smoker (OR 1.63) Regularly gambling on continuous activities vs. infrequent gambling (OR 2.68) Gambling on pub EGMs for more than 30 minutes in a typical day vs. not gambling
on pub EGMs (OR 2.63 to 5.20).
Risk factors for Pacific people that were not found for the total population were: Gambling annually or more often on text games or competitions vs. not gambling on
these activities (OR 3.87) Gambling monthly or more often on housie/bingo (OR 3.71) and horse/dog race
betting (OR 4.27) vs. not gambling on these activities Gambling on pub EGMs for more than 30 minutes in a typical day vs. not gambling
on pub EGMs (OR 4.48 to 6.81) Gambling on casino EGMs for more than 60 minutes in a typical day vs. not
gambling on casino EGMs (OR 4.19).
Factors associated with a lower chance of being a risky gambler were ethnicity, income and gambling at least once in the past year
Factors significantly independently associated (in multiple logistic regression analyses) with a lower chance of being a low-risk/moderate-risk/problem gambler vs. being a non-problem gambler/non-gambler across 2012 to 2015 were:
Being of Asian ethnicity vs. being of European/Other ethnicity (OR 0.53) Having an annual household income higher than $40,000 vs. $40,000 or less (OR
0.56 to 0.63) Gambling at least once in the prior year vs. at least weekly (OR 0.27).
Risk factor for Māori that was not found for the total population was:
10New Zealand National Gambling Study: Wave 4 (2015)Provider No: 467589, Agreement No: 349827/00Auckland University of Technology, Gambling and Addictions Research Centre Final Report Number 6, 29 March 2018

Not using drugs vs. using drugs (OR 0.63).
Risk factor for Pacific people that was not found for the total population was: Highest educational achievement was at secondary school or tertiary level vs. no
formal qualification (OR 0.51, 0.28).
Risk factors for being a moderate-risk/problem gambler were ethnicity, deprivation, psychological distress and various gambling behaviours
Statistically significant independent risk factors associated (in multiple logistic regression analyses) with being a moderate-risk/problem gambler vs. being a low-risk/non-problem gambler/non-gambler across 2012 to 2015 were:
Being of Māori ethnicity vs. being of European/Other ethnicity (OR 2.41) Experiencing one (OR 2.96) or 3 or more (OR 5.67) individual levels of deprivation
vs. no deprivation Experiencing moderate (OR 3.41), high (OR 18.08) or severe (OR 2.27) levels of
psychological distress vs. a low level.
Gambling-related risk factors were: Gambling at least monthly on card games, sports betting, EGMs, and playing on
gambling-type games not for money vs. not participating in these activities (OR 2.25 to 7.60)
Gambling regularly on continuous activities vs. infrequent gambling (OR 3.16) Having a typical monthly gambling expenditure of more than $50 vs. $20 or less
(OR 4.51) Gambling on casino (OR 3.27) or pub (OR 11.48) EGMs for more than 60 minutes in
a typical day vs. not gambling on EGMs in these venues Various methods for controlling gambling behaviour vs. not doing these things:
o Leaving ATM and credit cards at home (OR 4.26)o Avoiding places that have betting or gambling (OR 4.78).
Risk factors for Māori that were not found for the total population were: Gambling monthly or more often on pub EGMs (OR 2.77) and horse/dog race betting
(OR 3.04) vs. not gambling on these activities Gambling on pub EGMs for more than 60 minutes in a typical day vs. not gambling
on pub EGMs (OR 4.79) Separating money for betting from other money and stopping when it is used vs. not
doing this (OR 3.75).
Risk factor for Pacific people that was not found for the total population was: Gambling at least weekly vs. at least once in the prior year (OR 3.43).
Factors associated with a lower chance of being a moderate-risk/problem gambler were ethnicity and quality of life
Factors significantly independently associated (in multiple logistic regression analyses) with a lower chance of being a moderate-risk/problem gambler vs. being a low-risk/non-problem gambler/non-gambler across 2012 to 2015 were:
Being of Asian ethnicity vs. being of European/Other ethnicity (OR 0.28) Having a quality of life above the median level vs. below median (OR 0.35).
11New Zealand National Gambling Study: Wave 4 (2015)Provider No: 467589, Agreement No: 349827/00Auckland University of Technology, Gambling and Addictions Research Centre Final Report Number 6, 29 March 2018

There were no additional risk factors for Māori or Pacific people associated with a lower chance of being a moderate-risk/problem gambler.
People were less likely to recover from moderate-risk/problem gambling if they gambled monthly on Instant Kiwi, track betting and club EGMs
People who recovered from moderate-risk/problem gambling were those who were moderate-risk/ problem gamblers in 2012, who then transitioned out of these risk levels to lower levels (or stopped gambling) and remained at the lower levels in 2013, 2014 and 2015.
Factors significantly independently associated (in multiple logistic regression analyses) with less likelihood of recovery (in other words, were more likely to remain as moderate-risk/ problem gamblers) were gambling monthly or more often on Instant Kiwi or other scratch tickets (OR 0.06), on horse and dog race betting (OR 0.04), and on club EGMs (OR 0.05) vs. not gambling on these activities.
People were more likely to relapse into moderate-risk/problem gambling if they gambled annually on housie or overseas internet gambling, or monthly on Instant Kiwi or casino EGMs
People who relapsed into moderate-risk/problem gambling were those who were moderate-risk/ problem gamblers in 2012, were not at these risk levels in 2013, but who then became moderate-risk/ problem gamblers again in 2014 and/or 2015.Factors significantly associated (in multiple logistic regression analyses) with greater likelihood of relapse were:
Gambling annually or more often on housie/bingo (OR 21.90) or overseas internet gambling (OR 23.74) vs. not gambling on these activities
Gambling monthly or more often on Instant Kiwi or other scratch tickets (OR 11.38) and on casino EGMs (OR 16.08) vs. not gambling on these activities
Separated betting money from other money and stopped gambling when it was used up vs. not doing this (OR 12.41).
Implications
From 2012 to 2015, overall gambling participation has declined whilst problem gambling and low-risk and moderate-risk gambling levels have remained static. This poses a public health challenge of identifying the factors to explain the persistence of harm despite declining gambling participation. One reason may be a high relapse rate. If this is the case, greater attention is required for relapse prevention in public health and treatment programmes.
Māori and Pacific people continue to have very high problem gambling prevalence rates. This means that unless more focus is placed on understanding why this is the case, and processes put in place to change the current situation, Māori and Pacific communities will continue to be disproportionately affected by gambling-related harm.
12New Zealand National Gambling Study: Wave 4 (2015)Provider No: 467589, Agreement No: 349827/00Auckland University of Technology, Gambling and Addictions Research Centre Final Report Number 6, 29 March 2018

2 OVERVIEW AND PURPOSE
2.1 Introduction
The New Zealand National Gambling Study (NGS), a nationally representative prospective survey of adults (18 years and older), provides information on the prevalence, incidence, nature and effects of gambling in New Zealand. It employed a face-to-face household recruitment methodology with data collected via computer-assisted personal interviews (CAPI). Baseline data were collected in 2012 (Wave 1), with annual re-assessment of the same participants over the subsequent three years (until 2015). The Wave 1 sample comprised 6,251 adults and was a multi-stage, stratified, probability-proportional-to-size sample with over-sampling of Māori, Pacific people and Asian people. The number of participants re-interviewed in subsequent waves was: 3,745 in Wave 2 (2013), 3,115 in Wave 3 (2014) and 2,770 in Wave 4 (2015).
The same questionnaire (with a few minor adjustments) was used in all four waves so that changes over time could be measured and factors predictive of change in gambling and problem gambling could be identified. It incorporated a range of measures including gambling participation, gambling strategies and cognitions, gambling attitudes, problem gambling, health and well-being, psychological status, substance use/misuse, life events, social capital/support and demographic information. The questionnaire was designed to be as similar as possible to previous national and international gambling surveys, enabling comparisons of results between the NGS and those other surveys.
An additional cohort of 106 moderate-risk and problem gamblers was recruited from gambling venues and via advertisements in Wave 3 (2014) and re-assessed in Wave 4 (2015). The questionnaires for the cohort were the same as those used in Wave 1 and Wave 2 for the main NGS. The purpose of the additional cohort was to increase the numbers of participants in the moderate-risk and problem gambler categories, to allow more detailed analyses of transitions in gambling involvement over time.
This report details the fourth wave of the NGS, presenting and discussing results from the three-year follow-up assessment of participants conducted in 2015. Results for the additional cohort of moderate-risk and problem gamblers will be reported separately.
The baseline (2012, Wave 1) results are presented in three reports covering an overview of gambling and gambling participation findings (Abbott, Bellringer, Garrett, & Mundy-McPherson, 2014a), gambling harm and problem gambling (Abbott et al., 2014b), and attitudes towards gambling (Abbott et al., 2015a). The Wave 2 and Wave 3 results are detailed in two further reports (Abbott et al., 2015b; Abbott et al., 2016a).
2.2 Study objectives
The main objectives of Wave 4 were to investigate: Population prevalence trends over time Electronic gaming machine expenditure trends over time Gambling risk level trends over time Transitions in gambling risk level over time Risk and resiliency factors associated with gambling participation
13New Zealand National Gambling Study: Wave 4 (2015)Provider No: 467589, Agreement No: 349827/00Auckland University of Technology, Gambling and Addictions Research Centre Final Report Number 6, 29 March 2018

Risk and resiliency factors associated with low-risk/moderate-risk/problem gambling
Risk and resiliency factors associated with moderate-risk/problem gambling Factors associated with recovery from moderate-risk/problem gambling Factors associated with relapse into moderate-risk/problem gambling.
2.3 Background
Gambling, problem gambling and gambling-related harm
Globally, there has been massive growth in gambling availability. This growth has been accompanied by increases in gambling participation and expenditure (Abbott et al., 2014a; Bogart, 2011). Total 2016 world annual gambling revenue (consumer losses) was estimated to be US $400 billion (The Data Team, 2017). While much of this growth has been in land-based gambling activities, there has been a substantial expansion of online gambling and this is expected to further increase in both absolute and relative terms (Gainsbury, 2012; The Data Team, 2017). Hundreds of general population studies of gambling participation and problem gambling have been conducted since the mid-1980s, coinciding with the beginning of the current phase of gambling expansion. These studies increased understanding of gambling and problem gambling, and informed public and political debate. In some jurisdictions this led to legislative and other measures intended to assist problem gamblers and others affected adversely by their behaviour (Volberg, Dickerson, Ladouceur & Abbott, 1996). This research also contributed to recognition of gambling as a wider and growing public health issue (Abbott, Volberg, Bellringer & Reith, 2004a; Chetwynd, 1997; Shaffer & Korn, 2002).
Prevalence surveys provide estimates of how many people take part in various gambling activities and how many experience gambling-related problems. They also indicate which gambling activities are most strongly linked to problem gambling, and which population groups have higher and lower risk. Repeat surveys in the same jurisdiction provide assessments of changes in gambling participation, problem gambling and risk factors for problem gambling over time. While prevalence surveys advance understanding of the nature of problem gambling, they have limitations. As they are cross-sectional, the temporal sequence of associations is unclear. Additionally, people identified as problem gamblers include those with long-standing problems as well as recent cases. The circumstances under which these problems arose may have changed over time. These factors cannot be assessed in cross-sectional studies.
Information about temporal relationships and behaviour that occurred some years previously can be obtained by asking people about past experiences. Such information, however, is prone to recall deficiencies and other distortions. For gambling behaviour, reports of past events are highly unreliable (Abbott, Williams & Volberg, 2004b). Prospective studies are necessary to measure the incidence (onset) of gambling participation and problem gambling, to clarify temporal sequence and identify risk and protective factors for initial problem onset. Studies of this type also enable assessment of the natural history of gambling and problem gambling including problem duration, remission and relapse. While there is now a growing body of prospective gambling research, most involve small, atypical samples and have methodological deficiencies (Abbott & Clarke, 2007; Slutske, 2007). In recent years, five large prospective studies have been initiated, including the NGS (Abbott et al., 2016a; Abbott, Stone, Billi, & Yeung, 2016b; Billi, Stone, Marden & Yeung, 2014; el-Guebaly et al., 2015; Public Health Agency of Sweden, 2016; Romild, Volberg & Abbott, 2014; Williams et al., 2015). These studies, conducted in New Zealand, Australia, Sweden and Canada, are the first to assess the incidence of problem gambling and other gambling transitions in representative
14New Zealand National Gambling Study: Wave 4 (2015)Provider No: 467589, Agreement No: 349827/00Auckland University of Technology, Gambling and Addictions Research Centre Final Report Number 6, 29 March 2018

general population samples. The New Zealand, Swedish and Australian studies were designed to facilitate comparison of their respective findings.
Various commentators have noted that population research in the gambling field has had a narrow focus, largely confined to problem gambling. Wider gambling-related impacts have received relatively little attention (Hancock & Smith, 2017). Although this is generally true, the first and second New Zealand national problem gambling prevalence studies (in 1990 and 1999) included questions covering a wide range of gambling-related costs and benefits (Abbott, 2001; Abbott & Volberg, 1991, 1992, 1996, 2000). In these studies, costs and benefits were assessed in the following domains: personal, interpersonal and family, vocational/employment, financial and legal. Gambling participation was also considered in relation to various aspects of health and wellbeing.
Recently, research has more fully considered wider gambling-related harms. This includes the development of conceptual frameworks to map and understand gambling harm (Abbott et al., 2015d; Langham et al., 2016). Additionally, in the past year, burden of harm methodologies have been applied to gambling. The two studies of this type to date concluded that the burden of harm associated with gambling is substantially higher than harm linked to diabetes and drug use disorder (Browne et al., 2016; 2017). It was around two-thirds to three-quarters that associated with major depressive disorder, and alcohol misuse and dependence. The burden of harm is mainly from financial problems, damage to health and relationships, emotional and psychological distress, and adverse effects on work and education.
While the assessment of wider gambling-related impacts, including the application of burden of harm methodologies, is at an early stage of development, findings to date strongly suggest that the health and social costs are substantial. This research is likely to play an important part in placing gambling on global and national public health agendas (Abbott, 2017a).
With regard to individual gamblers, Browne et al. (2016, 2017) found that while problem gamblers experience the most harm, only a minority of overall gambling-related harm is associated with this group. Most is associated with low-risk and moderate-risk (sub-clinical) gamblers. The reason for this is that people in these categories significantly outnumber problem gamblers. One implication of this finding is that policies and other measures intended to reduce harm will need to focus on the population as a whole and not just on high-risk and problem gamblers.
Gambling in New Zealand
In New Zealand, throughout the 1970s and most of the 1980s, legal gambling was largely confined to on- and off-course betting on horse and dog racing (track betting) and the Golden Kiwi (a state lottery) (Grant, 1994). Eighty percent of official gambling expenditure was on track betting in 1984, with the remaining 20% spent on lotteries. During this period, official gambling expenditure changed very little (Abbott & Volberg, 2000). An unknown amount was also spent on informal activities including raffles, betting with friends and workmates, ‘casino’ fundraising evenings and playing cards and housie (bingo) for money.
New Zealand, in 1985, was one of the first countries to conduct a national gambling participation survey, which also assessed attitudes towards gambling. It did not include measurement of problem gambling. It was not until 1987 that a validated problem gambling instrument was developed (Lesieur & Blume, 1987). The 1985 survey was carried out two years before gambling availability began to markedly increase (Wither, 1988). From 1987 to 1990 a national lottery, scratch lottery and pub and club electronic gaming machines (EGMs)
15New Zealand National Gambling Study: Wave 4 (2015)Provider No: 467589, Agreement No: 349827/00Auckland University of Technology, Gambling and Addictions Research Centre Final Report Number 6, 29 March 2018

were introduced. During this three year period total gambling expenditure doubled. Gambling availability continued to increase during the 1990s. This included steady growth in EGM venues and numbers, the establishment of five casinos and the introduction of sports betting. Expenditure doubled again over this decade (Abbott & Volberg, 2000). After 2000, an additional casino was established, new lottery products were introduced and internet access was provided for betting on track and sports events and purchasing lottery products. EGM venues and numbers continued to increase until 2004. In that year, total official gambling expenditure reached $2.04 billion. Non-casino EGMs accounted for half of this total.
The Gambling Act 2003 came into effect in 2004 (Gambling Act, 2003). This Act limits the number of non-casino EGMs in venues and gives local government authorities more control over the number and location of venues. It prohibits the establishment of new casinos. It also prohibits some forms of gambling via the internet and telephone, while permitting the purchase of lottery products and betting on sport and track events online from approved New Zealand organisations. The Act also placed gambling within a public health framework. This includes the requirement for an integrated strategy, informed by independent research that includes programmes intended to prevent and minimise gambling harms. Harm is defined broadly and includes “harm or distress of any kind arising from, or caused or exacerbated by, a person’s gambling, and includes personal, social or economic harm” (Gambling Act, 2003). It extends to harm experienced by people who gamble, families, wider communities, workplaces and society-at-large.
Gambling strategy objectives, programmes and funding allocations are outlined in Ministry of Health strategies and associated three-year service plans (e.g. Ministry of Health, 2004, 2005, 2007, 2010, 2013, 2016). These plans include nationwide mass media campaigns designed to increase public awareness and understanding of gambling, gambling harm and measures that can be taken to counter them (Walker, Abbott & Gray, 2012). Additional to a national helpline and a range of clinical and associated services to assist problem gamblers and family members, plans include prevention activities, for example, working with organisations to introduce gambling workplace policies, encouraging community groups to find non-gambling sources of revenue and influencing local government authority policies in regard to EGM numbers and distribution (Kolandai-Matchett et al., 2015, 2017).
Following passage of the Gambling Act 2003, most local government authorities adopted caps or sinking lid policies in regard to EGM venues and machine numbers. In 2003 there were 25,221 EGMs in clubs and pubs. Numbers decreased steadily in subsequent years to total 16,053 in 2016 (Department of Internal Affairs, 2017a). From 2003 to 2016, overall official gambling expenditure remained around $2 billion per annum. However, it decreased by a fifth when adjusted for inflation. Non-casino EGM expenditure reduced from about half to 40% of total expenditure. Since 2003, the New Zealand population has grown significantly. This means that per capita expenditure has decreased by more than a fifth. New Zealand’s ranking in terms of per capita gambling expenditure has fallen. Currently New Zealand ranks sixth, below the United States of America (USA) and above Canada. Australia retains top ranking with more than double New Zealand’s per capita expenditure (The Data Team, 2017).
As outlined in Abbott (2017b), New Zealand is unique in that it has a series of national gambling participation and attitude surveys dating from 1985 to 2005 (Christoffel, 1992; Department of Internal Affairs, 2007; Reid and Searle, 1996; Wither, 1988). As mentioned, the first of these surveys was conducted prior to the post 1986 increase in gambling availability. This survey, conducted by the Department of Internal Affairs (DIA), was subsequently repeated every five years. All of these surveys used face-to-face residential
16New Zealand National Gambling Study: Wave 4 (2015)Provider No: 467589, Agreement No: 349827/00Auckland University of Technology, Gambling and Addictions Research Centre Final Report Number 6, 29 March 2018

recruitment and interviewing, and most of the survey questionnaire content remained the same. This facilitated comparison of survey findings over time.
Mention has also been made of the first New Zealand national survey of gambling and problem gambling (Abbott & Volberg, 1991, 1992, 1996; Volberg & Abbott, 1994). The survey was timed to coincide with the second DIA gambling participation and attitudes survey, and was the first national survey internationally to use a validated problem gambling instrument. It was also the first to use a current measure of problem gambling. This measure, the South Oaks Gambling Screen-Revised (SOGS-R), was adapted from the original lifetime South Oaks Gambling Screen (SOGS) (Lesieur & Blume, 1987) and provided both lifetime and current (past 6 months) assessment frames. Subsequently the SOGS-R became the most widely used measure of problem gambling in population research, typically with the current frame extended to 12 months and the lifetime frame omitted (Abbott & Volberg, 2006). In recent years, it has increasingly been replaced by the Problem Gambling Severity Index (Ferris & Wynne, 2001), a past 12 months measure.
A second New Zealand gambling and problem gambling survey was completed during 1999, a year before the fourth DIA gambling participation and attitudes survey (Abbott, 2001; Abbott & Volberg, 2000). The 1990 and 1999 national gambling and problem gambling surveys, in contrast to the DIA surveys, used landline telephone recruitment and interviewing in the main survey phase. At that time, the great majority of residential dwellings had landline telephones and response rates were similar across the DIA and telephone surveys. It was found that the gambling participation and other findings from the 1990 and 1999 telephone surveys were virtually identical to findings from the corresponding face-to-face surveys.
In both of the 1990 and 1999 surveys, problem gamblers and selected subsamples of non-problem gamblers were interviewed face-to-face a few months after their initial interviews. This extension to the studies enabled the collection of additional, more detailed, information and to assess the validity of the SOGS-R in the general population. It had been widely claimed that the SOGS (and by implication SOGS-R) over-estimated the prevalence of problem gambling in population research due to the generation of large numbers of false positives (people who score as problem gamblers but who are not actually problem gamblers when assessed more fully). The second phase interviewers were blind to participants’ SOGS-R categorisation. They were required to make an assessment using DSM pathological gambling criteria. In both studies it was found that while there were significant numbers of false positives, they were counter-balanced by false negatives, meaning that the initial prevalence estimates were likely to be reasonably accurate, if not conservative. Partly for this reason, as well as for reasons of practicality and cost, subsequent prevalence surveys worldwide have not included similar procedures to assess classification accuracy and use this information to adjust prevalence estimates.
The National Gambling Study was partly designed to facilitate comparisons with findings from the 1985-2005 DIA surveys, and the 1990 and 1999 national surveys of gambling and problem gambling (Abbott et al., 2014a). A further consideration was to enable comparison with more recent gambling and problem gambling prevalence survey results in New Zealand and elsewhere, including the Swedish and Victorian prospective gambling studies (Billi, Stone, Abbott & Yeung, 2015; Romild et al., 2014). Like the DIA surveys, the NGS involves face-to-face household recruitment and interviewing. This assists in comparing study findings with the 20-year series of DIA surveys. This approach was also taken because of the marked reduction in residential landline telephone connections during the past decade, the complexity of mixed mode recruitment (e.g. mobile and landlines), the importance of obtaining a high response rate, and retention in subsequent study phases.
17New Zealand National Gambling Study: Wave 4 (2015)Provider No: 467589, Agreement No: 349827/00Auckland University of Technology, Gambling and Addictions Research Centre Final Report Number 6, 29 March 2018

As mentioned in the introduction to this chapter, the first phase of the NGS was conducted in 2012 (Abbott et al., 2014a, 2014b, 2015a). Reports on this phase provide background information, critical reviews of relevant bodies of research and methodological details. These reports also presented the results of that phase of the study in regard to gambling participation, problem gambling and gambling-related harm, comorbidities and attitudes towards gambling.During the past decade, in addition to online gambling, there has been proliferation of online gaming. Increasingly, in recent years, there has also been a convergence of online gambling and gaming (King, Gainsbury, Delfabbro, Hing & Abarbanel, 2015). This convergence includes the development of online ‘gaming’ activities that simulate gambling that uses money, as well as the development of virtual, symbolic ‘currencies’. Gambling-like activities provide an experience of gambling without using money. They include demonstration games on internet sites and social casino games on social networking sites (Griffiths, 2015; King & Delfabbro, 2016). Gambling and gambling-type games not played for money were included in the NGS because relatively little is known about them and because they probably play a role in the recruitment of people to gambling, and may contribute to gambling-related harm.
Relationships between gambling availability, participation and gambling-related harm
Gambling prevalence surveys and studies of help-seeking populations have found strong associations between participation in some gambling activities and problem gambling, particularly those that are continuous in nature and involve an element of skill or perceived skill (Abbott et al., 2014a; Binde, 2011; Binde, Romild & Volberg, 2017; Dussault et al., 2017; Stevens & Young, 2010). Recent studies have found these associations extend to gambling-related harm more generally (Browne et al., 2016, 2017; Centre for Social and Health Outcomes Research and Evaluation & Te Ropu Whariki, 2008).
Hundreds of publications open with the assertion that increased gambling availability has resulted in increased participation and a rise in problem gambling prevalence rates. This notion was first introduced by Cornish (1978) who referred to it as ‘ecological opportunity’. It is also known as the availability or exposure hypothesis. This hypothesis has parallels with the total consumption or single distribution model in the alcohol field. This model proposes that there is a relationship between the average level of consumption and the proportion of heavy at-risk and problem drinkers. There is some support for this hypothesis. For example, reduced per capita consumption has been associated with reduced binge drinking and alcohol-related harmful effects (Rose & Day, 1990).
While methodological and other differences complicate the interpretation of study findings, early reviews (Abbott & Volberg, 1999; Shaffer, Hall & Vander Bilt, 1997; Wildman, 1998) and review bodies (Gambling Review Body, 2001; National Research Council, 1999; Productivity Commission, 1999) concluded that increased gambling availability generally led to increased participation and problems. While acknowledging these findings and conclusions, Shaffer et al. (1997) and Abbott, Volberg and Williams (1999) proposed that over time, populations adapt and people gamble less and experience fewer problems. This adaptation hypothesis was vigorously challenged by a number of gambling researchers. For example, Orford (2005) stated:
“Complex and multifactorial though causation is, the more the product is supplied in an accessible form, the greater the volume of consumption and the greater the incidence and prevalence of harm... It would be very surprising indeed if that general rule were not
18New Zealand National Gambling Study: Wave 4 (2015)Provider No: 467589, Agreement No: 349827/00Auckland University of Technology, Gambling and Addictions Research Centre Final Report Number 6, 29 March 2018

also true for gambling, and the onus should be upon those who think gambling might be an exception to the general law to prove their case” (p. 1236).
While supporting the availability hypothesis, Shaffer et al. (1997) and Abbott et al. (1999) considered it to be over-simplistic and were of the view that it does not apply in all situations. More specifically, Abbott (2006) proposed:
1. “During exposure to new forms of gambling, particularly EGMs and other continuous forms, previously unexposed individuals, population sectors and societies are at high risk for the development of gambling problems.
2. Over time, years rather than decades, adaptation (‘host’ immunity and protective environmental changes) typically occurs and problem levels reduce, even in the face of increasing exposure.
3. Adaptation can be accelerated by regulatory and public health measures.4. While strongly associated with problem development (albeit comparable to some
other continuous forms when exposure is held constant), EGMs give rise to more transient problems.”
Factors believed to contribute to adaptation include individual experience with new gambling activities; changes in gambling participation; increased public awareness of problem gambling and risks associated with various gambling activities; the development of informal social controls; increased provision of mutual help, support and treatment; regulatory changes; and public health programmes.
More recent reviews have found further support for the availability hypothesis (Calado & Griffiths, 2016; Williams, Volberg & Stevens, 2012a). They also identified studies with contradictory findings (Abbott 2006, 2007, 2017a; Abbott et al., 2014a, 2016a; Vasiliadis, Jackson, Christensen & Francis, 2013). Examination of changes in gambling participation and gambling-related problems over time is seriously compromised by variation in survey methodologies. Two studies have taken methodological differences into account to varying degrees and more formally evaluated the availability and adaptation hypotheses (Storer, Abbott & Stubbs, 2009; Williams et al., 2012a).
Storer et al. (2009) conducted a meta-analysis of 34 Australian and New Zealand post-1990 prevalence surveys. Adjustment was made for different problem gambling measures used in these surveys. They found that problem gambling prevalence increased with greater EGM density (EGMs per capita) and decreased over time when density was held constant. This means that over 25 or so years in Australasia, there was support for both availability and adaptation. Furthermore, the two variables, EGM density and time, explained nearly three-quarters of the variance in problem gambling prevalence. This indicates that both are major factors in determining problem gambling and, presumably, gambling-related harm more widely.
Williams et al. (2012a) examined problem gambling prevalence studies world-wide. They developed weightings to adjust problem prevalence rates for methodological differences and enable more valid comparisons to be made. In regions where there were sufficient numbers of studies (Australia, Canada and USA), they found that problem gambling prevalence initially increased, reached a peak, and in subsequent years decreased. Their study did not examine gambling availability or participation in relation to problem gambling. However, in all jurisdictions, gambling availability increased during the study period. At a general population level, the Williams et al. (2012) findings are consistent with availability followed by adaptation.
19New Zealand National Gambling Study: Wave 4 (2015)Provider No: 467589, Agreement No: 349827/00Auckland University of Technology, Gambling and Addictions Research Centre Final Report Number 6, 29 March 2018

Calado and Griffiths (2016) reported a systematic world-wide review of gambling and problem gambling prevalence surveys conducted from 2000 to 2015. In contrast to the Williams, West & Simpson (2012b) review, it included a substantial number of European studies. Past year problem gambling prevalence estimates ranged from 0.1% to 5.8%, virtually identical to the range reported by Williams et al. (2012b). The latter study found rates were generally high in Asia, intermediate in Australasia and low in Europe. Calado and Griffiths (2016) noted that problem gambling rates remained stable in many countries that had undertaken more than one study during this 15 year period. However, they mentioned exceptions, notably Estonia, where prevalence increased. They suggested, in the case of Estonia, that this may have been a consequence of recent exposure to a range of gambling activities that had previously been prohibited. As with the Williams et al. (2012b) review, gambling availability and participation rates were not considered in relation to problem gambling prevalence. Generally, however, availability increased during the study period. Consequently, apart from Estonia and a few other cases, these findings appear to be consistent with adaptation. However, as adjustments were not made to take account of methodological variations, this conclusion should be treated with some caution.
From the foregoing it appears, consistent with the availability hypothesis, that the substantial increases in gambling availability and exposure in recent decades contributed to marked increases in gambling consumption and gambling-related problems and wider harms. It also appears that in many jurisdictions both participation and problems subsequently decreased, despite availability continuing to increase. This is in keeping with the adaptation hypothesis. These reductions seem to have commenced in the mid-1990s in the USA and in the late 1990s in Canada and Australia (Williams et al., 2012b). More recently, as noted by Calado and Griffiths (2016), problem gambling prevalence rates have plateaued in a number of jurisdictions. This recent development is discussed more fully elsewhere in relation to Swedish and Australian studies (Abbott, et al., 2016b; Abbott, Romild & Volberg, 2014c). These studies examined changes over time in gambling participation and problem gambling. In both cases, gambling participation reduced markedly over five to ten year periods, across virtually all sociodemographic groups. However, contrary to both the availability and adaptation hypotheses, problem gambling rates remained unchanged. Furthermore, reduced participation was most marked for young adults and, in this population sector, problem gambling prevalence rates increased. Explanation of these findings requires consideration of factors additional to gambling availability and exposure that influence gambling participation and problem gambling development (Abbott, 2017b, 2017c).
New Zealand survey findings
The two national series of gambling surveys (NGS and DIA) conducted in New Zealand since 1985 provide a unique account of changes in gambling behaviour, attitudes and gambling-related problems over a long time period. A third series conducted more recently, since 2006/07, provides additional information (Thimasarn-Anwar, Squire, Trowland, & Martin, 2017). The study findings allow assessment of the availability, total distribution and adaptation hypotheses.
Gambling participation
As mentioned, the first DIA survey was conducted in 1985, a few years prior to the introduction of a new state lottery (Lotto), EGMs in clubs and pubs and a scratch lottery (Instant Kiwi). In 1985, 85% of adults reported taking part in one or more gambling activities during the past 12 months. At this time, the large majority (70%) said they took part in one to
20New Zealand National Gambling Study: Wave 4 (2015)Provider No: 467589, Agreement No: 349827/00Auckland University of Technology, Gambling and Addictions Research Centre Final Report Number 6, 29 March 2018
three activities and 15% said they took part in four or more activities. In 1990 and 1995, 90% of adults reported gambling participation during the past 12 months. While this was a relatively small overall increase since 1985, a more substantial increase was found for people reporting engagement in four or more activities. This level of engagement increased from 15% in 1985 to 40% in 1990, and 41% in 1995. In subsequent surveys participation declined. Participation in one or more activities declined to 87% in 2000 and 80% in 2005. A reduction was also evident for participation in four or more activities (37% in 2000 and 28% in 2005) (Department of Internal Affairs, 2007). The NGS 2012 baseline survey used a very similar methodology to that employed in the DIA surveys. No change was evident in 2012 in regard to taking part in one or more activities (80%). Participation in four or more activities, however, continued to decline (22%) (Abbott et al., 2014a) (see Figure 1).
Figure 1: Past year gambling participation by number of activities (1985 - 2012)
Reproduced from Abbott, 2017b Figure 1.
Abbott (2017b), outlines in his 28-year case study of gambling and gambling harm in New Zealand, participation in different gambling activities. In 1985, lotteries and informal raffles were the most popular form of gambling, with just over 70% of adults reporting past 12 months participation. Around a quarter of adults bet on horse or dog races and smaller percentages made bets with friends and workmates, played card games for money, took part in informal fundraising ‘casino’ evenings and played housie (bingo). Within a few years of their introduction, in 1990, Lotto became the most popular gambling activity, followed by Instant Kiwi. Non-casino EGMs ranked fourth after raffles and lotteries (Department of Internal Affairs, 2007) (see Figure 2).
Figure 2: Past year gambling participation by gambling activity (1985 - 2012)
21New Zealand National Gambling Study: Wave 4 (2015)Provider No: 467589, Agreement No: 349827/00Auckland University of Technology, Gambling and Addictions Research Centre Final Report Number 6, 29 March 2018

Reproduced from Abbott, 2017b Figure 2.From the aforementioned, it is evident that most newly introduced gambling activities were rapidly adopted, with their highest participation rates reached within the first few years. Following that, participation declined, markedly in most cases.
Few gambling activities had regular (weekly or more often) participation rates above 10%. Lotto was the exception, with 35% taking part weekly or more often in 1990 and 1995. It reduced to 30% in 2000, 21% in 2005 and 17% in 2012. In 1990, a couple of years after its introduction, Instant Kiwi participation was 14%. Participation declined in subsequent surveys (10%, 9%, 6% and 3%). Non-casino EGMs and track betting were the only other activities that five percent or more people took part in regularly. Five percent of adults reported regular non-casino EGM participation in 1990. In the next three surveys, three percent reported this frequency of participation and in 2012 it decreased to one percent. A similar pattern was found for track betting with five percent participating regularly in 1985 and subsequent reduced participation (4%, 3%, 2%, 3% and 1%) (Abbott et al., 2014a, Department of Internal Affairs, 2007).
The 1990 and 1999 national gambling and problem gambling surveys also provide gambling participation findings that can be compared with NGS findings. However, caution is required when making these comparisons because the surveys used different survey designs (face-to-face versus telephone landline recruitment and interviewing), and in the 1990 and 1999 surveys some gambling questions had a six month rather than a 12 month time-frame.
In the 1990 and 1999 surveys, participants were asked if they had ever taken part in any of a long list of gambling activities. The great majority of adults (95% and 94% respectively) said they had. This question was also asked in 2012. In this survey, 86% said they had gambled at some time. Past six months participation in one or more gambling activities was 90% in 1990 and 86% in 1999. The corresponding past 12 months estimates from the 1990 and 2000 DIA surveys were 90% and 87%. These very similar findings from independent surveys using different methodologies increases confidence in their validity.
22New Zealand National Gambling Study: Wave 4 (2015)Provider No: 467589, Agreement No: 349827/00Auckland University of Technology, Gambling and Addictions Research Centre Final Report Number 6, 29 March 2018

The national gambling and problem gambling surveys also assessed regular participation and grouped gambling participants into three groups - regular continuous gamblers, regular non-continuous gamblers and infrequent gamblers. Regular continuous gamblers took part in one or more activities such as EGMs and sport or track betting on a weekly or more frequent basis. Regular non-continuous gamblers took part this often in Lotto and/or other activities where winnings cannot be frequently ‘reinvested’. In both 1990 and 1999, 30% of adults were estimated to be regular non-continuous gamblers. This nearly halved to 16% in 2012. In 1990 the estimate for regular continuous gamblers was 18%. This reduced to 10% in 1999 and six percent in 2012, a third of what it was 22 years previously.
Other national studies, additional to the DIA and national gambling and problem gambling surveys, included questions on gambling participation. This includes a survey series conducted by the Health Sponsorship Council/Health Promotion Agency (Health and Lifestyles Survey biennially since 2006/07) and the Ministry of Health (New Zealand Health Surveys 2002/3, 2006/7 and 2011/12). Major findings from these studies are reported in Abbott et al. (2014a), Thimasarn-Anwar et al. (2017) and Rossen (2015). Participation rates are generally lower in these surveys than in the studies considered above. This is especially the case with the New Zealand Health Surveys (NZHS). For example, the past year gambling participation rate in the 2011/12 NZHS was 52%, compared to 80% in the 2012 NGS. Both surveys were conducted face-to-face but differed in that the NZHS was presented as a health rather than gambling study and did not include a full list of gambling activities. While the NZHS undoubtedly under-estimated gambling participation, both the NZHS and Health Sponsorship Council series found similar trends over time to those noted for the DIA and national gambling and problem gambling studies.
In New Zealand, online access (telephone, internet and interactive television) is provided to Lotteries Commission and New Zealand Racing Board gambling products. Domestic internet provision of other forms of gambling, for example casino table games and EGMs, are prohibited. However, locals are permitted to access online gambling of this type offered by offshore providers. In 2012, around one percent of adults accessed overseas internet gambling sites. Larger numbers accessed local Lotteries Commission and Racing Board gambling activities, for example, five percent used the internet to purchase Lotto tickets during the past 12 months. As with Lotto, where activities were available both on- and off-line, substantially more accessed them off-line and relatively few people only accessed activities online (Abbott et al., 2014a).
As mentioned, the NGS also examined online participation in gambling-type games not for money. In 2012, 17% of adults participated in activities of this type during the past 12 months, substantially more than participated in gambling activities online (Abbott et al., 2014a). Approximately half of these people (8% of adults) said they did so weekly or more often. This compares with 22% of adults who participated in a gambling activity on a weekly basis. Males, younger people and Māori were among the groups with higher levels of participation in gambling-type games on-line.
Problem gambling
The lifetime SOGS-R was included in the NGS to enable comparison with findings from the 1990 and 1999 gambling and problem gambling studies. The current SOGS-R was not included in the NGS. While inclusion of this measure would have enabled comparison with the earlier past six month prevalence findings, most recent general population studies, including all New Zealand surveys during the past decade, have used the PGSI.
23New Zealand National Gambling Study: Wave 4 (2015)Provider No: 467589, Agreement No: 349827/00Auckland University of Technology, Gambling and Addictions Research Centre Final Report Number 6, 29 March 2018

The 1990 national gambling and problem gambling study estimated that 2.7% of adults were lifetime probable pathological gamblers and 4.3% were lifetime problem gamblers. The corresponding 1999 lifetime estimates were 1.0% and 1.9%, substantially lower than nine years previously. The 1999 current probable pathological and problem gambling estimates (0.5%, 0.8%) were also markedly lower than their earlier 1990 counterparts (1.2%, 2.1%) (Abbott, 2001; Abbott & Volberg, 1991, 1996, 2000).
The 2012 NGS lifetime probable pathological and problem gambling estimates were 2.1% and 2.4%, respectively (Abbott et al., 2014b). While the 1999 and 2012 problem gambling confidence intervals overlap this is not the case for probable pathological gambling, suggesting that there may have been an increase in prevalence from 1999 to 2012. However, as mentioned, while the three surveys are similar in a number of ways, they differed in some respects. Notably the NGS used face-to-face residential recruitment and interviews, whereas the earlier studies used telephone recruitment and interviews. The formula developed by Williams et al. (2012a) was used to adjust for these methodological differences. With this adjustment, the 2012 and 1999 lifetime probable pathological and problem gambling estimates do not differ (Abbott et al., 2014b).
The 2012 NGS PGSI past 12 months problem gambling prevalence estimate was 0.6%. The moderate-risk and low-risk estimates were 1.7% and 4.9%, respectively (Abbott et al., 2014b). These are similar to problem (0.7%) and moderate-risk (2.4%) estimates from the 2010 Health and Lifestyles Survey (Health Sponsorship Council, 2012). The 2011/12 NZHS problem and moderate-risk gambling estimates were lower (0.2% and 1.0%) (Rossen, 2015). When the Williams et al. (2012a) formula was applied, the standardised rates were similar across the three studies. The earlier NZHS 2006/7 problem and moderate risk estimates were 0.5% and 1.4% (Ministry of Health, 2009). There was no significant difference between these and the corresponding 2011/12 NZHS estimates (Rossen, 2015).
Considering findings from all of the New Zealand studies, it appears that problem gambling prevalence, within the probable pathological, problem and moderate-risk range, decreased during the 1990s and subsequently plateaued. As gambling availability increased during the 1990s, the reductions both in gambling participation and problem gambling prevalence are consistent with the adaptation hypothesis. Reductions in gambling participation continued during the 2000s. This included regular participation in continuous gambling forms, for example, casino and non-casino EGMs and track betting. It also included a substantial reduction in the proportion of people who took part in multiple gambling activities. Participation in multiple activities is also associated with problem gambling (Abbott et al., 2014b, 2016a). These participation reductions are in keeping with the adaptation hypothesis. The finding that problem gambling prevalence rates did not change since 1990, however, is not consistent with adaptation. Neither is it consistent with the availability and total distribution hypotheses.
The post-1999 New Zealand findings are almost identical to patterns mentioned earlier for Sweden and Victoria (Abbott et al., 2014c, 2016b). All jurisdictions experienced substantial reductions in gambling participation and this was most evident for youth and young adults. They differed, however, in that in New Zealand there was no change in young adult problem gambling prevalence rates, whereas in Sweden and Victoria prevalence increased in this population sector. From Calado and Griffiths’ (2016) review it appears that decreased participation and a levelling in problem prevalence has occurred across multiple jurisdictions. More recent studies have obtained similar results (Armstrong, Thomas & Abbott, 2017; Conolly et al., 2017; Davidson, Rodgers, Taylor-Rodgers, Suomi, & Lucas, 2015; Kairouz, Paradis & Monson, 2016; Welte, Barnes, Tidwell, Hoffman & Wieczorek, 2015). An Icelandic study is an exception (Olason, Hayer, Brosowski & Meyer, 2015), whereby national
24New Zealand National Gambling Study: Wave 4 (2015)Provider No: 467589, Agreement No: 349827/00Auckland University of Technology, Gambling and Addictions Research Centre Final Report Number 6, 29 March 2018

surveys, using the same methodology, were conducted in 2005, 2007 and 2011. Both gambling participation and problem gambling increased from 2007 to 2011. The authors attributed this, and some other study findings, to the serious financial crisis and recession that followed bankruptcy of the major Icelandic banks in 2008. Interestingly, while participation increased across most gambling forms, EGM participation reduced. They concluded that the increase in problem gambling was most probably a consequence of a substantial rise in card and internet gambling among young men (Olason, Hayer, Brosowski & Meyer, 2015).
The findings discussed in the preceding paragraph illustrate the importance of considering different population sectors. They also indicate that contextual factors additional to gambling availability contribute to gambling participation and gambling-related harm. Consideration of these non-gambling factors is necessary to understand the changing epidemiology of problem gambling including the recent apparent disconnect between participation and problem gambling prevalence. While cross-sectional surveys provide useful information, prospective studies are required to more fully explain these, and related, matters.
Although many factors are associated with problem gambling prevalence, it is only recently that investigation has extended to identifying factors that predict problem gambling onset (incidence), remission/recovery and relapse. As mentioned, a large international body of research, predominantly cross-sectional but increasingly prospective, has found that gambling participation measures are most strongly implicated (Abbott et al., 2014b, 2015b, 2016a; el-Guebaly et al., 2015; Williams et al., 2015). Frequent participation in continuous gambling activities that involve an element of skill or perceived skill is particularly strongly associated with problem gambling onset, relapse and prevalence. In the NGS, while participation in all gambling activities predicted the onset of at-risk and problem gambling 12 months later, some activities had particularly strong associations, namely EGMs, casino table games, housie (bingo) and betting on horse or dog races (Abbott et al., 2015b). Other predictors include taking part in multiple gambling activities, high gambling expenditure, starting gambling at a young age and experiencing an early big win (Abbott et al., 2015b; el-Guebaly et al., 2015; Williams et al., 2015). Gambling being a favoured leisure activity, membership of a gambling rewards programme, and having friends or family members who are regular and/or problem gamblers were additional gambling risk factors.
In all New Zealand gambling surveys, including the initial 1990 national study and 2012 NGS baseline survey, Māori and Pacific people had much higher problem gambling prevalence rates than people of other ethnicities (Abbott et al., 2014b). Males, young adults, people who lack formal educational qualifications, unemployed people, people living in high deprivation neighbourhoods, and people belonging to non-Christian religions or non-traditional Christian churches also had higher risk. Males, young adults, low-income and non-married people are almost universally found to have elevated problem gambling prevalence rates (Abbott et al., 2014b, 2015b; Calado & Griffiths, 2016). As in New Zealand, a number of studies have found some ethnic and indigenous minority groups to have high risk. Some of these high-risk groups have high gambling participation rates, for example, Māori in New Zealand. Others however, have low or very low rates. In New Zealand this includes young adults, Pacific people, people from religions other than Christian, and members of non-traditional Christian churches.
Many of the high risk population groups reside disproportionately in high deprivation neighbourhoods. These neighbourhoods typically have high concentrations of gambling venues and outlets. In New Zealand this includes EGMs in pubs and clubs, and track and sports betting venues (TABs) (Allen+Clarke, 2015). Living in close proximity to gambling venues has been shown to be associated with higher levels of problem gambling (Ministry of Health, 2008). Most of the high risk groups contain proportionately more people who are
25New Zealand National Gambling Study: Wave 4 (2015)Provider No: 467589, Agreement No: 349827/00Auckland University of Technology, Gambling and Addictions Research Centre Final Report Number 6, 29 March 2018

disadvantaged in various ways. As mentioned, many people in some of these groups also have low levels of gambling participation. This partly reflects limited prior gambling experience. It seems likely that heightened vulnerability and low prior gambling experience, combined with high exposure to hazardous forms of gambling, contributes to elevated rates of problem gambling in these groups. This may somewhat explain the persistence of problem gambling disparities and the plateauing of problem gambling prevalence rates when gambling participation reduces.
During the past decade there have been substantial demographic changes in New Zealand. Overall, the population has grown. Additionally, it is aging and the proportions of Māori, Pacific and Asian people are increasing. Rates of immigration are high and many migrants, for example Asian and Pacific people, come from countries where EGMs and other continuous forms of gambling are prohibited or not widely available. The availability hypothesis predicts that these groups will have elevated risk for problem gambling because of the recent exposure. As mentioned, Pacific adults have long had high problem gambling rates in New Zealand. In the NGS 2012 baseline survey, while Asian adults did not have a significantly elevated problem gambling prevalence rate, they did have a higher combined problem and moderate-risk rate (Abbott et al., 2014b). Additionally, in the 12 month follow-up survey, Asian ethnicity significantly predicted the onset (incidence) of problem and moderate-risk gambling (Abbott et al., 2015b). Māori and Pacific adults also had high incidence rates, as did migrants compared to New Zealand born adults. Increases in the proportions of these, and some other groups, in the population may contribute to problem gambling plateauing in the adult population as a whole. This possibility could be assessed in future studies by using both standardised and unstandardized rates.
As discussed, since 1999 overall rates of problem and at-risk gambling have probably not changed in New Zealand. However, because population growth has been strong, the total number of problem gamblers and people experiencing lower levels of harm has increased. Most gambling and problem gambling surveys focus on rates and fail to report or discuss absolute numbers (Armstrong, Thomas & Abbott, 2017). As mentioned, during the past 15 to 20 years, participation rates have decreased in many jurisdictions and problem gambling rates have typically declined or plateaued. Focusing on rates can give a misleading impression of changes over time, and the extent of gambling-related harm in the population. In comparing two national Australian surveys conducted over a decade apart, it was found that national gambling participation declined by a fifth (Armstrong, Thomas & Abbott, 2017). While this is a substantial reduction, when adjusted for population growth, there was no change in the total number of people who gambled. In addition, while there was a decrease in per capita gambling expenditure, average expenditure for those who participated increased across most gambling activities. This increase was particularly large for EGMs. Thus, while participation rates reduced, those who engaged in more ‘potent’ activities including EGMs did so more intensively. Consequently, they were at elevated risk for problem gambling and other gambling-related harm.
A number of additional factors are involved in problem gambling development. Problem gambling is highly co-morbid with substance use disorders and other behavioural addictions, as well as with mood, anxiety and personality disorders (Petry, 2005; Rash, Weinstock & van Patten, 2016). While relationships between gambling and other mental health disorders are complex, prospective studies have found that substance use, substance use disorders and behavioural addictions are robust predictors of problem gambling onset (Afifi, Nicholsol, Martins & Sareen, 2016; Bruneau et al., 2016; el-Guebaly et al., 2015; Parhami, Mojtabai, Rosenthal, Afifi & Fong, 2014; Williams et al., 2015). Other factors implicated in problem development include psychological distress, recent major life events, childhood negative experience including trauma and abuse, low intelligence, and cognitive distortions regarding
26New Zealand National Gambling Study: Wave 4 (2015)Provider No: 467589, Agreement No: 349827/00Auckland University of Technology, Gambling and Addictions Research Centre Final Report Number 6, 29 March 2018

gambling (Leonard & Williams, 2016). Genetic and molecular genetic research indicate that there is also a substantial heritable contribution to problem gambling. The links between alcohol use and gambling disorders appear to be partially attributable to genes that influence both disorders. Additionally, neurobiological, neurocognitive and cognitive research has identified cognitive deficits and other characteristics, as well as multiple neurotransmitter systems that appear to underlie emotional, cognitive and behavioural aspects of problem gambling (Hodgins, Stea & Grant, 2011).
The findings from the first three NGS survey waves are generally consistent with the above findings. In addition to the various gambling participation and sociodemographic factors implicated in the development of problem and at-risk gambling, risk factors remaining in multiple regression analyses included major life events, moderate and high psychological distress, lower quality of life and alcohol, tobacco and other drug use and misuse (Abbott et al., 2016a).
Problem gambling prevalence is determined by incidence (the inflow of first time and relapsing problem gamblers) and the duration of problems. Duration is determined by outflow, through recovery, remission, migration and death. From the NGS and similar adult general population prospective studies conducted in other countries, it is known that over time spans of a few years problem gambling prevalence rates usually remain much the same. However, typically, as in the NGS (Abbott et al., 2015b; 2016a), in any given year a substantial number of people move out of the problem gambling category and are replaced by a similar proportion of ‘new’ problem gamblers. From 2012 to 2013, 0.28% of New Zealand adults became problem gamblers and 1.1% became moderate-risk gamblers (Abbott et al., 2015b). These are similar to findings from the 2013-2014 NGS wave and Swedish and Victorian studies. This means that about half of problem gamblers and two-thirds to three-quarters of moderate-risk gamblers are people who moved into these categories during the past 12 months.
As mentioned, ‘new’ problem gamblers include both first time cases and people who had problems in the past and are relapsing. The relative proportions of novice and relapse cases can be expected to vary across jurisdictions and sociodemographic groups within jurisdictions, as well as over time. Lifetime measures of problem gambling are known to under-detect past problems (Abbott et al., 2004a, 2004b). Consequently in New Zealand, as well as in Sweden and Victoria, as many as two-thirds of problem gamblers may actually be relapsing (Abbott et al., 2016a). This high rate of relapse was unexpected. It may be a major contributor to the plateauing in problem gambling prevalence rates that has been a notable feature in jurisdictions with mature gambling markets. In the prospective studies just mentioned, of the many predictors of past 12 months problem gambling onset, by far the strongest was having experienced a gambling problem in the past. It seems likely that in these jurisdictions, even though participation rates decrease, further declines in problem gambling and related harm are compromised by an accumulating pool of past problem gamblers who are highly prone to relapse. Additionally, as discussed, these jurisdictions are also likely to include other population sectors that have elevated risk for the development of gambling problems for the first time. This includes vulnerable groups such as those recently exposed to EGMs, casino gambling and continuous gambling forms. While there is some support for these proposals, they should be regarded as tentative pending further exploration and replication.
As mentioned, this report assesses adult general population gambling participation, problem gambling and risky gambling prevalence over the four NGS survey waves, each conducted 12 months apart. This includes examination of EGM expenditure over time. The reason for specifically considering EGMs was the particularly strong association between EGM
27New Zealand National Gambling Study: Wave 4 (2015)Provider No: 467589, Agreement No: 349827/00Auckland University of Technology, Gambling and Addictions Research Centre Final Report Number 6, 29 March 2018

participation and gambling-related harm in New Zealand. Additionally, because the study involves interviews with the same people on a number of occasions, there is major interest in examining transitions at an individual level. This interest includes transitions between gambling participation and gambling risk levels including problem gambling incidence. The study also identifies risk and resiliency factors associated with these transitions. As well as considering factors that predict increased gambling participation and the development of at-risk and problem gambling, it considers predictors of recovery from moderate-risk and problem gambling and relapse.
28New Zealand National Gambling Study: Wave 4 (2015)Provider No: 467589, Agreement No: 349827/00Auckland University of Technology, Gambling and Addictions Research Centre Final Report Number 6, 29 March 2018

3 RESEARCH METHODS
A full description of the research methods used in the National Gambling Study is presented in Report Number 1 (Abbott et al., 2014a). A précis of the research methods is detailed in this chapter.
3.1 Ethics approval
The Health and Disability Ethics Committees granted ethical approval on 3 March 2014 (Reference: NTY/11/04/040/AM03) for the re-contact and re-interview of participants in Wave 3 and Wave 4.
Throughout the research, all participants were allocated a code by the research team to protect their identities, and no personal identifying information has been reported. Participants were informed that taking part in the research was voluntary and that they could withdraw at any time, prior to data reporting.
3.2 Survey instrument
The questionnaire1used for the Wave 4 assessment covered the following areas, the results of which are described in this report:
1. Gambling participation (29 gambling activities)
2. Past gambling and recent gambling behaviour change
3. Problem gambling Problem Gambling Severity Index
The nine-item Problem Gambling Severity Index (PGSI; Ferris & Wynne, 2001) was used to measure severity of gambling problems in a past 12 month time frame.
Help-seeking behaviours Gambling in households
4. Major life events (from checklist of 18 events)
5. Mental health General psychological distress
The Kessler-10 (K-10) questionnaire was included to provide a continuous measure of general psychological distress that is responsive to change over time. The K-10 has been validated internationally. Its brevity and simple response format are attractive features. It also produces a summary measure indicating probability of currently experiencing an anxiety or depressive disorder (Kessler & Mroczek, 1994).
1 Available from the Gambling and Addictions Research Centre, Auckland University of Technology website: www.aut.ac.nz/garc
29New Zealand National Gambling Study: Wave 4 (2015)Provider No: 467589, Agreement No: 349827/00Auckland University of Technology, Gambling and Addictions Research Centre Final Report Number 6, 29 March 2018

Quality of lifeQuality of life was assessed by the WHOQoL-8, an eight item version of a widely used measure. This short form has been used in a number of countries, is robust psychometrically, and overall performance is strongly correlated with scores from the original WHOQoL instrument (Schmidt, Muhlan & Power, 2005).
6. Alcohol use/misuseTo identify hazardous alcohol consumption or active alcohol use disorders (including alcohol abuse or dependence) a brief version (AUDIT-C, three-item scale) of the Alcohol Use Disorders Identification Test (AUDIT) (Saunders et al., 1993) was administered.
7. Substance use/misuse Tobacco Other drugs
8. General health conditions (individual questions)
9. Social connectednessQuestions were based on those used in the Victorian Gambling Study (Victorian Responsible Gambling Foundation, 2011, 2012).
10. New Zealand Individual Deprivation Index (NZiDep)The New Zealand Index of socio-economic deprivation for individuals was used (eight item index) (Salmond, Crampton, King, & Waldegrave, 2006).
11. Demographics.
3.3 Overview of the survey methodology
3.3.1 Baseline (Wave 1 assessment)
Wave 1 survey methodology is detailed in Report Number 1 of the New Zealand National Gambling Study (Abbott et al., 2014a). Main aspects of the survey methodology have been briefly reproduced below.
The survey sampling was at three levels: 1) meshblocks (small areas) were selected, 2) dwellings were selected within each meshblock, and 3) an eligible respondent was selected for an interview from each dwelling.
Random selection procedures were used in all three of these sampling levels to minimise sampling bias. These procedures were used to ensure known, non-zero probabilities of selection for all final respondents.
Interviews were conducted face-to-face with respondents in their homes (dwellings). Interviews were conducted using Computer-Assisted Personal Interviewing (CAPI)
software (i.e. interviewers used laptop computers to administer the interview). The survey had nationwide coverage. The survey was representative of the New Zealand adult population (people aged
18 years or older). All adults were eligible (i.e. gamblers and non-gamblers). The household call pattern, call-backs to households, and the interviewers' approach
was designed to achieve an expected response rate of 65%. Up to seven calls were made to a household to contact the eligible respondent. Household calls were made
30New Zealand National Gambling Study: Wave 4 (2015)Provider No: 467589, Agreement No: 349827/00Auckland University of Technology, Gambling and Addictions Research Centre Final Report Number 6, 29 March 2018

on different days (week days and weekend days) and at different times of the day to maximise the chance of contacting people.
There was no inducement or coercion of respondents. A consent form was signed or approved by respondents before the interview began.
There were 'core' (non-screened) and 'screened' households within each meshblock. Interviews conducted in screened households boosted the number of interviews conducted with Māori, Pacific and Asian respondents.
3.3.2 Follow-up assessments (Wave 2 to Wave 4)
Interviews for the follow-up assessments were conducted 1, 2 and 3 years after the original interview date, or as near to this as was possible. Contact and interviewing of participants followed the process described for Wave 1 with the following differences:
Interviewers re-contacted participants face-to-face (i.e. door-to-door), at the residential address of the participant that was recorded at the previous assessment, except for a small proportion of participants where significant travel was involved to reach the participant's address (usually a rural address). In those cases, interviewers first attempted to telephone the participant to arrange an interview appointment.
Where participants had changed address, interviewers recorded that the participant had moved. Where possible, interviewers established whether the respondent had moved within New Zealand or overseas, and their new address in New Zealand.
When an interviewer was given a new address for a participant within their interviewing area (e.g. when a participant had moved within a city or town), the interviewer then contacted the participant at their new address.
Interviewers made up to five calls in total (i.e. four call-backs) door-to-door. A small koha/recompense was given to participants on completion of the follow-up
assessments ($20 in Wave 2, $40 in Wave 3 and Wave 4).
3.4 Survey population
3.4.1 Sample size
From March to October 2012 (Wave 1), a national sample of 6,251 randomly selected adults who were living in private households was interviewed face-to-face. The response rate was 64% and the sample was weighted to allow generalisation of the findings to the New Zealand adult population. From March to November 2013 (Wave 2), 3,745 participants were re-contacted and re-interviewed. Attempts were only made to re-contact 5,266 of the original 6,251 participants due to budgetary constraints; a 71% response rate was achieved. From March to December 2014 (Wave 3), 3,115 participants were re-interviewed (83% response rate). From March to November 2015 (Wave 4), 2,770 participants were re-interviewed, which was a response rate of 89% (Figure 3).
31New Zealand National Gambling Study: Wave 4 (2015)Provider No: 467589, Agreement No: 349827/00Auckland University of Technology, Gambling and Addictions Research Centre Final Report Number 6, 29 March 2018

Figure 3: Number of participants interviewed over time
32New Zealand National Gambling Study: Wave 4 (2015)Provider No: 467589, Agreement No: 349827/00Auckland University of Technology, Gambling and Addictions Research Centre Final Report Number 6, 29 March 2018
Wave 1 (2012)N=6,251
Attempted 12-month follow-up (2013)
n=5,266
Wave 2 (2013) participated
n=3,745
Wave 3 (2014)participated
n=3,115
Wave 4 (2015)participated
n=2,770
Wave 4 did not participate
n=345
Wave 3 did not participate
n=630
Wave 2 did not participaten=1,521
No 12-month follow-up attempt (2013)n=985

3.4.2 Sample composition by gender and age groups
Across all four waves, slightly more than half (about 58%) of the participants were female. In Wave 1, slightly more than one-third (36%) of the participants were aged 18 to 39 years, a similar proportion (38%) were aged 40 to 59 years, and about one-quarter (27%) were aged 60 years or older. By Wave 4, the proportion of participants comprising the youngest group (18 to 39 years) had decreased to less than one-third (29%) due to attrition. Consequently, this lead to an increase in the proportion of the older participants by Wave 4, with almost half (49%) of the participants aged 40 to 59 years, and 22% aged 60 years or older (Table 1).
Table 1: Gender and age of participants in Waves 1 to 4Wave 1 Wave 2 Wave 3 Wave 4
Gender and age n (%) n (%) n (%) n (%)GenderMale 2,642 (42.3) 1,607 (42.9) 1,319 (42.3) 1,170 (42.2)Female 3,609 (57.7) 2,138 (57.1) 1,796 (57.7) 1,600 (57.8)Total 6,251 (100.0
)3,745 (100.0) 3,115 (100.0) 2,770 (100.0
)
Age groups†
18 - 39 years 2,234 (35.7) 1,187 (31.7) 935 (30.0) 804 (29.0)40 - 59 years 2,342 (37.5) 1,502 (40.1) 1,276 (41.0) 1,368 (49.4)60+ years 1,668 (26.7) 1,055 (28.2) 903 (29.0) 597 (21.6)Total 6,244‡ (99.9) 3,74
4‡‡(100.0) 3,114‡‡ (100.0) 2,76
9‡‡(100.0
)† Age recorded in Wave 1 / ‡ Seven respondents refused age questions / ‡‡ One respondent refused age questions
3.4.3 Sample composition by ethnicity
Across all four waves, slightly more than half of the participants identified as European/Other (56% in Wave 1, 62% in Wave 4). Māori comprised 19% in Wave 1 and 17% in Wave 4. The proportion of Pacific and Asian participants was similar with 13% of each ethnicity reported in Wave 1 and about 10% in Wave 4 (Table 2). The ethnicity2 reported by participants in Wave 1 is the ethnic category used for data analyses in all waves.
Table 2: Ethnicity of participants in Waves 1 to 4Wave 1 Wave 2 Wave 3 Wave 4
Ethnic group† n (%) n (%) n (%) n (%)European/Other 3448 (55.7) 2209 (59.6) 1892 (61.4) 1702 (62.0)Māori 1164 (18.8) 656 (17.7) 520 (16.9) 473 (17.2)Pacific 778 (12.6) 439 (11.8) 350 (11.4) 287 (10.5)Asian 798 (12.9) 403 (10.9) 322 (10.4) 282 (10.3)Not reported 63 - 38 - 31 - 26 -Total 6,251 3,745 3,115 2,77
0† Prioritised ethnicity - respondents who identified with more than one of the four broad ethnic groups have been included in only one ethnic group using a prioritisation of Māori then Pacific then Asian then European/Other.
2 Ethnicity is a flexible construct and can change over time; however, for consistency Wave 1 ethnicity has been used for all analyses in this report.
33New Zealand National Gambling Study: Wave 4 (2015)Provider No: 467589, Agreement No: 349827/00Auckland University of Technology, Gambling and Addictions Research Centre Final Report Number 6, 29 March 2018

3.5 Weighting
3.5.1 Weighting
The representativeness of the sample was maintained by weighting. The general principle underlying the analysis of the Wave 4 data was to obtain results representative of the Wave 1 population, rather than the population of Waves 2, 3 or 4. Thus, inference on gambling and other trajectories, particularly inference on transitions, was obtained from the sample as originally constructed. Population-inference was obtained by considering the shifting composition of the population.
To achieve this with the Wave 4 analyses, Wave 1 weights, in order to be representative of the New Zealand population, were based on age group, gender and ethnicity. Wave 2, 3 and 4 weights incorporated Wave 1 weights but also took into consideration differential attrition in the same categories.
An assumption was made that the bulk of the information concerning differential attrition was contained in the age-gender-ethnicity triad. This information was tempered with an investigation of outcome-based attrition, which determined whether further adjustment of the weights based on gambling risk level or aggregated categories was required.
3.5.2 Census benchmark
Factor weights for analyses were based on the 2013 Census3, from Wave 1 to Wave 4.
3.5.3 Attrition-specific weights
Participants in Wave 4 (n=2,770) represented 89% of the participants from Wave 3 (n=3,115), 74% of the participants from Wave 2 (n=3,745) and 44% of the total participants from Wave 1 (n=6,251). Note, however, that due to budgetary constraints, attempt was not made to contact 985 participants from the Wave 1 sample, so the retention rate in Wave 4 from the Wave 1 sample where actual follow-up assessments were made (n=5,266) was 53%. Thus, although the reduction is described by the word ‘attrition’ in the present report, the mechanisms by which Wave 2 was reduced from Wave 1 did not all fall under non-response; therefore, this has affected the Wave 4 attrition from Wave 1.
The application of age, gender and ethnicity-based weights to data from Waves 2, 3 and 4 caused an underestimation of the estimated proportions in the moderate-risk and problem gambler categories. However, small numbers in some of the cells of the four-way table caused the variance inflation factor to reach unacceptable values. For this reason, raking (gender-age-ethnicity in one margin, gambling risk level in the other) was used to produce the final weights. Raking presents the advantage of preserving the marginal weights (Deming & Stephan, 1940).
3 Note that Wave 1 data presented in report numbers 1, 2 and 3 (Abbott et al., 2014a, 2014b, 2015) used 2006 Census data as the 2013 Census data were not available at the time. Therefore, there are some slight differences in numbers and percentages for Wave 1 presented in the previous reports and this report.
34New Zealand National Gambling Study: Wave 4 (2015)Provider No: 467589, Agreement No: 349827/00Auckland University of Technology, Gambling and Addictions Research Centre Final Report Number 6, 29 March 2018

Raking was applied to the Wave 1 sample to preserve the observed proportions in each gambling risk level. It was then applied separately to the Wave 2, 3 and 4 samples to match the weighted marginal frequencies of the Wave 1 sample, in an effort to allay any gambling outcome-based differential attrition.
3.6 Data analysis
3.6.1 Attrition analyses
Attrition analyses were conducted by examining unweighted Wave 1 characteristics (including a category for missing values) with frequencies and proportions, then examining subsequent participation for Waves 2, 3 and 4. The p-values testing independence4 between Wave 4 participants and non-participants are displayed in Appendix 6. The categorical variables concerned are presented in Appendix 1.
3.6.2 Descriptive statistics
Population prevalence trends
Trends across all four waves for each of the categorical variables presented in Appendix 2 are presented, detailing population prevalence estimates and 95% confidence intervals based on the census + attrition weights. Trends for online gambling (in New Zealand and overseas, separately) for the different gambling activities have also been presented. Where calculations have been made using 2013 Census population figures, a value of 3,300,996 was used for the total number of adults aged 18 years and older on Census night.
Data for Māori, Pacific and Asian groups are also presented for each of the categorical variables presented in Appendix 2 (except ethnicity), where statistically feasible (i.e. where numbers allowed).
Gambling risk level trends
Change trends over the four waves for the characteristics of gambling risk level over the past 12 months (non-gambler, non-problem gambler, low-risk gambler, moderate-risk gambler and problem gambler) by the each of the categorical variables presented in Appendix 3 are presented.
Electronic gaming machine expenditure trends
Electronic gaming machine expenditure by venue type and gambling risk level (including 95% confidence intervals) are presented across the four waves.
4 Based on Poisson deviance or Pearson’s χ2 statistic.35
New Zealand National Gambling Study: Wave 4 (2015)Provider No: 467589, Agreement No: 349827/00Auckland University of Technology, Gambling and Addictions Research Centre Final Report Number 6, 29 March 2018

Gambling risk level transitions
Data detailing gambling risk level transitions between Waves 1, 2, 3 and 4 are presented detailing census + attrition-weighted frequencies, along with transition incidence proportions and 95% confidence intervals based on the latter. Data (including incidence proportions and 95% confidence intervals) have also been produced for Māori and Pacific groups.
3.6.3 Inferential statistics
Repeated measures modelling
Mixed effects logistic regression (repeated measures analysis) was undertaken for each of the following comparisons, taking the four waves of data into account:
Gambling participation versus not gambling Low-risk/moderate-risk/problem gambler versus non-problem gambler/non-gambler Moderate-risk/problem gambler versus low-risk/non-problem/non-gambler
These comparisons were examined for each wave using a weighted repeated measures logistic regression, using the census + attrition weights. For each wave, the potential explanatory covariates listed in Appendix 4 were considered for possible inclusion in an explanatory model. In general, the covariates varied over time and were modelled as such; however, some covariates such as the majority of sociodemographic variables were examined for any changes over time and, where no change existed, the Wave 1 (baseline) measures were utilised. Note that the ‘gambling participation versus not gambling’ comparison only included the sociodemographic variables and other outcome variables.
Model selection generally proceeded through several steps. The first step identified candidate variables in bivariate analyses with the outcome variables that had a p-value < 0.2. Models were then developed for each of the major data domains (e.g. demographics, gambling participation, co-existing conditions) using the candidate variables, in order to identify the best subset of variables from that data domain. Then all of the results from the separate domains were considered for an overall model. Each of the model building procedures followed a stepwise selection method tempered by consideration of information criteria. Parsimonious models were favoured and competing models with similar fit but markedly different compositions have all been reported.
The base odds and odds ratio of potential explanatory covariates are reported as point estimates and 95% confidence intervals, accompanied by a p-value for the covariate.
Subgroup analysis for Māori and Pacific groups was examined in an equivalent manner for: Low-risk/moderate-risk/problem gambler versus non-problem gambler/non-gambler Moderate-risk/problem gambler versus low-risk/non-problem/non-gambler.
36New Zealand National Gambling Study: Wave 4 (2015)Provider No: 467589, Agreement No: 349827/00Auckland University of Technology, Gambling and Addictions Research Centre Final Report Number 6, 29 March 2018
3.6.4 Inference on specific transitions
The transitions detailed in Table 3 for recovery from moderate-risk/problem gambling and relapse into moderate-risk/problem gambling were examined in turn using weighted logistic regression and the census + attrition weights. For each transition, the potential explanatory covariates listed in Appendix 4 were considered for possible inclusion in an explanatory model.
Model selection is detailed in section 3.6.3. A key covariate considered for the recovery model was seeking formal assistance, in order to examine the effect of natural recovery. Subgroup analysis for Māori and Pacific groups was also undertaken.
Table 3: Recovery and relapse from Waves 1 to 4
Wave 1 Wave 2 Wave 3 Wave 4 nAdj.
nRecovery Moderate-risk/
problem gamblerModerate-risk/
problem gamblerModerate-risk/
problem gamblerModerate-risk/
problem gambler 17 7.7
Moderate-risk/ problem gambler
Non-gambler/non-problem/low-risk
gambler
Non-gambler/non-problem/low-risk
gambler
Non-gambler/non-problem/low-risk
gambler32 25.5
Relapse Moderate-risk/ problem gambler
Non-gambler/non-problem/low-risk
gambler
Non-gambler/non-problem/low-risk
gambler
Moderate-risk/ problem gambler 2 1.3
Moderate-risk/ problem gambler
Non-gambler/non-problem/low-risk
gambler
Moderate-risk/ problem gambler
Non-gambler/non-problem/low-risk
gambler3 1.0
Moderate-risk/ problem gambler
Non-gambler/non-problem/low-risk
gambler
Moderate-risk/ problem gambler
Moderate-risk/ problem gambler 4 2.4
Adj.n = Data weighted for 2013 Census data (all Waves) and attrition (Waves 2, 3 and 4)
37New Zealand National Gambling Study: Wave 4 (2015)Provider No: 467589, Agreement No: 349827/00Auckland University of Technology, Gambling and Addictions Research Centre Final Report Number 6, 29 March 2018

4 RESULTS
4.1 Attrition analyses
Attrition analyses were conducted to investigate Wave 4 sample differences in sociodemographic and gambling data, compared to Wave 1. Statistically significant differences were noted between the samples for demographics (age, ethnicity and area of residence), problem gambling severity, gambling participation and experiencing major life events.
There was higher attrition (less people retained in the study) for: The youngest age group (18-24 years) and, to a lesser extent, the next youngest age
group (25-34 years) People who had gambled on 10 or more activities in the past year People who had experienced five or more major life events in the past year.
There was greater retention (more people stayed in the study) for: European/Other ethnicity People living in Wellington or Christchurch Non-problem gamblers and problem gamblers.
Due to the significant differential attrition, data analyses were adjusted to account for attrition effects.
Data are presented in Appendix 6.
4.2 Descriptive statistics
This section details sociodemographic characteristics that could have changed over time (i.e. labour force status, household size, annual personal and household incomes, and individual level of deprivation) (section 4.2.1); gambling participation including past year and past month gambling, gambling behaviour and EGM gambling (section 4.2.2); online/remote gambling (section 4.2.3); methods to stop gambling too much and help-seeking behaviour (section 4.2.4); and health status including number of major life events experienced, quality of life, psychological distress, hazardous alcohol consumption, other drug use, and tobacco smoking (section 4.2.5).
4.2.1 Sociodemographic variables that could have changed over time
Data are presented in Appendix 7.
Each year from Wave 2 to Wave 4, participants were re-asked about sociodemographic factors that could have changed in the prior 12 months (i.e. labour force status, household size, annual personal and household incomes, and individual level of deprivation). There were no major differences over time for labour force status and household size.
38New Zealand National Gambling Study: Wave 4 (2015)Provider No: 467589, Agreement No: 349827/00Auckland University of Technology, Gambling and Addictions Research Centre Final Report Number 6, 29 March 2018

The proportion of participants with an annual personal income of $20,000 or less decreased over time from 33% in Wave 1 to 27% in Wave 3, and then stabilised (26% in Wave 4). The proportion of participants earning $60,001 to $80,000 increased from 11% in Wave 1 to 13% in Wave 4. The proportion of households with an annual income of $100,000 or more, increased from 28% in Wave 1 to 32% in Wave 3 and then stabilised (34% in Wave 4).
The percentage of participants without deprivation increased from 57% in Wave 1 to 64% in Wave 3 and then stabilised (67% in Wave 4). Conversely, the percentage of participants with one, two, four or five individual deprivation factors reduced over time.
4.2.2 Gambling participation
Past year and past month gambling
Data are presented in Appendix 8.
Gambling participation was assessed as gambling on a particular activity at least once in the past year, or at least once in the past month.
Past year gambling
In Wave 4, the most popular gambling activities for past year participation were Lotto (56%), raffles or lotteries (45%), Instant Kiwi or other scratch tickets (30%), and bets with friends or workmates (13%). Participation in each of the other gambling activities was less than 10%. These findings were similar to those noted in prior waves. However, some changes in past year gambling participation were apparent over time (Figure 4).
A decrease in participation from Wave 1 to Wave 4 was noted for the following gambling activities:
Card games (4.2% in Wave 1, 2.6% in Wave 4) Text game or competition (2.7% in Wave 1, 1.3% in Wave 4) Lotto (62% in Wave 1, 56% in Wave 4) Keno (2.8% in Wave 1, 1.8% in Wave 4) Overseas casino table games/EGMs (3.6% in Wave 1, 2.2% in Wave 4) New Zealand casino table games/EGMs (9.4% in Wave 1, 6.6% in Wave 4) New Zealand casino EGMs (8.3% in Wave 1, 5.9% in Wave 4) Club EGMs (5.6% in Wave 1, 3.7% in Wave 4) Overall overseas internet gambling (1.7% in Wave 1, 0.7% in Wave 4).
For one gambling activity, the decreased participation was noted in Wave 3 and maintained in Wave 4:
Horse/dog race betting (11.7% in Wave 1, 9.4% in Wave 3, 9.2% in Wave 4).
For other gambling activities, the decreased participation was noted in Wave 2 and maintained in Waves 3 and 4:
Pub EGMs (11.5% in Wave 1, 8.9% in Wave 2, 8.3% in Wave 3, 8.2% in Wave 4) EGMs overall (17.6% in Wave 1, 14.1% in Wave 2, 13.6% in Wave 3, 12.8% in
Wave 4).
39New Zealand National Gambling Study: Wave 4 (2015)Provider No: 467589, Agreement No: 349827/00Auckland University of Technology, Gambling and Addictions Research Centre Final Report Number 6, 29 March 2018

Figure 4: Past year gambling participation by activity across Waves 1 to 4
Past month gambling
In Wave 4, the most popular gambling activities for past month participation were Lotto (30%), Instant Kiwi or other scratch tickets (8.6%), and raffles or lotteries (7.8%). Participation in each of the other gambling activities was less than three percent. These findings were similar to those noted in prior waves. However, some changes in past month gambling participation were apparent over time (Figure 5).
A decrease in participation from Wave 1 to Wave 4 was noted for the following gambling activities:
Lotto (35% in Wave 1, 30% in Wave 4) New Zealand casino table games/EGMs (0.9% in Wave 1, 0.3% in Wave 4) New Zealand casino EGMs (0.9% in Wave 1, 0.3% in Wave 4) Pub EGMS (3.4% in Wave 1, 2.2% in Wave 4).
For some gambling activities, the decreased participation was noted in Wave 3 and maintained in Wave 4:
New Zealand/overseas raffle/lottery (10.9% in Wave 1, 8.7% in Wave 3, 7.8% in Wave 4)
Instant Kiwi/other scratch tickets (12.0% in Wave 1, 9.5% in Wave 3, 8.6% in Wave 4).
40New Zealand National Gambling Study: Wave 4 (2015)Provider No: 467589, Agreement No: 349827/00Auckland University of Technology, Gambling and Addictions Research Centre Final Report Number 6, 29 March 2018

For one gambling activity, the decreased participation was noted in Wave 2 and maintained in Waves 3 and 4:
EGMs overall (4.9% in Wave 1, 3.4% in Wave 2, 3.5% in Wave 3, 3.1% in Wave 4).
Figure 5: Past month gambling participation by activity across Waves 1 to 4
Gambling behaviour
Data are presented in Appendix 9.
In Wave 4, one-quarter of the participants (25%) had not gambled and about a fifth had each participated in one (23%) or two activities (21%). Over half (56%) of the participants were infrequent gamblers. Slightly more than one-quarter (29%) had gambled at least once in the past six months, and just less than one-fifth had gambled either weekly or more often, or monthly or more often (both 19%). The greatest proportions spent between $1 to $10, or $11 to $20 on gambling in a typical month (17% and 14% respectively). The most preferred gambling activity was Lotto (13%). Half (52%) of the participants usually gambled alone. These findings were similar to those noted in prior waves, except for the differences detailed below.
From Wave 1 to Wave 4, there was an increase in the percentage of participants who had not gambled in the past year, from 20% to 25%. From Wave 1 to Wave 2, a slight decrease was noted in the percentage of people participating in seven to nine gambling activities in the past year (3.3% in Wave 1, 2.0% in Wave 2); this reduction was subsequently maintained (2.1% in Wave 3, 1.5% in Wave 4). There was also a decrease in the proportion of participants gambling on four to six activities, from 18% in Wave 1 to 14% in Wave 4.
41New Zealand National Gambling Study: Wave 4 (2015)Provider No: 467589, Agreement No: 349827/00Auckland University of Technology, Gambling and Addictions Research Centre Final Report Number 6, 29 March 2018

There were no differences across the waves for typical monthly gambling expenditure nor with whom a participant gambled.
From Wave 1 to Wave 4, there was a decrease in the percentage of regular non-continuous 5 gamblers from 16% to 14%. This finding was probably due to the reduced percentage of participants whose most preferred gambling activity was Lotto, which decreased from 18% in Wave 1 to 13% in Wave 4. The percentage of regular continuous gamblers was stable from Wave 1 (6.3%) to Wave 4 (5.0%) (Figure 6).
Figure 6: Regular continuous and regular non-continuous gambling, over time
By ethnicity
In Wave 4, gambling participation by Māori participants was similar to that of the total population with one exception. Fewer Māori reported that they did not have a preferred gambling activity (8%) compared with the total population (14%). The proportion had decreased from Wave 1 when it was 13%. Data are presented in Appendix 10.
Gambling participation by Pacific participants in Wave 4, was similar to that of the total population (Appendix 11).
In Wave 4, there were some differences in gambling participation between Asian participants and the total population. A higher proportion of Asian participants had not gambled in the prior 12 months, compared with the total population (41% vs. 25%). Lower proportions of Asian participants had gambled:
On four to six activities (6.4% vs. 14%) Regularly on non-continuous activities (6.0% vs. 14%) At least weekly (8.9% vs. 19%).
5 In this study, Lotto, other lotteries, raffles and making bets with friends or workmates were non-continuous gambling activities. All other gambling activities were continuous. Regular non-continuous gamblers took part weekly or more often in one or more non-continuous gambling activities and did not participate this often in any continuous activity. Regular continuous gamblers took part in one or more continuous activities during the past week. They could also have taken part in non-continuous activities this or less often. Infrequent gamblers participated less than weekly in any particular gambling activity.
42New Zealand National Gambling Study: Wave 4 (2015)Provider No: 467589, Agreement No: 349827/00Auckland University of Technology, Gambling and Addictions Research Centre Final Report Number 6, 29 March 2018

Lower proportions of Asian participants, compared with the total population, preferred to gamble on:
Bets with friends or workmates (1.3% vs. 4.6%) New Zealand or overseas raffles or lotteries (5.5% vs. 11%) Horse or dog race betting (1.3% vs. 4.9%) Non-casino EGMs (1.0% vs. 4.0%).
A lower proportion of Asian participants did not have a preferred gambling activity, compared with the total population (2.7% vs. 7.4%).
Data for Asian participants are presented in Appendix 12.
EGM gambling
Data are presented in Appendix 13.
In each of the four waves, time spent gambling on casino, pub and club EGMs in an average day was assessed. There were no major differences over time. In Wave 4, a higher proportion of participants gambled for more than an hour in a typical day on casino EGMs (39%) than on pub (12%) or club (17%) EGMs.
By ethnicity
In Wave 4, the length of time Māori spent gambling on EGMs was similar to that of the total population. Data are presented in Appendix 14.
Sample sizes were too small for data to be presented on the length of time Pacific or Asian people spent gambling on EGMs.
4.2.3 Online/remote gambling
Data are presented in Table 4.
Across the waves, online/remote gambling occurred to a substantially lower extent than the same gambling via land based means. Lotto and New Zealand Racing Board gambling are both available online in New Zealand. Online Lotto participation was 4.9% in Wave 1, increasing to 8.2% in Wave 3; this then stabilised at 6.9% in Wave 4. Buying Lotto tickets from stores (on site) was more common with 61% of participants reporting this in Wave 1; this decreased to 53% in Wave 4.
New Zealand online/remote Totalisator Agency Board (TAB) gambling prevalence remained stable across the waves. In Wave 4, for horse/dog race betting it was 2.2%, and for sports betting it was 1.5%. Offshore online/remote horse/dog race and sports betting percentages were 0.2% and 0.1% respectively, in Wave 4. The prevalence of land based (venue) betting was higher. In Wave 4, it was 6.1% for horse/dog race betting at a TAB and 1.7% for sports betting at a TAB. The proportion of participants betting on horse/dog races at an event venue decreased from 8.0% in Wave 1 to 6.1% in Wave 2, then stabilised and was 5.7% in Wave 4. A similar trend was noted for sports betting at an event venue with 2.8% in Wave 1, decreasing to 1.6% in Wave 2 then stabilising (1.5% in Wave 4).
43New Zealand National Gambling Study: Wave 4 (2015)Provider No: 467589, Agreement No: 349827/00Auckland University of Technology, Gambling and Addictions Research Centre Final Report Number 6, 29 March 2018

Other online/remote gambling activities occurred to a very low extent - three percent or less. Overall, nine percent of adults participated in New Zealand online gambling activities in Wave 4 (Lotto and New Zealand Racing Board activities). This proportion remained relatively constant from Wave 1. Overall offshore online gambling activities were participated in by 0.7% of the participants in Wave 4. This was a decrease from the Wave 1 prevalence of 1.7% in what appears to be a decreasing trend in offshore online gambling over the four waves (1.7%, 1.2%, 0.9% and 0.7%). Overall offshore gambling prevalence, which includes online and land based gambling, was 5.4% in Wave 4; this was a reduction from 7.6% in Wave 1.
Table 4: Online/remote gambling in Waves 1, 2, 3 and 4
GamblingWave 1 Wave 2 Wave 3 Wave 4
n % (95% CI) n % (95% CI) n % (95% CI) n % (95% CI)Horse/dog race bettingNZ event venue 500 8.0 (7.2, 8.8) 229 6.1 (5.1, 7.1) 167 5.4 (4.4, 6.3) 157 5.7 (4.6, 6.7)NZ TAB on site 481 7.7 (6.9, 8.5) 259 6.9 (5.9, 7.9) 196 6.3 (5.3, 7.2) 169 6.1 (5.0, 7.2)NZ TAB online/ remote 182 2.9 (2.4, 3.5) 98 2.6 (1.9, 3.3) 63 2.0 (1.5, 2.9) 61 2.2 (1.6, 2.8)
Offshore online/ remote 26 0.4 (0.2, 0.6) 13 0.3 (0.1, 0.6) 12 0.4 (0.0, 0.7) 5 0.2 (0.0, 0.4)
Sports bettingNZ event venue 175 2.8 (2.3, 3.3) 58 1.6 (1.1, 2.0) 55 1.8 (1.1, 2.4) 42 1.5 (1.0, 2.0)NZ TAB on site 179 2.9 (2.3, 3.4) 65 1.7 (1.2, 2.3) 51 1.7 (1.1, 2.2) 47 1.7 (1.1, 2.3)NZ TAB online/ remote 116 1.9 (1.4, 2.3) 30 0.8 (0.5, 1.1) 34 1.1 (0.7, 1.5) 42 1.5 (0.9, 2.1)
Offshore online/ remote 22 0.4 (0.2, 0.6) 9 0.3 (0.0, 0.5) 8 0.3 (0.1, 0.4) 2 0.1 (0.0, 0.2)
Poker: CommercialNZ on site 107 1.7 (1.3, 2.1) 44 1.2 (0.7, 1.7) 20 0.6 (0.3, 1.0) 13 0.5 (0.1, 0.8)Offshore online/ remote 28 0.4 (0.2, 0.7) 14 0.4 (0.1, 0.7) 2 0.1 (0.0, 0.2) 5 0.2 (0.0, 0.4)
Raffle/lotteryNZ on site 2929 46.
9 (45.4, 48.3) 1784 47.6 (45.7, 49.5) 148
2 45.7 (43.6, 47.9) 1233 44.5 (42.2, 46.8)
Offshore online/ remote/on site 201 3.2 (2.7, 3.7) 120 3.2 (2.6, 3.8) 96 3.1 (2.4, 3.7) 78 2.8 (2.1, 3.5)
LottoNZ on site 3804 60.
9 (59.4, 62.3) 2175 58.1 (56.2, 60.0) 179
3 57.4 (55.2, 59.6) 1475 53.2 (50.9, 55.6)
NZ online 305 4.9 (4.2, 5.5) 225 6.0 (5.0, 7.0) 256 8.2 (7.0, 9.4) 191 6.9 (5.8, 8.0)KenoNZ on site 145 2.3 (1.9, 2.7) 75 2.0 (1.5, 2.5) 61 1.9 (1.4, 2.5) 39 1.4 (0.9, 1.9)NZ online 43 0.7 (0.4, 0.9) 23 0.6 (0.3, 0.9) 19 0.6 (0.3, 0.9) 12 0.4 (0.2, 0.7)Casino (table gambles/EGMs)NZ on site 590 9.4 (8.5, 10.4) 270 7.2 (6.1, 8.3) 227 7.3 (6.1, 8.5) 182 6.6 (5.3, 7.8)Offshore on site 228 3.7 (3.1, 4.2) 94 2.5 (1.9, 3.1) 83 2.7 (2.0, 3.4) 60 2.2 (1.5, 2.9)Other offshore online gambling# 39 0.6 (0.4, 0.9) 16 0.4 (0.2, 0.7) 10 0.3 (0.1, 0.5) 9 0.3 (0.1, 0.6)
Overall NZ online gambling 503 8.0 (7.2, 8.9) 308 8.2 (7.1, 9.4) 319 10.2 (8.9, 11.5) 251 9.0 (7.8, 10.3)
Overall offshore online gambling 104 1.7 (1.2, 2.1) 46 1.2 (0.8, 1.7) 28 0.9 (0.5, 1.3) 20 0.7 (0.3, 1.1)
Overall offshore gambling (online/on site)
476 7.6 (6.8, 8.4) 238 6.4 (5.4, 7.3) 187 6.0 (5.0, 7.0) 150 5.4 (4.4, 6.4)
Data weighted for 2013 Census data (all waves) and attrition (Waves 2, 3 and 4)# Not previously listed in table. Includes internet casino games and EGMs, events betting, bingo, skill games, virtual sport, and raffles/lotteries (does not include internet poker, New Zealand track betting or sports betting, or New Zealand lottery products)
44New Zealand National Gambling Study: Wave 4 (2015)Provider No: 467589, Agreement No: 349827/00Auckland University of Technology, Gambling and Addictions Research Centre Final Report Number 6, 29 March 2018

4.2.4 Methods used to stop gambling too much and help-seeking behaviour
Data are presented in Table 5.
Participants who had gambled in the past year were asked if they used any methods to stop gambling too much. Overall, across the four waves, percentages were generally similar for each of the methods used. In Wave 4 compared to Wave 1, slightly lower proportions reported setting a money limit for gambling before leaving home (12% in Wave 4, 16% in Wave 1) and separating betting money from other money and stopping gambling when it is used (2.1% in Wave 4, 3.5% in Wave 1). Similar reductions had been noted in Wave 2 but not Wave 3. Thus, these appear to be fluctuations that are probably of little importance.
All participants were asked if they had sought help for gambling in the past year, either from professional gambling treatment services or informal sources (e.g. family, friends and work colleagues). Across all four waves, a very low percentage reported seeking help (0.4% or less).
Table 5: Methods used to stop gambling too much and help-seeking behaviour in Waves 1, 2, 3 and 4
VariableWave 1 Wave 2 Wave 3 Wave 4
n % (95% CI) n % (95% CI) n % (95% CI) n % (95% CI)Methods used to stop gambling too much#
Set a money limit 992 16.0 (14.8, 17.1) 497 13.4 (12.0, 14.7) 379 15.9 (14.2, 17.6) 334 12.1 (10.5, 13.7)Trusted person manages the money 33 0.5 (0.3, 0.7) 17 0.4 (0.2, 0.7) 13 0.5 (0.1, 1.0) 17 0.6 (0.2, 1.1)
Separate betting money and stopping when used
215 3.5 (2.9, 4.0) 83 2.2 (1.7, 2.8) 65 2.7 (1.9, 3.5) 57 2.1 (1.3, 2.8)
Leave ATM/credit cards at home 72 1.2 (0.8, 1.5) 42 1.1 (0.7, 1.5) 27 1.1 (0.5, 1.7) 26 0.9 (0.4, 1.4)
Set a time limit 93 1.5 (1.1, 1.9) 46 1.2 (0.8, 1.7) 29 1.2 (0.7, 1.7) 24 0.9 (0.5, 1.2)Avoid betting/ gambling places 116 1.9 (1.5, 2.2) 57 1.5 (1.1, 2.0) 34 1.4 (0.8, 2.0) 33 1.2 (0.8, 1.6)
Sought help in past yearGambling treatment / informal sources 17 0.3 (0.1, 0.4) 14 0.4 (0.2, 0.6) 10 0.3 (0.1, 0.5) 5 0.2 (0.0, 0.3)
Only gambling treatment services 4 0.1 (0.0, 0.1) 5 0.1 (0.0, 0.3) 3 0.1 (0.0, 0.2) 1 0.0 !
Data weighted for 2013 Census data (all waves) and attrition (Waves 2, 3 and 4)# Calculated for participants who gambled in the last year! Meaningful confidence intervals not calculable due to small sample size
By ethnicity
In Wave 4, methods used to stop gambling too much and help-seeking behaviours were similar between Māori and the total population. There was a decrease in the proportion of Māori who set a money limit for gambling before leaving home in Wave 4 compared to Wave 1 (13% vs. 20%) (Table 6).
Sample sizes were too small for data to be presented on methods used to stop gambling too much and help-seeking behaviours of Pacific and Asian people.
45New Zealand National Gambling Study: Wave 4 (2015)Provider No: 467589, Agreement No: 349827/00Auckland University of Technology, Gambling and Addictions Research Centre Final Report Number 6, 29 March 2018

Table 6: Methods used to stop gambling too much and help-seeking behaviour in Waves 1, 2, 3 and 4 - Māori
VariableWave 1 Wave 2 Wave 3 Wave 4
n % (95% CI) n % (95% CI) n % (95% CI) n % (95% CI)Methods used to stop gambling too much#
Set a money limit 129 19.8 (17.2, 22.5) 69 17.9 (14.5, 21.3) 46 14.3 (10.9, 17.7) 37 12.6 (9.2, 16.1)Trusted person manages the money 8 1.2 (0.5, 1.8) 8 2.0 (0.7, 3.2) 5 1.5 (0.2, 2.8) 4 1.5 (0.1, 2.9)
Separate betting money and stopping when used
28 4.3 (3.0, 5.6) 18 4.6 (2.8, 6.4) 13 4.0 (2.2, 5.9) 14 4.8 (0.1, 9.5)
Leave ATM/credit cards at home 15 2.3 (1.4, 3.3) 12 3.2 (1.5, 4.8) 9 2.6 (0.8, 4.4) 3 1.0 (0.1, 2.0)
Set a time limit 21 3.2 (2.0, 4.5) 10 2.6 (1.1, 4.1) 8 2.6 (1.0, 4.2) 5 1.6 (0.3, 3.0)Avoid betting/ gambling places 17 2.6 (1.7, 3.5) 15 4.0 (2.3, 5.7) 6 1.7 (0.7, 2.8) 4 1.4 (0.2, 2.7)
Sought help in past yearGambling treatment / informal sources 7 1.1 (0.3, 1.9) 5 1.4 (0.3, 2.4) 5 1.5 (0.2, 2.7) 3 0.9 (0.0, 1.9)
Only gambling treatment services 1 0.1 ! 0 0.0 ! 2 0.6 ! 1 0.3 !
Data weighted for 2013 Census data (all waves) and attrition (Waves 2, 3 and 4)# Calculated for participants who gambled in the last year! Meaningful confidence intervals not calculable due to small sample size
4.2.5 Health status
In each wave, participants were asked about major life events experienced in the prior 12 months, quality of life in the past two weeks, psychological distress in the past four weeks, hazardous alcohol consumption and other drug use in the past year, and tobacco use.
Major life events
Data are presented in Appendix 15.
Thirty-two percent of participants in Wave 4 had not experienced any major life events in the prior 12 months, and 29% reported a single event (from a list of 18 possible events). Ten percent of participants reported experiencing four or more major events.
A slightly higher proportion of participants reported that they had not experienced any major life events in Wave 4 (32%) compared with Wave 1 (27%). The proportion of participants who experienced four or more major life events decreased in Wave 2 from Wave 1 (5.7% vs. 7.7%) and then stabilised in Waves 3 and 4 (4.4% and 5.3%, respectively). A similar trend was noted for participants who experienced five or more major life events.
By ethnicity
In Wave 4, there were no differences between Māori or Pacific people and the total population in the proportions experiencing different numbers of major life events (Appendices 16 and 17). However, a higher proportion of Asian participants reported no major life events in the prior 12 months compared with the total population (42% vs. 32%) (Appendix 18).
46New Zealand National Gambling Study: Wave 4 (2015)Provider No: 467589, Agreement No: 349827/00Auckland University of Technology, Gambling and Addictions Research Centre Final Report Number 6, 29 March 2018
A lower proportion of Pacific people had experienced five or more major life events in Wave 4 compared with Wave 1 (35% vs. 8.2%) (Appendix 17).Quality of life
Data are presented in Appendix 15.
Quality of life in the prior two weeks reported by participants was similar across the waves. Ten percent of participants in Wave 4 scored the median level (score of 25); half (50%) were above the median level (scored 26 to 32), and two-fifths (40%) had a quality of life below the median level (scored 0 to 24).
By ethnicity
In Wave 4, there were no differences between Māori or Pacific people and the total population for quality of life (Appendices 16 and 17). However, a lower proportion of Asian participants scored above the median level for quality of life than the total population (40% vs. 50%) (Appendix 18).
Psychological distress
Data are presented in Appendix 15.
The level of general psychological distress in the prior four weeks reported by participants was similar across the waves. In Wave 4, a low level of distress was reported by three-quarters of the participants (75%), with almost one-fifth (18%) reporting a moderate level of distress. Seven percent of participants scored in the high or severe levels of psychological distress.
By ethnicity
In Wave 4, there were no differences between Māori, Pacific or Asian people and the total population for psychological distress (Appendices 16, 17 and 18).
Hazardous alcohol consumption
Data are presented in Appendix 15.
A slight decrease in the proportion of participants reporting hazardous alcohol consumption in the prior 12 months was noted from Wave 1 to Wave 3 (37% and 33%, respectively); the decrease was maintained in Wave 4 (30%). Correspondingly, there was a slight increase in the proportion of participants who did not report hazardous alcohol consumption from Wave 1 to Wave 3 (63% and 67% respectively); this increase was maintained in Wave 4 (70%).
By ethnicity
In Wave 4, there were no differences between Māori or Pacific people and the total population for the proportion consuming alcohol in a hazardous manner (Appendix 16 and
47New Zealand National Gambling Study: Wave 4 (2015)Provider No: 467589, Agreement No: 349827/00Auckland University of Technology, Gambling and Addictions Research Centre Final Report Number 6, 29 March 2018

Appendix 17). However, a substantially lower proportion of Asian participants drank alcohol at a hazardous level compared with the total population (5% vs. 30%) (Appendix 18).
Other drug use
Data are presented in Appendix 15.
From Wave 1 to Wave 2, there was a decrease in the proportion of people who reported using recreational drugs (excluding alcohol and tobacco) in the prior 12 months (15% in Wave 1, 11% in Wave 2); the reduction was maintained in Waves 3 and 4 (11% and 10%, respectively). This finding was principally due to decreased use of cannabis (12% in Wave 1, then 9% in Waves 2 to 4). Correspondingly, there was a slight increase in the proportion of participants who did not use recreational drugs from Wave 1 to Wave 2 (85% in Wave 1, 89% in Wave 2), which was maintained in Waves 3 and 4 (both 90%).
By ethnicity
In Wave 4, a higher percentage of Māori reported using drugs other than alcohol and tobacco, compared with the total population (18% vs. 10%). A similar finding was noted for cannabis use (17% of Māori vs. 9% overall). Correspondingly, a lower proportion of Māori did not use drugs compared with the total population (82% vs. 90%). The percentages of Māori who used drugs/cannabis in Wave 4 were lower than the percentages in Wave 1 (18% vs. 29%). Data are presented in Appendix 16.
There were no differences between Pacific people and the total population for other drug use in Wave 4 (Appendix 17).
In Wave 4, a higher proportion of Asian participants reported that they had not used drugs (other than alcohol and tobacco) in the prior 12 months, compared with the total population (98% vs. 90%). Correspondingly, a lower proportion of Asian participants reported using drugs (2.0% vs. 10%) and cannabis (2.0% vs 9%) in comparison with the total population (Appendix 18).
Tobacco use
Data are presented in Appendix 15.
The proportion of participants who smoked tobacco daily reduced slightly in Wave 4 compared to Wave 1 (13% vs. 16%). Other tobacco use by participants was similar across the waves. In Wave 4, slightly more than half (55%) of the participants had never smoked, and almost one-third (29%) had given up smoking. Two-thirds (66%) of participants reported ever smoking in their lifetime and two-fifths (42%) had ever smoked daily.
By ethnicity
In Wave 4, higher percentages of Māori reported ever having smoked tobacco (80%), smoking more than 100 cigarettes in lifetime (59%) and ever smoking daily (57%) compared with the total population (66%, 45% and 42%, respectively). Correspondingly, in Wave 4, a lower proportion of Māori reported never having smoked compared with the total population
48New Zealand National Gambling Study: Wave 4 (2015)Provider No: 467589, Agreement No: 349827/00Auckland University of Technology, Gambling and Addictions Research Centre Final Report Number 6, 29 March 2018

(41% vs. 55%). There were no major differences in smoking behaviour amongst Māori from Wave 1 to Wave 4. Data are presented in Appendix 16.
In Wave 4, lower percentages of Pacific people reported ever having smoked tobacco compared with the total population (53% vs. 66%). However, in Wave 4 a lower proportion of Pacific people reported having given up smoking compared with the total population (17% vs. 29%). There were no major differences in smoking behaviour amongst Pacific people from Wave 1 to Wave 4. Data are presented in Appendix 17.
In Wave 4 a higher proportion of Asian participants reported that they had never smoked, compared with the total population (83% vs. 55%). Correspondingly, the proportions of Asians who had ever smoked (27%), smoked more than 100 cigarettes in lifetime (17%) and ever smoked daily (17%) were lower than the percentages of the total population reporting these smoking behaviours (66%, 45% and 42%, respectively). Similarly, a lower proportion of Asian participants reported that they had stopped smoking (13%) or reported that they smoked daily (3.5%) compared with the total population (29% and 13%, respectively). Data are presented in Appendix 18.
4.3 Gambling type games not played for money or prizes
This section details past year participation in gambling type games that are not played for money or prizes (section Error: Reference source not found).
Overall in Wave 4, 13% of participants reported playing gambling type games not for money or prizes in the prior 12 months. This was a slight decrease from Wave 1 (16%). Participation in individual games was low, with skill games being the most popular at 7.2% in Wave 4. Participation in fantasy football and internet poker both decreased over time from 4.7% and 4.1% respectively in Wave 1, to 2.6% and 2.3% respectively in Wave 4 (Table 7).
Table 7: Participation in gambling type games not for money or prizes in Waves 1, 2, 3 and 4
ActivityWave 1 Wave 2 Wave 3 Wave 4
n % (95% CI) n % (95% CI) n % (95% CI) n % (95% CI)Fantasy football 296 4.7 (4.0, 5.5) 143 3.8 (3.0, 4.6) 88 2.8 (2.0, 3.6) 71 2.6 (1.8, 3.3)Internet poker 253 4.1 (3.4, 4.7) 140 3.7 (2.8, 4.7) 103 3.3 (2.4, 4.2) 63 2.3 (1.5, 3.0)Online casino games 119 1.9 (1.5, 2.3) 62 1.7 (1.0, 2.3) 52 1.7 (1.0, 2.3) 42 1.5 (0.8, 2.2)
Internet bingo 54 0.9 (0.6, 1.1) 29 0.8 (0.5, 1.1) 40 1.3 (0.9, 1.7) 23 0.8 (0.5, 1.2)Skill games 547 8.7 (7.9, 9.6) 375 10.0 (8.7, 11.3) 288 9.2 (8.0, 10.5) 199 7.2 (6.0, 8.3)Other 41 0.7 (0.4, 0.9) 33 0.9 (0.5, 1.2) 34 1.1 (0.6, 1.5) 20 0.7 (0.3, 1.1)Total 1008 16.1 (15.0, 17.3) 625 16.7 (15.1, 18.2) 475 15.2 (13.6, 16.8) 361 13.0 (11.4, 14.6)
Data weighted for 2013 Census data (all waves) and attrition (Waves 2, 3 and 4)Wave 1 N=6,251; Wave 2 N=3,745; Wave 3 N=3,115; Wave 4 N=2,770
By ethnicity
Across all four waves, a higher proportion of Māori participated in gambling types games not for money or prizes in the prior 12 months, compared with European/Other participants. In Wave 4, participation in these games was 21% for Māori, 11% for Pacific participants, 10% for Asian participants and 13% for European/Other participants. Participation decreased for Asian participants in Wave 4 compared with Wave 1 (10% vs. 17%) (Table 8).
49New Zealand National Gambling Study: Wave 4 (2015)Provider No: 467589, Agreement No: 349827/00Auckland University of Technology, Gambling and Addictions Research Centre Final Report Number 6, 29 March 2018

Table 8: Participation in gambling type games not for money or prizes by ethnicity in Waves 1, 2, 3 and 4
EthnicityWave 1 Wave 2 Wave 3 Wave 4
n % (95% CI) n % (95% CI) n % (95% CI) n % (95% CI)Māori 146 22.4 (19.6, 25.1) 93 24.1 (20.1, 28.1) 77 23.6 (18.2, 29.0) 61 20.8 (14.9, 26.6)Pacific 55 17.9 (14.4, 21.3) 32 17.0 (12.9, 21.2) 23 15.1 (10.7, 19.5) 14 11.0 (6.3, 15.6)Asian 107 16.8 (13.8, 19.8) 53 14.4 (10.4, 18.5) 49 16.0 (11.7, 20.2) 27 9.5 (5.8, 13.2)European/Other 687 15.1 (13.6, 16.5) 442 16.0 (14.0, 17.9) 320 13.9 (12.0, 15.7) 258 12.6 (10.7, 14.5)
Data weighted for 2013 Census data (all waves) and attrition (Waves 2, 3 and 4)Wave 1 N=6,251; Wave 2 N=3,745; Wave 3 N=3,115; Wave 4 N=2,770
4.4 EGM expenditure trends
This section details typical per-participant monthly expenditure on casino, pub and club EGM gambling by gambling risk level (section 4.4.1), estimated annual EGM expenditure by gambling risk level (section 4.4.2), and Class 4 (pub and club) monthly expenditure by selected sociodemographic characteristics (section 4.4.3).
4.4.1 Typical monthly EGM expenditure by gambling risk level
Data are presented in Appendix 19.
Overall, there were no changes over time in the typical monthly expenditure6 by EGM gambling type. In Wave 4, it was $51 for casino EGMs, $35 for pub EGMs and $37 for club EGMs.
Typical monthly expenditure on casino EGM gambling in Wave 4 was $107 for moderate-risk/ problem gamblers, $93 for low-risk gamblers and $33 for non-problem gamblers. The difference in expenditure between moderate-risk/problem gamblers and non-problem gamblers was substantial and was apparent from Wave 1 to Wave 4.
A similar finding was noted for monthly expenditure on pub EGM gambling. In Wave 4, expenditure was $92 for moderate-risk/problem gamblers, $45 for low-risk gamblers and $25 for non-problem gamblers. The difference between non-problem and moderate-risk/ problem gamblers was substantial and apparent from Wave 1 to Wave 4.
In Wave 4, monthly expenditure on club EGM gambling was $110 for moderate-risk/problem gamblers, $66 for low-risk gamblers and $22 for non-problem gamblers. However, at some waves, 95% confidence intervals overlapped or were not calculable due to small sample size and non-normal distribution, meaning that the importance of the difference in point estimates is not ascertainable.
When pub and club EGM gambling expenditure were considered together (i.e. Class 4 gambling expenditure), in Wave 4, moderate-risk/problem gamblers spent $117 per month, low-risk gamblers spent $57 and non-problem gamblers spent $28. Expenditure of non-problem and low-risk gamblers were both substantially lower than that of moderate-risk/ problem gamblers from Wave 1 to Wave 4; although there was some overlap of confidence intervals in Wave 4. This is probably due to small sample sizes.
6 Usual expenditure in a typical month.50
New Zealand National Gambling Study: Wave 4 (2015)Provider No: 467589, Agreement No: 349827/00Auckland University of Technology, Gambling and Addictions Research Centre Final Report Number 6, 29 March 2018

4.4.2 Estimated annual EGM expenditure by gambling risk level
Data are presented in Appendix 20. Overall in Wave 4, estimated EGM expenditure was $286 million ($119 million on casino EGMs, $167 million on pub and club EGMs).
Converting total estimated expenditure into percentages for each type of EGM (casino, pub or club) allows comparison of relative proportions spent on EGM gambling by gambling risk level. Table 9 details expenditure as percentages.
Overall, slightly more than half of EGM expenditure was on pub and club EGMs and slightly less than half on casino EGMs. In Wave 4, this was 58% and 42%, respectively. When examined by gambling risk level, from Wave 1 to Wave 3, a higher proportion of the expenditure was on pub and club EGMs for moderate-risk/problem gamblers (about three-quarters) compared with low-risk and non-problem gamblers (slightly more than half). Conversely, casino expenditure for moderate-risk/problem gamblers was lower (about one-quarter) compared with low-risk and non-problem gamblers (slightly less than half). Of the pub and club gambling, about two-thirds of the expenditure was on pub EGMs for moderate-risk/problem gamblers; it was slightly higher for low-risk and non-problem gamblers at about three-quarters of the expenditure.
Wave 4 was anomalous in that the expenditure proportions for moderate-risk/problem gamblers were similar to that of low-risk gamblers and non-problem gamblers. There is no explanation for this finding.
Table 9: Percentage of total estimated EGM expenditure by gambling risk level and venue in Waves 1, 2, 3 and 4
Gambling risk levelEGM type
Wave 1 Wave 2 Wave 3 Wave 4n % n % n % n %
Non-problem gambler Casino 380 46.2 155 45.6 154 46.8 118 40.4Pub 519 34.3 224 38.6 195 34.0 162 41.5Club 267 19.5 105 15.8 99 19.2 79 18.1Pub+Club 640 53.8 281 54.4 252 53.2 203 59.6Total 834 100.0 383 100.0 334 100.0 265 100.0
Low-risk gambler Casino 77 42.0 46 38.4 32 43.4 21 40.4Pub 103 44.1 72 47.7 37 38.6 45 42.5Club 47 13.9 33 13.9 20 18.0 12 17.1Pub+Club 117 58.0 85 61.6 44 56.6 50 59.6Total 154 100.0 99 100.0 58 100.0 51 100.0
Moderate-risk/problem gambler Casino 60 29.4 25 26.4 12 28.4 24 44.6Pub 93 50.5 36 56.2 28 50.2 20 33.2Club 35 20.1 16 17.3 10 21.3 11 22.2Pub+Club 98 70.6 39 73.6 30 71.6 27 55.4Total 110 100.0 46 99.9 32 99.9 37 100.0
Total Casino 516 39.5 227 37.8 198 42.2 163 41.6Pub 715 41.8 331 46.4 259 38.5 227 39.4Club 349 18.7 154 15.8 129 19.4 103 19.0Pub+Club 855 60.5 406 62.2 326 57.8 279 58.4Total 1097 100.0 528 100.0 424 100.1 353 100.0
Percentages do not always add to 100% due to rounding
51New Zealand National Gambling Study: Wave 4 (2015)Provider No: 467589, Agreement No: 349827/00Auckland University of Technology, Gambling and Addictions Research Centre Final Report Number 6, 29 March 2018

4.4.3 Typical monthly Class 4 expenditure by selected demographics
Data are presented in Appendix 21.
In Wave 4, median typical monthly expenditure on Class 4 (pub and club EGM) gambling was similar between males and females at $18. This was fairly stable across Waves 1 to 4.
Expenditure by age group varied across the waves. In Wave 1 and Wave 3, the lowest median expenditure was by participants aged 18 to 24 years who spent less than $10 per month; however, in Wave 4 participants aged 35 to 44 years spent less than $10. Monthly expenditure for the other age groups across the waves was between $12 and $24. There were no apparent expenditure trends by ethnicity with median monthly amounts varying from $13 to $27.
Recent migrants who had arrived in New Zealand since 2008 had the lowest median monthly expenditure ($5 to $12) on Class 4 gambling in all waves apart from Wave 3 when it was the highest ($20); this latter finding may be an anomaly due to the small sample size. For less recent migrants (arrived before 2008), median expenditure varied between $14 and $19, with similar amounts recorded for New Zealand born participants ($17 to $19).
There were no apparent expenditure trends across the waves by area of residence with median values ranging from $14 to $20, apart from participants residing in Auckland in Wave 4 when the median expenditure was $33.
In all cases the expenditure range was large. Generally, minimum monthly expenditure was $1 to $2. The exception was for recent migrants with minimum expenditure of $5 to $20 across the waves. Maximum monthly expenditure varied up to $4,500. The lowest maximum expenditure was again for recent migrants ($250 in Wave 1).
4.5 Gambling risk trends
This section details Wave 1 to Wave 4 gambling risk trends (section 4.5.1), gambling risk levels by sociodemographic variables (section 4.5.2), gambling risk levels by gambling behaviour (section 4.5.3), gambling risk levels by methods used to stop gambling too much and help-seeking behaviour (section 4.5.5), and gambling risk levels by major life events experienced and psychological distress (section 4.5.6).
4.5.1 Gambling risk
Gambling risk was assessed via the Problem Gambling Severity Index (PGSI) (Table 10). In Wave 4, 0.2% of participants were problem gamblers, 1.8% were moderate-risk gamblers, 4.6% were low-risk gamblers and 68% were non-problem gamblers. Twenty-five percent had not gambled in the prior 12 months. In Wave 4, there was an increase in the proportion of participants who had not gambled in the past year (25%) compared with Wave 1 (20%). There was a slight decrease in the proportion of non-problem gamblers from Wave 1 (73%) to Wave 4 (68%).
52New Zealand National Gambling Study: Wave 4 (2015)Provider No: 467589, Agreement No: 349827/00Auckland University of Technology, Gambling and Addictions Research Centre Final Report Number 6, 29 March 2018

Table 10: Gambling risk in Waves 1, 2, 3 and 4Gambling risk level
Wave 1 Wave 2 Wave 3 Wave 4n % (95% CI) n % (95% CI) n % (95% CI) n % (95% CI)
Non-problem gambler 4535 72.5 (71.2,
73.9) 2633 70.3 (68.6, 72.0) 2186 70.0 (68.0, 72.0) 1890 68.2 (66.0, 70.5)
Low-risk gambler 307 4.9 (4.3, 5.6) 210 5.6 (4.8, 6.5) 155 5.0 (4.1, 5.9) 127 4.6 (3.7, 5.5)
Moderate-risk gambler 108 1.7 (1.4, 2.1) 57 1.5 (1.1, 1.9) 45 1.5 (1.0, 1.9) 51 1.8 (1.2, 2.5)
Problem gambler 40 0.6 (0.4, 0.9) 18 0.5 (0.3, 0.7) 10 0.3 (0.2, 0.5) 6 0.2 (0.1, 0.4)
No gambling in past year 1261 20.2 (19.0,
21.4) 828 22.1 (20.5, 23.7) 727 23.3 (21.3, 25.2) 695 25.1 (23.0, 27.2)
Data weighted for 2013 Census data (all waves) and attrition (Waves 2, 3 and 4)Wave 1 N=6,251; Wave 2 N=3,745; Wave 3 N=3,115; Wave 4 N=2,770
4.5.2 Gambling risk levels by sociodemographic variables
Data are presented in Appendix 22.
In Wave 4, similar proportions of males and females were moderate-risk/problem gamblers (2.2% males, 1.9% females), low-risk gamblers (4.9%, 4.3%) and non-problem gamblers (69%, 67%). Twenty-four percent of males and 26% of females had not gambled in the prior 12 months. There were no substantial changes over the four waves for males. For females, the proportion of non-problem gamblers decreased slightly from Wave 1 to Wave 2 to (73% to 69%) and then stayed at this level (67% in Wave 4). The proportion of females who had not gambled in the prior year increased from Wave 1 to Wave 4 to (20% to 26%).
A higher proportion of participants aged 18 to 39 years were moderate-risk/problem gamblers in Wave 4 (3.2%), compared with those aged 40 to 59 years (1.6%) or 60 years and older (1.0%). A similar pattern was noted for low-risk gamblers (6.4% vs. 4.1% and 2.3%). For non-problem gamblers, the pattern was reversed with a lower proportion amongst the younger age group (60% vs. 77% and 69%). Although in some cases the confidence intervals overlapped in Wave 4, suggesting no difference between the age groups, similar patterns and percentages were noted in Wave 1 where confidence intervals did not overlap, implying a valid difference. The only change noted over time was for participants aged 18 to 39 years; in Wave 4, a higher percentage had not gambled in the prior 12 months compared to Wave 1 (30% vs. 22%).
53New Zealand National Gambling Study: Wave 4 (2015)Provider No: 467589, Agreement No: 349827/00Auckland University of Technology, Gambling and Addictions Research Centre Final Report Number 6, 29 March 2018

When gambling risk was examined by ethnicity in Wave 4, a substantially higher proportion of Māori and Pacific participants were moderate-risk/problem gamblers (8.6% Māori, 7.6% Pacific), compared with European/Other (0.9%) and Asian (1.2%) participants. A higher proportion of Pacific participants were low-risk gamblers (8.8%), compared with European/ Other participants (4.1); 6.4% of Māori and 4.5% of Asian participants were low-risk gamblers. Lower proportions of Pacific (53%) and Asian (54%) participants were non-problem gamblers, compared with European/Other participants (72%); the proportion was 65% for Māori. A greater proportion of Asian participants had not gambled in the prior 12 months (41%), compared with European/Other participants (23%); non-gamblers comprised 20% of Māori and 31% of Pacific people. The only changes over time were for European/Other participants, of whom a higher proportion had not gambled in the prior 12 months in Wave 4, compared with Wave 1 (23% vs. 18%) and a lower proportion were non-problem gamblers in Wave 1, compared with Wave 4 (72% vs. 77%).
In Wave 4, a higher proportion of New Zealand born participants were non-problem gamblers (72%), compared with migrants who had arrived before 2008 (61%) or since 2008 (47%). Migrants were more likely to have not gambled in the prior 12 months (32% before 2008, 49% since 2008) than New Zealand born participants (21%). The only changes over time were for New Zealand born participants. The proportion who had not gambled in the prior 12 months increased from 17% in Wave 1 to 21% in Wave 4, whilst the proportion who were non-problem gamblers slightly decreased from 76% in Wave 1 to 72% in Wave 4.
A lower proportion of unemployed participants were non-problem gamblers in Wave 4 (49%), compared with employed participants (71%); 66% of students/homemakers/retired participants were non-problem gamblers. The latter group were more likely to have not gambled in the prior 12 months (30%) than employed participants (23%); 32% of unemployed participants had not gambled in the prior year. The percentage of non-problem gamblers among employed participants slightly decreased from Wave 1 (75%) to Wave 4 (71%). A larger decrease was noted for unemployed non-problem gamblers, from 65% in Wave 1 reducing to 53% in Wave 3, stabilising in Wave 4 (49%).
In Wave 4, higher proportions of moderate-risk/problem gamblers experienced five or more individual levels of deprivation than moderate-risk/problem gamblers who did not experience any deprivation (11% vs. 1.0%); a similar finding was noted for low-risk gamblers (20% vs. 3.1%). People with no deprivation were more likely to be non-problem gamblers (73%) than people with one or more levels of deprivation (42% to 63%). There were no major differences in proportions of participants who had not gambled in the prior 12 months and levels of deprivation. There were no changes in the findings over time.
4.5.3 Gambling risk levels by gambling behaviour
Data are presented in Appendix 23.
In Wave 4, a higher proportion of moderate-risk/problem gamblers had gambled on seven to nine activities in the prior 12 months (15%), compared to those gambling on one (0.4%), two (1.3%) or three activities (3.4%). This finding was similar across the waves. A comparable trend was noted for low-risk gamblers. For non-problem gamblers, the opposite trend was noted with a lower proportion gambling on seven to nine activities (58% in Wave 4), compared with less activities (81% to 96%). There were no changes in the trends over time. After Wave 1, the sample sizes were too small to meaningfully examine participants who had gambled on 10 or more activities.
54New Zealand National Gambling Study: Wave 4 (2015)Provider No: 467589, Agreement No: 349827/00Auckland University of Technology, Gambling and Addictions Research Centre Final Report Number 6, 29 March 2018

From Waves 1 to 4, a higher proportion of moderate-risk/problem gamblers gambled weekly or more often compared with those who gambled at a lower frequency. In Wave 4, 6.2% of moderate-risk/problem gamblers gambled weekly or more often compared with 2.2% who gambled monthly or more often, 1.6% who gambled six monthly or more often, and 0.4% who gambled at least once in the past year. Higher proportions of low-risk gamblers gambled at least weekly or monthly compared with less often. Conversely, lower proportions of non-problem gamblers gambled at least weekly (83% in Wave 4) or monthly (90%), compared with less often (95% to 98%). There were no changes in the trends over time.
Across the waves, higher proportions of regular continuous gamblers were moderate-risk/ problem gamblers compared with regular non-continuous gamblers and infrequent gamblers. In Wave 4, moderate-risk/problem gamblers comprised 15% of regular continuous gamblers compared with 3.1% of regular non-continuous gamblers and 1.6% of infrequent gamblers. A similar finding was noted for low-risk gamblers. Conversely, a lower proportion of regular continuous gamblers were non-problem gamblers (67% in Wave 4) compared with regular non-continuous gamblers (89%) and infrequent gamblers (94%). There were no changes in the trends over time.Higher monthly gambling expenditure of $101 or greater was more likely for moderate-risk/ problem gamblers and low-risk gamblers, whilst non-problem gamblers were less likely to spend that amount. There were no changes over time although there were some fluctuations in percentages due to very small sample sizes, in some cases.
Time spent gambling on EGMS (casino, pub and club) in an average day was also examined by gambling risk level across the waves. Generally, higher proportions of non-problem gamblers gambled for shorter periods, whilst higher proportions of moderate-risk/problem gamblers gambled for more than 60 minutes. However, it is difficult to determine exact trends within and between the waves due to small sample sizes, in some cases.
There were no differences within and between the waves in regard to with whom participants gambled.
4.5.4 Past year participation in gambling type games not played for money by gambling risk level
In Wave 4, 34% of moderate-risk/problem gamblers had participated in gambling type games not for money or prizes in the prior 12 months; 27% of low-risk gamblers and 13% of non-problem gamblers participated in these types of games. Eight percent of participants who had not gambled in the prior 12 months, participated in the not-for-money games. These percentages remained similar to those in previous waves. Data are presented in Table 11.
Table 11: Participation in gambling type games not for money or prizes by gambling risk level in Waves 1, 2, 3 and 4Gambling risk level
Wave 1 Wave 2 Wave 3 Wave 4n % (95% CI) n % (95% CI) n % (95% CI) n % (95% CI)
Non-problem gambler 683 15.1 (13.8, 16.4) 419.0 15.9 (14.1, 17.8) 345 15.8 (13.9, 17.7) 253 13.4 (11.5, 15.2)
Low-risk gambler 105 34.1 (27.2, 41.1) 57.0 27.3 (20.4, 34.3) 37 23.8 (14.9, 32.8) 34 26.7 (16.6, 36.8)
Moderate-risk/ problem gambler
59 40.1 (31.1, 49.0) 27.0 35.9 (24.6, 47.2) 16 30.0 (19.0, 41.1) 20 34.0 (15.2, 52.9)
No gambling in past year 161 12.8 (10.4, 15.1) 121.0 14.6 (11.2, 18.1) 76 10.5 (7.6, 13.4) 55 7.8 (5.1, 10.6)
Data weighted for 2013 Census data (all waves) and attrition (Waves 2, 3 and 4)Wave 1 N=6,251; Wave 2 N=3,745; Wave 3 N=3,115; Wave 4 N=2,770
55New Zealand National Gambling Study: Wave 4 (2015)Provider No: 467589, Agreement No: 349827/00Auckland University of Technology, Gambling and Addictions Research Centre Final Report Number 6, 29 March 2018
4.5.5 Gambling risk levels by methods used to stop gambling too much and help-seeking behaviour
Data are presented in Appendix 24.
Participants were asked about particular methods they used to stop gambling too much, in relation to their overall gambling. In Wave 4, moderate-risk/problem gamblers (42%) and low-risk gamblers (40%) more often than non-problem gamblers (14%) reported that they set a money limit for gambling. This finding had been noted from Wave 1 and was the most reported method reported by each group (moderate-risk/problem gamblers, low-risk gamblers and non-problem gamblers).
In Wave 4, a greater proportion of moderate-risk/problem gamblers, compared with non-problem gamblers, also separated money for betting and stopped when it was used up (17% vs. 1.8%), left Automated Teller Machine (ATM) and credit cards at home (7.6% vs. 0.7%), and avoided betting/gambling places (6.1% vs. 1.1). Although the 95% confidence intervals overlapped in Wave 4 between the groups, the findings were noted consistently from Wave 1 to Wave 3 without confidence interval overlap. The findings are thus deemed valid and the confidence interval overlaps are considered to be due to the small sample sizes in Wave 4.
The only changes over time were noted for non-problem gamblers, whereby lower percentages reported setting a money limit for gambling in Waves 3 and 4 (both 14%) compared with Wave 1 (18%), and lower percentages reported separating betting money and stopping when it was spent in Waves 2, 3 and 4 (1.9%, 1.5% and 1.8%) compared with Wave 1 (3.4%).
Very few participants had sought help from a professional gambling treatment service in the prior year. In Wave 4, only 1.6% of moderate-risk/problem gamblers had sought help. Although point estimates varied slightly, this finding was similar across the waves. No low-risk gamblers or moderate-risk gamblers sought professional help.
4.5.6 Gambling risk levels by major life events and psychological distress
Data are presented in Appendix 25.
In some waves, the low-risk and combined moderate-risk and problem groups reported more major life events than non-problem gamblers. However, there were no consistent major differences in the number of major life events experienced in the prior 12 months between non-problem gamblers, low-risk gamblers and moderate-risk/problem gamblers. Over time, there were changes in the proportions of non-problem gamblers experiencing different numbers of major life events. The proportion who had not experienced any life event increased in Wave 4 to 31% from 27% in Wave 1. Conversely, the percentage experiencing four events, or five or more events, decreased in Wave 4 (5.0% and 3.5% respectively) compared to Wave 1 (7.2% and 8.9% respectively).
In Wave 4, higher proportions of moderate-risk/problem gamblers reported severe and high psychological distress (10% and 17%, respectively) than non-problem gamblers (0.8% and 4.5%, respectively). Conversely, a lower proportion of moderate-risk/problem gamblers reported a low level of psychological distress (41%) compared with non-problem gamblers (78%). These findings were consistently noted across time from Wave 1.
56New Zealand National Gambling Study: Wave 4 (2015)Provider No: 467589, Agreement No: 349827/00Auckland University of Technology, Gambling and Addictions Research Centre Final Report Number 6, 29 March 2018

4.6 Incidence
Incidence of problem gambling in Wave 4 was calculated from problem gamblers who in Wave 3 were non-gamblers, non-problem gamblers, low-risk gamblers or moderate-risk gamblers. In Wave 4, the incidence rate for problem gambling was 0.10% (CI 0.00, 0.19). Of the people who developed problem gambling, 33.3% (CI 13.3, 53.3) were new problem gamblers and the remaining 67% were people who had previously had problems with gambling (either in Waves 1 or 2, or previously in their lifetime).
Incidence of moderate-risk gambling in Wave 4 was calculated from moderate-risk gamblers who in Wave 3 were non-gamblers, non-problem gamblers or low-risk gamblers. The incidence rate for moderate-risk gambling in Wave 4 is estimated at 1.15% (CI 0.55, 1.76). Of these people, 71.2% (CI 54.1, 88.3) were new moderate-risk gamblers. The estimate for incident cases of moderate-risk and problem gamblers combined was 70.0% (CI 52.8, 87.5).
The incidence rate for low-risk gambling in Wave 4 was calculated from low-risk gamblers who in Wave 3 were non-gamblers or non-problem gamblers. The incidence rate for low-risk gambling in Wave 4 is estimated at 3.25% (CI 2.42, 4.09).
4.7 Gambling risk level transitions
Table 12 details transitions in gambling risk level from Wave 1 to Wave 2, Wave 2 to Wave 3, and Wave 3 to Wave 4. The same data with 95% confidence intervals are presented in Appendix 26. Note that the sample size is very small for some cells, particularly for problem gamblers and, to a lesser extent, moderate-risk gamblers so the results should be considered with caution and should be considered indicative rather than absolute.
57New Zealand National Gambling Study: Wave 4 (2015)Provider No: 467589, Agreement No: 349827/00Auckland University of Technology, Gambling and Addictions Research Centre Final Report Number 6, 29 March 2018

Table 12: Transitions between gambling risk levels between the waves
Transition from
Transition to
Non-gambler
Non-problem gambler
Low-risk gambler
Moderate-risk
gamblerProblem gambler
n % n % n % n % n %Wave 1 to Wave 2Non-gambler 485 64.7 247 33.0 16 2.1 1 0.1 0 0.1Non-problem gambler 327 11.9 2267 82.5 133 4.8 19 0.7 3 0.1Low-risk gambler 13 7.2 97 54.6 46 25.7 21 11.7 1 0.8Moderate-risk gambler 4 6.9 16 30.7 13 25.3 15 27.5 5 9.6Problem gambler - 5 32.6 2 13.6 2 9.7 7 44.1
Wave 2 to Wave 3Non-gambler 439 64.1 231 33.8 13 1.8 2 0.2 0 -Non-problem gambler 275 12.5 1828 83.0 82 3.7 17 0.8 -Low-risk gambler 4 2.4 109 61.7 49 27.8 14 7.7 1 0.5Moderate-risk gambler 2 4.1 15 33.7 11 24.5 12 27.8 4 9.9Problem gambler 6 44.1 3 19.4 0 2.6 1 6.5 4 27.4
Wave 3 to Wave 4Non-gambler 453 70.9 180 28.2 5 0.7 1 0.2 -Non-problem gambler 232 11.9 1609 82.8 85 4.4 16 0.8 1 0.0Low-risk gambler 9 6.4 83 61.1 29 21.7 15 10.8 -Moderate-risk gambler 2 3.5 17 38.6 7 15.4 17 37.6 2 5.0Problem gambler 0 1.8 1 7.5 1 13.1 3 33.8 4 43.9
Data weighted for 2013 Census data and attritionTotal percentages do not always add up to 100% due to rounding
Table key No changeTransition to a higher risk levelTransition to a lower risk level
Stability
Groups where there were no changes across the waves are depicted in yellow in Table 12.
The most stable groups across the waves were non-gamblers and non-problem gamblers with a majority remaining in those categories in all waves. About two-thirds of non-gamblers stayed as non-gamblers and about four-fifths of non-problem gamblers remained as non-problem gamblers.
Problem gamblers were the next most stable group from Wave 1 to Wave 2, and from Wave 3 to Wave 4 with 44% staying in that category. Although the percentage appeared lower from Wave 2 to Wave 3 (27%), this is likely to be an artefact of small sample size as the 95% confidence internals overlapped those from the other waves.
About one-quarter to one-third of low-risk and moderate-risk gamblers remained in those categories across the waves.
Transition to higher risk level
58New Zealand National Gambling Study: Wave 4 (2015)Provider No: 467589, Agreement No: 349827/00Auckland University of Technology, Gambling and Addictions Research Centre Final Report Number 6, 29 March 2018

Transitions to a higher risk level were similar across the waves and are depicted in pink in Table 12.
About one-third (33%) of non-gamblers commenced gambling and became non-problem gamblers. A very small percentage (1% to 2%) transitioned to low-risk gambling, 0.1% to 0.2% to moderate-risk gambling, and 0.1% or less transitioned into problem gambling.
A small proportion (about 5%) of non-problem gamblers transitioned to risky gambling and 0.1% or less transitioned into the problem gambler category.
About 10% of low-risk gamblers became moderate-risk gamblers and 0.8% or less transitioned into problem gambling.
Ten percent of moderate-risk gamblers became problem gamblers from Wave 1 to Wave 2, and from Wave 2 to Wave 3. The point estimate was half that (5%) from Wave 3 to Wave 4; however, confidence intervals were wide and overlapped those of previous years due to very small sample size (n=2) so this finding is likely to be an artefact and there is probably no change from transitions between previous waves.
Transition to lower risk level
Transitions to a lower risk level are depicted in green in Table 12. Although the point estimates appear to indicate some differences/changes over time, an examination of the confidence intervals in Appendix 26 shows that they were wide and overlapped, due to very small sample sizes in some cases, particularly for problem gamblers and, to a lesser extent, moderate-risk gamblers. Therefore, any apparent differences over time are likely to be misleading.
From Wave 1 to Wave 2, no problem gamblers stopped gambling; unlike in Wave 2 to Wave 3, and Wave 3 to Wave 4. The majority of problem gamblers who transitioned to a lower risk level became either moderate-risk (9.7% to 34%), low-risk (2.6% to 14%) or non-problem gamblers (7.5% to 33%).
The majority of moderate-risk gamblers who transitioned to a lower risk level became either low-risk (15% to 25%) or non-problem gamblers (31% to 39%); a few stopped gambling (3.5% to 6.9%).
The majority of low-risk gamblers who transitioned to a lower risk level became non-problem gamblers (55% to 62%), with 2.4% to 7.2% stopping gambling.By ethnicity
Table 13 details transitions in gambling risk level from Wave 1 to Wave 2, Wave 2 to Wave 3, and Wave 3 to Wave 4 by Māori and Pacific ethnicity. The same data with 95% confidence intervals are presented in Appendix 27. Note that the moderate-risk and problem gambling categories have been combined due to very small sample sizes. Despite this, sample size remained very small for some cells, so the results should be considered with caution and should be considered indicative rather than absolute.
Although the point estimates appear to indicate some differences/changes over time or between the ethnicities, an examination of the confidence intervals in Appendix 27 shows that
59New Zealand National Gambling Study: Wave 4 (2015)Provider No: 467589, Agreement No: 349827/00Auckland University of Technology, Gambling and Addictions Research Centre Final Report Number 6, 29 March 2018

they were wide and overlapped, due to very small sample sizes in some cases. Therefore, any apparent differences over time are likely to be misleading.
Stability
As previously mentioned, overall, the most stable groups were non-gamblers and non-problem gamblers, followed by problem gamblers. Overall, people were more likely to transition out of the low-risk and moderate-risk groups.
For the analyses by Māori and Pacific ethnicity, the moderate-risk and problem gambler groups were combined. As with the total population, the low-risk group was the least stable for Māori and Pacific people. However, for both Māori and Pacific people, generally a high percentage of moderate-risk/problem gamblers remained in that category across each wave (51% to 64% of Māori, 40% to 55% of Pacific people).
Transition to higher risk level
As with the total population, the majority of Māori and Pacific non-gamblers who commenced gambling became non-problem gamblers, with a small percentage transitioning to low-risk gambling (1.0% to 4.2% of Māori, 0.6% to 3.1% of Pacific people) or moderate-risk/problem gambling (0.5% to 1.3% of Māori, 0 to 2.0% of Pacific people).
A few non-problem gamblers transitioned to low-risk gambling (5.5% to 9.7% of Māori, 8.3% to 9.9% of Pacific people) and slightly fewer (1.6% to 3.1% of Māori, 1.6% to 5.9% of Pacific people) transitioned into the moderate-risk/problem gambler category.
A substantial minority of low-risk gamblers became moderate-risk/problem gamblers (14% to 24% of Māori, 7% to 20% of Pacific people).
60New Zealand National Gambling Study: Wave 4 (2015)Provider No: 467589, Agreement No: 349827/00Auckland University of Technology, Gambling and Addictions Research Centre Final Report Number 6, 29 March 2018

Table 13: Transitions between gambling risk levels between the waves by Māori and Pacific ethnicity
Transition from
Transition to
Non-gambler
Non-problem gambler
Low-risk gambler
Moderate-risk/ problem gambler
n % n % n % n %Māori Wave 1 to Wave 2Non-gambler 28 47.0 29 48.6 2 3.9 0 0.5Non-problem gambler 35 12.5 210 75.6 27 9.7 6 2.2Low-risk gambler 1 3.0 14 45.2 11 37.7 4 14.0Moderate-risk/problem gambler 0 - 2 10.5 6 27.1 13 62.4
Wave 2 to Wave 3Non-gambler 32 55.1 23 40.2 2 4.2 0 0.6Non-problem gambler 37 17.3 162 75.5 12 5.6 3 1.6Low-risk gambler 0 - 14 41.0 14 39.8 7 19.2Moderate-risk/problem gambler 0 1.9 6 32.4 3 14.4 10 51.3
Wave 3 to Wave 4Non-gambler 39 61.7 23 36.0 1 1.0 1 1.3Non-problem gambler 19 10.3 147 81.2 10 5.5 6 3.1Low-risk gambler 2 5.6 16 54.1 5 16.8 7 23.5Moderate-risk/problem gambler 0 0.8 3 18.3 3 17.2 12 63.8
Pacific Wave 1 to Wave 2Non-gambler 33 70.6 12 25.2 1 2.2 1 2.0Non-problem gambler 19 17.1 77 69.0 11 9.9 4 3.9Low-risk gambler 1 5.1 8 52.2 4 22.3 3 20.4Moderate-risk/problem gambler 0 - 5 50.6 1 9.5 4 39.9
Wave 2 to Wave 3Non-gambler 28 65.5 14 31.5 1 3.1 0 -Non-problem gambler 12 15.3 56 68.9 8 9.9 5 5.9Low-risk gambler 1 3.8 9 65.7 3 23.4 1 7.1Moderate-risk/problem gambler 1 11.4 2 15.1 3 22.9 6 50.5
Wave 3 to Wave 4Non-gambler 26 76.4 7 21.8 0 0.6 0 1.3Non-problem gambler 13 17.7 53 72.4 6 8.3 1 1.6Low-risk gambler 1 9.0 7 55.0 2 17.9 2 18.1Moderate-risk/problem gambler 0 - 2 18.6 3 26.8 6 54.5
Data weighted for 2013 Census data and attritionTotal percentages do not always add up to 100% due to rounding
Table key No changeTransition to a higher risk levelTransition to a lower risk level
61New Zealand National Gambling Study: Wave 4 (2015)Provider No: 467589, Agreement No: 349827/00Auckland University of Technology, Gambling and Addictions Research Centre Final Report Number 6, 29 March 2018

Transition to lower risk level
The majority of Māori and Pacific moderate-risk/problem gamblers who transitioned to a lower risk level became either low-risk (14% to 27% of Māori, 18% to 23% of Pacific people) or non-problem gamblers (11% to 32% of Māori, 15% to 51% of Pacific people). Very few stopped gambling.
The majority of Māori and Pacific low-risk gamblers who transitioned to a lower risk level became non-problem gamblers (41% to 54% of Māori, 52% to 66% of Pacific people). Very few stopped gambling.
4.8 Associations with the chance of being a past year gambler vs. not gambling across Waves 1 to 4
This section details variables associated with the chance of being a past year gambler versus not gambling, taking the four waves into account. Bivariate associations (section 4.8.1) and multiple logistic regression analyses (section 4.8.2) are presented.
4.8.1 Bivariate associations
Statistically significant bivariate associations are presented in Appendix 28.
Variables associated with a higher chance of being a past year gambler
Bivariate associations examined using logistic regression indicated that male gender (vs. female), being aged 40 to 64 years (vs. 18 to 39 years), having a vocational or trade qualification (vs. no formal qualification), and having an annual personal income higher than $20,000 or an annual household income higher than $80,000 (vs. $20,000 or lower, or $40,000 or lower, respectively) were significantly associated with a higher chance of being a past year gambler vs. not gambling.
Additionally, experiencing three or more major life events in the prior 12 months (vs. no major life events), hazardous alcohol consumption (vs. non-hazardous consumption), using cannabis (vs. not using), and daily smoking tobacco or ever having smoked more than 100 cigarettes in lifetime (vs. not smoking in this manner) were significantly associated with a higher chance of being a past year gambler vs. not gambling.
Variables associated with a lower chance of being a past year gambler
Bivariate associations examined using logistic regression indicated that time was associated with gambling participation; participants in Waves 2, 3 and 4 had a lower chance of being a past year gambler than in Wave 1.
Being of Pacific or Asian ethnicity (vs. being of European/Other ethnicity), being affiliated with a religion (vs. not having a religion), being a migrant (vs. being New Zealand born), not being in employment (vs. being employed), and living in a household with five or more people (vs. a household of one or two people) were significantly associated with a lower chance of being a past year gambler vs. not gambling.
62New Zealand National Gambling Study: Wave 4 (2015)Provider No: 467589, Agreement No: 349827/00Auckland University of Technology, Gambling and Addictions Research Centre Final Report Number 6, 29 March 2018

Experiencing a moderate or high level of psychological distress (vs. a low level) and not using illegal drugs (vs. using drugs) were also significantly associated with a lower chance of being a past year gambler vs. not gambling.
4.8.2 Multiple logistic regression
Data are presented in Table 14.
Multiple logistic regression analyses showed that the majority of the variables that were significantly associated with the chance of being a past year gambler vs. not gambling in the bivariate analyses remained associated in the multiple variable analyses. The exceptions were gender, educational level, employment status, annual household income, household size, cannabis usage, daily tobacco smoking, and illegal drug usage, which were no longer associated when confounding variables were accounted for.
Table 14: Multiple logistic regression for associations with chance of being a past year gambler vs. not gambling across Waves 1 to 4
Wave 1 variable Odds ratio (95% CI) p-valueTime
Wave 1 1.00Wave 2 0.74 (0.63, 0.87)Wave 3 0.67 (0.56, 0.80)Wave 4 0.49 (0.41, 0.59) <0.0001
Age group (years)18 - 39 1.0040 - 64 1.97 (1.49, 2.60)65+ 1.06 (0.73, 1.54) <0.0001
Ethnic group (prioritised)Māori 1.11 (0.79, 1.56)Pacific 0.68 (0.43, 1.07)Asian 0.30 (0.18, 0.48)European/Other 1.00 <0.0001
ReligionNo religion 1.00Religion 0.74 (0.56, 0.96) 0.02
Arrival in New ZealandNew Zealand born 1.00Before 2008 0.59 (0.42, 0.82)After 2008 0.13 (0.07, 0.25) <0.0001
Highest qualificationNo formal qualification 1.00Secondary school qualification 0.91 (0.62, 1.34)Vocational or trade qualification 1.37 (0.93, 2.03)University degree or higher 0.79 (0.55, 1.14) 0.01
Annual personal income≤$20,000 1.00$20,001 - $40,000 1.55 (1.26, 1.90)$40,001 - $60,000 2.30 (1.77, 2.99)>$60,000 2.44 (1.84, 3.25) <0.0001
Number of major life events0 1.001 1.02 (0.85, 1.22)2 1.04 (0.84, 1.28)3 1.41 (1.09, 1.82)4+ 1.30 (1.00, 1.68) 0.04
Psychological distress (Kessler-10)Low (Score 0 - 5) 1.00Moderate (Score 6 - 11) 0.71 (0.52, 0.98)High (Score 12 - 19) 0.35 (0.20, 0.61)Severe (Score 20 - 40) 0.83 (0.68, 1.00) 0.0007
63New Zealand National Gambling Study: Wave 4 (2015)Provider No: 467589, Agreement No: 349827/00Auckland University of Technology, Gambling and Addictions Research Centre Final Report Number 6, 29 March 2018

Wave 1 variable Odds ratio (95% CI) p-valueHazardous alcohol consumption (AUDIT-C)
No 1.00Yes 1.73 (1.42, 2.1) <0.0001
Ever smoked more than 100 cigarettes in lifetimeNo 1.00Yes 1.39 (1.12, 1.73) 0.003
Data weighted for 2013 Census data (all Waves) and attrition (Waves 2, 3 and 4)
Variables associated with a higher chance of being a past year gambler
In the multiple logistic regression analyses, participants aged 40 to 64 years had almost twice the odds of being a past year gambler vs. not gambling, than participants aged 18 to 39 years. Participants with an annual personal income higher than $20,000 had higher odds of being a past year gambler vs. not gambling, compared with participants earning $20,000 or less. The odds increased with increasing income bands from 1.55 times higher (for $20,001 to $40,000) to 2.44 times higher (for income greater than $60,000).
Participants who had experienced three or more major life events in the prior 12 months had 1.3 to 1.4 times higher odds of being a past year gambler vs. not gambling, compared with participants who had not experienced any major life events.
Participants who drank alcohol in a hazardous manner had 1.73 times higher odds of being a past year gambler vs. not gambling, than participants who did not have hazardous alcohol consumption. Participants who had ever smoked more than 100 cigarettes in their lifetime had 1.39 times higher odds compared with participants who had not smoked this many cigarettes.
Although it appeared that participants with a vocational or trade qualification had 1.37 times higher odds of being a past year gambler vs. not gambling, compared with participants without any formal qualification, the confidence interval included 1 for each of the different levels of educational attainment. This indicates that the significance is probably between vocational/ trade qualification and a different reference group, in this case, university level education.
Variables associated with a lower chance of being a past year gambler
Time remained associated with the chance of being a past year gambler vs. not gambling in the multiple logistic regression analyses, with participants in Waves 2 and 3 having lower odds of being a past year gambler (odds ratio 0.07), and participants in Wave 4 having lower odds (odds ratio 0.5), than in Wave 1.
Lower odds of being a past year gambler vs. not gambling remained for participants of Asian ethnicity (odds ratio 0.30), compared with participants of European/Other ethnicity.
Being affiliated with a religion remained associated with lower odds of being a past year gambler vs. not gambling (odds ratio 0.74), compared with not having a religion. Migrants had lower odds of being a past year gambler vs. not gambling than participants who were born in New Zealand; this was particularly the case for more recent migrants (arrived in New Zealand after 2008; odds ratio 0.13) than for migrants who arrived in the country before 2008 (odds ratio 0.59).
64New Zealand National Gambling Study: Wave 4 (2015)Provider No: 467589, Agreement No: 349827/00Auckland University of Technology, Gambling and Addictions Research Centre Final Report Number 6, 29 March 2018

Experiencing a moderate or high level of psychological distress remained associated with lower odds of being a past year gambler vs. not gambling in the multiple variable analyses (odds ratio 0.71 and 0.35 times respectively), compared with experiencing a low level of psychological distress.
4.9 Associations with the chance of being a past year low-risk/moderate-risk/ problem gambler vs. being a non-problem gambler/non-gambler across Waves 1 to 4
This section details variables associated with the chance of being a past year low-risk/moderate-risk/problem gambler versus being a non-problem gambler/non-gambler, taking the four waves into account. Bivariate associations (section 4.9.1) are presented, as are multiple logistic regression analyses (section 4.9.2) including for Māori (section 4.9.3) and Pacific people (section 4.9.4).
4.9.1 Bivariate associations
Statistically significant bivariate associations are presented in Appendix 29.
Bivariate associations examined using logistic regression indicated that time (i.e. the year of participation) was not associated with the chance of being a low-risk/moderate-risk/problem gambler.
Variables associated with a higher chance of being a past year low-risk/moderate-risk/problem gambler
Being of Māori, Pacific or Asian ethnicity (vs. being of European/Other ethnicity), being a migrant (vs. being New Zealand born), living in a household with five or more people (vs. a household of one or two people), and having one or more levels of individual deprivation were significantly associated with a higher chance of being a past year low-risk/moderate-risk/ problem gambler versus being a non-problem gambler/non-gambler.
Experiencing three or more major life events in the prior 12 months (vs. no major life events); experiencing moderate, high or severe levels of psychological distress (vs. a low level of psychological distress); hazardous alcohol consumption (vs. non-hazardous consumption); using cannabis (vs. not using); and smoking, daily smoking tobacco or ever having smoked more than 100 cigarettes in lifetime (vs. not smoking in this manner) were also significantly associated with a higher chance of being a past year low-risk/moderate-risk/problem gambler versus being a non-problem gambler/non-gambler.
Additionally, gambling annually or more often, or monthly or more often on most gambling activities (vs. not gambling on the activities at these frequencies) and various other gambling behaviours were associated with a higher chance of being a past year low-risk/moderate-risk/ problem gambler versus being a non-problem gambler/non-gambler.
Variables associated with a lower chance of being a past year low-risk/moderate-risk/problem gambler
65New Zealand National Gambling Study: Wave 4 (2015)Provider No: 467589, Agreement No: 349827/00Auckland University of Technology, Gambling and Addictions Research Centre Final Report Number 6, 29 March 2018

Being aged 40 years or older (vs. 18 to 39 years), having a vocational or trade qualification or being educated to university level (vs. no formal qualification), having an annual personal income between $20,001 and $40,000 or greater than $60,000 (vs. $20,000 or less), and an annual household income higher than $40,000 (vs. $40,000 or less) were significantly associated with a lower chance of being a past year low-risk/moderate-risk/problem gambler versus being a non-problem gambler/non-gambler.
Having a quality of life score equivalent to the median level (vs. below median), and not using illegal drugs (vs. using drugs) were also significantly associated with a lower chance of being a past year low-risk/moderate-risk/problem gambler versus being a non-problem gambler/non-gambler.
Additionally, gambling less frequently than weekly (vs. weekly or more often) was associated with a lower chance of being a past year low-risk/moderate-risk/problem gambler versus being a non-problem gambler/non-gambler.
4.9.2 Multiple logistic regression
Data are presented in Table 15.
Multiple logistic regression analyses showed that ethnicity, annual household income, level of individual deprivation, experiencing major life events, psychological distress, using cannabis, and various gambling participation behaviours remained significantly associated with the chance of being a past year low-risk/moderate-risk/problem gambler versus being a non-problem gambler/non-gambler.
Table 15: Multiple logistic regression for the chance of being a past year low-risk/moderate-risk/problem gambler versus being a non-problem gambler/non-gambler across Waves 1 to 4
Wave 1 variable Odds ratio (95% CI) p-valueEthnic group (prioritised)
Māori 2.92 (1.75, 4.88)Pacific 2.50 (1.48, 4.24)Asian 0.53 (0.36, 0.76)European/Other 1.00 <0.0001
Annual household income≤$40,000 1.00$40,001 - $60,000 0.58 (0.40, 0.84)$60,001 - $80,000 0.79 (0.54, 1.15)$80,001 - $100,000 0.63 (0.42, 0.93)>$100,000 0.56 (0.39, 0.80) 0.006
New Zealand Individual deprivation Index0 1.001 1.43 (1.07, 1.90)2 2.32 (1.60, 3.37)3 2.41 (1.50, 3.87)4+ 3.18 (2.01, 5.02) <.0001
Number of major life events0 1.001 1.11 (0.81, 1.53)2 1.34 (0.95, 1.88)3 1.79 (1.24, 2.60)4+ 1.74 (1.20, 2.52) 0.005
Psychological distress (Kessler-10)Low (Score 0 - 5) 1.00Moderate (Score 6 - 11) 3.26 (2.19, 4.85)High (Score 12 - 19) 6.25 (3.15, 12.4)Severe (Score 20 - 40) 1.75 (1.33, 2.30) <.0001
66New Zealand National Gambling Study: Wave 4 (2015)Provider No: 467589, Agreement No: 349827/00Auckland University of Technology, Gambling and Addictions Research Centre Final Report Number 6, 29 March 2018

Wave 1 variable Odds ratio (95% CI) p-valueCannabis
No 1.00Yes 1.59 (1.10, 2.30) 0.01
Pattern of participationInfrequent gambler 1.00Regular non-continuous gambler 0.49 (0.14, 1.78)Regular continuous gambler 1.47 (0.41, 5.28) <0.0001
Gambling frequencyAt least weekly 1.00At least monthly 0.42 (0.12, 1.49)At least once in past year 0.27 (0.07, 0.98) 0.007
Typical monthly gambling expenditure≤$20 1.00$21 - $50 1.25 (0.90, 1.74)>$50 2.57 (1.81, 3.66) <0.0001
EGMs overall - annualNo 1.00Yes 2.79 (1.90, 4.09) <0.0001
Card games - monthlyNo 1.00Yes 3.64 (1.67, 7.95) 0.001
Sports betting - monthlyNo 1.00Yes 4.87 (2.15, 11.02) 0.0001
Pub EGMs - monthlyNo 1.00Yes 3.89 (2.34, 6.45) <0.0001
Club EGMs - monthlyNo 1.00Yes 2.53 (1.16, 5.54) 0.02
Short-term speculative investments - monthlyNo 1.00Yes 4.86 (1.22, 19.29) 0.02
Gambling-type games not for money - monthlyNo 1.00Yes 1.72 (1.30, 2.29) 0.0002
Time spent playing EGMs in an average day (casino)No time 1.00Up to 15 minutes 0.52 (0.23, 1.15)16 to 30 minutes 1.02 (0.53, 1.95)31 to 60 minutes 0.65 (0.34, 1.23)>60 minutes 2.43 (1.42, 4.18) 0.0006
Time spent playing EGMs in an average day (club)No time 1.00Up to 15 minutes 0.59 (0.26, 1.31)16 to 30 minutes 0.50 (0.25, 1.00)31 to 60 minutes 0.54 (0.26, 1.12)>60 minutes 4.38 (1.74, 11.05) 0.0001
Methods - Setting a dollar limit before leaving homeNo 1.00Yes 1.54 (1.19, 1.99) 0.001
Methods - Getting someone you trust to manage the moneyNo 1.00Yes 5.13 (1.77, 14.88) 0.003
Methods - Separating money for betting from other money and stoppingNo 1.00Yes 2.37 (1.52, 3.71) 0.0001
Methods - Leaving ATM and credit cards at homeNo 1.00Yes 2.38 (1.19, 4.75) 0.01
Methods - Setting a time limitNo 1.00Yes 3.16 (1.65, 6.07) 0.0005
Methods - Avoiding places that have betting or gamblingNo 1.00
67New Zealand National Gambling Study: Wave 4 (2015)Provider No: 467589, Agreement No: 349827/00Auckland University of Technology, Gambling and Addictions Research Centre Final Report Number 6, 29 March 2018

Wave 1 variable Odds ratio (95% CI) p-valueYes 5.46 (3.16, 9.42) <0.0001
Data weighted for 2013 Census data (all Waves) and attrition (Waves 2, 3 and 4)
Variables associated with a higher chance of being a past year low-risk/moderate-risk/problem gambler
Māori and Pacific participants had more than twice the odds of being a past year low-risk/ moderate-risk/problem gambler versus being a non-problem gambler/non-gambler (2.92 and 2.50 times higher, respectively), than European/Other participants.
Participants with one or more individual levels of deprivation had higher odds of being a past year low-risk/moderate-risk/problem gambler versus being a non-problem gambler/non-gambler, compared with participants who did not experience any deprivation. The odds increased with increasing deprivation from 1.43 times higher (for one deprivation level) to 3.18 times higher (for four or more deprivation levels).
Participants who had experienced three or more major life events in the prior 12 months had about 1.8 times higher odds of being a past year low-risk/moderate-risk/problem gambler versus being a non-problem gambler/non-gambler, compared with participants who had not experienced any major life events.
Experiencing moderate, high or severe levels of psychological distress remained associated with higher odds of being a past year low-risk/moderate-risk/problem gambler versus being a non-problem gambler/non-gambler, compared with experiencing a low level of psychological distress. However, the increased risk was not linear at 3.26, 6.25 and 1.75 times for moderate, high and severe levels, respectively.
Using cannabis also remained associated with being a past year low-risk/moderate-risk/problem gambler versus being a non-problem gambler/non-gambler in the multiple logistic regression analyses (1.59 times higher), compared with not using cannabis.
Various gambling participation behaviours remained associated with being a past year low-risk/moderate-risk/problem gambler versus being a non-problem gambler/non-gambler. These included at least annual gambling on EGMs in any venue (2.79 times higher); and at least monthly gambling on card games, sports betting, pub or club EGMs, short-term speculative investments, and playing on gambling-type games not for money (varied from 1.72 to 4.87 times higher), compared with not participating in these activities at least annually or monthly.
Having a typical monthly gambling expenditure of more than $50 was associated with 2.57 times higher odds of being a past year low-risk/moderate-risk/problem gambler versus being a non-problem gambler/non-gambler, than having a monthly expenditure of $20 or less. Participants who gambled on club or casino EGMs for more than 60 minutes in an average day had 4.38 times and 2.43 times higher odds, respectively, than participants who did not gamble on these EGMs.
Various methods for moderating gambling behaviour also remained associated with being a past year low-risk/moderate-risk/problem gambler versus being a non-problem gambler/non-gambler. These were setting a dollar limit before leaving home, getting someone trustworthy to manage the money, separating money for betting from other money and stopping when it is used, leaving ATM and credit cards at home, and avoiding places that have betting or gambling. The odds for increased risk varied from 1.54 to 5.46 times higher.
68New Zealand National Gambling Study: Wave 4 (2015)Provider No: 467589, Agreement No: 349827/00Auckland University of Technology, Gambling and Addictions Research Centre Final Report Number 6, 29 March 2018

Although it appeared that participants who gambled regularly on continuous activities had higher odds for being a past year low-risk/moderate-risk/problem gambler versus being a non-problem gambler/non-gambler, and participants who gambled regularly on non-continuous activities had lower odds, compared with infrequent gamblers, the confidence intervals included 1 for both. This indicates that the significance is probably between these two gambling behaviours and not with the reference group of infrequent gambling.
Variables associated with a lower chance of being a past year low-risk/moderate-risk/problem gambler
Asian participants had half the odds of being a past year low-risk/moderate-risk/problem gambler versus being a non-problem gambler/non-gambler, compared with European/Other participants.
Participants with an annual household income higher than $40,000 (apart from those in the $60,001 to $80,000 bracket) had lower odds of being a past year low-risk/moderate-risk/ problem gambler versus being a non-problem gambler/non-gambler (odds ratio about 0.6), compared with participants with an annual household income of $40,000 or less.
Participants who gambled at least once in the past year had lower odds of being a past year low-risk/moderate-risk/problem gambler versus being a non-problem gambler/non-gambler (odds ratio 0.27), than participants who gambled at least weekly.
4.9.3 Multiple logistic regression - Māori
Data are presented in Table 16.
Multiple logistic regression analyses for Māori showed that there were some similarities, and some differences, from the total population in regard to associations with being a past year low-risk/moderate-risk/problem gambler versus being a non-problem gambler/non-gambler. Using drugs, current tobacco smoking, psychological distress, and various gambling participation behaviours were significantly associated.
Table 16: Multiple logistic regression for the chance of being a past year low-risk/moderate-risk/problem gambler versus being a non-problem gambler/non-gambler across Waves 1 to 4 - Māori
Wave 1 variable Odds ratio (95% CI) p-valueUses drugs
Yes 1.00No 0.63 (0.41, 0.96) 0.03
Psychological distress (Kessler-10)Low (Score 0 - 5) 1.00Moderate (Score 6 - 11) 4.98 (2.82, 8.83)High (Score 12 - 19) 8.79 (3.67, 21.04)Severe (Score 20 - 40) 3.40 (2.18, 5.30) <0.0001
Current tobacco useNon-smoker 1.00Smoker 1.63 (1.11, 2.40) 0.01
Pattern of participationInfrequent gambler 1.00Regular non-continuous gambler 1.34 (0.83, 2.16)Regular continuous gambler 2.68 (1.53, 4.71) 0.01
Typical monthly gambling expenditure≤$20 1.00
69New Zealand National Gambling Study: Wave 4 (2015)Provider No: 467589, Agreement No: 349827/00Auckland University of Technology, Gambling and Addictions Research Centre Final Report Number 6, 29 March 2018

Wave 1 variable Odds ratio (95% CI) p-value$21 - $50 1.63 (0.86, 3.10)>$50 3.21 (1.72, 5.98) 0.001
NZ internet gambling - annualNo 1.00Yes 1.74 (1.01, 2.98) 0.04
Card games - monthlyNo 1.00Yes 5.23 (1.96, 13.91) 0.001
Sports betting - monthlyNo 1.00Yes 2.77 (1.03, 7.41) 0.04
Pub EGMs - monthlyNo 1.00Yes 0.37 (0.19, 0.74) 0.01
Gambling-type games not for money - monthlyNo 1.00Yes 1.69 (1.13, 2.53) 0.01
Time spent playing EGMs in an average day (pub)No time 1.00Up to 15 minutes 1.16 (0.58, 2.32)16 to 30 minutes 1.33 (0.64, 2.79)31 to 60 minutes 2.63 (1.31, 5.30)>60 minutes 5.20 (2.35, 11.51) 0.001
Methods - Separating money for betting from other money and stoppingNo 1.00Yes 2.90 (1.48, 5.68) 0.002
Methods - Leaving ATM and credit cards at homeNo 1.00Yes 4.08 (1.59, 10.48) 0.004
Data weighted for 2013 Census data (all Waves) and attrition (Waves 2, 3 and 4)
Variables associated with a higher chance of being a past year low-risk/moderate-risk/problem gambler
Māori experiencing moderate, high or severe levels of psychological distress had higher odds of being a past year low-risk/moderate-risk/problem gambler versus being a non-problem gambler/non-gambler, compared with Māori who experienced a low level of psychological distress. However, the increased risk was not linear at 4.98, 8.79 and 3.40 times for moderate, high and severe levels, respectively. This finding was similar to that noted for the total population; however, the level of risk (odds ratios) was higher for Māori.
Māori who were current tobacco smokers had 1.63 times higher odds of being a past year low-risk/moderate-risk/problem gambler versus being a non-problem gambler/non-gambler, compared with Māori who were not current smokers. This risk was not found in the multiple logistic regression analyses for the total population.
Various gambling participation behaviours were associated with Māori being past year low-risk/moderate-risk/problem gamblers versus being non-problem gamblers/non-gamblers. These included at least annual New Zealand internet gambling (1.74 times higher); and gambling monthly or more often on card games, sports betting, and playing on gambling-type games not for money (varied from 1.69 to 5.23 times higher), compared with not participating in these activities at least annually or monthly. These findings were similar (though not identical) to those noted for the total population.
Māori who regularly gambled on continuous activities had 2.68 times higher odds of being a past year low-risk/moderate-risk/problem gambler versus being a non-problem gambler/non-
70New Zealand National Gambling Study: Wave 4 (2015)Provider No: 467589, Agreement No: 349827/00Auckland University of Technology, Gambling and Addictions Research Centre Final Report Number 6, 29 March 2018

gambler, than Māori who were infrequent gamblers. This finding was not noted for the total population.
Māori who had a typical monthly gambling expenditure of more than $50 were 3.21 times more likely to be past year low-risk/moderate-risk/problem gamblers versus being non-problem gamblers/non-gamblers, than Māori who had a monthly expenditure of $20 or less. This finding was similar to that noted for the total population. Māori who gambled on pub EGMs for more than 30 minutes in an average day had higher odds of being a past year low-risk/moderate-risk/ problem gambler versus non-problem gambler/non-gambler, than Māori who did not gamble on pub EGMs; the risk increased with increasing time spent gambling on the EGMs, from 2.63 times to 5.20 times. This finding had not been noted for the total population for whom length of time gambling on club EGMs was a risk factor.
Two methods for moderating gambling behaviour were associated with Māori being past year low-risk/moderate-risk/problem gamblers versus being non-problem gamblers/non-gamblers. These were separating money for betting from other money and stopping when it is used, and leaving ATM and credit cards at home (2.90 and 4.08 times higher, respectively). These findings were similar to those noted for the total population; however, more moderating methods were associated with past year low-risk/moderate-risk/problem gambling for the total population.
Variables associated with a lower chance of being a past year low-risk/moderate-risk/problem gambler
Māori who did not use drugs had significantly lower odds (odds ratio 0.63) of being a past year low-risk/moderate-risk/problem gambler versus being a non-problem gambler/non-gambler, than Māori who used drugs. This finding was not noted in the multiple logistic regression analyses for the total population.
Māori who gambled monthly or more often on pub EGMs had lower odds of being a past year low-risk/moderate-risk/problem gambler versus being a non-problem gambler/non-gambler (odds ratio 0.37), than Māori who did not gamble monthly or more often on these EGMs. This finding is the opposite of that noted for the total population who had 3.89 times higher odds, if they gambled monthly or more often on pub EGMs. However, this is likely to be a function of the statistical modelling adjusting for the related factor of time spent gambling on pub EGMs.
4.9.4 Multiple logistic regression - Pacific people
Data are presented in Table 17.
Multiple logistic regression analyses for Pacific people showed that there were some similarities, and some differences, from the total population in regard to associations with being a past year low-risk/moderate-risk/problem gambler versus being a non-problem gambler/non-gambler. Highest educational level, psychological distress, various gambling participation behaviours, and two methods for moderating gambling behaviour were significantly associated with being a past year low-risk/moderate-risk/problem gambler.
71New Zealand National Gambling Study: Wave 4 (2015)Provider No: 467589, Agreement No: 349827/00Auckland University of Technology, Gambling and Addictions Research Centre Final Report Number 6, 29 March 2018

Table 17: Multiple logistic regression for the chance of being a past year low-risk/moderate-risk/ problem gambler versus being a non-problem gambler/non-gambler across Waves 1 to 4 - Pacific people
Wave 1 variable Odds ratio (95% CI) p-valueHighest qualification
No formal qualification 1.00Secondary school qualification 0.51 (0.26, 0.98)Vocational or trade qualification 0.59 (0.29, 1.19)University degree or higher 0.28 (0.13, 0.63) 0.02
Psychological distress (Kessler-10)Low (Score 0 - 5) 1.00Moderate (Score 6 - 11) 2.00 (0.93, 4.28)High (Score 12 - 19) 6.12 (1.82, 20.58)Severe (Score 20 - 40) 1.54 (0.82, 2.87) 0.01
Typical monthly gambling expenditure≤$20 1.00$21 - $50 1.69 (0.82, 3.47)>$50 3.19 (1.62, 6.28) 0.003
Text game or competition - annualNo 1.00Yes 3.87 (1.08, 13.80) 0.04
Housie or bingo - monthlyNo 1.00Yes 3.71 (1.44, 9.59) 0.007
Horse/dog race betting - monthlyNo 1.00Yes 4.27 (1.25, 14.65) 0.02
Time spent playing EGMs in an average day (casino)No time 1.00Up to 15 minutes 0.47 (0.05, 4.92)16 to 30 minutes 1.41 (0.39, 5.15)31 to 60 minutes 1.73 (0.45, 6.61)>60 minutes 4.19 (1.72, 10.16) 0.03
Time spent playing EGMs in an average day (pub)No time 1.00Up to 15 minutes 1.74 (0.49, 6.25)16 to 30 minutes 1.21 (0.47, 3.07)31 to 60 minutes 6.81 (1.71, 27.20)>60 minutes 4.48 (1.08, 18.55) 0.02
Methods - Getting someone you trust to manage the moneyNo 1.00Yes 4.67 (1.05, 20.73) 0.04
Methods - Avoiding places that have betting or gamblingNo 1.00Yes 3.22 (1.35, 7.71) 0.009
Data weighted for 2013 Census data (all Waves) and attrition (Waves 2, 3 and 4)
Variables associated with a higher chance of being a past year low-risk/moderate-risk/problem gambler
Pacific people experiencing high levels of psychological distress had 6.12 times higher odds of being a past year low-risk/moderate-risk/problem gambler versus being a non-problem gambler/non-gambler, compared with Pacific people who experienced a low level of psychological distress. This finding was similar to that noted for the total population; however, for the total population, increased odds for were also noted for participants experiencing mild and severe levels of psychological distress.
Various gambling participation behaviours were associated with Pacific people being past year low-risk/moderate-risk/problem gamblers versus being non-problem gamblers/non-gamblers. These included gambling annually or more often on text games or competitions (3.87 times higher); and gambling monthly or more often on housie/bingo and horse/dog race
72New Zealand National Gambling Study: Wave 4 (2015)Provider No: 467589, Agreement No: 349827/00Auckland University of Technology, Gambling and Addictions Research Centre Final Report Number 6, 29 March 2018

betting (both approximately four times higher), compared with not participating in those activities at least annually or monthly. Gambling on these activities was not associated with being a past year low-risk/moderate-risk/problem gambler for the total population or for Māori.
Pacific people who had a typical monthly gambling expenditure of more than $50 were 3.19 times more likely to be a past year low-risk/moderate-risk/problem gambler versus being a non-problem gambler/non-gambler, than Pacific people who had a monthly expenditure of $20 or less. This finding was similar to that noted for the total population and for Māori. Pacific people who gambled on pub EGMs for more than 30 minutes in an average day, or on casino EGMs for more than 60 minutes, had higher odds of being a past year low-risk/moderate-risk/problem gambler versus being a non-problem gambler/non-gambler, than Pacific people who did not gamble on pub or casino EGMs (four to seven times higher). This finding was not noted for the total population for whom length of time gambling on club EGMs was a risk factor, but was similar to Māori for the risk of gambling on pub EGMs.
Two methods for moderating gambling behaviour were associated with Pacific people being past year low-risk/moderate-risk/problem gamblers versus being non-problem gamblers/non-gamblers. These were getting a trusted person to manage the money, and avoiding places that have betting or gambling (4.67 and 3.22 times higher, respectively). These findings were similar to those noted for the total population; however, more moderating methods were associated for the total population.
Variables associated with a lower chance of being a past year low-risk/moderate-risk/problem gambler
Pacific people whose highest educational achievement was at secondary school or tertiary level had lower odds of being a past year low-risk/moderate-risk/problem gambler versus being a non-problem gambler/non-gambler (odds ratio 0.51 and 0.28, respectively), than Pacific people without any formal qualifications. This finding had not been noted for the total population nor for Māori.
4.10 Associations with the chance of being a past year moderate-risk/problem gambler vs. being a low-risk/non-problem/non-gambler across Waves 1 to 4
This section details variables associated with the chance of being a past year moderate-risk/ problem gambler versus being a low-risk/non-problem/non-gambler, taking the four waves into account. Bivariate associations (section 4.10.1) are presented, as are multiple logistic regression analyses (section 4.10.2) including for Māori (section 4.10.3) and Pacific people (section 4.10.4).
4.10.1 Bivariate associations
Statistically significant bivariate associations are presented in Appendix 30.
Bivariate associations examined using logistic regression indicated that time (i.e. the year of participation) was not associated with the chance of being a moderate-risk/problem gambler.
73New Zealand National Gambling Study: Wave 4 (2015)Provider No: 467589, Agreement No: 349827/00Auckland University of Technology, Gambling and Addictions Research Centre Final Report Number 6, 29 March 2018
Variables associated with a higher chance of being a past year moderate-risk/problem gambler
Being of Māori, Pacific or Asian ethnicity (vs. European/Other ethnicity), being unemployed (vs. being employed), and experiencing one or more levels of individual deprivation (vs. no deprivation) were significantly associated with a higher chance of being a moderate-risk/ problem gambler versus being a low-risk/non-problem/non-gambler.
Experiencing moderate, high or severe levels of psychological distress (vs. a low level of psychological distress); using cannabis (vs. not using); and smoking, or ever having smoked more than 100 cigarettes in lifetime (vs. not smoking in this manner) were also significantly associated with higher likelihood of moderate-risk/problem gambling.
Additionally, gambling annually or more often, or monthly or more often on most gambling activities (vs. not gambling on the activities at these frequencies) and various other gambling behaviours (e.g. Typical monthly expenditure of $50 or more, and gambling on EGMs for longer than an hour in an average day), were associated with a higher chance of being a moderate-risk/problem gambler versus being a low-risk/non-problem/non-gambler.
Variables associated with a lower chance of being a past year moderate-risk/problem gambler
Being aged 40 years or older (vs. 18 to 39 years), having a quality of life at or above the median level (vs. below median); and not using illegal drugs (vs. using drugs) were significantly associated with a lower chance of being a moderate-risk/problem gambler versus being a low-risk/non-problem/non-gambler.
Additionally, gambling less frequently than weekly (vs. weekly or more often) was associated with a lower chance of being a moderate-risk/problem gambler versus being a low-risk/non-problem/non-gambler.
4.10.2 Multiple logistic regression
Data are presented in Table 18.
Multiple logistic regression analyses showed that ethnicity, level of individual deprivation, quality of life, psychological distress, and various gambling participation behaviours remained significantly associated with the chance of being a past year moderate-risk/problem gambler versus being a low-risk/non-problem/non-gambler.
74New Zealand National Gambling Study: Wave 4 (2015)Provider No: 467589, Agreement No: 349827/00Auckland University of Technology, Gambling and Addictions Research Centre Final Report Number 6, 29 March 2018

Table 18: Multiple logistic regression for the chance of being a past year moderate-risk/problem gambler vs. being a low-risk/non-problem/non gambler across Waves 1 to 4
Wave 1 variable Odds ratio (95% CI) p-valueEthnic group (prioritised)
Māori 2.41 (1.05, 5.55)Pacific 1.78 (0.68, 4.65)Asian 0.28 (0.14, 0.55)European/Other 1.00 <0.0001
New Zealand Individual deprivation Index0 1.001 2.60 (1.46, 4.62)2 1.66 (0.78, 3.52)3 2.96 (1.28, 6.82)4+ 5.67 (2.59, 12.39) 0.0001
Quality of life (WHOQoL-8)Below median (Score 0 - 24) 1.00Median score (Score 25) 0.75 (0.35, 1.63)Above median (Score 26 - 32) 0.35 (0.20, 0.62) 0.002
Psychological distress (Kessler-10)Low (Score 0 - 5) 1.00Moderate (Score 6 - 11) 3.41 (1.71, 6.79)High (Score 12 - 19) 18.08 (6.81, 48.02)Severe (Score 20 - 40) 2.27 (1.34, 3.82) <0.0001
Pattern of participationInfrequent gambler 1.00Regular non-continuous gambler 1.12 (0.60, 2.09)Regular continuous gambler 3.16 (1.68, 5.93) 0.003
Typical monthly gambling expenditure<$20 1.00$21 - $50 1.24 (0.57, 2.74)>$50 4.51 (2.16, 9.43) <0.0001
Card games - monthlyNo 1.00Yes 4.16 (1.47, 11.77) 0.007
Sports betting - monthlyNo 1.00Yes 7.60 (2.40, 24.02) 0.0006
EGMs overall - monthlyNo 1.00Yes 6.20 (3.07, 12.50) <0.0001
Gambling-type games not for money - monthlyNo 1.00Yes 2.25 (1.35, 3.75) 0.002
Time spent playing EGMs in an average day (casino)No time 1.00Up to 15 minutes 2.57 (0.85, 7.73)16 to 30 minutes 0.62 (0.20, 1.99)31 to 60 minutes 0.30 (0.09, 1.01)>60 minutes 3.27 (1.54, 6.97) 0.0008
Time spent playing EGMs in an average day (pub)No time 1.00Up to 15 minutes 1.45 (0.58, 3.64)16 to 30 minutes 1.60 (0.71, 3.65)31 to 60 minutes 1.98 (0.83, 4.76)>60 minutes 11.48 (4.49, 29.34) <0.0001
Methods - Leaving ATM and credit cards at homeNo 1.00Yes 4.26 (1.71, 10.64) 0.002
Methods - Avoiding places that have betting or gamblingNo 1.00Yes 4.78 (2.19, 10.41) <0.0001
Data weighted for 2013 Census data (all Waves) and attrition (Waves 2, 3 and 4)
75New Zealand National Gambling Study: Wave 4 (2015)Provider No: 467589, Agreement No: 349827/00Auckland University of Technology, Gambling and Addictions Research Centre Final Report Number 6, 29 March 2018

Variables associated with a higher chance of being a past year moderate-risk/problem gambler
Māori participants had more than twice the odds of being a past year moderate-risk/problem gambler versus being a low-risk/non-problem/non-gambler (2.41 times higher), than European/ Other participants.
Participants with one, or three or more individual levels of deprivation had higher odds of being a past year moderate-risk/problem gambler versus being a low-risk/non-problem/non-gambler, compared with participants who did not experience any deprivation. The odds increased with increasing deprivation from 2.60 times higher (for one deprivation level) to 5.67 times higher (for four or more deprivation levels).
Experiencing moderate, high or severe levels of psychological distress remained associated with higher odds of being a past year moderate-risk/problem gambler versus being a low-risk/ non-problem/non-gambler, compared with experiencing a low level of psychological distress. However, the increased risk was not linear at 3.41, 18.08 and 2.27 times for moderate, high and severe levels, respectively.
Various gambling participation behaviours also remained associated with being a past year moderate-risk/problem gambler versus being a low-risk/non-problem/non-gambler. These included gambling monthly or more often on card games, sports betting, EGMs overall, and playing on gambling-type games not for money (varied from 2.25 to 7.60 times higher), compared with not participating in these activities at least monthly.
Regular continuous gamblers had 3.16 times higher odds of being a past year moderate-risk/ problem gambler versus being a low-risk/non-problem/non-gambler, compared with infrequent gamblers. Having a typical monthly gambling expenditure of more than $50 remained associated with 4.51 times higher odds of being a past year moderate-risk/problem gambler, than having a monthly expenditure of $20 or less. Participants who gambled on casino or pub EGMs for more than 60 minutes in an average day had higher odds of being a past year moderate-risk/problem gambler (3.27 and 11.48 times higher, respectively), than participants who did not gamble on casino or pub EGMs.
Two methods for moderating gambling behaviour also remained associated with being a past year moderate-risk/problem gambler versus being a low-risk/non-problem/non-gambler. These were leaving ATM and credit cards at home, and avoiding places that have betting or gambling. The odds for increased risk were 4.26 and 4.78 times higher, respectively.
Variables associated with a lower chance of being a past year moderate-risk/problem gambler
Asian participants had lower odds (odds ratio 0.28) of being a past year moderate-risk/problem gambler versus being a low-risk/non-problem/non-gambler, compared with European/Other participants.
Participants with a quality of life above the median level had lower odds of being a past year moderate-risk/problem gambler versus being a low-risk/non-problem/non-gambler (odds ratio 0.35), compared with participants with a quality of life below the median level.
76New Zealand National Gambling Study: Wave 4 (2015)Provider No: 467589, Agreement No: 349827/00Auckland University of Technology, Gambling and Addictions Research Centre Final Report Number 6, 29 March 2018

4.10.3 Multiple logistic regression - Māori
Data are presented in Table 19.
Multiple logistic regression analyses for Māori showed that there were some similarities, and some differences, from the total population in regard to associations with being a past year moderate-risk/problem gambler versus being a low-risk/non-problem/non-gambler. Psychological distress and various gambling participation behaviours were significantly associated with being a past year moderate-risk/problem gambler.
Table 19: Multiple logistic regression for the chance of being a past year moderate-risk/problem gambler vs. being a low-risk/non-problem/non-gambler across Waves 1 to 4 - Māori
Wave 1 variable Odds ratio (95% CI) p-valuePsychological distress (Kessler-10)
Low (Score 0 - 5) 1.00Moderate (Score 6 - 11) 9.21 (4.08, 20.77)High (Score 12 - 19) 27.21 (9.60, 77.11)Severe (Score 20 - 40) 6.56 (3.34, 12.90) <0.0001
Pattern of participationInfrequent gambler 1.00Regular non-continuous gambler 1.06 (0.51, 2.22)Regular continuous gambler 3.48 (1.59, 7.59) 0.01
Typical monthly gambling expenditure≤$20 1.00$21 - $50 0.73 (0.22, 2.39)>$50 3.45 (1.34, 8.92) 0.002
Horse/dog race betting - monthlyNo 1.00Yes 3.04 (1.27, 7.30) 0.01
Pub EGMs - monthlyNo 1.00Yes 2.77 (1.10, 6.94) 0.03
Time spent playing EGMs in an average day (pub)No time 1.00Up to 15 minutes 0.31 (0.08, 1.21)16 to 30 minutes 0.74 (0.23, 2.37)31 to 60 minutes 1.64 (0.60, 4.49)>60 minutes 4.79 (1.60, 14.36) 0.002
Methods - Separating money for betting from other money and stoppingNo 1.00Yes 3.75 (1.67, 8.41) 0.001
Methods - Leaving ATM and credit cards at homeNo 1.00Yes 3.13 (1.14, 8.62) 0.03
Data weighted for 2013 Census data (all Waves) and attrition (Waves 2, 3 and 4)
Variables associated with a higher chance of being a past year moderate-risk/problem gambler
Māori experiencing moderate, high or severe levels of psychological distress had higher odds of being a past year moderate-risk/problem gambler versus being a low-risk/non-problem/non-gambler, compared with Māori who experienced a low level of psychological distress. However, the increased risk was not linear at 9.21, 27.21 and 6.56 times for moderate, high and severe levels, respectively. This finding was similar to that noted for the total population; however, the level of risk (odds ratios) were higher for Māori.
Various gambling participation behaviours were associated with Māori being past year moderate-risk/problem gamblers versus being low-risk/non-problem/non-gamblers. These included gambling monthly or more often on pub EGMs and horse/dog race betting (2.77 and
77New Zealand National Gambling Study: Wave 4 (2015)Provider No: 467589, Agreement No: 349827/00Auckland University of Technology, Gambling and Addictions Research Centre Final Report Number 6, 29 March 2018

3.04 times higher, respectively), compared with not participating in these activities at least annually or monthly. These findings were not noted for the total population.
Māori who regularly gambled on continuous activities had 3.48 times higher odds of being a past year moderate-risk/problem gambler versus being a low-risk/non-problem/non-gambler, than Māori who were infrequent gamblers. This finding was similar to that noted for the total population.
Māori who had a typical monthly gambling expenditure of more than $50 were 3.45 times more likely to be past year moderate-risk/problem gamblers versus being low-risk/non-problem/non-gamblers, than Māori who had a monthly expenditure of $20 or less. This finding was similar to that noted for the total population. Māori who gambled on pub EGMs for more than 60 minutes in an average day had higher odds (4.79 times higher) of being a past year moderate-risk/problem gambler, than Māori who did not gamble on pub EGMs. This finding was also noted for the total population though the risk (odds ratio) was higher for Māori.
Two methods for moderating gambling behaviour were associated with Māori being past year moderate-risk/problem gamblers versus being low-risk/non-problem/non-gamblers. These were separating money for betting from other money and stopping when it is used, and leaving ATM and credit cards at home (3.75 and 3.13 times higher, respectively). For the total population, two methods for moderating gambling behaviour were also associated with being past year moderate-risk/problem gamblers; however, leaving ATM/credit cards at home was the only associated moderating method for the total population and for Māori participants.
Variables associated with a lower chance of being a past year moderate-risk/problem gambler
There were no variables associated with lower likelihood of Māori being past year moderate-risk/problem gamblers versus being low-risk/non-problem/non-gamblers.
4.10.4 Multiple logistic regression - Pacific people
Data are presented in Table 20.
Multiple logistic regression analyses for Pacific people showed that there were some similarities, and some differences, from the total population in regard to associations with being a past year moderate-risk/problem gambler versus being a low-risk/non-problem/non-gambler. As for Māori, psychological distress and various gambling participation behaviours were significantly associated with Pacific people being past year moderate-risk/problem gamblers.
78New Zealand National Gambling Study: Wave 4 (2015)Provider No: 467589, Agreement No: 349827/00Auckland University of Technology, Gambling and Addictions Research Centre Final Report Number 6, 29 March 2018

Table 20: Multiple logistic regression for the chance of being a past year moderate-risk/problem gambler vs. being a low-risk/non-problem/non-gambler across Waves 1 to 4 - Pacific people
Wave 1 variable Odds ratio (95% CI) p-valuePsychological distress (Kessler-10)
Low (Score 0 - 5) 1.00Moderate (Score 6 - 11) 1.87 (0.69, 5.05)High (Score 12 - 19) 9.46 (2.71, 33.05)Severe (Score 20 - 40) 1.17 (0.49, 2.77) 0.005
Gambling frequencyAt least once in past year 1.00At least monthly 1.38 (0.52, 3.65)At least weekly 3.43 (1.42, 8.30) 0.007
EGMs overall - annuallyNo 1.00Yes 4.93 (1.94, 12.52) 0.001
Time spent playing EGMs in an average day (pub)No time 1.00Up to 15 minutes 0.85 (0.18, 3.92)16 to 30 minutes 0.93 (0.28, 3.11)31 to 60 minutes 2.70 (0.74, 9.87)>60 minutes 6.54 (1.66, 25.74) 0.032
Methods - Avoiding places that have betting or gamblingNo 1.00Yes 4.47 (1.74, 11.47) 0.002
Data weighted for 2013 Census data (all Waves) and attrition (Waves 2, 3 and 4)
Variables associated with a higher chance of being a past year moderate-risk/problem gambler
Pacific people experiencing high levels of psychological distress had 9.46 times higher odds of being a past year moderate-risk/problem gambler versus being a low-risk/non-problem/non-gambler, compared with Pacific people who experienced a low level of psychological distress. However, moderate and severe levels of psychological distress were not associated with moderate-risk/problem gambling unlike for the total population and for Māori.
Pacific people who gambled annually or more often on EGMs overall had 4.93 times higher odds of being a past year moderate-risk/problem gambler versus being a low-risk/non-problem/ non-gambler, compared with Pacific people who did not gamble on EGMs at least annually. This finding was also noted for the total population. Pacific people who gambled at least weekly also had higher odds (3.43 times higher) of being a past year moderate-risk/problem gambler, than those who gambled at least once in the past year. This finding was not noted for the total population nor for Māori.
Pacific people who gambled on pub EGMs for more than 60 minutes in an average day had higher odds (6.54 times higher) of being a past year moderate-risk/problem gambler versus being a low-risk/non-problem/non-gambler, than Pacific people who did not gamble on pub EGMs. This finding was also noted for the total population though the risk (odds ratio) was greater than for Pacific people.
One method for moderating gambling behaviour was associated with Pacific people being past year moderate-risk/problem gamblers versus being low-risk/non-problem/non-gamblers - avoiding places that have betting or gambling (4.47 times higher). This finding was also noted for the total population though was not noted for Māori.
79New Zealand National Gambling Study: Wave 4 (2015)Provider No: 467589, Agreement No: 349827/00Auckland University of Technology, Gambling and Addictions Research Centre Final Report Number 6, 29 March 2018

Variables associated with a lower chance of being a past year moderate-risk/problem gambler
There were no variables associated with lower likelihood of Pacific people being past year moderate-risk/problem gamblers versus being low-risk/non-problem/non-gamblers.
4.11 Recovery from moderate-risk/problem gambling
This section details associations with recovery from moderate-risk/problem gambling. Participants who were moderate-risk/problem gamblers in Wave 1, who then transitioned out of these risk levels to lower levels (or stopped gambling) and remained at the lower levels in Waves 2, 3 and 4 were deemed to have recovered from moderate-risk/problem gambling. Bivariate associations (section 4.11.1) are presented, as are multiple logistic regression analyses (section 4.11.2). Subgroup analyses by ethnicity were not possible due to very small sample sizes.
Eight participants (adjusted n) were moderate-risk/problem gamblers in Wave 1 and remained so in Waves 2, 3 and 4. Twenty-six participants (adjusted n) were moderate-risk/problem gamblers in Wave 1 and transitioned to a lower risk level (or stopped gambling) in Wave 2, remaining at the lower level in Waves 3 and 4; these people recovered from moderate-risk/ problem gambling.
Note that due to the very small sample sizes, the associations (and odds ratios) detailed below must be considered indicative only. In several cases, odds ratios were not calculable.
4.11.1 Bivariate associations
Statistically significant bivariate associations are presented in Appendix 31.
Bivariate associations examined using logistic regression indicated that Wave 1 household size (three to four people) and annual personal income ($40,001 to $60,000) were both significantly associated with increased likelihood of recovery from moderate-risk/problem gambling compared with people in households of one to two people, or on the lowest income ($20,000 or less). Wave 1 age (60 years or older) was associated with a reduced likelihood of recovery compared with people aged 18 to 39 years.
Additionally, people who had gambled on a higher number of activities (four or more) in the past year in Wave 1, who gambled annually or more often on bets with friends/workmates, club EGMs, or New Zealand online gambling, or who gambled monthly or more often on text games or competitions, Instant Kiwi or other scratch tickets, horse and dog race betting, EGMs overall, or New Zealand online gambling were less likely to recover from moderate-risk/problem gambling than people who did not gamble annually or monthly on those activities or who gambled on only one to three activities.
4.11.2 Multiple logistic regression
Data are presented in Table 21.
Multiple logistic regression analyses showed that the only variables that remained significantly associated with recovery from moderate-risk/problem gambling were Wave 1
80New Zealand National Gambling Study: Wave 4 (2015)Provider No: 467589, Agreement No: 349827/00Auckland University of Technology, Gambling and Addictions Research Centre Final Report Number 6, 29 March 2018

gambling monthly or more often on Instant Kiwi or other scratch tickets, and on horse and dog race betting. Gambling monthly or more often on club EGMs was also associated with recovery; this just failed to attain a level of statistical significance in the bivariate analyses (p=0.07) although gambling annually or more often on club EGMs was significantly associated in the bivariate analyses. For each of these gambling activities, participants had substantially lower odds for recovery (i.e. were less likely to recover), compared with people who did not gamble at least monthly on these activities. The odds ratios were 0.06 for Instant Kiwi/other scratch tickets, 0.04 for horse/dog race betting, and 0.05 for club EGM gambling.
Table 21: Multiple logistic regression for recovery from moderate-risk/problem gambling
Wave 1 variable Adjusted n%
Recovery Odds ratio (95% CI) p-valueInstant Kiwi/other scratch tickets - monthly
No 27 86.2 1.00Yes 6 36.9 0.06 (0.01, 0.54) 0.01
Horse/dog race betting - monthlyNo 29 84.4 1.00Yes 5 30.3 0.04 (0.01, 0.34) 0.003
Club EGMs - monthlyNo 31 80.4 1.00Yes 2 32.0 0.05 ! 0.04
Data weighted for 2013 Census data (all Waves) and attrition (Waves 2, 3 and 4)! Meaningful confidence intervals not calculable due to small sample size
4.12 Relapse into moderate-risk/problem gambling
This section details associations with relapse into moderate-risk/problem gambling. Participants who were moderate-risk/problem gamblers in Wave 1, were not at these risk levels in Wave 2, but who then became moderate-risk/problem gamblers again in Wave 3 and/or Wave 4 are deemed to have relapsed. Bivariate associations (section 4.12.1) are presented, as are multiple logistic regression analyses (section 4.12.2). Subgroup analyses by ethnicity were not possible due to very small sample sizes.
Twenty-six participants (adjusted n) were moderate-risk/problem gamblers in Wave 1, transitioned to a lower risk level (or stopped gambling) in Wave 2, and remained at a lower risk level in Wave 3 and Wave 4. Five participants (adjusted n) were moderate-risk/problem gamblers in Wave 1, transitioned to a lower risk level (or stopped gambling) in Wave 2, then became moderate-risk/problem gamblers again in Wave 3 and/or Wave 4; these people had relapsed into moderate-risk/problem gambling.
Note that due to the very small sample size, the associations (and odds ratios) detailed below must be considered indicative only. In several cases, odds ratios were not calculable.
4.12.1 Bivariate associations
Statistically significant bivariate associations are presented in Appendix 32.
Bivariate associations examined using logistic regression indicated that Asian ethnicity was significantly associated with increased likelihood of relapse into moderate-risk/problem gambling compared with people of European/Other ethnicity.
81New Zealand National Gambling Study: Wave 4 (2015)Provider No: 467589, Agreement No: 349827/00Auckland University of Technology, Gambling and Addictions Research Centre Final Report Number 6, 29 March 2018

People who in Wave 1 gambled annually or more often on housie/bingo, overseas internet gambling7, any offshore/online gambling or other offshore gambling8, or who gambled monthly or more often on Instant Kiwi or other scratch tickets, were more likely to relapse than people who did not gamble at least annually or monthly on those activities.
Additionally, people who gambled in Wave 1 with several other people or in a group, had increased likelihood of relapsing into moderate-risk/problem gambling, compared with people who gambled alone.
4.12.2 Multiple logistic regression
Data are presented in Table 22.
Multiple logistic regression analyses showed that the variables remaining significantly associated with relapse into moderate-risk/problem gambling were Wave 1 gambling annually or more often on housie/bingo or overseas internet gambling, and gambling monthly or more often on Instant Kiwi or other scratch tickets. Gambling monthly or more often on casino EGMs was also associated with relapse; this failed to attain a level of statistical significance in the bivariate analyses (p=0.16), probably as only one person in this category (adjusted n) had relapsed. For each of these gambling activities, participants had substantially higher odds for relapse compared with people who did not gamble at least annually or monthly on these activities. The odds were 21.90 times higher for housie/bingo, 23.74 times higher for overseas internet gambling, 11.38 times higher for Instant Kiwi/other scratch tickets, and 16.08 times higher for casino EGM gambling.
Additionally, participants who, in Wave 1, separated betting money from other money and stopped gambling when it was used up had higher odds (12.41 times higher) for relapsing into moderate-risk/problem gambling than people who did not use this strategy. This finding just failed to attain a level of statistical significance in the bivariate analyses (p=0.06).
Table 22: Multiple logistic regression for relapsing into moderate-risk/problem gamblingWave 1 variable Adjusted n % Relapse Odds ratio (95% CI) p-valueHousie/bingo - annual
No 28 12.1 1.00Yes 2 69.6 21.90 ! 0.01
Overseas internet gambling† - annualNo 28 11.6 1.00Yes 2 72.8 23.74 ! 0.02
Instant Kiwi/other scratch tickets - monthlyNo 26 9.6 1.00Yes 5 48.9 11.38 (1.58, 81.75) 0.02
Casino EGMs - monthlyNo 29 14.1 1.00Yes 1 55.2 16.08 ! 0.03
Separate betting money and stopping when usedNo 27 10.7 1.00Yes 3 52.9 12.41 (1.39, 110.60) 0.02
Data weighted for 2013 Census data (all Waves) and attrition (Waves 2, 3 and 4)† Overseas online poker, raffles/lottery, sports betting and horse/dog race betting.! Meaningful confidence intervals not calculable due to small sample size
7 Overseas online poker, raffles/lottery, sports betting and horse/dog race betting.8 ‘Other offshore gambling’ relates to online gambling on the following: casino games and EGMs (not cards), bingo, event betting, skill games, virtual sport and other non-specified gambling.
82New Zealand National Gambling Study: Wave 4 (2015)Provider No: 467589, Agreement No: 349827/00Auckland University of Technology, Gambling and Addictions Research Centre Final Report Number 6, 29 March 2018

5 SUMMARY, DISCUSSION AND CONCLUSIONS
Introduction
The NGS was designed as a prospective investigation to enable assessment of the incidence (rate of onset) of problem and risky gambling in the New Zealand adult population, and other changes in gambling participation and gambling-related harm. These other changes included increased and decreased gambling participation, decreased risky and problem gambling, and relapse to at-risk and problem gambling. Factors that predicted some of these transitions are also considered. Some transitions, for example, into the problem gambling category, are made by a small number of people in any given year. For this reason, in some analyses, groups are combined (e.g. moderate-risk and problem gamblers). Also for this reason, some analyses combine data from across the four study waves. This increases statistical power.
As the number of transitions that occurred increased over the four waves, it was possible to examine some ethnic groups separately. This is important because previous New Zealand studies found that Māori and Pacific adults have particularly high prevalence rates of risky and problem gambling (Abbott, 2014b; Rossen, 2015). This was also evident in earlier waves of the NGS. In the second and third waves, Māori and Pacific people also had high incidence rates relative to European/Other people (Abbott et al., 2014b, 2015b, 2016a). Additionally, Asian incidence rates were higher. These findings suggest that unless effective measures are taken to reduce the incidence of problem and risky gambling among Māori and Pacific people, current prevalence differences between these groups and European/Other people will persist or increase. While Asian and European/Other prevalence rates do not currently differ, the higher Asian incidence rate suggests that in future the Asian prevalence rate may well be higher.
Although the main interest is in examining individual level changes over time, the NGS can also be regarded as a series of cross-sectional annual surveys of the adult population from 2012 to 2015. Considered this way, the NGS provides information on the national prevalence of participation in various forms of gambling, risky gambling and problem gambling. It also provides prevalence estimates for a number of other health and social characteristics. This aspect of the study is important because some gambling and gambling-related prevalence estimates are based on small numbers and, as a consequence, have wide confidence intervals. Along with methodological variation across studies, this means that the accuracy of individual survey results are often uncertain. Consequently, as discussed in Abbott et al. (2016a), it is unclear whether apparent differences, or similarities, between survey findings are real or artefacts of methodological variation and/or measurement error (Calado & Griffiths, 2016; Stone et al., 2015; Williams et al., 2012a).
As the NGS waves use the same methodology, each wave can be regarded as a replication survey. This information is helpful in assessing the reliability of the study prevalence estimates. However, while the methodology is consistent, the sample is not identical in that participants aged. In Wave 1 (2012), 18, 19 and 20 year olds were included. By Wave 4 (2015) participants were aged 21 years and older. As reported, in addition to aging, there was differential attrition. Sample weighting probably largely corrected for this non-random attrition. This means that while some caution is required, the survey findings provide a good indication of prevalence changes and stability over the three years of the study.
Gambling and gambling-type participation: 2015 and changes from 2012 to 2015
83New Zealand National Gambling Study: Wave 4 (2015)Provider No: 467589, Agreement No: 349827/00Auckland University of Technology, Gambling and Addictions Research Centre Final Report Number 6, 29 March 2018

Gambling participation reduced from 2012 to 2015. The proportion of adults who reported taking part in one or more gambling activities during the past year decreased from 80% to 75%. Reductions were most apparent for females, adults aged 18 to 39 years, European/Other and New Zealand born people. Weekly and monthly gambling participation also decreased. Past year reductions were evident for most gambling activities and, in some cases, this was a trend across the four waves. This trend was evident for activities that are strongly associated with gambling harm including EGM participation (in all settings), overseas internet gambling and betting on horse and dog races. Monthly or more frequent participation also reduced for a number of activities including EGMs in pubs and casinos. Additionally, participation in multiple (four or more) gambling activities reduced from 2012 to 2015. Past year and monthly increases were not found for any gambling activity. Although gambling participation decreased across the three years of the study, there was no change in reported typical monthly gambling expenditure. Time spent playing EGMs on a typical day, for those who took part in this activity, also did not change over time. Neither did persons gambled with.
In 2015, a quarter of adults were non-gamblers, over half were infrequent gamblers, 13.5% were regular non-continuous gamblers and five percent were regular continuous gamblers. As in previous waves, Lotto, raffles and lotteries, Instant Kiwi and other scratch tickets, bets with friends and workmates, and EGMs (across all settings) were the most popular activities. Past year participation in any other single activity did not exceed ten percent.
Self-reported EGM expenditure was assessed in all NGS waves. In 2015, average monthly EGM expenditure was $57 per month and did not vary appreciably across pub, club and casino settings. Neither did it change much across study waves. There were, however, some differences and changes with regard to estimated population annual EGM expenditure. In 2015, total EGM expenditure was estimated to total $286 million. This is similar to the 2013 and 2014 estimates but less than the 2012 estimate of $453 million. The corresponding actual expenditure on pub and club EGMS only (i.e. excluding casino EGMs) was $843 million in 2015/16 and $827 million in 2012/13 (Department of Internal Affairs, 2017b). The NGS estimates of total annual EGM expenditure when compared to actual expenditure obtained from official sources, indicate that capturing self-reported expenditure data are unreliable for a number of reasons. These include not including expenditure from tourists who gamble in New Zealand, failure to count winnings in expenditure recall, and unconscious or deliberate misreporting of net expenditure (e.g. believing it to be is lower than it actually is, or under-reporting high expenditure to avoid stigma) (Abbott & Volberg, 2000; Abbott et al., 2014a). Abbott and Volberg (2000) noted that self-reported casino gambling and non-casino EGM gambling expenditure was much lower than the official expenditure.
The 2015 findings are somewhat unexpected. At the outset of the study (2012) it was expected that there would be minimal changes in gambling participation over the course of one or two years. From 2012 to 2014, while there were reductions on some gambling participation measures, mostly there was little or no change. However, in the 2015 wave, as indicated, reductions were more evident and found across a wider range of measures. These changes are consistent with longer term participation trends. As mentioned earlier, overall past year gambling participation was 90% in the early to mid-1990s. In the NGS it was 80% in 2012 and reduced in subsequent waves to 75% in 2015. More substantial reductions took place in regular gambling participation. In 1990, 48% of adults participated weekly or more often. This reduced to 40% in 1999 and 23% in 2012. Three years later it reduced to 19%. A similar trend is evident for past year participation in four or more gambling activities. After reaching a high point of 41% in 1995, it reduced to 37% in 2000, 28% in in 2005 and 22% in 2012. In the third NGS wave in 2015 it was 17%. As mentioned and discussed further in
84New Zealand National Gambling Study: Wave 4 (2015)Provider No: 467589, Agreement No: 349827/00Auckland University of Technology, Gambling and Addictions Research Centre Final Report Number 6, 29 March 2018

Abbott (2017b) and Abbott et al. (2016a) these findings are contrary to availability hypothesis predictions. This hypothesis predicts that gambling participation (and problem gambling) increases if new gambling activities are introduced and gambling availability and exposure increase. During the past 20 years, new gambling activities and ways of accessing them have increased in New Zealand. Rather than increasing, participation in almost all gambling activities decreased and in many cases further reductions occurred from 2012 to 2015. These findings are in keeping with the adaptation hypothesis. Given the strong associations between problem gambling and both regular participation in continuous forms of gambling and participation in multiple gambling activities, it could be expected that reductions from 2012 to 2015 would be accompanied by lower problem gambling prevalence rates.
As noted in the introduction, the Health and Lifestyles Survey series conducted since 2006/07 also found a significant reduction in gambling participation over time. However, in contrast to the present study, past year participation remained constant (70%) from 2012 to 2016 (Thimasarn-Anwar et al., 2017). Thus, some uncertainty remains regarding changes in participation in recent years.
Offshore and local online (internet, telephone and interactive television) gambling participation research is reviewed by Bellringer, Garrett, Kolandai-Matchett and Abbott (2015). As mentioned, Lotto and track and sport betting can be accessed online in New Zealand. Locals are also permitted to use online gambling services offered from outside New Zealand. In 2015, less than one percent of adults took part in offshore gambling online, a reduction from 1.7% in 2012. Overall domestic online gambling participation was substantially higher than offshore gambling in 2015 (9%) and did not change across the four waves. These findings indicate that gambling participation in New Zealand is predominantly land-based and that offshore online gambling has not increased in recent years. The effect on online gambling participation with the recent (2017) introduction of online scratch cards in New Zealand is yet to be determined.
As in previous NGS waves, people who took part in a gambling activity were asked about methods they use to prevent themselves from gambling too much. All participants were also asked if they had personally sought help for gambling in the past year. Setting a money limit was the only method reported by more than one-in-ten gamblers. Separating betting money and stopping when it was spent was the next most often mentioned method. Use of both of these methods decreased from 2012 to 2015. Relatively few participants mentioned using other methods or seeking help from professional or informal sources.
Some gambling measures were considered by ethnicity. In Wave 4, Māori and Pacific gambling participation was generally similar to that of the overall population. However, in the baseline 2012 survey and 2013 follow-up wave, Māori had somewhat higher past year, weekly and regular continuous gambling participation rates than the population as a whole. They also more often took part in four or more gambling activities during the past 12 months. The length of time spent playing EGMs on a typical day, however, was similar to the population as a whole. While Pacific adults did not differ from the overall population they had a lower past year participation rate than Māori. Asian adults had substantially lower past year participation than the population as a whole and Māori. It was also lower than Pacific participation. These differences were apparent across all NGS waves. Relative to the population as a whole and in some cases to Māori and Pacific adults, Asian people had lower weekly and regular non-continuous participation rates. They also less often took part in four or more activities. Additionally, Asian people more often had a preferred gambling activity and less often preferred to bet with friends and workmates, purchase overseas raffles or lotteries, bet on horse or dog races, or gamble on non-casino EGMs.
85New Zealand National Gambling Study: Wave 4 (2015)Provider No: 467589, Agreement No: 349827/00Auckland University of Technology, Gambling and Addictions Research Centre Final Report Number 6, 29 March 2018

Pub and club EGM expenditure was also considered by ethnicity and some other demographic characteristics. These analyses applied only to people who reported pub and club EGM participation, not to all adults in these groups. In 2015, Pacific adults had the highest average expenditure, followed by Māori, European/Other adults and Asian adults. The first three ethnic groups, however, had similar median expenditure. Asian median expenditure was lower. While this suggests lower typical Asian expenditure and higher Pacific and Māori expenditure, there was some variation across the four study waves. Generally, Māori and Pacific mean and median expenditure were higher than European/Other expenditure. However, in two waves, Asian mean and median expenditure was high relative to other groups. This fluctuation may be due to the small number of Asian respondents who took part in these gambling activities. Within all ethnic groups there was a very wide range of expenditure reported. For these reasons, while it appears likely that Māori and Pacific pub and club EGM participants typically spend more than Europeans/Other participants, these findings need to be treated with some caution. It remains unclear how Asian adults compare with these ethnic groups.
No gender differences were apparent in typical pub and club EGM expenditure in 2015 or across the four study waves. In 2015, the youngest (18 to 24 years) and third youngest (35 to 44 years) age groups had the lowest mean and median expenditure. Other groups spent much the same. However, there was some variation across NGS waves. Generally the youngest group reported the lowest mean expenditure and the 45 to 54 year and 55 to 64 year age groups the highest. There was generally less variation across groups in median expenditure. New Zealand born and longer-term migrants had similar expenditure in 2015 and in other waves. There were too few recent migrants to calculate robust estimates. There did not appear to be differences across the three major metropolitan regions and the rest of New Zealand.
As mentioned, internationally there has been marked growth in both online gambling and gaming activities and a convergence of the two (King et al., 2015). This convergence includes the development of online ‘gambling’ that simulates gambling activities that use money. These activities provide an experience of gambling without using money. They include demonstration games on internet gambling sites and casino games on social networking sites (Griffiths, 2015; King & Delfabbro, 2016). Demonstration games often provide better odds and more wins than when they are participated in for monetary outcomes. They may include encouragement to switch to participation for money. Gambling and gambling-type games not played for money were included in the NGS because relatively little is known about them and because there are good reasons to believe they play a role in people taking up gambling and, over time, developing gambling-related problems (Dussault et al., 2017).
In 2015, 13% of adults reported taking part in one or more gambling-type games not for money during the past year; somewhat more than the percentage taking part in one or more forms of online gambling and substantially more than those who gambled using an offshore internet site. Skill games were the most frequently participated in, followed by fantasy football, internet poker, online casino games, internet bingo and other online activities. As found for gambling participation, participation in gambling-type games reduced somewhat from the first to the fourth study wave. Māori past year participation in gambling-type games was 21% in 2015, approximately double that of the other three major ethnic groups. Māori had higher participation rates across all waves. The Pacific, Asian and European/Other groups had similar participation rates in 2015 as well as in earlier waves.
86New Zealand National Gambling Study: Wave 4 (2015)Provider No: 467589, Agreement No: 349827/00Auckland University of Technology, Gambling and Addictions Research Centre Final Report Number 6, 29 March 2018

Problem and at-risk gambling prevalence: 2012-2015
In 2015, the PGSI problem gambling prevalence rate was 0.2% (95 % CI 0.1 - 0.4). In 2012, the corresponding estimate was 0.6% (95% CI 0.4 - 0.9). The Wave 2 and 3 estimates were 0.5% and 0.3%. While this suggests a reduction in problem gambling prevalence over the course of the NGS, the confidence intervals for these estimates overlap. Consequently, it cannot be concluded that the prevalence of problem gambling has decreased. The 2015 moderate-risk and low-risk gambling estimates are respectively 1.8% (95% CI 1.2 - 2.5) and 4.6% (95% CI 3.7 - 5.5), almost identical to the corresponding 2012, 2013 and 2014 estimates. Replication of these results on four occasions greatly increases confidence in their accuracy. These estimates are similar to those obtained from the 2010, 2012 and 2016 Health and Lifestyle Surveys (Devlin & Walton, 2012; Thimasarn-Anwar et al., 2017; Tu, 2013) and, when adjusted for methodological differences, the 2006/7 and 2011/12 NZHS estimates (Abbott et al., 2016a; Rossen, 2015). Consequently, it appears that rates of problem and subclinical problem gambling continued to plateau from 2012 to 2015. While rates have apparently not changed during the past 15 years, the adult population has grown considerably. This means that the number of people with gambling problems and experiencing gambling-related harm has increased over this period (Armstrong, Thomas & Abbott, 2017).
Due to the low number of problem gamblers, the problem and moderate-risk categories were combined for purposes of analysis. This enabled assessment of differences between sociodemographic groups and examination of relationships with gambling participation and other factors. In 2015, Māori and Pacific adults had higher problem and moderate-risk prevalence rates than European/other and Asian adults. So too did adults who had high deprivation scores. Rates did not differ by gender, age, migrant status or labour force status. Low-risk gambling rates did not differ by gender or migrant status either. Younger adults (18 to 39 years) did, however, have a higher rate of low-risk gambling than older (60+ years) adults, and unemployed people had a higher rate than other groups outside the paid workforce. Pacific adults had a higher rate of low-risk gambling than European/Other adults, and higher deprivation was also associated with low-risk gambling. Problem/moderate-risk and low-risk prevalence rates for the sociodemographic groups considered stayed much the same over the four study waves.
As mentioned, in the 2012 survey, unemployed status was associated with problem gambling, along with male gender and Māori and Pacific ethnicity. A wider range of sociodemographic factors was considered in the report on the 2012 survey (Abbott et al., 2014b). Some of these factors were also associated with problem gambling, namely low income, lack of formal educational qualifications, residence in high deprivation neighbourhoods and membership of non-Christian and non-traditional Christian churches.
In the 2015 wave, problem/moderate risk rates were higher among adults who participated in multiple gambling activities, gambled weekly, were regular continuous gamblers, or spent more than $100 per month on gambling. Low-risk rates were higher in some of these participation groups too. This was also the case in the 2012 to 2014 waves. Around a third of adults who gambled on pub EGMs for 60 minutes or more on an average gambling day were problem/ moderate risk gamblers, substantially more than those who gambled for 30 minutes or less. Sample size was not sufficient to detect differences with regard to time engaged in casino or club EGM gambling. However, in 2012, with a larger sample, similar results were obtained both for casino and club EGMs. As mentioned earlier, participants’ typical monthly EGM expenditure remained much the same from 2012 to 2015, and this applied across all three settings. In 2015, typical
87New Zealand National Gambling Study: Wave 4 (2015)Provider No: 467589, Agreement No: 349827/00Auckland University of Technology, Gambling and Addictions Research Centre Final Report Number 6, 29 March 2018

expenditure was $151 for moderate-risk and problem gamblers, $93 for low-risk gamblers and $36 for non-problem gamblers. Across the four study waves, confidence intervals overlapped and it is unlikely typical EGM expenditure changed in these groups, both overall and for participation in casino, pub and club settings.
Estimated annual total 2015 EGM expenditure9 was $286 million, similar to the 2013 and 2014 estimates but lower than the 2012 estimate of $453 million. At-risk and problem gamblers accounted for over half of total EGM expenditure in 2015 (moderate-risk and problem gamblers 28%; low-risk gamblers 24%).
In 2015, around a fifth of moderate-risk and problem gamblers and just over a quarter of low-risk gamblers reported having participated in gambling type games not for money in the prior year. Participation rates were lower for non-problem gamblers and non-gamblers. These are similar to findings from the previous three waves. They are consistent with previous research showing associations between participation in these types of activities and problem gambling (King & Delfabbro, 2016). The reasons for these associations remain uncertain as they are based on cross-sectional and retrospective studies. Gainsbury, Russell, King, Delfabbro and Hing (2016) found that problem gamblers and moderate-risk gamblers more often reported that they believed their gambling had increased because of their involvement in online social casino games. While this may have been the case and could have contributed to problematic gambling, Gainsbury, Hing, Delfabbro, Dewar and King (2015) reported elsewhere that their problems were unlikely to have been initially caused by social casino game involvement. It is also possible that some problem and at-risk gamblers engage in online gambling-like games as a distraction from gambling and/or a way of reducing gambling expenditure (Gainsbury et al., 2015). Prospective studies are required to clarify the nature of relationships between gambling-like games, gambling activities and problem gambling.
In some waves, moderate-risk/problem and low-risk groups reported experiencing more major life events than non-problem groups. However, this was inconsistent across waves.
In 2015, people who experienced high or severe psychological distress had substantially higher rates of problem/moderate-risk gambling than those who had reported low distress levels. Similar results were obtained in earlier NGS waves. In 2015, the moderate and high distress groups had elevated low-risk gambling prevalence relative to the low distress group. This was also the case in 2012 and 2013, but not 2014. As mentioned in the introduction, experience of major life events and psychological distress are among the most consistently found correlates of at-risk and problem gambling. The NGS and other recent prospective studies have found that they are also predictors of the onset of problem and moderate-risk gambling. Thus, to reduce gambling-related harm, it is important that attention is given to modifiable risk and protective factors such as economic and social disparities, employment and educational attainment, as well as mental health and addiction disorders generally.
Methods to stop gambling too much and help-seeking
Past year gamblers reported using a variety of methods to attempt to moderate their gambling. Only one, setting money limits on gambling before leaving home, was used by more than ten percent of participants. The proportion doing so was lower in Wave 4 than it was in Waves 1 and 3. The next most often used method, separating betting money from other money and
9 Note that self-reported gambling expenditure generally does not correspond to actual, official expenditure for various reasons including that official figures contain expenditure by non-residents, and people interpret questions differently (e.g. reporting losses vs. total expenditure without deducting winnings), (Abbott & Volberg, 2000; Blaszczynski, Dumlao & Lange, 1997).
88New Zealand National Gambling Study: Wave 4 (2015)Provider No: 467589, Agreement No: 349827/00Auckland University of Technology, Gambling and Addictions Research Centre Final Report Number 6, 29 March 2018

stopping when it was used, was reported by around two percent of participants in Waves 2 and 3, slightly less often than reported in Wave 1. Other methods were reported less frequently and did not change across the four survey waves. It is not known why there was a slight reduction in use over time for two of the methods. The Māori findings were fairly similar to those for the population as a whole. While most gambling participants do not apparently use deliberate strategies to control time and/or money spent to control gambling, in Wave 4, as in earlier phases of the study, at-risk and problem gamblers did so much more frequently than non-problem gamblers (Abbott et al., 2014b, 2015b, 2016a). This is not surprising as they had greater reason to do so. In earlier waves it was found that while the large majority of people who reported using these methods found them to be helpful, problem gamblers less often reported that they were effective.
In each of the four waves, between 0.2% and 0.4% of adults reported having sought help for a gambling problem, either formal or informal, during the past 12 months. Help-seeking proportions, in Waves 2 to 4, are similar to problem gambling past 12 months prevalence rates. Smaller proportions, around 0.1%, reported seeking help specifically from gambling treatment services. Māori help-seeking rates were somewhat higher although, given the small numbers involved, caution is required in their interpretation. Small sample size precluded consideration of other ethnic groups. The great majority of people who seek formal help for problem gambling have scores within the PGSI problem gambling range, generally at the high end. This topic is covered in detail in the second NGS report (Abbott et al., 2014b). In Wave 1 around a third of problem gamblers and a fifth of moderate-risk gamblers reported having sought help to reduce or stop gambling. Proportionately more Māori sought help. Informal help, for example, from friends and family, was mentioned most often, followed by a helpline, community support groups, counsellors and doctors. Most people who received help believe that it assisted. Support, encouragement and assurance was mentioned most often in this regard, followed by counselling and having their money limited or controlled in some way. These findings suggest that informal assistance plays an important role in assisting people to moderate their gambling and reduce problems. It no doubt helps explain why many people overcome their problems without formal treatment. Gambling helpline services in New Zealand have also been shown to be effective in assisting people with serious gambling problems, with effects persisting for at least three years post-treatment (Abbott et al., 2015c).
While most problem gamblers and moderate-risk gamblers who seek help consider it to be helpful, the NGS and similar studies in Sweden, Victoria and Canada show that high proportions of past problem gamblers relapse. Additionally, many moderate-risk and problem gamblers do not report seeking help of any kind. In each of the NGS waves only 1.6% to 4.2% of moderate-risk and problem gamblers reported having sought professional treatment for a gambling problem during the preceding 12 months. Barriers to help-seeking have been examined in New Zealand and elsewhere (Bellringer, Pulford, Abbott, DeSouza & Clarke, 2008; Clarke, Abbott, DeSouza & Bellringer, 2007; Pulford et al., 2009a, 2009b). Pride, shame and denial are most often mentioned as reasons for not seeking help. Financial problems, relationship strain and breakdown, and psychological and physical health problems are most often mentioned as reasons for seeking help. The foregoing findings suggest there is potential through public awareness and other programmes to promote and increase the use of self-monitoring and control of gambling participation to prevent or reduce problematic gambling and to encourage help-seeking when problems start to arise. This could involve public education about ways to support people experiencing gambling-related difficulties and harm, including mental health first aid and ways to assist people to receive appropriate professional assistance. There is potential to significantly increase the provision and use of online education, treatment and support. Given the psychological barriers including pride and shame, online services may be more acceptable to many at-risk and problem gamblers. Further research is required to examine potential cultural and other differences in regard to
89New Zealand National Gambling Study: Wave 4 (2015)Provider No: 467589, Agreement No: 349827/00Auckland University of Technology, Gambling and Addictions Research Centre Final Report Number 6, 29 March 2018

the use of strategies to self-moderate gambling, informal support and treatment seeking behaviours.
Sociodemographics, health and wellbeing
While not a direct focus of the NGS, a number of factors additional to gambling were examined. As mentioned in the results section, over the course of the study, employment rates and household size remained the same. So too did quality of life and psychological distress. On other measures, changes were apparent. By Wave 4 there was a reduction in the proportions of adults reporting low annual income, higher levels of deprivation and four or more major life events. There were also decreases in hazardous alcohol consumption, cannabis use, other drug use and daily tobacco smoking.
In 2015, relative to adults generally, Māori had higher rates of cannabis use, other drug use and lifetime and current daily tobacco smoking. On other health and wellbeing measures they did not differ from the general population. From 2012 to 2015, as for the adult population as a whole, there were reductions in hazardous alcohol consumption, cannabis use and other drug use. Changes were not found for the other measures including daily smoking. In 2015, Pacific adults generally only differed from other adults in that they had less often ever smoked tobacco and were less likely to have since stopped smoking. No change was evident from 2012 to 2015 on the health and wellbeing measures, apart from a slight reduction in the proportion who experienced five or more life events in the past year. In 2015, Asian adults compared to adults generally, more often reported experiencing no major life events. They also had substantially lower rates of hazardous alcohol consumption, cannabis use, other drug use and lifetime and current tobacco smoking. There was no change on any of these measures across the four NGS waves.
Incidence and transitions
As for the NGS Wave 2 and Wave 3 reports, the main focus in Wave 4 is the onset of risky and problem gambling (incidence), risk and problem remission and factors that precede and predict these and other transitions of interest.
In 2015, the problem gambling incidence rate was 0.10 (95% CI 0.00 - 0.19). Incidence rates for moderate-risk and low-risk gambling were respectively 1.15 (95% CI 0.55 - 1.76) and 3.25 (95% CI 2.42 - 4.09). It was estimated that 33.3% (95% CI 13.3 - 53.3) of the problem gambling incident cases were first time problem gamblers. The corresponding estimate for moderate-risk gamblers was 71.2% (95% CI 54.1 - 88.3). The estimate for the combined moderate-risk and problem incident cases was 70.0% (95% CI 52.5 - 87.5).
Although the 2015 incidence rates appear to be lower than corresponding estimates from previous waves, their confidence intervals overlap and it is unlikely that they have changed over three years of the study. They are similar to incidence estimates from the recent Swedish (Public Health Agency of Sweden, 2016) and Victorian (Billi et al., 2014) prospective studies. The 2014 and 2015 NGS combined incidence estimates are 1.2% and 1.25% respectively. The corresponding Swedish estimate was 1.4%. It appears that the ‘inflow’ rates of ‘new’ problem gamblers are similar across these jurisdictions.
While most incident cases appear to be first time problem or moderate-risk gamblers, substantial proportions are past problem or moderate-risk gamblers who are relapsing. In 2015, the problem and moderate-risk prevalence rates were 0.2% and 1.8% respectively. The
90New Zealand National Gambling Study: Wave 4 (2015)Provider No: 467589, Agreement No: 349827/00Auckland University of Technology, Gambling and Addictions Research Centre Final Report Number 6, 29 March 2018

incidence rates were 0.1% and 1.15%. This suggests that in 2015 around half of the problem gamblers and two-thirds of moderate-risk gamblers were ‘new’ incident cases. They were people who had not scored as problem or moderate-risk gamblers during the previous 12 months. They may, however, have experienced problems prior to that. The first wave of the NGS included the SOGS-R to provide an estimate of lifetime pathological and problem gambling. The SOGS-R lifetime measure was used to separate people who had experienced a gambling problem at some time in the past from those who had not. Using this method it was concluded that around half of ‘new’ problem gamblers and somewhat more than a quarter of moderate-risk gamblers were people who had previously been a pathological or problem gambler (Abbott et al., 2015b).
As discussed in the introduction, the SOGS-R lifetime measure is a conservative indicator of past problems. This means that in New Zealand, as well as in Sweden and Victoria, as many as two-thirds of ‘new’ problem gamblers are likely to be past problem gamblers who are relapsing. Consequently, it is important that policy, public education and prevention initiatives place greater emphasis than they have to date on relapse prevention. This emphasis could usefully extend to treatment programmes and treatment follow-up. Primary prevention measures directed towards people who have not previously experienced gambling-related problems continue to have an important role to play, especially for recently exposed and high-risk populations, for example, youth and some recent migrant groups that do not have high proportions of previous problem gamblers who are prone to relapse. In practice, many measures taken with regard to primary prevention will also have relevance to relapse prevention.
From Wave 3 to Wave 4, non-problem gamblers and non-gamblers remained the most stable groups with large majorities remaining in these categories. Problem gamblers were the next most stable, with 44% remaining in that category. Moderate-risk and low-risk groups were the least stable, with substantial majorities moving into other categories, predominantly to lower risk and non-problem categories. These findings are consistent with transitions from Wave 1 to Wave 2 and Wave 2 to Wave 3.
The foregoing findings, in addition to being similar to findings from earlier NGS waves, are consistent with those from other general population prospective gambling studies. These studies found that the large majority (generally 80% to 90%) of non-problem gamblers remain non-problem gamblers at follow-up (see Abbott et al., 2015b, and Luce, Nadeau & Kairouz, 2016 for reviews). Not as many studies have considered non-gamblers from baseline. Those that did obtained similar results to the NGS where, in each of the three waves, around two-thirds remained non-gamblers. Low-risk and moderate-risk gamblers were the least stable categories with around only 10% to 30% retaining membership over a 12 month period. Problem gamblers were somewhat more stable than the at-risk groups; however, relative to other groups, study findings are more variable. This variability partly relates to the duration of the follow-up period and number of assessment points.
The NGS and other studies that demonstrated fluidity in problem gambling over relatively short time periods challenged traditional conceptualisation of pathological gambling as a chronic disorder. This research contributed to changes in the latest version of the DSM where gambling disorder is redefined to include provision for transient episodes and in-remission diagnoses (American Psychiatric Association, 2013; Mitzner, Whelan, & Meyers, 2011; Petry et al., 2014). While reflecting research findings, it is important to note that most prospective studies had short follow-up periods, rarely extending beyond a few years. Furthermore, most included low numbers of serious problem gamblers and the problem and moderate-risk groups were often combined. Given the high relapse proportions identified in the NGS and recent Swedish and Victorian studies, it could be that problem gambling, perhaps especially
91New Zealand National Gambling Study: Wave 4 (2015)Provider No: 467589, Agreement No: 349827/00Auckland University of Technology, Gambling and Addictions Research Centre Final Report Number 6, 29 March 2018

in its more serious forms, is more typically a chronically relapsing disorder than has been portrayed during the past decade. Longer duration studies are required to assess this possibility. Partly for this reason, a further follow-up phase is planned for the NGS, seven years after the baseline survey. This follow-up will also enable comparison of the findings with those of Abbott et al.’s (1999, 2004b) earlier New Zealand prospective study, which also had a seven year follow-up (however, without intervening follow-ups). A qualitative study is also planned to examine participant experience and understanding of changes in their gambling behaviour and its consequences over time (see Mutti-Packer et al., 2017).
In the NGS, around a third of non-gamblers commenced or recommenced gambling during the following 12 months. The large majority became non-problem gamblers and a minority, around 1% to 2%, moved into the at-risk and problem gambling categories. For non-problem gamblers, typically around 10% to 15% became non-gamblers and around 5% became at-risk or problem gamblers. In the low-risk category, the majority, generally between half and a third, became non-problem gamblers and a smaller proportion, less than 10%, stopped gambling. Somewhat more (8.2% to 12.5%) moved into the moderate-risk or problem gambler categories. NGS moderate-risk gamblers evidenced a somewhat similar pattern with the majority moving into the low risk, non-problem and non-gambling categories. Between 5% and 10% became problem gamblers. These findings are also generally consistent with those of other studies. As mentioned, problem gamblers are more stable than the at-risk groups.
The NGS findings are typical of studies that assess change over a 12 month period or periods. These studies generally find that only a third to half remain problem gamblers from one year to the next. While no longer in the problem gambling category, a substantial proportion are in the low-risk and moderate-risk categories, indicating that they are still experiencing some gambling-related harms and remain at risk of relapse. Over time-spans of seven (Abbott et al., 1999, 2004b) and 11 years (Slutske, Jackson & Sher, 2003), it appears that most problem gamblers no longer experience problems. However, other studies have found that substantial numbers experience cyclic patterns of relapse and remission and others have more stable, chronic problems (el-Guebaly et al., 2015; Williams et al., 2015). To some extent, this type of pattern also applies to moderate-risk gamblers. While the large majority improve over time, moderate-risk gamblers’ trajectories are highly variable. A recent Canadian study involving three assessments over two years found one-third of moderate-risk gamblers improved, one-third remained stable and one-third became problem gamblers (Luce at al., 2016). These findings, among others, extend the construct and predictive validation of the PGSI, particularly with regard to the low-risk and moderate-risk classifications. Longer duration studies are required to more fully understand the natural history of problem gambling and obtain more accurate estimates of the proportions following different trajectories.
Another New Zealand general population study has recently looked at gambling and gambling risk transitions over time (Kruse, White, Walton & Tu, 2016). It involved a nationally representative sample and included follow-up and reassessment two years after a baseline survey. The baseline surveys for the NGS and this study were conducted in 2012. Both studies used the PGSI and interviewed participants in residential dwellings. The Kruse et al. (2016) study differed from the NGS in that follow-up interviews were conducted by telephone and it had much lower retention (31%). It also only had one follow-up assessment and, as mentioned, that was two years post baseline rather than one year. These features could all be expected to influence the study results. Interestingly, despite these differences, the past year gambling participation rates obtained by the two New Zealand studies are identical at baseline (80%). In the NGS, the participation rate decreased to 77% in Wave 3 and 75% in Wave 4. The Kruse et al. (2016) rate was 76% at follow-up. These findings further increase confidence in the accuracy of the NGS gambling participation estimates for
92New Zealand National Gambling Study: Wave 4 (2015)Provider No: 467589, Agreement No: 349827/00Auckland University of Technology, Gambling and Addictions Research Centre Final Report Number 6, 29 March 2018

the New Zealand adult population. In contrast to the NGS, the proportion of adults in the combined at-risk and problem categories in the Kruse et al. study increased somewhat over time. This is apparently another instance where there is an increase in gambling-related harm despite reduced participation. The Kruse et al. (2016) findings should be treated with some caution, however, given the methodology used and high, differential attrition. While Kruse et al. (2016) did not calculate incidence rates, they did look at similar transitions to those considered in the NGS, albeit over two years rather than over three one-year intervals. Over two years, around half of the people in the combined low-risk, moderate-risk and problem gambling categories moved into lower risk or non-problem categories. This is in keeping with findings from the NGS and other prospective studies that indicate that problem and at-risk gambling are transitory states over relatively short time periods. Interestingly, none of those who reduced their risk category stopped gambling. Kruse et al. (2016) also found that proportionately more people moved into the problem and at-risk categories than moved out of them. This is why, as mentioned in the previous paragraph, the prevalence of problem and at-risk gambling increased from baseline to follow-up. These findings are at variance with the findings of the NGS and other general population prospective studies (Abbott et al., 2016a; Williams et al., 2015). These studies found people moving into the problem and at-risk categories were balanced or exceeded somewhat by those moving out of them. In these studies, prevalence either did not change across assessment waves, or decreased slightly. The reason for the discrepant Kruse et al. (2016) finding is unclear and may be related to their high attrition rate. The authors noted, however, that the increase in risk prevalence was predominantly a consequence of the relatively large number of people who moved from the non-problem to low-risk category.
Moderate-risk gamblers are much more likely to develop serious gambling problems than non-gamblers, non-problem gamblers and low-risk gamblers. For this reason, the moderate-risk group provides a potential focus for programmes designed to prevent progression to more serious problem gambling. However, while very low proportions of people in the other groups develop major gambling problems, as many as a third to half of problem gambling incident cases come directly from these groups. This is because the great majority of adults are in the non-problem, non-gambling and low-risk groups. Similarly, around half of moderate-risk gamblers are people who progressed from the low-risk group and a similar proportion come from the non-problem and non-gambler groups. This means that while a focus on moderate-risk gambling, in the case of problem gambling, and low-risk gambling, in the case of moderate-risk gambling, has relevance to prevention; it excludes a substantial number of people who go on to develop gambling problems. Some of these people will be past problem gamblers who are relapsing. To have a substantial impact, prevention policies and programmes should include at-risk gamblers, past problem gamblers and the population as a whole.
For many years, major attention in research, policy and practice has been accorded to problem gambling and its assessment, development, treatment and prevention. More recently, wider gambling-related harm and costs to individuals, communities and society has been considered. While the PGSI was developed for use in general population surveys and intended to assess a broad concept of problem gambling and negative gambling consequences (Ferris & Wynne, 2001), it covers only three of the seven harm domains that have been identified (Browne et al., 2016). Nevertheless, overall PGSI scores have been found to correlate highly with more comprehensive measures and it can be used as a proxy for wider gambling-related harms. Browne et al. (2016, 2017) included the PGSI and wider harm measures in Australian and New Zealand studies. The latter study drew on NGS data. Both studies found that only around 15% of gambling-related harm was attributable to problem gamblers. The majority was associated with moderate-risk and low-risk gambling. Indeed, almost half of total gambling-related harm was attributable to low-risk gamblers. From a
93New Zealand National Gambling Study: Wave 4 (2015)Provider No: 467589, Agreement No: 349827/00Auckland University of Technology, Gambling and Addictions Research Centre Final Report Number 6, 29 March 2018
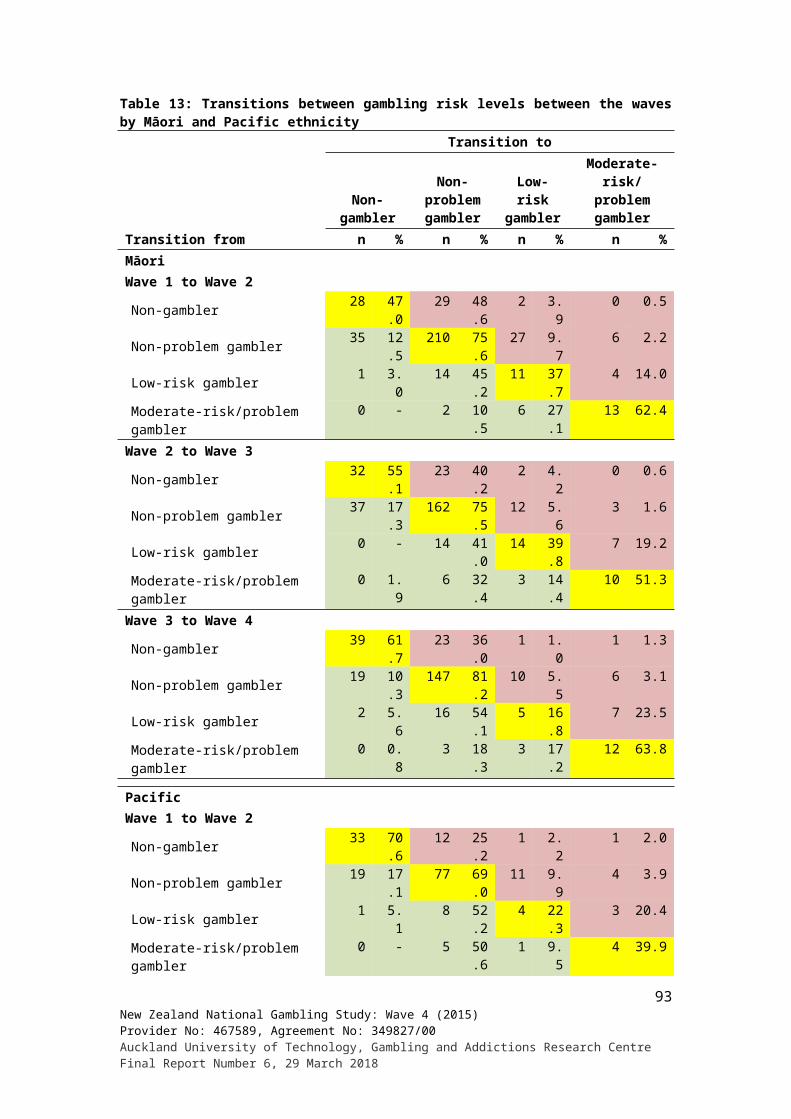
public health perspective, these findings underline the importance of the at-risk groups. If the interest is in reducing or preventing gambling-related harm in the population, at-risk gamblers are of major significance in their own right.
It is important to note that the assessment of problem and at-risk gambling is based on participant self-report and that recall deficiencies and other factors compromise the reliability of these reports. As previously discussed, this limitation is particularly evident in regard to ‘lifetime’ problem gambling measures such as the SOGS-R. However, it is also apparent over shorter periods of time. For the PGSI, one month test-retest reliabilities have been found to be in the mid to high 0.70s (Currie, Hodgins & Casey, 2013; Ferris & Wynne, 2001). This means that PGSI past 12 months scores on the NGS and other studies will partly reflect measurement error and there will, as a consequence, be some misclassification of changes between PGSI categories. Williams et al. (2015) corrected for PGSI measurement error and re-examined changes between categories in the two Canadian prospective gambling studies. They found that between five percent and seven percent of the PGSI problem gamblers changed categories when measurement error was taken into account. Given the very small number of people changing categories, similar adjustments have not been made to the NGS data. However, on completion of the study, with the inclusion of the seven year assessment, this could be done across all study waves. While unlikely to be a major influence on the findings, failure to take measurement error into account in this and other studies may somewhat exaggerate the amount of change between PGSI categories over time.
Predictors of gambling participation and at-risk and problem gambling
Combined data from transitions across the four NGS study waves were undertaken. Some categories were combined to increase statistical power to examine predictors of transitions and, in some instances, allow comparison with findings from other studies. Given that the factors examined in relation to transitions are inter-related, multiple logistic regression analyses were conducted where feasible.
Gambling participation
Across the four NGS waves, about one-third (29% to 36%) of transitions were individuals who started gambling from not having gambled in the preceding wave. Many of these people gambled in earlier waves. Consistent with the lower gambling participation rate over time the likelihood of commencing and re-commencing gambling decreased during the course of the study. From the multiple logistic regression analysis it was found that being aged 40 to 64 years, having a higher annual personal income, experiencing three or more recent major life events, hazardous alcohol consumption and having smoked cigarettes predicted gambling participation. Migrants, especially recent migrants, Asians and people with a religious affiliation were less likely to participate. In the bivariate analysis, Pacific people also had lower participation than European/Other people but this relationship was no longer significant when other factors were taken into account in the multivariate analysis. In this report, people who commenced gambling for the first time and people who are re-commencing are considered together. In previous NGS reports (Abbott et al., 2015b; 2016a) they were considered separately. Many of the risk factors, especially alcohol use and misuse, tobacco use and drug use, were found to be associated with both the initiation of gambling and re-commencing after a period of non-participation.
Low-risk, moderate-risk and problem gambling
94New Zealand National Gambling Study: Wave 4 (2015)Provider No: 467589, Agreement No: 349827/00Auckland University of Technology, Gambling and Addictions Research Centre Final Report Number 6, 29 March 2018

Less than 10% (6.1% to 7.9%) of transitions across the NGS were into the combined low-risk, moderate-risk and problem gambling category from the non-gambling or non-problem gambling categories. A large number of gambling participation measures were strongly predictive of increased gambling risk. Of the many predictors, the strongest general gambling predictors in the bivariate analyses included regular participation in continuous gambling activities (OR 11.3), participation in seven or more different gambling activities (OR 19.3), and typical gambling expenditure of more than $50 per month (OR 8.2). While participation in virtually all individual gambling activities was associated with increased gambling risk, participation in some activities was very strongly predictive. The strongest were monthly or more frequent participation in pub EGMs (OR 36.4), EGMs overall (OR 20.1), card games (OR 24.3), housie or bingo (OR 21.8), sports betting (OR 16.6), overseas offshore gambling (OR 13.8) and overseas internet gambling (11.1). This frequency of participation was also significant for short-term speculative investments (OR 15.8) and gambling-type games not for money (OR 2.7). Longer typical EGM sessions were also very strongly predictive. Even people who reported sessions of less than 16 minutes had significantly increased risk, relative to non-participants. This applied across the three different EGM settings. For pub EGMs, there was a pronounced linear dose-response relationship between session length and increased risk. The odds ratio for 31 to 60 minute sessions was 15.7, rising to 71.8 for typical sessions of 60 minutes or more. The odds ratios for sessions of 60 minutes or more was 14.8 for casino EGMs and 17.7 for club EGMs. Odds ratios were also very high for the use of methods used to moderate or reduce gambling participation, particularly getting someone to manage gambling money (OR 30.0) and setting a time limit (OR 20.7).
As in a number of previous New Zealand prevalence studies and the earlier NGS waves, a range of sociodemographic variables were predictive of at-risk and problem gambling, namely younger age, ethnicity, migrant status, low educational attainment, being unemployed, low personal and household income, large household size and high deprivation. Odds ratios were very high for Pacific and Māori ethnicities (OR 13.8 and 6.6, respectively) and high for Asian ethnicity (OR 3.8), relative to European/Other ethnicity. There was a linear association with deprivation. People scoring four or more on the NZ deprivation index had an odds ratio of 9.2. High psychological distress (OR 14.9) relative to low distress was also strongly predictive. Significant but weaker predictors included tobacco use (past and present) measures, hazardous alcohol consumption, cannabis use and other drug use.
The foregoing predictors of increased gambling risk and problems are inter-related, in some cases strongly so. A number of the gambling measures were retained in the multiple logistic regression analysis, notably frequent participation in continuous gambling activities including EGMs, sports betting and card games. Longer typical EGM sessions and high overall gambling expenditure were also retained, as were making short-term speculative investments and participating in gambling-type games not for money. The retention of these variables indicates that they each made significant, independent contributions to prediction. The use of methods to moderate gambling participation and losses were additional independent predictors. While the odds ratios for Māori and Pacific adults were lower in the multivariate analysis they remained high relative to European/Other adults, indicating that other factors such as lower income and higher deprivation only partially explained the ethnic differences. In the multivariate analysis, Asian adults had a lower rate than European/Other adults suggesting that other factors retained in the analysis accounted for the difference. Lower household income, greater deprivation, increased number of recent major life events, moderate to high psychological distress and cannabis use were also retained in the multivariate analysis.
95New Zealand National Gambling Study: Wave 4 (2015)Provider No: 467589, Agreement No: 349827/00Auckland University of Technology, Gambling and Addictions Research Centre Final Report Number 6, 29 March 2018
Predictors of the risk of being in the combined moderate-risk and problem gambling category in the bivariate analysis were similar to those for the wider at-risk and problem category discussed above. The gambling participation risk factors were very similar with particularly high odds ratios for frequent participation in continuous gambling activities, participation in seven or more activities, monthly expenditure of greater than $50, and monthly or more frequent participation in pub EGMs, casino EGMs and EGMs overall, overseas internet gambling, offshore gambling, track betting, sports betting, playing housie or bingo, and card games. Longer EGM sessions were again strongly predictive, especially pub EGMs. Methods used to moderate gambling were also similarly evident. Many of these risk factors were retained in the multivariate analysis including the very high odds ratio for longer pub EGM sessions. The sociodemographic risk factors were similar especially with regard to ethnicity, labour force status, education and deprivation. Migrant status, education, income and household size, however, were not. Low quality of life, high psychological distress, and tobacco and cannabis use were again implicated although alcohol use was not. In the multivariate analysis, ethnicity and deprivation were retained, along with quality of life and psychological distress.
The only other New Zealand prospective study that examined associations between a range of gambling participation and sociodemographic variables and increased PGSI gambling risk found, as did the present study, that participation in continuous gambling activities and EGM participation were strong predictors (Kruse et al., 2016). Far fewer measures were included than in the NGS and the study also had a smaller sample and much higher attrition. Baseline measures, additional to gambling participation, included gender, age, ethnicity, employment status, stress, social connectedness and neighbourhood deprivation. Apart from the two gambling participation measures mentioned, only baseline no-risk (non-problem) PGSI status, Pacific ethnicity and high neighbourhood deprivation status were retained in multivariate analyses. The gambling participation predictors identified in the study were also major predictors in the NGS. Pacific ethnicity and deprivation have also been found to be consistently and strongly linked to future at-risk and problem gambling development in the NGS.
Given the large at-risk and problem gambling prevalence and incidence ethnic differences evident in the NGS, there was interest in examining major ethnic groups separately. The same analyses were conducted for Māori and Pacific adults as for the adult population as a whole. Mostly, the risk factors for these two ethnic groups are very similar to those for adults generally. This means that prevention policies and practices directed at these risk factors are likely to have relevance across these different ethnic groups. While this is the case, it will be recalled that Māori and Pacific ethnicity, in contrast to Asian ethnicity, remained a significant predictor of at-risk and problem gambling when examined alongside other factors in multivariate analyses. Therefore, there are likely to be additional factors associated with these ethnicities that are not accounted for by factors such as higher deprivation and psychological distress. Further investigation is required to identify what these factors are, and consider what role they might play in problem gambling development, treatment and prevention.
In recent years, there has been growing interest in developing low-risk or safe gambling limits as a means of preventing the development of problem gambling and gambling-related harm. The foregoing findings are relevant to this topic. The low-risk gambling concept derives from the alcohol field where ‘safe’ intake levels, defined as a certain number of standard drinks consumed over specified times, have been developed and widely promulgated as part of public health programmes. In the gambling field, the focus has been on identifying a small number of gambling participation measures that are strong predictors of problem gambling development. Currie et al. (2006, 2008, 2017), leading researchers in this field, have
96New Zealand National Gambling Study: Wave 4 (2015)Provider No: 467589, Agreement No: 349827/00Auckland University of Technology, Gambling and Addictions Research Centre Final Report Number 6, 29 March 2018

examined three general participation measures (times gambling per month, monthly gambling expenditure and percentage of income spent on gambling) in relation to gambling-related harm. Their initial studies were limited by the use of cross-sectional data (Currie et al., 2006, 2008). Nevertheless, the findings of these studies were promising and this year they extended their research by drawing on data from two general population prospective studies, namely the Williams et al. (2015) and el-Guebaly et al. (2015) Canadian studies mentioned previously in this report. The recent Currie et al. (2017) research used the seven PGSI ‘harm’ items, administered 12 months after the baseline assessment, as the outcome measure. Optimal cut-points were identified for the three measures that predicted future harm.
Although statistically significant, Currie et al.’s (2017) risk factors accounted for less than 20% of the variation in harm, with odds ratios ranging from 1.4 to 3.1. Independently and in combination these measures are only moderately strong predictors of problem development and Currie et al. (2017), for this reason among others, caution against their premature application. Can more robust limits be developed? Abbott (2017d) discusses a number of challenges to the development of low-risk limits, including the diversity of gambling forms and settings, wide variation in the ‘toxicity’ of different activities and, in contrast to the situation with alcohol, lack of a standard gambling unit. This is evident in the present study where people who participated monthly or more often in pub EGMs were over 36 times more likely to become at-risk or problem gamblers over a 12 month period than those who did not. This frequency of participation in some other activities also had particularly strong associations. As mentioned, card playing, housie and bingo, and sports betting all had odds ratios of 15 or higher. In contrast, the odds ratio for Lotto was 2.0. It seems likely that enhanced prediction will require inclusion of particular gambling activities, especially those such as EGMs that are strongly predictive across a variety of settings and jurisdictions. Inter-relationships between participation in different forms of gambling are typically strong and sometimes complex. Multivariate analyses, as is evident in the present study and elsewhere, indicate that both type-specific and more generic participation measures uniquely predict gambling-related harm (Quilty, Avila Murati, & Bagby, 2014).
Two of the three generic measures used by Currie et al. (2017) (frequency of gambling participation and monthly gambling expenditure) were included in the NGS. Both were moderately predictive of movement into the combined at-risk and problem gambling category. This replicates the Currie et al. findings. However, frequent participation in continuous gambling activities was more strongly predictive than was frequent participation in non-continuous activities or in gambling activities overall. Additionally, as mentioned, frequent participation in EGMs and some other specific forms of gambling were much stronger predictors. Typical EGM session length was a very strong predictor. Another generic measure, number of different gambling activities participated in, was an additional predictor, stronger than overall participation and monthly expenditure. Number of activities participated in has been found to be a strong correlate of problem gambling in previous studies, and the NGS results indicate that it is also predictive of future gambling risk and harm. A recent prospective study found two further gambling-related factors (gambling reinforcement value and gambling fallacies) predicted increased risk and problem onset (Jonsson, Abbott, Sjöberg & Carlbring, 2017). The inclusion of the number of gambling activities engaged in, time spent gambling and some other gambling-related measures may strengthen prediction of generic risk limits or guidelines.
Although gambling participation measures, including past gambling problems, are generally the strongest predictors of future at-risk and problematic gambling, the NGS and other recent prospective studies have shown that many additional factors play a part. In the NGS, non-gambling factors with odds ratios similar to or higher than overall gambling frequency include Māori and Pacific ethnicity, high deprivation, high psychological distress and the use
97New Zealand National Gambling Study: Wave 4 (2015)Provider No: 467589, Agreement No: 349827/00Auckland University of Technology, Gambling and Addictions Research Centre Final Report Number 6, 29 March 2018

of some methods to reduce or control gambling. Additional predictive factors of somewhat lower strength were mentioned earlier. The NGS findings are broadly consistent with those of other studies and reviews that consider a wider range of factors (Abbott et al., 2015d; Williams et al., 2015). It seems likely that different participation ‘thresholds’ may apply to different groups, for example, indigenous and some recent migrant groups, people living in high deprivation settings and experiencing high levels of psychological distress. Currie et al. (2017) considered this and noted “additional guidelines and cautionary statements for more vulnerable populations” may be required. As mentioned, past problem gamblers come into this category. In some jurisdictions, including New Zealand, possibly as many as two-thirds of incident cases are relapsing problem gamblers. Further research is required to increase understanding of relapse and find ways to prevent it.
Relative to the alcohol field, where there are substantial bodies of research examining consumption patterns in relation to a wide variety of morbidities over long time periods, research on linkages between gambling participation and harm is in its infancy. As mentioned, until recently, relevant research has been predominantly cross-sectional. It has yet to consider the wider spectrum of gambling-related morbidities and harm. The PGSI items included in Currie et al.’s (2017) paper cover three gambling harm domains. Brown et al. (2016, 2017) have identified seven domains. To date, prospective exploration of participation and other gambling-related measures has been limited to one or a few years. This is a very weak foundation on which to base guidelines or limits to reduce future harm.
Currie et al. (2017) found that the risk curves for their three generic consumption measures were j-shaped. In other words, there was a threshold beyond which increased consumption was associated with a substantial increase in harm. Below the threshold, at the lowest participation level, there was no association with harm. Moderate participation below the threshold was apparently protective. Markham, Young and Doran (2016) also examined risk curves for one of the Currie et al. general measures, total gambling expenditure, as well as for a number of separate gambling forms in different countries. They found that curves were mainly linear and r-shaped and varied somewhat across different gambling activities and countries. Linear relationships refer to increasing harm with increasing expenditure. R-shaped curves refer to risk increasing more at low to moderate levels and then attenuating.
In the NGS, increased time spent playing EGMs in pubs has a strong linear relationship with increased risk of becoming an at-risk or problem gambler. Even low average session duration (up to 15 minutes) in all three settings (pubs, casinos and clubs) was associated with significantly higher risk, compared with not participating. However, in contrast to the strong linear relationship for pub EGMs, in casinos and clubs the relationship plateaued until session length increased to 60 minutes or more. At that point risk increased sharply. These findings suggest that relationships between gambling participation and harm are complex and may vary by setting as well as gambling type. The challenge in developing a small number of safe or low-risk gambling participation guidelines is considerable and may be insurmountable (Abbott, 2017d). However, there is value in increasing understanding of harm, both short and long term, linked to participation in different gambling activities and settings, and the individual and other factors that influence the risk of harm arising from participation. This is relevant to the development of harm reduction and prevention policies and programmes. Irrespective of whether or not generic or hybrid low-risk gambling limits can be derived, to be effective in reducing problem gambling development and harm they will undoubtedly need to be augmented by prevention policies and programmes that address the wide variety of modifiable risk and protective factors at multiple levels (individual, community and society-wide) and include both supply and demand reduction strategies.
98New Zealand National Gambling Study: Wave 4 (2015)Provider No: 467589, Agreement No: 349827/00Auckland University of Technology, Gambling and Addictions Research Centre Final Report Number 6, 29 March 2018

Additional to the development of increased risk and problem gambling, this study was also interested in recovery and relapse. Recovery was defined as problem and moderate-risk gamblers at baseline who transitioned out of these categories and remained at lower-risk or in the non-problem or non-gambling categories in Waves 2, 3 and 4. Relapse was defined as problem and moderate-risk gamblers at baseline who were not in this category in Wave 2 but who became problem and moderate-risk gamblers again in Wave 3 and/or Wave 4. The small numbers of people involved and resulting low statistical power limited the factors that could be considered, including the possibility of identifying potential different predictors for major ethnic groups.
Over three-quarters of moderate-risk and problem gamblers ‘recovered’, as defined in the previous paragraph, and just less than a quarter remained moderate-risk or problem gamblers throughout the course of the study. A number of gambling participation measures were associated with recovery. People who participated in three or fewer gambling activities were more likely to recover than those who took part in multiple activities. Participation in a number of particular gambling activities was associated with lower recovery rates in the bivariate analyses. Younger age, middle personal income, and living in a household of three to four people relative to a household of one or two, were associated with higher recovery rates. These sociodemographic factors were not, however, retained in the multivariate analysis. When the various predictors were considered together in the multivariate analysis, only betting on horse and dog races, and on Instant Kiwi and other scratch tickets, remained as robust predictors. Interestingly, for the adult population as a whole, these forms of gambling were only moderately strongly associated with the development of moderate-risk and problem gambling and were not retained in the multivariate analysis. For Māori, however, betting on horse and dog races was retained. It is unclear why instant lottery participation is associated with low recovery rates. The association with track betting, however, has been found previously. The first general population prospective study of gambling and problem gambling included re-assessment of a subsample of 77 problem gamblers seven years after their baseline assessment (Abbott et al., 1999, 2004b). In a multiple logistic regression analysis, three baseline measures were retained as independent predictors of chronicity (problem persistence seven years later). The strongest predictor was a preference for betting on horse and dog races relative to a preference for Lotto or another gambling activity, or no preference. The other predictors were higher baseline problem gambling severity and hazardous alcohol consumption.
The Abbott et al. (1999, 2004b) study participants were recruited from the 1991 New Zealand national survey (Abbott & Volberg, 1991, 1992, 1996). In that study problem gamblers, relative to non-problem gamblers, had strong preferences for betting on horse or dog races and EGM participation. Preferences for these activities and frequent participation in them were both strong predictors of concurrent problem gambling status. However, whereas problem gamblers in 1991 markedly reduced their EGM participation over the course of seven years, there was no change in track betting involvement. It appears that track betting is more ‘embedded’ in the lives of problem gamblers who prefer this gambling activity and more likely to persist over time than EGM involvement. Abbott et al. (1999) suggested that this could largely account for the worse prognosis for problem gamblers with a preference for track betting. To our knowledge the NGS is the first study to replicate the association of track betting with problem chronicity.
As indicated, the large majority of moderate-risk and problem gamblers recovered. Only 16% of moderate-risk and problem gamblers who moved into the non-problem or non-gambling categories in Wave 2 subsequently relapsed during Waves 3 or 4. While Asian adults appeared to be highly prone to relapse, relative to people of other major ethnicities, the very small sample size means that this finding must be treated with extreme caution. Instant
99New Zealand National Gambling Study: Wave 4 (2015)Provider No: 467589, Agreement No: 349827/00Auckland University of Technology, Gambling and Addictions Research Centre Final Report Number 6, 29 March 2018

Kiwi/other scratch tickets participation was found to be associated with relapse too. House/bingo, overseas internet gambling and casino EGM gambling also appeared to be associated with relapse although the confidence intervals are very wide. These findings, while worth exploring further in future studies, require replication before being considered to be reliable. However, they raise the possibility that the gambling activities most strongly associated with recovery and relapse are not necessarily those most strongly implicated in problem development.
Conclusions
Findings across the four NGS study waves indicate that while there has been little or no change on some gambling participation measures, on others, participation has declined. Relatively more adults do not gamble at all and participation in a number of specific activities, including EGMs, has declined. While already very low, it appears that this includes a reduction in participation in offshore internet gambling. The extent of these changes was not expected over the three year study period. However, they are consistent with longer term trends that have been evident in New Zealand for the past two decades (Abbott, 2017b). As found in earlier New Zealand studies as well as in recent studies in various other jurisdictions, rates of problem and at-risk gambling did not decline. When population growth is taken into account this means that over time the number of people adversely affected has increased. Plateauing harm rates are not consistent with either the availability or adaptation hypotheses. The challenge, from a public health perspective, is to identify what factors explain the persistence of harm in the face of declining gambling participation.
Although EGM participation reduced there was no reduction in reported typical monthly expenditure across the three settings (casinos, pubs and clubs). Problem and moderate-risk gamblers accounted for around a quarter of total expenditure and adults experiencing lower levels of gambling-related harm accounted for a further quarter.
As in previous NGS waves, problem and moderate-risk gambling rates were higher for adults who took part in multiple gambling activities, participated weekly or more in continuous gambling activities and spent larger amounts of money on gambling. Longer typical pub EGM session lengths had a particularly strong association. Approximately a third of pub EGM participants who typically had sessions of 60 minutes or more were problem or moderate-risk gamblers. Problem and at-risk gamblers also participated in gambling-type games not for money more often than non-problem gamblers. They also experienced higher levels of psychological distress. As in earlier NGS waves and other New Zealand studies, Māori and Pacific adults as well as people with high deprivation scores had high prevalence rates. There was no difference by gender, age, migrant and labour force status. A wider range of sociodemographic factors was considered in Wave 1. The sample was also larger, providing greater statistical power. In that wave male gender, younger age, low income, low educational attainment, larger household size, residence in high deprivation neighbourhoods and membership of non-Christian and non-traditional Christian churches were additional risk factors.
The major focus of Wave 4 and the present report is on the incidence of problem and at-risk gambling and other transitions. Sweden is the only other country to have national-level information of this type (Abbott, Romild & Volberg, 2017; Public Health Agency of Sweden, 2016). As in earlier NGS waves, the Swedish study and most other large-scale prospective studies, it was found that while there is consistency in problem and at-risk prevalence rates over time, at the individual level there is substantial change. The non-gambling and non-problem groups were most stable. The at-risk groups were least stable and problem gamblers
100New Zealand National Gambling Study: Wave 4 (2015)Provider No: 467589, Agreement No: 349827/00Auckland University of Technology, Gambling and Addictions Research Centre Final Report Number 6, 29 March 2018

were in-between. The present study confirmed earlier indications that in New Zealand the majority of ‘new’ problem gamblers are people who experienced problems in the past and are relapsing. It appears likely that this high relapse rate may be one reason why problem gambling rates have stabilised in a number of jurisdictions with declining participation rates. If so, greater attention will need to be given to relapse prevention in public health and treatment programmes.
By combining data across all study waves it was possible to identify predictors of incidence and some other transitions. However, small sample size limited examination in some cases, particularly with regard to recovery and relapse. Consideration of potential ethnic differences was also constrained by sample size. Wave 4 of the NGS extended our knowledge of factors that predict starting and recommencing gambling, the onset of at-risk and problem gambling, relapse and recovery. Some of the risk factors for these various transitions are the same. However, some groups that were less likely to take up gambling had high at-risk and problem gambling incidence and prevalence rates. The strongest gambling participation predictors of at-risk and problem gambling onset included those found to be associated with the prevalence of these conditions in the NGS cross-sectional analyses, namely frequent participation in continuous forms of gambling, participation in multiple forms and high overall monthly gambling expenditure. While participation in almost all individual forms of gambling was associated with progression to at-risk or problem gambling, in some instances, relationships were very strong. For example, long typical EGM sessions (particularly in pub settings) and monthly or more frequent participation in EGMS overall, card games, housie or bingo, sports betting, short-term speculative investments, and overseas internet and off-shore gambling. Most of these factors remained in the multivariate analyses, as did participation in gambling-type games not for money, indicating that they all make independent contributions to prediction.As found in NGS cross-sectional analyses with regard to prevalence, Māori and Pacific ethnicity and a number of other sociodemographic factors were also associated with the development of at-risk and problem gambling. The Asian incidence rate was also higher than the European/Other rate, suggesting that in future, gambling-related problems may increase relatively for Asian people. Increased number of major life events, high deprivation, psychological distress, and substance use and misuse were additional predictors. A variety of methods used to stop gambling too much also predicted at-risk and problem gambling. Given that many participants report that these methods assist in controlling gambling this does not mean that they contribute to the development of gambling problems. It is likely that the association arises because these methods are more often used by people who are gambling heavily, losing control and seeking to moderate their gambling. While apparently of assistance in this regard, problem gamblers less often report that they help. Although many problem gamblers cease having problems without receiving professional help, for others problems are persistent and most appear to be prone to relapse in the longer term.
The incidence findings indicate that non-gamblers and non-problem gamblers have a low probability of developing at-risk and problem gambling. However, the large majority of the population is in these categories and, as a consequence, a substantial number of moderate-risk and problem gambler incident cases come from these sectors. The majority of low-risk gamblers also come from these sectors and low-risk and moderate-risk gamblers account for substantially more gambling-related harm than problem gamblers. Therefore, while there is merit in focusing problem gambling prevention programmes on at-risk gamblers, if the object is to reduce gambling-related harm more widely, both whole-of-population and indicated (targeted) prevention approaches will be required. To be effective these interventions will need to take account of long-standing and perhaps widening ethnic disparities. Māori and Pacific people continue to have very high problem gambling prevalence rates. The finding of similar, if not greater, disparities in incidence rates means that unless more is done to address
101New Zealand National Gambling Study: Wave 4 (2015)Provider No: 467589, Agreement No: 349827/00Auckland University of Technology, Gambling and Addictions Research Centre Final Report Number 6, 29 March 2018

these disparities Māori and Pacific communities will continue to be disproportionately affected by gambling-related morbidities and harm. The present findings suggest that in future Asian and some migrant groups may also experience elevated harm. While not clear in the current study wave, in the previous wave there were indications that Māori and Pacific problem gamblers may experience more persistent and relapsing problems. This may also be the case for Asian people. If these groups are more prone to having chronic problems, current ethnic differences can be expected to increase even further in the future.
Gambling availability and participation are necessary conditions for the development of problem gambling and gambling-related harm more widely. Participation, particularly frequent participation in EGMs and some other continuous forms, is very strongly implicated in at-risk and problem gambling onset, persistence and relapse. Consequently, policies directed at reducing the availability of these gambling activities and programmes directed towards the promotion of moderation have a significant role in reducing gambling-related harm. Consideration also needs to be given to gambling-type games not for money as participation in these activities is both moderately high and implicated in the development of at-risk and problem gambling. Given their particularly strong association with harm and their widespread availability, a continued focus on EGMs is warranted. While the number of venues and machines have reduced substantially during the past decade they remain readily accessible, especially in geographical areas where there are substantial numbers of residents with attributes that increase their vulnerability to the development of gambling and related problems. These attributes include low prior involvement in high-risk gambling forms (e.g. Pacific and Asian people, some recent migrant groups and people with non-Christian religions), Māori, low income and socio-economic status, unemployment, high exposure to major life events and ongoing stressors, low social capital and high rates of mental health and addictive disorders.
While reducing gambling exposure and participation through supply and demand reduction are important, they are unlikely to be sufficient on their own. Participation has decreased markedly over the past 15 or so years yet harm has plateaued. To further reduce gambling-related harm, increased attention will need to be given to other modifiable risk and protective factors. Programmes and policies that address some of these risk factors (e.g. economic and social disparities, employment and educational attainment), have relevance to numerous morbidities and harms additional to those more directly stemming from gambling. These morbidities include mental health and addiction disorders generally.
102New Zealand National Gambling Study: Wave 4 (2015)Provider No: 467589, Agreement No: 349827/00Auckland University of Technology, Gambling and Addictions Research Centre Final Report Number 6, 29 March 2018

6 REFERENCES
Abbott, M.W. (2001). Problem and non-problem gamblers in New Zealand: A report on phase two of the 1999 national prevalence survey. Wellington: Department of Internal Affairs.
Abbott, M. (2006). Do EGMs and problem gambling go together like a horse and carriage? Gambling Research: Journal of the National Association for Gambling Studies (Australia), 18(1), 7-38.
Abbott, M.W. (2007). Situational factors that affect gambling behavior. In G. Smith, D.C. Hodgins, & R.J. Williams (Eds.), Research and measurement issues in gambling studies (pp. 251-278). Boston: Academic Press.
Abbott, M. (2017a). Beyond Reno: A critical commentary on Hancock and Smith [Advance online publication]. International Journal of Mental Health and Addiction. doi:10.1007/s11469-017-9794-3
Abbott, M. (2017b). Gambling and gambling harm in New Zealand: A 28-year case study [Advance online publication]. International Journal of Mental Health and Addiction. doi:10.1007/s11469-017-9767-6
Abbott, M. (2017c). Public health and diagnostic considerations of gambling disorder. Invited paper presented at the WHO Forum on alcohol, drugs and addictive behaviours, 26-28 June 2017. Geneva, Switzerland. (Available from the WHO Headquarters)
Abbott, M.W. (2017d). Commentary on Currie et al. (2017): Low‐risk gambling limits - a bridge too far? Addiction, 112(11), 2021-2022.
Abbott, M., Bellringer, M., Garrett, N., Mundy-McPherson, S. (2014a). New Zealand 2012 National Gambling Study: Overview and gambling participation. Report number 1. Auckland: Auckland University of Technology, Gambling and Addictions Research Centre.
Abbott, M., Bellringer, M., Garrett, N., Mundy-McPherson, S. (2014b). New Zealand 2012 National Gambling Study: Gambling harm and problem gambling. Report number 2. Auckland: Auckland University of Technology, Gambling and Addictions Research Centre.
Abbott, M., Bellringer, M., Garrett, N., & Mundy-McPherson, S. (2015a). New Zealand 2012 National Gambling Study: Attitudes towards gambling. Report Number 3. Auckland: Gambling and Addictions Research Centre, Auckland University of Technology.
Abbott, M., Bellringer, M., Garrett, N., & Mundy-McPherson, S. (2015b). New Zealand National Gambling Study: Wave 2 (2013). Report Number 4. Auckland: Gambling and Addictions Research Centre, Auckland University of Technology.
Abbott, M., Bellringer, M., Palmer du Preez, K., Pearson, J., Vandal, A., Garrett, N., & Hodgins, D. (2015c). Randomised controlled trial of problem gambling brief telephone interventions: Three years later. Auckland: Auckland University of Technology, Gambling and Addictions Research Centre.
103New Zealand National Gambling Study: Wave 4 (2015)Provider No: 467589, Agreement No: 349827/00Auckland University of Technology, Gambling and Addictions Research Centre Final Report Number 6, 29 March 2018

Abbott, M., Bellringer, M., Garrett, N., & Mundy-McPherson, S. (2016a). New Zealand National Gambling Study: Wave 3 (2014). Report Number 5. Auckland: Gambling and Addictions Research Centre, Auckland University of Technology.
Abbott, M., Binde, P., Clark, L., Hodgins, D., Korn, D., Pereira, A., . . . Walker, D. (2015d). Conceptual framework of harmful gambling: An international collaboration revised edition . Ontario, Canada: Gambling Research Exchange Ontario (GREO). Retrieved from https://dspace.ucalgary.ca/bitstream/1880/51023/1/Conceptual_Framework_Oct_26_2015.pdf
Abbott, M.W., & Clarke, D. (2007). Prospective problem gambling research: Contribution and potential. International Gambling Studies, 7(1), 123-144.
Abbott, M.W., Romild, U., & Volberg, R.A. (2014c). Gambling and problem gambling in Sweden: Changes between 1998 and 2009. Journal of Gambling Studies, 30(4), 985-999.
Abbott, M.W., Romild, U., & Volberg, R. (2017). The prevalence, incidence, and gender and age-specific incidence of problem gambling: Results of the Swedish longitudinal gambling Study (Swelogs). Addiction. DOI 10.1111/add.14083
Abbott, M., Stone, C.A., Billi, R., & Yeung, K. (2016b). Gambling and problem gambling in Victoria, Australia: Changes over 5 years. Journal of Gambling Studies, 32(1), 47-78.
Abbott, M.W., & Volberg, R. (1991). Gambling and problem gambling in New Zealand: Report on phase one of the national survey. Wellington: Department of Internal Affairs.
Abbott, M.W., & Volberg, R.A. (1992). Frequent and problem gambling in New Zealand. Wellington: Department of Internal Affairs.
Abbott, M.W., & Volberg, R.A. (1996). The New Zealand national survey of problem and pathological gambling. Journal of Gambling Studies, 12(2), 143-160.
Abbott, M.W., & Volberg, R.A. (1999). Gambling and problem gambling in the community: An international overview and critique. Wellington: Department of Internal Affairs.
Abbott, M.W., & Volberg, R.A. (2000). Taking the pulse on gambling and problem gambling in New Zealand: A report on phase one of the 1999 national prevalence survey. Wellington: Department of Internal Affairs.
Abbott, M.W., & Volberg, R.A. (2006). The measurement of adult problem and pathological gambling. International Gambling Studies, 6(2), 175-200.
Abbott, M., Volberg, R., Bellringer, M., & Reith, G. (2004a). A review of research on aspects of problem gambling.Report to the Responsibility in Gambling Trust, United Kingdom . Auckland: Auckland University of Technology, Gambling Research Centre. Retrieved from http://www.gla.ac.uk/media/media_34551_en.pdf
Abbott, M.W., Volberg, R.A., & Williams, M.M. (1999). Seven years on: A follow-up study of frequent and problem gamblers living in the community. Wellington: Department of Internal Affairs.
Abbott, M.W., Williams, M.M., & Volberg, R.A. (2004b). A prospective study of problem and regular non-problem gamblers living in the community. Substance Use & Misuse, 39(6), 855-884.
104New Zealand National Gambling Study: Wave 4 (2015)Provider No: 467589, Agreement No: 349827/00Auckland University of Technology, Gambling and Addictions Research Centre Final Report Number 6, 29 March 2018

Afifi, T.O., Nicholson, R., Martins, S.S., & Sareen, J. (2016). A longitudinal study of the temporal relation between problem gambling and mental and substance use disorders among young adults. The Canadian Journal of Psychiatry, 61(2), 102-111.Allen+Clarke. (2015). Informing the 2015 gambling harm needs assessment. Final Report for the Ministry of Health. Retrieved fromhttps://www.health.govt.nz/system/files/documents/publications/informing-2015-gambling-harm-needs-assessmnt-jul15.pdf
American Psychiatric Association. (2013). Diagnostic and statistical manual of mental Disorders, 5th ed. Washington DC: American Psychiatric Association.
Amey, B. (2005). People’s participation in and attitudes to gaming 1985-2005: Results of the 2005 survey. Wellington: Department of Internal Affairs.
Armstrong, A.R., Thomas, A., & Abbott, M. (2017). Gambling participation, expenditure and risk of harm in Australia, 1997-1998 and 2010-2011 [Advance online publication]. Journal of Gambling Studies. doi:10.1007/s10899-017-9708-0
Bellringer, M., Garrett, N., Kolandai-Matchett, K., & Abbott, M. (2015). Offshore gambling by New Zealanders study. Auckland: Auckland University of Technology, Gambling and Addictions Research Centre.
Bellringer, M., Pulford, J., Abbott, M., DeSouza, R., & Clarke, D. (2008). Problem gambling-barriers to help-seeking behaviours. Auckland: Auckland University of Technology, Gambling and Addictions Research Centre.
Billi, R., Stone, C.A., Abbott, M., & Yeung, K. (2015). The Victorian Gambling Study (VGS) A longitudinal study of gambling and health in Victoria 2008-2012: Design and methods. International Journal of Mental Health and Addiction, 13(2), 274-296.
Billi, R., Stone, C.A., Marden, P., & Yeung, K. (2014). The Victorian Gambling Study: A longitudinal study of gambling and health in Victoria, 2008-2012. Melbourne: Victorian Responsible Gambling Foundation.
Binde, P. (2011). What are the most harmful forms of gambling? Analyzing problem gambling prevalence surveys. Center for Public Sector Research (CEFOS) working papers 12 (1653-3895). Gothenburg, Sweden: University of Gothenburg.
Binde, P., Romild, U., & Volberg, R.A. (2017). Forms of gambling, gambling involvement and problem gambling: Evidence from a Swedish population survey. International Gambling Studies, 17(3), 490-507.
Blaszczynski, A., Dumlao, V., & Lange, M. (1997). "How much do you spend gambling?" Ambiguities in survey questionnaire items. Journal of Gambling Studies, 13(3), 237-252.
Bogart, W.A. (2011). Permit but discourage: Regulating excessive consumption. New York: Oxford University Press.
Browne, M., Bellringer, M., Greer, N., Kolandai-Matchett, K., Rawat, V., Langham, E., . . . Abbott, M. (2017). Measuring the burden of gambling harm in New Zealand. Wellington: Ministry of Health.
105New Zealand National Gambling Study: Wave 4 (2015)Provider No: 467589, Agreement No: 349827/00Auckland University of Technology, Gambling and Addictions Research Centre Final Report Number 6, 29 March 2018

Browne, M., Langham, E., Rawat, V., Greer, N., Li, E., Rose, J., . . . Goodwin, B. (2016). Assessing gambling-related harm in Victoria: A public health perspective. Melbourne: Victorian Responsible Gambling Foundation.
Bruneau, M., Grall-Bronnec, M., Vénisse, J.-L., Romo, L., Valleur, M., Magalon, D., . . . Challet-Bouju, G. (2016). Gambling transitions among adult gamblers: A multi-state model using a Markovian approach applied to the JEU cohort. Addictive Behaviors, 57, 13-20.
Calado, F., & Griffiths, M. D. (2016). Problem gambling worldwide: An update and systematic review of empirical research (2000-2015). Journal of Behavioral Addictions, 5(4), 592-613.
Centre for Social and Health Outcomes Research and Evaluation & Te Ropu Whariki. (2008). Assessment of the social impacts of gambling in New Zealand. Report to Ministry of Health . Auckland,: Massey University. Retrieved fromhttp://www.health.govt.nz/system/files/documents/pages/social-impacts-gambling-nz08.pdf
Chetwynd, J. (1997). Problem gambling. In P.M. Ellis & S.C.D. Collings (Eds.), Mental health in New Zealand from a public health perspective (pp. 405-411). Wellington: Ministry of Health.
Christoffel, P. (1992). People's participation in and attitudes towards gambling. Wellington: Department of Internal Affairs.
Clarke, D., Abbott, M., DeSouza, R., & Bellringer, M. (2007). An overview of help seeking by problem gamblers and their families including barriers to and relevance of services. International Journal of Mental Health and Addiction, 5(4), 292-306.
Conolly, A., Fuller, E., Jones, H., Maplethorpe, N., Sondaal, A., & Wardle, H. (2017). Gambling behaviour in Great Britain in 2015: Evidence from England, Scotland and Wales. London: NatCen Social Research.
Cornish, D.B. (1978). Gambling: A review of the literature and its implications for policy and research. London: HMSO.
Currie, S.R., Hodgins, D.C., & Casey, D.M. (2013). Validity of the problem gambling severity index interpretive categories. Journal of Gambling Studies, 29(2), 311-327.
Currie, S.R., Hodgins, D.C., Casey, D.M., el‐Guebaly, N., Smith, G.J., Williams, R.J., & Schopflocher, D.P. (2017). Deriving low‐risk gambling limits from longitudinal data collected in two independent Canadian studies [Advance online publication]. Addiction. doi:10.1111/add.13909
Currie, S.R., Hodgins, D.C., Wang, J., El‐Guebaly, N., Wynne, H., & Chen, S. (2006). Risk of harm among gamblers in the general population as a function of level of participation in gambling activities. Addiction, 101(4), 570-580.
Currie, S.R., Hodgins, D.C., Wang, J., el-Guebaly, N., Wynne, H., & Miller, N.V. (2008). Replication of low-risk gambling limits using Canadian provincial gambling prevalence data. Journal of Gambling Studies, 24(3), 321-335.
106New Zealand National Gambling Study: Wave 4 (2015)Provider No: 467589, Agreement No: 349827/00Auckland University of Technology, Gambling and Addictions Research Centre Final Report Number 6, 29 March 2018

Davidson, T., Rodgers, B., Taylor-Rodgers, E., Suomi, A., & Lucas, M. (2015). 2014 survey on gambling, health and wellbeing in the ACT. Canberra: Australian National University, Centre for Gambling Research.
Deming, W.E., & Stephan, F.F. (1940). On a least squares adjustment of a sample frequency table when the expected marginal totals are known. Annals of Mathematical Statistics, 11, 427-444.
Department of Internal Affairs. (2007). People's participation in, and attitudes to, gambling 1985-2005: Results of the 2005 survey. Wellington: Department of Internal Affairs. Retrieved from http://www.dia.govt.nz/Pubforms.nsf/URL/GamblingParticipationSurvey1985-2005.pdf/$file/GamblingParticipationSurvey1985-2005.pdf
Department of Internal Affairs. (2017a). Gaming machine numbers: June 1994 to March 2017 at 3-monthly intervals. Retrieved fromhttps://www.dia.govt.nz/diawebsite.nsf/wpg_URL/Resource-material-Information-We-Provide-Timeline-of-Gaming-Machine-Numbers-from-June-1994
Department of Internal Affairs. (2017b). Gambling expenditure statistics. Retrieved from https://www.dia.govt.nz/diawebsite.nsf/wpg_URL/Resource-material-Information-We-Provide-Gambling-Expenditure-Statistics
Devlin, M.E., & Walton, D. (2012). The prevalence of problem gambling in New Zealand as measured by the PGSI: Adjusting prevalence estimates using meta-analysis. International Gambling Studies, 12(2), 177-197.
Dussault, F., Brunelle, N., Kairouz, S., Rousseau, M., Leclerc, D., Tremblay, J., . . . Dufour, M. (2017). Transition from playing with simulated gambling games to gambling with real money: A longitudinal study in adolescence. International Gambling Studies, 17(3), 386-400.
el-Guebaly, N., Casey, D.M., Currie, S.R., Hodgins, D.C., Schopflocher, D.P., Smith, G.J., & Williams, R.J. (2015). The Leisure, Lifestyle & Lifecycle Project (LLLP): A longitudinal study of gambling in Alberta. Final report for the Alberta Gambling Research Institute. Canada: Alberta Gambling Research Institute.
Ferris, J., & Wynne, H. (2001). The Canadian Problem Gambling Index: Final report. Ottawa: Canadian Centre on Substance Abuse.
Gainsbury, S. (2012). Internet gambling: Current research findings and implications. New York: Springer.
Gainsbury, S.M., Hing, N., Delfabbro, P., Dewar, G., & King, D.L. (2015). An exploratory study of interrelationships between social casino gaming, gambling, and problem gambling. International Journal of Mental Health and Addiction, 13(1), 136-153.
Gainsbury, S.M., Russell, A.M., King, D.L., Delfabbro, P., & Hing, N. (2016). Migration from social casino games to gambling: Motivations and characteristics of gamers who gamble. Computers in Human Behavior, 63, 59-67.
Gambling Act 2003. Gambling Act 2003 (Public Act 2003 No 51), New Zealand Statutes. Retrieved from http://www.legislation.govt.nz/act/public/2003/0051/latest/whole.html
107New Zealand National Gambling Study: Wave 4 (2015)Provider No: 467589, Agreement No: 349827/00Auckland University of Technology, Gambling and Addictions Research Centre Final Report Number 6, 29 March 2018

Gambling Review Body. (2001). Gambling review report. Norwich: HMSO.
Grant, D. (1994). On a roll: A history of gambling and lotteries in New Zealand. Wellington: Victoria University Press.
Griffiths, M.D. (2015). Adolescent gambling and gambling-type games on social networking sites: Issues, concerns, and recommendations. Aloma: Revista de Psicologia, 33(2), 31-37.
Hancock, L., & Smith, G. (2017). Critiquing the Reno model I-IV international influence on regulators and governments (2004–2015): The distorted reality of “responsible gambling” [Advance online publication]. International Journal of Mental Health and Addiction. doi:10.1007/s11469-017-9746-y
Health Sponsorship Council. (2012). New Zealanders’ knowledge, views and experience of gambling and gambling harm: Results from the 2010 Health and Lifestyles Survey. Retrieved from http://www.hsc.org.nz/researchpublications.html.
Hodgins, D.C., Stea, J.N., & Grant, J.E. (2011). Gambling disorders. The Lancet, 378(9806), 1874-1884.
Jonsson, J., Abbott, M.W., Sjöberg, A., & Carlbring, P. (2017). Measuring gambling reinforcers, over consumption and fallacies: The psychometric properties and predictive validity of the Jonsson-Abbott Scale. Frontiers in Psychology, 8(1807). Retrieved from https://doi.org/10.3389/fpsyg.2017.01807
Kairouz, S., Paradis, C., & Monson, E. (2016). Gender, gambling settings and gambling behaviours among undergraduate poker players. International Gambling Studies, 16(1), 85-97.
Kessler, R., & Mroczek, D. (1994). Final versions of our Non-Specific Psychological Distress Scale. Written communication-memo dated 10/3/94. Ann Arbour (MI), Surrey Research Center of the Institute for Social Research, University of Michigan.
King, D.L., & Delfabbro, P.H. (2016). Early exposure to digital simulated gambling: A review and conceptual model. Computers in Human Behavior, 55, 198-206.
King, D.L., Gainsbury, S.M., Delfabbro, P.H., Hing, N., & Abarbanel, B. (2015). Distinguishing between gaming and gambling activities in addiction research. Journal of Behavioral Addictions, 4(4), 215-220.
Kolandai-Matchett, K., Bellringer, M., Landon, J., & Abbott, M. (2015). Evaluation of problem gambling public health services: An analysis of provider progress reports. Auckland: Auckland University of Technology, Gambling and Addictions Research Centre.
Kolandai-Matchett, K., Bellringer, M., Landon, J., & Abbott, M. (2017). A process evaluation of the ‘Aware’ and ‘Supportive Communities’ gambling harm-minimisation programmes in New Zealand [Advance online publication]. The European Journal of Public Health. doi:https://doi-org.ezproxy.aut.ac.nz/10.1093/eurpub/ckx120
Kruse, K., White, J., Walton, D.K., & Tu, D. (2016). Changes in risky gambling prevalence among a New Zealand population cohort. International Gambling Studies, 16(2), 328-346.
108New Zealand National Gambling Study: Wave 4 (2015)Provider No: 467589, Agreement No: 349827/00Auckland University of Technology, Gambling and Addictions Research Centre Final Report Number 6, 29 March 2018

Langham, E., Thorne, H., Browne, M., Donaldson, P., Rose, J., & Rockloff, M. (2016). Understanding gambling related harm: A proposed definition, conceptual framework, and taxonomy of harms. BMC Public Health, 16(1). doi:10.1186/s12889-016-2747-0
Leonard, C.A., & Williams, R.J. (2016). The relationship between gambling fallacies and problem gambling. Psychology of Addictive Behaviors, 30(6), 694-704.
Lesieur, H.R., & Blume, S.B. (1987). The South Oaks Gambling Screen (SOGS): A new instrument for the identification of pathological gamblers. American Journal of Psychiatry, 144(9), 1184-1188. doi:10.1176/ajp.144.9.1184Luce, C., Nadeau, L., & Kairouz, S. (2016). Pathways and transitions of gamblers over two years. International Gambling Studies, 16(3), 357-372.
Markham, F., Young, M., & Doran, B. (2016). The relationship between player losses and gambling‐related harm: Evidence from nationally representative cross‐sectional surveys in four countries. Addiction, 111(2), 320-330.
Ministry of Health. (2004). Preventing and minimising gambling harm: Strategic plan 2004-2010, needs assessment, proposed three-year funding plan, proposed problem gambling levy rates. Wellington: Ministry of Health. Retrieved from http://www.moh.govt.nz/NoteBook/nbbooks.nsf/0/C614453204ECCF41CC256E680078134B/$file/ProblemGamblingConsultation.pdf
Ministry of Health. (2005). Preventing and minimising gambling harm: Three-year funding plan 2004-2007. Wellington: Ministry of Health. Retrieved from http://www.moh.govt.nz/notebook/nbbooks.nsf/0/dd9d4088046c3880cc256fc30071223f/$FILE/problemgambling-threeyearfundingplan-2004-2007.pdf
Ministry of Health. (2007). Preventing and minimising gambling harm: Three-year service plan 2007-2010. Wellington: Ministry of Health. Retrieved from http://www.health.govt.nz/publication/preventing-and-minimising-gambling-harm-three-year-service-plan-2007-2010
Ministry of Health. (2008). Raising the Odds? Gambling behaviour and neighbourhood access to gambling venues in New Zealand. Wellington: Ministry of Health.
Ministry of Health. (2009). A focus on problem gambling: Results of the 2006/07 New Zealand Health Survey. Wellington: Ministry of Health.
Ministry of Health. (2010). Preventing and minimising gambling harm: Three-year service plan 2010/11–2012/13. Wellington: Ministry of Health. Retrieved from http://www.health.govt.nz/publication/preventing-and-minimising-gambling-harm-three-year-service-plan-2010-11-2012-13
Ministry of Health. (2013). Preventing and minimising gambling harm: Three year service plan and levy rates for 2013/14 to 2015/16. Wellington: Ministry of Health. Retrieved from http://www.health.govt.nz/publication/preventing-and-minimising-gambling-harm-three-year-service-plan-and-levy-rates-2013-14-2015-16
109New Zealand National Gambling Study: Wave 4 (2015)Provider No: 467589, Agreement No: 349827/00Auckland University of Technology, Gambling and Addictions Research Centre Final Report Number 6, 29 March 2018

Ministry of Health. (2016). Strategy to prevent and minimise gambling harm 2016/17 to 2018/19. Wellington: Ministry of Health. Retrieved from http://www.health.govt.nz/publication/strategy-prevent-and-minimise-gambling-harm-2016-17-2018-19
Mitzner, G.B., Whelan, J.P., & Meyers, A.W. (2011). Comments from the trenches: Proposed changes to the DSM-V classification of pathological gambling. Journal of Gambling Studies, 27(3), 517-521.
Mutti-Packer, S., Kowatch, K., Steadman, R., Hodgins, D.C., el-Guebaly, N., Casey, D.M., Currie, S.R., Williams, R,. & Smith, G. (2017). A qualitative examination of factors underlying transitions in problem gambling severity: Findings from the Leisure, Lifestyle, & Lifecycle Project, Addiction Research and Theory. doi: 10.1080/16066359.2017.1307967
National Research Council. (1999). Pathological gambling: A critical review. Washington D.C.: National Academies Press.
Olason, D.T., Hayer, T., Brosowski, T., & Meyer, G. (2015). Gambling in the mist of economic crisis: Results from three national prevalence studies from Iceland. Journal of Gambling Studies, 31(3), 759-774.
Orford, J. (2005). Disabling the public interest: Gambling strategies and policies for Britain. Addiction, 100(9), 1219-1225.
Parhami, I., Mojtabai, R., Rosenthal, R.J., Afifi, T.O., & Fong, T.W. (2014). Gambling and the onset of comorbid mental disorders: A longitudinal study evaluating severity and specific symptoms. Journal of Psychiatric Practice, 20(3), 207-219.
Petry, N.M. (2005). Pathological gambling: Etiology, comorbidity, and treatment. Washington, DC: American Psychological Association.
Productivity Commission. (1999). Australia’s gambling industries. Report number 10. Canberra: AusInfo.
Petry, N.M., Blanco, C., Auriacombe, M., Borges, G., Bucholz, K., Crowley, T.J., . . . O’Brien, C. (2014). An overview of and rationale for changes proposed for pathological gambling in DSM-5. Journal of Gambling Studies, 30(2), 493-502.
Public Health Agency of Sweden. (2016). Gambling and gambling problems in Sweden 2008-2010. Swedish longitudinal gambling study, SWELOGS: Findings from wave one and wave two. Sweden: Public Health Agency of Sweden.
Pulford, J., Bellringer, M., Abbott, M., Clarke, D., Hodgins, D., & Williams, J. (2009a). Barriers to help-seeking for a gambling problem: The experiences of gamblers who have sought specialist assistance and the perceptions of those who have not. Journal of Gambling Studies, 25(1), 33-48.
Pulford, J., Bellringer, M., Abbott, M., Clarke, D., Hodgins, D., & Williams, J. (2009b). Reasons for seeking help for a gambling problem: The experiences of gamblers who have sought specialist assistance and the perceptions of those who have not. Journal of Gambling Studies, 25(1), 19-32.
110New Zealand National Gambling Study: Wave 4 (2015)Provider No: 467589, Agreement No: 349827/00Auckland University of Technology, Gambling and Addictions Research Centre Final Report Number 6, 29 March 2018

Quilty, L.C., Avila Murati, D., & Bagby, R.M. (2014). Identifying indicators of harmful and problem gambling in a Canadian sample through receiver operating characteristic analysis. Psychology of Addictive Behaviors, 28(1), 229-237.
Rash, C.J., Weinstock, J., & van Patten, R. (2016). A review of gambling disorder and substance use disorders. Substance Abuse & Rehabilitation, 7, 3-13.
Reid, K., & Searle, W. (1996). People's participation in and attitudes towards gambling: Final results of the 1995 survey. Wellington: Department of Internal Affairs. Retrieved from http://citeseerx.ist.psu.edu.ezproxy.aut.ac.nz/viewdoc/download?doi=10.1.1.515.3413&rep=rep1&type=pdf
Romild, U., Volberg, R., & Abbott, M. (2014). The Swedish Longitudinal Gambling Study (Swelogs): Design and methods of the epidemiological (EP-) track. International journal of methods in psychiatric research, 23(3), 372-386.
Rose, G., & Day, S. (1990). The population mean predicts the number of deviant individuals. British Medical Journal, 301(6759), 1031-1034.
Rossen, F. (2015). Gambling and problem gambling: Results of the 2011/12 New Zealand health survey. Auckland: The University of Auckland, Centre for Addiction Research.
Salmond, C., Crampton, P., King, P., & Waldegrave, C. (2006). NZiDep: A New Zealand index of socioeconomic deprivation for individuals. Social Science and Medicine, 62, 1474-1485.
Saunders, J.B., Aasland, O.G., Babor, T.F., De La Fuente, J.R., & Grant, M. (1993). Development of the Alcohol Use Disorders Identification Test (AUDIT): WHO collaborative project on early detection of persons with harmful alcohol consumption-II. Addiction 88, 791-804.
Schmidt, S., Muhlan, H., & Power, M. (2005). The EUROHIS-QOL 8-item index: Psychometric results of a cross-cultural field study. European Journal of Public Health, 16(4), 420-428.
Shaffer, H.J., Hall, M.N., & Vander Bilt, J. (1997). Estimating the prevalence of disordered gambling behavior in the United States and Canada: A meta-analysis. Boston, MA: Harvard Medical School, Division of Addictions.
Shaffer, H.J., & Korn, D.A. (2002). Gambling and related mental disorders: A public health analysis. Annual review of public health, 23(1), 171-212.
Slutske, W.S. (2007). Longitudinal studies of gambling behavior. In G. Smith, D. Hodgins, & R.J. Williams (Eds.), Research and measurement issues in gambling studies (pp. 127-154). Elsevier: Academic Press.
Slutske, W.S., Jackson, K.M., & Sher, K.J. (2003). The natural history of problem gambling from age 18 to 29. Journal of Abnormal Psychology, 112(2), 263-274.
Stevens, M., & Young, M. (2010). Who plays what? Participation profiles in chance versus skill-based gambling. Journal of Gambling Studies, 26(1), 89-103.
111New Zealand National Gambling Study: Wave 4 (2015)Provider No: 467589, Agreement No: 349827/00Auckland University of Technology, Gambling and Addictions Research Centre Final Report Number 6, 29 March 2018

Stone, C.A., Romild, U., Abbott, M., Yeung, K., Billi, R., & Volberg, R. (2015). Effects of different screening and scoring thresholds on PGSI gambling risk segments. International Journal of Mental Health and Addiction, 13(1), 82-102.
Storer, J., Abbott, M., & Stubbs, J. (2009). Access or adaptation? A meta-analysis of surveys of problem gambling prevalence in Australia and New Zealand with respect to concentration of electronic gaming machines. International Gambling Studies, 9(3), 225-244.
The Data Team. (2017). The world’s biggest gamblers. Retrieved from http://www.economist.com/blogs/graphicdetail/2017/02/daily-chart-4
Thimasarn-Anwar, T., Squire, H., Trowland, H., & Martin, G. (2017). Gambling report: Results from the 2016 Health and Lifestyles Survey. Wellington: Health Promotion Agency Research and Evaluation Unit.
Tu, D. (2013). New Zealanders’ participation in gambling: Results from the 2012 Health and Lifestyles Survey. Wellington: Health Promotion Agency.Tu, D., Gray, R.J., & Walton, D.K. (2014). Household experience of gambling-related harm by socio-economic deprivation in New Zealand: Increases in inequality between 2008 and 2012. International Gambling Studies, 14(2), 330-344.
Vasiliadis, S.D., Jackson, A.C., Christensen, D., & Francis, K. (2013). Physical accessibility of gaming opportunity and its relationship to gaming involvement and problem gambling: A systematic review. Journal of Gambling Issues, 28, 1-46. doi:10.4309/jgi.2013.28.2
Victorian Responsible Gambling Foundation. (2011). The Victorian Gambling Study: A longitudinal study of gambling and public health - Wave Two findings. Melbourne: Victorian Responsible Gambling Foundation.
Victorian Responsible Gambling Foundation. (2012). The Victorian Gambling Study: A longitudinal study of gambling and public health - Wave Three findings. Melbourne: Victorian Responsible Gambling Foundation.
Volberg, R.A., & Abbott, M.W. (1994). Lifetime prevalence estimates of pathological gambling in New Zealand. International Journal of Epidemiology, 23(5), 976-983.
Volberg, R.A., Dickerson, M.G., Ladouceur, R., & Abbott, M.W. (1996). Prevalence studies and the development of services for problem gamblers and their families. Journal of Gambling Studies, 12(2), 215-231.
Walker, S.E., Abbott, M.W., & Gray, R.J. (2012). Knowledge, views and experiences of gambling and gambling-related harms in different ethnic and socio-economic groups in New Zealand. Australian and New Zealand Journal of Public Health, 36(2), 153-159.
Welte, J.W., Barnes, G.M., Tidwell, M.C.O., Hoffman, J.H., & Wieczorek, W.F. (2015). Gambling and problem gambling in the United States: Changes between 1999 and 2013. Journal of Gambling Studies, 31(3), 695-715.
Wildman, R.W. (1998). Gambling: An attempt at an integration. Alberta: Wynne Resources.
Williams, R.J., Hann, R.G., Schopflocher, D.P., West, B.L., McLaughlin, P., White, N., . . . Flexhaug, T. (2015). Quinte longitudinal study of gambling and problem gambling. Ontario: Ontario Problem Gambling Research Centre.
112New Zealand National Gambling Study: Wave 4 (2015)Provider No: 467589, Agreement No: 349827/00Auckland University of Technology, Gambling and Addictions Research Centre Final Report Number 6, 29 March 2018

Williams, R.J., Volberg, R.A., & Stevens, R.M.G. (2012a). The population prevalence of problem gambling: Methodological influences, standardized rates, jurisdictional differences, and worldwide trends. Report prepared for the Ontario Problem Gambling Research Centre and the Ontario Ministry of Health and Long Term Care. Retrieved from http://hdl.handle.net/10133/3068
Williams, R.J., West, B.L., & Simpson, R.I. (2012b). Prevention of problem gambling: A comprehensive review of the evidence and identified best practices . Report prepared for the Ontario Problem Gambling Research Centre and The Ontario Ministry of Health and Long Term Care. Retrieved from https://www.uleth.ca/dspace/handle/10133/3121
Wither, A. (1988). Taking a gamble: A survey of public attitudes towards gambling in New Zealand. Wellington: Department of Internal Affairs.
113New Zealand National Gambling Study: Wave 4 (2015)Provider No: 467589, Agreement No: 349827/00Auckland University of Technology, Gambling and Addictions Research Centre Final Report Number 6, 29 March 2018

APPENDIX 1:Categorical values covered by attrition analyses
1. Demographic Age group Gender Ethnicity Region (Auckland, Wellington, Christchurch, rest of New Zealand)
2. Problem gambling PGSI risk level
3. Gambling participation Number of activities Frequency of gambling Pattern of participation (regular continuous, regular non-continuous, infrequent
gambling, non-gamblers)4. Help seeking behaviour
Sought formal help in last 12 months5. Others
Number of life events (None, 1, 2, 3 or more) Psychological distress (K-10).
114New Zealand National Gambling Study: Wave 4 (2015)Provider No: 467589, Agreement No: 349827/00Auckland University of Technology, Gambling and Addictions Research Centre Final Report Number 6, 29 March 2018
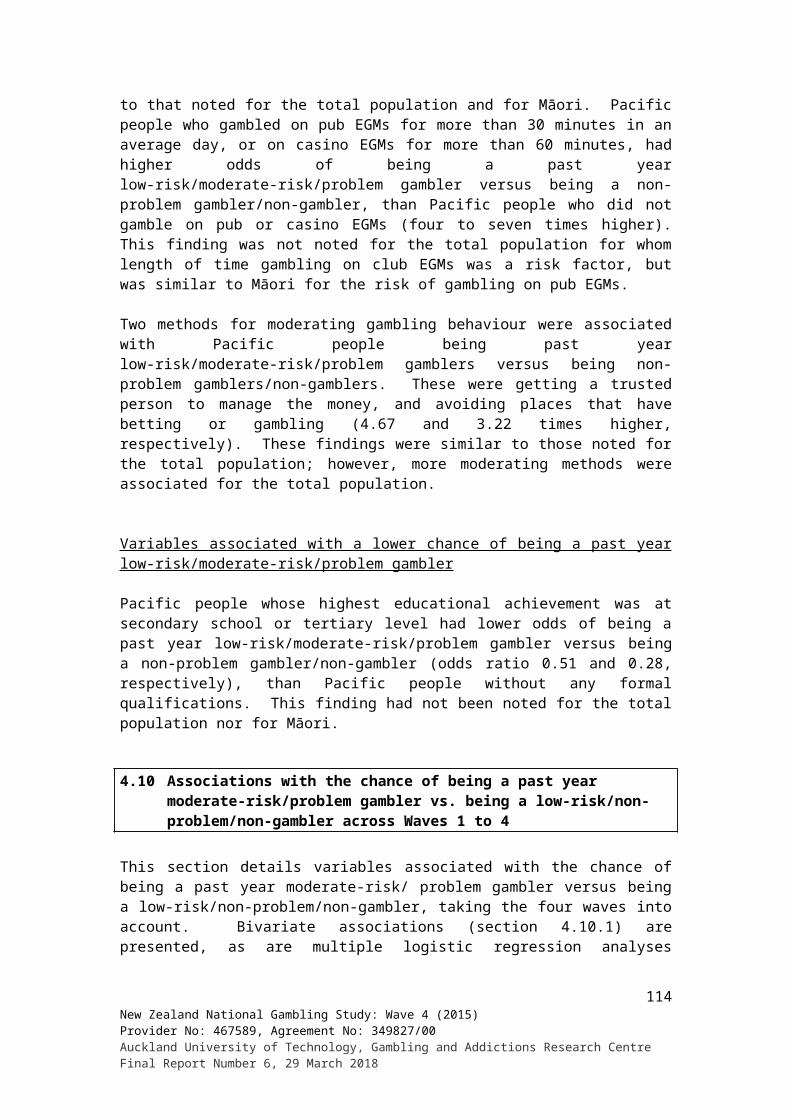
APPENDIX 2:Covariates for descriptive analysis
1. Sociodemographic variables Age group Gender Ethnicity Country of birth (New Zealand, other) Arrival in New Zealand Educational level (highest qualification) Religion Household size Region (Auckland, Wellington, Christchurch, rest of New Zealand) Employment/labour force status Annual personal income Annual household income NZ Individual Deprivation Index
2. Gambling participation Number of activities Pattern of participation (regular continuous, regular non-continuous, infrequent
gambling, non-gamblers) Frequency of gambling by gambling activity (listed in Appendix 5) Gambling expenditure by gambling activity (listed in Appendix 5) Most preferred activity Length of time spent gambling on gaming machines in a casino Length of time spent gambling on gaming machines in a pub Length of time spent gambling on gaming machines in a club Who they are with when gambling Gambling not for money
3. Management of gambling/help-seeking behaviour Methods used to stop gambling too much Sought formal help from problem gambling services in last 12 months
4. Other outcomes Number of life events (None, 1, 2, 3 or more) Quality of life (WHOQol-8) Psychological distress (K-10) Alcohol (AUDIT-C) Drug use Self-reported tobacco use.
115New Zealand National Gambling Study: Wave 4 (2015)Provider No: 467589, Agreement No: 349827/00Auckland University of Technology, Gambling and Addictions Research Centre Final Report Number 6, 29 March 2018

APPENDIX 3:Covariate for gambling risk level descriptive analysis
1. Sociodemographic variables Age group Gender Ethnicity Country of birth (New Zealand, other) Arrival in New Zealand Employment/labour force status NZ Individual Deprivation Index
2. Gambling participation Number of activities Pattern of participation (regular continuous, regular non-continuous, infrequent
gambling, non-gamblers) Frequency of gambling Gambling expenditure Length of time spent gambling on gaming machines in a casino Length of time spent gambling on gaming machines in a pub Length of time spent gambling on gaming machines in a club Who they are with when gambling Gambling not for money
3. Management of gambling/help-seeking behaviour Methods used to stop gambling too much Sought formal help from problem gambling services in last 12 months
4. Other outcomes Number of life events (None, 1, 2, 3 or more) Psychological distress (K-10).
116New Zealand National Gambling Study: Wave 4 (2015)Provider No: 467589, Agreement No: 349827/00Auckland University of Technology, Gambling and Addictions Research Centre Final Report Number 6, 29 March 2018

APPENDIX 4:Covariates for consideration in the inferential analyses
1. Sociodemographic variables (non-time varying) Age group in Wave 1 Gender Ethnicity Country of birth (New Zealand, other) Arrival in New Zealand
2. Sociodemographic variables ( potentiallytime varying) Educational level (highest qualification) Religion Household size Region (Auckland, Wellington, Christchurch, rest of New Zealand) Employment/labour force status Annual personal income Annual household income NZ Individual Deprivation Index
3. Gambling participation Number of activities Pattern of participation (regular continuous, regular non-continuous, infrequent
gambling, non-gamblers) Most preferred activity Overall frequency of gambling Overall gambling expenditure Annual participation by gambling activity (list in Appendix 5) Monthly participation by gambling activity (list in Appendix 5) Length of time spent gambling on gaming machines in a casino Length of time spent gambling on gaming machines in a pub Length of time spent gambling on gaming machines in a club Who they are with when gambling Gambling not for money
4. Management of gambling/help-seeking behaviour Methods used to stop gambling too much Sought formal help from problem gambling services in last 12 months
5. Other outcomes Number of life events (None, 1, 2, 3 or more) Quality of life (WHOQol-8) Psychological distress (K-10) Alcohol (AUDIT-C) Drug use Self-reported tobacco use.
117New Zealand National Gambling Study: Wave 4 (2015)Provider No: 467589, Agreement No: 349827/00Auckland University of Technology, Gambling and Addictions Research Centre Final Report Number 6, 29 March 2018

APPENDIX 5:Gambling activities for analysis
Card games Bets with friends/workmates Text game or competition Raffle/lottery (New Zealand or overseas) Lotto Keno Instant Kiwi/other scratch tickets Housie or bingo Horse/dog race betting Sports betting Casino table games or EGMS (overseas) Casino table games (New Zealand) Casino EGMs (New Zealand) Pub EGMs Club EGMs Short-term speculative investments
Including the following subtotals: Casino table games or EGMS (New Zealand) EGM (club + pub) EGMs overall (New Zealand) New Zealand internet gambling overall Overseas internet gambling overall
118New Zealand National Gambling Study: Wave 4 (2015)Provider No: 467589, Agreement No: 349827/00Auckland University of Technology, Gambling and Addictions Research Centre Final Report Number 6, 29 March 2018

APPENDIX 6:Wave 4 attrition from Wave 1 (unweighted numbers)
Baseline variables DescriptionWave
1Wave
2Wave
3Wave
4
% Retained
(Wave 1-4) p-value#
Gender Male 2642 1603 1316 1170 44Female 3609 2142 1799 1600 44 0.97
Age group (years) 18 - 24 571 259 188 158 2825 - 34 1069 574 453 390 3635 - 44 1261 783 650 577 4645 - 54 1195 758 650 587 4955 - 64 922 591 517 460 5065+ 1226 779 656 597 49 <0.0001Not reported 7 1 1 1 -
Ethnic group (prioritised)
Māori 1164 656 520 473 41Pacific 778 439 350 287 37Asian 798 403 322 282 35European/Other 3448 2209 1892 1702 49 <0.0001Not reported 63 38 31 26 -
Area of residence Auckland 2101 1225 1012 880 42Wellington 632 420 338 308 49Christchurch 342 230 193 179 52Rest of NZ 3176 1870 1572 1403 44 0.0003
Problem Gambling Severity Index score (PGSI)
No gambling in last year 1301 705 576 516 40Non-problem 4434 2759 2310 2053 46Low-risk 325 181 143 124 38Moderate-risk 133 67 56 51 38Problem gambler 58 33 30 26 45 <0.0001
Number of gambling activities participated in
0 1301 705 576 516 401 1353 789 668 584 432 1342 828 695 619 463 954 602 507 462 484-6 1069 689 560 496 467-9 204 116 98 83 4110+ 28 16 11 10 36 0.0005
Gambling frequency
At least weekly 1487 935 788 699 47At least monthly 1411 842 689 610 43At least 6 monthly 1601 1007 841 754 47At least once in past year 441 249 214 185 42
No gambling in last year 1301 705 576 516 40 0.0002Not reported 10 7 7 6 -
Pattern of participation
Not in last year 1301 705 576 516 40Infrequent gambler 3482 2118 1761 1564 45Regular non-continuous 1059 675 577 524 49Regular continuous 409 247 201 166 41 <0.0001
119New Zealand National Gambling Study: Wave 4 (2015)Provider No: 467589, Agreement No: 349827/00Auckland University of Technology, Gambling and Addictions Research Centre Final Report Number 6, 29 March 2018

Baseline variables DescriptionWave
1Wave
2Wave
3Wave
4
% Retained
(Wave 1-4) p-value#
Number of major life events
0 1774 1040 859 757 431 1620 982 824 741 462 1139 705 590 526 463 706 449 376 341 484 456 274 227 211 465+ 554 294 238 193 35 <0.0001Not reported 2 1 1 1 -
Psychological distress (Kessler-10)
Low 4494 2712 2251 2005 45Moderate 1196 736 610 544 45High 414 221 188 163 39Severe 142 75 65 57 40 0.12Not reported 5 1 1 1 -
Sought help from gambling treatment services
Yes 5 3 3 3 60
In last 12 months No 6251 3742 3112 2767 44 0.48Total 6251 3745 3115 2770 44
# p-values are chi-squares tests for association, excluding ‘Not reported’ and ‘missing’ categories** Note all measures relate to the 2012 baseline measures
120New Zealand National Gambling Study: Wave 4 (2015)Provider No: 467589, Agreement No: 349827/00Auckland University of Technology, Gambling and Addictions Research Centre Final Report Number 6, 29 March 2018

APPENDIX 7:Sociodemographic variables that could have changed over time
Demographic variablesWave 1 Wave 2 Wave 3 Wave 4
n % (95% CI) n % (95% CI) n % (95% CI) n % (95% CI)Labour force status
Employed 4004 64.1 (62.7, 65.5) 2472 66.0 (64.2, 67.8) 2079 66.6 (64.6, 68.5) 1844 66.6 (64.5, 68.7)
Unemployed 504 8.1 (7.3, 8.8) 274 7.3 (6.3, 8.4) 191 6.1 (5.2, 7.0) 190 6.9 (5.7, 8.0)
Student/Homemaker/Retired 1705 27.3 (26.0, 28.6) 987 26.4 (24.7, 28.0) 842 27.0 (25.2, 28.8) 736 26.6 (24.7, 28.5)
Other 36 0.6 (0.3, 0.8) 12 0.3 (0.2, 0.5) 11 0.4 (0.1, 0.6) 0 - Not reported 2 - 0 - 0 - 0 -Household size
1 606 9.7 (9.1, 10.3) 361 9.6 (8. 8, 10.5) 326 10.4 (9.4, 11.4) 294 10.6 (9.5, 11.7)
2 2168 34.7 (33.3, 36.1) 1310 35.0 (33.2, 36.8) 1063 34.1 (32.1, 36.0) 983 35.5 (33.3, 37.7)
3 1087 17.4 (16.3, 18.5) 712 19.0 (17.5, 20.6) 559 17.9 (16.2, 19.6) 482 17.4 (15.6, 19.3)
4 1286 20.6 (19.3, 21.8) 699 18.7 (17.1, 20.2) 614 19.7 (17.9, 21.4) 520 18.8 (16.8, 20.7)
5+ 1097 17.6 (16.3, 18.8) 664 17.7 (16.1, 19.3) 561 18.0 (16.1, 19.8) 491 17.7 (15.7, 19.7)
Not reported 5 0.1 (0.00, 0.20) 0 - 0 - 0 -Personal Income ($)
Up to 20,000 1954 33.2 (31.8, 34.7) 1112 30.8 (29.0, 32.6) 798 26.9 (25.0, 28.9) 701 26.0 (23.8, 28.1)
20,001 - 40,000 1601 27.2 (25.9, 28.6) 949 26.3 (24.6, 28.0) 808 27.3 (25.3, 29.2) 764 28.3 (26.1, 30.4)
40,001 - 60,000 1032 17.5 (16.4, 18.7) 719 19.9 (18.3, 21.5) 583 19.7 (17.9, 21.4) 497 18.4 (16.6, 20.2)
60,001 - 80,000 620 10.5 (9.6, 11.5) 378 10.5 (9.3, 11.6) 381 12.9 (11.4, 14.3) 362 13.4 (11.8, 15.0)
80,001 - 100,000 293 5.0 (4.3, 5.6) 196 5.4 94.6, 6.3) 171 5.8 (4.7, 6.8) 172 6.4 (5.3, 7.5)
121New Zealand National Gambling Study: Wave 4 (2015)Provider No: 467589, Agreement No: 349827/00Auckland University of Technology, Gambling and Addictions Research Centre Final Report Number 6, 29 March 2018

Demographic variablesWave 1 Wave 2 Wave 3 Wave 4
n % (95% CI) n % (95% CI) n % (95% CI) n % (95% CI) Over 100,000 383 6.5 (5.7, 7.3) 255 7.1 (6.0, 8.1) 224 7.5 (6.4, 8.7) 205 7.6 (6.4, 8.8) Missing 379 - 137 - 159 - 68 -
Demographic variablesWave 1 Wave 2 Wave 3 Wave 4
n % (95% CI) n % (95% CI) n % (95% CI) n % (95% CI)Household Income ($)
Up to 20,000 861 15.5 (14.5, 16.4) 497 14.1 (13.0, 15.2) 390 13.8 (12.5, 15.0) 360 13.7 (12.2, 15.2)
20,001 - 40,000 899 16.1 (15.0, 17.2) 552 15.7 (14.2, 17.1) 413 14.6 (12.9, 16.2) 353 13.4 (11.9, 15.0)
40,001 - 60,000 761 13.7 (12.6, 14.7) 482 13.7 (12.3, 15.0) 356 12.6 (11.1, 14.0) 339 12.9 (11.2, 14.6)
60,001 - 80,000 764 13.7 (12.6, 14.8) 446 12.7 (11.3, 14.0) 375 13.2 (11.7, 14.8) 336 12.8 (11.3, 14.3)
80,001 - 100,000 746 13.4 (12.3, 14.5) 493 14.0 (12.6, 15.4) 387 13.7 (12.1, 15.2) 339 12.9 (11.2, 14.6)
Over 100,000 1538 27.6 (26.2, 29.1) 1053 29.9 (28.0, 31.7) 913 32.2 (30.1, 34.3) 897 34.2 (31.9, 36.6)
Missing 681 - 222 - 290 - 146 -NZ Individual Deprivation Index
0 3540 56.6 (55.2, 58.1) 2275 60.8 (58.9, 62.6) 1998 64.0 (61.8, 66.1) 1866 67.4 (65.1, 69.7)
1 1348 21.6 (20.3, 22.8) 752 20.1 (18.5, 21.7) 560 17.9 (16.2, 19.7) 485 17.5 (15.5, 19.5)
2 683 10.9 (10.0, 11.9) 336 9.0 (7.9, 10.1) 262 8.4 (7.1, 9.7) 198 7.1 (6.0, 8.3) 3 271 4.3 (3.8, 4.9) 184 4.9 (4.1, 5.8) 153 4.9 (3.9, 5.9) 105 3.8 (2.7, 4.9) 4 201 3.2 (2.7, 3.7) 74 2.0 (1.5, 2.4) 72 2.3 (1.5, 3.1) 55 2.0 (1.4, 2.6) 5 106 1.7 (1.4, 2.0) 75 2.0 (1.3, 2.7) 40 1.3 (0.9, 1.7) 25 0.9 (0.6, 1.2) 6 61 1.0 (0.7, 1.2) 35 0.9 (0.6, 1.2) 20 0.6 (0.4, 0.9) 24 0.9 (0.4, 1.3) 7 30 0.5 (0.3, 0.6) 9 0.3 (0.1, 0.4) 14 0.4 (0.2, 0.6) 8 0.3 (0.1, 0.5)
8 9 0.1 (0.1, 0.2) 3 0.1 (0.0, 0.2) 4 0.1 (0.0, 0.2) 3 0.21 (0.0, 0.2)
Missing 1 - 1 - 0 - 0 -
122New Zealand National Gambling Study: Wave 4 (2015)Provider No: 467589, Agreement No: 349827/00Auckland University of Technology, Gambling and Addictions Research Centre Final Report Number 6, 29 March 2018

Data weighted for 2013 Census data (all waves) and attrition (Waves 2, 3 and 4)Wave 1 N=6,251; Wave 2 N=3,745; Wave 3 N=3,115; Wave 4 N=2,770
123New Zealand National Gambling Study: Wave 4 (2015)Provider No: 467589, Agreement No: 349827/00Auckland University of Technology, Gambling and Addictions Research Centre Final Report Number 6, 29 March 2018

APPENDIX 8:Past year and past month gambling in Waves 1, 2, 3 and 4
Gambling activityWave 1 Wave 2 Wave 3 Wave 4
n % (95% CI) n % (95% CI) n % (95% CI) n % (95% CI)In past 12 monthsCard games 265 4.2 (3.6, 4.9) 125 3.3 (2.6, 4.1) 100 3.2 (2.2, 4.2) 71 2.6 (1.7, 3.5)Bets with friends/workmates 914 14.6 (13.6, 15.7) 458 12.2 (11.0, 13.5) 407 13.0 (11.6, 14.4) 357 12.9 (11.3, 14.5)Text game or competition 169 2.7 (2.2, 3.2) 68 1.8 (1.2, 2.4) 57 1.8 (1.2, 2.4) 36 1.3 (0.8, 1.7)Raffle/lottery (NZ or overseas) 2929 46.9 (45.4, 48.3) 1784 47.6 (45.7, 49.5) 1429 45.7 (43.6, 47.9) 1233 44.5 (42.2, 46.8)Lotto 3893 62.3 (60.8, 63.7) 2237 59.7 (57.8, 61.6) 1861 59.6 (57.4, 61.7) 1544 55.7 (53.4, 58.1)Keno 178 2.8 (2.4, 3.3) 95 2.5 (2.0, 3.0) 75 2.4 (1.8, 3.0) 49 1.8 (1.2, 2.3)Instant Kiwi/other scratch tickets 2026 32.4 (31.0, 33.8) 1118 29.8 (28.1, 31.6) 910 29.1 (27.2, 31.1) 820 29.6 (27.4, 31.8)Housie or bingo 104 1.7 (1.3, 2.0) 49 1.3 (1.0, 1.7) 37 1.2 (0.8, 1.6) 36 1.3 (0.9, 1.7)Horse/dog race betting 732 11.7 (10.7, 12.7) 394 10.5 (9.3, 11.7) 294 9.4 (8.2, 10.6) 255 9.2 (7.9, 10.5)Sports betting 287 4.6 (3.9, 5.3) 103 2.7 (2.1, 3.4) 91 2.9 (2.2, 3.7) 85 3.1 (2.3, 3.9)Casino table games or EGMS (overseas) 228 3.6 (3.1, 4.2) 94 2.5 (1.9, 3.1) 83 2.7 (1.9, 3.4) 60 2.2 (1.5, 2.9)Casino table games or EGMS (NZ) 590 9.4 (8.5, 10.4) 270 7.2 (6.1, 8.3) 227 7.3 (6.1, 8.5) 182 6.6 (5.3, 7.8)Casino table games (NZ) 232 3.7 (3.1, 4.3) 113 3.0 (2.2, 3.8) 91 2.9 (2.1, 3.8) 68 2.5 (1.7, 3.2)Casino EGMs (NZ) 517 8.3 (7.4, 9.1) 227 6.1 (5.1, 7.0) 198 6.3 (5.3, 7.4) 163 5.9 (4.7, 7.1)Pub EGMs 717 11.5 (10.5, 12.5) 332 8.9 (7.7, 10.0) 259 8.3 (7.1, 9.5) 227 8.2 (6.9, 9.5)Club EGMs 349 5.6 (4.9, 6.3) 154 4.1 (3.4, 4.9) 129 4.1 (3.3, 5.0) 103 3.7 (2.9, 4.5)EGMs overall 1100 17.6 (16.4, 18.8) 528 14.1 (12.7, 15.5) 424 13.6 (12.1, 15.0) 353 12.8 (11.2, 14.4)Short-term speculative investments 59 0.9 (0.7, 1.2) 55 1.5 (0.9, 2.0) 41 1.3 (0.8, 1.8) 29 1.0 (0.6, 1.5)Other overseas internet gambling† 39 0.6 (0.4, 0.9) 16 0.4 (0.2, 0.6) 10 0.3 (0.1, 0.5) 9 0.3 (0.1, 0.6)Overseas internet gambling overall‡ 104 1.7 (1.2, 2.1) 42 1.2 (0.8, 1.7) 28 0.9 (0.5, 1.3) 20 0.7 (0.3, 1.1)
124New Zealand National Gambling Study: Wave 4 (2015)Provider No: 467589, Agreement No: 349827/00Auckland University of Technology, Gambling and Addictions Research Centre Final Report Number 6, 29 March 2018
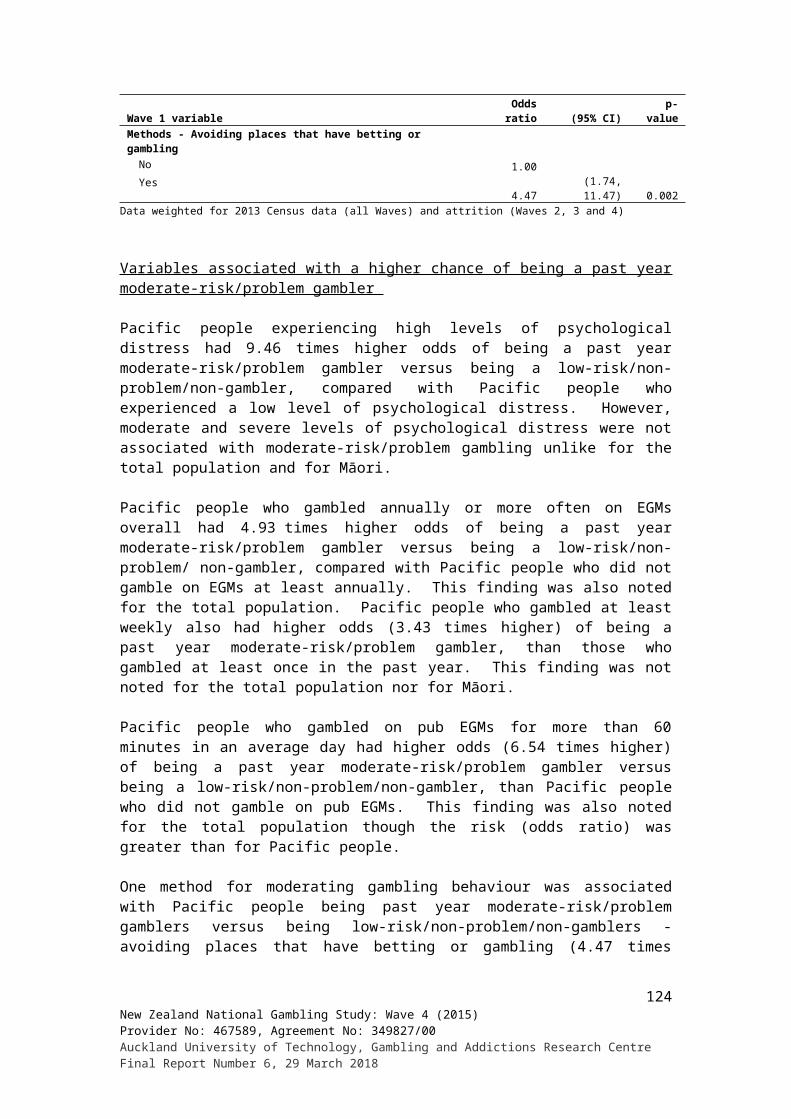
Gambling activityWave 1 Wave 2 Wave 3 Wave 4
n % (95% CI) n % (95% CI) n % (95% CI) n % (95% CI)In past monthCard games 82 1.3 (1.0, 1.7) 36 1.0 (0.6, 1.3) 25 0.8 (0.4, 1.2) 22 0.8 (0.4, 1.2)Bets with friends/workmates 97 1.5 (1.2, 1.9) 62 1.7 (1.1, 2.2) 38 1.2 (0.8, 1.6) 27 1.0 (0.6, 1.4)Text game or competition 39 0.6 (0.4, 0.9) 14 0.4 (0.1, 0.7) 10 0.3 (0.1, 0.5) 8 0.3 (0.1, 0.5)Raffle/lottery (NZ or overseas) 684 10.9 (10.1, 11.8) 4.4 10.8 (9.7, 11.9) 271 8.7 (7.6, 9.8) 215 7.8 (6.7, 8.8)Lotto 2200 35.2 (33.8, 36.6) 1224 32.7 (30.9, 34.4) 1013 32.4 (30.5, 34.4) 827 29.8 (27.8, 31.9)Keno 86 1.4 (1.1, 1.7) 45 1.2 (0.8, 1.6) 24 0.8 (0.5, 1.1) 24 0.9 (0.5, 1.2)Instant Kiwi/other scratch tickets 750 12.0 (11.0, 13.0) 4.2 10.7 (9.6, 11.9) 296 9.5 (8.3, 10.7) 238 8.6 (7.3, 9.9)Housie or bingo 34 0.5 (0.4, 0.7) 17 0.5 (0.3, 0.6) 16 0.5 (0.3, 0.7) 12 0.4 (0.2, 0.6)Horse/dog race betting 176 2.8 (2.3, 3.3) 88 2.3 (1.8, 2.9) 70 2.3 (1.7, 2.8) 59 2.1 (1.5, 2.7)Sports betting 83 1.3 (1.0, 1.7) 35 0.9 (0.6, 1.3) 28 0.9 (0.5, 1.3) 22 0.8 (0.4, 1.2)Casino table games or EGMS (overseas) 5 0.1 (0.0, 0.1) 1 0.0 ! 0 - - 1 0.0 !Casino table games or EGMS (NZ) 59 0.9 (0.6, 1.2) 26 0.7 (0.2, 1.2) 19 0.6 (0.2, 1.0) 7 0.3 (0.1, 0.5)Casino table games (NZ) 13 0.2 (0.0, 0.4) 15 0.4 (0.0, 0.9) 6 0.2 (0.0, 0.5) 0 - -Casino EGMs (NZ) 55 0.9 (0.6, 1.2) 16 0.4 (0.2, 0.6) 11 0.4 (0.1, 0.6) 8 0.3 (0.1, 0.5)Pub EGMs 213 3.4 (2.9, 3.9) 91 2.4 (1.9, 3.0) 74 2.4 (1.8, 3.0) 61 2.2 (1.6, 2.8)Club EGMs 94 1.5 (1.2, 1.9) 42 1.1 (0.7, 1.5) 30 0.9 (0.6, 1.3) 32 1.1 (0.7, 1.6)EGMs overall 309 4.9 (4.3, 5.6) 127 3.4 (2.8, 4.0) 110 3.5 (2.8, 4.2) 86 3.1 (2.4, 3.8)Short-term speculative investments 19 0.3 (0.1, 0.5) 14 0.4 (0.1, 0.6) 10 0.3 (0.1, 0.6) 11 0.4 (0.1, 0.7)Other overseas internet gambling† 16 0.2 (0.1, 0.4) 8 0.2 (0.0, 0.4) 6 0.2 (0.1, 0.4) 6 0.2 (0.0, 0.5)Overseas internet gambling overall‡ 41 0.6 (0.4, 0.9) 20 0.5 (0.2, 0.8) 9 0.3 (0.1, 0.5) 9 0.3 (0.1, 0.6)Data weighted for 2013 Census data (all waves) and attrition (Waves 2, 3 and 4)Wave 1 N=6,251; Wave 2 N=3,745; Wave 3 N=3,115; Wave 4 N=2,770† Not included in other overseas categories‡ Excludes overseas raffles/lotteries! Meaningful confidence intervals not calculable due to small sample size
125New Zealand National Gambling Study: Wave 4 (2015)Provider No: 467589, Agreement No: 349827/00Auckland University of Technology, Gambling and Addictions Research Centre Final Report Number 6, 29 March 2018

APPENDIX 9:Gambling behaviour in Waves 1, 2, 3 and 4
Gambling participation-related variablesWave 1 Wave 2 Wave 3 Wave 4
n % (95% CI) n % (95% CI) n % (95% CI) n % (95% CI)Number of gambling activities participated in
0 1261 20.2 (19.0, 21.4) 828 22.1 (20.5, 23.7) 727 23.3 (21.3, 25.2) 693 25.0 (22.9, 27.1)1 1376 22.0 (20.8, 23.2) 805 21.5 (19.9, 23.0) 693 22.2 (20.4, 24.0) 622 22.5 (20.6, 24.4)2 1318 21.1 (19.9, 22.7) 828 22.1 (20.5, 23.7) 684 21.9 (20.1, 23.7) 586 21.2 (19.2, 23.1)3 964 15.4 (14.4, 16.5) 627 16.7 (15.3, 18.2) 464 14.9 (13.4, 16.3) 427 15.4 (13.8, 17.0)4 - 6 1097 17.6 (16.4, 18.7) 580 15.5 (14.1, 16.9) 488 15.6 (14.1, 17.2) 395 14.3 (12.6, 15.9)7 - 9 206 3.3 (2.8, 3.8) 73 2.0 (1.4, 2.5) 65 2.1 (1.5, 2.6) 43 1.5 (1.0, 2.1)10+ 28 0.4 (0.2, 0.7) 5 0.1 (0.0, 0.3) 3 0.1 (0.0, 0.2) 5 0.2 (0.0, 0.3)
Pattern of participationNo gambling in past year 1261 20.2 (19.0, 21.4) 828 22.1 (20.5, 23.7) 728 23.3 (21.4, 25.2) 695 25.1 (23.0, 27.2)Infrequent gambler 3590 57.4 (56.0, 58.9) 2141 57.1 (55.3, 59.0) 1765 56.5 (54.4, 58.7) 1562 56.4 (54.1, 58.7)Regular non-continuous gambler 1007 16.1 (15.1, 17.1) 548 14.6 (13.4, 15.9) 477 15.3 (13.8, 16.7) 375 13.5 (12.1, 14.9)Regular continuous gambler 393 6.3 (5.6, 7.0) 229 6.1 (5.2, 7.0) 154 4.9 (4.1, 5.8) 137 5.0 (4.0, 5.9)
Gambling frequencyNo gambling in past year 1261 20.2 (19.0, 21.4) 828 22.2 (20.6, 23.8) 728 23.3 (21.4, 25.2) 695 25.1 (23.0, 27.3)At least weekly 1425 22.8 (21.6, 24.0) 787 21.1 (19.6, 22.6) 635 20.4 (18.8, 22.0) 515 18.6 (17.0, 20.3)At least monthly 1368 21.9 (20.7, 23.1) 786 21.0 (19.5, 22.6) 632 20.3 (18.5, 22.0) 516 18.7 (16.9, 20.4)At least 6 monthly 1704 27.3 (26.0, 28.6) 1067 28.6 (26.8, 30.3) 884 28.3 (26.4, 30.2) 814 29.4 (27.3, 31.6)At least once in past year 483 7.7 (6.9, 8.6) 268 7.2 (6.2, 8.2) 240 7.7 (6.4, 9.0) 225 8.2 (6.8, 9.5)Missing 10 - 12 - 4 - 0 -
126New Zealand National Gambling Study: Wave 4 (2015)Provider No: 467589, Agreement No: 349827/00Auckland University of Technology, Gambling and Addictions Research Centre Final Report Number 6, 29 March 2018

Gambling participation-related variablesWave 1 Wave 2 Wave 3 Wave 4
n % (95% CI) n % (95% CI) n % (95% CI) n % (95% CI)Typical monthly gambling expenditure
No gambling in past year 1278 20.4 (19.3, 21.6) 838 22.4 (20.8, 24.0) 735 23.5 (21.6, 25.5) 700 25.3 (23.1, 27.4)$1 - $10 1019 16.3 (15.2, 17.4) 654 17.5 (16.0, 18.9) 511 16.4 (14.9, 17.9) 463 16.7 (15.0, 18.4)$11 - $20 1003 16.0 (15.0, 17.1) 592 15.8 (14.4, 17.2) 477 15.3 (13.7, 16.8) 385 13.9 (12.4, 15.4)$21 - $30 625 10.0 (9.1, 10.9) 364 9.7 (8.6, 10.8) 337 10.8 (9.3, 12.2) 297 10.7 (9.3, 12.1)$31 - $50 709 11.3 (10.4, 12.3) 394 10.5 (9.4, 11.7) 344 11.0 (9.7, 12.3) 292 10.5 (9.0, 12.1)$51 - $100 798 12.8 (11.8, 13.8) 473 12.6 (11.3, 13.9) 391 12.5 (11.2, 13.9) 351 12.7 (11.2, 14.1)$101 - $500 688 11.0 (10.1, 11.9) 364 9.7 (8.5, 10.9) 272 8.7 (7.6, 9.8) 251 9.1 (7.8, 10.3)>$500 129 2.1 (1.7, 2.5) 64 1.7 (1.2, 2.2) 55 1.8 (1.2, 2.3) 32 1.2 (0.7, 1.6)Not reported 2 0.0 ! 2 0.1 ! 0 - 0 -
Most preferred activityNo gambling in past year 1261 20.2 (19.0, 21.4) 828 22.1 (20.5, 23.7) 728 23.3 (21.4, 25.2) 695 25.1 (23.0, 27.2)Cards games 126 2.0 (1.6, 2.5) 65 1.7 (1.1, 2.4) 56 1.8 (1.0, 2.5) 33 1.2 (0.7, 1.7)Bets with friends/workmates 288 4.6 (4.0, 5.2) 147 3.9 (3.2, 4.7) 147 4.7 (3.9, 5.5) 127 4.6 (3.7, 5.5)Text game or competition 15 0.2 (0.1, 0.4) 8 0.2 (0.0, 0.4) 5 0.2 (0.0, 0.3) 4 0.2 (0.0, 0.3)Raffle/lottery (NZ or overseas) 575 9.2 (8.4, 10.1) 380 10.1 (9.0, 11.2) 328 10.5 (9.3, 11.7) 297 10.7 (9.4, 12.1)Lotto 1105 17.7 (16.6, 18.7) 605 16.1 (14.8, 17.5) 516 16.5 (14.9, 18.1) 364 13.2 (11.7, 14.6)Keno 17 0.3 (0.1, 0.4) 11 0.3 (0.1, 0.5) 4 0.1 (0.0, 0.2) 3 0.1 (0.0, 0.2)Bullseye 13 0.2 (0.1, 0.3) 3 0.1 (0.0, 0.2) 4 0.1 (0.0, 0.2) 3 0.1 (0.0, 0.2)Instant Kiwi/or other scratch tickets 549 8.8 (7.9, 9.6) 297 7.9 (6.9, 9.0) 250 8.0 (6.7, 9.3) 244 8.8 (7.3, 10.3)Housie or bingo 44 0.7 (0.5, 0.9) 27 0.7 (0.5, 1.0) 23 0.7 (0.4, 1.0) 18 0.6 (0.4, 0.9)Horse/dog race betting 362 5.8 (5.1, 6.5) 204 5.4 (4.6, 6.3) 147 4.7 (3.8, 5.6) 137 4.9 (4.0, 5.9)Sports betting 74 1.2 (0.8, 1.6) 34 0.9 (0.5, 1.3) 26 0.8 (0.4, 1.3) 26 0.9 (0.5, 1.4)Casino table games or EGMS (NZ and overseas) 254 4.1 (3.4, 4.7) 127 3.4 (2.6, 4.2) 99 3.2 (2.4, 4.0) 77 2.8 (1.9, 3.6)Non-casino EGMs 219 3.5 (2.9, 4.1) 130 3.5 (2.7, 4.2) 119 3.8 (3.0, 4.6) 111 4.0 (3.0, 5.0)Short-term spec. investments 25 0.4 (0.2, 0.6) 24 0.6 (0.3, 1.0) 27 0.9 (0.5, 1.3) 12 0.4 (0.1, 0.7)Other overseas internet gambling† 4 0.1 (0.0, 0.1) 4 0.1 (0.0, 0.2) 1 0.0 ! 0 - -Other activities 35 0.6 (0.3, 0.8) 23 0.6 (0.4, 0.9) 27 0.9 (0.4, 1.3) 21 0.8 (0.4, 1.1)No preference 397 6.4 (5.6, 7.1) 266 7.1 (6.2, 8.0) 208 6.7 (5.7, 7.6) 205 7.4 (6.3, 8.5)Did not respond 847 13.5 (12.6, 14.5) 538 14.4 (13.0, 15.7) 394 12.6 (11.3, 13.9) 377 13.6 (12.0, 15.2)Refused/Don’t know 40 0.6 (0.4, 0.9) 24 0.7 (0.4, 0.9) 14 0.5 (0.2, 0.7) 15 0.5 (0.3, 0.8)
127New Zealand National Gambling Study: Wave 4 (2015)Provider No: 467589, Agreement No: 349827/00Auckland University of Technology, Gambling and Addictions Research Centre Final Report Number 6, 29 March 2018

Gambling participation-related variablesWave 1 Wave 2 Wave 3 Wave 4
n % (95% CI) n % (95% CI) n % (95% CI) n % (95% CI)Who gambled with
Alone 1869 50.4 (48.5, 52.4) 1070 51.2 (48.6, 53.8) 909 51.1 (48.2, 54.0) 769 51.9 (48.8, 55.1)With one person 865 23.3 (21.7, 25.0) 434 20.8 (18.7, 22.9) 387 21.8 (19.2, 24.3) 335 22.7 (19.9, 25.4)With several people/a group 972 26.2 (24.5, 28.0) 586 28.0 (25.6, 30.4) 483 27.2 (24.6, 29.7) 376 25.4 (22.7, 28.1)Missing 2580 - 1624 - 1343 - 1290 -
Data weighted for 2013 Census data (all waves) and attrition (Waves 2, 3 and 4)Wave 1 N=6,251; Wave 2 N=3,745; Wave 3 N=3,115; Wave 4 N=2,770† Not included in other overseas categories! Meaningful confidence intervals not calculable due to small sample size
128New Zealand National Gambling Study: Wave 4 (2015)Provider No: 467589, Agreement No: 349827/00Auckland University of Technology, Gambling and Addictions Research Centre Final Report Number 6, 29 March 2018

APPENDIX 10:Gambling behaviour in Waves 1, 2, 3 and 4 - Māori
Gambling participation-related variablesWave 1 Wave 2 Wave 3 Wave 4
n % (95% CI) n % (95% CI) n % (95% CI) n % (95% CI)Number of gambling activities participated in
0 95 14.6 (12.3, 17.0) 63 16.3 (12.8, 19.8) 70 21.3 (15.0, 27.6) 59 20.1 (12.6, 27.6)1 113 17.4 (15.0, 19.9) 68 17.6 (14.2, 21.0) 53 16.2 (12.4, 20.1) 63 21.6 (16.4, 26.8)2 142 21.9 (19.2, 24.5) 88 22.6 (18.6, 26.7) 69 21.3 (17.2, 25.3) 49 16.8 (12.8, 20.8)3 97 14.9 (12.6, 17.1) 70 18.2 (14.9, 21.4) 61 18.6 (14.7, 22.5) 54 18.5 (14.3, 22.8)4 - 6 156 23.9 (21.1, 26.7) 80 20.8 (17.2, 24.3) 63 19.4 (14.7, 24.1) 56 19.0 (13.5, 24.5)7 - 9 40 6.1 (4.5, 7.6) 17 4.5 (2.5, 6.5) 8 2.5 (1.1, 4.0) 9 3.0 (1.2, 4.9)10+ 8 1.3 (0.5, 2.0) 0 0.1 ! 2 0.7 ! 3 0.9 (0.0, 1.9)
Pattern of participationNo gambling in past year 95 14.6 (12.3, 17.0) 63 16.3 (12.8, 19.8) 70 21.5 (15.2, 27.7) 59 20.2 (12.7, 27.7)Infrequent gambler 370 56.8 (53.6, 60.0) 214 55.4 (51.0, 59.8) 170 52.0 (46.1, 57.9) 165 56.4 (49.4, 63.5)Regular non-continuous gambler 124 19.1 (16.7, 21.5) 72 18.6 (15.5, 21.7) 61 18.6 (14.8, 22.5) 45 15.4 (11.6, 19.2)Regular continuous gambler 62 9.5 (7.6, 11.4) 37 9.7 (7.0, 12.3) 26 7.9 (5.2, 10.5) 23 8.0 (5.2, 10.8)
Gambling frequencyNo gambling in past year 95 14.7 (12.3, 17.0) 63 16.4 (12.9, 19.9) 70 21.5 (15.2, 27.7) 59 20.2 (12.7, 27.7)At least weekly 189 29.0 (26.2, 31.9) 111 28.7 (24.9, 32.6) 86 26.5 (22.0, 31.0) 68 23.4 (18.7, 28.2)At least monthly 180 27.7 (24.8, 30.7) 98 25.5 (21.3, 29.8) 77 23.5 (18.6, 28.4) 65 22.2 (17.6, 26.9)At least 6 monthly 154 23.7 (20.9, 26.4) 89 23.0 (19.3, 26.6) 76 23.3 (18.8, 27.7) 78 26.8 (20.6, 33.1)At least once in past year 32 4.9 (3.5, 6.3) 25 6.4 (4.0, 8.8) 17 5.2 (3.0, 7.4) 21 7.3 (4.2, 10.4)Missing 95 14.6 (12.3, 17.0) 63 16.3 (12.8, 19.8) 70 21.5 (15.2, 27.7) 59 20.1 (12.6, 27.6)
129New Zealand National Gambling Study: Wave 4 (2015)Provider No: 467589, Agreement No: 349827/00Auckland University of Technology, Gambling and Addictions Research Centre Final Report Number 6, 29 March 2018

Gambling participation-related variablesWave 1 Wave 2 Wave 3 Wave 4
n % (95% CI) n % (95% CI) n % (95% CI) n % (95% CI)Typical monthly gambling expenditure
No gambling in past year 98 15.0 (12.7, 17.3) 65 16.7 (13.2, 20.3) 70 21.5 (15.2, 27.7) 60 20.3 (12.8, 27.8)$1 - $10 76 11.6 (9.5, 13.7) 50 12.9 (9.8, 15.9) 41 12.5 (8.8, 16.1) 41 13.8 (9.6, 18.1)$11 - $20 96 14.8 (12.5, 17) 54 14.0 (10.9, 17.2) 38 11.7 (8.7, 14.8) 35 12.1 (8.9, 15.3)$21 - $30 65 10.0 (8.1, 11.8) 45 11.6 (8.2, 14.9) 30 9.3 (6.8, 11.8) 21 7.1 (4.7, 9.6)$31 - $50 80 12.3 (10.3, 14.4) 39 10.0 (7.5, 12.5) 37 11.4 (8.4, 14.3) 47 16.2 (10.6, 21.8)$51 - $100 98 15.1 (12.8, 17.3) 63 16.4 (13.1, 19.6) 52 16.0 (11.7, 20.4) 44 15.1 (11.0, 19.2)$101 - $500 118 18.1 (15.6, 20.7) 61 15.8 (12.7, 18.9) 49 15.1 (11.3, 19.0) 41 13.9 (10.0, 17.8)>$500 21 3.2 (2.0, 4.4) 10 2.6 (1.3, 3.8) 8 2.5 (1.0, 4.0) 4 1.4 (0.2, 2.5)
Most preferred activityNo gambling in past year 95 14.6 (12.3, 17.0) 63 16.3 (12.8, 19.8) 70 21.5 (15.2, 27.7) 59 20.2 (12.7, 27.7)Cards games 27 4.2 (2.7, 5.7) 10 2.6 (0.9, 4.2) 8 2.5 (0.1, 4.9) 8 2.6 (0.3, 4.8)Bets with friends/workmates 29 4.5 (3.1, 5.9) 25 6.5 (4.1, 8.9) 20 6.2 (3.8, 8.7) 17 5.9 (2.9, 8.8)Text game or competition 2 0.3 ! 0 - 1 0.4 ! 0 0.1 !Raffle/lottery (NZ or overseas) 65 10.0 (8.1, 11.9) 50 12.8 (9.4, 16.2) 37 11.2 (8.0, 14.4) 31 10.5 (7.5, 13.5)Lotto 118 18.2 (15.8, 20.6) 65 16.7 (13.7, 19.7) 51 15.6 (12.2, 19.1) 46 15.8 (11.7, 19.9)Keno 2 0.4 ! 3 0.7 (0.1, 1.3) 1 0.3 ! 1 0.3 !Bullseye 0 - 0 - 0 0.1 ! 1 0.2 !Instant Kiwi/or other scratch tickets 75 11.6 (9.4, 13.7) 39 10.1 (7.2, 12.9) 25 7.7 (4.7, 10.8) 30 10.4 (6.5, 14.3)Housie or bingo 13 2.0 (1.2, 2.8) 6 1.7 (0.7, 2.7) 4 1.3 (0.3, 2.3) 5 1.7 (0.4, 3.0)Horse/dog race betting 35 5.4 (4.0, 6.8) 15 3.8 (2.3, 5.4) 14 4.3 (2.4, 6.3) 13 4.5 (2.6, 6.5)Sports betting 9 1.3 (0.6, 2.1) 5 1.4 (0.4, 2.4) 2 0.6 ! 4 1.4 (0.2, 2.7)Casino table games or EGMS (NZ and overseas) 16 2.4 (1.4, 3.5) 13 3.3 (1.4, 5.2) 20 6.2 (2.6, 9.8) 15 5.0 (0.2, 9.7)Non-casino EGMs 39 6.0 (4.5, 7.6) 28 7.1 (4.9, 9.4) 13 4.1 (2.4, 5.9) 12 3.9 (2.1, 5.8)Short-term spec. investments 1 0.1 ! 0 0.1 ! 1 0.2 ! 1 0.3 !Other overseas internet gambling† 1 0.1 ! 0 0.1 ! 0 0.0 ! 0 0.2 !Other activities 4 0.6 (0.1, 1.1) 2 0.4 ! 2 0.7 ! 6 2.0 (0.3, 3.7)No preference 37 5.7 (4.2, 7.3) 25 6.3 (4.4, 8.3) 21 6.5 (4.4, 8.5) 21 7.0 (4.6, 9.4)Did not respond 81 12.5 (10.5, 14.6) 37 9.5 (7.1, 11.9) 33 10.1 (7.3, 13.0) 22 7.7 (5.0, 10.3)Refused/Don’t know 0 0.0 (0.0, 0.1) 2 0.5 ! 1 0.3 (0.0, 0.8) 1 0.4 !
130New Zealand National Gambling Study: Wave 4 (2015)Provider No: 467589, Agreement No: 349827/00Auckland University of Technology, Gambling and Addictions Research Centre Final Report Number 6, 29 March 2018

Gambling participation-related variablesWave 1 Wave 2 Wave 3 Wave 4
n % (95% CI) n % (95% CI) n % (95% CI) n % (95% CI)Who gambled with
Alone 249 56.9 (53.0, 60.8) 138 53.0 (47.5, 58.5) 104 51.5 (44.8, 58.3) 100 52.5 (44.8, 60.2)With one person 89 20.4 (17.3, 23.5) 58 22.4 (17.8, 27.0) 40 19.8 (13.6, 26.0) 35 18.3 (10.9, 25.8)With several people/a group 99 22.7 (19.4, 26.1) 64 24.6 (19.7, 29.5) 58 28.6 (22.7, 34.6) 55 29.2 (22.5, 35.8)
Data weighted for 2013 Census data (all waves) and attrition (Waves 2, 3 and 4)Wave 1 N=6,251; Wave 2 N=3,745; Wave 3 N=3,115; Wave 4 N=2,770† Not included in other overseas categories! Meaningful confidence intervals not calculable due to small sample size
131New Zealand National Gambling Study: Wave 4 (2015)Provider No: 467589, Agreement No: 349827/00Auckland University of Technology, Gambling and Addictions Research Centre Final Report Number 6, 29 March 2018

APPENDIX 11:Gambling behaviour in Waves 1, 2, 3 and 4 - Pacific
Gambling participation-related variablesWave 1 Wave 2 Wave 3 Wave 4
n % (95% CI) n % (95% CI) n % (95% CI) n % (95% CI)Number of gambling activities participated in
0 79 25.7 (22.1, 29.3) 53 28.7 (23.6, 33.8) 42 28.4 (22.6, 34.2) 40 30.5 (24.4, 36.6)1 62 20.0 (16.6, 23.4) 39 20.8 (16.5, 25.1) 32 21.1 (16.4, 25.7) 28 21.3 (15.6, 26.9)2 60 19.3 (16.2, 22.4) 38 20.5 (16.3, 24.7) 30 20.4 (15.5, 25.2) 29 22.1 (16.3, 27.9)3 44 14.2 (11.5, 17.0) 22 11.6 (8.2, 15.0) 18 12.1 (8.2, 15.9) 14 10.4 (6.8, 14.0)4 - 6 49 15.8 (12.5, 19.1) 29 15.6 (11.1, 20.2) 22 14.5 (10.2, 18.8) 19 14.1 (9.2, 19.0)7 - 9 14 4.5 (2.8, 6.2) 4 2.0 (0.8, 3.2) 5 3.4 (0.9, 5.8) 2 1.6 !10+ 2 0.5 ! 1 0.7 ! 0 0.2 ! 0 0.1 !
Pattern of participationNo gambling in past year 79 25.7 (22.1, 29.3) 53 28.7 (23.6, 33.8) 42 28.4 (22.6, 34.2) 40 30.5 (24.4, 36.6)Infrequent gambler 150 48.5 (44.4, 52.6) 93 50.3 (44.8, 55.8) 74 49.2 (43.1, 55.2) 63 47.9 (41.0, 54.8)Regular non-continuous gambler 54 17.5 (14.4, 20.6) 23 12.3 (8.8, 15.9) 20 13.6 (9.4, 17.7) 17 12.7 (8.5, 16.9)Regular continuous gambler 26 8.4 (6.1, 10.6) 16 8.6 (4.9, 12.4) 13 8.9 (5.3, 12.5) 12 8.9 (4.6, 13.2)
Gambling frequencyNo gambling in past year 79 25.7 (22.1, 29.3) 53 28.7 (23.6, 33.8) 42 28.4 (22.6, 34.2) 40 30.6 (24.5, 36.7)At least weekly 84 27.1 (23.3, 30.8) 40 21.4 (16.6, 26.2) 34 22.5 (17.2, 27.7) 29 21.6 (15.9, 27.4)At least monthly 74 23.9 (20.5, 27.3) 44 23.6 (19.1, 28.1) 26 17.7 (13.3, 22.1) 24 18.2 (12.9, 23.5)At least 6 monthly 51 16.5 (13.6, 19.4) 40 21.3 (17.1, 25.5) 35 23.4 (18.4, 28.5) 30 22.8 (16.9, 28.6)At least once in past year 21 6.8 (4.7, 9.0) 9 5.0 (2.3, 7.7) 12 8.1 (4.7, 11.4) 9 6.8 (3.8, 9.9)
132New Zealand National Gambling Study: Wave 4 (2015)Provider No: 467589, Agreement No: 349827/00Auckland University of Technology, Gambling and Addictions Research Centre Final Report Number 6, 29 March 2018

Gambling participation-related variablesWave 1 Wave 2 Wave 3 Wave 4
n % (95% CI) n % (95% CI) n % (95% CI) n % (95% CI)Typical monthly gambling expenditure
No gambling in past year 79 25.7 (22.1, 29.3) 53 28.7 (23.6, 33.8) 42 28.4 (22.6, 34.2) 41 30.8 (24.7, 36.8)$1 - $10 37 11.9 (9.1, 14.7) 29 15.6 (11.5, 19.6) 19 12.4 (8.7, 16.1) 16 11.7 (8.0, 15.5)$11 - $20 39 12.7 (10.2, 15.2) 21 11.4 (8.4, 14.3) 19 12.8 (8.9, 16.7) 22 16.9 (11.6, 22.3)$21 - $30 21 6.7 (4.8, 8.7) 13 7.0 (4.3, 9.6) 12 8.0 (4.8, 11.1) 12 8.9 (4.6, 13.1)$31 - $50 36 11.5 (9.1, 14) 20 10.6 (7.5, 13.8) 18 11.9 (8.0, 15.9) 10 7.9 (4.4, 11.4)$51 - $100 43 13.9 (11.1, 16.7) 25 13.3 (9.4, 17.3) 19 12.7 (8.9, 16.4) 12 9.1 (5.1, 13.1)$101 - $500 46 14.9 (11.7, 18.1) 23 12.3 (8.3, 16.3) 19 12.7 (8.2, 17.2) 18 13.3 (8.6, 18.0)>$500 8 2.7 (1.5, 3.8) 2 1.2 ! 2 1.2 ! 2 1.5 !
Most preferred activityNo gambling in past year 79 25.7 (22.1, 29.3) 53 28.7 (23.6, 33.8) 42 28.4 (22.6, 34.2) 40 30.5 (24.4, 36.6)Cards games 8 2.5 (1.1, 3.9) 5 2.9 (1.2, 4.7) 4 3.0 (1.0, 5.0) 4 3.1 (0.4, 5.8)Bets with friends/workmates 13 4.1 (2.3, 5.9) 6 3.4 (1.1, 5.7) 6 3.9 (1.3, 6.5) 5 3.5 (1.4, 5.6)Text game or competition 0 0.8 ! 0 - 0 0.5 ! 0 -Raffle/lottery (NZ or overseas) 21 6.8 (4.9, 8.7) 18 9.8 (6.6, 13) 13 8.6 (5.1, 12.1) 11 8.0 (3.7, 12.3)Lotto 70 22.5 (19.2, 25.7) 32 17.3 (13.5, 21.1) 25 16.8 (12.7, 20.9) 24 18.3 (13.3, 23.3)Keno 3 1.1 (0.4, 1.8) 2 1.3 ! 1 0.7 ! 0 0.1 !Bullseye 0 0.1 ! 0 - 0 - 0 -Instant Kiwi/or other scratch tickets 23 7.5 (5.3, 9.8) 8 4.5 (2.5, 6.6) 9 6.2 (3.2, 9.3) 6 4.4 (1.5, 7.3)Housie or bingo 7 2.3 (1.2, 3.5) 6 3.4 (1.3, 5.6) 5 3.3 (1.2, 5.3) 4 3.0 (0.9, 5.2)Horse/dog race betting 6 2.0 (0.9, 3.2) 4 2.2 (0.5, 3.8) 3 2.0 (0.0, 4.4) 4 2.7 (0.8, 4.6)Sports betting 4 1.4 (0.0, 3.1) 2 0.9 ! 0 0.1 ! 2 1.7 !Casino table games or EGMS (NZ and overseas) 10 3.2 (1.9, 4.5) 6 3.0 (1.1, 4.9) 7 4.7 (1.9, 7.5) 2 1.7 !Non-casino EGMs 9 2.8 (1.4, 4.2) 4 2.2 (0.7, 3.7) 6 3.8 (1.6, 6.1) 4 2.8 (0.3, 5.3)Short-term spec. investments 0 - 0 - 0 - 0 -Other overseas internet gambling† 0 0.2 ! 0 0.2 ! 1 0.4 ! 0 -Other activities 1 0.4 ! 0 0.1 ! 1 0.4 ! 0 0.3 !No preference 13 4.2 (2.5, 5.9) 10 5.6 (2.5, 8.7) 8 5.7 (3.4, 8.0) 9 7.1 (3.7, 10.6)Did not respond 37 11.9 (9.2, 14.7) 27 14.4 (10.9, 18) 16 10.6 (6.9, 14.2) 17 12.7 (8.2, 17.3)Refused/Don’t know 0 0.4 ! 0 - 1 0.8 ! 0 -
133New Zealand National Gambling Study: Wave 4 (2015)Provider No: 467589, Agreement No: 349827/00Auckland University of Technology, Gambling and Addictions Research Centre Final Report Number 6, 29 March 2018

Gambling participation-related variablesWave 1 Wave 2 Wave 3 Wave 4
n % (95% CI) n % (95% CI) n % (95% CI) n % (95% CI)Who gambled with
Alone 106 59.6 (54.3, 64.8) 53 56.1 (48.5, 63.7) 41 49.7 (42.0, 57.5) 33 49.8 (40.4, 59.2)With one person 32 18.1 (13.6, 22.6) 16 16.4 (10.4, 22.3) 12 14.7 (9.5, 19.9) 14 22.0 (13.8, 30.2)With several people/a group 40 22.3 (17.8, 26.9) 26 27.5 (20.7, 34.3) 29 35.6 (27.5, 43.6) 18 28.2 (19.7, 36.7)
Data weighted for 2013 Census data (all waves) and attrition (Waves 2, 3 and 4)Wave 1 N=6,251; Wave 2 N=3,745; Wave 3 N=3,115; Wave 4 N=2,770† Not included in other overseas categories! Meaningful confidence intervals not calculable due to small sample size
134New Zealand National Gambling Study: Wave 4 (2015)Provider No: 467589, Agreement No: 349827/00Auckland University of Technology, Gambling and Addictions Research Centre Final Report Number 6, 29 March 2018

APPENDIX 12:Gambling behaviour in Waves 1, 2, 3 and 4 - Asian
Gambling participation-related variablesWave 1 Wave 2 Wave 3 Wave 4
n % (95% CI) n % (95% CI) n % (95% CI) n % (95% CI)Number of gambling activities participated in
0 254 39.8 (36.0, 43.6) 162 43.9 (38.4, 49.4) 130 41.9 (35.6, 48.2) 114 40.8 (34.1, 47.6)1 155 24.3 (21.0, 27.6) 83 22.5 (18.1, 26.8) 74 24.0 (18.8, 29.2) 63 22.6 (16.9, 28.3)2 108 17.0 (14.2, 19.8) 57 15.6 (11.8, 19.4) 50 16.3 (11.7, 20.9) 49 17.6 (12.2, 23.1)3 56 8.7 (6.5, 10.9) 37 10.1 (7.0, 13.3) 30 9.6 (6.2, 13.0) 34 12.0 (7.8, 16.3)4 - 6 60 9.4 (7.1, 11.7) 27 7.3 (4.6, 9.9) 22 7.2 (4.4, 9.9) 18 6.4 (3.6, 9.2)7 - 9 5 0.8 (0.2, 1.4) 3 0.7 (0.0, 1.6) 4 1.1 (0.0, 2.3) 1 0.5 !10+ 0 - 0 - 0 - 0 -
Pattern of participationNo gambling in past year 254 39.8 (36.0, 43.6) 162 43.9 (38.4, 49.4) 130 41.9 (35.6, 48.2) 114 40.8 (34.1, 47.6)Infrequent gambler 314 49.2 (45.3, 53.1) 173 47.0 (41.6, 52.4) 151 48.6 (42.3, 54.9) 142 50.7 (43.8, 57.5)Regular non-continuous gambler 49 7.7 (5.7, 9.6) 27 7.3 (4.6, 9.9) 21 6.7 (3.7, 9.6) 17 6.0 (2.9, 9.1)Regular continuous gambler 21 3.4 (1.9, 4.9) 7 1.9 (0.5, 3.3) 9 2.9 (0.9, 4.8) 7 2.5 (0.2, 4.9)
Gambling frequencyNo gambling in past year 254 39.9 (36.1, 43.8) 162 44.2 (38.7, 49.7) 130 42.0 (35.7, 48.3) 114 40.9 (34.1, 47.7)At least weekly 70 11.1 (8.6, 13.5) 35 9.5 (6.5, 12.5) 30 9.6 (6.1, 13.0) 25 8.9 (5.0, 12.7)At least monthly 126 19.9 (16.8, 23.0) 63 17.1 (13.2, 21.1) 53 17.2 (12.9, 21.5) 42 15.0 (10.4, 19.5)At least 6 monthly 121 19.0 (16.1, 21.9) 77 21.0 (16.8, 25.3) 71 22.9 (17.6, 28.2) 68 24.3 (18.1, 30.4)At least once in past year 64 10.1 (7.8, 12.5) 30 8.2 (5.4, 10.9) 26 8.3 (5.1, 11.5) 31 11.0 (6.9, 15.2)
135New Zealand National Gambling Study: Wave 4 (2015)Provider No: 467589, Agreement No: 349827/00Auckland University of Technology, Gambling and Addictions Research Centre Final Report Number 6, 29 March 2018
Gambling participation-related variablesWave 1 Wave 2 Wave 3 Wave 4
n % (95% CI) n % (95% CI) n % (95% CI) n % (95% CI)Typical monthly gambling expenditure
No gambling in past year 256 40.2 (36.3, 44.0) 165 44.6 (39.1, 50.1) 132 42.6 (36.4, 48.9) 115 41.0 (34.2, 47.8)$1 - $10 78 12.3 (9.9, 14.7) 49 13.2 (9.9, 16.6) 38 12.1 (8.6, 15.6) 38 13.5 (8.7, 18.2)$11 - $20 94 14.7 (12.0, 17.3) 47 12.7 (9.4, 16.0) 44 14.1 (9.7, 18.5) 37 13.1 (8.6, 17.6)$21 - $30 50 7.9 (5.8, 9.9) 38 10.4 (7.0, 13.8) 30 9.6 (6.0, 13.2) 22 7.8 (4.3, 11.3)$31 - $50 57 8.9 (6.7, 11.1) 17 4.6 (2.5, 6.7) 30 9.6 (5.9, 13.3) 24 8.6 (4.9, 12.4)$51 - $100 46 7.2 (5.1, 9.4) 29 7.8 (5.0, 10.6) 18 5.7 (3.0, 8.4) 27 9.7 (5.6, 13.7)$101 - $500 39 6.1 (4.3, 7.9) 17 4.7 (2.4, 7.0) 15 4.7 (2.2, 7.2) 16 5.8 (3.0, 8.7)>$500 18 2.7 (1.4, 4.1) 7 1.9 (0.4, 3.4) 5 1.5 (0.4, 2.6) 1 0.5 !
Most preferred activityNo gambling in past year 254 39.8 (36.0, 43.6) 162 43.9 (38.4, 49.4) 130 41.9 (35.6, 48.2) 114 40.8 (34.1, 47.6)Cards games 12 1.8 (0.8, 2.8) 3 0.7 (0.0, 1.6) 2 0.7 ! 3 1.0 (0.0, 1.9)Bets with friends/workmates 15 2.4 (1.2, 3.6) 5 1.3 (0.1, 2.6) 3 0.9 (0.0, 2.0) 4 1.3 (0.0, 2.7)Text game or competition 2 0.3 ! 0 - 0 - 2 0.6 !Raffle/lottery (NZ or overseas) 23 3.6 (2.3, 4.9) 20 5.5 (3.2, 7.7) 17 5.5 (2.8, 8.3) 15 5.5 (2.3, 8.6)Lotto 115 18.0 (15.2, 20.9) 66 18.0 (13.9, 22.1) 59 19.1 (14.2, 23.9) 43 15.2 (10.5, 20.0)Keno 2 0.3 ! 1 0.2 ! 2 0.5 ! 1 0.5 !Bullseye 4 0.6 (0.0, 1.5) 2 0.4 ! 1 0.4 ! 1 0.2 !Instant Kiwi/or other scratch tickets 37 5.8 (3.9, 7.7) 14 3.8 (1.8, 5.7) 14 4.6 (2.2, 7.0) 23 8.2 (3.9, 12.5)Housie or bingo 2 0.4 ! 1 0.2 ! 0 - 1 0.3 !Horse/dog race betting 8 1.2 (0.2, 2.3) 4 1.1 (0.1, 2.1) 5 1.5 (0.2, 2.9) 4 1.3 (0.0, 2.6)Sports betting 4 0.7 (0.1, 1.3) 2 0.5 ! 5 1.5 (0.3, 2.8) 3 1.2 (0.0, 2.4)Casino table games or EGMS (NZ and overseas) 37 5.8 (4.0, 7.6) 18 5.0 (2.8, 7.2) 8 2.4 (0.9, 4.0) 7 2.5 (0.7, 4.3)
Non-casino EGMs 3 0.5 (0.0, 1.1) 1 0.4 ! 1 0.2 ! 3 1.0 (0.0, 2.1)Short-term spec. investments 5 0.7 (0.0, 1.6) 5 1.5 (0.0, 3.1) 4 1.4 (0.2, 2.7) 1 0.3 !Other overseas internet gambling† 0 - 0 - 0 - 0 -Other activities 2 0.4 ! 1 0.3 ! 1 0.3 ! 3 1.0 (0.0, 2.1)No preference 21 3.3 (2.1, 4.6) 17 4.7 (2.6, 6.7) 13 4.2 (2.1, 6.3) 8 2.7 (0.9, 4.5)Did not respond 88 13.9 (11.3, 16.5) 44 12.1 (8.8, 15.3) 46 14.8 (10.5, 19.2) 45 16.0 (10.8, 21.3)Refused/Don’t know 2 0.3 ! 2 0.5 ! 0 - 1 0.5 !
136New Zealand National Gambling Study: Wave 4 (2015)Provider No: 467589, Agreement No: 349827/00Auckland University of Technology, Gambling and Addictions Research Centre Final Report Number 6, 29 March 2018
Gambling participation-related variablesWave 1 Wave 2 Wave 3 Wave 4
n % (95% CI) n % (95% CI) n % (95% CI) n % (95% CI)Who gambled with
Alone 137 50.3 (44.3, 56.2) 83 57.6 (49.6, 65.6) 83 68.7 (59.9, 77.5) 68 60.9 (50.1, 71.7)With one person 66 24.2 (18.9, 29.5) 25 17.6 (11.0, 24.1) 18 15.0 (8.9, 21.1) 22 19.8 (10.3, 29.4)With several people/a group 69 25.5 (20.3, 30.8) 36 24.8 (17.8, 31.9) 20 16.3 (8.6, 23.9) 22 19.3 (11.1, 27.4)
Data weighted for 2013 Census data (all waves) and attrition (Waves 2, 3 and 4)Wave 1 N=6,251; Wave 2 N=3,745; Wave 3 N=3,115; Wave 4 N=2,770† Not included in other overseas categories! Meaningful confidence intervals not calculable due to small sample size
137New Zealand National Gambling Study: Wave 4 (2015)Provider No: 467589, Agreement No: 349827/00Auckland University of Technology, Gambling and Addictions Research Centre Final Report Number 6, 29 March 2018

APPENDIX 13:Time spent gambling on EGMs in an average day in Waves 1, 2, 3 and 4
Venue and timeWave 1 Wave 2 Wave 3 Wave 4
n % (95% CI) n % (95% CI) n % (95% CI) n % (95% CI)NZ casino
Up to 15 minutes 120 23.4 (18.4, 28.4) 43 18.9 (12.2, 25.6) 39 19.7 (12.7, 26.7) 30 18.6 (8.5, 28.6)16 - 30 minutes 118 23.1 (18.1, 28.0) 54 23.9 (16.5, 31.3) 52 26.4 (18.0, 34.8) 41 25.4 (15.9, 34.8)31 - 60 minutes 113 22.1 (17.7, 26.4) 47 20.7 (14.8, 26.5) 47 23.6 (16.4, 30.7) 28 17.1 (10.5, 23.7)> 60 minutes 161 31.5 (26.7, 36.2) 83 36.5 (29.2, 43.8) 60 30.4 (22.9, 37.9) 63 39.0 (29.7, 48.3)
PubUp to 15 minutes 253 35.5 (30.9, 40.1) 119 35.8 (29.2, 42.4) 90 34.7 (27.4, 42.0) 72 31.9 (24.1, 39.8)16 - 30 minutes 209 29.3 (25.0, 33.7) 97 29.2 (23.0, 35.4) 81 31.4 (24.4, 38.5) 70 30.8 (23.2, 38.4)31 - 60 minutes 148 20.7 (17.2, 24.2) 75 22.6 (15.9, 29.2) 53 20.5 (14.8, 26.2) 58 25.8 (18.6, 32.9)> 60 minutes 103 14.4 (11.5, 17.3) 41 12.4 (8.7, 16.2) 35 13.3 (8.8, 17.8) 26 11.5 (7.1, 15.9)
ClubUp to 15 minutes 88 25.5 (19.7, 31.2) 59 38.1 (28.5, 47.7) 44 34.2 (23.6, 44.7) 21 20.5 (12.2, 28.9)16 - 30 minutes 125 36.3 (30.2, 42.4) 42 27.4 (19.3, 35.6) 36 28.2 (19.1, 37.2) 35 34.2 (23.8, 44.7)31 - 60 minutes 89 25.7 (20.3, 31.1) 34 22.2 (14.5, 29.9) 32 25.0 (15.6, 34.4) 29 28.2 (18.4, 37.9)> 60 minutes 43 12.5 (8.8, 16.3) 19 12.3 (6.8, 17.8) 16 12.7 (6.8, 18.6) 17 17.0 (9.6, 24.5)
Data weighted for 2013 Census data (all waves) and attrition (Waves 2, 3 and 4)Wave 1 N=6,251; Wave 2 N=3,745; Wave 3 N=3,115; Wave 4 N=2,770
138New Zealand National Gambling Study: Wave 4 (2015)Provider No: 467589, Agreement No: 349827/00Auckland University of Technology, Gambling and Addictions Research Centre Final Report Number 6, 29 March 2018

APPENDIX 14:Time spent gambling on EGMs in an average day in Waves 1, 2, 3 and 4 - Māori
Venue and timeWave 1 Wave 2 Wave 3 Wave 4
n % (95% CI) n % (95% CI) n % (95% CI) n % (95% CI)NZ casino
Up to 15 minutes 10 20.9 (11.1, 30.8) 4 12.9 (1.2, 24.6) 3 10.0 (0.4, 19.5) 8 29.8 (0.0, 72.9)16 - 30 minutes 7 15.5 (7.4, 23.6) 5 15.4 (1.4, 29.4) 3 12.4 (1.7, 23.2) 2 7.1 !31 - 60 minutes 7 15.6 (7.0, 24.3) 9 28.2 (12.9, 43.5) 11 39.2 (16.0, 62.4) 6 21.8 (0.1, 43.4)> 60 minutes 22 47.9 (35.9, 59.9) 14 43.6 (27.8, 59.3) 10 38.4 (18.0, 58.8) 11 41.3 (10.5, 72.2)
PubUp to 15 minutes 42 27.9 (21.7, 34.2) 26 34.8 (24.3, 45.3) 14 29.4 (16.7, 42.2) 9 22.2 (11.6, 32.9)16 - 30 minutes 36 24.0 (18.1, 30.0) 14 19.5 (11.9, 27.2) 13 28.4 (16.8, 39.9) 9 21.8 (12.1, 31.5)31 - 60 minutes 32 21.3 (15.6, 27.1) 19 25.5 (16.8, 34.2) 10 20.9 (10.7, 31.2) 16 39.3 (25.8, 52.8)> 60 minutes 40 26.7 (20.7, 32.7) 15 20.1 (12.5, 27.8) 10 21.3 (11.0, 31.6) 7 16.7 (6.8, 26.5)
ClubUp to 15 minutes 15 24.3 (14.8, 33.8) 4 21.2 (7.9, 34.6) 2 9.7 ! 3 22.4 (10.4, 34.5)16 - 30 minutes 25 41.0 (30.5, 51.5) 7 35.1 (19.0, 51.2) 4 22.8 (7.6, 38.0) 2 15.7 (5.2, 26.2)31 - 60 minutes 10 16.7 (9.0, 24.4) 4 18.0 (6.6, 29.4) 5 28.4 (10.4, 46.3) 3 22.2 (0.0, 44.9)> 60 minutes 11 18.0 (10.0, 26.1) 5 25.6 (13.6, 37.6) 7 39.1 (18.8, 59.4) 5 39.7 (18.0, 61.4)
Data weighted for 2013 Census data (all waves) and attrition (Waves 2, 3 and 4)Wave 1 N=6,251; Wave 2 N=3,745; Wave 3 N=3,115; Wave 4 N=2,770! Meaningful confidence intervals not calculable due to small sample size
139New Zealand National Gambling Study: Wave 4 (2015)Provider No: 467589, Agreement No: 349827/00Auckland University of Technology, Gambling and Addictions Research Centre Final Report Number 6, 29 March 2018

APPENDIX 15:Health status in Waves 1, 2, 3 and 4
Health variableWave 1 Wave 2 Wave 3 Wave 4
n % (95% CI) n % (95% CI) n % (95% CI) n % (95% CI)Number of major life events0 1711 27.4 (26.1, 28.6) 1081 28.9 (27.2, 30.5) 907 29.0 (27.1, 30.9) 883 31.9 (29.6, 34.1)1 1645 26.3 (25.0, 27.6) 1125 30.0 (28.2, 31.8) 890 28.5 (26.6, 30.4) 804 29.0 (27.0, 31.1)2 1151 18.4 (17.3, 19.6) 701 18.7 (17.2, 20.2) 618 19.8 (18.0, 21.6) 510 18.4 (16.6, 20.2)3 727 11.6 (10.7, 12.6) 433 11.6 (10.3, 12.8) 405 13.0 (11.5, 14.5) 304 11.0 (9.6, 12.4)4 479 7.7 (6.8, 8.5) 215 5.7 (4.8, 6.6) 138 4.4 (3.6, 5.2) 147 5.3 (4.3, 6.4)5+ 536 8.6 (7.7, 9.4) 190 5.1 (4.2, 5.9) 164 5.2 (4.1, 6.4) 122 4.4 (3.2, 5.6)Missing 2 - 0 - 0 - 0 -Quality of life (WHOQoL-8)Below median (Score 0 - 24) 2635 42.2 (40.7, 43.6) 1534 41.0 (39.1, 42.9) 1312 42.0 (39.9, 44.2) 1117 40.4 (38.1, 42.7)Median (Score 25) 648 10.4 (9.5, 11.3) 369 9.9 (8.8, 11.0) 294 9.4 (8.2, 10.6) 274 9.9 (8.4, 11.4)Above median (Score 26 - 32) 2962 47.4 (46.0, 48.9) 1840 49.2 (47.2, 51.1) 1515 48.5 (46.3, 50.7) 1376 49.7 (47.4, 52.1)Missing 8 - 3 - 0 - 2 -Psychological distress (Kessler-10)Low (Score 0 - 5) 4597 73.6 (72.3, 74.9) 2831 75.6 (73.9, 77.2) 2307 73.9 (71.9, 75.9) 2087 75.3 (73.2, 77.4)Moderate (Score 6 - 11) 1204 19.3 (18.1, 20.5) 659 17.6 (16.1, 19.1) 602 19.3 (17.4, 21.2) 493 17.8 (15.8, 19.7)High (Score 12 - 19) 339 5.4 (4.8, 6.1) 207 5.5 (4.7, 6.4) 162 5.2 (4.3, 6.1) 151 5.5 (4.5, 6.4)Severe (Score 20 - 40) 107 1.7 (1.4, 2.6) 48 1.3 (0.9, 1.7) 52 1.7 (1.1, 2.3) 40 1.4 (0.8, 2.1)Missing 5 - - - 0 -Hazardous alcohol consumption (AUDIT-C)No 3925 62.9 (61.4, 64.3) 2437 65.1 (63.2, 66.9) 2087 66.9 (64.8, 69.0) 1928 69.6 (67.4, 71.8)Yes 2319 37.1 (35.7, 38.6) 1309 34.9 (33.1, 36.8) 1033 33.1 (31.0, 35.2) 842 30.4 (28.2, 32.6)Missing 10 - - - 3 - 0 -
140New Zealand National Gambling Study: Wave 4 (2015)Provider No: 467589, Agreement No: 349827/00Auckland University of Technology, Gambling and Addictions Research Centre Final Report Number 6, 29 March 2018

Health variableWave 1 Wave 2 Wave 3 Wave 4
n % (95% CI) n % (95% CI) n % (95% CI) n % (95% CI)Other drug useYes 916 14.7 (13.5, 15.8) 427 11.4 (10.0, 12.8) 328 10.5 (8.8, 12.2) 285 10.3 (8.6, 12.0)No 5334 85.3 (84.2, 86.5) 3319 88.6 (87.2, 90.0) 2795 89.5 (87.8, 91.2) 2485 89.7 (88.0, 91.4)Cannabis 757 12.1 (11.1, 13.2) 342 9.1 (7.8, 10.4) 277 8.9 (7.4, 10.4) 259 9.3 (7.7, 11.0)Tobacco useEver smoked 4109 65.7 (64.4, 67.1) 2449 65.4 (63.6, 67.2) 2088 66.8 (64.8, 68.9) 1816 65.6 (63.4, 67.7)Smoked more than 100 cigarettes in lifetime 2779 44.5 (43.0, 45.9) 1670 44.6 (42.7, 46.5) 1412 45.2 (43.1, 47.4) 1242 44.8 (42.5, 47.2)Ever smoked daily 2594 41.5 (40.1, 42.9) 2187 41.6 (39.7, 43.5) 1333 42.7 (40.6, 44.8) 1175 42.4 (40.1, 44.7)How often currently smoke tobaccoDoes not smoke now 1616 25.9 (24.6, 27.1) 1023 27.3 (25.6, 29.0) 880 28.2 (26.3, 30.1) 809 29.2 (27.1, 31.3)At least once a day 985 15.8 (14.7, 16.8) 543 14.5 (13.1, 15.9) 433 13.9 (12.3, 15.4) 351 12.7 (11.2, 14.1)At least once a week 88 1.4 (1.0, 1.8) 56 1.5 (1.0, 2.0) 47 1.5 (0.9, 2.1) 31 1.1 (0.7, 1.5)At least once a month 32 0.5 (0.3, 0.7) 13 0.4 (0.2, 0.5) 18 0.6 (0.3, 0.9) 25 0.9 (0.4, 1.3)Less than once a month 57 0.9 (0.6, 1.2) 35 0.9 (0.6, 1.3) 33 1.1 (0.6, 1.5) 27 1.0 (0.5, 1.5)Never smoked 3470 55.5 (54.1, 57.0) 2075 55.4 (53.5, 57.3) 1711 54.8 (52.6, 56.9) 1528 55.2 (52.8, 57.5)Missing 3 - - - 0 -
Data weighted for 2013 Census data (all waves) and attrition (Waves 2, 3 and 4)Wave 1 N=6,251; Wave 2 N=3,745; Wave 3 N=3,115; Wave 4 N=2,770
141New Zealand National Gambling Study: Wave 4 (2015)Provider No: 467589, Agreement No: 349827/00Auckland University of Technology, Gambling and Addictions Research Centre Final Report Number 6, 29 March 2018

APPENDIX 16:Health status in Waves 1, 2, 3 and 4 - Māori
Health variableWave 1 Wave 2 Wave 3 Wave 4
n % (95% CI) n % (95% CI) n % (95% CI) n % (95% CI)Number of major life events0 149 22.8 (20.1, 25.5) 89 22.9 (19.1, 26.8) 55 16.9 (13.1, 20.7) 71 24.3 (18.4, 30.2)1 147 22.6 (19.9, 25.3) 94 24.4 (20.7, 28.1) 98 30.1 (24.7, 35.4) 71 24.1 (19.2, 29.1)2 118 18.1 (15.6, 20.6) 87 22.5 (18.4, 26.6) 66 20.2 (16.0, 24.5) 63 21.5 (16.8, 26.2)3 90 13.8 (11.5, 16.0) 48 12.4 (9.6, 15.2) 58 17.7 (13.3, 22.0) 39 13.4 (9.3, 17.4)4 55 8.4 (6.6, 10.3) 36 9.3 (6.6, 11.9) 19 5.9 (3.8, 8.0) 17 5.7 (3.5, 7.9)5+ 93 14.2 (12.0, 16.5) 33 8.4 (6.0, 10.9) 30 9.3 (3.8, 14.7) 32 11.0 (3.2, 18.7)Quality of life (WHOQoL-8)Below median (Score 0 - 24) 316 48.5 (45.3, 51.7) 177 45.8 (41.2, 50.3) 156 47.9 (42.0, 53.7) 123 42.0 (35.6, 48.5)Median (Score 25) 53 8.2 (6.4, 9.9) 30 7.6 (5.3, 10.0) 30 9.3 (5.7, 12.8) 35 11.8 (6.6, 17.1)Above median (Score 26 - 32) 282 43.3 (40.1, 46.5) 180 46.6 (42.1, 51.1) 140 42.8 (36.9, 48.8) 135 46.1 (39.1, 53.2)Psychological distress (Kessler-10)Low (Score 0 - 5) 440 67.7 (64.7, 70.6) 275 71.0 (66.9, 75.0) 217 66.3 (60.8, 71.9) 205 70.0 (63.9, 76.1)Moderate (Score 6 - 11) 128 19.7 (17.2, 22.2) 70 18.0 (14.4, 21.6) 67 20.6 (15.8, 25.5) 59 20.3 (14.6, 26.0)High (Score 12 - 19) 57 8.7 (6.9, 10.5) 31 8.0 (5.8, 10.3) 28 8.5 (5.8, 11.2) 22 7.4 (4.6, 10.2)Severe (Score 20 - 40) 26 3.9 (2.7, 5.1) 11 3.0 (1.6, 4.3) 15 4.5 (1.6, 7.5) 7 2.3 (0.9, 3.7)Hazardous alcohol consumption (AUDIT-C)No 323 49.7 (46.5, 53) 210 54.2 (49.6, 58.7) 191 58.4 (52.6, 64.1) 182 62.1 (55.6, 68.5)Yes 327 50.3 (47, 53.5) 177 45.8 (41.3, 50.4) 136 41.6 (35.9, 47.4) 111 37.9 (31.5, 44.4)Other drug useYes 186 28.5 (25.5, 31.5) 94 24.3 (20.0, 28.6) 74 22.8 (16.3, 29.3) 52 17.7 (13.0, 22.5)No 466 71.5 (68.5, 74.5) 293 75.7 (71.4, 80.0) 252 77.2 (70.7, 83.7) 241 82.3 (77.5, 87.0)Cannabis 162 24.9 (22.0, 27.8) 76 19.7 (15.5, 23.8) 65 20.0 (13.5, 26.5) 48 16.6 (11.9, 21.2)Tobacco useEver smoked 515 79.0 (76.4, 81.7) 313 81.0 (77.5, 84.5) 266 81.5 (77.4, 85.5) 233 79.7 (74.9, 84.4)Smoked more than 100 cigarettes in lifetime 427 65.7 (62.6, 68.8) 248 64.2 (59.6, 68.8) 204 62.3 (56.1, 68.6) 173 59.0 (51.5, 66.6)Ever smoked daily 405 62.2 (59.0, 65.4) 235 60.8 (56.2, 65.5) 194 59.3 (53.1, 65.6) 168 57.3 (49.8, 64.7)
142New Zealand National Gambling Study: Wave 4 (2015)Provider No: 467589, Agreement No: 349827/00Auckland University of Technology, Gambling and Addictions Research Centre Final Report Number 6, 29 March 2018

Health variableWave 1 Wave 2 Wave 3 Wave 4
n % (95% CI) n % (95% CI) n % (95% CI) n % (95% CI)How often currently smoke tobaccoDoes not smoke now 172 26.5 (23.7, 29.3) 106 27.4 (23.6, 31.2) 89 27.2 (22.6, 31.7) 76 26.0 (21.2, 30.8)At least once a day 226 34.8 (31.7, 37.8) 125 32.4 (28.2, 36.5) 96 29.4 (24.4, 34.4) 82 27.9 (22.4, 33.3)At least once a week 18 2.7 (1.5, 3.9) 6 1.5 (0.6, 2.5) 9 2.9 (0.9, 4.8) 7 2.2 (0.7, 3.8)At least once a month 7 1.1 (0.4, 1.8) 4 0.9 (0.2, 1.7) 3 1.0 (0.0, 2.2) 7 2.4 (0.5, 4.3)Less than once a month 4 0.6 (0.2, 1.1) 7 1.9 (0.8, 3.1) 6 2.0 (0.3, 3.6) 1 0.5 !Never smoked 223 34.3 (31.2, 37.4) 139 35.8 (31.2, 40.4) 123 37.7 (31.4, 43.9) 120 41.0 (33.4, 48.5)
Data weighted for 2013 Census data (all waves) and attrition (Waves 2, 3 and 4)Wave 1 N=6,251; Wave 2 N=3,745; Wave 3 N=3,115; Wave 4 N=2,770! Meaningful confidence intervals not calculable due to small sample size
143New Zealand National Gambling Study: Wave 4 (2015)Provider No: 467589, Agreement No: 349827/00Auckland University of Technology, Gambling and Addictions Research Centre Final Report Number 6, 29 March 2018

APPENDIX 17:Health status in Waves 1, 2, 3 and 4 - Pacific
Health variableWave 1 Wave 2 Wave 3 Wave 4
n % (95% CI) n % (95% CI) n % (95% CI) n % (95% CI)Number of major life events0 95 30.8 (27.1, 34.5) 63 34.0 (28.9, 39.1) 41 27.2 (21.6, 32.7) 35 26.3 (20.8, 31.9)1 78 25.1 (21.6, 28.6) 42 22.4 (17.9, 26.9) 39 26.1 (20.6, 31.5) 43 32.7 (26.2, 39.2)2 61 19.6 (16.1, 23.2) 36 19.3 (15.1, 23.5) 32 21.6 (16.6, 26.5) 26 19.4 (13.8, 25.0)3 29 9.3 (6.9, 11.6) 25 13.5 (9.5, 17.6) 22 14.8 (10.2, 19.3) 14 10.5 (6.4, 14.6)4 22 7.0 (4.9, 9.2) 10 5.2 (2.4, 7.9) 7 5.0 (2.5, 7.5) 10 7.6 (3.6, 11.6)5+ 25 8.2 (6.0, 10.4) 10 5.6 (3.2, 8.0) 8 5.5 (2.6, 8.4) 5 3.5 (1.3, 5.6)Quality of life (WHOQoL-8)Below median (Score 0 - 24) 160 51.8 (47.6, 55.9) 94 50.8 (45.4, 56.2) 72 48.0 (41.9, 54) 64 48.6 (42.0, 55.2)Median (Score 25) 27 8.9 (6.5, 11.2) 19 10.3 (6.7, 13.9) 16 10.8 (6.7, 14.8) 11 8.3 (4.4, 12.2)Above median (Score 26 - 32) 122 39.4 (35.3, 43.4) 72 38.9 (33.5, 44.3) 62 41.3 (35.2, 47.3) 57 43.1 (36.5, 49.6)Psychological distress (Kessler-10)Low (Score 0 - 5) 201 65.0 (61.0, 69.0) 125 67.6 (62.6, 72.7) 100 66.7 (61.0, 72.5) 96 72.7 (66.8, 78.7)Moderate (Score 6 - 11) 62 20.2 (16.7, 23.7) 36 19.4 (15.3, 23.4) 33 21.9 (16.6, 27.3) 21 15.6 (10.6, 20.5)High (Score 12 - 19) 35 11.4 (9.0, 13.9) 17 9.1 (5.7, 12.5) 13 8.4 (5.2, 11.6) 11 8.7 (5.0, 12.3)Severe (Score 20 - 40) 10 3.4 (2.0, 4.8) 7 3.9 (2.0, 5.8) 4 3.0 (1.1, 4.8) 4 3.1 (1.4, 4.7)Hazardous alcohol consumption (AUDIT-C)No 213 69.1 (65.2, 73.1) 138 74.2 (69.4, 78.9) 114 76.1 (70.9, 81.4) 97 73.8 (67.9, 79.7)Yes 95 30.9 (26.9, 34.8) 48 25.8 (21.1, 30.6) 36 23.9 (18.6, 29.1) 35 26.2 (20.3, 32.1)Other drug useYes 41 13.3 (10.2, 16.5) 16 8.7 (5.4, 12.0) 15 9.7 (6.0, 13.4) 13 9.5 (5.1, 14.0)No 268 86.7 (83.5, 89.8) 169 91.3 (88, 94.6) 135 90.3 (86.6, 94.0) 119 90.5 (86.0, 94.9)Cannabis 37 12.0 (9.0, 15.1) 14 7.4 (4.2, 10.5) 12 7.7 (4.2, 11.2) 13 9.5 (5.1, 14.0)Tobacco useEver smoked 164 53.0 (49.0, 57.1) 96 51.8 (46.2, 57.4) 79 52.7 (46.5, 58.8) 70 53.3 (46.8, 59.7)Smoked more than 100 cigarettes in lifetime 115 37.3 (33.3, 41.3) 71 38.1 (32.7, 43.4) 58 39.0 (32.9, 45.1) 49 36.7 (30.5, 43.0)Ever smoked daily 105 34.1 (30.2, 38.0) 63 33.8 (28.6, 38.9) 56 37.2 (31.1, 43.2) 48 36.2 (29.9, 42.4)
144New Zealand National Gambling Study: Wave 4 (2015)Provider No: 467589, Agreement No: 349827/00Auckland University of Technology, Gambling and Addictions Research Centre Final Report Number 6, 29 March 2018

Health variableWave 1 Wave 2 Wave 3 Wave 4
n % (95% CI) n % (95% CI) n % (95% CI) n % (95% CI)How often currently smoke tobaccoDoes not smoke now 44 14.4 (11.6, 17.2) 34 18.1 (13.9, 22.3) 28 18.6 (14.1, 23.2) 22 17.0 (12.2, 21.9)At least once a day 64 20.6 (17.2, 24.1) 29 15.5 (11.6, 19.4) 26 17.3 (12.4, 22.2) 22 16.8 (12.0, 21.5)At least once a week 4 1.3 (0.3, 2.2) 5 2.8 (1.2, 4.5) 3 1.9 (0.6, 3.2) 3 2.0 (0.4, 3.6)At least once a month 2 0.5 ! 2 1.2 ! 1 0.9 ! 1 0.5 !Less than once a month 2 0.5 ! 1 0.5 ! 0 0.3 ! 1 0.4 !Never smoked 194 62.7 (58.7, 66.7) 115 61.9 (56.6, 67.3) 91 61.0 (54.9, 67.1) 84 63.3 (57.0, 69.5)
Data weighted for 2013 Census data (all waves) and attrition (Waves 2, 3 and 4)Wave 1 N=6,251; Wave 2 N=3,745; Wave 3 N=3,115; Wave 4 N=2,770! Meaningful confidence intervals not calculable due to small sample size
145New Zealand National Gambling Study: Wave 4 (2015)Provider No: 467589, Agreement No: 349827/00Auckland University of Technology, Gambling and Addictions Research Centre Final Report Number 6, 29 March 2018
APPENDIX 18:Health status in Waves 1, 2, 3 and 4 - Asian
Health variableWave 1 Wave 2 Wave 3 Wave 4
n % (95% CI) n % (95% CI) n % (95% CI) n % (95% CI)Number of major life events0 241 37.7 (34.0, 41.4) 131 35.6 (30.4, 40.7) 98 31.6 (26.0, 37.2) 119 42.4 (35.7, 49.2)1 164 25.8 (22.4, 29.1) 124 33.6 (28.4, 38.7) 98 31.8 (25.9, 37.7) 68 24.5 (18.9, 30.0)2 94 14.7 (12.1, 17.4) 53 14.4 (10.5, 18.2) 61 19.7 (14.8, 24.6) 42 15.2 (9.6, 20.7)3 70 11.0 (8.5, 13.5) 31 8.5 (5.4, 11.6) 33 10.6 (6.5, 14.8) 28 9.9 (5.5, 14.2)4 37 5.8 (4.1, 7.6) 14 3.9 (1.8, 5.9) 10 3.1 (1.3, 4.9) 13 4.6 (1.3, 8.0)5+ 32 5.0 (3.3, 6.6) 15 4.2 (1.8, 6.5) 10 3.2 (0.4, 6.0) 10 3.4 (1.2, 5.6)Quality of life (WHOQoL-8)Below median (Score 0 - 24) 295 46.2 (42.3, 50.1) 179 48.6 (43.2, 54.0) 143 46.3 (40.0, 52.5) 130 46.5 (39.7, 53.2)Median (Score 25) 68 10.7 (8.3, 13.0) 40 11.0 (7.8, 14.1) 31 9.9 (6.1, 13.7) 38 13.7 (8.6, 18.8)Above median (Score 26 - 32) 275 43.1 (39.3, 47.0) 149 40.4 (35.1, 45.7) 136 43.8 (37.6, 50.0) 111 39.8 (33.2, 46.5)Psychological distress (Kessler-10)Low (Score 0 - 5) 466 73.0 (69.5, 76.6) 274 74.2 (69.4, 79.1) 218 70.2 (64.3, 76.2) 214 76.5 (71.0, 82.0)Moderate (Score 6 - 11) 125 19.6 (16.4, 22.9) 68 18.5 (14.3, 22.7) 77 25.0 (19.2, 30.7) 55 19.5 (14.4, 24.7)High (Score 12 - 19) 36 5.6 (3.8, 7.5) 22 5.9 (3.0, 8.9) 15 4.8 (2.4, 7.1) 11 3.8 (1.5, 6.0)Severe (Score 20 - 40) 11 1.7 (0.7, 2.7) 5 1.3 (0.2, 2.4) 0 - 1 0.2 !Hazardous alcohol consumption (AUDIT-C)No 576 90.3 (88.0, 92.5) 329 89.3 (86.0, 92.5) 276 89.3 (85.6, 92.9) 264 94.6 (92.0, 97.2)Yes 62 9.7 (7.5, 12.0) 40 10.7 (7.5, 14.0) 33 10.7 (7.1, 14.4) 15 5.4 (2.8, 8.0)Other drug useYes 24 3.7 (2.0, 5.5) 11 3.0 (1.4, 4.6) 7 2.2 (0.5, 3.8) 6 2.0 (0.1, 3.8)No 614 96.3 (94.5, 98.0) 358 97.0 (95.4, 98.6) 303 97.8 (96.2, 99.5) 274 98.0 (96.2, 99.9)Cannabis 15 2.3 (1.0, 3.7) 5 1.4 (0.3, 2.5) 7 2.2 (0.5, 3.8) 6 2.0 (0.1, 3.8)Tobacco useEver smoked 200 31.4 (27.7, 35.0) 99 26.9 (22.1, 31.7) 86 27.9 (22.3, 33.5) 76 27.3 (21.3, 33.3)Smoked more than 100 cigarettes in lifetime 121 19.0 (15.8, 22.2) 61 16.6 (12.5, 20.6) 55 17.7 (12.8, 22.7) 48 17.1 (11.8, 22.5)Ever smoked daily 109 17.1 (14.1, 20.2) 53 14.3 (10.5, 18.2) 49 15.8 (11.0, 20.7) 46 16.6 (11.3, 21.9)
146New Zealand National Gambling Study: Wave 4 (2015)Provider No: 467589, Agreement No: 349827/00Auckland University of Technology, Gambling and Addictions Research Centre Final Report Number 6, 29 March 2018

Health variableWave 1 Wave 2 Wave 3 Wave 4
n % (95% CI) n % (95% CI) n % (95% CI) n % (95% CI)How often currently smoke tobaccoDoes not smoke now 60 9.5 (7.0, 12.0) 31 8.5 (5.5, 11.5) 33 10.6 (6.3, 14.9) 35 12.6 (7.6, 17.5)At least once a day 49 7.7 (5.6, 9.7) 22 5.9 (3.3, 8.5) 10 3.2 (1.3, 5.0) 10 3.5 (1.4, 5.5)At least once a week 8 1.3 (0.4, 2.2) 6 1.5 (0.2, 2.9) 8 2.4 (0.5, 4.4) 2 0.7 !At least once a month 1 0.2 ! 0 - 1 0.3 ! 1 0.4 !Less than once a month 2 0.4 ! 2 0.7 ! 4 1.3 (0.0, 2.6) 0 -Never smoked 516 81.0 (77.8, 84.2) 308 83.4 (79.4, 87.5) 255 82.3 (77.3, 87.2) 232 82.9 (77.5, 88.2)
Data weighted for 2013 Census data (all waves) and attrition (Waves 2, 3 and 4)Wave 1 N=6,251; Wave 2 N=3,745; Wave 3 N=3,115; Wave 4 N=2,770! Meaningful confidence intervals not calculable due to small sample size
147New Zealand National Gambling Study: Wave 4 (2015)Provider No: 467589, Agreement No: 349827/00Auckland University of Technology, Gambling and Addictions Research Centre Final Report Number 6, 29 March 2018

APPENDIX 19:Typical monthly EGM expenditure by gambling risk level for Waves 1, 2, 3 and 4
Wave 1 Wave 2 Wave 3 Wave 4Gambling risk level EGM venue n $ (95% CI) n $ (95% CI) n $ (95% CI) n $ (95% CI)Non-problem gambler
Casino 380 40.22 (31.23, 49.21) 155 34.28 (25.71, 42.86) 154 33.58 (26.67, 40.48) 118 32.81 (26.13, 39.50)Pub 519 21.80 (19.19, 24.40) 224 20.04 (16.31, 23.77) 195 19.24 (15.26, 23.22) 162 24.65 (18.72, 30.59)Club 267 24.15 (16.79, 31.50) 105 17.58 (13.82, 21.35) 99 21.32 (14.56, 28.08) 79 22.04 (17.32, 26.77)Pub + club 640 27.73 (23.42, 32.05) 281 22.53 (18.04, 27.01) 252 23.25 (18.94, 27.56) 203 28.25 (22.56, 33.94)Total 834 39.62 (33.63, 45.61) 383 30.43 (24.88, 35.99) 334 32.99 (26.89, 39.08) 265 36.25 (29.13, 43.37)
Low-risk gambler Casino 77 74.32 (48.47, 100.18) 46 58.25 (33.92, 82.57) 32 61.95 (46.46, 77.45) 21 93.19 (27.11, 159.28)Pub 103 58.14 (35.99, 80.29) 72 46.84 (35.71, 57.98) 37 48.17 (31.70, 64.64) 45 45.04 (19.60, 70.48)Club 47 39.95 (31.16, 48.73) 33 29.39 (21.82, 36.96) 20 42.36 (20.79, 63.93) 12 65.73 !Pub + club 117 67.15 (45.39, 88.90) 85 50.89 (39.30, 62.47) 44 59.12 (40.34, 77.90) 50 57.34 (10.73, 103.96)Total 154 88.13 (64.32, 111.94) 99 70.98 (52.51, 89.44) 58 79.59 (56.57, 102.60) 51 93.21 (23.63, 162.80)
Moderate-risk/Problem gambler
Casino 60 121.55 (87.53, 155.56) 25 88.31 (60.31, 116.32) 12 97.05 ! 24 106.58 (49.29, 163.86)Pub 93 135.49 (70.99, 200.00) 36 133.65 (82.50, 184.80) 28 74.69 (57.71, 91.67) 20 91.75 (46.73, 136.77)Club 35 144.71 (21.05, 268.38) 16 93.53 (70.66, 116.40) 10 86.72 ! 11 110.16 !Pub + club 98 179.83 (97.24, 262.42) 39 157.50 (110.56, 204.44) 30 99.44 (75.21, 123.67) 27 117.06 (70.66, 163.45)Total 110 227.06 (147.10, 307.01) 46 185.06 (137.37, 232.74) 32 128.72 (91.37, 166.07) 37 150.88 (90.36, 211.40)
Total Casino 516 54.76 (45.72, 63.79) 227 45.22 (36.58, 53.85) 198 42.08 (35.14, 49.02) 163 51.18 (33.45, 68.91)Pub 715 41.80 (32.40, 51.20) 331 38.03 (30.28, 45.79) 259 29.29 (24.39, 34.19) 227 34.70 (27.04, 42.36)Club 349 38.25 (24.51, 51.99) 154 27.87 (18.17, 37.58) 129 29.66 (22.80, 36.51) 103 37.07 (22.57, 51.57)Pub + club 855 50.52 (39.74, 61.31) 406 41.61 (33.40, 49.82) 326 35.04 (29.54, 40.54) 279 41.90 (31.61, 52.19)Total 1097 65.16 (54.83, 75.49) 528 51.44 (43.17, 59.72) 424 46.59 (39.71, 53.47) 353 56.58 (42.27, 70.90)
Data weighted for 2013 Census data (all waves) and attrition (Waves 2, 3 and 4)! Confidence interval not calculable due to small sample size and non-normal distribution
148New Zealand National Gambling Study: Wave 4 (2015)Provider No: 467589, Agreement No: 349827/00Auckland University of Technology, Gambling and Addictions Research Centre Final Report Number 6, 29 March 2018

APPENDIX 20:Estimated annual EGM expenditure by gambling risk level for Waves 1, 2, 3 and 4
Wave 1 Wave 2 Wave 3 Wave 4Gambling risk level EGM venue n $ (95% CI) n $ (95% CI) n $ (95% CI) n $ (95% CI)
Non-problem gambler
Casino 380 96,758,102 (75,160,997, 118,358,081)
155 56,195,229 (41,486,595, 70,903,862)
154 65,422,232 (51,008,043, 79,836,422)
118 55,500,311 (42,906,497, 68,094,125)
Pub 519 71,708,342 ($62,596,826, $80,824,923)
224 47,476,274 ($37,120,702, $57,831,846)
195 47,530,869 (37,474,569, 57,587,170)
162 56,993,455 (41,198,198, 72,788,711)
Club 267 40,844,513 ($28,258,846, $53,430,181)
105 19,441,438 ($14,703,823, $24,179,053)
99 26,846,016 (18,635,146, 35,056,886)
79 24,835,774 (18,733,592, 30,937,956)
Pub + club 640 112,555,990 ($94,498,695, $130,612,081)
281 66,917,711 ($52,282,411, $81,553,012)
252 74,376,885 (60,479,896, 88,273,874)
203 81,829,229 (63,080,527, 100,577,931)
Total 834 209,314,092 ($177,252,892, $241,376,962)
383 123,107,941 ($99,381,273, $146,844,606)
334 139,802,413 (113,402,770, 166,195,464)
265 137,329,540 (107,838,042, 166,821,038)
Low-risk gambler
Casino 77 36,057,704 ($23,774,323, $48,341,085)
46 28,613,230 ($14,419,809, $42,806,651)
32 25,330,686 (18,455,242, 32,206,129)
21 27,616,463 (6,199,702, 49,033,223)
Pub 103 37,887,995 ($23,464,660, $52,311,330)
72 35,596,924 ($26,148,651, $45,045,197)
37 22,488,784 (13,132,743, 31,844,825)
45 29,007,942 (13,662,586, 44,353,297)
Club 47 11,930,858 ($8,548,404, $15,313,312)
33 10,361,422 ($7,598,108, $13,124,736)
20 10,485,382 (4,757,206, 16,213,559)
12 11,678,309 !
Pub + club 117 49,818,853 ($33,723,187, $65,914,520)
85 45,958,346 ($34,538,710, $57,377,981)
44 32,974,166 (20,779,505, 45,168,828)
50 40,686,250 (8,225,601, 73,146,899)
Total 154 85,877,647 ($63,057,133, $108,695,982)
99 74,571,575 ($52,434,461, $96,708,690)
58 58,304,852 (39,494,001, 77,115,704)
51 68,302,713 (18,031,769, 118,573,656)
Moderate-risk/Problem gambler
Casino 60 46,355,775 ($33,708,371, $59,003,179)
25 23,619,065 ($15,545,585, $31,692,546)
12 14,908,857 ! 24 35,821,653 (28,266,132, 43,377,174)
Pub 93 79,768,877 ($41,124,381, $118,413,907)
36 50,230,453 ($26,607,162, $73,853,744)
28 26,346,610 (20,313,732, 32,379,487)
20 26,640,283 (13,823,771, 39,456,796)
Club 35 31,726,491 ($2,911,477, $60,541,505)
16 15,449,984 ($13,078,294, $17,821,673)
10 11,180,516 ! 11 17,847,241 !
Pub + club 98 111,497,728 ($58,647,221, $164,344,049)
39 65,680,437 ($40,933,428, $90,427,446)
30 37,527,126 (27,289,744, 47,764,508)
27 44,487,524 (25,555,446, 63,419,602)
Total 110 157,852,140 ($99,694,686, $216,008,133)
46 89,299,502 ($61,461,770, $117,137,234)
32 52,435,983 (35,335,215, 69,536,750)
37 80,309,177 (59,197,815, 101,420,539)
149New Zealand National Gambling Study: Wave 4 (2015)Provider No: 467589, Agreement No: 349827/00Auckland University of Technology, Gambling and Addictions Research Centre Final Report Number 6, 29 March 2018
Wave 1 Wave 2 Wave 3 Wave 4Gambling risk level EGM venue n $ (95% CI) n $ (95% CI) n $ (95% CI) n $ (95% CI)
Total Casino 516 179,175,803 ($149,761,521, $208,584,515)
227 108,430,581 ($86,560,344, $130,294,703)
198 105,661,775 (86,986,949, 124,336,601)
163 118,938,427 (79,461,716, 158,415,139)
Pub 715 189,365,535 ($146,729,426, $232,006,601)
331 133,301,726 ($105,672,015, $160,935,284)
259 96,366,263 (80,568,012, 112,164,512)
227 112,641,679 (87,117,335, 138,166,025)
Club 349 84,502,540 ($53,794,704, $115,209,021)
154 45,252,843 ($29,660,224, $60,845,463)
129 48,511,915 (37,641,679, 59,382,149)
103 54,361,323 (33,041,892, 75,680,754)
Pub + club 855 273,868,076 ($215,083,445, $332,656,307)
406 178,560,444 ($143,285,935, $213,827,052)
326 144,875,990 (122,695,819, 167,060,536)
279 166,999,414 (125,896,997, 208,109,009)
Total 1097 453,043,878 ($381,053,801, $525,031,987)
528 286,980,450 ($240,265,779, $333,702,255)
424 250,545,913 (213,391,606, 287,688,298)
353 285,935,372 (213,543,717, 358,339,142)
Data weighted for 2013 Census data (all waves) and attrition (Waves 2, 3 and 4)! Confidence interval not calculable due to small sample size and non-normal distribution
150New Zealand National Gambling Study: Wave 4 (2015)Provider No: 467589, Agreement No: 349827/00Auckland University of Technology, Gambling and Addictions Research Centre Final Report Number 6, 29 March 2018

APPENDIX 21:Typical month Class 4 expenditure by demographics for Waves 1, 2, 3 and 4
Wave 1 Wave 2 Wave 3 Wave 4
n Mean$
Median$
SD$
Min$
Max$ n Mean
$
Median$
SD$
Min$
Max$ n
Mean$
Median$
SD$
Min$
Max$
nMea
n$
Median$
SD$
Min$
Max$
Gender
Male 423 47.69 18.18 2002.
2 1 1,400
203 43.59 17.88 1336.
3 1 800 164 35.86 18.33 585.
8 1 400 156 39.47 17.96 778.9 1 800
Female 432 53.30 17.66 4280.
9 1 4,500
202 39.63 17.22 1010.
3 1 2,850
162 34.21 12.07 644.
2 1 800 122 45.01 17.57 1245.
1 1 1,200
Age group (years)
18 - 24 194 39.36 9.33 3223.
6 1 4,500 73 27.71 15.97 461.4 2 320 45 23.27 9.81 122.
4 2 260 47 24.64 11.85 340.5 2 400
25 - 34 211 40.63 18.25 1291.
1 1 1,400 94 35.76 18.28 523.5 1 300 84 36.91 17.60 497.
3 1 400 68 63.43 23.57 1068.8 2 1,20
0
35 - 44 136 40.08 18.89 651.8 1 550 73 41.03 15.38 1084.
7 2 540 45 27.94 14.57 253.3 1 180 42 19.01 9.78 128.0 1 140
45 - 54 119 66.20 18.70 1256.
1 1 1,700 68 65.97 18.11 960.0 1 2,85
0 62 42.42 13.98 464.3 1 800 42 51.03 19.89 467.2 2 1,00
0
55 - 64 96 82.91 18.72 2575.4 1 1,00
0 44 44.55 17.89 418.6 1 500 39 46.53 14.91 408.6 1 320 38 42.83 13.43 246.4 1 500
65+ 98 57.73 20.44 1340.4 1 900 54 38.45 15.78 389.7 2 400 52 30.94 17.81 306.
2 1 200 41 39.63 19.08 313.0 1 200
Ethnic group (prioritised)
Māori 168 82.13 19.07 3525.
4 1 4,500 81 58.38 18.96 624.2 1 800 52 52.63 18.52 486.
4 1 450 48 59.84 18.56 1144.1 1 1,20
0
Pacific 45 64.97 19.33 596.1 2 1,700 16 66.48 19.42 391.7 2 1,20
0 16 38.95 23.73 115.1 2 400 15 70.58 16.82 350.4 2 1,00
0
Asian 23 55.12 19.81 345.5 2 250 7 192.75 27.05 836.0 2 2,85
0 11 67.12 26.09 212.6 20 800 9 18.12 11.57 15.0 2 40
European/Other
613 40.79 17.31 3064.
2 1 1,000
303 32.54 16.56 1294.
8 1 540 247 29.66 12.68 674.
4 1 320 208 36.81 17.59 821.9 1 500
Arrival in New Zealand
NZ Born 718 49.71 17.84 4386.
2 1 4,500
348 40.19 17.68 1459.
1 1 1,200
270 35.28 17.15 824.
4 1 450 234 42.74 17.47 1429.
9 1 1,200
Before 2008 128 54.78 18.02 1509.
2 2 1,400 55 51.81 15.26 410.2 2 2,85
0 54 34.01 14.24 257.5 2 800 43 38.32 18.76 252.7 2 800
151New Zealand National Gambling Study: Wave 4 (2015)Provider No: 467589, Agreement No: 349827/00Auckland University of Technology, Gambling and Addictions Research Centre Final Report Number 6, 29 March 2018

Since 2008 9 55.28 11.76 219.5 5 250 2 6.56 5.00 3.2 5 10 2 29.56 20.00 - 20 40 2 14.75 10.00 - 10 20 Area of residence
Auckland 179 72.38 18.31 3504.
4 1 4,500 87 40.23 18.61 595.5 1 1,20
0 60 34.90 13.17 414.8 1 400 60 39.91 13.80 457.5 2 1,00
0
Wellington 87 44.17 19.86 600.4 1 550 33 80.88 18.32 1106.8 1 550 32 41.38 18.83 266.
1 2 450 23 45.32 16.40 360.5 5 300
Christchurch 79 38.84 13.89 489.5 1 400 31 36.93 16.21 210.9 2 200 31 36.89 18.34 209.
6 1 300 30 44.50 33.13 278.9 2 400
Rest of NZ 510 45.74 17.48 3077.
6 1 1,360
254 37.55 17.14 1123.
5 1 2,850
203 33.81 16.23 708.
7 1 800 166 41.68 17.59 1308.
6 1 1,200
Data weighted for 2013 Census data (all waves) and attrition (Waves 2, 3 and 4)
152New Zealand National Gambling Study: Wave 4 (2015)Provider No: 467589, Agreement No: 349827/00Auckland University of Technology, Gambling and Addictions Research Centre Final Report Number 6, 29 March 2018

APPENDIX 22:Gambling risk levels by sociodemographic variables for Waves 1, 2, 3 and 4
Baseline variable Gambling risk levelWave 1 Wave 2 Wave 3 Wave 4
n % (95% CI) n % (95% CI) n % (95% CI) n % (95% CI)GenderMale Non-problem gambler 2143 71.
7 (69.7, 73.7) 1287 71.8 (69.2, 74.4) 1064 71.3 (68.1, 74.5) 919 69.1 (65.6, 72.7)
Low-risk gambler 164 5.5 (4.4, 6.5) 97 5.4 (4.1, 6.7) 73 4.9 (3.5, 6.3) 65 4.9 (3.3, 6.4)Moderate-risk/problem gambler 85 2.8 (2.2, 3.5) 42 2.3 (1.5, 3.2) 26 1.8 (1.1, 2.4) 29 2.2 (1.0, 3.4)No gambling in past year 597 20.
0 (18.2, 21.8) 366 20.4 (18.1, 22.8) 329 22.1 (19.1, 25.1) 316 23.8 (20.4, 27.1)
Female Non-problem gambler 2392 73.3 (71.7, 75.0) 1346 68.9 (66.5, 71.2) 1123 68.8 (66.2,
71.5) 971 67.4 (64.6, 70.2)
Low-risk gambler 143 4.4 (3.6, 5.2) 114 5.8 (4.7, 6.9) 82 5.0 (3.9, 6.2) 63 4.3 (3.3, 5.4)Moderate-risk/problem gambler 63 1.9 (1.4, 2.4) 33 1.7 (1.2, 2.2) 29 1.8 (1.2, 2.3) 28 1.9 (1.2, 2.7)No gambling in past year 664 20.
4 (18.8, 21.9) 462 23.6 (21.4, 25.8) 398 24.4 (21.9, 26.9) 379 26.3 (23.6, 29.0)
Age group (years) 18 - 39 Non-problem gambler 1564 67.
3 (64.8, 69.7) 847 62.9 (59.4, 66.3) 719 63.9 (59.7, 68.1) 602 60.4 (55.6, 65.1)
Low-risk gambler 154 6.6 (5.3, 8.0) 104 7.7 (5.9, 9.5) 63 5.6 (3.8, 7.4) 64 6.4 (4.3, 8.5)Moderate-risk/problem gambler 88 3.8 (2.9, 4.7) 34 2.5 (1.6, 3.4) 22 1.9 (1.2, 2.7) 32 3.2 (1.6, 4.9)No gambling in past year 518 22.
3 (20.1, 24.5) 363 26.9 (23.7, 30.1) 321 28.5 (24.5, 32.6) 299 30.0 (25.4, 34.6)
40 - 59 Non-problem gambler 2092 76.8 (75.0, 78.6) 1260 75.8 (73.6, 78.1) 1041 75.5 (73.1,
78.0) 912 74.5 (71.9, 77.1)
Low-risk gambler 112 4.1 (3.3, 4.9) 81 4.9 (3.8, 5.9) 70 5.0 (3.8, 6.3) 51 4.1 (3.1, 5.2)Moderate-risk/problem gambler 53 1.9 (1.4, 2.5) 32 1.9 (1.2, 2.6) 23 1.7 (1.1, 2.2) 20 1.6 (0.9, 2.3)No gambling in past year 466 17.
1 (15.5, 18.7) 289 17.4 (15.3, 19.4) 245 17.8 (15.6, 20.0) 242 19.7 (17.3, 22.2)
60+ Non-problem gambler 873 73.0 (70.2, 75.8) 524 71.2 (67.7, 74.8) 424 68.7 (64.7,
72.7) 375 68.9 (64.8, 73.0)
Low-risk gambler 41 3.4 (2.2, 4.6) 26 3.5 (2.1, 4.8) 22 3.6 (2.1, 5.1) 12 2.3 (1.0, 3.5)Moderate-risk/problem gambler 7 0.6 (0.1, 1.0) 9 1.3 (0.4, 2.1) 10 1.6 (0.6, 2.7) 5 1.0 (0.2, 1.7)No gambling in past year 276 23.
1 (20.5, 25.7) 177 24.0 (20.6, 27.4) 161 26.1 (22.3, 29.8) 152 27.8 (23.9, 31.8)
Ethnic group (prioritised)
153New Zealand National Gambling Study: Wave 4 (2015)Provider No: 467589, Agreement No: 349827/00Auckland University of Technology, Gambling and Addictions Research Centre Final Report Number 6, 29 March 2018

Baseline variable Gambling risk levelWave 1 Wave 2 Wave 3 Wave 4
n % (95% CI) n % (95% CI) n % (95% CI) n % (95% CI)Māori Non-problem gambler 466 71.
6 (68.6, 74.5) 254 65.7 (61.3, 70.1) 206 63.0 (56.5, 69.4) 190 64.8 (57.2, 72.4)
Low-risk gambler 51 7.8 (6.0, 9.6) 46 11.9 (8.9, 14.9) 31 9.5 (5.2, 13.7) 19 6.4 (4.0, 8.9)Moderate-risk/problem gambler 39 6.0 (4.5, 7.5) 23 6.0 (3.8, 8.2) 21 6.3 (4.0, 8.5) 25 8.6 (3.6, 13.6)No gambling in past year 95 14.
6 (12.3, 17.0) 63 16.3 (12.8, 19.8) 70 21.3 (15.0, 27.6) 59 20.2 (12.7, 27.7)
Pacific Non-problem gambler 178 57.5 (53.4, 61.7) 103 55.4 (50.0, 60.8) 80 53.8 (47.5,
60.1) 70 53.1 (46.7, 59.5)
Low-risk gambler 29 9.4 (6.9, 11.9) 17 9.0 (6.1, 11.9) 15 10.2 (6.6, 13.7) 12 8.8 (5.4, 12.2)Moderate-risk/problem gambler 23 7.4 (4.9, 9.9) 13 6.9 (4.3, 9.5) 11 7.6 (4.1, 11.2) 10 7.6 (4.4, 10.8)No gambling in past year 79 25.
7 (22.1, 29.3) 53 28.7 (23.6, 33.8) 42 28.4 (22.6, 34.2) 40 30.5 (24.4, 36.6)
Asian Non-problem gambler 329 51.6 (47.7, 55.5) 182 49.4 (44.0, 54.8) 160 51.5 (45.3,
57.8) 149 53.5 (46.7, 60.2)
Low-risk gambler 37 5.8 (3.8, 7.8) 19 5.1 (2.8, 7.4) 16 5.2 (2.9, 7.5) 13 4.5 (2.2, 6.9)Moderate-risk/problem gambler 18 2.8 (1.4, 4.2) 6 1.7 (0.3, 3.0) 4 1.4 (0.1, 2.7) 3 1.2 (0.1, 2.3)No gambling in past year 254 39.
8 (36.0, 43.6) 162 43.9 (38.4, 49.4) 130 41.9 (35.6, 48.2) 114 40.8 (34.1, 47.6)
European/Other Non-problem gambler 3499 76.7 (75.1, 78.3) 2062 74.6 (72.5, 76.6) 1722 74.7 (72.3,
77.0) 1463 71.7 (69.0, 74.3)
Low-risk gambler 189 4.1 (3.3, 4.9) 129 4.6 (3.7, 5.6) 93 4.0 (3.1, 5.0) 84 4.1 (3.0, 5.3)Moderate-risk/problem gambler 68 1.5 (1.0, 2.0) 32 1.2 (0.7, 1.7) 18 0.8 (0.4, 1.2) 19 0.9 (0.5, 1.4)No gambling in past year 806 17.
7 (16.3, 19.1) 543 19.6 (17.7, 21.6) 473 20.5 (18.3, 22.8) 475 23.3 (20.8, 25.8)
Arrival in New ZealandNZ born Non-problem gambler 3375 76.
2 (74.6, 77.7) 1985 73.7 (71.7, 75.8) 1654 73.2 (70.8, 75.6) 1444 71.8 (69.2, 74.3)
Low-risk gambler 223 5.0 (4.2, 5.9) 160 6.0 (4.9, 7.0) 114 5.1 (3.9, 6.2) 93 4.6 (3.4, 5.8)Moderate-risk/problem gambler 102 2.3 (1.8, 2.8) 54 2.0 (1.4, 2.6) 42 1.9 (1.3, 2.4) 48 2.4 (1.5, 3.3)No gambling in past year 731 16.
5 (15.2, 17.8) 493 18.3 (16.5, 20.1) 449 19.9 (17.6, 22.1) 428 21.3 (18.9, 23.7)
Before 2008 Non-problem gambler 1007 66.9 (64.2, 69.5) 567 65.0 (61.5, 68.5) 462 64.7 (60.6,
68.8) 383 61.3 (56.6, 66.1)
Low-risk gambler 69 4.6 (3.4, 5.7) 41 4.7 (3.3, 6.0) 35 4.8 (3.3, 6.4) 32 5.1 (3.4, 6.8)Moderate-risk/problem gambler 36 2.4 (1.5, 3.3) 19 2.2 (1.2, 3.1) 12 1.7 (0.8, 2.5) 8 1.2 (0.5, 2.0)No gambling in past year 394 26.
2 (23.7, 28.6) 246 28.2 (24.8, 31.5) 205 28.8 (24.7, 32.8) 202 32.3 (27.6, 37.1)
Since 2008 Non-problem gambler 153 48.7 (41.9, 55.6) 81 44.7 (35.6, 53.9) 70 46.9 (37.0,
56.8) 63 47.3 (36.0, 58.6)
154New Zealand National Gambling Study: Wave 4 (2015)Provider No: 467589, Agreement No: 349827/00Auckland University of Technology, Gambling and Addictions Research Centre Final Report Number 6, 29 March 2018

Baseline variable Gambling risk levelWave 1 Wave 2 Wave 3 Wave 4
n % (95% CI) n % (95% CI) n % (95% CI) n % (95% CI)Low-risk gambler 16 5.0 (2.3, 7.7) 9 5.0 (1.6, 8.5) 6 4.1 (1.0, 7.1) 3 2.2 (0.5, 3.8)Moderate-risk/problem gambler 10 3.2 (0.9, 5.5) 2 0.9 ! 1 0.5 ! 2 1.6 !No gambling in past year 135 43.
1 (36.4, 49.8) 89 49.4 (40.1, 58.6) 73 48.5 (38.7, 58.4) 65 49.0 (37.8, 60.1)
Labour force statusEmployed Non-problem gambler 3019 75.
4 (73.8, 77.0) 1787 72.3 (70.1, 74.5) 1521 73.1 (70.6, 75.7) 1307 70.9 (68.0, 73.7)
Low-risk gambler 196 4.9 (4.1, 5.7) 132 5.3 (4.3, 6.4) 109 5.2 (4.1, 6.4) 88 4.7 (3.6, 5.9)Moderate-risk/problem gambler 83 2.1 (1.6, 2.5) 47 1.9 (1.3, 2.5) 33 1.6 (1.1, 2.1) 33 1.8 (1.2, 2.4)No gambling in past year 707 17.
7 (16.2, 19.1) 507 20.5 (18.5, 22.5) 416 20.0 (17.6, 22.4) 417 22.6 (19.8, 25.3)
Unemployed Non-problem gambler 350 64.9 (60.5, 69.3) 173 60.5 (53.7, 67.3) 106 52.6 (44.8,
60.4) 87 48.9 (39.8, 58.1)
Low-risk gambler 44 8.2 (5.4, 11.0) 26 9.2 (5.3, 13.1) 15 7.6 (3.9, 11.4) 19 10.8 (4.0, 17.7)Moderate-risk/problem gambler 32 5.9 (3.7, 8.1) 14 4.8 (2.4, 7.2) 10 4.8 (2.4, 7.3) 15 8.2 (0.7, 15.7)No gambling in past year 113 21.
0 (17.3, 24.6) 73 25.5 (19.8, 31.1) 70 34.9 (27.5, 42.4) 57 32.0 (23.9, 40.2)
Student/Homemaker/Retired Non-problem gambler 1165 68.3 (65.8, 70.9) 673 68.2 (65.0, 71.4) 560 66.5 (62.8,
70.1) 487 66.2 (62.4, 69.9)
Low-risk gambler 67 3.9 (2.7, 5.2) 52 5.3 (3.7, 6.8) 31 3.7 (2.3, 5.0) 20 2.7 (1.5, 3.8)Moderate-risk/problem gambler 33 2.0 (1.2, 2.7) 14 1.5 (0.7, 2.2) 12 1.4 (0.6, 2.2) 10 1.3 (0.5, 2.1)No gambling in past year 439 25.
8 (23.4, 28.1) 248 25.1 (22.1, 28.1) 240 28.5 (24.9, 32.1) 220 29.9 (26.2, 33.5)
NZ Individual Deprivation Index0 Non-problem gambler 2703 76.
4 (74.7, 78.0) 1689 74.2 (72.1, 76.3) 1479 74.0 (71.8, 76.3) 1361 72.9 (70.5, 75.4)
Low-risk gambler 124 3.5 (2.8, 4.2) 91 4.0 (3.1, 4.9) 81 4.1 (3.0, 5.1) 57 3.1 (2.2, 3.9)Moderate-risk/problem gambler 35 1.0 (0.6, 1.3) 26 1.1 (0.7, 1.6) 19 1.0 (0.6, 1.4) 19 1.0 (0.6, 1.5)No gambling in past year 678 19.
1 (17.6, 20.7) 470 20.7 (18.7, 22.6) 418 20.9 (18.8, 23.1) 428 22.9 (20.6, 25.3)
1 Non-problem gambler 950 70.5 (67.5, 73.5) 513 68.2 (64.0, 72.4) 402 71.8 (66.9,
76.7) 300 61.9 (55.2, 68.6)
Low-risk gambler 77 5.7 (4.0, 7.4) 45 6.0 (4.0, 8.0) 29 5.2 (2.7, 7.6) 26 5.3 (2.6, 8.1)Moderate-risk/problem gambler 45 3.3 (2.2, 4.5) 23 3.1 (1.5, 4.6) 8 1.3 (0.4, 2.3) 18 3.8 (0.8, 6.8)No gambling in past year 276 20.
5 (17.9, 23.1) 171 22.7 (18.9, 26.6) 122 21.7 (17.1, 26.3) 141 29.0 (22.4, 35.6)
2 Non-problem gambler 459 67.2 (63.0, 71.5) 219 65.2 (59.1, 71.4) 141 53.9 (45.4,
62.4) 109 55.1 (46.6, 63.6)
155New Zealand National Gambling Study: Wave 4 (2015)Provider No: 467589, Agreement No: 349827/00Auckland University of Technology, Gambling and Addictions Research Centre Final Report Number 6, 29 March 2018

Baseline variable Gambling risk levelWave 1 Wave 2 Wave 3 Wave 4
n % (95% CI) n % (95% CI) n % (95% CI) n % (95% CI)Low-risk gambler 49 7.2 (4.8, 9.5) 34 10.2 (6.3, 14.0) 26 9.8 (5.5, 14.0) 18 8.9 (4.8, 12.9)Moderate-risk/problem gambler 22 3.2 (1.8, 4.7) 5 1.4 (0.5, 2.4) 9 3.5 (1.3, 5.7) 6 2.8 (0.5, 5.1)No gambling in past year 153 22.
4 (18.6, 26.1) 78 23.2 (17.8, 28.6) 86 32.9 (24.0, 41.8) 66 33.2 (25.1, 41.3)
3 Non-problem gambler 173 63.7 (57.3, 70.2) 102 55.4 (46.5, 64.3) 86 56.2 (45.5,
66.8) 66 62.9 (50.6, 75.3)
Low-risk gambler 20 7.4 (4.5, 10.4) 19 10.1 (4.8, 15.5) 8 5.2 (2.0, 8.3) 9 8.5 (2.7, 14.3)Moderate-risk/problem gambler 16 6.0 (2.7, 9.3) 12 6.6 (2.6, 10.7) 7 4.6 (1.9, 7.4) 4 3.8 (0.8, 6.9)No gambling in past year 62 22.
8 (17.2, 28.4) 51 27.8 (19.5, 36.1) 52 34.0 (23.1, 44.9) 26 24.7 (14.8, 34.7)
4 Non-problem gambler 123 61.0 (52.9, 69.1) 39 52.6 (40.5, 64.7) 45 62.6 (46.9,
78.3) 28 50.8 (36.4, 65.3)
Low-risk gambler 26 12.7 (6.4, 19.0) 10 14.0 (5.5, 22.5) 4 6.1 (1.0, 11.1) 6 10.0 (1.1, 19.0)
Moderate-risk/problem gambler 11 5.4 (2.3, 8.5) 3 4.4 (1.6, 7.3) 4 6.2 (0.0, 12.4) 3 6.2 (0.7, 11.6)No gambling in past year 42 20.
9 (14.2, 27.7) 21 29.0 (18.1, 39.8) 18 25.2 (12.3, 38.1) 18 33.0 (18.2, 47.8)
5+ Non-problem gambler 126 61.4 (54.6, 68.2) 71 58.0 (46.9, 69.1) 33 42.0 (31.5,
52.4) 25 41.9 (28.8, 55.0)
Low-risk gambler 11 5.6 (2.4, 8.7) 11 9.2 (3.6, 14.7) 7 9.3 (3.1, 15.4) 12 20.3 (4.8, 35.8)Moderate-risk/problem gambler 19 9.0 (5.2, 12.8) 5 4.3 (1.9, 6.7) 7 9.5 (4.2, 14.8) 7 11.1 (3.5, 18.7)No gambling in past year 49 24.
0 (17.9, 30.1) 35 28.5 (18.4, 38.6) 31 39.3 (27.9, 50.6) 16 26.8 (16.2, 37.3)
Data weighted for 2013 Census data (all waves) and attrition (Waves 2, 3 and 4)! Meaningful confidence intervals not calculable due to small sample size
156New Zealand National Gambling Study: Wave 4 (2015)Provider No: 467589, Agreement No: 349827/00Auckland University of Technology, Gambling and Addictions Research Centre Final Report Number 6, 29 March 2018

APPENDIX 23:Gambling risk levels by gambling behaviour for Waves 1, 2, 3 and 4
Gambling participation-related variables Gambling risk level
Wave 1 Wave 2 Wave 3 Wave 4n % (95% CI) n % (95% CI) n % (95% CI) n % (95% CI)
Number of gambling activities participated in1 Non-problem gambler 1325 96.
3 (95.0, 97.6) 770 95.8 (94.2, 97.3) 660 95.3 (93.5, 97) 595 95.7 (94.1, 97.3)
Low-risk gambler 47 3.4 (2.2, 4.7) 28 3.5 (2.0, 5.0) 28 4.0 (2.3, 5.6) 22 3.5 (2.1, 4.9)Moderate-risk/problem gambler 4 0.3 (0.0, 0.6) 6 0.8 (0.3, 1.3) 5 0.8 (0.2, 1.3) 3 0.4 (0.1, 0.8)
2 Non-problem gambler 1260 95.6 (94.3, 96.8) 785 94.8 (93.0, 96.6) 651 95.2 (93.7, 96.7) 561 95.7 (94.0, 97.5)
Low-risk gambler 42 3.2 (2.2, 4.2) 29 3.5 (2.0, 5.0) 24 3.5 (2.3, 4.8) 17 3.0 (1.4, 4.5)Moderate-risk/problem gambler 16 1.2 (0.6, 1.9) 14 1.7 (0.7, 2.8) 9 1.3 (0.5, 2.1) 8 1.3 (0.5, 2.1)
3 Non-problem gambler 877 91.0 (89.0, 93.1) 558 89.0 (86.2, 91.9) 430 92.6 (89.9, 95.2) 387 90.6 (87.7, 93.6)
Low-risk gambler 66 6.8 (4.9, 8.7) 53 8.4 (5.9, 10.9) 27 5.8 (3.3, 8.2) 25 5.9 (3.5, 8.4)Moderate-risk/problem gambler 21 2.2 (1.2, 3.1) 16 2.5 (1.0, 4.1) 8 1.7 (0.6, 2.7) 15 3.4 (1.7, 5.2)
4 - 6 Non-problem gambler 917 83.6 (80.9, 86.3) 475 81.9 (78.4, 85.3) 401 82.3 (78.3, 86.2) 320 81.1 (75.6, 86.5)
Low-risk gambler 107 9.8 (7.6, 12.0) 77 13.3 (10.2, 16.3) 62 12.8 (9.1, 16.4) 49 12.4 (7.9, 16.9)Moderate-risk/problem gambler 73 6.6 (4.9, 8.4) 28 4.9 (3.1, 6.6) 24 5.0 (3.1, 6.8) 26 6.5 (2.7, 10.3)
7 - 9 Non-problem gambler 143 69.2 (62.1, 76.3) 44 59.5 (45.9, 73.2) 44 68.8 (55.7, 81.8) 25 57.5 (42.7, 72.3)
Low-risk gambler 37 18.1 (12.2, 24.1) 21 28.9 (16.7, 41.1) 13 20.4 (7.5, 33.2) 12 27.5 (13.8, 41.2)
Moderate-risk/problem gambler 26 12.7 (8.3, 17.1) 8 11.6 (4.8, 18.4) 7 10.9 (4.3, 17.5) 6 15.1 (6.3, 23.8)
10+ Non-problem gambler 13 45.2 (18.4, 72.0) 1 20.1 ! - 2 41.8 !
Low-risk gambler 8 28.5 (0.0, 57.1) 2 48.0 ! 1 38.4 ! 2 51.2 !
Moderate-risk/problem gambler 7 26.3 (6.1, 46.5) 2 31.9 ! 2 61.6 ! 0 7.0 !
Gambling frequencyAt least weekly Non-problem gambler 1204 84.
5 (82.5, 86.6) 648 82.3 (79.4, 85.2) 536 84.4 (81.5, 87.3) 427 82.9 (79.6, 86.2)
Low-risk gambler 137 9.6 (7.9, 11.4) 95 12.0 (9.5, 14.6) 63 10.0 (7.6, 12.4) 56 10.9 (8.1, 13.6)
157New Zealand National Gambling Study: Wave 4 (2015)Provider No: 467589, Agreement No: 349827/00Auckland University of Technology, Gambling and Addictions Research Centre Final Report Number 6, 29 March 2018

Gambling participation-related variables Gambling risk level
Wave 1 Wave 2 Wave 3 Wave 4n % (95% CI) n % (95% CI) n % (95% CI) n % (95% CI)
Moderate-risk/problem gambler 83 5.8 (4.5, 7.1) 44 5.6 (4.0, 7.3) 36 5.6 (3.9, 7.4) 32 6.2 (4.2, 8.3)At least monthly Non-problem gambler 1228 89.
8 (87.7, 91.8) 702 89.4 (87.0, 91.8) 558 88.2 (85.0, 91.4) 465 90.1 (86.6, 93.6)
Low-risk gambler 92 6.7 (5.0, 8.5) 65 8.2 (6.1, 10.4) 64 10.0 (6.9, 13.1) 40 7.7 (4.4, 11)Moderate-risk/problem gambler 48 3.5 (2.3, 4.7) 19 2.4 (1.3, 3.4) 11 1.8 (0.9, 2.6) 11 2.2 (0.8, 3.5)
At least 6 monthly Non-problem gambler 1626 95.4 (94.1, 96.7) 1013 95.0 (93.4, 96.5) 853 96.5 (95.2, 97.8) 772 94.9 (92.6, 97.1)
Low-risk gambler 66 3.9 (2.6, 5.1) 45 4.2 (2.8, 5.6) 26 3.0 (1.7, 4.2) 29 3.5 (2.0, 5.0)Moderate-risk/problem gambler 12 0.7 (0.3, 1.1) 9 0.8 (0.2, 1.4) 5 0.6 (0.1, 1.0) 13 1.6 (0.0, 3.3)
At least once in past year Non-problem gambler 467 96.7 (95.0, 98.4) 260 97.1 (93.7, 100.0) 236 98.3 (96.7, 99.8) 222 98.3 (96.7, 99.9)
Low-risk gambler 11 2.3 (1.0, 3.6) 5 1.8 (0.0, 4.4) 2 0.7 ! 3 1.3 (0.0, 2.8)Moderate-risk/problem gambler 5 1.0 (0.0, 2.2) 3 1.2 (0.0, 3.4) 2 1.0 ! 1 0.4 !
Pattern of participationInfrequent gambler Non-problem gambler 3347 93.
2 (92.2, 94.3) 1992 93.0 (91.8, 94.3) 1651 93.6 (92.2, 94.9) 1465 93.8 (92.1, 95.4)
Low-risk gambler 171 4.8 (3.9, 5.7) 118 5.5 (4.4, 6.6) 92 5.2 (3.9, 6.5) 72 4.6 (3.3, 6.0)Moderate-risk/problem gambler 72 2.0 (1.5, 2.6) 31 1.5 (0.9, 2.0) 21 1.2 (0.7, 1.6) 25 1.6 (0.6, 2.6)
Regular non-continuous gambler Non-problem gambler 927 92.
1 (90.4, 93.7) 485 88.5 (85.6, 91.4) 428 89.7 (86.9, 92.5) 333 88.7 (85.4, 92.0)
Low-risk gambler 54 5.4 (3.9, 6.8) 48 8.8 (6.1, 11.4) 37 7.7 (5.2, 10.2) 31 8.3 (5.4, 11.1)Moderate-risk/problem gambler 26 2.6 (1.6, 3.5) 15 2.7 (1.4, 4.0) 12 2.6 (1.2, 4.0) 11 3.1 (1.2, 4.9)
Regular continuous gambler Non-problem gambler 261 66.4 (61.1, 71.8) 156 68.1 (61.3, 74.9) 107 69.7 (62.0, 77.4) 92 67.3 (58.9, 75.8)
Low-risk gambler 82 20.9 (16.2, 25.6) 45 19.4 (13.7, 25.2) 26 16.8 (10.6, 23.0) 24 17.6 (11.1, 24.0)
Moderate-risk/problem gambler 50 12.6 (9.2, 16.1) 29 12.5 (7.9, 17.0) 21 13.6 (8.3, 18.9) 21 15.1 (9.3, 20.8)
Typical monthly gambling expenditure$1 - $10 Non-problem gambler 987 96.
9 (95.6, 98.2) 636 97.3 (95.7, 98.9) 498 97.4 (96.0, 98.9) 454 98.0 (96.8, 99.2)
Low-risk gambler 29 2.8 (1.6, 4.1) 17 2.5 (1.0, 4.1) 10 2.0 (0.7, 3.3) 8 1.7 (0.6, 2.8)Moderate-risk/problem gambler 3 0.2 (0.0, 0.6) 1 0.2 ! 3 0.6 (0.0, 1.2) 1 0.3 !
$11 - $20 Non-problem gambler 960 95.7 (94.1, 97.3) 569 96.0 (94.5, 97.6) 458 96.0 (94.2, 97.8) 365 95.0 (92.8, 97.2)
Low-risk gambler 35 3.5 (2.0, 5.0) 20 3.3 (1.9, 4.8) 17 3.6 (1.9, 5.3) 15 3.8 (1.8, 5.8)Moderate-risk/problem gambler 8 0.8 (0.3, 1.3) 4 0.7 (0.2, 1.2) 2 0.4 ! 5 1.2 (0.2, 2.2)
158New Zealand National Gambling Study: Wave 4 (2015)Provider No: 467589, Agreement No: 349827/00Auckland University of Technology, Gambling and Addictions Research Centre Final Report Number 6, 29 March 2018

Gambling participation-related variables Gambling risk level
Wave 1 Wave 2 Wave 3 Wave 4n % (95% CI) n % (95% CI) n % (95% CI) n % (95% CI)
$21 - $30 Non-problem gambler 595 95.1 (93.1, 97.2) 338 92.8 (89.5, 96) 323 95.9 (93.5, 98.3) 278 93.5 (89.6, 97.5)
Low-risk gambler 27 4.3 (2.3, 6.3) 22 6.0 (3.0, 9.0) 14 4.1 (1.7, 6.5) 17 5.6 (1.7, 9.5)Moderate-risk/problem gambler 4 0.6 (0.1, 1.2) 5 1.3 (0.0, 2.6) - 2 0.8 !
$31 - $50 Non-problem gambler 678 95.7 (93.7, 97.7) 367 93.0 (90.3, 95.8) 318 92.3 (89.3, 95.3) 265 90.8 (85.4, 96.2)
Low-risk gambler 24 3.4 (1.5, 5.4) 22 5.5 (3.0, 7.9) 23 6.6 (3.7, 9.4) 17 5.9 (2.8, 8.9)Moderate-risk/problem gambler 6 0.8 (0.2, 1.5) 6 1.5 (0.2, 2.8) 4 1.1 (0.2, 2.1) 10 3.3 (0.0, 8.1)
$51 - $100 Non-problem gambler 716 89.7 (87.2, 92.3) 410 86.7 (83.2, 90.3) 341 87.2 (83.2, 91.2) 318 90.5 (86.5, 94.5)
Low-risk gambler 56 7.0 (5.0, 9.0) 54 11.4 (8.0, 14.7) 39 9.9 (6.2, 13.7) 28 7.9 (4.0, 11.7)Moderate-risk/problem gambler 26 3.2 (1.6, 4.9) 9 1.9 (0.7, 3.1) 11 2.9 (1.4, 4.4) 6 1.7 (0.5, 2.8)
$101 - $500 Non-problem gambler 509 74.0 (70.2, 77.8) 263 72.1 (66.7, 77.5) 202 74.4 (68.5, 80.2) 186 74.3 (68.4, 80.2)
Low-risk gambler 104 15.2 (11.9, 18.5) 65 17.8 (13.3, 22.4) 44 16.2 (11.0, 21.4) 40 16.1 (11.1, 21.2)
Moderate-risk/problem gambler 75 10.9 (8.4, 13.4) 37 10.1 (6.6, 13.6) 26 9.4 (6.1, 12.8) 24 9.5 (5.9, 13.2)
>$500 Non-problem gambler 73 56.8 (46.7, 66.9) 42 65.5 (51.6, 79.3) 38 69.5 (55.6, 83.4) 19 60.7 (41.4, 80.1)
Low-risk gambler 29 22.7 (14.3, 31.2) 9 13.6 (4.2, 23.0) 8 15.0 (2.9, 27.1) 3 9.6 (2.4, 16.8)
Moderate-risk/problem gambler 26 20.5 (12.6, 28.4) 13 21.0 (10.1, 31.9) 9 15.5 (5.8, 25.1) 10 29.6 (11.3, 48)
NZ casino EGMS (time gambling in average day)Up to 15 minutes Non-problem gambler 104 86.
9 (78.2, 95.7) 32 74.0 (55.1, 92.9) 38 96.7 (93.2, 100.0) 23 77.0 (35.5, 100.0)
Low-risk gambler 7 5.4 (0.7, 10.2) 6 12.9 (0.8, 25.0) 1 2.4 ! -Moderate-risk/problem gambler 9 7.6 (0.0, 15.3) 6 13.1 (0.0, 29.3) 0 0.9 ! 7 23.0 (0.0, 64.5)
16 - 30 minutes Non-problem gambler 92 77.6 (66.2, 89.0) 47 87.3 (76.2, 98.4) 40 77.3 (63.6, 90.9) 32 77.8 (66.2, 89.3)
Low-risk gambler 21 17.5 (6.6, 28.4) 5 9.9 (0.0, 20.1) 10 19.6 (6.5, 32.6) 6 14.3 (2.7, 25.8)
Moderate-risk/problem gambler 6 4.9 (0.0, 9.8) 1 2.8 ! 2 3.2 ! 3 7.9 (3.9, 11.9)31 - 60 minutes Non-problem gambler 83 73.
3 (63.5, 83.1) 33 70.3 (57.1, 83.5) 37 79.5 (64.1, 95) 23 82.1 (68.3, 95.8)
Low-risk gambler 21 18.2 (9.5, 26.9) 12 25.1 (12.8, 37.4) 7 15.0 (0.1, 29.9) 2 6.2 !
Moderate-risk/problem gambler 10 8.5 (2.2, 14.8) 2 4.6 ! 3 5.5 (0.0, 11.0) 3 11.8 (0.0, 24.6)
159New Zealand National Gambling Study: Wave 4 (2015)Provider No: 467589, Agreement No: 349827/00Auckland University of Technology, Gambling and Addictions Research Centre Final Report Number 6, 29 March 2018

Gambling participation-related variables Gambling risk level
Wave 1 Wave 2 Wave 3 Wave 4n % (95% CI) n % (95% CI) n % (95% CI) n % (95% CI)
> 60 minutes Non-problem gambler 98 60.7 (52.5, 68.9) 43 51.7 (39.5, 63.9) 38 64.0 (50.3, 77.6) 40 63.4 (51.2, 75.6)
Low-risk gambler 28 17.2 (10.9, 23.5) 24 28.8 (17.8, 39.9) 14 23.4 (11.2, 35.6) 13 20.7 (12.9, 28.5)
Moderate-risk/problem gambler 36 22.1 (15.0, 29.1) 16 19.4 (10.5, 28.3) 8 12.6 (4.0, 21.2) 10 15.9 (6.1, 25.6)
Pub EGMS (time gambling in average day)Up to 15 minutes Non-problem gambler 209 82.
8 (75.8, 89.7) 102 86.0 (78.8, 93.3) 78 86.8 (78.5, 95.2) 65 90.4 (82.6, 98.2)
Low-risk gambler 24 9.5 (3.8, 15.1) 15 12.3 (5.2, 19.4) 8 8.5 (1.8, 15.3) 6 7.9 (0.8, 15.1)Moderate-risk/problem gambler 20 7.8 (3.2, 12.4) 2 1.7 ! 4 4.6 (0.0, 9.5) 1 1.7 !
16 - 30 minutes Non-problem gambler 167 79.7 (72.5, 87.0) 65 67.1 (56.0, 78.2) 63 76.9 (67.7, 86.2) 48 68.9 (54.0, 83.7)
Low-risk gambler 24 11.6 (5.5, 17.7) 24 24.3 (13.5, 35.1) 13 15.7 (7.1, 24.2) 17 23.7 (9.9, 37.6)
Moderate-risk/problem gambler 18 8.6 (4.0, 13.3) 8 8.6 (1.8, 15.4) 6 7.4 (2.8, 11.9) 5 7.4 (0.4, 14.4)31 - 60 minutes Non-problem gambler 95 64.
4 (55.6, 73.2) 48 64.2 (49.9, 78.4) 35 65.3 (52.5, 78.1) 37 64.0 (46.5, 81.6)
Low-risk gambler 34 23.0 (14.8, 31.2) 18 23.7 (12.5, 35) 8 15.9 (6.2, 25.6) 16 26.6 (9.4, 43.7)
Moderate-risk/problem gambler 19 12.6 (6.6, 18.6) 9 12.1 (3.9, 20.3) 10 18.8 (9.5, 28.2) 5 9.4 (1.1, 17.7)
> 60 minutes Non-problem gambler 47 45.3 (34.8, 55.8) 9 21.9 (8.8, 35.0) 19 55.2 (37.6, 72.8) 11 40.4 (21.5, 59.3)
Low-risk gambler 20 19.0 (11.3, 26.8) 16 38.8 (22.2, 55.5) 8 22.8 (6.4, 39.2) 7 27.4 (9.1, 45.7)
Moderate-risk/problem gambler 37 35.6 (26.2, 45.0) 16 39.3 (24.5, 54.1) 8 22.0 (9.3, 34.7) 8 32.2 (16, 48.4)
Club EGMS (time gambling in average day)Up to 15 minutes Non-problem gambler 76 86.
8 (79.2, 94.4) 46 78.6 (65.5, 91.7) 42 94.8 (87.3, 100.0) 18 85.3 (63.2, 100.0)
Low-risk gambler 4 4.6 (0.2, 9.0) 9 15.7 (4.3, 27.1) 2 4.9 ! 1 6.4 !Moderate-risk/problem gambler 8 8.6 (2.4, 14.9) 3 5.7 (0.0, 13.1) 0 0.3 ! 2 8.3 !
16 - 30 minutes Non-problem gambler 100 79.8 (70.8, 88.8) 32 75.9 (64.4, 87.3) 29 79.9 (66.8, 93.1) 28 79.0 (61.9, 96.2)
Low-risk gambler 16 12.8 (4.9, 20.8) 6 13.7 (2.9, 24.5) 6 15.4 (2.0, 28.9) 4 11.6 (0.0, 28.3)
Moderate-risk/problem gambler 9 7.4 (2.5, 12.2) 4 10.4 (2.8, 18.1) 2 4.6 ! 3 9.3 (3.3, 15.3)31 - 60 minutes Non-problem gambler 67 75.
7 (65.2, 86.1) 21 59.9 (40.0, 79.8) 21 66.2 (50.7, 81.6) 23 81.0 (65.5, 96.6)
160New Zealand National Gambling Study: Wave 4 (2015)Provider No: 467589, Agreement No: 349827/00Auckland University of Technology, Gambling and Addictions Research Centre Final Report Number 6, 29 March 2018

Gambling participation-related variables Gambling risk level
Wave 1 Wave 2 Wave 3 Wave 4n % (95% CI) n % (95% CI) n % (95% CI) n % (95% CI)
Low-risk gambler 17 18.8 (9.0, 28.5) 6 18.8 (2.1, 35.5) 6 17.1 (7.6, 26.6) 3 11.6 (0.0, 25.9)
Moderate-risk/problem gambler 5 5.6 (0.4, 10.7) 7 21.3 (6.9, 35.6) 5 16.8 (4.0, 29.5) 2 7.4 !> 60 minutes Non-problem gambler 21 48.
2 (33.1, 63.3) 6 30.2 (7.0, 53.3) 7 43.7 (13.9, 73.4) 10 55.3 (27.9, 82.7)
Low-risk gambler 10 22.0 (10.3, 33.7) 13 66.8 (45.5, 88.1) 6 38.2 (17.9, 58.6) 4 20.8 (4.0, 37.7)
Moderate-risk/problem gambler 13 29.8 (13.9, 45.7) 1 3.0 ! 3 18.1 (0.0, 38.6) 4 23.9 (0.8, 47.0)
Who gambled withAlone Non-problem gambler 1684 90.
1 (88.6, 91.6) 954 89.2 (87.2, 91.2) 821 90.2 (88.3, 92.2) 696 90.5 (88.1, 92.8)
Low-risk gambler 128 6.8 (5.5, 8.2) 83 7.8 (6.0, 9.5) 59 6.5 (4.9, 8.1) 46 5.9 (4.0, 7.9)Moderate-risk/problem gambler 57 3.1 (2.3, 3.8) 33 3.1 (2.0, 4.1) 30 3.3 (2.2, 4.4) 25 3.2 (2.0, 4.5)
With one person Non-problem gambler 766 88.6 (85.9, 91.2) 374 86.1 (82.4, 89.8) 343 88.5 (84.3, 92.8) 293 87.3 (82.2, 92.4)
Low-risk gambler 56 6.5 (4.5, 8.4) 43 9.9 (6.7, 13.1) 36 9.2 (5.1, 13.3) 27 7.9 (4.8, 11.1)Moderate-risk/problem gambler 43 4.9 (3.0, 6.9) 18 4.1 (2.0, 6.1) 9 2.2 (0.8, 3.6) 16 4.7 (0.5, 9.0)
With several people/a group Non-problem gambler 858 88.2 (85.7, 90.7) 507 86.5 (83.2, 89.9) 437 90.3 (87.3, 93.3) 331 87.9 (83.7, 92.1)
Low-risk gambler 81 8.3 (6.1, 10.5) 60 10.2 (7.3, 13.2) 36 7.5 (4.7, 10.2) 32 8.6 (4.7, 12.5)Moderate-risk/problem gambler 34 3.5 (2.2, 4.7) 19 3.2 (1.6, 4.9) 11 2.2 (1.0, 3.4) 13 3.5 (1.7, 5.2)
Data weighted for 2013 Census data (all waves) and attrition (Waves 2, 3 and 4)! Meaningful confidence intervals not calculable due to small sample size
161New Zealand National Gambling Study: Wave 4 (2015)Provider No: 467589, Agreement No: 349827/00Auckland University of Technology, Gambling and Addictions Research Centre Final Report Number 6, 29 March 2018

APPENDIX 24:Gambling risk levels by methods used to stop gambling too much and help-seeking behaviour for Waves 1, 2, 3 and 4
Gambling risk level MethodWave 1 Wave 2 Wave 3 Wave 4
n % (95% CI) n % (95% CI) n % (95% CI) n % (95% CI)Methods used to stop gambling too much#
Non-problem gambler Set a money limit 814 18.1 (16.7, 19.5) 404 15.5 (13.7, 17.2) 297 13.7 (11.9, 15.4) 259 13.8 (11.7, 15.9)Trusted person manages the money 19 0.4 (0.2, 0.7) 9 0.4 (0.1, 0.6) 7 0.3 (0.0, 0.8) 5 0.3 (0.0, 0.6)Separate betting money and stopping when used 153 3.4 (2.7, 4.1) 48 1.9 (1.2, 2.5) 34 1.5 (0.9, 2.2) 34 1.8 (1.1, 2.5)
Leave ATM/credit cards at home 33 0.7 (0.5, 1.0) 19 0.7 (0.3, 1.1) 13 0.6 (0.1, 1.1) 14 0.7 (0.3, 1.1)Set a time limit 57 1.3 (0.9, 1.7) 21 0.8 (0.3, 1.3) 18 0.8 (0.3, 1.3) 14 0.8 (0.3, 1.2)Avoid betting/gambling places 76 1.7 (1.3, 2.1) 33 1.3 (0.8, 1.8) 24 1.1 (0.5, 1.7) 21 1.1 (0.6, 1.6)
Low-risk gambler Set a money limit 113 36.8 (30.2, 43.4) 67 32.2 (25.3, 39.1) 59 37.9 (29.4, 46.4) 51 39.6 (28.7, 50.6)Trusted person manages the money 9 2.8 (0.9, 4.6) 3 1.6 (0.1, 3.2) 2 1.5 ! 8 6.6 (0.0, 14.7)Separate betting money and stopping when used 36 11.7 (7.5, 15.8) 25 12.1 (6.9, 17.3) 22 14.4 (8.5, 20.2) 12 9.7 (3.7, 15.8)
Leave ATM/credit cards at home 22 7.1 (3.2, 11.0) 12 5.7 (2.0, 9.4) 8 5.1 (1.8, 8.5) 8 6.1 (0.0, 14.0)Set a time limit 20 6.7 (3.5, 9.8) 17 8.1 (4.1, 12.1) 7 4.7 (1.7, 7.7) 6 4.9 (1.2, 8.6)Avoid betting/gambling places 19 6.2 (3.4, 9.1) 12 6.0 (2.6, 9.4) 3 1.8 (0.3, 3.3) 9 7.0 (1.9, 12.0)
Moderate-risk/problem gambler Set a money limit 65 43.9 (34.8, 53.0) 27 36.1 (24.9, 47.3) 23 41.4 (30.3, 52.6) 24 41.5 (27.2, 55.7)
Trusted person manages the money 6 3.8 (1.4, 6.3) 4 5.1 (0.4, 9.9) 4 6.6 (0.0, 13.2) 3 5.3 (0.0, 11.1)Separate betting money and stopping when used 26 17.4 (10.7, 24.1) 10 13.1 (5.9, 20.3) 9 15.9 (6.5, 25.3) 10 17.4 (0.0, 38.1)
Leave ATM/credit cards at home 17 11.7 (6.3, 17.0) 11 14.3 (7.0, 21.5) 6 10.2 (2.3, 18.0) 4 7.6 (1.0, 14.2)Set a time limit 16 10.6 (4.4, 16.8) 8 10.6 (3.6, 17.6) 4 6.4 (0.5, 12.3) 3 5.2 (0.0, 11.3)Avoid betting/gambling places 21 14.1 (8.3, 19.9) 12 15.6 (6.9, 24.4) 7 12.6 (4.2, 21.0) 3 6.1 (1.4, 10.8)
Sought help from gambling treatment services in past year
Non-problem gambler No 4535
100.0 - 2633
100.0 - 2186 100.0 (99.9, 100.0)
1890 100.0 -
Yes 0 - 0 - 1 0.0 ! 0 -Low-risk gambler No 307 100.0 - 210 100.0 - 155 100.0 - 127 100.0 -
Yes 0 - 0 - 0 - 0 -Moderate-risk/problem gambler No 144 97.4 (94.5, 100.0) 72 95.8 (91.2,
100.0)53 96.6 (93.1,
100.0)56 98.4 (95.6, 100.0)
162New Zealand National Gambling Study: Wave 4 (2015)Provider No: 467589, Agreement No: 349827/00Auckland University of Technology, Gambling and Addictions Research Centre Final Report Number 6, 29 March 2018

Gambling risk level MethodWave 1 Wave 2 Wave 3 Wave 4
n % (95% CI) n % (95% CI) n % (95% CI) n % (95% CI)Yes 4 2.6 (0.0, 5.5) 3 4.2 (0.0, 8.8) 2 3.4 ! <1 1.6 (0.0, 4.4)
Data weighted for 2013 Census data (all waves) and attrition (Waves 2, 3 and 4) / # Calculated for participants who gambled in the last year ! Meaningful confidence intervals not calculable due to small sample size
163New Zealand National Gambling Study: Wave 4 (2015)Provider No: 467589, Agreement No: 349827/00Auckland University of Technology, Gambling and Addictions Research Centre Final Report Number 6, 29 March 2018

APPENDIX 25:Gambling risk levels by major life events experienced and psychological distress for Waves 1, 2, 3 and 4
Gambling risk level VariableWave 1 Wave 2 Wave 3 Wave 4
n % (95% CI) n % (95% CI) n % (95% CI) n % (95% CI)Number of major life eventsNon-problem gambler 0 1227 27.1 (25.6, 28.6) 769 29.2 (27.2, 31.2) 665 30.4 (28.1, 32.7) 594 31.4 (28.8, 34.1)
1 1201 26.5 (25.0, 28.0) 810 30.8 (28.6, 32.9) 621 28.4 (26.1, 30.6) 561 29.7 (27.2, 32.1)2 840 18.5 (17.2, 19.9) 498 18.9 (17.1, 20.7) 418 19.1 (17.0, 21.2) 366 19.4 (17.2, 21.6)3 533 11.8 (10.6, 12.9) 292 11.1 (9.6, 12.6) 286 13.1 (11.3, 14.8) 206 10.9 (9.2, 12.6)4 328 7.2 (6.4, 8.1) 140 5.3 (4.3, 6.3) 88 4.0 (3.1, 5.0) 95 5.0 (3.8, 6.3)5+ 403 8.9 (7.9, 9.9) 125 4.7 (3.8, 5.7) 109 5.0 (3.7, 6.3) 67 3.5 (2.5, 4.5)
Low-risk gambler 0 65 21.3 (16.0, 26.6) 30 14.4 (9.4, 19.5) 26 16.7 (10.7, 22.7) 31 24.6 (16.0, 33.3)1 61 20.0 (14.7, 25.3) 42 20.1 (14.3, 25.9) 42 27.2 (18.2, 36.3) 24 19.1 (10.2, 28.0)2 57 18.5 (13.0, 24.0) 52 24.9 (18.0, 31.7) 38 24.7 (17.3, 32.1) 20 15.4 (8.4, 22.5)3 38 12.3 (8.1, 16.5) 38 17.9 (12.0, 23.8) 27 17.2 (10.6, 23.7) 21 16.4 (9.5, 23.4)4 51 16.4 (10.4, 22.9) 20 9.4 (5.1, 13.7) 15 9.4 (3.8, 15.0) 11 8.7 (2.6, 17.8)5+ 35 11.2 (7.2, 15.2) 28 13.3 (7.2, 19.4) 7 4.8 (1.7, 8.0) 20 15.7 (7.0, 24.3)
Moderate-risk/problem gambler 0 26 17.5 (11.0, 24.0) 16 21.8 (12.2, 31.4) 12 22.3 (11.4, 33.1) 15 25.8 (6.0, 45.6)1 31 21.0 (13.7, 28.4) 21 28.4 (16.8, 40.0) 15 26.8 (15.6, 37.9) 16 28.5 (14.9, 42.2)2 29 19.4 (12.4, 26.4) 11 14.6 (7.0, 22.2) 10 18.1 (9.0, 27.1) 8 13.8 (4.9, 22.8)3 26 17.7 (9.9, 25.5) 15 19.5 (9.2, 30.0) 10 17.4 (10.0, 24.9) 10 17.4 (7.6, 27.2)4 15 10.4 (4.8, 15.9) 5 7.2 (1.5, 12.8) 2 4.1 ! 4 6.2 (0.6, 11.7)5+ 21 14.0 (8.6, 19.5) 6 8.5 (1.6, 15.5) 6 11.4 (4.1, 18.7) 5 8.3 (1.4, 15.2)
Psychological distress score (Kessler-10)Non-problem gambler Low (Score 0 - 5) 3458 76.3 (74.8, 77.8) 2059 78.2 (76.2, 80.1) 1665 76.1 (73.8, 78.5) 147
978.2 (75.7, 80.7)
Moderate (Score 6 - 11) 804 17.7 (16.4, 19.1) 441 16.8 (15.0, 18.5) 396 18.1 (15.9, 20.3) 311 16.4 (14.1, 18.8)High (Score 12 - 19) 207 4.6 (3.9, 5.3) 113 4.3 (3.3, 5.2) 106 4.9 (3.8, 5.9) 86 4.5 (3.5, 5.6)Severe (Score 20 - 40) 64 1.4 (1.0, 1.8) 21 0.8 (0.5, 1.1) 20 0.9 (0.4, 1.4) 15 0.8 (0.4, 1.2)
Low-risk gambler Low (Score 0 - 5) 178 57.9 (51.0, 64.9) 116 55.3 (47.5, 63.0) 99 64.0 (54.8, 73.2) 74 57.7 (46.8, 68.6)Moderate (Score 6 - 11) 91 29.7 (23.2, 36.2) 56 26.6 (19.6, 33.6) 43 27.9 (19.0, 36.9) 33 25.7 (15.9, 35.6)High (Score 12 - 19) 30 9.7 (5.7, 13.7) 30 14.1 (8.7, 19.6) 11 7.2 (3.5, 10.9) 15 12.1 (5.9, 18.4)Severe (Score 20 - 40) 8 2.7 (0.8, 4.5) 9 4.1 (0.5, 7.6) 1 0.8 ! 6 4.4 (0.0, 11.4)
164New Zealand National Gambling Study: Wave 4 (2015)Provider No: 467589, Agreement No: 349827/00Auckland University of Technology, Gambling and Addictions Research Centre Final Report Number 6, 29 March 2018

Gambling risk level VariableWave 1 Wave 2 Wave 3 Wave 4
n % (95% CI) n % (95% CI) n % (95% CI) n % (95% CI)Moderate-risk/problem gambler Low (Score 0 - 5) 56 38.0 (29.0, 47.0) 39 51.9 (40.1, 63.7) 29 53.2 (41.2, 65.2) 23 40.5 (25.3, 55.8)
Moderate (Score 6 - 11) 49 33.1 (24.8, 41.5) 17 23.2 (12.4, 34.0) 14 25.8 (16.2, 35.5) 18 32.0 (12.1, 51.8)High (Score 12 - 19) 26 17.9 (11.5, 24.3) 14 18.4 (9.6, 27.2) 8 14.5 (6.4, 22.6) 10 17.2 (6.6, 27.9)Severe (Score 20 - 40) 16 11.0 (6.5, 15.5) 5 6.5 (2.8, 10.3) 4 6.4 (1.0, 11.9) 6 10.3 (3.9, 16.7)
Data weighted for 2013 Census data (all waves) and attrition (Waves 2, 3 and 4)! Meaningful confidence intervals not calculable due to small sample size
165New Zealand National Gambling Study: Wave 4 (2015)Provider No: 467589, Agreement No: 349827/00Auckland University of Technology, Gambling and Addictions Research Centre Final Report Number 6, 29 March 2018

APPENDIX 26:Transitions between gambling risk levels between the waves
Transition from
Transition toNon-gambler Non-problem gambler Low-risk gambler Moderate-risk gambler Problem gambler
n % (95% CI) n % (95% CI) n % (95% CI) n % (95% CI) n % (95% CI)Wave 1 to Wave 2Non-gambler 485 64.7 (60.6, 68.9) 247 33.0 (29.0, 37.0) 16 2.1 (0.9, 3.3) 1 0.1 ! 0 0.1 !Non-problem gambler 327 11.9 (10.4, 13.3) 2267 82.5 (80.8, 84.1) 133 4.8 (3.9, 5.7) 19 0.7 (0.4, 1.0) 3 0.1 (0.0, 0.3)Low-risk gambler 13 7.2 (2.6, 11.9) 97 54.6 (44.9, 64.3) 46 25.7 (17.9, 33.5) 21 11.7 (6.2, 17.2) 1 0.8 !Moderate-risk gambler 4 6.9 (0.0, 15.9) 16 30.7 (16.3, 45.1) 13 25.3 (10.1, 40.4) 15 27.5 (15.3, 39.6) 5 9.6 (2.0, 17.3)Problem gambler - 5 32.6 (10.5, 54.6) 2 13.6 ! 2 9.7 ! 7 44.1 (23.2, 65.0)
Wave 2 to Wave 3Non-gambler 439 64.1 (59.6, 68.7) 231 33.8 (29.2, 38.3) 13 1.8 (0.7, 2.9) 2 0.2 ! 0 0.0 !Non-problem gambler 275 12.5 (10.5, 14.5) 1828 83.0 (80.9, 85.2) 82 3.7 (2.8, 4.7) 17 0.8 (0.4, 1.1) -Low-risk gambler 4 2.4 (0.0, 4.7) 109 61.7 (53.3, 70.1) 49 27.8 (19.9, 35.7) 14 7.7 (3.7, 11.6) 1 0.5 !Moderate-risk gambler 2 4.1 ! 15 33.7 (18.7, 48.7) 11 24.5 (12.9, 36.0) 12 27.8 (15.7, 40.0) 4 9.9 (2.0, 17.7)Problem gambler 6 44.1 (16.1, 72.1) 3 19.4 (12.1, 26.7) 0 2.6 ! 1 6.5 ! 4 27.4 (5.4, 49.3)
Wave 3 to Wave 4Non-gambler 453 70.9 (65.9, 75.9) 180 28.2 (23.2, 33.2) 5 0.7 (0.1, 1.4) 1 0.2 ! -Non-problem gambler 232 11.9 (10.1, 13.8) 1609 82.8 (80.7, 85.0) 85 4.4 (3.2, 5.6) 16 0.8 (0.4, 1.3) 1 0.0 !Low-risk gambler 9 6.4 (1.9, 10.9) 83 61.1 (50.8, 71.5) 29 21.7 (13.7, 29.7) 15 10.8 (1.0, 20.5) -Moderate-risk gambler 2 3.5 ! 17 38.6 (24.1, 53.2) 7 15.4 (6.1, 24.6) 17 37.6 (25, 50.2) 2 5.0 !Problem gambler 0 1.8 ! 1 7.5 ! 1 13.1 ! 3 33.8 (2.9, 64.7) 4 43.9 (16.0, 71.7)
Data weighted for 2013 Census data and attritionTotal percentages do not always add up to 100% due to rounding! Meaningful confidence intervals not calculable due to small sample size
166New Zealand National Gambling Study: Wave 4 (2015)Provider No: 467589, Agreement No: 349827/00Auckland University of Technology, Gambling and Addictions Research Centre Final Report Number 6, 29 March 2018

APPENDIX 27:Transitions between gambling risk levels between the waves by Māori and Pacific ethnicity
Transition from
Transition to
Non-gambler Non-problem gambler Low-risk gamblerModerate-risk/problem
gamblern % (95% CI) n % (95% CI) n % (95% CI) n % (95% CI)
MāoriWave 1 to Wave 2Non-gambler 28 47.0 (33.2, 60.7) 29 48.6 (34.8, 62.4) 2 3.9 ! 0 0.5 !Non-problem gambler 35 12.5 (8.9, 16.0) 210 75.6 (71.0, 80.2) 27 9.7 (6.5, 12.9) 6 2.2 (0.6, 3.9)Low-risk gambler 1 3.0 ! 14 45.2 (27.9, 62.5) 11 37.7 (20.5, 54.9) 4 14.0 (0.0, 28.1)Moderate-risk/problem gambler 0 - 2 10.5 ! 6 27.1 (8.2, 46.1) 13 62.4 (43.7, 81.0)
Wave 2 to Wave 3Non-gambler 32 55.1 (40.4, 69.8) 23 40.2 (25.8, 54.6) 2 4.2 ! 0 0.6 !Non-problem gambler 37 17.3 (8.8, 25.9) 162 75.5 (66.5, 84.4) 12 5.6 (0.6, 10.5) 3 1.6 (0.3, 2.9)Low-risk gambler 0 - 14 41.0 (24.5, 57.5) 14 39.8 (22.1, 57.5) 7 19.2 (7.3, 31.1)Moderate-risk/problem gambler 0 1.9 ! 6 32.4 (13.0, 51.9) 3 14.4 (0.0, 33.6) 10 51.3 (27.9, 74.7)
Wave 3 to Wave 4Non-gambler 39 61.7 (42.3, 81.0) 23 36.0 (17.4, 54.7) 1 1.0 ! 1 1.3 !Non-problem gambler 19 10.3 (6.5, 14.0) 147 81.2 (76.1, 86.2) 10 5.5 (2.7, 8.3) 6 3.1 (0.2, 5.9)Low-risk gambler 2 5.6 ! 16 54.1 (22.6, 85.7) 5 16.8 (4.4, 29.2) 7 23.5 (0.0, 61.3)Moderate-risk/problem gambler 0 0.8 ! 3 18.3 (3.2, 33.3) 3 17.2 (4.2, 30.1) 12 63.8 (45.6, 82.0)
PacificWave 1 to Wave 2Non-gambler 33 70.6 (60.5, 80.7) 12 25.2 (15.2, 35.2) 1 2.2 ! 1 2.0 !Non-problem gambler 19 17.1 (12.1, 22.2) 77 69.0 (62.9, 75.2) 11 9.9 (6.0, 13.9) 4 3.9 (1.7, 6.1)Low-risk gambler 1 5.1 ! 8 52.2 (34.3, 70.1) 4 22.3 (6.0, 38.6) 3 20.4 (6.3, 34.5)Moderate-risk/problem gambler 0 - 5 50.6 (28.0, 73.2) 1 9.5 ! 4 39.9 (19.1, 60.8)
167New Zealand National Gambling Study: Wave 4 (2015)Provider No: 467589, Agreement No: 349827/00Auckland University of Technology, Gambling and Addictions Research Centre Final Report Number 6, 29 March 2018

Transition from
Transition to
Non-gambler Non-problem gambler Low-risk gamblerModerate-risk/problem
gamblern % (95% CI) n % (95% CI) n % (95% CI) n % (95% CI)
Wave 2 to Wave 3Non-gambler 28 65.5 (54.2, 76.8) 14 31.5 (20.4, 42.5) 1 3.1 ! 0 -Non-problem gambler 12 15.3 (9.2, 21.4) 56 68.9 (61.4, 76.5) 8 9.9 (5.4, 14.3) 5 5.9 (2.5, 9.4)Low-risk gambler 1 3.8 ! 9 65.7 (44.8, 86.5) 3 23.4 (3.5, 43.3) 1 7.1 !Moderate-risk/problem gambler 1 11.4 ! 2 15.1 ! 3 22.9 (7.9, 38.0) 6 50.5 (27.7, 73.3)
Wave 3 to Wave 4Non-gambler 26 76.4 (69.0, 83.7) 7 21.8 (14.9, 28.6) 0 0.6 ! 0 1.3 !Non-problem gambler 13 17.7 (11.5, 23.8) 53 72.4 (65.1, 79.7) 6 8.3 (3.5, 13.0) 1 1.6 !Low-risk gambler 1 9.0 ! 7 55.0 (37.9, 72.1) 2 17.9 ! 2 18.1 !Moderate-risk/problem gambler 0 - 2 18.6 ! 3 26.8 (7.0, 46.6) 6 54.5 (33.2, 75.9)
Data weighted for 2013 Census data and attritionTotal percentages do not always add up to 100% due to rounding! Meaningful confidence intervals not calculable due to small sample size
168New Zealand National Gambling Study: Wave 4 (2015)Provider No: 467589, Agreement No: 349827/00Auckland University of Technology, Gambling and Addictions Research Centre Final Report Number 6, 29 March 2018

169New Zealand National Gambling Study: Wave 4 (2015)Provider No: 467589, Agreement No: 349827/00Auckland University of Technology, Gambling and Addictions Research Centre Final Report Number 6, 29 March 2018

APPENDIX 28:Statistically significant bivariate associations with the chance of being a past year
gambler vs. not gambling across Waves 1 to 4
Wave 1 variable Odds ratio (95% CI) p-valueTime
Wave 1 1.00Wave 2 0.77 (0.65, 0.92)Wave 3 0.68 (0.57, 0.82)Wave 4 0.49 (0.41, 0.59) <0.0001
GenderFemale 1.00Male 1.53 (1.14, 2.04) 0.004
Age group (years)18 - 39 1.0040 - 64 2.40 (1.75, 3.28)65+ 1.18 (0.80, 1.76) <0.0001
Ethnic group (prioritised)Māori 1.23 (0.88, 1.73)Pacific 0.36 (0.24, 0.55)Asian 0.08 (0.05, 0.12)European/Other 1.00 <0.0001
ReligionNo religion 1.00Religion 0.46 (0.34, 0.62) <0.0001
Country of birthNew Zealand 1.00Other 0.20 (0.15, 0.27) <0.0001
Arrival in New ZealandNew Zealand born 1.00Before 2008 0.28 (0.21, 0.37)After 2008 0.03 (0.01, 0.06) <0.0001
Highest qualificationNo formal qualification 1.00Secondary school qualification 0.78 (0.50, 1.21)Vocational or trade qualification 1.73 (1.11, 2.70)University degree or higher 0.70 (0.46, 1.05) <0.0001
Labour force statusEmployed 1.00Unemployed 0.64 (0.46, 0.90)Student/homemaker/retired 0.51 (0.40, 0.64) <0.0001
Annual personal income≤$20,000 1.00$20,001 - $40,000 1.44 (1.14, 1.81)$40,001 - $60,000 2.13 (1.59, 2.86)>$60,000 2.53 (1.84, 3.46) <0.0001
Annual household income≤$40,000 1.00$40,001 - $60,000 1.12 (0.84, 1.50)$60,001 - $80,000 1.18 (0.87, 1.61)$80,001 - $100,000 1.94 (1.39, 2.70)>$100,000 1.79 (1.33, 2.42) 0.0002
Household size1 - 2 1.003 - 4 0.95 (0.69, 1.31)5+ 0.58 (0.38, 0.88) 0.04
Number of major life events0 1.001 1.02 (0.84, 1.24)2 1.06 (0.85, 1.33)3 1.59 (1.22, 2.08)4+ 1.41 (1.07, 1.86) 0.002
170New Zealand National Gambling Study: Wave 4 (2015)Provider No: 467589, Agreement No: 349827/00Auckland University of Technology, Gambling and Addictions Research Centre Final Report Number 6, 29 March 2018

Wave 1 variable Odds ratio (95% CI) p-valuePsychological distress (Kessler-10)
Low (Score 0 - 5) 1.00Moderate (Score 6 - 11) 0.70 (0.50, 0.99)High (Score 12 - 19) 0.31 (0.18, 0.55)Severe (Score 20 - 40) 0.86 (0.70, 1.06) 0.0006
Hazardous alcohol consumption (AUDIT-C)No 1.00Yes 2.39 (1.98, 2.89) <0.0001
Uses drugsYes 1.00No 0.52 (0.38, 0.71) <0.0001
CannabisNo 1.00Yes 1.77 (1.24, 2.52) 0.002
Ever smoked more than 100 cigarettes in lifetimeNo 1.00Yes 2.16 (1.73, 2.70) <0.0001
Ever smoked daily for a period of timeNo 1.00Yes 2.07 (1.64, 2.60) <0.0001
Data weighted for 2013 Census data (all Waves) and attrition (Waves 2, 3 and 4)
171New Zealand National Gambling Study: Wave 4 (2015)Provider No: 467589, Agreement No: 349827/00Auckland University of Technology, Gambling and Addictions Research Centre Final Report Number 6, 29 March 2018

APPENDIX 29:Statistically significant bivariate associations with the chance of being a past year low-
risk/moderate-risk/problem gambler vs. being a non-problem/non-gambler across Waves 1 to 4
Wave 1 variable Odds ratio (95% CI) p-valueAge group (years)
18 - 39 1.0040 - 64 0.50 (0.33, 0.76)65+ 0.27 (0.15, 0.50) <0.0001
Ethnic group (prioritised)Māori 6.60 (4.19, 10.39)Pacific 13.78 (7.90, 24.03)Asian 3.78 (2.09, 6.85)European/Other 1.00 <0.0001
Country of birthNew Zealand 1.00Other 1.54 (1.01, 2.34) 0.04
Highest qualificationNo formal qualification 1.00Secondary school qualification 0.66 (0.37, 1.16)Vocational or trade qualification 0.54 (0.31, 0.96)University degree or higher 0.32 (0.19, 0.56) 0.0006
Labour force statusEmployed 1.00Unemployed 2.76 (1.79, 4.26)Student/homemaker/retired 1.01 (0.70, 1.46) <0.0001
Annual personal income≤$20,000 1.00$20,001 - $40,000 0.59 (0.41, 0.83)$40,001 - $60,000 0.80 (0.53, 1.19)>$60,000 0.41 (0.26, 0.64) 0.0001
Annual household income≤$40,000 1.00$40,001 - $60,000 0.39 (0.25, 0.60)$60,001 - $80,000 0.55 (0.36, 0.86)$80,001 - $100,000 0.45 (0.28, 0.72)>$100,000 0.35 (0.23, 0.53) <0.0001
Household size1 - 2 1.003 - 4 1.17 (0.76, 1.81)5+ 2.48 (1.46, 4.21) 0.003
New Zealand Individual deprivation Index0 1.001 1.77 (1.29, 2.42)2 4.14 (2.80, 6.12)3 4.66 (2.79, 7.81)4+ 9.21 (5.66, 15.00) <0.0001
Number of major life events0 1.001 1.05 (0.74, 1.50)2 1.31 (0.90, 1.90)3 1.92 (1.28, 2.89)4+ 2.75 (1.85, 4.08) <0.0001
Quality of life (WHOQoL-8)Below median (Score 0 - 24) 1.00Median score (Score 25) 0.65 (0.49, 0.88)Above median (Score 26 - 32) 0.98 (0.65, 1.47) 0.01
Psychological distress (Kessler-10)Low (Score 0 - 5) 1.00Moderate (Score 6 - 11) 5.31 (3.42, 8.26)High (Score 12 - 19) 14.89 (7.05, 31.44)Severe (Score 20 - 40) 2.24 (1.66, 3.02) <0.0001
172New Zealand National Gambling Study: Wave 4 (2015)Provider No: 467589, Agreement No: 349827/00Auckland University of Technology, Gambling and Addictions Research Centre Final Report Number 6, 29 March 2018

Wave 1 variable Odds ratio (95% CI) p-valueHazardous alcohol consumption (AUDIT-C)
No 1.00Yes 1.76 (1.30, 2.39) 0.0003
Uses drugsYes 1.00No 0.36 (0.24, 0.53) <0.0001
CannabisNo 1.00Yes 3.41 (2.23, 5.20) <0.0001
Ever smoked more than 100 cigarettes in lifetimeNo 1.00Yes 1.95 (1.39, 2.75) 0.0001
Ever smoked daily for a period of timeNo 1.00Yes 1.83 (1.29, 2.59) 0.0007
Current tobacco useNon-smoker 1.00Smoker 3.51 (2.43, 5.06) <0.0001
Number of gambling activities participated in at Wave 11 - 3 1.004 - 6 3.68 (2.78, 4.88)7 - 10 19.28 (11.01, 33.78) <0.0001
Pattern of participationInfrequent gambler 1.00Regular non-continuous gambler 2.09 (1.50, 2.92)Regular continuous gambler 11.29 (7.38, 17.28) <0.0001
Gambling frequencyAt least weekly 1.00At least monthly 0.40 (0.29, 0.55)At least once in past year 0.15 (0.11, 0.22) <0.0001
Typical monthly gambling expenditure≤$20 1.00$21 - $50 1.89 (1.33, 2.69)>$50 8.24 (5.85, 11.60) <0.0001
Cards games - annualNo 1.00Yes 5.25 (3.10, 8.89) <0.0001
Bets with friends/workmates - annualNo 1.00Yes 1.63 (1.19, 2.23) 0.002
Text game or competition - annualNo 1.00Yes 2.96 (1.58, 5.53) 0.0007
Raffle/lottery (NZ/overseas) - annualNo 1.00Yes 1.33 (1.02, 1.73) 0.03
Lotto - annualNo 1.00Yes 2.08 (1.41, 3.08) 0.0002
Keno - annualNo 1.00Yes 3.62 (1.98, 6.6) <0.0001
Instant Kiwi/other scratch tickets - annualNo 1.00Yes 2.28 (1.73, 3.00) <0.0001
Housie or bingo - annualNo 1.00Yes 4.60 (2.13, 9.94) 0.0001
Horse/dog race betting - annualNo 1.00Yes 2.02 (1.41, 2.88) 0.0001
Sports betting - annualNo 1.00Yes 3.55 (2.10, 5.98) <0.0001
173New Zealand National Gambling Study: Wave 4 (2015)Provider No: 467589, Agreement No: 349827/00Auckland University of Technology, Gambling and Addictions Research Centre Final Report Number 6, 29 March 2018

Wave 1 variable Odds ratio (95% CI) p-valueCasino table games or EGMs (overseas) - annual
No 1.00Yes 2.32 (1.33, 4.04) 0.003
Casino table games or EGMs (NZ) - annualNo 1.00Yes 5.58 (3.93, 7.92) <0.0001
Casino table games (NZ) - annualNo 1.00Yes 3.91 (2.29, 6.68) <0.0001
Casino EGMs (NZ) - annualNo 1.00Yes 5.42 (3.76, 7.82) <0.0001
Pub EGMs - annualNo 1.00Yes 9.47 (6.59, 13.59) <0.0001
Club EGMs - annualNo 1.00Yes 2.93 (1.85, 4.65) <0.0001
EGMs overall - annualNo 1.00Yes 9.46 (6.95, 12.88) <0.0001
Internet gambling overall - annualNo 1.00Yes 6.34 (1.84, 21.76) 0.003
NZ internet gambling - annualNo 1.00Yes 1.86 (1.25, 2.76) 0.002
Overseas internet gambling - annualNo 1.00Yes 6.78 (3.05, 15.06) <0.0001
Overseas offshore gambling - annualNo 1.00Yes 1.99 (1.33, 3.00) 0.0009
Overseas internet/offshore gambling overall - annualNo 1.00Yes 6.78 (3.05, 15.06) <0.0001
Card games - monthlyNo 1.00Yes 24.34 (8.33, 71.06) <0.0001
Bets with friends/workmates - monthlyNo 1.00Yes 3.67 (1.85, 7.27) 0.0002
Raffle/lottery (NZ/overseas) - monthlyNo 1.00Yes 1.47 (1.04, 2.06) 0.03
Lotto - monthlyNo 1.00Yes 2.01 (1.50, 2.69) <0.0001
Keno - monthlyNo 1.00Yes 3.69 (1.49, 9.15) 0.005
Instant Kiwi/other scratch tickets - monthlyNo 1.00Yes 3.35 (2.40, 4.69) <0.0001
Housie or bingo - monthlyNo 1.00Yes 21.78 (6.06, 78.24) <0.0001
Horse/dog race betting - monthlyNo 1.00Yes 4.40 (2.28, 8.50) <0.0001
Sports betting - monthlyNo 1.00Yes 16.60 (5.58, 49.39) <0.0001
174New Zealand National Gambling Study: Wave 4 (2015)Provider No: 467589, Agreement No: 349827/00Auckland University of Technology, Gambling and Addictions Research Centre Final Report Number 6, 29 March 2018

Wave 1 variable Odds ratio (95% CI) p-valueCasino EGMs (NZ) - monthly
No 1.00Yes 4.91 (1.57, 15.37) 0.006
Pub EGMs - monthlyNo 1.00Yes 36.36 (18.83, 70.24) <0.0001
Club EGMs - monthlyNo 1.00Yes 7.32 (3.27, 16.40) <0.0001
EGMs overall - monthlyNo 1.00Yes 20.07 (11.77, 34.24) <0.0001
Short-term speculative investments - monthlyNo 1.00Yes 15.80 (2.49, 100.32) 0.003
Internet gambling overall - monthlyNo 1.00Yes 5.73 (1.11, 29.66) 0.04
NZ internet gambling - monthlyNo 1.00Yes 2.40 (1.47, 3.92) 0.0004
Overseas internet gambling - monthlyNo 1.00Yes 11.05 (3.33, 36.68) <0.0001
Overseas offshore gambling - monthlyNo 1.00Yes 13.76 (4.31, 43.95) <0.0001
Overseas internet/offshore gambling overall - monthlyNo 1.00Yes 11.05 (3.33, 36.68) <0.0001
Gambling-type games not for money - monthlyNo 1.00Yes 2.70 (1.99, 3.67) <0.0001
Time spent playing EGMs in an average day (casino)No time 1.00Up to 15 minutes 2.37 (1.04, 5.42)16 to 30 minutes 3.99 (2.15, 7.41)31 to 60 minutes 3.77 (1.95, 7.27)>60 minutes 14.81 (8.30, 26.41) <0.0001
Time spent playing EGMs in an average day (pub)No time 1.00Up to 15 minutes 3.72 (2.17, 6.35)16 to 30 minutes 8.22 (4.88, 13.83)31 to 60 minutes 15.72 (8.70, 28.39)>60 minutes 71.80 (32.81, 157.09) <0.0001
Time spent playing EGMs in an average day (club)No time 1.00Up to 15 minutes 2.96 (1.31, 6.67)16 to 30 minutes 1.51 (0.76, 3.01)31 to 60 minutes 2.59 (1.22, 5.52)>60 minutes 17.74 (6.67, 47.21) <0.0001
Who spent time with on most enjoyed activityAlone 1.00With one person 1.57 (1.10, 2.25)With several people/a group 1.69 (1.19, 2.40) 0.004
Methods - Setting a dollar limit before leaving homeNo 1.00Yes 3.14 (2.39, 4.11) <0.0001
Methods - Getting someone you trust to manage the moneyNo 1.00Yes 29.99 (9.15, 98.30) <0.0001
Methods - Separating money for betting from other money and stoppingNo 1.00Yes 9.22 (5.70, 14.91) <0.0001
175New Zealand National Gambling Study: Wave 4 (2015)Provider No: 467589, Agreement No: 349827/00Auckland University of Technology, Gambling and Addictions Research Centre Final Report Number 6, 29 March 2018

Wave 1 variable Odds ratio (95% CI) p-valueMethods - Leaving ATM and credit cards at home
No 1.00Yes 14.78 (6.90, 31.66) <0.0001
Methods - Setting a time limitNo 1.00Yes 20.68 (10.10, 42.38) <0.0001
Methods - Avoiding places that have betting or gamblingNo 1.00Yes 8.30 (4.57, 15.09) <0.0001
Data weighted for 2013 Census data (all Waves) and attrition (Waves 2, 3 and 4)
176New Zealand National Gambling Study: Wave 4 (2015)Provider No: 467589, Agreement No: 349827/00Auckland University of Technology, Gambling and Addictions Research Centre Final Report Number 6, 29 March 2018

APPENDIX 30:Statistically significant bivariate associations with the chance of being a past year
moderate-risk/problem gambler vs. being a low-risk/non-problem/non-gambler across Waves 1 to 4
Wave 1 variable Odds ratio (95% CI) p-valueAge group (years)
18 - 39 1.0040 - 64 0.48 (0.23, 1.01)65+ 0.19 (0.05, 0.76) 0.02
Ethnic group (prioritised)Māori 9.63 (4.28, 21.68)Pacific 17.43 (6.98, 43.54)Asian 3.96 (1.23, 12.72)European/Other 1.00 <0.0001
Labour force statusEmployed 1.00Unemployed 2.71 (1.21, 6.07)Student/homemaker/retired 1.03 (0.52, 2.02) 0.04
New Zealand Individual deprivation Index0 1.001 3.50 (1.92, 6.39)2 2.01 (0.86, 4.71)3 4.38 (1.75, 10.95)4+ 12.91 (5.73, 29.12) <0.0001
Quality of life (WHOQoL-8)Below median (Score 0 - 24) 1.00Median score (Score 25) 0.33 (0.14, 0.80)Above median (Score 26 - 32) 0.18 (0.09, 0.33)
Psychological distress (Kessler-10) <0.0001Low (Score 0 - 5) 1.00Moderate (Score 6 - 11) 2.79 (1.58, 4.90)High (Score 12 - 19) 7.36 (3.54, 15.31)Severe (Score 20 - 40) 39.45 (15.13, 102.82) <0.0001
Uses drugsYes 1.00No 0.47 (0.23, 0.96) 0.04
CannabisNo 1.00Yes 2.27 (1.07, 4.83) 0.03
Ever smoked more than 100 cigarettes in lifetimeNo 1.00Yes 2.10 (1.08, 4.08) 0.03
Current tobacco useNon-smoker 1.00Smoker 2.67 (1.38, 5.16) 0.004
Number of gambling activities participated in at Wave 11 - 3 1.004 - 6 4.01 (2.34, 6.87)7 - 10 18.60 (8.58, 40.30) <0.0001
Pattern of participationInfrequent gambler 1.00Regular non-continuous gambler 1.37 (0.69, 2.72)Regular continuous gambler 11.02 (5.95, 20.41) <0.0001
Gambling frequencyAt least weekly 1.00At least monthly 0.38 (0.21, 0.67)At least once in past year 0.10 (0.05, 0.22) <0.0001
Typical monthly gambling expenditure≤$20 1.00$21 - $50 2.01 (0.81, 5.47)>$50 14.95 (6.44, 34.74) <0.0001
177New Zealand National Gambling Study: Wave 4 (2015)Provider No: 467589, Agreement No: 349827/00Auckland University of Technology, Gambling and Addictions Research Centre Final Report Number 6, 29 March 2018

Wave 1 variable Odds ratio (95% CI) p-valueCards games - annual
No 1.00Yes 3.62 (1.57, 8.39) 0.003
Bets with friends/workmates - annualNo 1.00Yes 1.92 (1.08, 3.41) 0.03
Raffle/lottery (NZ/overseas) - annualNo 1.00Yes 1.79 (1.05, 3.06) 0.03
Lotto - annualNo 1.00Yes 2.37 (1.09, 5.18) 0.03
Keno - annualNo 1.00Yes 4.06 (1.58, 10.40) 0.004
Instant Kiwi/other scratch tickets - annualNo 1.00Yes 2.69 (1.61, 4.50) 0.0002
Housie or bingo - annualNo 1.00Yes 8.87 (3.26, 24.14) <0.0001
Horse/dog race betting - annualNo 1.00Yes 1.94 (1.03, 3.65) 0.04
Sports betting - annualNo 1.00Yes 5.11 (2.31, 11.34) <0.0001
Casino table games or EGMs (NZ) - annualNo 1.00Yes 4.77 (2.66, 8.53) <0.0001
Casino table games (NZ) - annualNo 1.00Yes 4.17 (1.67, 10.42) 0.002
Casino EGMs (NZ) - annualNo 1.00Yes 5.57 (3.10, 9.99) <0.0001
Pub EGMs - annualNo 1.00Yes 12.16 (6.79, 21.79) <0.0001
Club EGMs - annualNo 1.00Yes 2.22 (1.05, 4.70) 0.04
EGMs overall - annualNo 1.00Yes 12.14 (6.74, 21.88) <0.0001
Internet gambling overall - annualNo 1.00Yes 8.82 (1.93, 40.40) 0.005
Overseas internet gambling - annualNo 1.00Yes 6.93 (2.31, 20.81) 0.0006
Overseas offshore gambling - annualNo 1.00Yes 2.18 (1.10, 4.29) 0.02
Overseas internet/offshore gambling overall - annualNo 1.00Yes 6.93 (2.31, 20.81) 0.0006
Card games - monthlyNo 1.00Yes 9.88 (3.29, 29.68) <0.0001
Bets with friends/workmates - monthlyNo 1.00Yes 4.83 (1.73, 13.53) 0.003
178New Zealand National Gambling Study: Wave 4 (2015)Provider No: 467589, Agreement No: 349827/00Auckland University of Technology, Gambling and Addictions Research Centre Final Report Number 6, 29 March 2018

Wave 1 variable Odds ratio (95% CI) p-valueRaffle/lottery (NZ/overseas) - monthly
No 1.00Yes 1.86 (1.01, 3.44) 0.05
Lotto - monthlyNo 1.00Yes 1.83 (1.02, 3.28) 0.04
Instant Kiwi/other scratch tickets - monthlyNo 1.00Yes 2.06 (1.13, 3.73) 0.02
Housie or bingo - monthlyNo 1.00Yes 13.51 (3.12, 58.45) 0.0005
Horse/dog race betting - monthlyNo 1.00Yes 4.92 (1.83, 13.20) 0.002
Sports betting - monthlyNo 1.00Yes 19.92 (6.05, 65.6) <0.0001
Casino EGMs (NZ) - monthlyNo 1.00Yes 12.99 (3.21, 52.60) 0.0003
Pub EGMs - monthlyNo 1.00Yes 25.01 (12.48, 50.12) <0.0001
Club EGMs - monthlyNo 1.00Yes 5.20 (1.89, 14.33) 0.001
EGMs overall - monthlyNo 1.00Yes 24.86 (13.1, 47.17) <0.0001
NZ internet gambling - monthlyNo 1.00Yes 3.19 (1.33, 7.62) 0.009
Overseas internet gambling - monthlyNo 1.00Yes 17.68 (4.47, 69.94) <0.0001
Overseas offshore gambling - monthlyNo 1.00Yes 17.07 (4.50, 64.81) <0.0001
Overseas internet/offshore gambling overall - monthlyNo 1.00Yes 17.68 (4.47, 69.94) <0.0001
Gambling-type games not for money - monthlyNo 1.00Yes 3.91 (2.25, 6.81) <.0001
Time spent playing EGMs in an average day (casino)No time 1.00Up to 15 minutes 6.92 (2.33, 20.60)16 to 30 minutes 0.87 (0.25, 3.06)31 to 60 minutes 1.13 (0.28, 4.54)>60 minutes 17.77 (8.51, 37.12) <0.0001
Time spent playing EGMs in an average day (pub)No time 1.00Up to 15 minutes 4.78 (1.79, 12.74)16 to 30 minutes 6.57 (2.82, 15.32)31 to 60 minutes 10.42 (4.39, 24.73)>60 minutes 89.58 (38.52, 208.34) <0.0001
Time spent playing EGMs in an average day (club)No time 1.00Up to 15 minutes 2.77 (0.72, 10.6)16 to 30 minutes 1.16 (0.39, 3.46)31 to 60 minutes 1.24 (0.37, 4.18)>60 minutes 11.37 (2.96, 43.68) 0.006
179New Zealand National Gambling Study: Wave 4 (2015)Provider No: 467589, Agreement No: 349827/00Auckland University of Technology, Gambling and Addictions Research Centre Final Report Number 6, 29 March 2018
Wave 1 variable Odds ratio (95% CI) p-valueWho spent time with on most enjoyed activity
Alone 1.00With one person 2.09 (1.13, 3.86)With several people/a group 0.85 (0.43, 1.71) 0.03
Methods - Setting a dollar limit before leaving homeNo 1.00Yes 2.96 (1.81, 4.84) <0.0001
Methods - Getting someone you trust to manage the moneyNo 1.00Yes 14.44 (3.56, 58.62) 0.0002
Methods - Separating money for betting from other money and stoppingNo 1.00Yes 5.26 (2.50, 11.05) <0.0001
Methods - Leaving ATM and credit cards at homeNo 1.00Yes 18.57 (7.23, 47.69) <0.0001
Methods - Setting a time limitNo 1.00Yes 5.67 (1.93, 16.70) 0.002
Methods - Avoiding places that have betting or gamblingNo 1.00Yes 6.52 (2.79, 15.25) <0.0001
Data weighted for 2013 Census data (all Waves) and attrition (Waves 2, 3 and 4)
180New Zealand National Gambling Study: Wave 4 (2015)Provider No: 467589, Agreement No: 349827/00Auckland University of Technology, Gambling and Addictions Research Centre Final Report Number 6, 29 March 2018

APPENDIX 31:Statistically significant bivariate associations for recovery from moderate-risk/problem
gambling
Wave 1 variable Adjusted n%
Recovery Odds ratio (95% CI) p-valueAge group (years)
18 - 39 16 81.5 1.0040 - 59 15 75.8 0.72 (0.14, 3.62)60+ 3 54.3 0.27 (0.08, 0.92) 0.02
Ethnic group (prioritised) Māori 8 51.6Pacific 5 66.2Asian 1 100.0European/Other 20 89.3
Arrival in NZNZ born 27 74.5before 2008 5 85.2since 2008 1 100.0
Household size1 - 2 10 51.4 1.003 - 4 12 93.0 12.53 (1.62, 96.86)5+ 11 82.2 4.36 (0.76, 24.86) 0.02
Personal income≤$20,000 10 65.2 1.00$20,001 - $40,000 11 73.9 1.51 (0.20, 11.14)$40,001 - $60,000 6 98.0 25.79 (1.99, 333.87)>$60,000 6 95.0 10.05 (0.66, 153.18) 0.04
Number of gambling activities participated in 1 - 3 11 97.4 1.004 - 6 15 67.5 0.06 (0.01, 0.62)7 - 10 8 66.6 0.05 (0.01, 0.51) 0.03
Pattern of participationInfrequent gambler 16 100.0Regular non-continuous gambler 7 85.6Regular continuous gambler 11 36.2
Gambling frequencyAt least weekly 18 56.2At least monthly 8 100.0At least once in past year 7 100.0
Typical monthly gambling expenditure≤$20 3 100.0$21 - $50 3 100.0>$50 27 71.4
Bets with friends/workmates - annualNo 24 85.7 1.00Yes 9 53.9 0.20 (0.05, 0.84) 0.03
Club EGMs - annualNo 26 84.2 1.00Yes 7 50.2 0.19 (0.04, 0.86) 0.03
NZ internet gambling - annualNo 29 82.6 1.00Yes 5 40.5 0.14 (0.03, 0.75) 0.02
Bets with friends/workmates - monthlyNo 31 81.3Yes 2 0.0
Text game or competition - monthlyNo 32 78.0 1.00Yes 1 21.3 0.08 (0.01, 0.63) 0.02
Instant Kiwi/other scratch tickets - monthlyNo 27 86.2 1.00Yes 6 36.9 0.09 (0.02, 0.49) 0.005
181New Zealand National Gambling Study: Wave 4 (2015)Provider No: 467589, Agreement No: 349827/00Auckland University of Technology, Gambling and Addictions Research Centre Final Report Number 6, 29 March 2018
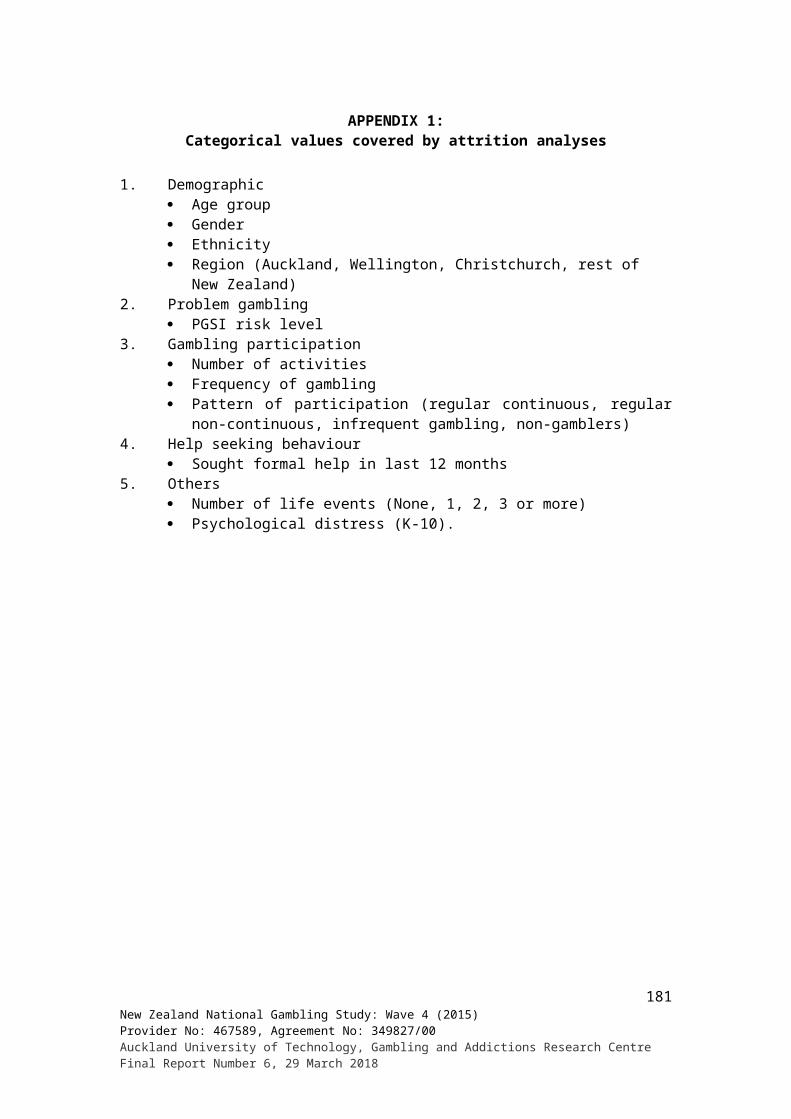
Wave 1 variable Adjusted n%
Recovery Odds ratio (95% CI) p-valueHorse/dog race betting - monthly
No 29 84.4 1.00Yes 5 30.3 0.08 (0.01, 0.52) 0.01
EGMs overall - monthlyNo 21 86.4 1.00Yes 12 61.0 0.25 (0.06, 0.99) 0.05
NZ internet gambling - monthlyNo 29 83.0 1.00Yes 4 32.7 0.10 (0.02, 0.59) 0.01
Sought help (from formal sources) - in last yearNo 33 76.7Yes 0.3 100.0
Data weighted for 2013 Census data (all Waves) and attrition (Waves 2, 3 and 4)
182New Zealand National Gambling Study: Wave 4 (2015)Provider No: 467589, Agreement No: 349827/00Auckland University of Technology, Gambling and Addictions Research Centre Final Report Number 6, 29 March 2018

APPENDIX 32:Statistically significant bivariate associations for relapse into moderate-risk/problem
gambling
Wave 1 variable Adjusted n % Relapse Odds ratio (95% CI) p-valueEthnic group (prioritised)
Māori 6 25.1 10.30 (0.72, 148.40)Pacific 4 24.3 9.88 (0.87, 112.64)Asian 2 75.1 92.49 (3.80, >999.99)European/Other 18 3.2 1.00 0.04
Area of residenceAuckland 11 25.6Wellington 4 18.9Christchurch 3 0.0Rest of NZ 11 25.6
Text game or competition - annualNo 29 16.2Yes 1 0.0
Housie/bingo - annualNo 28 12.1 1.00Yes 2 69.6 16.57 (1.04, 263.18) 0.05
Sports betting - annualNo 28 16.5Yes 2 0.0
Club EGMs - annualNo 27 17.6Yes 4 0.0
Short-term spec. investments - annualNo 30 14.9Yes 0.2 100.0
Other offshore gambling# - annualNo 28 11.6 1.00Yes 2 72.8 20.44 (1.37, 304.91) 0.03
NZ internet gambling - annualNo 28 16.5Yes 2 0.0
Other overseas internet gambling† - annualNo 28 11.6 1.00Yes 2 72.8 20.44 (1.37, 304.91) 0.03
Any offshore/internet gambling - annualNo 28 11.6 1.00Yes 2 72.8 20.44 (1.37, 304.91) 0.03
Text game or competition - monthlyNo 30 15.5Yes 0.1 0.0
Instant Kiwi/other scratch tickets - monthlyNo 26 9.6 1.00Yes 5 48.9 9.01 (1.46, 55.62) 0.02
Housie/bingo - monthlyNo 30 14.5Yes 0.3 100.0
Sports betting - monthlyNo 30 15.7Yes 1 0.0
Club EGMs - monthlyNo 29 15.9Yes 1 0.0
Short-term spec. investments - monthlyNo 30 14.9Yes 0.2 100.0
NZ internet gambling - monthlyNo 29 16.2Yes 1 0.0
183New Zealand National Gambling Study: Wave 4 (2015)Provider No: 467589, Agreement No: 349827/00Auckland University of Technology, Gambling and Addictions Research Centre Final Report Number 6, 29 March 2018

Wave 1 variable Adjusted n % Relapse Odds ratio (95% CI) p-valueTime spent gambling on casino EGMs in an average day
None 17 14.2Up to 15 minutes 3 0.016 - 30 minutes 0 -31 - 60 minutes 5 12.2> 60 minutes 6 29.2
Time spent gambling on pub EGMs in an average dayNone 11 19.0Up to 15 minutes 6 0.016 - 30 minutes 5 0.031 - 60 minutes 3 0.0> 60 minutes 5 53.5
Who gambled withAlone 9 2.5 1.00With one person 9 6.8 2.86 (0.10, 79.94)With several people/a group 12 32.8 19.23 (1.52, 244.21) 0.04
Trusted person manages the moneyNo 29 15.9Yes 1 0.0
Set a time limitNo 30 15.5Yes 0.1 0.0
Sought help (from formal sources) - in last yearNo 30 15.6Yes 0.3 0.0
Data weighted for 2013 Census data (all Waves) and attrition (Waves 2, 3 and 4)# ‘Other offshore gambling’ relates to online gambling on the following: casino games and EGMs (not cards), bingo, event betting, skill games, virtual sport and other non-specified gambling.† Overseas online poker, raffles/lottery, sports betting and horse/dog race betting.
184New Zealand National Gambling Study: Wave 4 (2015)Provider No: 467589, Agreement No: 349827/00Auckland University of Technology, Gambling and Addictions Research Centre Final Report Number 6, 29 March 2018