New Zealand Journal of Forestry Science · 2Scion, Private Bag 3020, Rotorua 3046, ... New Zealand...
15
New Zealand Journal of Forestry Science 41 (2011) 115-129 published on-line: 08/07/2011 www.scionresearch.com/nzjfs © 2011 New Zealand Forest Research Institute Limited, trading as Scion ISSN 0048 - 0134 (print) ISSN 1179-5395 (on-line) Spatial description of potential areas suitable for afforestation within New Zealand and quantification of their productivity under Pinus radiata. Michael S. Watt 1 *, David J. Palmer 2 , and Barbara K. Höck 2 1 Scion, PO Box 29237 Fendalton, Christchurch 8540, New Zealand 2 Scion, Private Bag 3020, Rotorua 3046, New Zealand (Received for publication 23 August 2010; accepted in revised form 25 May 2011) *corresponding author: [email protected] Abstract The demand for carbon credits to offset greenhouse gas emissions is likely to stimulate afforestation rates throughout the world. The development of maps that describe suitable new areas for plantation forestry and quantify potential productivity for these regions will be of considerable value to planners and growers. Using nationally available spatial data sets the objectives of this study were to: (i) identify areas within New Zealand that could be afforested in the future; and (ii) compare productivity between current Pinus radiata D.Don plantations and potential areas suitable for afforestation. Productivity for P. radiata was defined by 300 Index, which describes the stem volume mean annual increment at age 30 years under a reference regime of 300 stems ha -1 . Within New Zealand three potential afforestation scenarios were developed in which delineated areas ranged from ca. 0.7 million ha (Scenario 1) to 1.1 M ha (Scenario 2) and 2.9 M ha (Scenario 3). All three scenarios targeted non-arable land classes for afforestation that have limitations for sustainable use under perennial vegetation. For the current plantations the mean national 300 Index was 27.4 m 3 ha -1 yr -1 . Compared to the current plantations, at the national level, 2 to 6% increases in 300 Index were predicted for areas established under these three scenarios. Such afforestation would also significantly reduce the rate of soil loss by erosion. Keywords: afforestation; erosion; Geographic Information System; productivity modelling; radiata pine; spatial surfaces. Introduction Plantation forestry is a major industry in the Southern Hemisphere and contributes significantly to the economy of many countries (Lewis & Ferguson, 1993; New Zealand Forest Owners Association, 2007). Although difficult to quantify, sustainably managed plantation forests also make major positive contributions to environmental and social issues (Brockerhoff, et al., 2008; Ford-Robertson, 1996; Giltrap, et al., 2009; Palma, 2005; Richardson, et al., 1999). Within New Zealand, the reduction of soil erosion is one of the most important and well documented auxiliary benefits of afforestation (Marden, et al., 2005). The removal of natural forests in New Zealand over the last few centuries (Ewers, et al., 2006; McGlone & Wilmshurst, 1999; Wilmshurst, et al., 2008) has caused rates of erosion and associated
Transcript of New Zealand Journal of Forestry Science · 2Scion, Private Bag 3020, Rotorua 3046, ... New Zealand...
New Zealand Journal of Forestry Science41 (2011) 115-129
published on-line: 08/07/2011www.scionresearch.com/nzjfs
© 2011 New Zealand Forest Research Institute Limited, trading as Scion ISSN 0048 - 0134 (print) ISSN 1179-5395 (on-line)
Spatial description of potential areas suitable for afforestation within New Zealand and quantification of their productivity under Pinus radiata.
Michael S. Watt1*, David J. Palmer2, and Barbara K. Höck2
1Scion, PO Box 29237 Fendalton, Christchurch 8540, New Zealand2Scion, Private Bag 3020, Rotorua 3046, New Zealand
(Received for publication 23 August 2010; accepted in revised form 25 May 2011)
*corresponding author: [email protected]
Abstract
The demand for carbon credits to offset greenhouse gas emissions is likely to stimulate afforestation rates throughout the world. The development of maps that describe suitable new areas for plantation forestry and quantify potential productivity for these regions will be of considerable value to planners and growers. Using nationally available spatial data sets the objectives of this study were to: (i) identify areas within New Zealand that could be afforested in the future; and (ii) compare productivity between current Pinus radiata D.Don plantations and potential areas suitable for afforestation. Productivity for P. radiata was defined by 300 Index, which describes the stem volume mean annual increment at age 30 years under a reference regime of 300 stems ha-1.
Within New Zealand three potential afforestation scenarios were developed in which delineated areas ranged from ca. 0.7 million ha (Scenario 1) to 1.1 M ha (Scenario 2) and 2.9 M ha (Scenario 3). All three scenarios targeted non-arable land classes for afforestation that have limitations for sustainable use under perennial vegetation. For the current plantations the mean national 300 Index was 27.4 m3 ha-1 yr -1. Compared to the current plantations, at the national level, 2 to 6% increases in 300 Index were predicted for areas established under these three scenarios. Such afforestation would also significantly reduce the rate of soil loss by erosion.
Keywords: afforestation; erosion; Geographic Information System; productivity modelling; radiata pine; spatial surfaces.
Introduction
Plantation forestry is a major industry in the Southern Hemisphere and contributes significantly to the economy of many countries (Lewis & Ferguson, 1993; New Zealand Forest Owners Association, 2007). Although difficult to quantify, sustainably managed plantation forests also make major positive contributions to environmental and social issues
(Brockerhoff, et al., 2008; Ford-Robertson, 1996; Giltrap, et al., 2009; Palma, 2005; Richardson, et al., 1999). Within New Zealand, the reduction of soil erosion is one of the most important and well documented auxiliary benefits of afforestation (Marden, et al., 2005). The removal of natural forests in New Zealand over the last few centuries (Ewers, et al., 2006; McGlone & Wilmshurst, 1999; Wilmshurst, et al., 2008) has caused rates of erosion and associated
Watt et al.: New Zealand Journal of Forestry Science 41 (2011) 115-129116
© 2011 New Zealand Forest Research Institute Limited, trading as Scion ISSN 0048 - 0134 (print) ISSN 1179-5395 (on-line)
flooding and sedimentation to increase markedly, leading to detrimental environmental impacts on both affected individual land owners and communities (National Water and Soil Conservation Organisation (NWASCO), 1970). Afforestation of eroding areas has been shown to be one of the most effective ways of reducing both the size of erosion features and the volume of sediment (flow and deposition) (Liebault & Piegay, 2001; Marden, et al., 2005; Piegay & Salvador, 1997).
New opportunities for improving financial returns to tree growers are likely to provide major incentives for expansion of plantation forest in New Zealand (Höck, et al., 2009). In particular, afforestation with fast-growing species is an effective means of offsetting carbon dioxide emissions to meet national commitments (Dixon, et al., 1994). The volume of carbon traded has increased substantially over the last few years and the enactment of emission trading schemes within major plantation-growing countries, such as New Zealand, is likely to markedly improve returns from forestry (Manley & Maclaren, 2009). Given the strong positive relationship between rates of return and the area annually afforested (Horgan, 2007; Manley & Maclaren, 2009), increases in returns that have been forecast to occur through carbon forestry (Manley & Maclaren, 2009) are likely to induce rapid conversion of marginal land to plantation forestry.
Developing maps that describe both suitable areas for new plantation forests and quantify potential productivity of these regions will be of considerable value to planners and growers. The development of these maps in New Zealand has been greatly facilitated by the recent provision of high resolution and comprehensive data sets together with increases in the capability of geographic information systems. In recent years several national extent spatial surfaces covering land-use classification (AsureQuality, 2009; Landcare Research, 2010; Newsome, et al., 2000), terrain attributes (Palmer, Höck, Dunningham, et al., 2009) and a range of environmental variables (Leathwick, et al., 2003; Leathwick & Stephens, 1998; Palmer, Watt, et al., 2009; Tait et al., 2006) have been developed.
Recent research has utilised these environmental layers to develop spatial representations of plantation productivity across broad landscape scales at a reasonably high spatial resolution (Palmer, Höck, Dunningham, et al., 2009; Watt, et al., 2009). By combining productivity surfaces with maps that delineate potential regions for afforestation it should be possible to determine the productive capacity of afforestable areas on a regional basis. Comparison of productivity predictions between current and future plantations will provide some insight into the feasibility and profitability of further afforestation.
Using nationally available datasets the objective of this research was to spatially delineate the potential locations of future forests within New Zealand. Previously developed spatial surfaces of productivity for the most common plantation species, Pinus radiata D.Don, were then overlaid on these delineated areas. Estimates of productivity were determined for both current and future plantings at national and regional scales.
Materials and Methods
Identification of current plantations
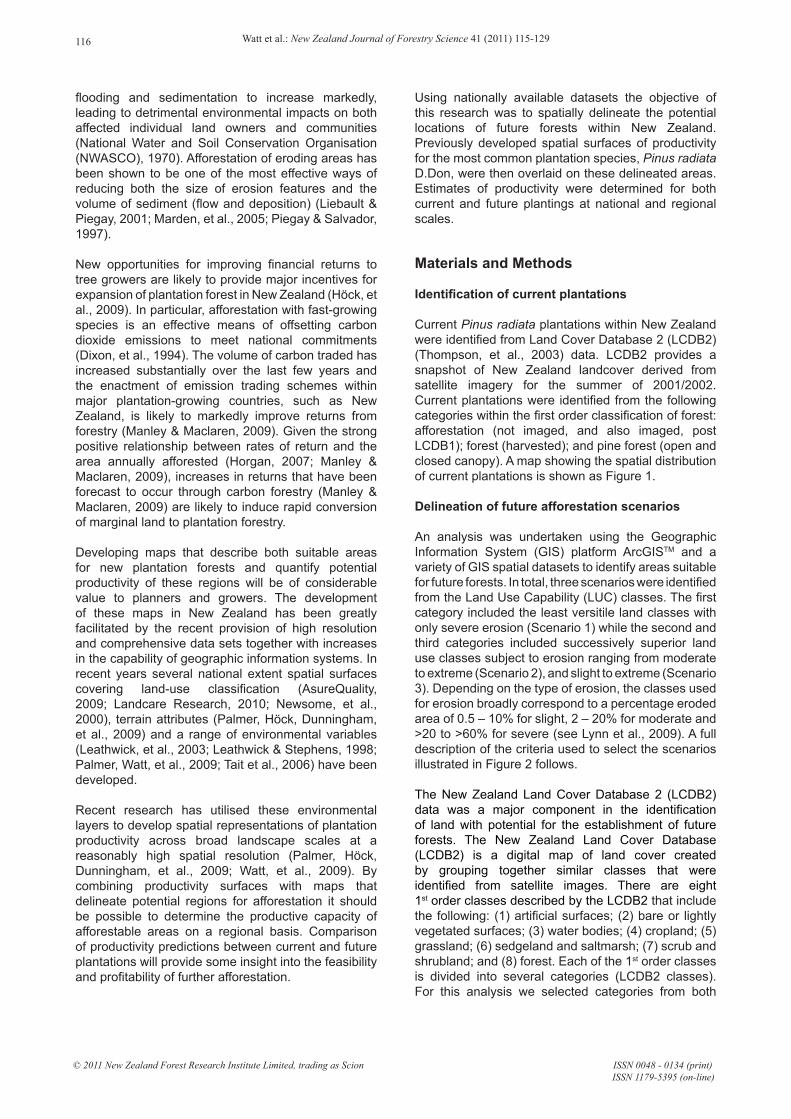
Current Pinus radiata plantations within New Zealand were identified from Land Cover Database 2 (LCDB2) (Thompson, et al., 2003) data. LCDB2 provides a snapshot of New Zealand landcover derived from satellite imagery for the summer of 2001/2002. Current plantations were identified from the following categories within the first order classification of forest: afforestation (not imaged, and also imaged, post LCDB1); forest (harvested); and pine forest (open and closed canopy). A map showing the spatial distribution of current plantations is shown as Figure 1.
Delineation of future afforestation scenarios
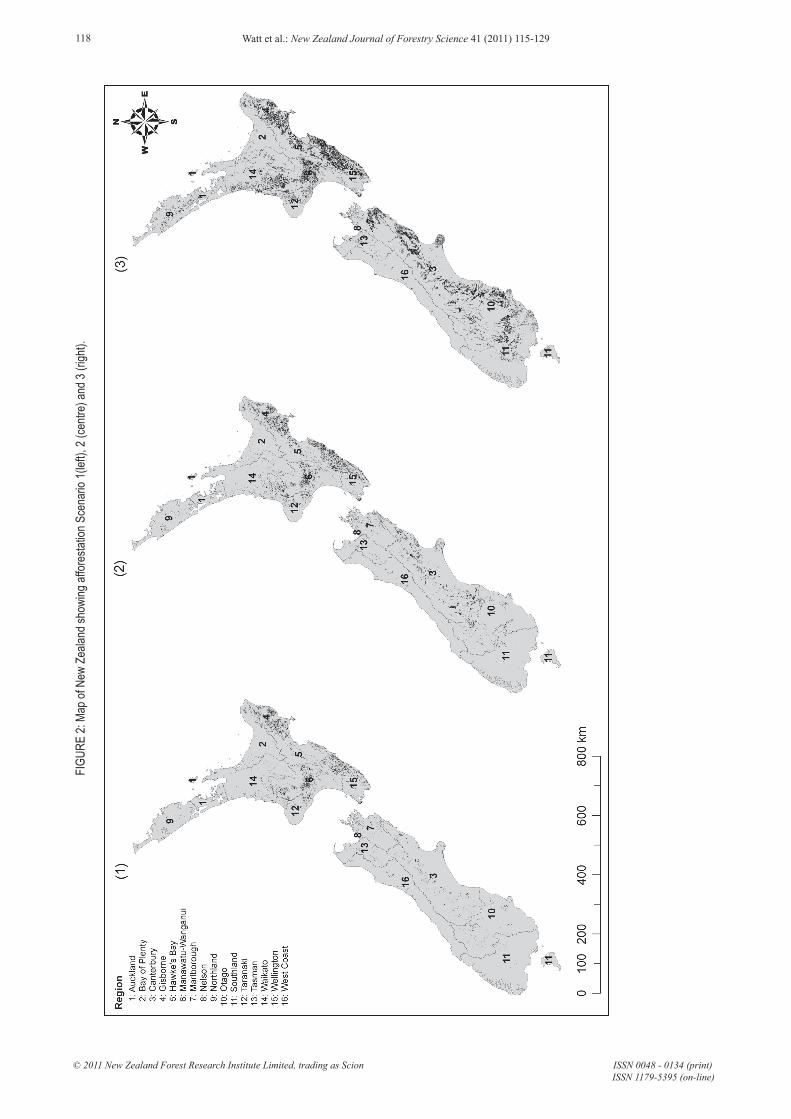
An analysis was undertaken using the Geographic Information System (GIS) platform ArcGISTM and a variety of GIS spatial datasets to identify areas suitable for future forests. In total, three scenarios were identified from the Land Use Capability (LUC) classes. The first category included the least versitile land classes with only severe erosion (Scenario 1) while the second and third categories included successively superior land use classes subject to erosion ranging from moderate to extreme (Scenario 2), and slight to extreme (Scenario 3). Depending on the type of erosion, the classes used for erosion broadly correspond to a percentage eroded area of 0.5 – 10% for slight, 2 – 20% for moderate and >20 to >60% for severe (see Lynn et al., 2009). A full description of the criteria used to select the scenarios illustrated in Figure 2 follows.
The New Zealand Land Cover Database 2 (LCDB2) data was a major component in the identification of land with potential for the establishment of future forests. The New Zealand Land Cover Database (LCDB2) is a digital map of land cover created by grouping together similar classes that were identified from satellite images. There are eight 1st order classes described by the LCDB2 that include the following: (1) artificial surfaces; (2) bare or lightly vegetated surfaces; (3) water bodies; (4) cropland; (5) grassland; (6) sedgeland and saltmarsh; (7) scrub and shrubland; and (8) forest. Each of the 1st order classes is divided into several categories (LCDB2 classes). For this analysis we selected categories from both
Watt et al.: New Zealand Journal of Forestry Science 41 (2011) 115-129 117
© 2011 New Zealand Forest Research Institute Limited, trading as Scion ISSN 0048 - 0134 (print) ISSN 1179-5395 (on-line)
grassland, and scrub and shrubland classes. These categories included depleted, low and high producing grassland (from 1st order class grassland) and gorse and broom and mixed exotic shrubland (from 1st order class scrub and shrubland).
To minimise the impact on native plant biodiversity, landscape values and areas suited to ecological protection, a number of categories within the 1st order classifications (5) grassland, and (7) scrub and shrublands were excluded from the analysis. Within the grassland class, the category of tall-tussock grassland was excluded while the categories excluded from the scrub and shrubland class included fernland, manuka and or kanuka, matagouri, broadleaved indigenous hardwoods, sub alpine shrubland, and grey scrub. The rationale for these exclusions is that afforestation should be undertaken in a manner that minimises further native ecosystem loss.
From a carbon forestry viewpoint, the shrubland categories were excluded as they are considered native carbon sinks. The shrubland categories can be eligible for carbon credits if they are the result of
natural succession on ex-pasture land since January 1990 and fulfill the definition of forests, namely having a woody cover of at least 30% and a minimum height of 5m at maturity (Ministry for the Environment, 2010).
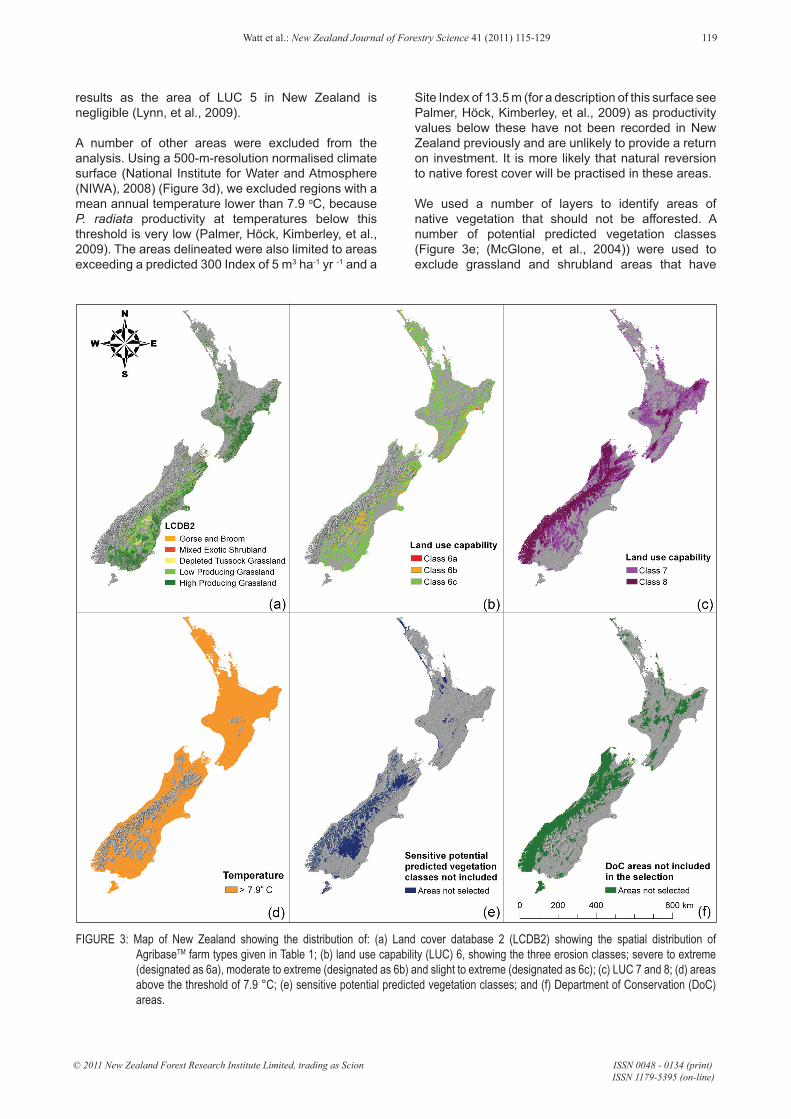
The AgriBaseTM-enhanced version of LCDB2 (AsureQuality, 2009) classifies the type of farming at a fine scale so this version was used to further refine the selection of areas within the 1st order grassland category. The aim of using the AgriBaseTM-enhanced LCDB2 was to exclude land uses with the potential for high returns — for example, dairying, horticulture, and viticulture. For low producing and depleted grassland, only the classes beef (BEF), deer (DEE), grazing other peoples’ stock (GRA), not farmed - idle (NOF), sheep (SHP), mixed sheep and beef (SNB), and unspecified (UNS) were selected (Figure 3a). For high producing exotic grassland, all of these classes were selected apart from the BEF farm type class, as these areas are likely to provide higher returns.
Land use capability (LUC) classes (Figures 3b & 3c) were used to exclude arable land and slightly limited non-arable classes and to differentiate between the three scenarios on the basis of erosion severity. Within this classification, LUC 1 to 4 denote arable land classes whereas LUC 5 to 8 are unsuitable for arable land and have slight (LUC 5), moderate (LUC 6), severe (LUC 7) and extreme (LUC 8) limitations for perennial vegetation such as pasture and forest. A full description of the LUC system is given in Lynn et al. (2009), and a summary of the non-arable classes selected here is included as Appendix 1.
Based on past patterns of land use, expert opinion and classification ratings we included areas in LUC 7 and 8 (meeting other criteria outlined in Table 1) as potentially afforestable land. Because LUC 7 has severe limitations it is widely accepted that forestry is a more suitable sustainable use than agriculture for this class (Lynn, et al., 2009). The LUC 8 lands, included as permanent carbon sinks and not harvested, may potentially provide a useful long term landuse for this class. Because erosion potential is the key limitation and differentiator of land within LUC 6, and because forestry provides the most effective solution to controlling accelerated erosion (Marden, et al., 2005), we developed three scenarios based on erosion severity within LUC 6 (Figure 3b). The first scenario was most conservative and included only severe to extreme erosion severities; the second included moderate to extreme erosion severities; and the third was least conservative and included slight to extreme erosion severities (Figure 3b). All of these scenarios also included the delineated areas within LUC 7 and 8. LUC 5 was not included in our analyses because these areas are generally accepted as being more suited to agriculture than forestry (NWASCO, 1979; Soil Conservation and Rivers Control Council (SCRCC), 1974). This assumption is unlikely to markedly affect
FIGURE 1: Map of New Zealand showing current plantation forests.
© 2011 New Zealand Forest Research Institute Limited, trading as Scion ISSN 0048 - 0134 (print) ISSN 1179-5395 (on-line)
Watt et al.: New Zealand Journal of Forestry Science 41 (2011) 115-129118
FIGU
RE 2:
Map
of N
ew Z
ealan
d sho
wing
affor
estat
ion S
cena
rio 1(
left),
2 (ce
ntre)
and 3
(righ
t).
© 2011 New Zealand Forest Research Institute Limited, trading as Scion ISSN 0048 - 0134 (print) ISSN 1179-5395 (on-line)
Watt et al.: New Zealand Journal of Forestry Science 41 (2011) 115-129 119
A number of other areas were excluded from the analysis. Using a 500-m-resolution normalised climate surface (National Institute for Water and Atmosphere (NIWA), 2008) (Figure 3d), we excluded regions with a mean annual temperature lower than 7.9 oC, because P. radiata productivity at temperatures below this threshold is very low (Palmer, Höck, Kimberley, et al., 2009). The areas delineated were also limited to areas exceeding a predicted 300 Index of 5 m3 ha-1 yr -1 and a
Site Index of 13.5 m (for a description of this surface see Palmer, Höck, Kimberley, et al., 2009) as productivity values below these have not been recorded in New Zealand previously and are unlikely to provide a return on investment. It is more likely that natural reversion to native forest cover will be practised in these areas.
We used a number of layers to identify areas of native vegetation that should not be afforested. A number of potential predicted vegetation classes (Figure 3e; (McGlone, et al., 2004)) were used to exclude grassland and shrubland areas that have
FIGURE 3: Map of New Zealand showing the distribution of: (a) Land cover database 2 (LCDB2) showing the spatial distribution of AgribaseTM farm types given in Table 1; (b) land use capability (LUC) 6, showing the three erosion classes; severe to extreme (designated as 6a), moderate to extreme (designated as 6b) and slight to extreme (designated as 6c); (c) LUC 7 and 8; (d) areas above the threshold of 7.9 °C; (e) sensitive potential predicted vegetation classes; and (f) Department of Conservation (DoC) areas.
results as the area of LUC 5 in New Zealand is negligible (Lynn, et al., 2009).
© 2011 New Zealand Forest Research Institute Limited, trading as Scion ISSN 0048 - 0134 (print) ISSN 1179-5395 (on-line)
Watt et al.: New Zealand Journal of Forestry Science 41 (2011) 115-129120
TABLE 1: Spatial datasets and criteria used to determine potential available land.
* See text for selection of AgriBaseTM farm types within each class.# Three available land scenarios were developed by subdividing LUC class 6 into three categories with the following erosion severity: (1) severe to extreme; (2) moderate to extreme; and (3) slight to extreme.
unique biodiversity value and would not naturally support trees. These regions included: scrub; tussock-grassland and herbfield above the tree-line; and scrub, shrubland and tussock-grassland classes below the tree-line, with the latter group occurring mostly in the central Otago region where they have landscape-character value. These are areas that should ideally remain as shrubland and tussock-type vegetation regardless of human activities.
The potential predicted vegetation also enables the identification and removal of dunelands and wetlands from the analysis because these areas are generally unsuitable for afforestation. The Department of Conservation (DoC) estate (Figure 3f), and current plantation areas were excluded from delineated areas. The DoC estate was defined by a vector dataset provided by DoC staff in 2009.
Determination of productivity for current and proposed plantations
Pinus radiata is a fast growing softwood that is currently the dominant production species in New Zealand, comprising 89% of the current estate (New Zealand Forest Owners Association, 2007). This study assumes that future plantings are predominantly P. radiata. A previously developed surface of 300 Index for P. radiata (Palmer, Höck, Kimberley, et al., 2009) was used to spatially quantify productivity for both the current estate and proposed plantings.
The 300 Index defines the stem volume mean annual increment (MAI) of P. radiata at age 30 years with a reference regime of 300 stems ha-1 (Kimberley, et al., 2005). We used 300 Index values in this study because standardised volume-based measurements provide a
more accurate means of ascertaining site productivity for P. radiata than height based measurements such as Site Index (Kimberley et al., 2005). Importantly, recent research has clearly shown that accurate and unbiased values for 300 Index can be obtained using measurements taken from P. radiata stands differing in age or stocking from those of the 300 Index standard regime (30 years and 300 stems ha-1; Kimberley et al., 2005).
To calculate the 300 Index, a plot measurement consisting of the basal area, mean top height and stocking at a known age, along with stand history information (initial stocking, timing and extent of thinnings, and timing and height of prunings) are required. The 300 Index estimation procedure utilises the 300 Index model, an empirical stand level basal area growth model that expresses basal area as a function of age, stocking, Site Index and the 300 Index, effectively a local site productivity parameter (Kimberley et al., 2005). The model accounts for the effects of pruning and thinning using age-shift adjustments. For example, field trials have demonstrated that the effect of a typical pruning regime is to lose about 1.4 years’ basal area growth compared with a similar unpruned regime, and this effect is incorporated into the 300 Index growth model. The model is structured so that for stands using the standard ‘300 Index’ regime (pruned to 6 m height, and thinned at time of final pruning so that stocking at age 30 years is 300 stems ha-1) the stem volume MAI equals the 300 Index parameter. Therefore, the 300 Index is an index of stem volume productivity, defined as the volume MAI at age 30 years for this standard regime. Because the model is sensitive to departures from this standard regime (e.g. different stocking levels and different intensities and timing of thinning and pruning
Spatial dataset Criteria
1. Included classesTemperature (°C) > 7.9
Land cover database 2* 40: High producing grassland 42: Low producing grassland 44: Depleted grassland 51: Gorse and broom 56: Mixed exotic shrubland
Land use capability (LUC) 6#, 7, 8
2. Excluded classesDepartment of Conservation estate All excludedPotential predicted vegetation Classes 21, 22, 23, 24, 25 excluded
Watt et al.: New Zealand Journal of Forestry Science 41 (2011) 115-129 121
© 2011 New Zealand Forest Research Institute Limited, trading as Scion ISSN 0048 - 0134 (print) ISSN 1179-5395 (on-line)
regimes), and can also adjust for the stand age, it can be used to predict the index for any plot measurement. To do this, an iterative procedure is used to determine the 300 Index parameter value compatible with the plot measurement and management history associated with the plot.
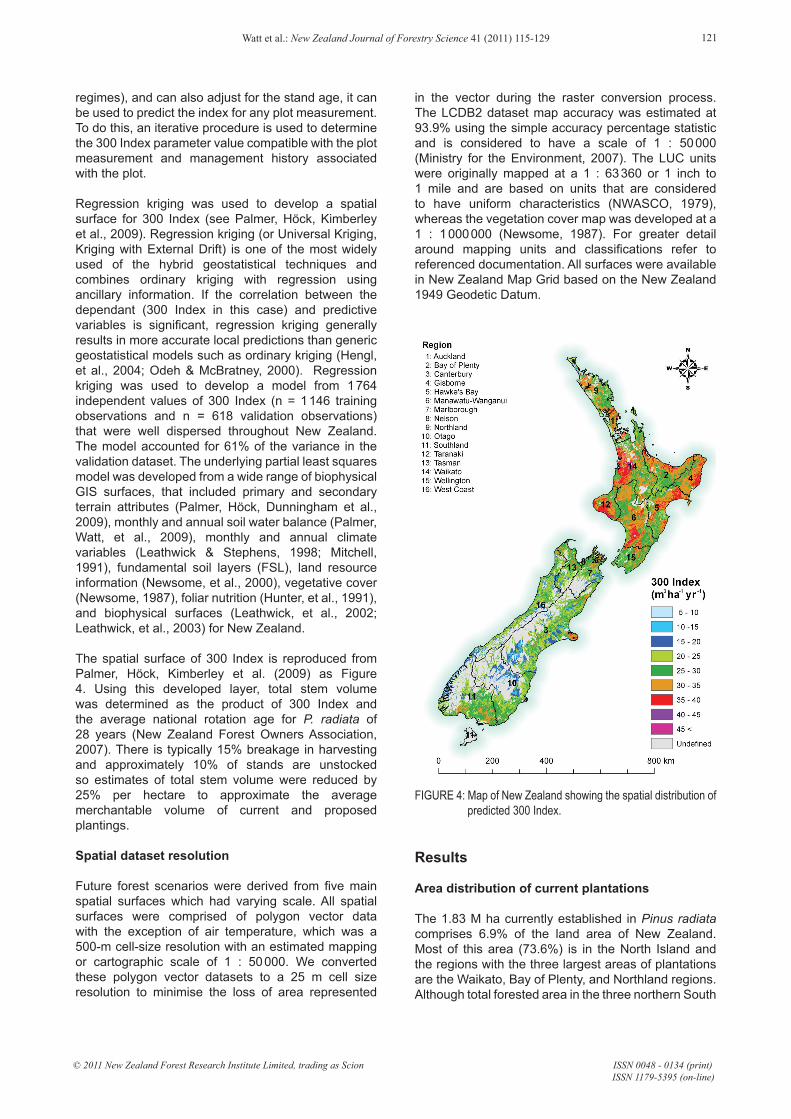
Regression kriging was used to develop a spatial surface for 300 Index (see Palmer, Höck, Kimberley et al., 2009). Regression kriging (or Universal Kriging, Kriging with External Drift) is one of the most widely used of the hybrid geostatistical techniques and combines ordinary kriging with regression using ancillary information. If the correlation between the dependant (300 Index in this case) and predictive variables is significant, regression kriging generally results in more accurate local predictions than generic geostatistical models such as ordinary kriging (Hengl, et al., 2004; Odeh & McBratney, 2000). Regression kriging was used to develop a model from 1 764 independent values of 300 Index (n = 1 146 training observations and n = 618 validation observations) that were well dispersed throughout New Zealand. The model accounted for 61% of the variance in the validation dataset. The underlying partial least squares model was developed from a wide range of biophysical GIS surfaces, that included primary and secondary terrain attributes (Palmer, Höck, Dunningham et al., 2009), monthly and annual soil water balance (Palmer, Watt, et al., 2009), monthly and annual climate variables (Leathwick & Stephens, 1998; Mitchell, 1991), fundamental soil layers (FSL), land resource information (Newsome, et al., 2000), vegetative cover (Newsome, 1987), foliar nutrition (Hunter, et al., 1991), and biophysical surfaces (Leathwick, et al., 2002; Leathwick, et al., 2003) for New Zealand.
The spatial surface of 300 Index is reproduced from Palmer, Höck, Kimberley et al. (2009) as Figure 4. Using this developed layer, total stem volume was determined as the product of 300 Index and the average national rotation age for P. radiata of 28 years (New Zealand Forest Owners Association, 2007). There is typically 15% breakage in harvesting and approximately 10% of stands are unstocked so estimates of total stem volume were reduced by 25% per hectare to approximate the average merchantable volume of current and proposed plantings.
Spatial dataset resolution
Future forest scenarios were derived from five main spatial surfaces which had varying scale. All spatial surfaces were comprised of polygon vector data with the exception of air temperature, which was a 500-m cell-size resolution with an estimated mapping or cartographic scale of 1 : 50 000. We converted these polygon vector datasets to a 25 m cell size resolution to minimise the loss of area represented
in the vector during the raster conversion process. The LCDB2 dataset map accuracy was estimated at 93.9% using the simple accuracy percentage statistic and is considered to have a scale of 1 : 50 000 (Ministry for the Environment, 2007). The LUC units were originally mapped at a 1 : 63 360 or 1 inch to 1 mile and are based on units that are considered to have uniform characteristics (NWASCO, 1979), whereas the vegetation cover map was developed at a 1 : 1 000 000 (Newsome, 1987). For greater detail around mapping units and classifications refer to referenced documentation. All surfaces were available in New Zealand Map Grid based on the New Zealand 1949 Geodetic Datum.
Results
Area distribution of current plantations
The 1.83 M ha currently established in Pinus radiata comprises 6.9% of the land area of New Zealand. Most of this area (73.6%) is in the North Island and the regions with the three largest areas of plantations are the Waikato, Bay of Plenty, and Northland regions. Although total forested area in the three northern South
FIGURE 4: Map of New Zealand showing the spatial distribution of predicted 300 Index.
© 2011 New Zealand Forest Research Institute Limited, trading as Scion ISSN 0048 - 0134 (print) ISSN 1179-5395 (on-line)
Watt et al.: New Zealand Journal of Forestry Science 41 (2011) 115-129122
Island regions (Nelson, Marlborough and Tasman), is relatively low, these forests nevertheless comprise a moderate percentage of the total regional land area. In contrast, plantations within the remaining regions of the South Island are relatively scattered and the percentage land area in forests within these regions are far lower than that of the national average.
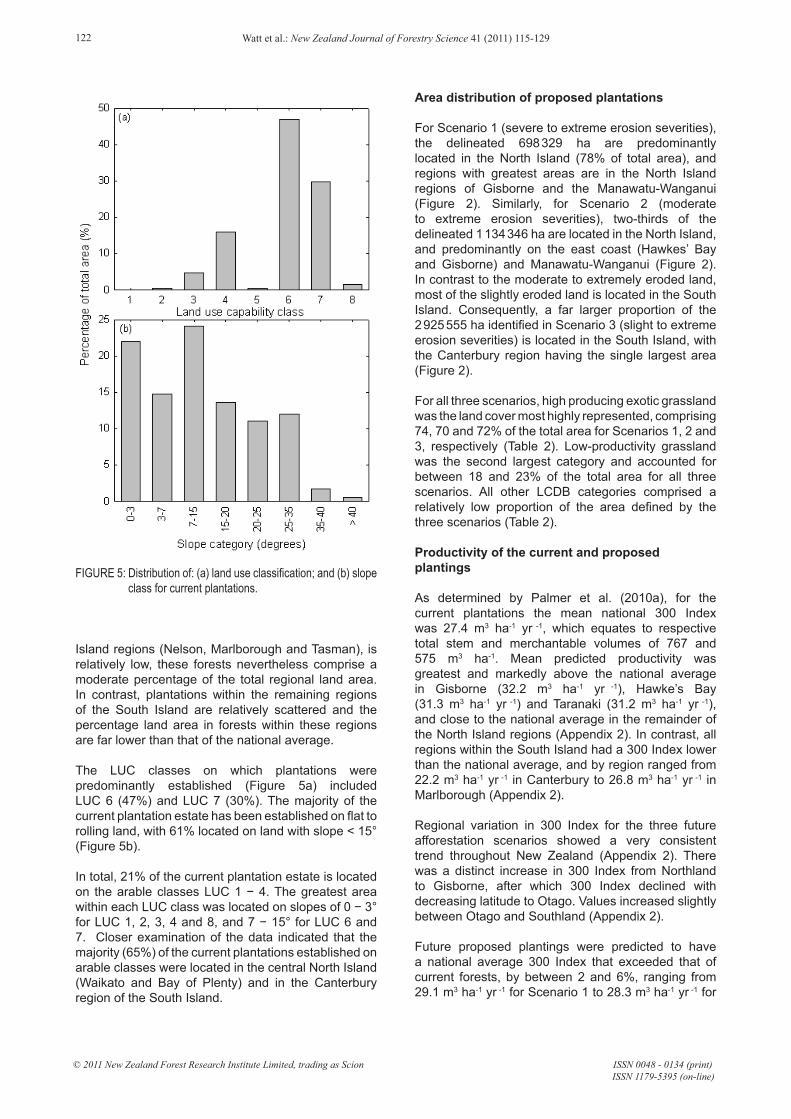
The LUC classes on which plantations were predominantly established (Figure 5a) included LUC 6 (47%) and LUC 7 (30%). The majority of the current plantation estate has been established on flat to rolling land, with 61% located on land with slope < 15° (Figure 5b).
In total, 21% of the current plantation estate is located on the arable classes LUC 1 − 4. The greatest area within each LUC class was located on slopes of 0 − 3° for LUC 1, 2, 3, 4 and 8, and 7 − 15° for LUC 6 and 7. Closer examination of the data indicated that the majority (65%) of the current plantations established on arable classes were located in the central North Island (Waikato and Bay of Plenty) and in the Canterbury region of the South Island.
Area distribution of proposed plantations
For Scenario 1 (severe to extreme erosion severities), the delineated 698 329 ha are predominantly located in the North Island (78% of total area), and regions with greatest areas are in the North Island regions of Gisborne and the Manawatu-Wanganui (Figure 2). Similarly, for Scenario 2 (moderate to extreme erosion severities), two-thirds of the delineated 1 134 346 ha are located in the North Island, and predominantly on the east coast (Hawkes’ Bay and Gisborne) and Manawatu-Wanganui (Figure 2). In contrast to the moderate to extremely eroded land, most of the slightly eroded land is located in the South Island. Consequently, a far larger proportion of the 2 925 555 ha identified in Scenario 3 (slight to extreme erosion severities) is located in the South Island, with the Canterbury region having the single largest area (Figure 2).
For all three scenarios, high producing exotic grassland was the land cover most highly represented, comprising 74, 70 and 72% of the total area for Scenarios 1, 2 and 3, respectively (Table 2). Low-productivity grassland was the second largest category and accounted for between 18 and 23% of the total area for all three scenarios. All other LCDB categories comprised a relatively low proportion of the area defined by the three scenarios (Table 2).
Productivity of the current and proposed plantings
As determined by Palmer et al. (2010a), for the current plantations the mean national 300 Index was 27.4 m3 ha-1 yr -1, which equates to respective total stem and merchantable volumes of 767 and 575 m3 ha-1. Mean predicted productivity was greatest and markedly above the national average in Gisborne (32.2 m3 ha-1 yr -1), Hawke’s Bay (31.3 m3 ha-1 yr -1) and Taranaki (31.2 m3 ha-1 yr -1), and close to the national average in the remainder of the North Island regions (Appendix 2). In contrast, all regions within the South Island had a 300 Index lower than the national average, and by region ranged from 22.2 m3 ha-1 yr -1 in Canterbury to 26.8 m3 ha-1 yr -1 in Marlborough (Appendix 2).
Regional variation in 300 Index for the three future afforestation scenarios showed a very consistent trend throughout New Zealand (Appendix 2). There was a distinct increase in 300 Index from Northland to Gisborne, after which 300 Index declined with decreasing latitude to Otago. Values increased slightly between Otago and Southland (Appendix 2).
Future proposed plantings were predicted to have a national average 300 Index that exceeded that of current forests, by between 2 and 6%, ranging from 29.1 m3 ha-1 yr -1 for Scenario 1 to 28.3 m3 ha-1 yr -1 for
FIGURE 5: Distribution of: (a) land use classification; and (b) slope class for current plantations.
Watt et al.: New Zealand Journal of Forestry Science 41 (2011) 115-129 123
© 2011 New Zealand Forest Research Institute Limited, trading as Scion ISSN 0048 - 0134 (print) ISSN 1179-5395 (on-line)
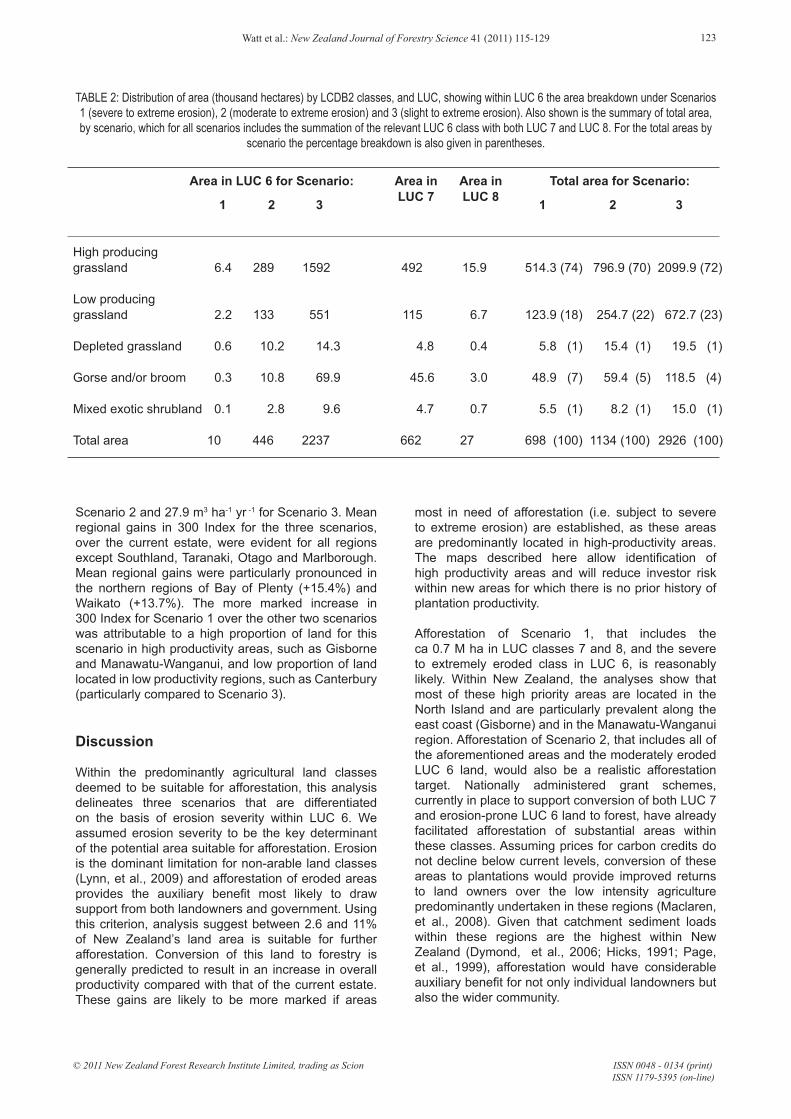
TABLE 2: Distribution of area (thousand hectares) by LCDB2 classes, and LUC, showing within LUC 6 the area breakdown under Scenarios 1 (severe to extreme erosion), 2 (moderate to extreme erosion) and 3 (slight to extreme erosion). Also shown is the summary of total area, by scenario, which for all scenarios includes the summation of the relevant LUC 6 class with both LUC 7 and LUC 8. For the total areas by
scenario the percentage breakdown is also given in parentheses.
1 2 3 1 2 3
High producing grassland 6.4 289 1592 492 15.9 514.3 (74) 796.9 (70) 2099.9 (72)
Low producing grassland 2.2 133 551 115 6.7 123.9 (18) 254.7 (22) 672.7 (23)
Depleted grassland 0.6 10.2 14.3 4.8 0.4 5.8 (1) 15.4 (1) 19.5 (1)
Gorse and/or broom 0.3 10.8 69.9 45.6 3.0 48.9 (7) 59.4 (5) 118.5 (4)
Mixed exotic shrubland 0.1 2.8 9.6 4.7 0.7 5.5 (1) 8.2 (1) 15.0 (1) Total area 10 446 2237 662 27 698 (100) 1134 (100) 2926 (100)
Area in LUC 6 for Scenario: Total area for Scenario:Area in LUC 7
Area in LUC 8
Scenario 2 and 27.9 m3 ha-1 yr -1 for Scenario 3. Mean regional gains in 300 Index for the three scenarios, over the current estate, were evident for all regions except Southland, Taranaki, Otago and Marlborough. Mean regional gains were particularly pronounced in the northern regions of Bay of Plenty (+15.4%) and Waikato (+13.7%). The more marked increase in 300 Index for Scenario 1 over the other two scenarios was attributable to a high proportion of land for this scenario in high productivity areas, such as Gisborne and Manawatu-Wanganui, and low proportion of land located in low productivity regions, such as Canterbury (particularly compared to Scenario 3).
Discussion
Within the predominantly agricultural land classes deemed to be suitable for afforestation, this analysis delineates three scenarios that are differentiated on the basis of erosion severity within LUC 6. We assumed erosion severity to be the key determinant of the potential area suitable for afforestation. Erosion is the dominant limitation for non-arable land classes (Lynn, et al., 2009) and afforestation of eroded areas provides the auxiliary benefit most likely to draw support from both landowners and government. Using this criterion, analysis suggest between 2.6 and 11% of New Zealand’s land area is suitable for further afforestation. Conversion of this land to forestry is generally predicted to result in an increase in overall productivity compared with that of the current estate. These gains are likely to be more marked if areas
most in need of afforestation (i.e. subject to severe to extreme erosion) are established, as these areas are predominantly located in high-productivity areas. The maps described here allow identification of high productivity areas and will reduce investor risk within new areas for which there is no prior history of plantation productivity.
Afforestation of Scenario 1, that includes the ca 0.7 M ha in LUC classes 7 and 8, and the severe to extremely eroded class in LUC 6, is reasonably likely. Within New Zealand, the analyses show that most of these high priority areas are located in the North Island and are particularly prevalent along the east coast (Gisborne) and in the Manawatu-Wanganui region. Afforestation of Scenario 2, that includes all of the aforementioned areas and the moderately eroded LUC 6 land, would also be a realistic afforestation target. Nationally administered grant schemes, currently in place to support conversion of both LUC 7 and erosion-prone LUC 6 land to forest, have already facilitated afforestation of substantial areas within these classes. Assuming prices for carbon credits do not decline below current levels, conversion of these areas to plantations would provide improved returns to land owners over the low intensity agriculture predominantly undertaken in these regions (Maclaren, et al., 2008). Given that catchment sediment loads within these regions are the highest within New Zealand (Dymond, et al., 2006; Hicks, 1991; Page, et al., 1999), afforestation would have considerable auxiliary benefit for not only individual landowners but also the wider community.
Watt et al.: New Zealand Journal of Forestry Science 41 (2011) 115-129124
© 2011 New Zealand Forest Research Institute Limited, trading as Scion ISSN 0048 - 0134 (print) ISSN 1179-5395 (on-line)
The probability that all of Scenario 3 could be afforested is very low because there is likely to be considerable landowner resistance to afforesting LUC 6 areas with only slight erosion. Conversion of the entire area delineated in Scenario 3 will also largely displace low intensity agriculture from the New Zealand landscape. Hence, afforestation is likely to range in areal extent between ~1.1 M ha (Scenario 2) and 2.9 M ha (Scenario 3). The key sensitivity around total future afforested area is likely to be the proportion of slightly eroded LUC 6 land that is converted to forestry.
The proportion of slightly eroded land that could be afforested is likely to depend largely on the rate of return for forestry, compared with other landuses, and landowner amenability to change. Historically, within New Zealand, annual rates of new afforestation exhibit a strong positive relationship with internal rate of return on the investment (IRR), with predicted new afforestation rates ranging from close to nil at IRR values ≤6.6% to approximately 100 000 ha annum-1 at an IRR of 11.0% (Horgan, 2007; Manley & Maclaren, 2009). Projected IRR for carbon forestry, under a conservative price for carbon (NZ$25/t CO2-e), ranges from 7.7 to 10.4% (Manley & Maclaren, 2009). Therefore afforestation rates of at least 25 000 ha yr -1 (Manley & Maclaren, 2009) and possibly up to 87,000 ha yr -1 seem reasonably likely. Recent research shows there is sufficient domestic demand for carbon credits from energy producing sectors in New Zealand to afforest at least 1 M ha by 2020 (Mason, 2010). Although increased returns from forestry are likely to result in greater rates of conversion, the limited amount of remaining land for agriculture may slow the afforestation rate, particularly after areas most suitable (i.e. Scenarios 1 and 2), have been converted.
The establishment of forests solely for carbon and environmental protection, in which no harvesting is planned, may be a useful land use in a number of areas. This regime is particularly well suited for LUC 8 land, in which catchment protection has been identified as a priority (Lynn, et al., 2009). Areas with greater steepness also fall into this category because harvesting on steep slopes is often not feasible. Regions fitting these criteria represent a small proportion of the delineated land comprising only 2 to 5% of the total area between the three scenarios. However, there are also likely to be considerable areas that will be established solely for carbon on LUC 6 and LUC 7 land as the large distance to processing facilities or ports precludes the possibility of economic harvesting.
Spatial variation in 300 Index using the model described here has been previously shown to be primarily related to air temperature and soil water balance (Palmer, 2008). Consequently, predictions of 300 Index increased from the cooler temperate Southland region to optimum values found at mid-
latitudes in the North Island, before declining further north, particularly in the warm temperate climates of Auckland and Northland. Increases in productivity also occurred in regions with high average root-zone water storage (e.g. Southland) and were reduced in drier areas such as the Canterbury plains. Thus, the overall gains in productivity between future plantations and the current estate were mainly attributable to the delineation of land in warmer and wetter areas. For example, the marked increase in productivity of future plantings, compared with those of current plantations within the Waikato region, was predominantly due to a shift in plantation location from the cooler interior to warmer coastal areas (Figure 4).
The results described here could be used at a range of different scales. The productivity maps reduce investor risk particularly within new areas for which there are sparse productivity data. Maps also provide useful information for regional planning. For instance, substantial areas of highly productive land with moderate to severe erosion risk were identified in the Gisborne and Manawatu-Wanganui regions. This information could be used to develop projections of afforestation that would facilitate planning around infra-structure requirements. At the national level productivity data could be used to develop spatially explicit afforestation area targets, to offset future emissions. This type of information could be used to make informed decisions at the national level on how to develop policy to expedite afforestation.
The distribution of current plantations reinforces the future afforestation scenarios described here. The majority of forest plantations have been historically sited on LUC classes 6 and 7, which agrees well with our identified scenarios. Although arable classes have been afforested previously, such plantations were established primarily on dryland sites on the Canterbury plains and in areas with now-corrected micro-nutrient (cobalt) deficiencies in the central North Island (Will, 1985). Because of the widespread current use of irrigation and advances in our understanding of agricultural nutrition, afforestation of arable land classes is unlikely to be repeated, and we consider these forests an historical anomaly. In support of this view, many of the forests located on the Canterbury plains have been very recently converted to farm and arable land. Within New Zealand arable crops and dairy farming generally provide better financial returns than forestry (Sinclair, et al., 2009) and this feature is likely to provide a disincentive to afforest high performing arable or dairy lands.
A number of assumptions have been made in the development of the maps shown in this paper. The key assumption is that Pinus radiata will be the main species used for afforestation. This assessment seems reasonable because P. radiata is a versatile and highly productive species that grows well across New
Watt et al.: New Zealand Journal of Forestry Science 41 (2011) 115-129 125
© 2011 New Zealand Forest Research Institute Limited, trading as Scion ISSN 0048 - 0134 (print) ISSN 1179-5395 (on-line)
Zealand’s environmental gradient (Cown, 1997; Turner & Lambert, 1986). Pinus radiata is highly effective at controlling erosion and provides the greatest returns under carbon forestry among New Zealand’s widely used commercial plantation species (Turner, et al., 2008). This methodology could be repeated for species other than P. radiata should spatial surfaces for these species become available. We also assumed afforestation of the entire land in LUC 8 class under all scenarios considered. Although it is unlikely that all of LUC class 8 land will be afforested, the development of a carbon market within New Zealand is likely to make afforestation of LUC 8 for catchment protection an attractive long term option. However, as LUC 8 land represents a very small proportion of the identified scenarios (between 0.9 to 3.8%), it is worth noting our analyses are relatively insensitive to this assumption. A further assumption was that productivity surfaces could be applied to eroded land. This seems reasonable because deep-seated mass-movement erosion generally represents a very low proportion of the total land area even for severely eroded landscapes (Lynn, et al., 2009).
In conclusion, our analyses in this paper has identified between ca. 0.7 M and 2.9 M ha of land that could potentially be afforested. Erosion severity was used to discriminate between scenarios because control of accelerated erosion is a major objective of afforestation in New Zealand. Compared to current plantations, all three scenarios showed an increase in productivity, at the national level.
Ackowledgements
We thank Peter Hall, Ian Nicholas, James Turner, Thomas Paul (Scion), and Mark Bloomberg (University of Canterbury) for their advice and assistance in the development of the future forest scenarios. This work was jointly funded through the MAF programme, Future Forest Systems (Contract No. CO4X0901), and the Future Forest Research contract ‘Positioning Future forests project (Contract No. C04X0806).
References
AsureQuality (2009). Retrieved 30 April 2010, from http://www.asurequality.com/geospatial-services/agribase-derived-products.cfm.
Cown, D. J. (1997). New Zealand forest management and wood quality trends. In S. Y. Zhang, R. Gosselin, & G. Chauret, G. (Eds.), Proceedings of the CTIA-IUFRO. Timber management toward wood quality and end-product value. International Wood Quality Workshop, Quebec City, Canada, August 18-22.
Brockerhoff, E. G., Jactel, H., Parrotta, J. A., Quine, C. P., & Sayer, J. (2008). Plantation forests and biodiversity: oxymoron or opportunity? Biodiversity and Conservation, 17(5), 925-951.
Dixon, R. K., Brown, S., Houghton, R. A., Solomon, A. M., Trexler, M. C., & Wisniewski, J. (1994). Carbon pools and flux of global forest ecosystems. Science, 263, 185-190.
Dymond, J. R., Ausseil, A. G., Shepherd, J. D., & Buettner, L. (2006). Validation of a region-wide model of landslide susceptibility in the Manawatu-Wanganui region of New Zealand. Geomorphology, 74(1-4), 70-79.
Ewers, R. M., Kliskey, A. D., Walker, S., Rutledge, D., Harding, J. S., & Didham, R. K. (2006). Past and future trajectories of forest loss in New Zealand. Biological Conservation, 133, 312-325.
Ford-Robertson, J. B. (1996). Estimating the net carbon balance of plantation forestry in New Zealand. Biomass and Bioenergy, 10(1), 7-10.
Giltrap, D., Aussiel, A.-G., Ekanayake, J., Pawson, S. M., Hall, P., Newsome, P., & Dymond, J. (2009). Environmental impacts of large-scale forestry for bioenergy. In P. Hall, & M. Jack (Eds.), Bioenergy Options for New Zealand - analysis of large-scale forestry for bioenergy. (Chapter 2; pp. 71-121). Rotorua, New Zealand: Scion.
Hengl, T., Heuvelink, G., & Stein, A. (2004). A generic framework for spatial prediction of soil variables based on regression-kriging. Geoderma, 120, 75-93.
Hicks, D. L. (1991). Erosion under pasture, pine plantations, scrub and indigenous forest: a comparison from cyclone Bola. New Zealand Journal of Forestry, 26, 21-22.
Höck, B., Payn, T., Clinton, P., & Turner, J. (2009). Towards green markets for New Zealand plantations. New Zealand Journal of Forestry, 54, 9 -18.
Horgan, G. (2007). Financial returns and forestry planting rates. Retrieved 30 April 2010, from www.maf.govt.nz/climatechange/forestry/ets/returns/returns-and-new-planting-rates.pdf.
Hunter, I. R., Rodgers, B. E., Dunningham, A., Prince, J. M., & Thorn, A. J. (1991). An atlas of radiata pine nutrition in New Zealand. (Forest Research Bulletin No. 165). Rotorua, New Zealand: Forest Research Institute.
Watt et al.: New Zealand Journal of Forestry Science 41 (2011) 115-129126
© 2011 New Zealand Forest Research Institute Limited, trading as Scion ISSN 0048 - 0134 (print) ISSN 1179-5395 (on-line)
Kimberley, M. O., West, G., Dean, M., & Knowles, L. (2005). Site Productivity: The 300 Index - a volume productivity index for radiata pine. New Zealand Journal of Forestry, 50, 13-18.
Landcare Research. (2010). Retrieved 30 April 2010, from http://www.landcareresearch.co.nz/databases/LENZ/products_poster.asp.
Leathwick, J., Morgan, F., Wilson, G., Rutledge, D., McLeod, M., & Johnston, K. (2002). Land environments of New Zealand: A technical guide. Hamilton New Zealand: Manaaki Whenua Landcare Research and Wellington, New Zealand: Ministry for the Environment.
Leathwick, J., Wilson, G., Rutledge, D., Wardle, P., Morgan, F., Johnston, K., McLeod, M., & Kirkpatrick, R. (2003). Land environments of New Zealand – Nga Taiao o Aotearoa. Auckland, New Zealand: David Bateman.
Leathwick, J. R., & Stephens, R. T. T. (1998). Climate surfaces for New Zealand. Landcare Research Contract Report LC9798/126. Lincoln, New Zealand: Landcare Research.
Lewis, N. B., & Ferguson, I. S. (1993). Management of radiata pine. Melbourne, Australia: Inkata Press.
Liebault, F., & Piegay, H. (2001). Assessment of channel changes due to long-term bedload supply decrease, Roubion River, France. Geomorphology, 36(3-4), 167-186.
Lynn, I. H., Manderson, A. K., Page, M. J., Harmsworth, G. R., Eyles, G. O., Douglas, G. B., Mackay, A. D., & Newsome, P. J. F. (2009). Land Use Capability survey handbook - a New Zealand handbook for the classification of land. 3rd Ed. Hamilton, New Zealand: Agresearch; Lincoln, New Zealand: Landcare Research; Lower Hutt, New Zealand: GNS Science.
Maclaren, J. P., Manley, B., & Final Year School of Forestry Students (2008). Impact of the New Zealand Emissions Trading Scheme on forest management. New Zealand Journal of Forestry, 53, 33-39.
Manley, B., & Maclaren, P. (2009). Modelling the impact of carbon trading legislation on New Zealand’s plantation estate. New Zealand Journal of Forestry, 54, 39-44.
Marden, M., Arnold, G., Gomez, B., & Rowan, D. (2005). Pre- and post-reforestation gully development in Mangatu Forest, east coast, North Island, New Zealand. River Research and Applications, 21(7), 757-771.
Mason, E. G. (2010). Impacts of the revised Emissions Trading Scheme on potential demand for carbon credits from new forest planting. New Zealand Journal of Forestry, 54, 12-15.
McGlone, M., Walker, S., Leathwick, J., & Briggs, C. (2004). Predicted Potential Natural Vegetation of New Zealand. [Poster and electronic data]. Retrieved 30 April 2010, from http://www.landcareresearch.co.nz/databases/lenz/products_poster.asp.
McGlone, M. S., & Wilmshurst, J. M. (1999). Dating initial Maori environmental impact in New Zealand. Quaternary International, 59, 5-16.
Ministry for the Environment (2007). Retrieved 16 May 2011, from http://www.mfe.govt.nz/issues/land/land-cover-dbase/classes.html.
Ministry for the Environment (2010). Land Use and Carbon Analysis System (LUCAS): Land use classes with woody biomass satellite imagery interpretation guide. Retrieved 29 April 2010 from http://koordinates.com/#/layer/1414-new-zealand-land-use-map-1990-2008-lum-v003/ <http://koordinates.com/>.
Mitchell, N. D. (1991). The derivation of climate surfaces for New Zealand, and their application to the bioclimatic analysis of the distribution of kauri (Agathis australis). Journal of the Royal Society of New Zealand, 21, 13-24.
New Zealand Forest Owners Association. (2007). New Zealand Forestry Industry, Facts and Figures 2006/2007. New Zealand Forest Owners Association, Wellington.
Newsome, P. J. F. (1987). The Vegetative Cover of New Zealand. (Water and Soil Miscellaneous Publication No. 112). Wellington, New Zealand: Ministry of Works and Development Soil Conservation Centre, Aokautere.
Newsome, P. J. F., Wilde, R. H., & Willoughby, E. J. (2000). Land resource information system spatial data layers. Volume 1: Label Format. Palmerston North, New Zealand: Landcare Research.
National Institute for Water and Atmosphere (NIWA) (2008). Retrieved 30 April 2010, from http://www.niwa.co.nz/our-science/freshwater/tools/rec.
National Water and Soil Conservation Organisation (NWASCO) (1970). Wise land use and community development. Report of technical committee of inquiry into the problems of the Poverty Bay-East Coast District of New
Watt et al.: New Zealand Journal of Forestry Science 41 (2011) 115-129 127
© 2011 New Zealand Forest Research Institute Limited, trading as Scion ISSN 0048 - 0134 (print) ISSN 1179-5395 (on-line)
Zealand. Wellington, New Zealand: Ministry of Works on behalf of the National Water and Soil Conservation Organisation by the Water and Soil Division.
National Water and Soil Conservation Organisation (NWASCO) (1979). Our Land Resources - a bulletin to accompany NZLRI worksheets. Wellington, New Zealand: National Water and Soil Conservation Organisation.
Odeh, I., & McBratney, A. (2000). Using AVHRR imageries for spatial prediction of clay content in the lower Namoi Valley of eastern Australia. Geoderma, 97, 237-254.
Page, M. J., Reid, L. M., & Lynn, I. H. (1999). Sediment production from Cyclone Bola landslides, Waipaoa catchment. Journal of Hydrology, 38, 289-308.
Palma, R. (2005). Social and environmental valuation as a tool for forest management. New Zealand Journal of Forestry Science, 50, 23-26.
Palmer, D. J. (2008). Development of national extent terrain attributes (TANZ), soil water balance surfaces (SWatBal), and environmental surfaces, and their application for spatial modelling of Pinus radiata productivity across New Zealand. Unpublished PhD thesis, University of Waikato, Hamilton, New Zealand.
Palmer, D. J., Höck, B. K., Dunningham, A. G., Lowe, D. J., & Payn, T. W. (2009). Developing national-scale terrain attributes for New Zealand (TANZ). (Forest Research Bulletin, 232). Rotorua, New Zealand: Forest Research Institute.
Palmer, D. J., Höck, B. K., Kimberley, M. O., Watt, M. S., Lowe, D. J., & Payn, T. W. (2009). Comparison of spatial prediction techniques for developing Pinus radiata productivity surfaces across New Zealand. Forest Ecology and Management, 258(9), 2046-2055.
Palmer, D. J., Watt, M. S., Höck, B. K., & Lowe, D. J. (2009). A dynamic framework for spatial modelling Pinus radiata soil water balance (SWatBal) across New Zealand. (Scion Bulletin 234). Rotorua, New Zealand: Scion Research.
Palmer, D. J., Watt, M. S., Kimberley, M., Höck, B. K., Payn, T. W., Lowe, D. J. (2010a). Mapping and explaining the productivity of Pinus radiata in New Zealand. New Zealand Journal of Forestry, 55(1), 15-21.
Palmer, D. J., Watt, M. S., Kimberley, M., Höck, B. K., Payn, T. W., Lowe, D. J. (2010b). Mapping the productivity of radiata pine. New Zealand Tree Grower, 31(2), 18-19.
Piegay, H., & Salvador, P. G. (1997). Contemporary floodplain forest evolution along the middle Ubaye river, southern Alps, France. Global Ecology and Biogeography Letters, 6(5), 397-406.
Richardson, B., Skinner, M. F., & West, G. (1999). The role of forest productivity in defining the sustainability of plantation forests in New Zealand. Forest Ecology and Management, 122(1/2), 125-137.
Soil Conservation and Rivers Control Council (SCRCC). (1974). Land Use Capability survey handbook. A New Zealand handbook for the classification of land. Wellington, New Zealand: Soil Conservation and Rivers Control Council.
Sinclair, S., Turner, J. A., Schnell, J., Smeaton, D., & Glennie, S. (2009). Management of carbon price exposure in the agricultural sector through the use of post-1989 forestry - case studies based on farmer data, attitudes and actions. (Report prepared for the Ministry of Agriculture and Forestry). Hamilton, New Zealand: AgResearch. Retrieved 29 April 2010, from http://www.maf.govt.nz/climatechange/reports/management-of-carbon-price-exposure-feb-2010.pdf.
Tait, A., Henderson, R., Turner, R., & Zheng, Z. (2006). Thin plate smoothing interpolation of daily rainfall for New Zealand using a climatological rainfall surface. International Journal of Climatology, 26, 2097-2115.
Thompson, S., Gruner, I., & Gapare, N. (2003). New Zealand Land Cover Database Version 2 - Illustrated Guide to Target Classes. Technical User Guide Version 4.0_April 2004. Wellington, New Zealand: Ministry for the Environment. Retrieved 30 April 2010 from http://www.mfe.govt.nz/issues/land/land-cover-dbase/.
Turner, J., & Lambert, M. J. (1986). Nutrition and nutritional relationships of Pinus radiata. Annual Review of Ecology and Systematics, 17, 325-350.
Turner, J. A., West, G., Dungey, H., Wakelin, S., Maclaren, P., Adams, T., & Silcock, P. (2008). Managing New Zealand planted forests for carbon: A review of selected management
128 Watt et al.: New Zealand Journal of Forestry Science 41 (2011) 115-129
© 2011 New Zealand Forest Research Institute Limited, trading as Scion ISSN 0048 - 0134 (print) ISSN 1179-5395 (on-line)
scenarios and identification of knowledge gaps. MAF Report No. CC MAF POL_2008-09 (108-1). Wellington, New Zealand: Ministry of Agriculture and Forestry.
Watt, M. S., Palmer, D. J., Dungey, H., & Kimberley, M. O. (2009). Predicting the spatial distribution of Cupressus lusitanica productivity in New Zealand. Forest Ecology and Management, 258(3), 217-223.
Will, G. M. (1985). Nutrient deficiencies and fertiliser use in New Zealand exotic forests (Forest Research Institute Bulletin No 97.). Rotorua, New Zealand: Forest Research Institute.
Wilmshurst, J., Anderson, A., Higham, T., & Worthy, T. (2008). Dating the late prehistoric dispersal of Polynesians to New Zealand using the commmensal Pacific rat. Proceedings of the National Academy of Sciences of the United States of America, 105, 7676-7680.
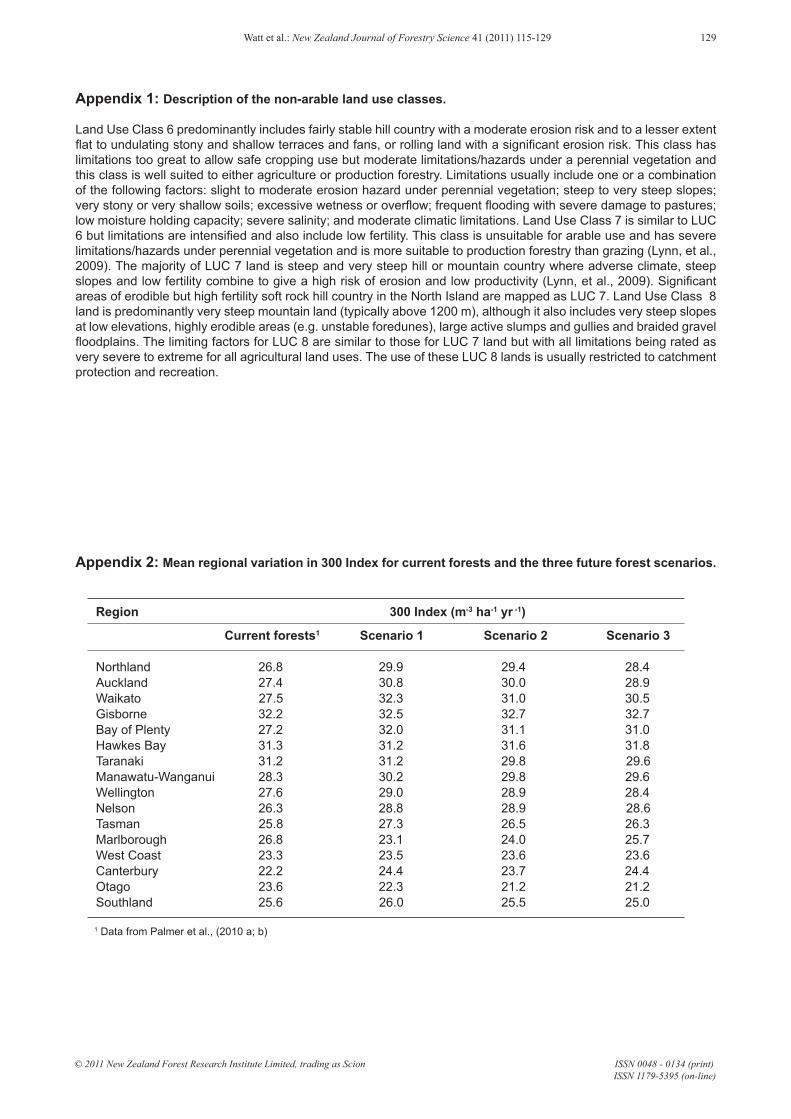
Northland 26.8 29.9 29.4 28.4Auckland 27.4 30.8 30.0 28.9Waikato 27.5 32.3 31.0 30.5Gisborne 32.2 32.5 32.7 32.7Bay of Plenty 27.2 32.0 31.1 31.0Hawkes Bay 31.3 31.2 31.6 31.8Taranaki 31.2 31.2 29.8 29.6Manawatu-Wanganui 28.3 30.2 29.8 29.6Wellington 27.6 29.0 28.9 28.4Nelson 26.3 28.8 28.9 28.6Tasman 25.8 27.3 26.5 26.3Marlborough 26.8 23.1 24.0 25.7West Coast 23.3 23.5 23.6 23.6Canterbury 22.2 24.4 23.7 24.4Otago 23.6 22.3 21.2 21.2Southland 25.6 26.0 25.5 25.0
Region 300 Index (m-3 ha-1 yr -1)
Current forests1 Scenario 1 Scenario 2 Scenario 3
1 Data from Palmer et al., (2010 a; b)
Appendix 1: Description of the non-arable land use classes.
Land Use Class 6 predominantly includes fairly stable hill country with a moderate erosion risk and to a lesser extent flat to undulating stony and shallow terraces and fans, or rolling land with a significant erosion risk. This class has limitations too great to allow safe cropping use but moderate limitations/hazards under a perennial vegetation and this class is well suited to either agriculture or production forestry. Limitations usually include one or a combination of the following factors: slight to moderate erosion hazard under perennial vegetation; steep to very steep slopes; very stony or very shallow soils; excessive wetness or overflow; frequent flooding with severe damage to pastures; low moisture holding capacity; severe salinity; and moderate climatic limitations. Land Use Class 7 is similar to LUC 6 but limitations are intensified and also include low fertility. This class is unsuitable for arable use and has severe limitations/hazards under perennial vegetation and is more suitable to production forestry than grazing (Lynn, et al., 2009). The majority of LUC 7 land is steep and very steep hill or mountain country where adverse climate, steep slopes and low fertility combine to give a high risk of erosion and low productivity (Lynn, et al., 2009). Significant areas of erodible but high fertility soft rock hill country in the North Island are mapped as LUC 7. Land Use Class 8 land is predominantly very steep mountain land (typically above 1200 m), although it also includes very steep slopes at low elevations, highly erodible areas (e.g. unstable foredunes), large active slumps and gullies and braided gravel floodplains. The limiting factors for LUC 8 are similar to those for LUC 7 land but with all limitations being rated as very severe to extreme for all agricultural land uses. The use of these LUC 8 lands is usually restricted to catchment protection and recreation.
Appendix 2: Mean regional variation in 300 Index for current forests and the three future forest scenarios.
Watt et al.: New Zealand Journal of Forestry Science 41 (2011) 115-129
© 2011 New Zealand Forest Research Institute Limited, trading as Scion ISSN 0048 - 0134 (print) ISSN 1179-5395 (on-line)
129