NEW ZEALAND CUSTOMS SERVICE - What Happened to · PDF filethe time it takes the New Zealand...
28
NEW ZEALAND CUSTOMS SERVICE TIME RELEASE STUDY 2010
Transcript of NEW ZEALAND CUSTOMS SERVICE - What Happened to · PDF filethe time it takes the New Zealand...

NEW ZEALAND CUSTOMS SERVICE TIME RELEASE STUDY 2010

2 Time Release Study 2010Time Release Study 2010

New Zealand Customs Service 1
NEW ZEALAND CUSTOMS SERVICE TIME RELEASE STUDY 2010
2 Time Release Study 2010
The TRS project team would like to thank all those who contributed to the study and in particular acknowledge the following:
ACKNOWLEDGEMENTS Ports of Auckland, Auckland Port of Tauranga, TaurangaPort of Napier, NapierPort Taranaki, New PlymouthCentrePort, Wellington
Port Nelson, NelsonLyttelton Port Company, ChristchurchPrimePort Timaru, TimaruPort Otago, DunedinSouth Port NZ, Bluff
You can download this publication from www.customs.govt.nz
ADDITIONAL COPIES, FEEDBACK AND CONTACT DETAILS
If you wish to provide feedback, information and views that could be useful to this publication, please contact:
While every effort has been made to ensure the information in this publication is accurate, the New Zealand Customs Service does not accept any responsibility or liability for error of fact, omission, interpretation, or opinion that may be present, nor for the consequences of any decisions
DISCLAIMERbased on this information. Any view or opinion expressed does not necessarily represent the view of the New Zealand Customs Service.
While the New Zealand Customs Service has exercised all reasonable skill and care in the preparation of
information in this report, it does not accept any liability in contract, tort or otherwise for any loss, damage, injury, or expense, whether direct, indirect or consequential, arising out of the provision of information in this report.
Manager, Operations Strategy and SupportNew Zealand Customs ServicePO Box 2218Wellington 6140New Zealand
2
Sharon Lin, Operations Analyst
Time Release Study 2010
New Zealand Customs Service 3
EXECUTIVE SUMMARY ............................................................................. 4Purpose of the 2010 study ............................................................................... 4Comparison of key results from 2010 and 2009 ............................................ 4Key findings from the 2010 study ................................................................... 5Opportunities for improvement ...................................................................... 6
SECTION ONE ........................................................................................... 7Introduction and purpose ................................................................................ 7Objectives and contribution ............................................................................. 7Methodology and scope ................................................................................... 7
SECTION TWO .......................................................................................... 8Analysis of sea cargo ........................................................................................ 8
Imports ........................................................................................................... 8Exports ......................................................................................................... 10SES analysis .................................................................................................. 12
SECTION THREE ......................................................................................13Analysis of air cargo ....................................................................................... 13
Imports ......................................................................................................... 13Exports ......................................................................................................... 14
SECTION FOUR .......................................................................................15Findings and opportunities ............................................................................ 15Key findings from the study .......................................................................... 15Opportunities for improvement .................................................................... 16
SECTION FIVE .........................................................................................17Conclusion ....................................................................................................... 17
APPENDICES ...........................................................................................18Appendix A: Scope of project ....................................................................... 18Appendix B: Definitions, glossary, and exclusions ....................................... 19Appendix C: Vessel and aircraft details ......................................................... 21Appendix D: Entry lodgement day ................................................................ 22Appendix E: Containerised cargo charts ....................................................... 23
TABLE OF CONTENTS
4 Time Release Study 2010
EXECUTIVE SUMMARY
PURPOSE OF THE 2010 STUDY
COMPARISON OF KEY RESULTS FROM 2010 AND 2009
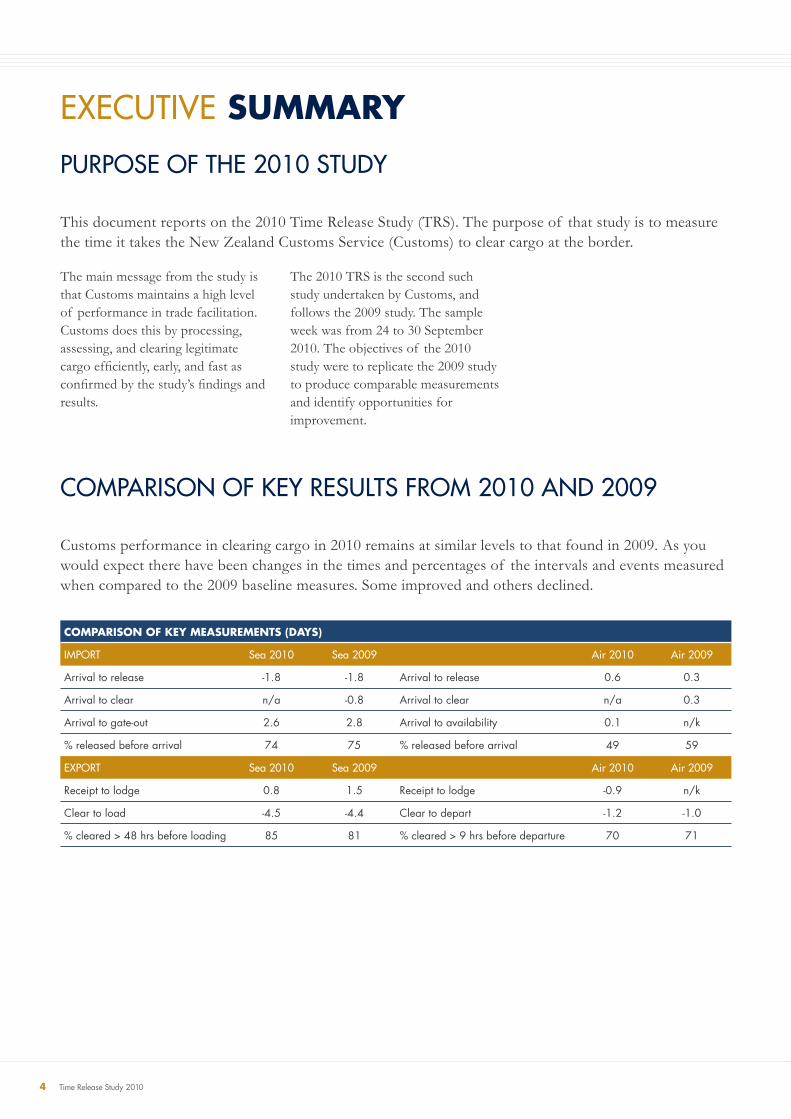
The main message from the study is that Customs maintains a high level of performance in trade facilitation. Customs does this by processing, assessing, and clearing legitimate cargo effi ciently, early, and fast as confi rmed by the study’s fi ndings and results.
COMPARISON OF KEY MEASUREMENTS (DAYS)
IMPORT Sea 2010 Sea 2009 Air 2010 Air 2009
Arrival to release -1.8 -1.8 Arrival to release 0.6 0.3
Arrival to clear n/a -0.8 Arrival to clear n/a 0.3
Arrival to gate-out 2.6 2.8 Arrival to availability 0.1 n/k
% released before arrival 74 75 % released before arrival 49 59
EXPORT Sea 2010 Sea 2009 Air 2010 Air 2009
Receipt to lodge 0.8 1.5 Receipt to lodge -0.9 n/k
Clear to load -4.5 -4.4 Clear to depart -1.2 -1.0
% cleared > 48 hrs before loading 85 81 % cleared > 9 hrs before departure 70 71
Customs performance in clearing cargo in 2010 remains at similar levels to that found in 2009. As you would expect there have been changes in the times and percentages of the intervals and events measured when compared to the 2009 baseline measures. Some improved and others declined.
This document reports on the 2010 Time Release Study (TRS). The purpose of that study is to measure the time it takes the New Zealand Customs Service (Customs) to clear cargo at the border.
The 2010 TRS is the second such study undertaken by Customs, and follows the 2009 study. The sample week was from 24 to 30 September 2010. The objectives of the 2010 study were to replicate the 2009 study to produce comparable measurements and identify opportunities for improvement.
New Zealand Customs Service 5
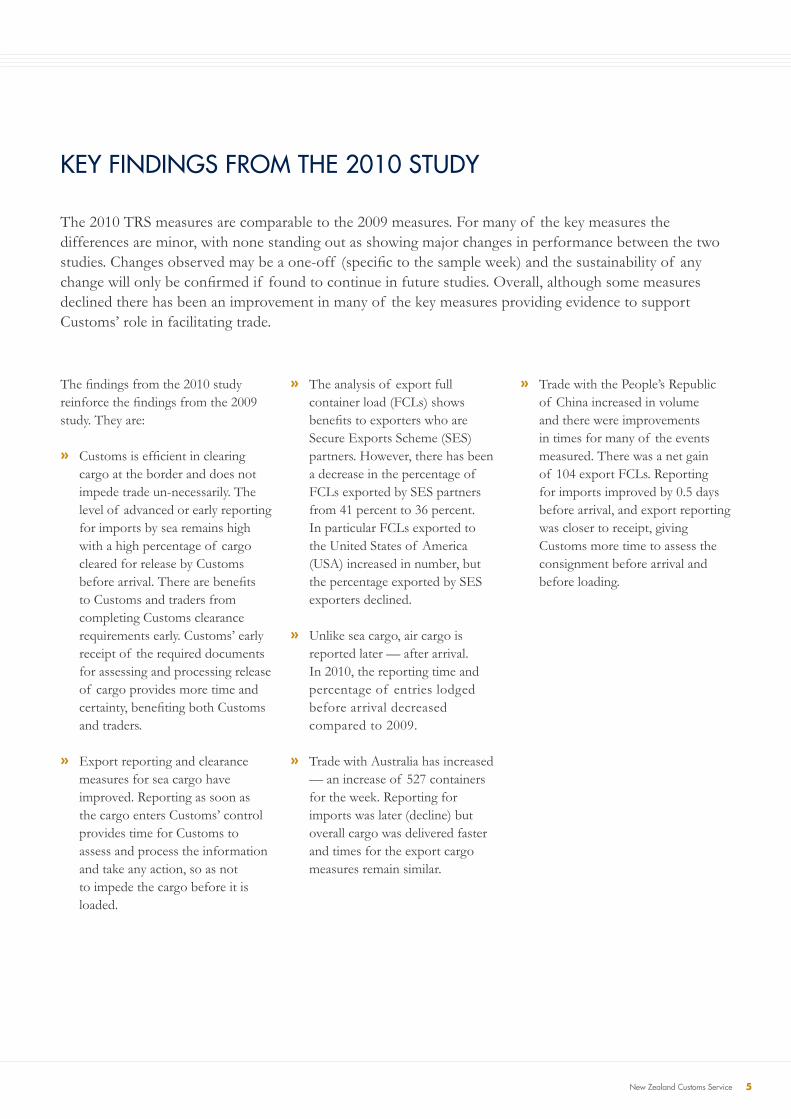
KEY FINDINGS FROM THE 2010 STUDY
The 2010 TRS measures are comparable to the 2009 measures. For many of the key measures the differences are minor, with none standing out as showing major changes in performance between the two studies. Changes observed may be a one-off (specifi c to the sample week) and the sustainability of any change will only be confi rmed if found to continue in future studies. Overall, although some measures declined there has been an improvement in many of the key measures providing evidence to support Customs’ role in facilitating trade.
The fi ndings from the 2010 study reinforce the fi ndings from the 2009 study. They are:
» Customs is effi cient in clearing cargo at the border and does not impede trade un-necessarily. The level of advanced or early reporting for imports by sea remains high with a high percentage of cargo cleared for release by Customs before arrival. There are benefi ts to Customs and traders from completing Customs clearance requirements early. Customs’ early receipt of the required documents for assessing and processing release of cargo provides more time and certainty, benefi ting both Customs and traders.
» Export reporting and clearance measures for sea cargo have improved. Reporting as soon as the cargo enters Customs’ control provides time for Customs to assess and process the information and take any action, so as not to impede the cargo before it is loaded.
» The analysis of export full container load (FCLs) shows benefi ts to exporters who are Secure Exports Scheme (SES) partners. However, there has been a decrease in the percentage of FCLs exported by SES partners from 41 percent to 36 percent. In particular FCLs exported to the United States of America (USA) increased in number, but the percentage exported by SES exporters declined.
» Unlike sea cargo, air cargo is reported later — after arrival. In 2010, the reporting time and percentage of entries lodged before arrival decreased compared to 2009.
» Trade with Australia has increased — an increase of 527 containers for the week. Reporting for imports was later (decline) but overall cargo was delivered faster and times for the export cargo measures remain similar.
» Trade with the People’s Republic of China increased in volume and there were improvements in times for many of the events measured. There was a net gain of 104 export FCLs. Reporting for imports improved by 0.5 days before arrival, and export reporting was closer to receipt, giving Customs more time to assess the consignment before arrival and before loading.
6 Time Release Study 2010
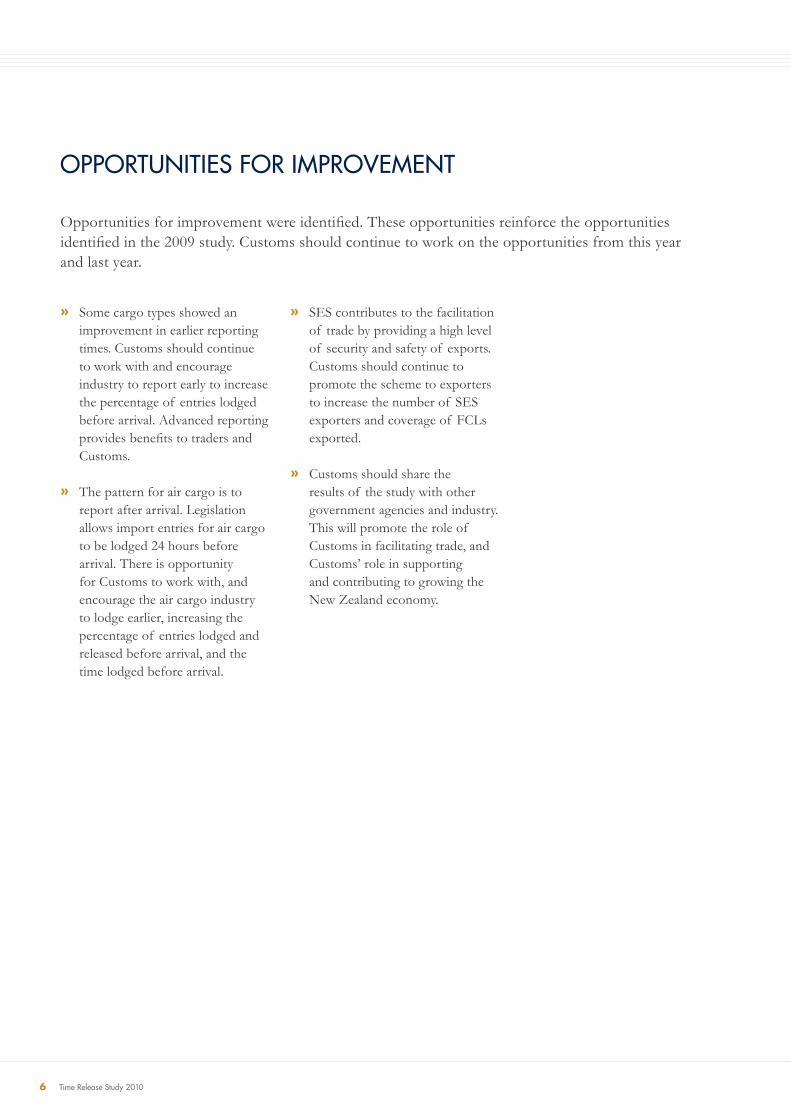
OPPORTUNITIES FOR IMPROVEMENT
» Some cargo types showed an improvement in earlier reporting times. Customs should continue to work with and encourage industry to report early to increase the percentage of entries lodged before arrival. Advanced reporting provides benefi ts to traders and Customs.
» The pattern for air cargo is to report after arrival. Legislation allows import entries for air cargo to be lodged 24 hours before arrival. There is opportunity for Customs to work with, and encourage the air cargo industry to lodge earlier, increasing the percentage of entries lodged and released before arrival, and the time lodged before arrival.
» SES contributes to the facilitation of trade by providing a high level of security and safety of exports. Customs should continue to promote the scheme to exporters to increase the number of SES exporters and coverage of FCLs exported.
» Customs should share the results of the study with other government agencies and industry. This will promote the role of Customs in facilitating trade, and Customs’ role in supporting and contributing to growing the New Zealand economy.
Opportunities for improvement were identifi ed. These opportunities reinforce the opportunities identifi ed in the 2009 study. Customs should continue to work on the opportunities from this year and last year.
New Zealand Customs Service 7
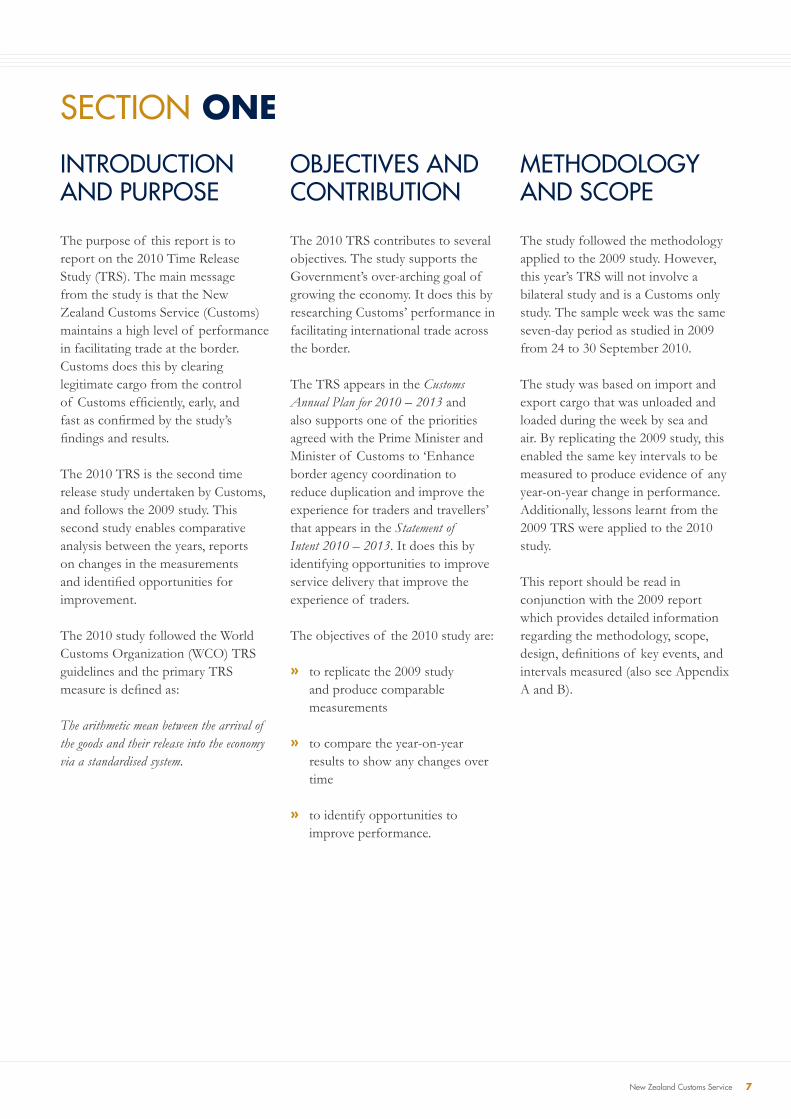
SECTION ONE
The purpose of this report is to report on the 2010 Time Release Study (TRS). The main message from the study is that the New Zealand Customs Service (Customs) maintains a high level of performance in facilitating trade at the border. Customs does this by clearing legitimate cargo from the control of Customs effi ciently, early, and fast as confi rmed by the study’s fi ndings and results.
The 2010 TRS is the second time release study undertaken by Customs, and follows the 2009 study. This second study enables comparative analysis between the years, reports on changes in the measurements and identifi ed opportunities for improvement.
The 2010 study followed the World Customs Organization (WCO) TRS guidelines and the primary TRS measure is defi ned as:
The arithmetic mean between the arrival of the goods and their release into the economy via a standardised system.
The 2010 TRS contributes to several objectives. The study supports the Government’s over-arching goal of growing the economy. It does this by researching Customs’ performance in facilitating international trade across the border.
The TRS appears in the Customs Annual Plan for 2010 – 2013 and also supports one of the priorities agreed with the Prime Minister and Minister of Customs to ‘Enhance border agency coordination to reduce duplication and improve the experience for traders and travellers’ that appears in the Statement of Intent 2010 – 2013. It does this by identifying opportunities to improve service delivery that improve the experience of traders.
The objectives of the 2010 study are:
» to replicate the 2009 study and produce comparable measurements
» to compare the year-on-year results to show any changes over time
» to identify opportunities to improve performance.
The study followed the methodology applied to the 2009 study. However, this year’s TRS will not involve a bilateral study and is a Customs only study. The sample week was the same seven-day period as studied in 2009 from 24 to 30 September 2010.
The study was based on import and export cargo that was unloaded and loaded during the week by sea and air. By replicating the 2009 study, this enabled the same key intervals to be measured to produce evidence of any year-on-year change in performance. Additionally, lessons learnt from the 2009 TRS were applied to the 2010 study.
This report should be read in conjunction with the 2009 report which provides detailed information regarding the methodology, scope, design, defi nitions of key events, and intervals measured (also see Appendix A and B).
INTRODUCTION AND PURPOSE
OBJECTIVES AND CONTRIBUTION
METHODOLOGY AND SCOPE
8 Time Release Study 2010
SECTION TWO
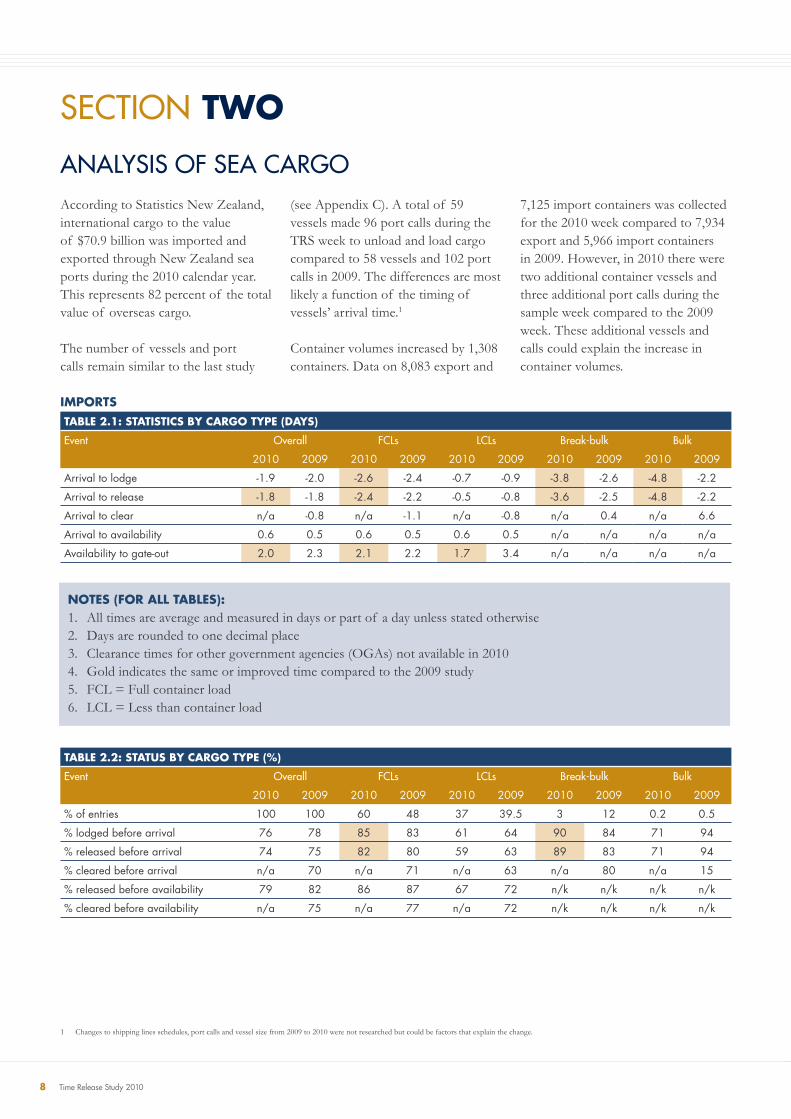
According to Statistics New Zealand, international cargo to the value of $70.9 billion was imported and exported through New Zealand sea ports during the 2010 calendar year. This represents 82 percent of the total value of overseas cargo.
The number of vessels and port calls remain similar to the last study
ANALYSIS OF SEA CARGO(see Appendix C). A total of 59 vessels made 96 port calls during the TRS week to unload and load cargo compared to 58 vessels and 102 port calls in 2009. The differences are most likely a function of the timing of vessels’ arrival time.1
Container volumes increased by 1,308 containers. Data on 8,083 export and
7,125 import containers was collected for the 2010 week compared to 7,934 export and 5,966 import containers in 2009. However, in 2010 there were two additional container vessels and three additional port calls during the sample week compared to the 2009 week. These additional vessels and calls could explain the increase in container volumes.
IMPORTSTABLE 2.1: STATISTICS BY CARGO TYPE (DAYS)
Event Overall FCLs LCLs Break-bulk Bulk
2010 2009 2010 2009 2010 2009 2010 2009 2010 2009
Arrival to lodge -1.9 -2.0 -2.6 -2.4 -0.7 -0.9 -3.8 -2.6 -4.8 -2.2
Arrival to release -1.8 -1.8 -2.4 -2.2 -0.5 -0.8 -3.6 -2.5 -4.8 -2.2
Arrival to clear n/a -0.8 n/a -1.1 n/a -0.8 n/a 0.4 n/a 6.6
Arrival to availability 0.6 0.5 0.6 0.5 0.6 0.5 n/a n/a n/a n/a
Availability to gate-out 2.0 2.3 2.1 2.2 1.7 3.4 n/a n/a n/a n/a
TABLE 2.2: STATUS BY CARGO TYPE (%)
Event Overall FCLs LCLs Break-bulk Bulk
2010 2009 2010 2009 2010 2009 2010 2009 2010 2009
% of entries 100 100 60 48 37 39.5 3 12 0.2 0.5
% lodged before arrival 76 78 85 83 61 64 90 84 71 94
% released before arrival 74 75 82 80 59 63 89 83 71 94
% cleared before arrival n/a 70 n/a 71 n/a 63 n/a 80 n/a 15
% released before availability 79 82 86 87 67 72 n/k n/k n/k n/k
% cleared before availability n/a 75 n/a 77 n/a 72 n/k n/k n/k n/k
NOTES (FOR ALL TABLES):1. All times are average and measured in days or part of a day unless stated otherwise2. Days are rounded to one decimal place3. Clearance times for other government agencies (OGAs) not available in 20104. Gold indicates the same or improved time compared to the 2009 study5. FCL = Full container load6. LCL = Less than container load
1 Changes to shipping lines schedules, port calls and vessel size from 2009 to 2010 were not researched but could be factors that explain the change.
New Zealand Customs Service 9
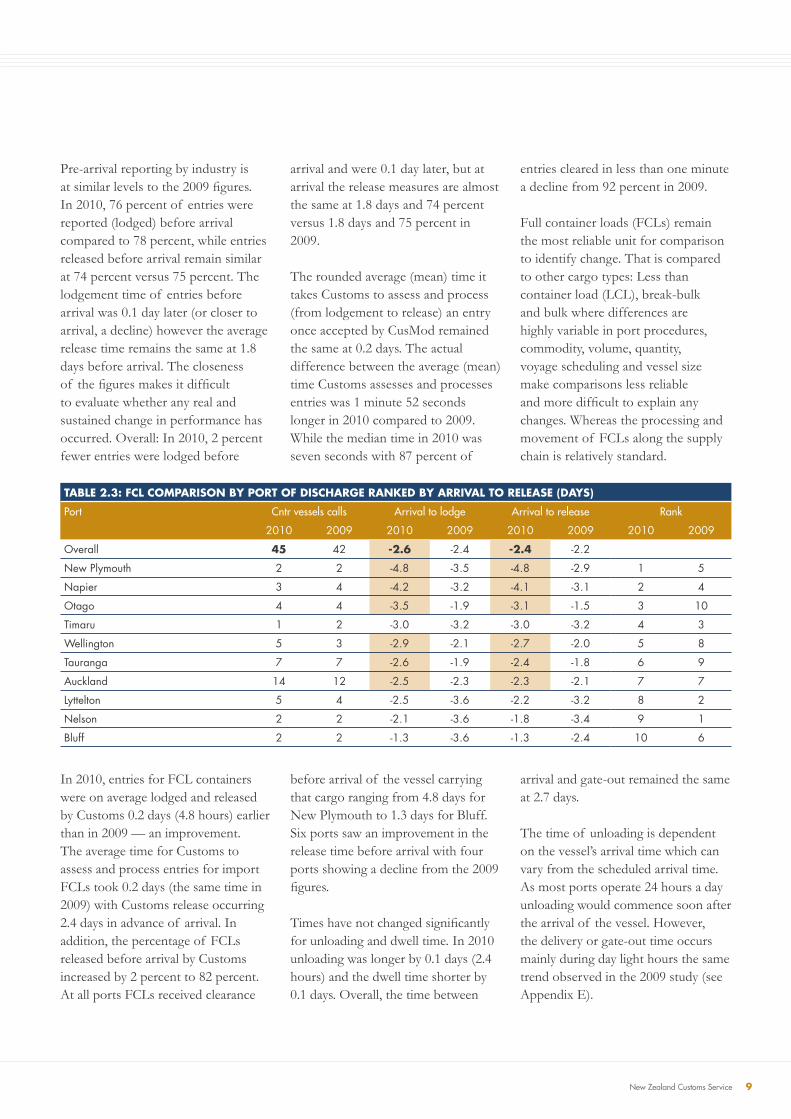
Pre-arrival reporting by industry is at similar levels to the 2009 fi gures. In 2010, 76 percent of entries were reported (lodged) before arrival compared to 78 percent, while entries released before arrival remain similar at 74 percent versus 75 percent. The lodgement time of entries before arrival was 0.1 day later (or closer to arrival, a decline) however the average release time remains the same at 1.8 days before arrival. The closeness of the fi gures makes it diffi cult to evaluate whether any real and sustained change in performance has occurred. Overall: In 2010, 2 percent fewer entries were lodged before
arrival and were 0.1 day later, but at arrival the release measures are almost the same at 1.8 days and 74 percent versus 1.8 days and 75 percent in 2009.
The rounded average (mean) time it takes Customs to assess and process (from lodgement to release) an entry once accepted by CusMod remained the same at 0.2 days. The actual difference between the average (mean) time Customs assesses and processes entries was 1 minute 52 seconds longer in 2010 compared to 2009. While the median time in 2010 was seven seconds with 87 percent of
entries cleared in less than one minute a decline from 92 percent in 2009.
Full container loads (FCLs) remain the most reliable unit for comparison to identify change. That is compared to other cargo types: Less than container load (LCL), break-bulk and bulk where differences are highly variable in port procedures, commodity, volume, quantity, voyage scheduling and vessel size make comparisons less reliable and more diffi cult to explain any changes. Whereas the processing and movement of FCLs along the supply chain is relatively standard.
TABLE 2.3: FCL COMPARISON BY PORT OF DISCHARGE RANKED BY ARRIVAL TO RELEASE (DAYS)
Port Cntr vessels calls Arrival to lodge Arrival to release Rank
2010 2009 2010 2009 2010 2009 2010 2009
Overall 45 42 -2.6 -2.4 -2.4 -2.2
New Plymouth 2 2 -4.8 -3.5 -4.8 -2.9 1 5
Napier 3 4 -4.2 -3.2 -4.1 -3.1 2 4
Otago 4 4 -3.5 -1.9 -3.1 -1.5 3 10
Timaru 1 2 -3.0 -3.2 -3.0 -3.2 4 3
Wellington 5 3 -2.9 -2.1 -2.7 -2.0 5 8
Tauranga 7 7 -2.6 -1.9 -2.4 -1.8 6 9
Auckland 14 12 -2.5 -2.3 -2.3 -2.1 7 7
Lyttelton 5 4 -2.5 -3.6 -2.2 -3.2 8 2
Nelson 2 2 -2.1 -3.6 -1.8 -3.4 9 1
Bluff 2 2 -1.3 -3.6 -1.3 -2.4 10 6
In 2010, entries for FCL containers were on average lodged and released by Customs 0.2 days (4.8 hours) earlier than in 2009 — an improvement. The average time for Customs to assess and process entries for import FCLs took 0.2 days (the same time in 2009) with Customs release occurring 2.4 days in advance of arrival. In addition, the percentage of FCLs released before arrival by Customs increased by 2 percent to 82 percent. At all ports FCLs received clearance
before arrival of the vessel carrying that cargo ranging from 4.8 days for New Plymouth to 1.3 days for Bluff. Six ports saw an improvement in the release time before arrival with four ports showing a decline from the 2009 fi gures.
Times have not changed signifi cantly for unloading and dwell time. In 2010 unloading was longer by 0.1 days (2.4 hours) and the dwell time shorter by 0.1 days. Overall, the time between
arrival and gate-out remained the same at 2.7 days.
The time of unloading is dependent on the vessel’s arrival time which can vary from the scheduled arrival time. As most ports operate 24 hours a day unloading would commence soon after the arrival of the vessel. However, the delivery or gate-out time occurs mainly during day light hours the same trend observed in the 2009 study (see Appendix E).
10 Time Release Study 2010
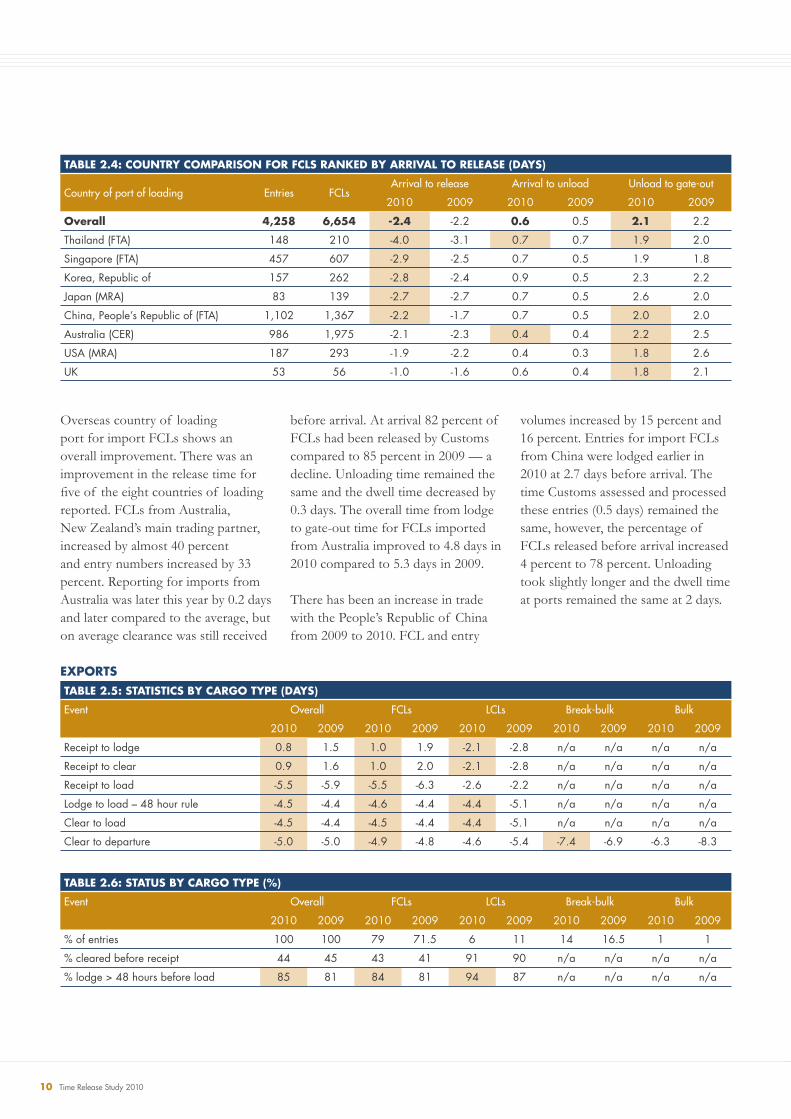
Overseas country of loading port for import FCLs shows an overall improvement. There was an improvement in the release time for fi ve of the eight countries of loading reported. FCLs from Australia, New Zealand’s main trading partner, increased by almost 40 percent and entry numbers increased by 33 percent. Reporting for imports from Australia was later this year by 0.2 days and later compared to the average, but on average clearance was still received
before arrival. At arrival 82 percent of FCLs had been released by Customs compared to 85 percent in 2009 — a decline. Unloading time remained the same and the dwell time decreased by 0.3 days. The overall time from lodge to gate-out time for FCLs imported from Australia improved to 4.8 days in 2010 compared to 5.3 days in 2009.
There has been an increase in trade with the People’s Republic of China from 2009 to 2010. FCL and entry
volumes increased by 15 percent and 16 percent. Entries for import FCLs from China were lodged earlier in 2010 at 2.7 days before arrival. The time Customs assessed and processed these entries (0.5 days) remained the same, however, the percentage of FCLs released before arrival increased 4 percent to 78 percent. Unloading took slightly longer and the dwell time at ports remained the same at 2 days.
EXPORTSTABLE 2.5: STATISTICS BY CARGO TYPE (DAYS)
Event Overall FCLs LCLs Break-bulk Bulk
2010 2009 2010 2009 2010 2009 2010 2009 2010 2009
Receipt to lodge 0.8 1.5 1.0 1.9 -2.1 -2.8 n/a n/a n/a n/a
Receipt to clear 0.9 1.6 1.0 2.0 -2.1 -2.8 n/a n/a n/a n/a
Receipt to load -5.5 -5.9 -5.5 -6.3 -2.6 -2.2 n/a n/a n/a n/a
Lodge to load – 48 hour rule -4.5 -4.4 -4.6 -4.4 -4.4 -5.1 n/a n/a n/a n/a
Clear to load -4.5 -4.4 -4.5 -4.4 -4.4 -5.1 n/a n/a n/a n/a
Clear to departure -5.0 -5.0 -4.9 -4.8 -4.6 -5.4 -7.4 -6.9 -6.3 -8.3
TABLE 2.6: STATUS BY CARGO TYPE (%)
Event Overall FCLs LCLs Break-bulk Bulk
2010 2009 2010 2009 2010 2009 2010 2009 2010 2009
% of entries 100 100 79 71.5 6 11 14 16.5 1 1
% cleared before receipt 44 45 43 41 91 90 n/a n/a n/a n/a
% lodge > 48 hours before load 85 81 84 81 94 87 n/a n/a n/a n/a
TABLE 2.4: COUNTRY COMPARISON FOR FCLS RANKED BY ARRIVAL TO RELEASE (DAYS)
Country of port of loading Entries FCLsArrival to release Arrival to unload Unload to gate-out
2010 2009 2010 2009 2010 2009
Overall 4,258 6,654 -2.4 -2.2 0.6 0.5 2.1 2.2
Thailand (FTA) 148 210 -4.0 -3.1 0.7 0.7 1.9 2.0
Singapore (FTA) 457 607 -2.9 -2.5 0.7 0.5 1.9 1.8
Korea, Republic of 157 262 -2.8 -2.4 0.9 0.5 2.3 2.2
Japan (MRA) 83 139 -2.7 -2.7 0.7 0.5 2.6 2.0
China, People’s Republic of (FTA) 1,102 1,367 -2.2 -1.7 0.7 0.5 2.0 2.0
Australia (CER) 986 1,975 -2.1 -2.3 0.4 0.4 2.2 2.5
USA (MRA) 187 293 -1.9 -2.2 0.4 0.3 1.8 2.6
UK 53 56 -1.0 -1.6 0.6 0.4 1.8 2.1
New Zealand Customs Service 11
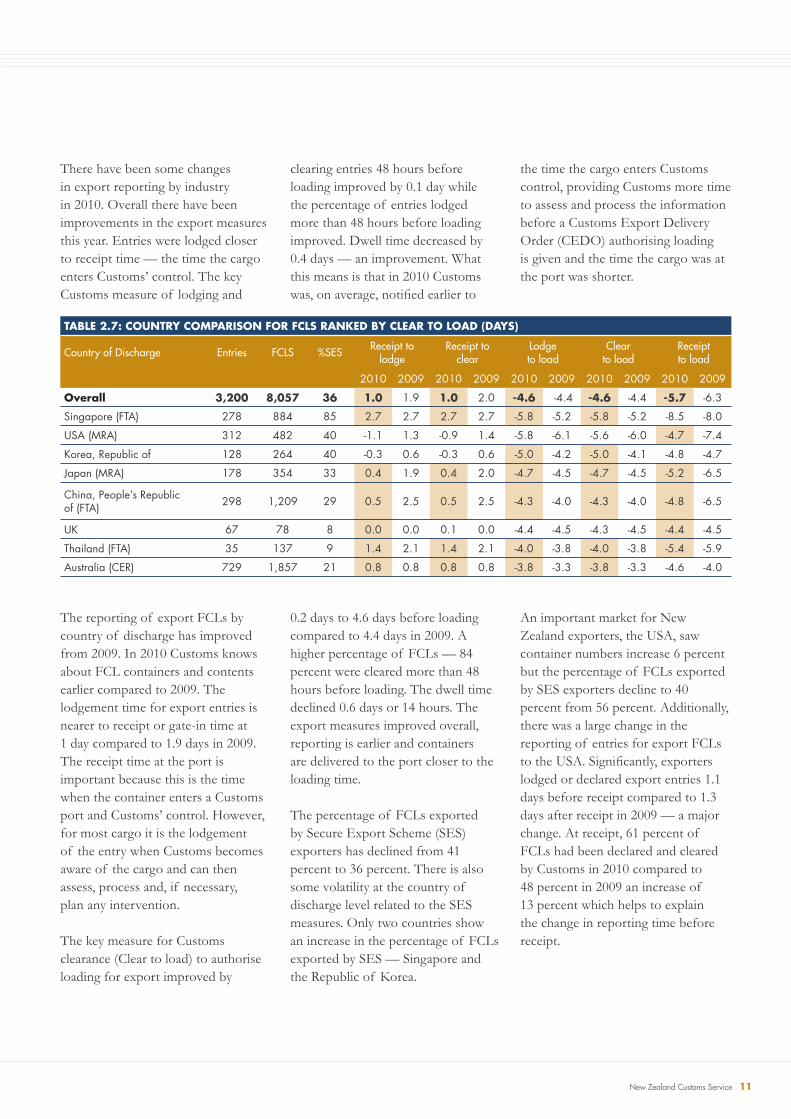
There have been some changes in export reporting by industry in 2010. Overall there have been improvements in the export measures this year. Entries were lodged closer to receipt time — the time the cargo enters Customs’ control. The key Customs measure of lodging and
clearing entries 48 hours before loading improved by 0.1 day while the percentage of entries lodged more than 48 hours before loading improved. Dwell time decreased by 0.4 days — an improvement. What this means is that in 2010 Customs was, on average, notifi ed earlier to
the time the cargo enters Customs control, providing Customs more time to assess and process the information before a Customs Export Delivery Order (CEDO) authorising loading is given and the time the cargo was at the port was shorter.
TABLE 2.7: COUNTRY COMPARISON FOR FCLS RANKED BY CLEAR TO LOAD (DAYS)
Country of Discharge Entries FCLS %SES Receipt to lodge
Receipt to clear
Lodge to load
Clear to load
Receipt to load
2010 2009 2010 2009 2010 2009 2010 2009 2010 2009
Overall 3,200 8,057 36 1.0 1.9 1.0 2.0 -4.6 -4.4 -4.6 -4.4 -5.7 -6.3
Singapore (FTA) 278 884 85 2.7 2.7 2.7 2.7 -5.8 -5.2 -5.8 -5.2 -8.5 -8.0
USA (MRA) 312 482 40 -1.1 1.3 -0.9 1.4 -5.8 -6.1 -5.6 -6.0 -4.7 -7.4
Korea, Republic of 128 264 40 -0.3 0.6 -0.3 0.6 -5.0 -4.2 -5.0 -4.1 -4.8 -4.7
Japan (MRA) 178 354 33 0.4 1.9 0.4 2.0 -4.7 -4.5 -4.7 -4.5 -5.2 -6.5
China, People’s Republic of (FTA) 298 1,209 29 0.5 2.5 0.5 2.5 -4.3 -4.0 -4.3 -4.0 -4.8 -6.5
UK 67 78 8 0.0 0.0 0.1 0.0 -4.4 -4.5 -4.3 -4.5 -4.4 -4.5
Thailand (FTA) 35 137 9 1.4 2.1 1.4 2.1 -4.0 -3.8 -4.0 -3.8 -5.4 -5.9
Australia (CER) 729 1,857 21 0.8 0.8 0.8 0.8 -3.8 -3.3 -3.8 -3.3 -4.6 -4.0
The reporting of export FCLs by country of discharge has improved from 2009. In 2010 Customs knows about FCL containers and contents earlier compared to 2009. The lodgement time for export entries is nearer to receipt or gate-in time at 1 day compared to 1.9 days in 2009. The receipt time at the port is important because this is the time when the container enters a Customs port and Customs’ control. However, for most cargo it is the lodgement of the entry when Customs becomes aware of the cargo and can then assess, process and, if necessary, plan any intervention.
The key measure for Customs clearance (Clear to load) to authorise loading for export improved by
0.2 days to 4.6 days before loading compared to 4.4 days in 2009. A higher percentage of FCLs — 84 percent were cleared more than 48 hours before loading. The dwell time declined 0.6 days or 14 hours. The export measures improved overall, reporting is earlier and containers are delivered to the port closer to the loading time.
The percentage of FCLs exported by Secure Export Scheme (SES) exporters has declined from 41 percent to 36 percent. There is also some volatility at the country of discharge level related to the SES measures. Only two countries show an increase in the percentage of FCLs exported by SES — Singapore and the Republic of Korea.
An important market for New Zealand exporters, the USA, saw container numbers increase 6 percent but the percentage of FCLs exported by SES exporters decline to 40 percent from 56 percent. Additionally, there was a large change in the reporting of entries for export FCLs to the USA. Signifi cantly, exporters lodged or declared export entries 1.1 days before receipt compared to 1.3 days after receipt in 2009 — a major change. At receipt, 61 percent of FCLs had been declared and cleared by Customs in 2010 compared to 48 percent in 2009 an increase of 13 percent which helps to explain the change in reporting time before receipt.
12 Time Release Study 2010
Exports FCLs to Australia, New Zealand’s main trading partner decreased by 2 percent and the percentage from SES exporters declined by 4 percent. The measures receipt to lodge and receipt to clear remain the same in 2010 at 0.8 days. At receipt 38 percent of FCLs were declared and cleared in 2010 compared to 41 percent in 2009. The
dwell time for export FCLs increased by 0.6 days to 4.6 days compared to 4.0 days in 2009.
At other country of discharge level, the number of FCLs exported to Singapore increased by 39 percent this, however, could be a result of shipping lines using Singapore as a hub port. The number of FCLs
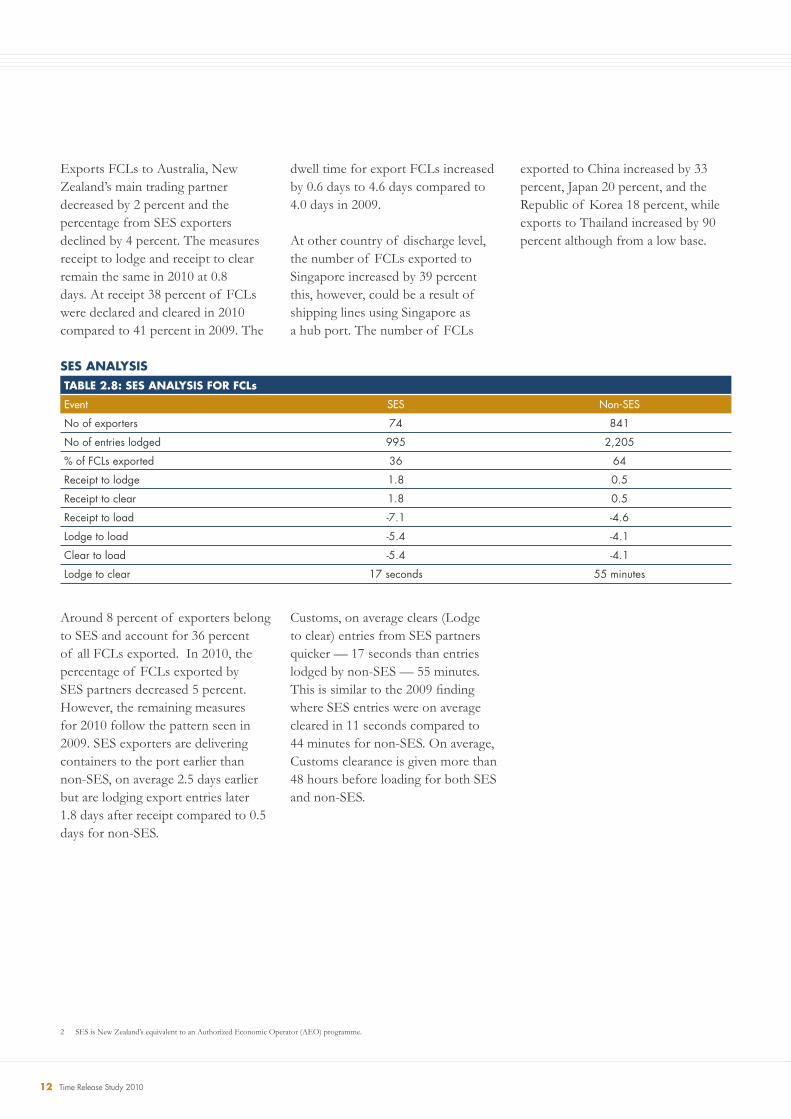
SES ANALYSISTABLE 2.8: SES ANALYSIS FOR FCLs
Event SES Non-SES
No of exporters 74 841
No of entries lodged 995 2,205
% of FCLs exported 36 64
Receipt to lodge 1.8 0.5
Receipt to clear 1.8 0.5
Receipt to load -7.1 -4.6
Lodge to load -5.4 -4.1
Clear to load -5.4 -4.1
Lodge to clear 17 seconds 55 minutes
Around 8 percent of exporters belong to SES and account for 36 percent of all FCLs exported. In 2010, the percentage of FCLs exported by SES partners decreased 5 percent. However, the remaining measures for 2010 follow the pattern seen in 2009. SES exporters are delivering containers to the port earlier than non-SES, on average 2.5 days earlier but are lodging export entries later 1.8 days after receipt compared to 0.5 days for non-SES.
Customs, on average clears (Lodge to clear) entries from SES partners quicker — 17 seconds than entries lodged by non-SES — 55 minutes. This is similar to the 2009 fi nding where SES entries were on average cleared in 11 seconds compared to 44 minutes for non-SES. On average, Customs clearance is given more than 48 hours before loading for both SES and non-SES.
2 SES is New Zealand’s equivalent to an Authorized Economic Operator (AEO) programme.
exported to China increased by 33 percent, Japan 20 percent, and the Republic of Korea 18 percent, while exports to Thailand increased by 90 percent although from a low base.
New Zealand Customs Service 13
SECTION THREE
According to Statistics New Zealand international cargo to the value of $15.3 billion was imported and exported through New Zealand air ports during the 2010 calendar year. This represents 18 percent of the total value of overseas cargo.
ANALYSIS OF AIR CARGO
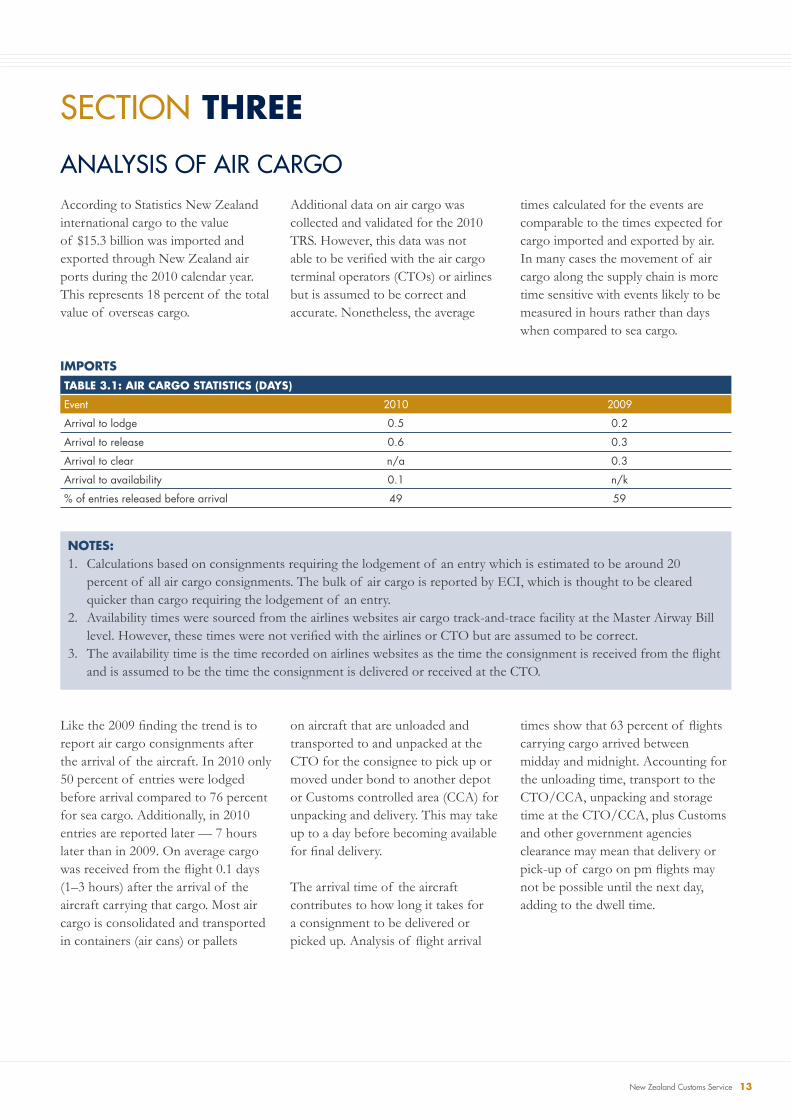
IMPORTSTABLE 3.1: AIR CARGO STATISTICS (DAYS)
Event 2010 2009
Arrival to lodge 0.5 0.2
Arrival to release 0.6 0.3
Arrival to clear n/a 0.3
Arrival to availability 0.1 n/k
% of entries released before arrival 49 59
Additional data on air cargo was collected and validated for the 2010 TRS. However, this data was not able to be verifi ed with the air cargo terminal operators (CTOs) or airlines but is assumed to be correct and accurate. Nonetheless, the average
times calculated for the events are comparable to the times expected for cargo imported and exported by air. In many cases the movement of air cargo along the supply chain is more time sensitive with events likely to be measured in hours rather than days when compared to sea cargo.
NOTES:1. Calculations based on consignments requiring the lodgement of an entry which is estimated to be around 20
percent of all air cargo consignments. The bulk of air cargo is reported by ECI, which is thought to be cleared quicker than cargo requiring the lodgement of an entry.
2. Availability times were sourced from the airlines websites air cargo track-and-trace facility at the Master Airway Bill level. However, these times were not verifi ed with the airlines or CTO but are assumed to be correct.
3. The availability time is the time recorded on airlines websites as the time the consignment is received from the fl ight and is assumed to be the time the consignment is delivered or received at the CTO.
Like the 2009 fi nding the trend is to report air cargo consignments after the arrival of the aircraft. In 2010 only 50 percent of entries were lodged before arrival compared to 76 percent for sea cargo. Additionally, in 2010 entries are reported later — 7 hours later than in 2009. On average cargo was received from the fl ight 0.1 days (1–3 hours) after the arrival of the aircraft carrying that cargo. Most air cargo is consolidated and transported in containers (air cans) or pallets
on aircraft that are unloaded and transported to and unpacked at the CTO for the consignee to pick up or moved under bond to another depot or Customs controlled area (CCA) for unpacking and delivery. This may take up to a day before becoming available for fi nal delivery.
The arrival time of the aircraft contributes to how long it takes for a consignment to be delivered or picked up. Analysis of fl ight arrival
times show that 63 percent of fl ights carrying cargo arrived between midday and midnight. Accounting for the unloading time, transport to the CTO/CCA, unpacking and storage time at the CTO/CCA, plus Customs and other government agencies clearance may mean that delivery or pick-up of cargo on pm fl ights may not be possible until the next day, adding to the dwell time.
14 Time Release Study 2010
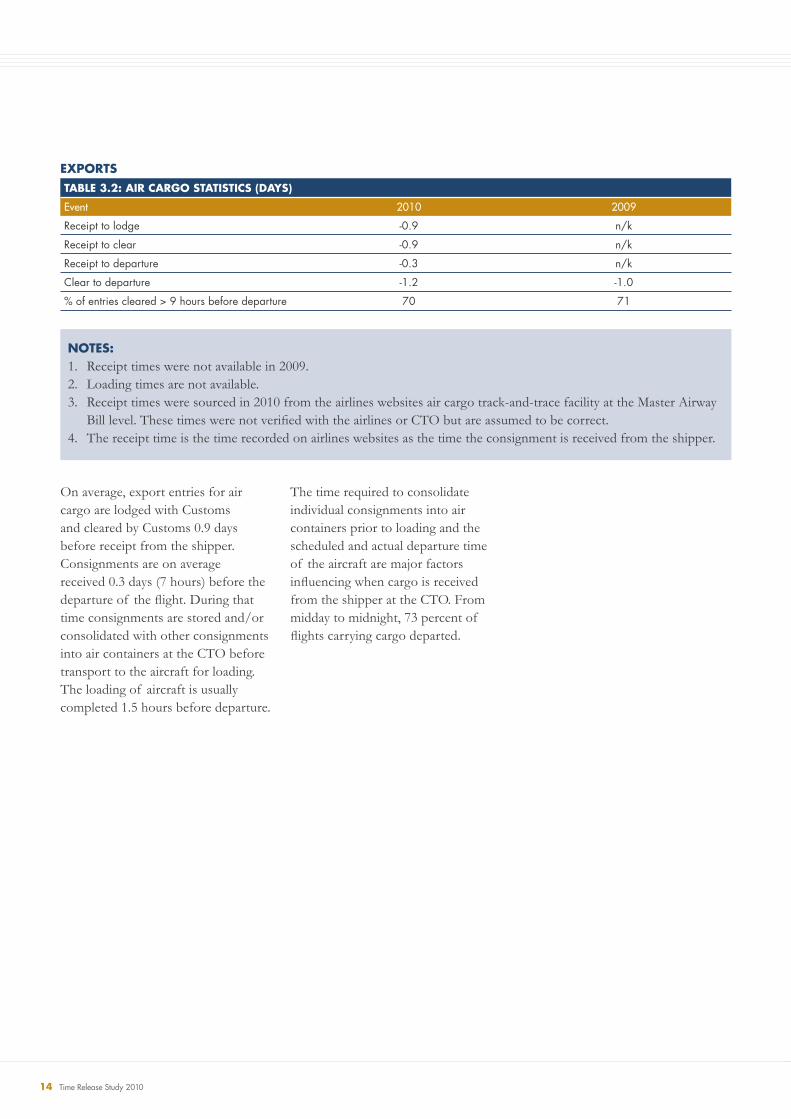
EXPORTSTABLE 3.2: AIR CARGO STATISTICS (DAYS)
Event 2010 2009
Receipt to lodge -0.9 n/k
Receipt to clear -0.9 n/k
Receipt to departure -0.3 n/k
Clear to departure -1.2 -1.0
% of entries cleared > 9 hours before departure 70 71
NOTES:1. Receipt times were not available in 2009.2. Loading times are not available. 3. Receipt times were sourced in 2010 from the airlines websites air cargo track-and-trace facility at the Master Airway
Bill level. These times were not verifi ed with the airlines or CTO but are assumed to be correct.4. The receipt time is the time recorded on airlines websites as the time the consignment is received from the shipper.
On average, export entries for air cargo are lodged with Customs and cleared by Customs 0.9 days before receipt from the shipper. Consignments are on average received 0.3 days (7 hours) before the departure of the fl ight. During that time consignments are stored and/or consolidated with other consignments into air containers at the CTO before transport to the aircraft for loading. The loading of aircraft is usually completed 1.5 hours before departure.
The time required to consolidate individual consignments into air containers prior to loading and the scheduled and actual departure time of the aircraft are major factors infl uencing when cargo is received from the shipper at the CTO. From midday to midnight, 73 percent of fl ights carrying cargo departed.
New Zealand Customs Service 15
SECTION FOUR
KEY FINDINGS FROM THE STUDY The purposes of the 2010 study were: to replicate the 2009 study; to produce comparable measures; and to identify areas for improvement. This TRS provides Customs with a second set of data and measures that allow comparison between the two studies. Differences in the measurements can therefore explain changes in performance. For many of the key measures the differences were minor, with none standing out as showing major changes in performance between the two studies. Changes observed may be one-off (specifi c only to the sample week) and the sustainability or continuation of any change will only be confi rmed in future studies. Overall, although some measures declined there has been an improvement in many of the measures providing evidence supporting Customs’ role in facilitating trade.
Additionally, the fi ndings from the 2010 TRS support the fi ndings from the 2009 study. The key fi ndings are:
» Customs is effi cient in clearing cargo at the border and does not impede trade un-necessarily. The level of advanced or early reporting for imports by sea remains high with a high percentage of cargo released by Customs before arrival. The 2010 study shows a slight decline in the percentage of entries lodged by traders or their agents before
FINDINGS AND OPPORTUNITIESarrival and lodgement is closer (later) to arrival. However, the measures for release are similar to 2009. Advanced reporting was a key fi nding from the 2009 study and the three Australian studies, to date. There are benefi ts to Customs and traders from completing Customs clearance requirements early. Customs’ early receipt of the required documents for assessing and processing release of cargo provides more time and certainty, benefi ting both Customs and traders.
» Export reporting and clearance measures for sea cargo have improved. Reporting as soon as the cargo enters Customs control provides time for Customs to assess and process the information and take any action, so to not impede the cargo before it is loaded.
» The analysis of export FCLs shows benefi ts to exporters who are SES partners. However, there has been a decrease in the percentage of FCLs exported by SES partners from 41 percent to 36 percent. In particular FCLs exported to the USA increased in number but the percentage exported by SES exporters declined. Should this pattern continue then Customs may see an increase in requests from the USA to inspect/x-ray containers to confi rm the cargo is safe to load.
» Unlike sea cargo, air cargo is reported later — after arrival. In 2010, both the reporting time and percentage of entries lodged before arrival decreased compared to 2009. The information required to complete Customs’ reporting requirements and shorter transport and dwell times are the most likely explanations for why air cargo is reported later.
» Trade with Australia has increased — an increase of 527 containers for the week. Reporting for imports was later (decline) but overall cargo was delivered faster and times for the export cargo measures remain similar.
» Trade with the People’s Republic of China increased in volume and there were improvements in times for many of the events measured. There was a net gain of 104 export FCLs. Reporting for imports improved by 0.5 days before arrival and export reporting was earlier to receipt, giving Customs more time to assess the consignment before arrival and before loading.

16 Time Release Study 2010
OPPORTUNITIES FOR IMPROVEMENTOpportunities for improvement were identifi ed. These opportunities reinforce the opportunities identifi ed from the 2009 study. Customs should continue to work on the opportunities from this year and last year.
» Some cargo types showed an improvement in earlier reporting times. Customs should continue to work with and encourage industry to lodge declarations earlier to increase the percentage of entries lodged before arrival. Advanced reporting provides benefi ts to traders and Customs.
» The pattern for air cargo is to report after arrival. Legislation allows entries for air cargo to be lodged 24 hours before arrival. However, this year and in 2009 entries were on average lodged after arrival. The delivery of air cargo is more time-sensitive compared to sea so there is an opportunity for Customs to work with and encourage the air cargo industry to lodge earlier to increase the percentage of entries lodged and released before arrival and the time lodged before arrival.
» The percentage of FCLs exported by SES partners decreased this year. SES contributes to the facilitation of trade by providing a high level of security and safety over exports. Customs should continue to promote the scheme to increase the number of SES exporters and coverage of FCLs exported.
» Customs should share the results of the study with other government agencies and industry. This will promote the role of Customs in facilitating trade, and Customs role in supporting and contributing to growing the New Zealand economy.
New Zealand Customs Service 17
SECTION FIVE
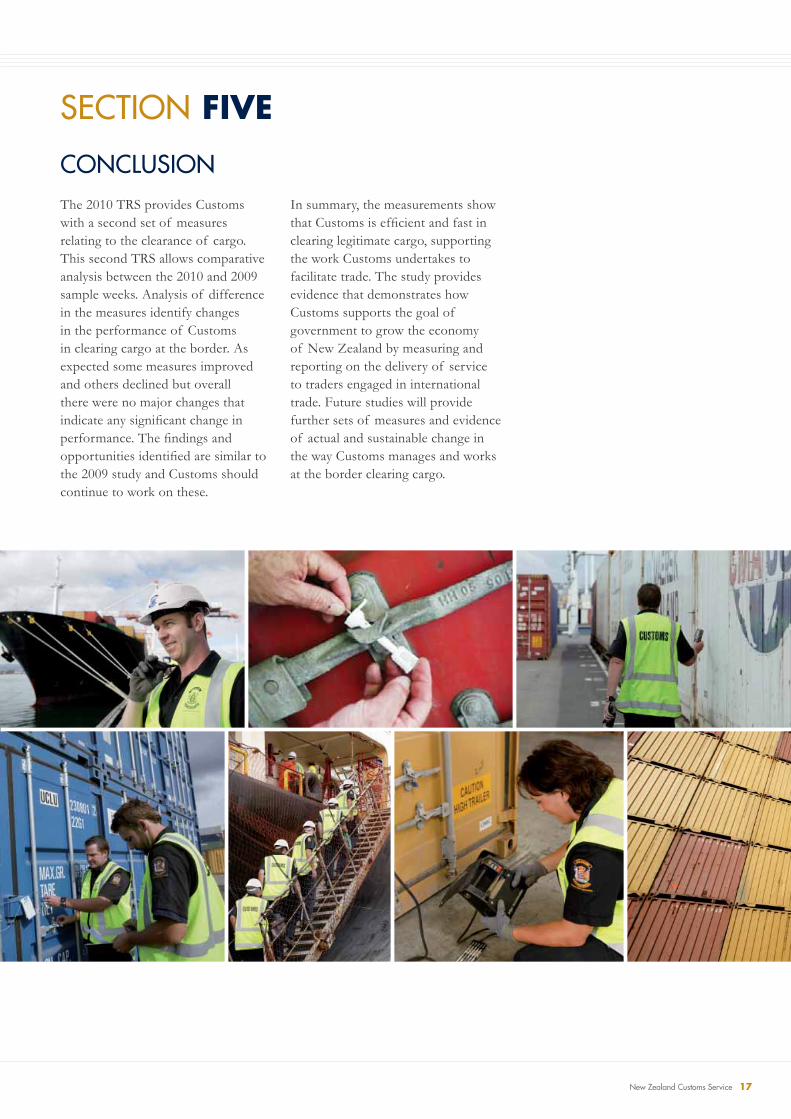
The 2010 TRS provides Customs with a second set of measures relating to the clearance of cargo. This second TRS allows comparative analysis between the 2010 and 2009 sample weeks. Analysis of difference in the measures identify changes in the performance of Customs in clearing cargo at the border. As expected some measures improved and others declined but overall there were no major changes that indicate any signifi cant change in performance. The fi ndings and opportunities identifi ed are similar to the 2009 study and Customs should continue to work on these.
CONCLUSIONIn summary, the measurements show that Customs is effi cient and fast in clearing legitimate cargo, supporting the work Customs undertakes to facilitate trade. The study provides evidence that demonstrates how Customs supports the goal of government to grow the economy of New Zealand by measuring and reporting on the delivery of service to traders engaged in international trade. Future studies will provide further sets of measures and evidence of actual and sustainable change in the way Customs manages and works at the border clearing cargo.
18 Time Release Study 2010
APPENDICES
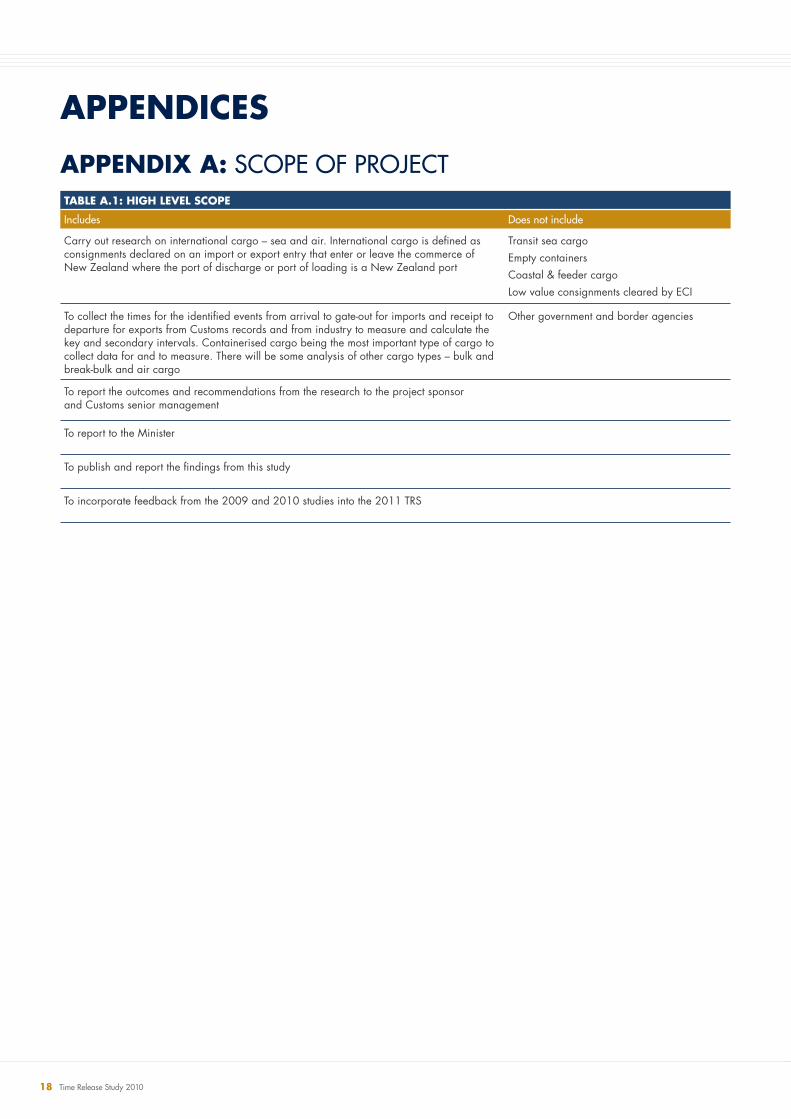
APPENDIX A: SCOPE OF PROJECT TABLE A.1: HIGH LEVEL SCOPE
Includes Does not include
Carry out research on international cargo – sea and air. International cargo is defi ned as consignments declared on an import or export entry that enter or leave the commerce of New Zealand where the port of discharge or port of loading is a New Zealand port
Transit sea cargoEmpty containersCoastal & feeder cargoLow value consignments cleared by ECI
To collect the times for the identifi ed events from arrival to gate-out for imports and receipt to departure for exports from Customs records and from industry to measure and calculate the key and secondary intervals. Containerised cargo being the most important type of cargo to collect data for and to measure. There will be some analysis of other cargo types – bulk and break-bulk and air cargo
Other government and border agencies
To report the outcomes and recommendations from the research to the project sponsor and Customs senior management
To report to the Minister
To publish and report the fi ndings from this study
To incorporate feedback from the 2009 and 2010 studies into the 2011 TRS
New Zealand Customs Service 19
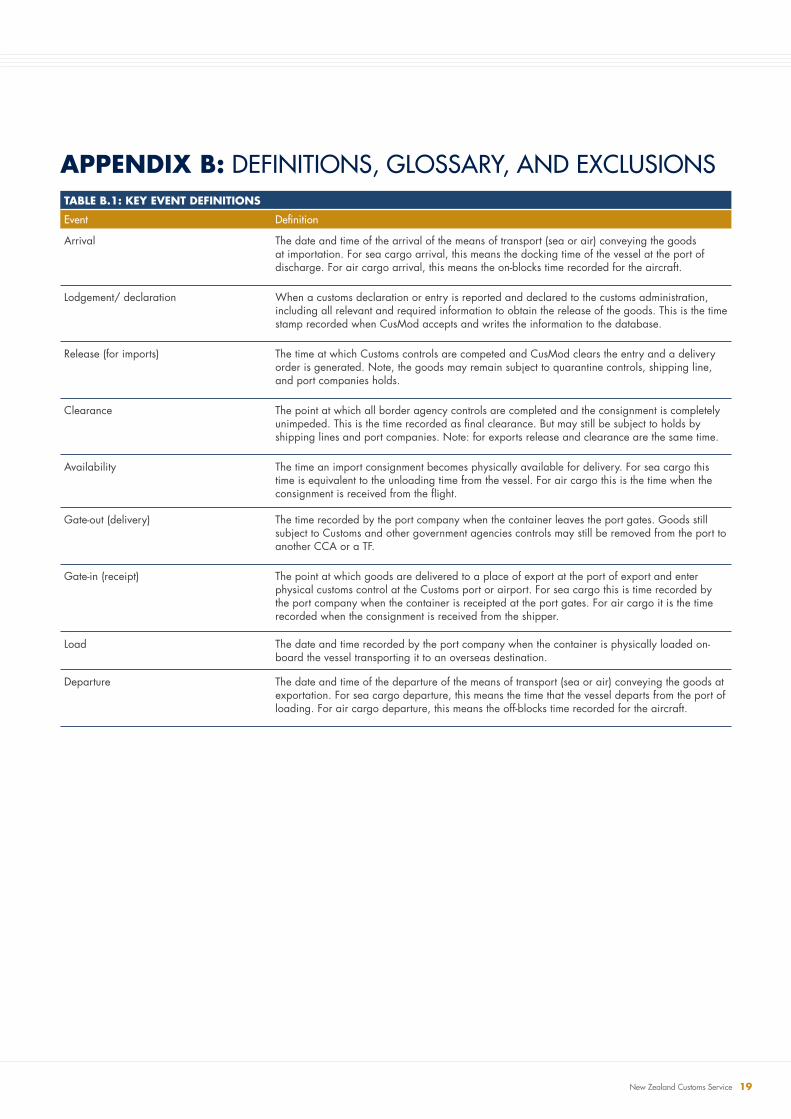
APPENDIX B: DEFINITIONS, GLOSSARY, AND EXCLUSIONSTABLE B.1: KEY EVENT DEFINITIONS
Event Defi nition
Arrival The date and time of the arrival of the means of transport (sea or air) conveying the goods at importation. For sea cargo arrival, this means the docking time of the vessel at the port of discharge. For air cargo arrival, this means the on-blocks time recorded for the aircraft.
Lodgement/ declaration When a customs declaration or entry is reported and declared to the customs administration, including all relevant and required information to obtain the release of the goods. This is the time stamp recorded when CusMod accepts and writes the information to the database.
Release (for imports) The time at which Customs controls are competed and CusMod clears the entry and a delivery order is generated. Note, the goods may remain subject to quarantine controls, shipping line, and port companies holds.
Clearance The point at which all border agency controls are completed and the consignment is completely unimpeded. This is the time recorded as fi nal clearance. But may still be subject to holds by shipping lines and port companies. Note: for exports release and clearance are the same time.
Availability The time an import consignment becomes physically available for delivery. For sea cargo this time is equivalent to the unloading time from the vessel. For air cargo this is the time when the consignment is received from the fl ight.
Gate-out (delivery) The time recorded by the port company when the container leaves the port gates. Goods still subject to Customs and other government agencies controls may still be removed from the port to another CCA or a TF.
Gate-in (receipt) The point at which goods are delivered to a place of export at the port of export and enter physical customs control at the Customs port or airport. For sea cargo this is time recorded by the port company when the container is receipted at the port gates. For air cargo it is the time recorded when the consignment is received from the shipper.
Load The date and time recorded by the port company when the container is physically loaded on-board the vessel transporting it to an overseas destination.
Departure The date and time of the departure of the means of transport (sea or air) conveying the goods at exportation. For sea cargo departure, this means the time that the vessel departs from the port of loading. For air cargo departure, this means the off-blocks time recorded for the aircraft.
20 Time Release Study 2010
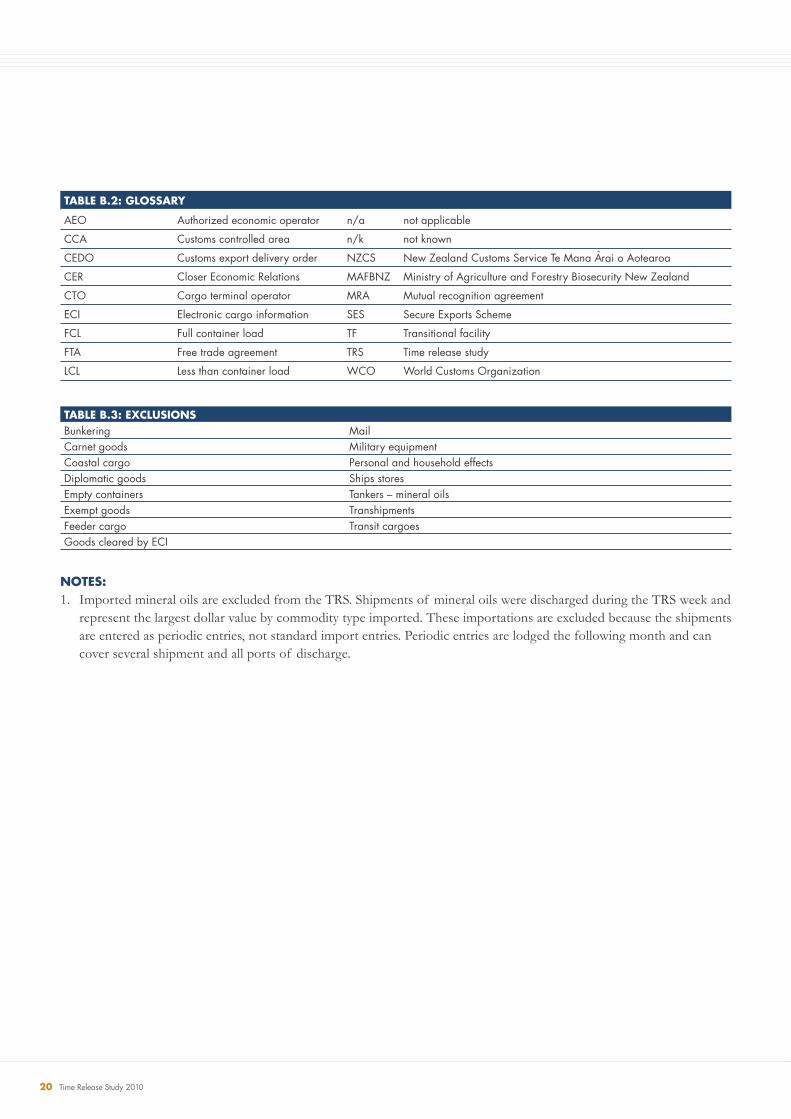
TABLE B.2: GLOSSARY
AEO Authorized economic operator n/a not applicable
CCA Customs controlled area n/k not known
CEDO Customs export delivery order NZCS New Zealand Customs Service Te Mana A-rai o Aotearoa
CER Closer Economic Relations MAFBNZ Ministry of Agriculture and Forestry Biosecurity New Zealand
CTO Cargo terminal operator MRA Mutual recognition agreement
ECI Electronic cargo information SES Secure Exports Scheme
FCL Full container load TF Transitional facility
FTA Free trade agreement TRS Time release study
LCL Less than container load WCO World Customs Organization
TABLE B.3: EXCLUSIONSBunkering MailCarnet goods Military equipmentCoastal cargo Personal and household effectsDiplomatic goods Ships storesEmpty containers Tankers – mineral oilsExempt goods TranshipmentsFeeder cargo Transit cargoesGoods cleared by ECI
NOTES:1. Imported mineral oils are excluded from the TRS. Shipments of mineral oils were discharged during the TRS week and
represent the largest dollar value by commodity type imported. These importations are excluded because the shipments are entered as periodic entries, not standard import entries. Periodic entries are lodged the following month and can cover several shipment and all ports of discharge.
New Zealand Customs Service 21
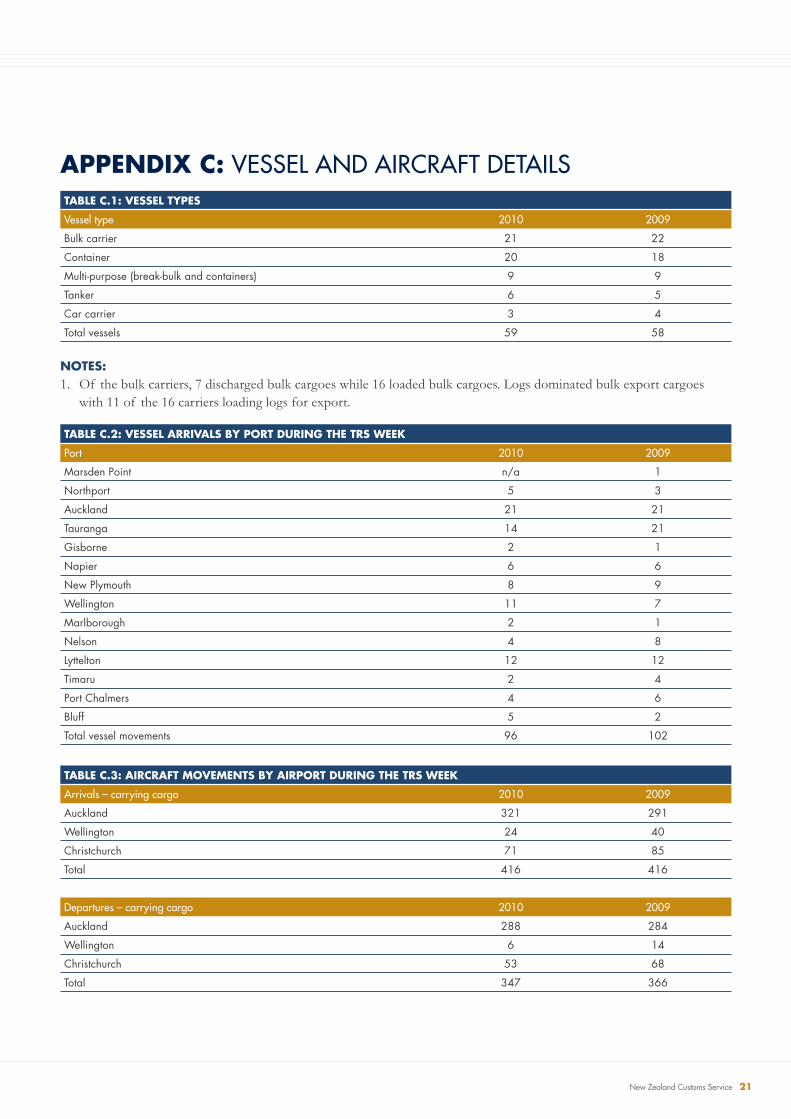
APPENDIX C: VESSEL AND AIRCRAFT DETAILSTABLE C.1: VESSEL TYPES
Vessel type 2010 2009
Bulk carrier 21 22
Container 20 18
Multi-purpose (break-bulk and containers) 9 9
Tanker 6 5
Car carrier 3 4
Total vessels 59 58
NOTES:1. Of the bulk carriers, 7 discharged bulk cargoes while 16 loaded bulk cargoes. Logs dominated bulk export cargoes
with 11 of the 16 carriers loading logs for export.
TABLE C.2: VESSEL ARRIVALS BY PORT DURING THE TRS WEEK
Port 2010 2009
Marsden Point n/a 1
Northport 5 3
Auckland 21 21
Tauranga 14 21
Gisborne 2 1
Napier 6 6
New Plymouth 8 9
Wellington 11 7
Marlborough 2 1
Nelson 4 8
Lyttelton 12 12
Timaru 2 4
Port Chalmers 4 6
Bluff 5 2
Total vessel movements 96 102
TABLE C.3: AIRCRAFT MOVEMENTS BY AIRPORT DURING THE TRS WEEK
Arrivals – carrying cargo 2010 2009
Auckland 321 291
Wellington 24 40
Christchurch 71 85
Total 416 416
Departures – carrying cargo 2010 2009
Auckland 288 284
Wellington 6 14
Christchurch 53 68
Total 347 366
22 Time Release Study 2010
APPENDIX D: ENTRY LODGEMENT DAY
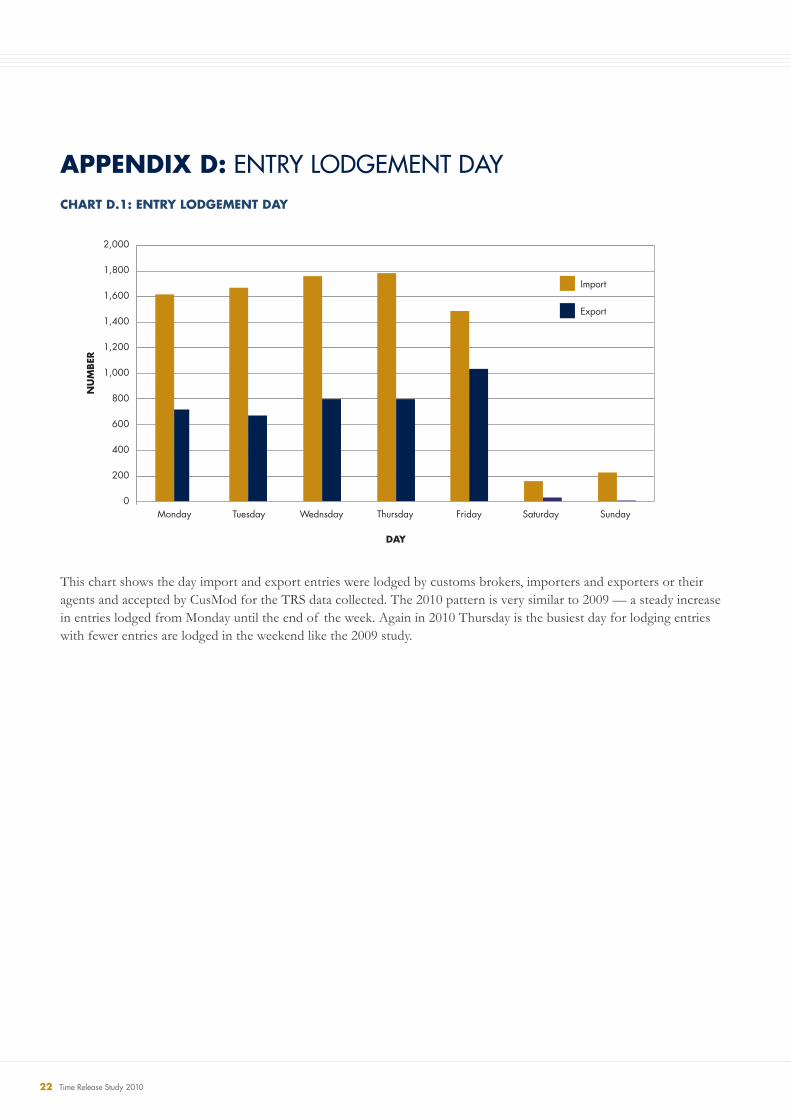
This chart shows the day import and export entries were lodged by customs brokers, importers and exporters or their agents and accepted by CusMod for the TRS data collected. The 2010 pattern is very similar to 2009 — a steady increase in entries lodged from Monday until the end of the week. Again in 2010 Thursday is the busiest day for lodging entries with fewer entries are lodged in the weekend like the 2009 study.
CHART D.1: ENTRY LODGEMENT DAY
Monday0
200
400
600
800
1,000
1,200
1,400
1,600
1,800
2,000
Tuesday Wednsday
NU
MBER
DAY
Thursday Friday Saturday
Import
Sunday
Export

New Zealand Customs Service 23
APPENDIX E: CONTAINERISED CARGO CHARTSCHART E.1: IMPORT FCLS UNLOAD AND GATE-OUT HOUR
This chart shows the unloading and gate-out hour for FCLs. Ports operate 24 hours a day, 7 days a week, and containers are unloaded and delivered throughout the day and night. For the 2010 week, there is a busy period from midnight through to 10 am when between 300 and 400 containers were unloaded per hour. The unloading hour is a function of the vessel arrival time so will vary from week-to-week and year-to-year. However, the gate-out hour in 2010 follows a similar pattern observed in 2009 where the majority of containers were delivered during day light hours. Between 7 am and 7 pm, 75 percent of containers were recorded leaving the ports. To also point out, during the hour 6 am to 7 am, 116 FCLs were delivered, then between the hour 7 am to 8 am, 448 FCLs were delivered — almost a 300 percent increase. For both studies, the busiest hour for gate-out was from 10 am to 11 am when 529 FCLs were delivered in 2010.
300
100
0
200
500
600
400
NU
MBER
HOUR
00:0
0-01
:00
01:0
0-02
:00
02:0
0-03
:00
03:0
0-04
:00
04:0
0-05
:00
05:0
0-06
:00
06:0
0-07
:00
07:0
0-08
:00
08:0
0-09
:00
09:0
0-10
:00
10:0
0-11
:00
11:0
0-12
:00
12:0
0-13
:00
13:0
0-14
:00
14:0
0-15
:00
15:0
0-16
:00
16:0
0-17
:00
17:0
0-18
:00
18:0
0-19
:00
19:0
0-20
:00
20:0
0-21
:00
21:0
0-22
:00
22:0
0-23
:00
23:0
0-24
:00
Unload
Gate-out
24 Time Release Study 2010
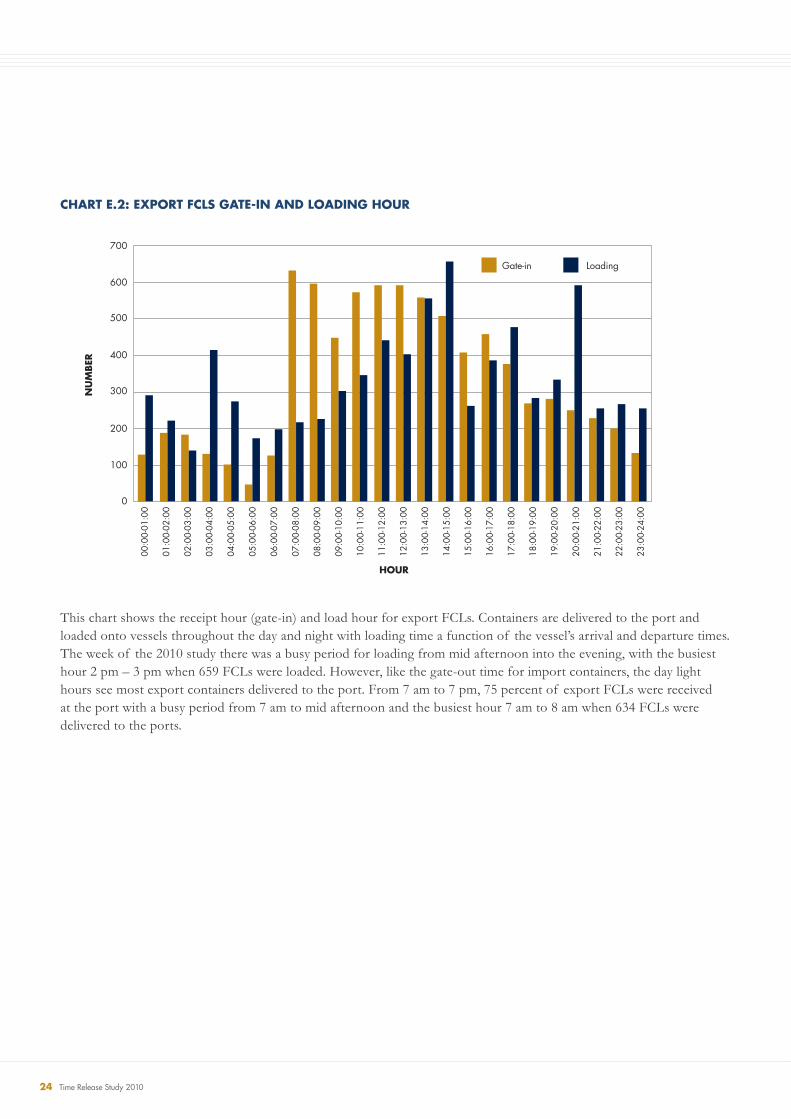
CHART E.2: EXPORT FCLS GATE-IN AND LOADING HOUR
This chart shows the receipt hour (gate-in) and load hour for export FCLs. Containers are delivered to the port and loaded onto vessels throughout the day and night with loading time a function of the vessel’s arrival and departure times. The week of the 2010 study there was a busy period for loading from mid afternoon into the evening, with the busiest hour 2 pm – 3 pm when 659 FCLs were loaded. However, like the gate-out time for import containers, the day light hours see most export containers delivered to the port. From 7 am to 7 pm, 75 percent of export FCLs were received at the port with a busy period from 7 am to mid afternoon and the busiest hour 7 am to 8 am when 634 FCLs were delivered to the ports.
300
100
0
200
500
700
600
400
NU
MBER
HOUR
00:0
0-01
:00
01:0
0-02
:00
02:0
0-03
:00
03:0
0-04
:00
04:0
0-05
:00
05:0
0-06
:00
06:0
0-07
:00
07:0
0-08
:00
08:0
0-09
:00
09:0
0-10
:00
10:0
0-11
:00
11:0
0-12
:00
12:0
0-13
:00
13:0
0-14
:00
14:0
0-15
:00
15:0
0-16
:00
16:0
0-17
:00
17:0
0-18
:00
18:0
0-19
:00
19:0
0-20
:00
20:0
0-21
:00
21:0
0-22
:00
22:0
0-23
:00
23:0
0-24
:00
Gate-in Loading

New Zealand Customs Service 25

26 Time Release Study 2010