
New Zealand Blood Service Annual Statement of Performance ... · This Annual Statement of...
39
E.38 New Zealand Blood Service Annual Statement of Performance Expectations 1 July 2017 – 30 June 2018 NZBS National Office 11 Great South Road Epsom 1051 Private Bag 92 071 Victoria Street West AUCKLAND 1142
Transcript of New Zealand Blood Service Annual Statement of Performance ... · This Annual Statement of...
E.38
New Zealand Blood Service
Annual Statement of Performance Expectations
1 July 2017 – 30 June 2018
NZBS National Office 11 Great South Road
Epsom 1051 Private Bag 92 071
Victoria Street West AUCKLAND 1142
E.38
NZBS ANNNUAL STATEMENT OF PERFORMANCE EXPECTATIONS 1 JULY 2017 TO 30 JUNE 2018
NEW ZEALAND BLOOD SERVICE
TABLE OF CONTENTS
1 INTRODUCTION 1
PART I
2 FORECAST STATEMENT OF PERFORMANCE EXPECTATIONS: 10
Period covered: 1 JULY 2017 TO 30 JUNE 2018
2.1 Forecast Statement of Externally Focused Service Performance 11
2.2 Forecast Statement of Internally Focused Service Performance 13 (Capability and Input Measures)
PART II
3 FINANCIAL PLAN 17
3.1 Overview of Financial Plan 17
3.2 Key Assumptions 21
3.3 Forecast Financial Statements 27
3.4 Statement of Accounting Policies 30
Copyright ©. This copyright work is licensed under the Creative Commons Attribution 3.0 New Zealand licence. In essence, you are free to copy, distribute and adapt the work, as long as you attribute the work to New Zealand Blood Service and abide by the other licence terms. To view a copy of this licence, visit http://creativecommons.org/licenses/by/3.0/nz/. Please note that the New Zealand Blood Service logo may not be used in any way which infringes any provision of the Flags, Emblems, and Names Protection Act 1981 or would infringe such provision if the relevant use occurred within New Zealand. Attribution to New Zealand Blood Service should be in written form and not by reproduction of the New Zealand Blood Service logo.
NZBS National Office 11 Great South Road Epsom 1051 Private Bag 92 071 Victoria Street West AUCKLAND 1142
NZBS ANNUAL STATEMENT OF PERFORMANCE EXPECTATIONS 1 JULY 2017 – 30 JUNE 2018
NEW ZEALAND BLOOD SERVICE Page 1 of 37
1 INTRODUCTION
Purpose This Annual Statement of Performance Expectations has been prepared in accordance with the Crown Entities Act 2004 and should be read in conjunction with the July 2017 – June 2021 NZBS Statement of Intent (SOI).
It sets out how the New Zealand Blood Service (NZBS) will organise itself and prudently deploy resources (in line with both the July 2012 Enduring Letter of Expectations from the Ministers of Health and State Services and the 17th February 2017 Letter of Expectation from the Minister of Health) to ensure transparency, collaboration and value for money in the support of New Zealand’s healthcare sector. It identifies for Parliament and the New Zealand public what NZBS intends to achieve and how performance will be assessed, in order to deliver on the organisation’s strategic goals1 and its single enduring Output Class and Outcome:
Health needs of people in New Zealand are supported by the availability of safe
and appropriate blood, blood products, tissue products and related services.
Government Expectations for the 2017/18 Financial Year This Statement of Performance Expectations has been prepared taking into account the Minister’s 17 February 2017 Letter of Expectations for the 2017/18 financial year, requiring NZBS to take a whole of sector view and;
Focus on keeping costs to district health boards as low as possible while continuing to ensure the safe supply of blood and blood products as and when needed and;
Continue to innovate where appropriate to support this goal.
NZBS will also adhere to the Minister’s more general expectations of:
Ongoing fiscal discipline and prudent financial management;
Contributing as part of the team approach across the health and disability system, to continue to improve service delivery, building on progress that has already been made to achieve better results for New Zealanders;
Continuing the commitment to ongoing continuous performance improvement, including publishing non-sensitive performance information on the NZBS website to demonstrate openness, transparency and accountability;
Working constructively with the Ministry of Health and;
Demonstrating our commitment and linkage to the New Zealand Health Strategy.
NZBS Strategy The NZBS strategy is explained in detail in the Statement of Intent. What NZBS plans to achieve in the 2017/18 year as detailed in Part I of this document is linked to the following seven strategic goals:
1 See Section 4 of SOI
NZBS ANNUAL STATEMENT OF PERFORMANCE EXPECTATIONS 1 JULY 2017 – 30 JUNE 2018
NEW ZEALAND BLOOD SERVICE Page 2 of 37
Strategic Goal
1. NZBS builds on core capabilities to provide a range of products and services which are appropriate to New Zealand health needs and priorities.
2. NZBS achieves the highest possible safety and quality standards in all that it does.
3. NZBS manages a sustainable donor population capable of supporting ongoing product demand in New Zealand.
4. NZBS relationships with other health sector entities are mutually supportive and productive.
5. NZBS has a sustainable, competent and engaged workforce.
6. NZBS uses international best practices and internal research and development capabilities to improve and develop products and services for the New Zealand health and disability sector.
7. NZBS is a financially sustainable organisation operating effectively and efficiently.
Business Improvement Activities
In addition to maintaining a safe and secure supply of blood, blood products, tissue products and related services at all times, NZBS’s main areas of focus for the 2017/18 year are related to the following business improvement activities: Ensuring Appropriate Blood Product Utilisation
NZBS is a demand driven service. It works in partnership with prescribing clinicians in the District Health Boards (DHBs) and with Hospital Transfusion Committees to ensure clinically appropriate utilisation of blood and blood products. This is very effective, as evidenced by the ongoing reduction in demand for Red Blood Cells (RBCs) as DHBs, with the support of NZBS, have progressively implemented patient blood management programmes. This reduction in RBC prescribing, whilst good medical practice and overall reducing sector costs, does create financial challenges for NZBS with the associated loss of production volume and product issues. Immunoglobulin product utilisation is also closely managed and monitored, as this drives plasmapheresis collection activity. Historically, the rate of growth in New Zealand has been lower than that seen in other countries. For example, growth in Australia is consistently between 11-13% per annum, whereas up until 2015 NZBS growth was on average 6.5% per annum and since then it has reduced to between 0 – 4%. These changes in demand are forecast to continue over the 2017/18 period therefore NZBS will continue to flex its collection activity to align with actual demand in order to minimise expiry levels. Collections and Facilities Over the period of this SPE and the associated SOI, NZBS will seek to ensure optimum efficiency of the blood collection and processing network. This will include;
The relocation of the Dunedin collection centre in 2017 providing a modern and future protected site capable of flexing collection mix, particularly plasma capacity over the long term.
NZBS ANNUAL STATEMENT OF PERFORMANCE EXPECTATIONS 1 JULY 2017 – 30 JUNE 2018
NEW ZEALAND BLOOD SERVICE Page 3 of 37
Establishment of processing of Haemopoetic Progenitor Cells (HPC) at the Wellington site. This will provide support for the stem cell therapy programme in the Central region.
The refurbishment and improvement of the main Auckland laboratory facilities. By 2020 this will provide a second processing facility (along with Christchurch) capable of servicing the blood supply for the whole of New Zealand if required.
The Auckland site also houses the National Tissue Typing and National Reference Laboratory. Growth and new technologies in these areas requires an update in space and configuration over the next 2 – 3 years.
NZBS leases all of its buildings and regularly reviews its overall facility infrastructure in response to changes in forecast collection and manufacturing requirements. The major changes planned are to ensure that New Zealand maintains at least two hub sites capable of processing the blood product supply for the entire country whilst providing the most cost effective method of supply chain management and service delivery.
NZBS will deploy process improvement programmes across our major sites, utilising LEAN methodologies, to ensure that we can minimise the capital outlay needed to extend and refurbish those sites. Staff will be supported to lead the redesign of their working environments with particular focus on the Auckland hub site which has been signalled for extension and/or refurbishment for several years.
Due to the continued decline in demand for red blood cells and the increasing cost of facility operations we will consider the potential rationalisation of red blood cell only collection sites. We will ensure that donors continue to have the ability to donate locally by enhancing mobile collections.
To accommodate the introduction of Haemopoetic Progenitor Cell processing for
Capital and Coast DHB during 2017, NZBS will determine a clear position on the
capability and capacity requirements of the Wellington site. Any changes to
configuration would be implemented in the 2016/17 and 2017/18 financial years. Process Improvement activities
Safety is the cornerstone of everything that NZBS does, therefore quality and ongoing process improvement is embedded in the way that we work.
During 2017/18 NZBS will accelerate process improvements through our ‘Process Excellence’ programme, aimed at implementing Lean systems and processes across NZBS operations. This is a multi-year project based on a programme of work which will engage and develop staff from the front-line in delivering meaningful improvements, building on NZBS’s culture of safety and excellence. In addition to direct process improvements, savings targets associated with these projects have been incorporated within the financial projections.
From 2017, NZBS will be establishing a new Executive management structure. This is acknowledging the highly specialist nature of the business and the need to future proof key senior capability. New areas of accountability will ensure an integrated planning and supply chain function, end-to-end planning and delivery across the two main operational areas of donor services and technical services and a focus on business development and future opportunities.
2017/18 will see the implementation of an information system (eTraceline) supporting New Zealand’s 41 blood banks with efficient and safe ordering and supply of products. This system fully integrates with the existing NZBS blood management systems so providing complete “vein to vein” monitoring of the blood supply as well as positioning the sector for the uptake of emerging technologies such as ‘smart fridges’.
NZBS ANNUAL STATEMENT OF PERFORMANCE EXPECTATIONS 1 JULY 2017 – 30 JUNE 2018
NEW ZEALAND BLOOD SERVICE Page 4 of 37
Sector Relationships The critical relationship for NZBS is that with the DHBs. Over the term of this SOI, NZBS aims to work more closely with the DHBs to collaboratively develop a strategy for blood management in New Zealand so providing a proactive response to changing demand patterns whilst ensuring prudent financial considerations. Addressing the overall cost to the sector will require NZBS to focus strongly on business improvement opportunities for cost containment, use technologies to drive efficiencies and ensure optimal skill mix models are in place in our workforce.
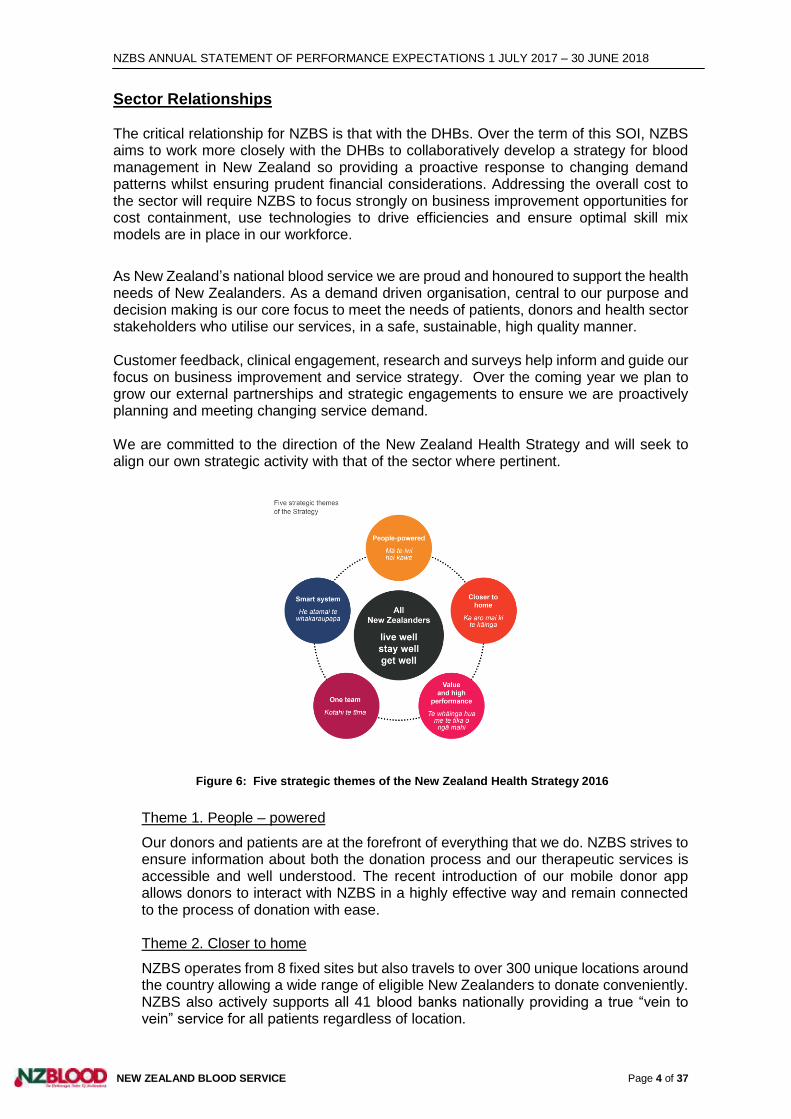
As New Zealand’s national blood service we are proud and honoured to support the health needs of New Zealanders. As a demand driven organisation, central to our purpose and decision making is our core focus to meet the needs of patients, donors and health sector stakeholders who utilise our services, in a safe, sustainable, high quality manner. Customer feedback, clinical engagement, research and surveys help inform and guide our focus on business improvement and service strategy. Over the coming year we plan to grow our external partnerships and strategic engagements to ensure we are proactively planning and meeting changing service demand. We are committed to the direction of the New Zealand Health Strategy and will seek to align our own strategic activity with that of the sector where pertinent.
Figure 6: Five strategic themes of the New Zealand Health Strategy 2016
Theme 1. People – powered
Our donors and patients are at the forefront of everything that we do. NZBS strives to ensure information about both the donation process and our therapeutic services is accessible and well understood. The recent introduction of our mobile donor app allows donors to interact with NZBS in a highly effective way and remain connected to the process of donation with ease.
Theme 2. Closer to home
NZBS operates from 8 fixed sites but also travels to over 300 unique locations around the country allowing a wide range of eligible New Zealanders to donate conveniently. NZBS also actively supports all 41 blood banks nationally providing a true “vein to vein” service for all patients regardless of location.
NZBS ANNUAL STATEMENT OF PERFORMANCE EXPECTATIONS 1 JULY 2017 – 30 JUNE 2018
NEW ZEALAND BLOOD SERVICE Page 5 of 37
Theme 3. Value and high performance
Our enduring focus on quality and business process improvements contribute to the system level theme of Value and High Performance. NZBS is actively building a culture that allows teams and individuals to use data to measure and drive performance whilst striving for continuous quality improvement. Theme 4. One team
NZBS is an active partner both clinically and non-clinically with the DHBs and other stakeholders. We are actively working towards a more collaborative approach to planning for demand changes and supporting the DHBs with blood management programmes. We operate the blood management information systems used by all the DHBs and constantly seek new ways to support the wider health sector with improved technologies and enhanced clinical products. Theme 5. Smart system
The clinical team work closely with DHB clinicians and Hospital Transfusion Committees to support the development and introduction of new policies and procedures aimed at improving transfusion outcomes for patients. Initiatives include a multi-site clinical audit programme and support for clinical transfusion research studies.
Financial Plan As a demand responsive service within the public health and disability sector, NZBS has a constant focus on improving its performance, increasing efficiencies and containing costs wherever possible. Business improvement initiatives, centred on the application of LEAN methodologies have been incorporated in the financial forecasts covering this planning period.
Infrastructure investment has, over the last few years, been a focus and this focus is maintained over this 4 year planning period, albeit at a lower average annual investment level. Such investment does introduce additional cost to the business, for example higher depreciation charges not all of which could / can be immediately offset by savings initiatives.
NZBS has a statutory responsibility to balance the Minister’s and DHBs’ expectation of minimising any price increase to the sector with the Crown Entities Act 2004 obligation to maintain financial viability. Achieving that necessary balance is a constant challenge particularly in a period of falling or largely minimal demand growth, noting a low growth outlook is being forecast over this 4 year planning period.
Price Setting
As an operating principle NZBS is committed to keeping any annual price increases to a minimum in accordance with the annual Minister’s Letter of Expectation albeit that expectation balanced against the requirement for the organisation to behave in a financially responsible manner at all times.
Over this 4 year planning period NZBS is forecasting price increases slightly above the forecast compound Consumer Price Index (CPI) movement which NZBS adopts as its benchmark for price setting behaviour.
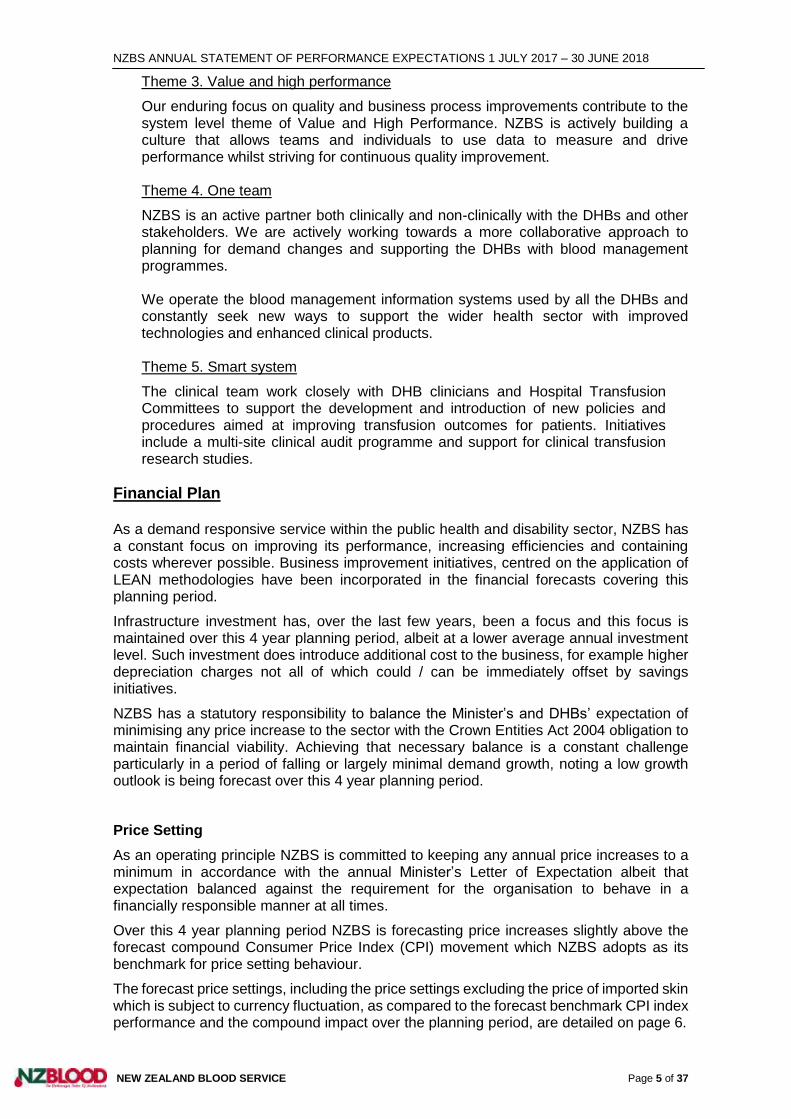
The forecast price settings, including the price settings excluding the price of imported skin which is subject to currency fluctuation, as compared to the forecast benchmark CPI index performance and the compound impact over the planning period, are detailed on page 6.
NZBS ANNUAL STATEMENT OF PERFORMANCE EXPECTATIONS 1 JULY 2017 – 30 JUNE 2018
NEW ZEALAND BLOOD SERVICE Page 6 of 37
Heading Actual 2015/16
Forecast 2016/17
Forecast 2017/18
Forecast 2018/19
Forecast 2019/20
Forecast 2020/21
NZBS Weighted Price Increase excl. Imported Skin
0.40% 1.82% 1.99% 1.96% 1.97% 1.90%
NZBS Weighted Price Increase - all Products and Services
0.44% 1.86% 2.05% 2.05% 2.06% 1.98%
Consumers Price Index (CPI) % Movement
0.42% 1.50% 1.50% 2.10% 1.94% 1.93%
Compound % Comparison of NZBS Price Increases vs CPI Index – June 2007 base
(0.0%) = lower NZBS Pricing to CPI
(9.67%) (9.91%) (9.45%) (9.71%) (9.77%) (9.90%)
Over the 2017/18 to 2020/21 4 year planning period NZBS is forecasting a compound price movement (excl. imported skin) of 8.06% compared with a forecast compound CPI movement of 7.69%.
The long run NZBS price setting behaviour over the period 1 July 2007 to 30 June 2021, shows a 9.90% lower compound price increase (net of price rebates to the DHBs) when compared to the compound CPI movement over the same period.
As a benchmark indicator this comparison validates the long run price setting behaviour of NZBS as being consistently, post any price rebates, below that of the CPI movement. DHB Prices for 2017/18
The overall price increase for DHBs, excluding skin product pricing, is a weighted 1.99% increase with the major category price settings as follows;
Fresh Products - a 1.72% weighted increase across red cells, platelets and fresh plasma products;
Fractionated Product - a 2.00% weighted increase; and
Services - a 2.42% weighted increase over all service categories. Price Rebates
NZBS has a mechanism in place to provide a price rebate to the DHBs in the event there is a level of surplus which is not required by NZBS to meet and discharge its own financial obligations and responsibilities.
NZBS may generate additional revenue or make savings, as against budget setting, by events such as:
increases in demand for products and services;
improved fractionation yields;
exchange rate gains; and/or
internal cost efficiencies.
There is no planned price rebate for the 2017/18 financial year. The 4 year financial projections show no planned price rebates.
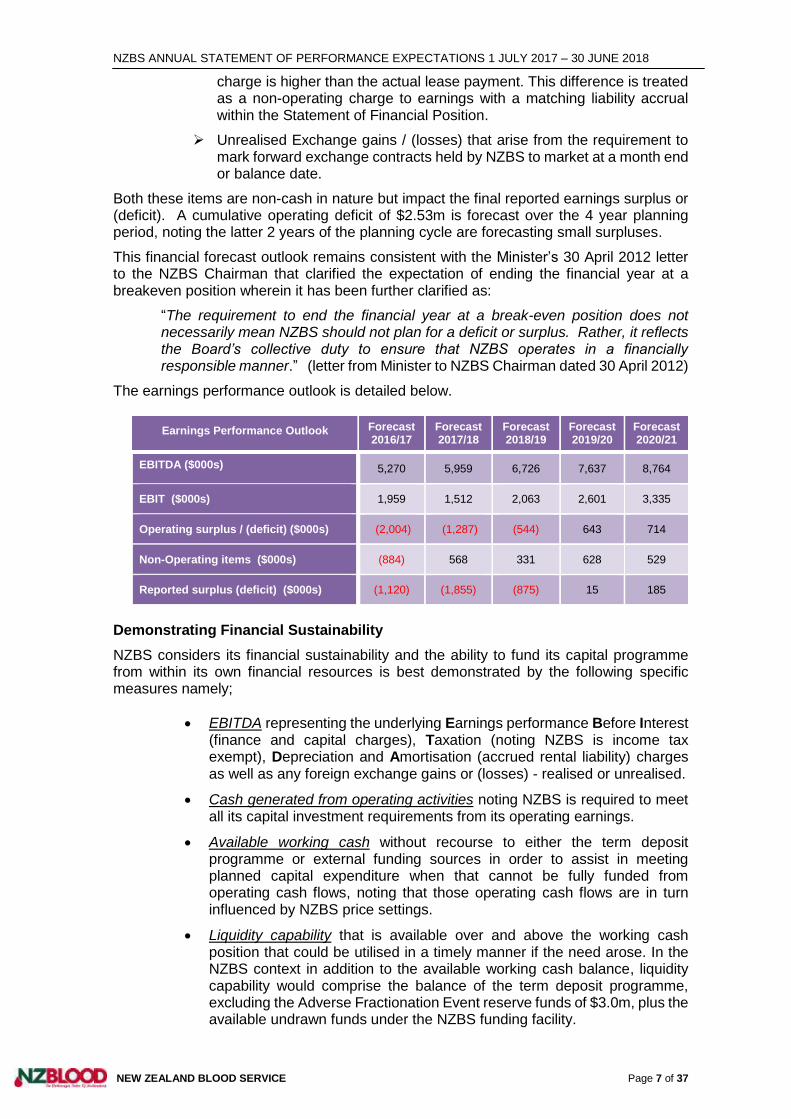
Earnings Performance Outlook
NZBS is forecasting operating deficits for the first 2 years of the planning period effectively absorbing cost on behalf of the sector. In addition NZBS reports non-operating items that arise from international accounting standards compliance obligations. There are two reporting compliance items classified by NZBS as non-operating items namely;
Accrued Rent Payable which is a charge arising from the compliance requirement to amortise the Christchurch Blood Centre lease over the term of the initial lease. In the first half of the lease term the amortised
NZBS ANNUAL STATEMENT OF PERFORMANCE EXPECTATIONS 1 JULY 2017 – 30 JUNE 2018
NEW ZEALAND BLOOD SERVICE Page 7 of 37
charge is higher than the actual lease payment. This difference is treated as a non-operating charge to earnings with a matching liability accrual within the Statement of Financial Position.
Unrealised Exchange gains / (losses) that arise from the requirement to mark forward exchange contracts held by NZBS to market at a month end or balance date.
Both these items are non-cash in nature but impact the final reported earnings surplus or (deficit). A cumulative operating deficit of $2.53m is forecast over the 4 year planning period, noting the latter 2 years of the planning cycle are forecasting small surpluses.
This financial forecast outlook remains consistent with the Minister’s 30 April 2012 letter to the NZBS Chairman that clarified the expectation of ending the financial year at a breakeven position wherein it has been further clarified as:
“The requirement to end the financial year at a break-even position does not necessarily mean NZBS should not plan for a deficit or surplus. Rather, it reflects the Board’s collective duty to ensure that NZBS operates in a financially responsible manner.” (letter from Minister to NZBS Chairman dated 30 April 2012)
The earnings performance outlook is detailed below.
Earnings Performance Outlook Forecast 2016/17
Forecast 2017/18
Forecast 2018/19
Forecast 2019/20
Forecast 2020/21
EBITDA ($000s) 5,270 5,959 6,726 7,637 8,764
EBIT ($000s) 1,959 1,512 2,063 2,601 3,335
Operating surplus / (deficit) ($000s) (2,004) (1,287) (544) 643 714
Non-Operating items ($000s) (884) 568 331 628 529
Reported surplus (deficit) ($000s) (1,120) (1,855) (875) 15 185
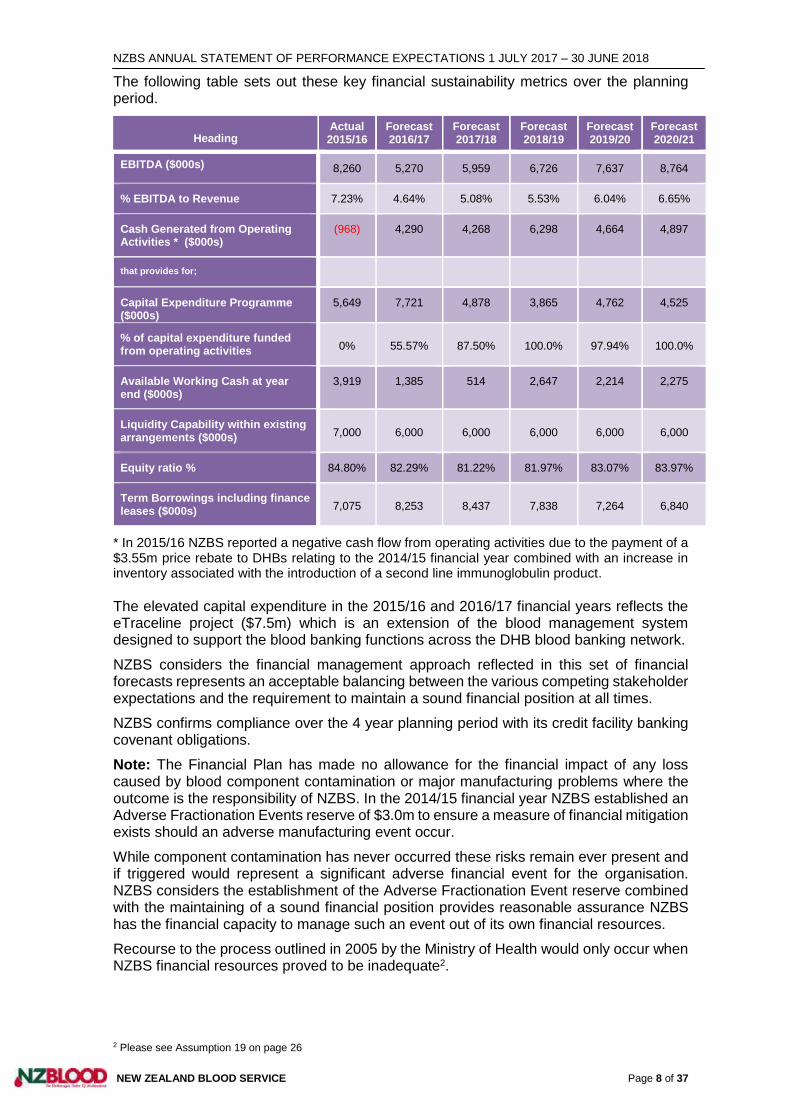
Demonstrating Financial Sustainability
NZBS considers its financial sustainability and the ability to fund its capital programme from within its own financial resources is best demonstrated by the following specific measures namely;
EBITDA representing the underlying Earnings performance Before Interest (finance and capital charges), Taxation (noting NZBS is income tax exempt), Depreciation and Amortisation (accrued rental liability) charges as well as any foreign exchange gains or (losses) - realised or unrealised.
Cash generated from operating activities noting NZBS is required to meet all its capital investment requirements from its operating earnings.
Available working cash without recourse to either the term deposit programme or external funding sources in order to assist in meeting planned capital expenditure when that cannot be fully funded from operating cash flows, noting that those operating cash flows are in turn influenced by NZBS price settings.
Liquidity capability that is available over and above the working cash position that could be utilised in a timely manner if the need arose. In the NZBS context in addition to the available working cash balance, liquidity capability would comprise the balance of the term deposit programme, excluding the Adverse Fractionation Event reserve funds of $3.0m, plus the available undrawn funds under the NZBS funding facility.
NZBS ANNUAL STATEMENT OF PERFORMANCE EXPECTATIONS 1 JULY 2017 – 30 JUNE 2018
NEW ZEALAND BLOOD SERVICE Page 8 of 37
The following table sets out these key financial sustainability metrics over the planning period.
Heading Actual 2015/16
Forecast 2016/17
Forecast 2017/18
Forecast 2018/19
Forecast 2019/20
Forecast 2020/21
EBITDA ($000s) 8,260 5,270 5,959 6,726 7,637 8,764
% EBITDA to Revenue 7.23% 4.64% 5.08% 5.53% 6.04% 6.65%
Cash Generated from Operating Activities * ($000s)
(968) 4,290 4,268 6,298 4,664 4,897
that provides for;
Capital Expenditure Programme ($000s)
5,649 7,721 4,878 3,865 4,762 4,525
% of capital expenditure funded from operating activities 0% 55.57% 87.50% 100.0% 97.94% 100.0%
Available Working Cash at year end ($000s)
3,919 1,385 514 2,647 2,214 2,275
Liquidity Capability within existing arrangements ($000s) 7,000 6,000 6,000 6,000 6,000 6,000
Equity ratio % 84.80% 82.29% 81.22% 81.97% 83.07% 83.97%
Term Borrowings including finance leases ($000s) 7,075 8,253 8,437 7,838 7,264 6,840
* In 2015/16 NZBS reported a negative cash flow from operating activities due to the payment of a $3.55m price rebate to DHBs relating to the 2014/15 financial year combined with an increase in inventory associated with the introduction of a second line immunoglobulin product.
The elevated capital expenditure in the 2015/16 and 2016/17 financial years reflects the eTraceline project ($7.5m) which is an extension of the blood management system designed to support the blood banking functions across the DHB blood banking network.
NZBS considers the financial management approach reflected in this set of financial forecasts represents an acceptable balancing between the various competing stakeholder expectations and the requirement to maintain a sound financial position at all times.
NZBS confirms compliance over the 4 year planning period with its credit facility banking covenant obligations.
Note: The Financial Plan has made no allowance for the financial impact of any loss caused by blood component contamination or major manufacturing problems where the outcome is the responsibility of NZBS. In the 2014/15 financial year NZBS established an Adverse Fractionation Events reserve of $3.0m to ensure a measure of financial mitigation exists should an adverse manufacturing event occur.
While component contamination has never occurred these risks remain ever present and if triggered would represent a significant adverse financial event for the organisation. NZBS considers the establishment of the Adverse Fractionation Event reserve combined with the maintaining of a sound financial position provides reasonable assurance NZBS has the financial capacity to manage such an event out of its own financial resources.
Recourse to the process outlined in 2005 by the Ministry of Health would only occur when NZBS financial resources proved to be inadequate2.
2 Please see Assumption 19 on page 26
NZBS ANNUAL STATEMENT OF PERFORMANCE EXPECTATIONS 1 JULY 2017 – 30 JUNE 2018
NEW ZEALAND BLOOD SERVICE Page 9 of 37
Statement of Performance Expectations Structure
This Statement of Performance Expectations is structured in two parts:
Part I provides a concise tabulated explanation of how performance is to be assessed for the period 1 July 2017 to 30 June 2018 and in more general terms for the subsequent 3 years and consists of:
the Forecast Statement of Externally Focused Service Performance which NZBS will report on in its Annual Report for 2017/18; and
Forecast Statement of Internally Focused Service Performance (Capability and Input Measures) relating to internal NZBS activities;
Part II presents:
Forecast Financial Statements for the 4 years to 30 June 2021;
Supporting assumptions; and
Statement of Accounting Policies.
David Chamberlain Ian Ward Sam Cliffe
Chairman Deputy Chairman Chief Executive
Date: 19 April 2017
NZBS ANNUAL STATEMENT OF PERFORMANCE EXPECTATIONS 1 JULY 2016 – 30 JUNE 2017
NEW ZEALAND BLOOD SERVICE Page 10 of 37
PART I
2 FORECAST STATEMENT OF SERVICE PERFORMANCE
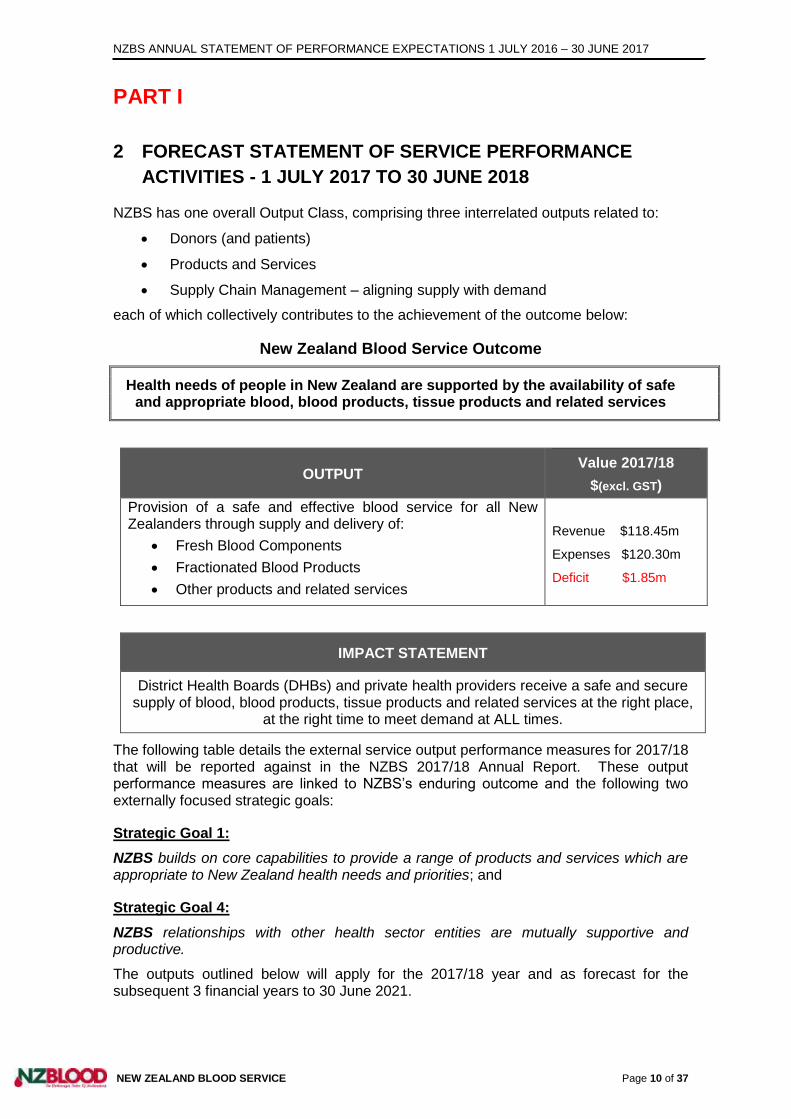
ACTIVITIES - 1 JULY 2017 TO 30 JUNE 2018 NZBS has one overall Output Class, comprising three interrelated outputs related to:
Donors (and patients)
Products and Services
Supply Chain Management – aligning supply with demand
each of which collectively contributes to the achievement of the outcome below:
New Zealand Blood Service Outcome
Health needs of people in New Zealand are supported by the availability of safe and appropriate blood, blood products, tissue products and related services
OUTPUT Value 2017/18
$(excl. GST)
Provision of a safe and effective blood service for all New Zealanders through supply and delivery of:
Fresh Blood Components
Fractionated Blood Products
Other products and related services
Revenue $118.45m
Expenses $120.30m
Deficit $1.85m
IMPACT STATEMENT
District Health Boards (DHBs) and private health providers receive a safe and secure supply of blood, blood products, tissue products and related services at the right place,
at the right time to meet demand at ALL times.
The following table details the external service output performance measures for 2017/18 that will be reported against in the NZBS 2017/18 Annual Report. These output performance measures are linked to NZBS’s enduring outcome and the following two externally focused strategic goals:
Strategic Goal 1:
NZBS builds on core capabilities to provide a range of products and services which are appropriate to New Zealand health needs and priorities; and
Strategic Goal 4:
NZBS relationships with other health sector entities are mutually supportive and productive.
The outputs outlined below will apply for the 2017/18 year and as forecast for the subsequent 3 financial years to 30 June 2021.
NZBS ANNUAL STATEMENT OF PERFORMANCE EXPECTATIONS 1 JULY 2017 – 30 JUNE 2018
NEW ZEALAND BLOOD SERVICE Page 11 of 37
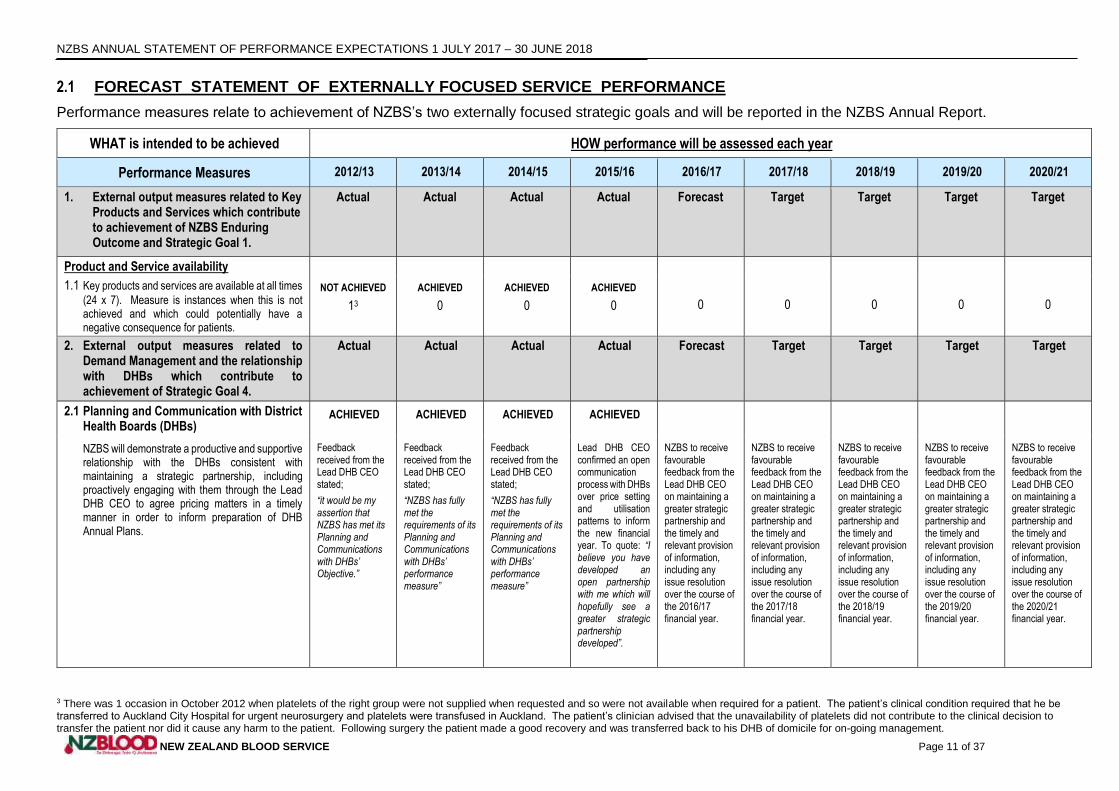
2.1 FORECAST STATEMENT OF EXTERNALLY FOCUSED SERVICE PERFORMANCE
Performance measures relate to achievement of NZBS’s two externally focused strategic goals and will be reported in the NZBS Annual Report.
WHAT is intended to be achieved HOW performance will be assessed each year
Performance Measures 2012/13 2013/14 2014/15 2015/16 2016/17 2017/18 2018/19 2019/20 2020/21
1. External output measures related to Key Products and Services which contribute to achievement of NZBS Enduring Outcome and Strategic Goal 1.
Actual Actual Actual Actual Forecast Target Target Target
Target
Product and Service availability
1.1 Key products and services are available at all times
(24 x 7). Measure is instances when this is not achieved and which could potentially have a negative consequence for patients.
NOT ACHIEVED
13
ACHIEVED
0
ACHIEVED
0
ACHIEVED
0
0
0
0
0
0
2. External output measures related to Demand Management and the relationship with DHBs which contribute to achievement of Strategic Goal 4.
Actual Actual Actual Actual Forecast Target Target Target Target
2.1 Planning and Communication with District Health Boards (DHBs)
ACHIEVED ACHIEVED ACHIEVED ACHIEVED
NZBS will demonstrate a productive and supportive relationship with the DHBs consistent with maintaining a strategic partnership, including proactively engaging with them through the Lead DHB CEO to agree pricing matters in a timely manner in order to inform preparation of DHB Annual Plans.
Feedback received from the Lead DHB CEO stated;
“it would be my assertion that NZBS has met its Planning and Communications with DHBs’ Objective.”
Feedback received from the Lead DHB CEO stated;
“NZBS has fully met the requirements of its Planning and Communications with DHBs’ performance measure”
Feedback received from the Lead DHB CEO stated;
“NZBS has fully met the requirements of its Planning and Communications with DHBs’ performance measure”
Lead DHB CEO confirmed an open communication process with DHBs over price setting and utilisation patterns to inform the new financial year. To quote: “I believe you have developed an open partnership with me which will hopefully see a greater strategic partnership developed”.
NZBS to receive favourable feedback from the Lead DHB CEO on maintaining a greater strategic partnership and the timely and relevant provision of information, including any issue resolution over the course of the 2016/17 financial year.
NZBS to receive favourable feedback from the Lead DHB CEO on maintaining a greater strategic partnership and the timely and relevant provision of information, including any issue resolution over the course of the 2017/18 financial year.
NZBS to receive favourable feedback from the Lead DHB CEO on maintaining a greater strategic partnership and the timely and relevant provision of information, including any issue resolution over the course of the 2018/19 financial year.
NZBS to receive favourable feedback from the Lead DHB CEO on maintaining a greater strategic partnership and the timely and relevant provision of information, including any issue resolution over the course of the 2019/20 financial year.
NZBS to receive favourable feedback from the Lead DHB CEO on maintaining a greater strategic partnership and the timely and relevant provision of information, including any issue resolution over the course of the 2020/21 financial year.
3 There was 1 occasion in October 2012 when platelets of the right group were not supplied when requested and so were not available when required for a patient. The patient’s clinical condition required that he be transferred to Auckland City Hospital for urgent neurosurgery and platelets were transfused in Auckland. The patient’s clinician advised that the unavailability of platelets did not contribute to the clinical decision to transfer the patient nor did it cause any harm to the patient. Following surgery the patient made a good recovery and was transferred back to his DHB of domicile for on-going management.
NZBS ANNUAL STATEMENT OF PERFORMANCE EXPECTATIONS 1 JULY 2017 – 30 JUNE 2018
NEW ZEALAND BLOOD SERVICE Page 12 of 37
Performance Measures 2012/13 2013/14 2014/15 2015/16 2016/17 2017/18 2018/19 2019/20 2020/21
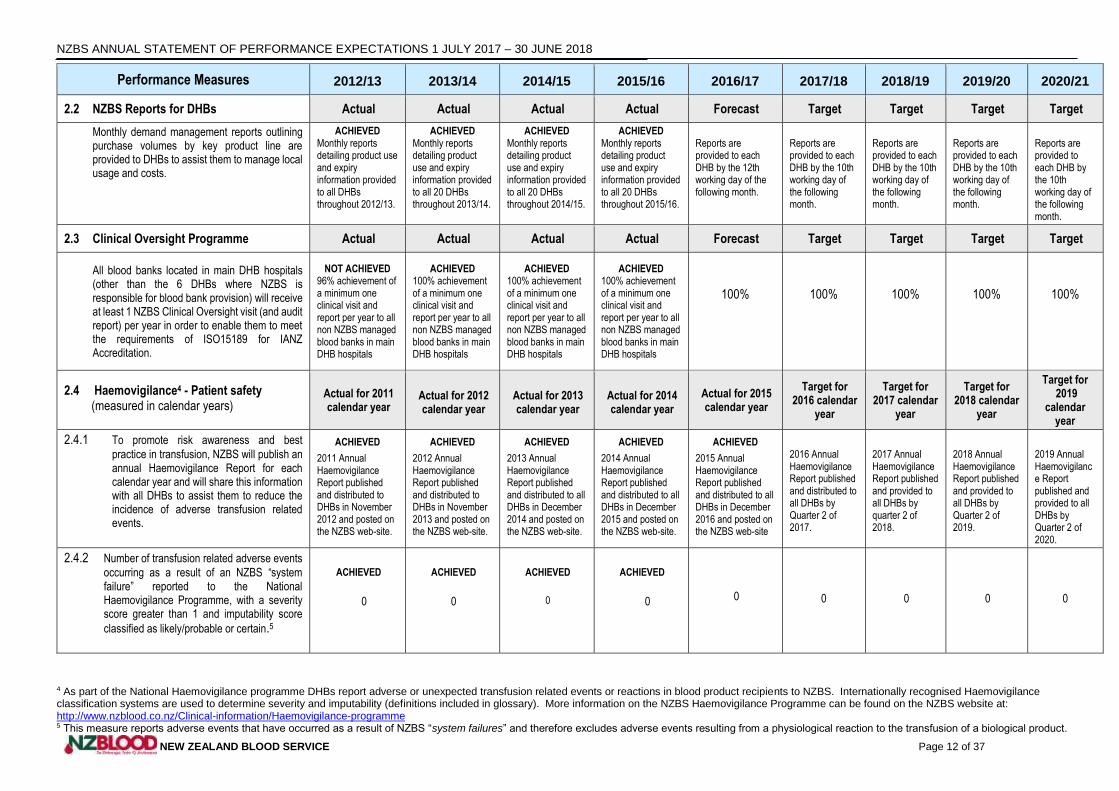
2.2 NZBS Reports for DHBs Actual Actual Actual Actual Forecast Target Target Target Target
Monthly demand management reports outlining purchase volumes by key product line are provided to DHBs to assist them to manage local usage and costs.
ACHIEVED Monthly reports detailing product use and expiry information provided to all DHBs throughout 2012/13.
ACHIEVED Monthly reports detailing product use and expiry information provided to all 20 DHBs throughout 2013/14.
ACHIEVED Monthly reports detailing product use and expiry information provided to all 20 DHBs throughout 2014/15.
ACHIEVED Monthly reports detailing product use and expiry information provided to all 20 DHBs throughout 2015/16.
Reports are provided to each DHB by the 12th working day of the following month.
Reports are provided to each DHB by the 10th working day of the following month.
Reports are provided to each DHB by the 10th working day of the following month.
Reports are provided to each DHB by the 10th working day of the following month.
Reports are provided to each DHB by the 10th working day of the following month.
2.3 Clinical Oversight Programme Actual Actual Actual Actual Forecast Target Target Target Target
All blood banks located in main DHB hospitals (other than the 6 DHBs where NZBS is responsible for blood bank provision) will receive at least 1 NZBS Clinical Oversight visit (and audit report) per year in order to enable them to meet the requirements of ISO15189 for IANZ Accreditation.
NOT ACHIEVED 96% achievement of a minimum one clinical visit and report per year to all non NZBS managed blood banks in main DHB hospitals
ACHIEVED 100% achievement of a minimum one clinical visit and report per year to all non NZBS managed blood banks in main DHB hospitals
ACHIEVED 100% achievement of a minimum one clinical visit and report per year to all non NZBS managed blood banks in main DHB hospitals
ACHIEVED 100% achievement of a minimum one clinical visit and report per year to all non NZBS managed blood banks in main DHB hospitals
100% 100% 100% 100% 100%
2.4 Haemovigilance4 - Patient safety (measured in calendar years)
Actual for 2011 calendar year
Actual for 2012 calendar year
Actual for 2013 calendar year
Actual for 2014 calendar year
Actual for 2015 calendar year
Target for 2016 calendar
year
Target for 2017 calendar
year
Target for 2018 calendar
year
Target for 2019
calendar year
2.4.1 To promote risk awareness and best
practice in transfusion, NZBS will publish an annual Haemovigilance Report for each calendar year and will share this information with all DHBs to assist them to reduce the incidence of adverse transfusion related events.
ACHIEVED
2011 Annual Haemovigilance Report published and distributed to DHBs in November 2012 and posted on the NZBS web-site.
ACHIEVED
2012 Annual Haemovigilance Report published and distributed to DHBs in November 2013 and posted on the NZBS web-site.
ACHIEVED
2013 Annual Haemovigilance Report published and distributed to all DHBs in December 2014 and posted on the NZBS web-site.
ACHIEVED
2014 Annual Haemovigilance Report published and distributed to all DHBs in December 2015 and posted on the NZBS web-site.
ACHIEVED
2015 Annual Haemovigilance Report published and distributed to all DHBs in December 2016 and posted on the NZBS web-site
2016 Annual Haemovigilance Report published and distributed to all DHBs by Quarter 2 of 2017.
2017 Annual Haemovigilance Report published and provided to all DHBs by quarter 2 of 2018.
2018 Annual Haemovigilance Report published and provided to all DHBs by Quarter 2 of 2019.
2019 Annual Haemovigilance Report published and provided to all DHBs by Quarter 2 of 2020.
2.4.2 Number of transfusion related adverse events
occurring as a result of an NZBS “system failure” reported to the National Haemovigilance Programme, with a severity score greater than 1 and imputability score
classified as likely/probable or certain.5
ACHIEVED
0
ACHIEVED
0
ACHIEVED
0
ACHIEVED
0
0
0
0
0
0
4 As part of the National Haemovigilance programme DHBs report adverse or unexpected transfusion related events or reactions in blood product recipients to NZBS. Internationally recognised Haemovigilance classification systems are used to determine severity and imputability (definitions included in glossary). More information on the NZBS Haemovigilance Programme can be found on the NZBS website at: http://www.nzblood.co.nz/Clinical-information/Haemovigilance-programme 5 This measure reports adverse events that have occurred as a result of NZBS “system failures” and therefore excludes adverse events resulting from a physiological reaction to the transfusion of a biological product.
NZBS ANNUAL STATEMENT OF PERFORMANCE EXPECTATIONS 1 JULY 2017 – 30 JUNE 2018
NEW ZEALAND BLOOD SERVICE Page 13 of 37
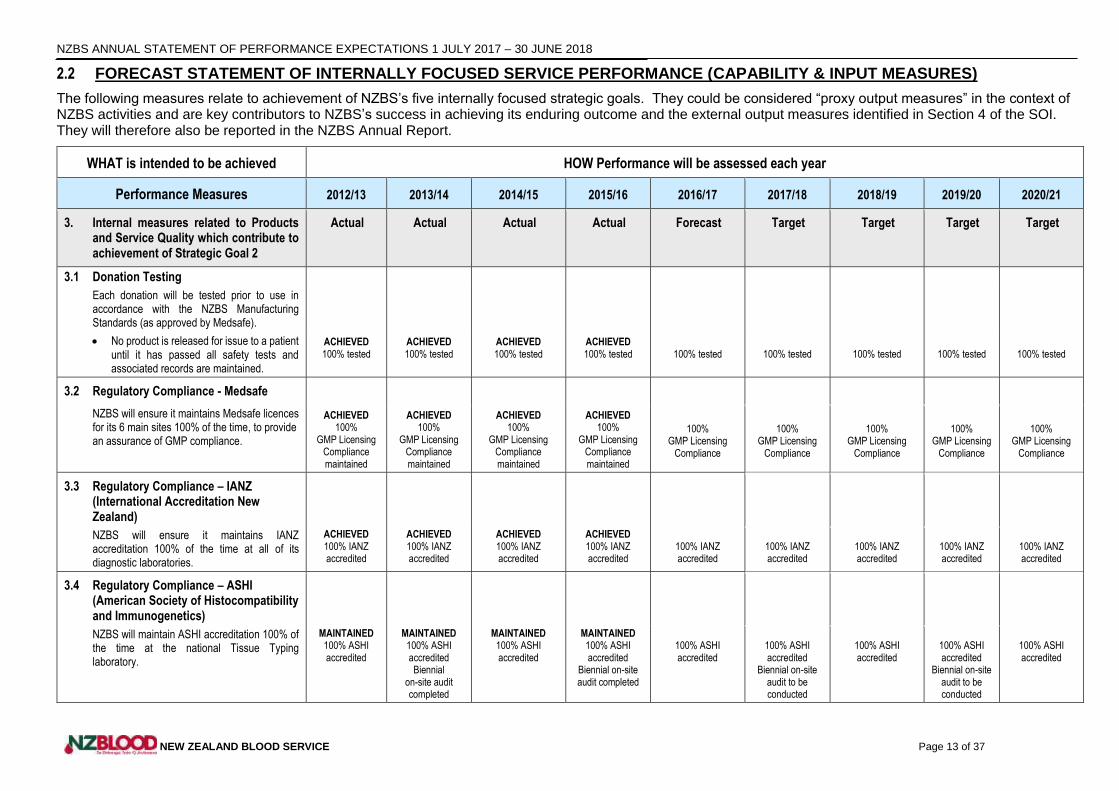
2.2 FORECAST STATEMENT OF INTERNALLY FOCUSED SERVICE PERFORMANCE (CAPABILITY & INPUT MEASURES)
The following measures relate to achievement of NZBS’s five internally focused strategic goals. They could be considered “proxy output measures” in the context of NZBS activities and are key contributors to NZBS’s success in achieving its enduring outcome and the external output measures identified in Section 4 of the SOI. They will therefore also be reported in the NZBS Annual Report.
WHAT is intended to be achieved HOW Performance will be assessed each year
Performance Measures 2012/13 2013/14 2014/15 2015/16 2016/17 2017/18 2018/19 2019/20 2020/21
3. Internal measures related to Products and Service Quality which contribute to achievement of Strategic Goal 2
Actual Actual Actual Actual Forecast Target Target Target Target
3.1 Donation Testing
Each donation will be tested prior to use in accordance with the NZBS Manufacturing Standards (as approved by Medsafe).
No product is released for issue to a patient until it has passed all safety tests and associated records are maintained.
ACHIEVED 100% tested
ACHIEVED 100% tested
ACHIEVED 100% tested
ACHIEVED 100% tested
100% tested
100% tested
100% tested
100% tested
100% tested
3.2 Regulatory Compliance - Medsafe
NZBS will ensure it maintains Medsafe licences for its 6 main sites 100% of the time, to provide an assurance of GMP compliance.
ACHIEVED 100%
GMP Licensing Compliance maintained
ACHIEVED 100%
GMP Licensing Compliance maintained
ACHIEVED 100%
GMP Licensing Compliance maintained
ACHIEVED 100%
GMP Licensing Compliance maintained
100% GMP Licensing
Compliance
100% GMP Licensing
Compliance
100% GMP Licensing
Compliance
100% GMP Licensing
Compliance
100% GMP Licensing
Compliance
3.3 Regulatory Compliance – IANZ (International Accreditation New Zealand)
NZBS will ensure it maintains IANZ accreditation 100% of the time at all of its diagnostic laboratories.
ACHIEVED 100% IANZ accredited
ACHIEVED 100% IANZ accredited
ACHIEVED 100% IANZ accredited
ACHIEVED 100% IANZ accredited
100% IANZ accredited
100% IANZ accredited
100% IANZ accredited
100% IANZ accredited
100% IANZ accredited
3.4 Regulatory Compliance – ASHI (American Society of Histocompatibility and Immunogenetics)
NZBS will maintain ASHI accreditation 100% of the time at the national Tissue Typing laboratory.
MAINTAINED 100% ASHI accredited
MAINTAINED 100% ASHI accredited Biennial
on-site audit completed
MAINTAINED 100% ASHI accredited
MAINTAINED 100% ASHI accredited
Biennial on-site audit completed
100% ASHI accredited
100% ASHI accredited
Biennial on-site audit to be conducted
100% ASHI accredited
100% ASHI accredited
Biennial on-site audit to be conducted
100% ASHI accredited
NZBS ANNUAL STATEMENT OF PERFORMANCE EXPECTATIONS 1 JULY 2017 – 30 JUNE 2018
NEW ZEALAND BLOOD SERVICE Page 14 of 37
Performance Measures 2012/13 2013/14 2014/15 2015/16 2016/17 2017/18 2018/19 2019/20 2020/21
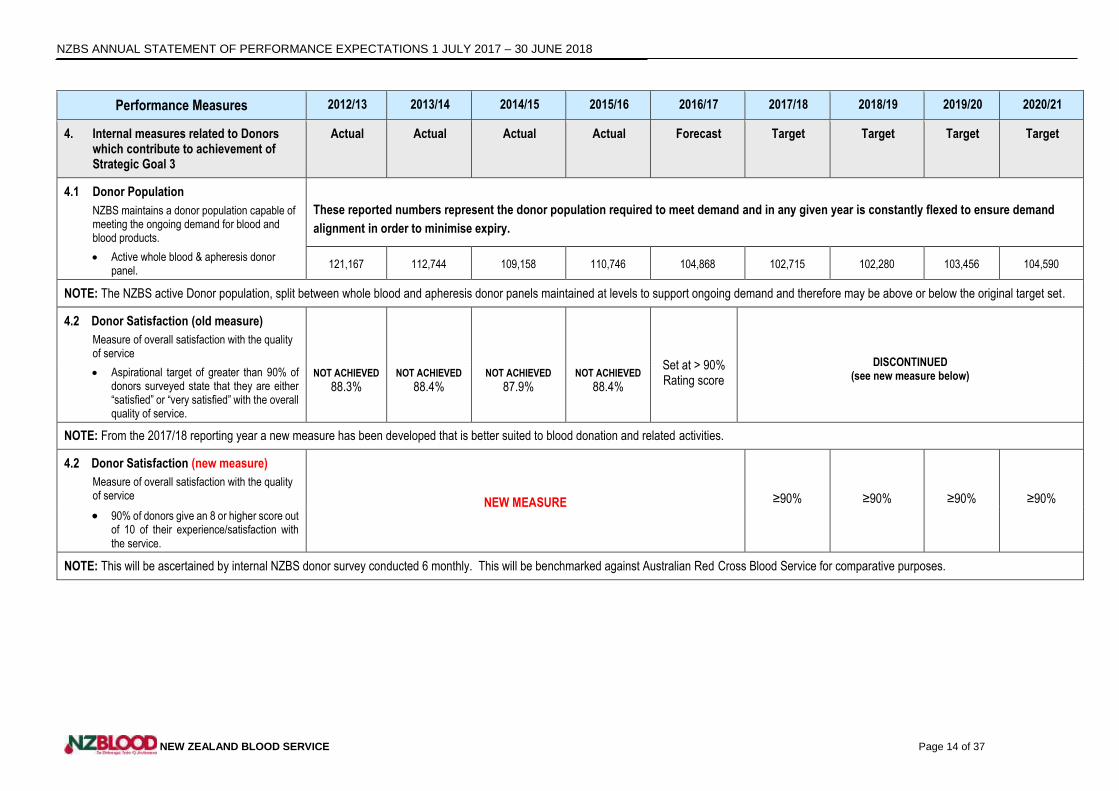
4. Internal measures related to Donors which contribute to achievement of Strategic Goal 3
Actual Actual Actual Actual Forecast Target Target Target Target
4.1 Donor Population
NZBS maintains a donor population capable of meeting the ongoing demand for blood and blood products.
These reported numbers represent the donor population required to meet demand and in any given year is constantly flexed to ensure demand
alignment in order to minimise expiry.
Active whole blood & apheresis donor panel.
121,167 112,744 109,158 110,746 104,868 102,715 102,280 103,456 104,590
NOTE: The NZBS active Donor population, split between whole blood and apheresis donor panels maintained at levels to support ongoing demand and therefore may be above or below the original target set.
4.2 Donor Satisfaction (old measure)
Measure of overall satisfaction with the quality of service
NOT ACHIEVED
88.3% NOT ACHIEVED
88.4% NOT ACHIEVED
87.9% NOT ACHIEVED
88.4%
Set at > 90% Rating score
DISCONTINUED (see new measure below) Aspirational target of greater than 90% of
donors surveyed state that they are either “satisfied” or “very satisfied” with the overall quality of service.
NOTE: From the 2017/18 reporting year a new measure has been developed that is better suited to blood donation and related activities.
4.2 Donor Satisfaction (new measure)
Measure of overall satisfaction with the quality of service
NEW MEASURE ≥90% ≥90% ≥90% ≥90%
90% of donors give an 8 or higher score out of 10 of their experience/satisfaction with the service.
NOTE: This will be ascertained by internal NZBS donor survey conducted 6 monthly. This will be benchmarked against Australian Red Cross Blood Service for comparative purposes.
NZBS ANNUAL STATEMENT OF PERFORMANCE EXPECTATIONS 1 JULY 2017 – 30 JUNE 2018
NEW ZEALAND BLOOD SERVICE Page 15 of 37
Performance Measures 2012/13 2013/14 2014/15 2015/16 2016/17 2017/18 2018/19 2019/20 2020/21
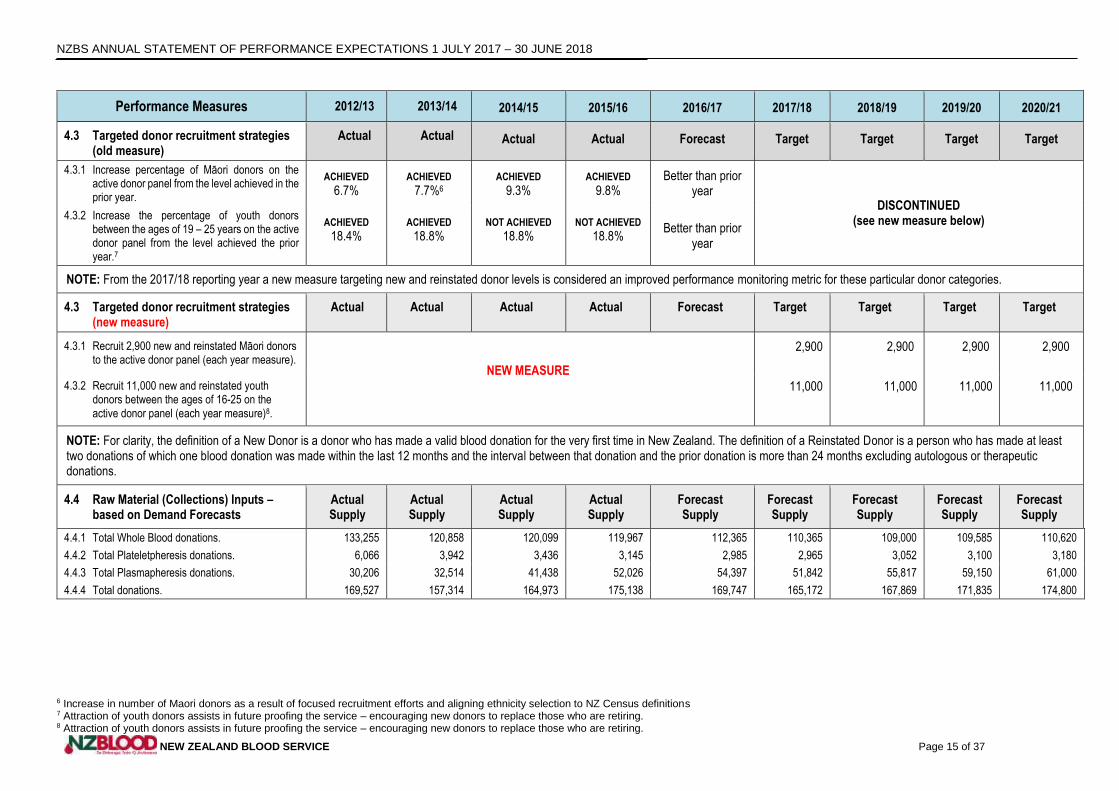
4.3 Targeted donor recruitment strategies (old measure)
Actual Actual Actual Actual Forecast Target Target Target Target
4.3.1 Increase percentage of Māori donors on the active donor panel from the level achieved in the prior year.
ACHIEVED
6.7% ACHIEVED
7.7%6 ACHIEVED
9.3% ACHIEVED
9.8% Better than prior
year DISCONTINUED
(see new measure below) 4.3.2 Increase the percentage of youth donors between the ages of 19 – 25 years on the active donor panel from the level achieved the prior year.7
ACHIEVED
18.4% ACHIEVED
18.8% NOT ACHIEVED
18.8% NOT ACHIEVED
18.8% Better than prior
year
NOTE: From the 2017/18 reporting year a new measure targeting new and reinstated donor levels is considered an improved performance monitoring metric for these particular donor categories.
4.3 Targeted donor recruitment strategies (new measure)
Actual Actual Actual Actual Forecast Target Target Target Target
4.3.1 Recruit 2,900 new and reinstated Māori donors to the active donor panel (each year measure).
NEW MEASURE
2,900 2,900 2,900 2,900
4.3.2 Recruit 11,000 new and reinstated youth donors between the ages of 16-25 on the active donor panel (each year measure)8.
11,000 11,000 11,000 11,000
NOTE: For clarity, the definition of a New Donor is a donor who has made a valid blood donation for the very first time in New Zealand. The definition of a Reinstated Donor is a person who has made at least two donations of which one blood donation was made within the last 12 months and the interval between that donation and the prior donation is more than 24 months excluding autologous or therapeutic donations.
4.4 Raw Material (Collections) Inputs – based on Demand Forecasts
Actual Supply
Actual Supply
Actual Supply
Actual Supply
Forecast Supply
Forecast Supply
Forecast Supply
Forecast Supply
Forecast Supply
4.4.1 Total Whole Blood donations. 133,255 120,858 120,099 119,967 112,365 110,365 109,000 109,585 110,620
4.4.2 Total Plateletpheresis donations. 6,066 3,942 3,436 3,145 2,985 2,965 3,052 3,100 3,180
4.4.3 Total Plasmapheresis donations. 30,206 32,514 41,438 52,026 54,397 51,842 55,817 59,150 61,000
4.4.4 Total donations. 169,527 157,314 164,973 175,138 169,747 165,172 167,869 171,835 174,800
6 Increase in number of Maori donors as a result of focused recruitment efforts and aligning ethnicity selection to NZ Census definitions 7 Attraction of youth donors assists in future proofing the service – encouraging new donors to replace those who are retiring. 8 Attraction of youth donors assists in future proofing the service – encouraging new donors to replace those who are retiring.
NZBS ANNUAL STATEMENT OF PERFORMANCE EXPECTATIONS 1 JULY 2017 – 30 JUNE 2018
NEW ZEALAND BLOOD SERVICE Page 16 of 37
Performance Measures 2012/13 2013/14 2014/15 2015/16 2016/17 2017/18 2018/19 2019/20 2020/21
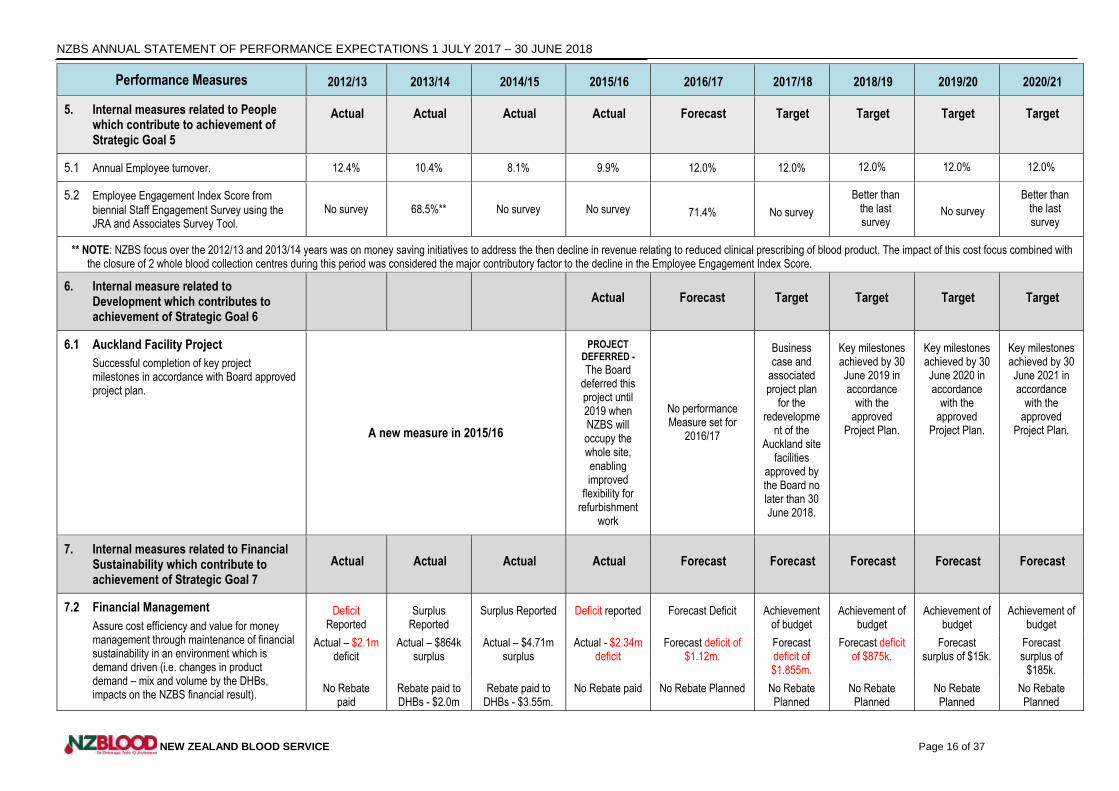
5. Internal measures related to People which contribute to achievement of Strategic Goal 5
Actual Actual Actual Actual Forecast Target Target Target Target
5.1 Annual Employee turnover. 12.4% 10.4% 8.1% 9.9% 12.0% 12.0% 12.0% 12.0% 12.0%
5.2 Employee Engagement Index Score from
biennial Staff Engagement Survey using the JRA and Associates Survey Tool.
No survey 68.5%** No survey No survey
71.4%
No survey
Better than the last survey
No survey
Better than the last survey
** NOTE: NZBS focus over the 2012/13 and 2013/14 years was on money saving initiatives to address the then decline in revenue relating to reduced clinical prescribing of blood product. The impact of this cost focus combined with the closure of 2 whole blood collection centres during this period was considered the major contributory factor to the decline in the Employee Engagement Index Score.
6. Internal measure related to Development which contributes to achievement of Strategic Goal 6
Actual
Forecast
Target
Target
Target
Target
6.1 Auckland Facility Project
Successful completion of key project milestones in accordance with Board approved project plan.
A new measure in 2015/16
PROJECT DEFERRED -
The Board deferred this project until 2019 when NZBS will occupy the whole site, enabling improved
flexibility for refurbishment
work
No performance Measure set for
2016/17
Business case and
associated project plan
for the redevelopme
nt of the Auckland site
facilities approved by the Board no later than 30 June 2018.
Key milestones achieved by 30 June 2019 in accordance
with the approved
Project Plan.
Key milestones achieved by 30 June 2020 in accordance
with the approved
Project Plan.
Key milestones achieved by 30 June 2021 in accordance
with the approved
Project Plan.
7. Internal measures related to Financial Sustainability which contribute to achievement of Strategic Goal 7
Actual Actual Actual Actual Forecast Forecast Forecast Forecast Forecast
7.2 Financial Management
Assure cost efficiency and value for money management through maintenance of financial sustainability in an environment which is demand driven (i.e. changes in product demand – mix and volume by the DHBs, impacts on the NZBS financial result).
Deficit Reported
Surplus Reported
Surplus Reported Deficit reported Forecast Deficit Achievement of budget
Achievement of budget
Achievement of budget
Achievement of budget
Actual – $2.1m deficit
Actual – $864k surplus
Actual – $4.71m surplus
Actual - $2.34m deficit
Forecast deficit of $1.12m.
Forecast deficit of $1.855m.
Forecast deficit of $875k.
Forecast surplus of $15k.
Forecast surplus of
$185k.
No Rebate paid
Rebate paid to DHBs - $2.0m
Rebate paid to DHBs - $3.55m.
No Rebate paid No Rebate Planned No Rebate Planned
No Rebate Planned
No Rebate Planned
No Rebate Planned
NZBS ANNUAL STATEMENT OF PERFORMANCE EXPECTATIONS 1 JULY 2017 – 30 JUNE 2018
NEW ZEALAND BLOOD SERVICE Page 17 of 37
PART II
3 FINANCIAL PLAN
3.1 OVERVIEW OF FINANCIAL PLAN
The 2017/18 Financial Plan has been based on the 2016/17 base year forecast, incorporating actual results and trending demand patterns evident as at 31 January 2017. The NZBS planning environment remains “challenging” with a demand outlook consistent with blood management practices being constantly assessed and refined by the District Health Boards (DHBs). Demand for primary fresh products has a mix of either declining or generally flat demand and this trend (which is being seen globally) is reflected over this four year planning period.
Using the benchmark of “Product issued / tests performed per 1000 head of population” NZBS is forecasting the following trends over the planning period for its key blood products and services.
(a) Fresh Products – 3.95% decline in issues per 1000 head of population
A decrease in fresh product usage per head of population remains a continuing trend over the forecast timeframe. In 2012/13 fresh products per 1000 head of population stood at 25.84 fresh product units (Red Blood Cells (RBCs), platelets and clinical plasma for transfusion) issued per 1000 head of population. By 2015/16, usage had dropped to 22.65 fresh product units issued per 1000 head of population, a 12.3% decline over that 3 year period.
Continuation of this declining trend, albeit at a slower decline, is anticipated over this planning period with fresh product demand forecast to be at 20.65 units issued per 1000 head of population by 2020/21. This represents a 3.95% decrease in issues per 1000 head of population over the planning period.
(b) Immunoglobulin Product – 8.1% increase in grams issued per 1000 head of population
Unlike fresh blood product, Immunoglobulin product (comprising Intragam P, Evogam and Privigen product) has generally continued to see year on year increases in demand. Over the 8 years to 30 June 2016 immunoglobulin annual demand growth averaged 6.2%. However in the last year the rate of annual increase has slowed dramatically with a forecast growth in the 2016/17 financial year of just 0.62%.
For the purposes of this planning forecast NZBS has assumed a much lower average annual growth rate for its immunoglobulin product. Over this 4 year planning period the average annual growth rate is forecast at 3.1%.
Immunoglobulin usage in 2012/13 totalled 64.7 grams per 1000 head of population. By 2015/16 this had increased to 76.0 grams per 1000 head of population, a 20.5% increase over that 3 year period. This level of immunoglobulin usage is significantly lower than what is reported internationally. As a comparison the Australian immunoglobulin usage for 2015/16 was reported to be in the order of 206 grams per 1000 head of population.
Based on the growth assumptions inherent in this plan the use of immunoglobulin product by 2020/21 is forecast to have grown to 81.6 grams per 1000 head of population growth. This translates to a forecast demand increase per 1000 head of population of 8.1% over the 4 year planning period.
NZBS ANNUAL STATEMENT OF PERFORMANCE EXPECTATIONS 1 JULY 2017 – 30 JUNE 2018
NEW ZEALAND BLOOD SERVICE Page 18 of 37
(c) Services – small 0.83% increase in test volumes performed per 1000 head of population
Testing services and related activities are forecast to have nominal growth rate over the 4 year planning period when measured on per 1000 head of population basis. In 2012/13 overall test volumes per 1000 head of population stood at 127.6 test units. By 2015/16 the test unit rate had dropped to 118.2 representing a 7.4% decline over this 3 year period.
For the 2016/17 financial year the test volumes are forecast to have further reduced to 116.9 test units per 1000 head of population. This current plan forecasts that by 2020/21 test unit volumes will have grown marginally to 117.9 test units per 1000 head of population.
These mixed demand profiles require NZBS (like all members of the health sector) to work continuously to improve operational efficiencies and reduce operational cost wherever possible in order to maintain the delivery of an ongoing cost effective operation.
Over this planning period an ongoing focus on delivering operational efficiencies remains a key focus in order to mitigate input cost pressures and ensure price increases to the sector are, ideally, set below the benchmark Consumer Price Index (CPI) annual movement.
The Minister of Health’s clearly stated expectation of NZBS is to keep price increases to DHBs to a minimum albeit balanced against ensuring the entity remains financially viable at all times.
NZBS has set itself an average annual operational cost savings target of $630k over the planning period. NZBS considers its active adoption of LEAN methodologies and other business improvement techniques will act as the key catalysts to securing those operational saving efficiencies.
Over this planning period the programme of infrastructure maintenance and renewal continues, although the level of forecast capital spend over the planning period is forecast to be at a lower average annual level of $4.5m compared to the average annual spend of $5.6m in the 3 financial years, 2014/15 through 2016/17.
The major spend in the last 2 financial years ($7.5m) has related to the extension of the blood management system with the planned addition of eTraceline, a stand-alone system designed to support the blood banking function within the DHBs. eTraceline is planned to go-live 1 July 2017.
The capital programme over the 4 year planning period is forecast at $18.03m and compares with a depreciation charge over that same time of $19.58m. The spend analysis by major category over the planning period comprises;
Facilities - $9.69m. Key projects covered in this plan are;
an extension to and upgrade of the Auckland City Hospital Blood Bank planned for 2017/18 with NZBS working in conjunction with the landlord, the Auckland District Health Board. Capital allowance in 2017/18 of $650k.
Establishment of a Hematopoietic Progenator Cell (HPC) processing facility at the Wellington blood centre planned for 2017/18. Capital allowance in 2017/18 of $400k.
Planning for the relocation of the national office during 2018/19 back to the Auckland Blood Centre (71 Great South Road, Epsom). Once that has taken place NZBS will have secured sole occupancy of this important site.
Sole occupancy enables NZBS to then commence a long planned redevelopment of the site that will ensure it is appropriately configured to meet the foreseeable future needs of the blood service. This redevelopment programme is being planned as a likely 3 year
NZBS ANNUAL STATEMENT OF PERFORMANCE EXPECTATIONS 1 JULY 2017 – 30 JUNE 2018
NEW ZEALAND BLOOD SERVICE Page 19 of 37
programme with a capital allowance at this early stage in the planning process of $5.1m.
Planning for the relocation of the North Shore Blood Centre to new premises at the end of it current lease. The planned timing is for project commencement in the 2019/20 financial year. Capital allowance of $1.55m over the 2019/20 and 2020/21 financial years.
Business Systems and IT Infrastructure - $3.87m over the planning period with the key areas of expenditure identified as;
NZBS Blood Management Systems - $1.50m. In this planning period there is particular focus on improving the donor experience with, as an example, the introduction of a self-administered health history capability. Software upgrades/new installs are planned for donor management, tissue, cord and stem cell management systems as well as the piloting of smart fridges post the introduction of eTraceline.
Business Systems - $1.45m. Reflects planned upgrades to various business systems to improve functional performance. Investment is planned in the mobile / web applications area combined with the ongoing investment in business intelligence capabilities.
Network Infrastructure - $0.92m. Investment required to maintain the existing NZBS network infrastructure noting this level of planned investment is lower than historically provided for. This is due to NZBS planning to adopt, where appropriate, ‘software as a service’ cloud service delivery within the current planning period.
Equipment - $4.47m. A reflection of the ongoing need to maintain all NZBS equipment over the supply chain in suitable working order, particularly where the supply chain is subject to GMP compliance requirements. An emerging trend within the management of the general equipment capital programme has been the willingness of suppliers to offer a finance leasing alternative to outright purchase.
NZBS has and plans to continue using the finance lease option which has the benefit of reducing up-front capital outflows, a lower capital spend in this area reflected within this planning period.
For NZBS the finance leasing option better aligns with the NZBS ‘pay as you go’ business model. The finance leasing option also provides improved flexibility to effect technology driven upgrades with minimum disruption than would occur if NZBS physically owned the equipment in question.
The Minister and sector’s expectation remains one of fiscal restraint. NZBS is required to balance that expectation against;
The requirement to fund ongoing capital needs primarily from operational cash flows and,
the setting of price increases at the minimum required to maintain overall NZBS financial viability.
In that context this plan sees the projected capital spend of $18.03m being 100% covered via depreciation charges. In terms of price increases, the price increases forecast over the 4 year planning period are a compound increase of 8.4% compared with a forecast compound CPI % movement of 7.7% over the same period.
This slightly higher price setting compared to forecast CPI over the planning period is a reflection of the difficult balancing act NZBS faces whithin a very low volume growth environment. Low volume growth makes it difficult to adequately absorb increasing input costs, maintain overall financial viability and keep prices to a minimum. While NZBS has
NZBS ANNUAL STATEMENT OF PERFORMANCE EXPECTATIONS 1 JULY 2017 – 30 JUNE 2018
NEW ZEALAND BLOOD SERVICE Page 20 of 37
worked to minimise its prices in the current environment, it was not possible without some adverse impact on the price setting.
NZBS has a policy mechanism in place to effectively return price increases to the DHBs via a price rebate mechanism, should the actual demand levels and operational performance exceed the forecast financial out-turn. Under this mechanism NZBS last paid a price rebate in the 2014/15 financial year. No price rebates are forecast over this 4 year planning period.
Throughout the planning period NZBS maintains its financial gearing ratio within the range set by the NZBS Financial Guidelines Policy with a range of 81.2% to 84.0% equity component over the planning period. This ratio is lower than reported in prior years due to the recognition of former operating leases as finance leases, such recognition having the effect of increasing the debt ratio. NZBS is forecast to operate at all times within its banking covenant obligations over the planning period.
Ongoing financial sustainability is appropriately maintained over the 4 year planning period with a forecast average annual EBITDA of $7.3m. The average year-end available working cash position is forecast at $1.9m supported by $4.0m on term deposit and an entitlement of $2.0m in undrawn approved credit facilities.
This financial forecast has been prepared as required by the Crown Entities Act 2004 for disclosure in this Statement of Performance Expectations (SPE) and may not be appropriate for any other purpose. If NZBS becomes aware that there are changes to the assumptions detailed below, which may materially impact the stated financial position, this SPE and the SOI (if necessary) will be amended accordingly under section 148 of the Crown Entities Act 2004.
The NZBS Board has agreed the financial forecast at the date of signing of this Statement of Performance Expectations.

NZBS ANNUAL STATEMENT OF PERFORMANCE EXPECTATIONS 1 JULY 2017 – 30 JUNE 2018
NEW ZEALAND BLOOD SERVICE Page 21 of 37
3.2 KEY ASSUMPTIONS
The following assumptions (and risk assessments9 where appropriate) are key elements underpinning the financial forecasts for 2017/18 through to 2020/21:
Assumption Comment / Risk
1. Price Setting – In accordance with the Minister’s
expectation to keep price increases to a minimum while maintaining financial viability and based on the assumed demand mix, the weighted price movements over the 4 year forecast period are set out below.
Year
Prices with Imported
Skin
Price excluding Imported
Skin
2017/18 2.05% 1.99%
2018/19 2.05% 1.96%
2019/20 2.06% 1.98%
2020/21 1.98% 1.90%
NZBS when assessing its price setting performance excludes the impact of imported skin which is denominated in USD and therefore subject to currency fluctuation, something outside NZBS control.
It is acknowledged that should unbudgeted costs create unforeseen financial risks over the period then NZBS may require a price increase greater than indicated in the three outer years.
Risk Assessment: MEDIUM – Cost increases could
exceed indicated price increases causing deterioration in the NZBS financial position, resulting in a requirement for price increases greater than currently indicated in the 3 outer years.
2. Revenue Forecasts – Revenue growth over
the forecast period has been forecast as:
Year % Growth
2017/18 3.47%
2018/19 3.51%
2019/20 3.98%
2020/21 4.33%
Revenue growth is a combination of price and demand (volume) movements. The specific demand assumptions for the key revenue categories are detailed in Assumption 3. Risk Assessment: MEDIUM - With price settings set
annually, the major risk to revenue growth stems from the uncertainty of demand for any given product or service. The demand assumptions taken within these forecasts reflect recent trend indications as well as allowance for any known forward demand impact factors.
3. Demand (Volume) Assumptions –
Demand (sales) growth over the forecast period has been assessed on a weighted product by product basis. The outcome of those assessments is detailed below at product category level.
(a) Summary of Product and Services Demand Growth
Product 2017/18 2018/19 2019/20 2020/21
Fresh (0.21%) (0.12%) 0.13% 0.25%
Fractionated 1.94% 2.29% 3.11% 3.72%
Blood Products 0.75% 1.04% 1.55% 1.92%
Services 0.67% 0.43% 0.37% 0.43%
Overall Total 1.42% 1.46% 1.92% 2.35%
(b) Key Fresh Blood Product Issues
Product 2017/18 2018/19 2019/20 2020/21
RBCs (units) 101,470 100,985 101,503 102,522
Platelets (Adult doses)
15,245 15,500 15,665 15,835
Fresh Plasma (units)
14,500 14,625 14,805 14,935
Cryoprecipitate (units)
5,100 5,150 5,200 5,250
Sales volumes are totally dependent on health sector demand. Demand volatility is an ever present reality for NZBS, although the health and disability sector demographics would indicate that low demand growth can reasonably be assumed with the expectation of an increasing New Zealand population.
As a manufacturer, NZBS endeavours to maintain flexibility within its production settings in order to minimise product expiry and ensure inventory levels are kept aligned to the current individual product demand profiles, having regard to supply chain logistics, manufacturing requirements and product shelf life.
Red Blood Cells (RBCs): RBCs are the primary fresh
product. NZBS is working with the DHBs to actively manage down their utilisation of RBCs which has seen a 5.8% decline in use over the last 4 years. With DHBs increasingly focused on their patient blood management activities or plans, short term decline is expected however population growth and an ageing population may see an offsetting increase in RBC demand. If demand increases or decreases beyond that forecast, whole blood collections (refer Assumption 4) will be flexed as required and accommodated within the current donor panel population.
.
9 Risk Assessment is based on severity and likelihood.
NZBS ANNUAL STATEMENT OF PERFORMANCE EXPECTATIONS 1 JULY 2017 – 30 JUNE 2018
NEW ZEALAND BLOOD SERVICE Page 22 of 37
Assumption Comment / Risk
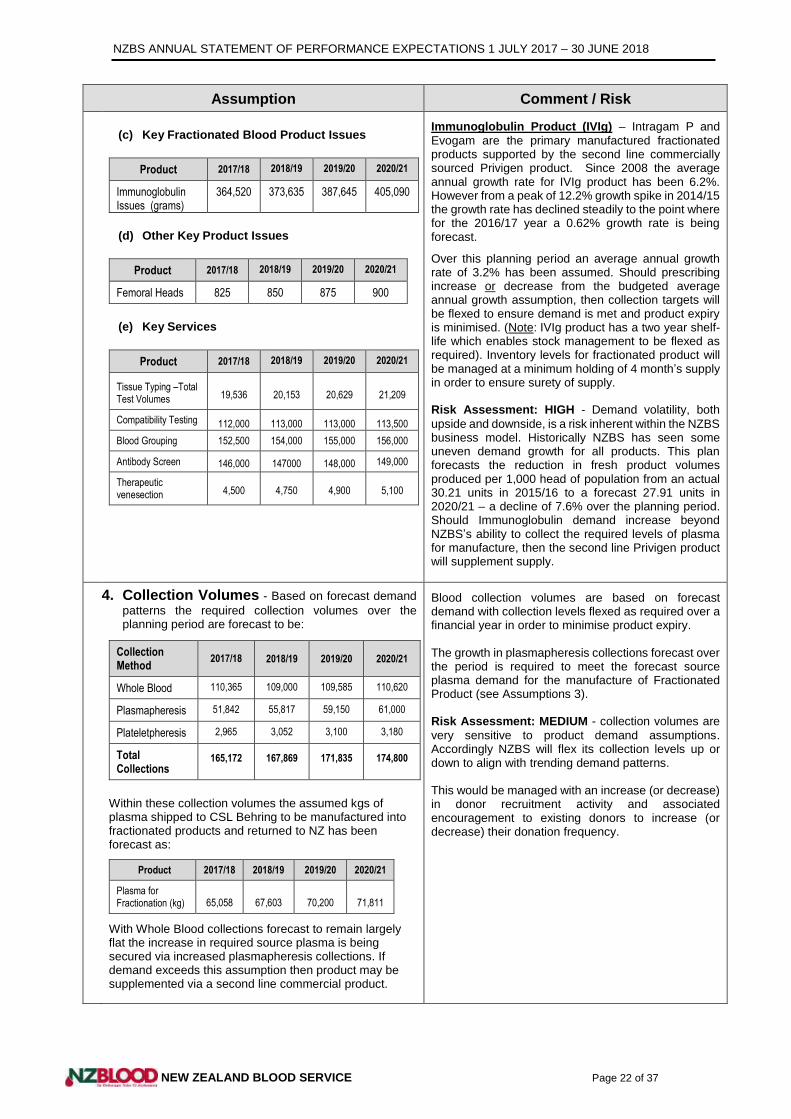
(c) Key Fractionated Blood Product Issues
Product 2017/18 2018/19 2019/20 2020/21
Immunoglobulin Issues (grams)
364,520 373,635 387,645 405,090
(d) Other Key Product Issues
Product 2017/18 2018/19 2019/20 2020/21
Femoral Heads 825 850 875 900
(e) Key Services
Product 2017/18 2018/19 2019/20 2020/21
Tissue Typing –Total Test Volumes 19,536 20,153 20,629 21,209
Compatibility Testing 112,000 113,000 113,000 113,500
Blood Grouping 152,500 154,000 155,000 156,000
Antibody Screen 146,000 147000 148,000 149,000
Therapeutic venesection 4,500 4,750 4,900 5,100
Immunoglobulin Product (IVIg) – Intragam P and
Evogam are the primary manufactured fractionated products supported by the second line commercially sourced Privigen product. Since 2008 the average annual growth rate for IVIg product has been 6.2%. However from a peak of 12.2% growth spike in 2014/15 the growth rate has declined steadily to the point where for the 2016/17 year a 0.62% growth rate is being forecast.
Over this planning period an average annual growth rate of 3.2% has been assumed. Should prescribing increase or decrease from the budgeted average annual growth assumption, then collection targets will be flexed to ensure demand is met and product expiry is minimised. (Note: IVIg product has a two year shelf-life which enables stock management to be flexed as required). Inventory levels for fractionated product will be managed at a minimum holding of 4 month’s supply in order to ensure surety of supply. Risk Assessment: HIGH - Demand volatility, both
upside and downside, is a risk inherent within the NZBS business model. Historically NZBS has seen some uneven demand growth for all products. This plan forecasts the reduction in fresh product volumes produced per 1,000 head of population from an actual 30.21 units in 2015/16 to a forecast 27.91 units in 2020/21 – a decline of 7.6% over the planning period. Should Immunoglobulin demand increase beyond NZBS’s ability to collect the required levels of plasma for manufacture, then the second line Privigen product will supplement supply.
4. Collection Volumes - Based on forecast demand
patterns the required collection volumes over the planning period are forecast to be:
Collection Method
2017/18 2018/19 2019/20 2020/21
Whole Blood 110,365 109,000 109,585 110,620
Plasmapheresis 51,842 55,817 59,150 61,000
Plateletpheresis 2,965 3,052 3,100 3,180
Total Collections
165,172 167,869 171,835 174,800
Within these collection volumes the assumed kgs of plasma shipped to CSL Behring to be manufactured into fractionated products and returned to NZ has been forecast as:
Product 2017/18 2018/19 2019/20 2020/21
Plasma for Fractionation (kg) 65,058 67,603 70,200 71,811
With Whole Blood collections forecast to remain largely flat the increase in required source plasma is being secured via increased plasmapheresis collections. If demand exceeds this assumption then product may be supplemented via a second line commercial product.
Blood collection volumes are based on forecast demand with collection levels flexed as required over a financial year in order to minimise product expiry. The growth in plasmapheresis collections forecast over the period is required to meet the forecast source plasma demand for the manufacture of Fractionated Product (see Assumptions 3). Risk Assessment: MEDIUM - collection volumes are
very sensitive to product demand assumptions. Accordingly NZBS will flex its collection levels up or down to align with trending demand patterns. This would be managed with an increase (or decrease) in donor recruitment activity and associated encouragement to existing donors to increase (or decrease) their donation frequency.
NZBS ANNUAL STATEMENT OF PERFORMANCE EXPECTATIONS 1 JULY 2017 – 30 JUNE 2018
NEW ZEALAND BLOOD SERVICE Page 23 of 37
Assumption Comment / Risk
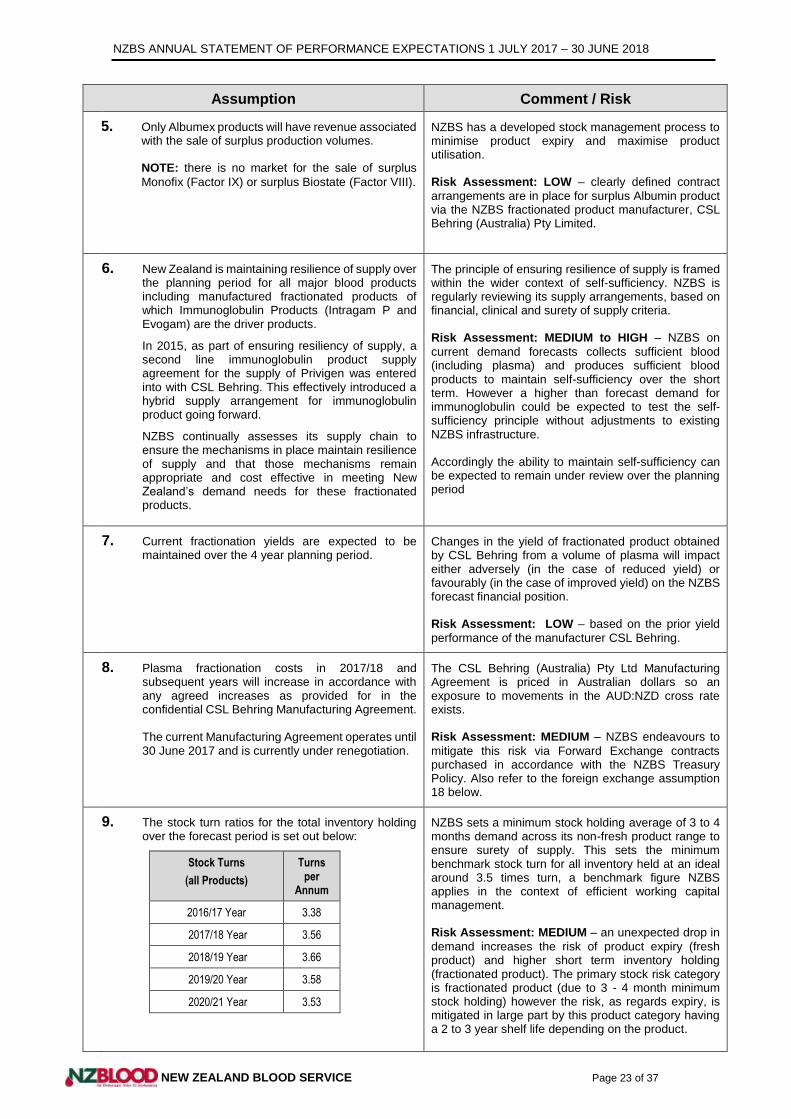
5. Only Albumex products will have revenue associated with the sale of surplus production volumes. NOTE: there is no market for the sale of surplus
Monofix (Factor IX) or surplus Biostate (Factor VIII).
NZBS has a developed stock management process to minimise product expiry and maximise product utilisation. Risk Assessment: LOW – clearly defined contract
arrangements are in place for surplus Albumin product via the NZBS fractionated product manufacturer, CSL Behring (Australia) Pty Limited.
6. New Zealand is maintaining resilience of supply over the planning period for all major blood products including manufactured fractionated products of which Immunoglobulin Products (Intragam P and Evogam) are the driver products.
In 2015, as part of ensuring resiliency of supply, a second line immunoglobulin product supply agreement for the supply of Privigen was entered into with CSL Behring. This effectively introduced a hybrid supply arrangement for immunoglobulin product going forward.
NZBS continually assesses its supply chain to ensure the mechanisms in place maintain resilience of supply and that those mechanisms remain appropriate and cost effective in meeting New Zealand’s demand needs for these fractionated products.
The principle of ensuring resilience of supply is framed within the wider context of self-sufficiency. NZBS is regularly reviewing its supply arrangements, based on financial, clinical and surety of supply criteria. Risk Assessment: MEDIUM to HIGH – NZBS on
current demand forecasts collects sufficient blood (including plasma) and produces sufficient blood products to maintain self-sufficiency over the short term. However a higher than forecast demand for immunoglobulin could be expected to test the self-sufficiency principle without adjustments to existing NZBS infrastructure. Accordingly the ability to maintain self-sufficiency can be expected to remain under review over the planning period
7. Current fractionation yields are expected to be maintained over the 4 year planning period.
Changes in the yield of fractionated product obtained by CSL Behring from a volume of plasma will impact either adversely (in the case of reduced yield) or favourably (in the case of improved yield) on the NZBS forecast financial position. Risk Assessment: LOW – based on the prior yield
performance of the manufacturer CSL Behring.
8. Plasma fractionation costs in 2017/18 and subsequent years will increase in accordance with any agreed increases as provided for in the confidential CSL Behring Manufacturing Agreement. The current Manufacturing Agreement operates until 30 June 2017 and is currently under renegotiation.
The CSL Behring (Australia) Pty Ltd Manufacturing Agreement is priced in Australian dollars so an exposure to movements in the AUD:NZD cross rate exists. Risk Assessment: MEDIUM – NZBS endeavours to
mitigate this risk via Forward Exchange contracts purchased in accordance with the NZBS Treasury Policy. Also refer to the foreign exchange assumption 18 below.
9. The stock turn ratios for the total inventory holding over the forecast period is set out below:
Stock Turns
(all Products)
Turns per
Annum
2016/17 Year 3.38
2017/18 Year 3.56
2018/19 Year 3.66
2019/20 Year 3.58
2020/21 Year 3.53
NZBS sets a minimum stock holding average of 3 to 4 months demand across its non-fresh product range to ensure surety of supply. This sets the minimum benchmark stock turn for all inventory held at an ideal around 3.5 times turn, a benchmark figure NZBS applies in the context of efficient working capital management. Risk Assessment: MEDIUM – an unexpected drop in
demand increases the risk of product expiry (fresh product) and higher short term inventory holding (fractionated product). The primary stock risk category is fractionated product (due to 3 - 4 month minimum stock holding) however the risk, as regards expiry, is mitigated in large part by this product category having a 2 to 3 year shelf life depending on the product.
NZBS ANNUAL STATEMENT OF PERFORMANCE EXPECTATIONS 1 JULY 2017 – 30 JUNE 2018
NEW ZEALAND BLOOD SERVICE Page 24 of 37
Assumption Comment / Risk
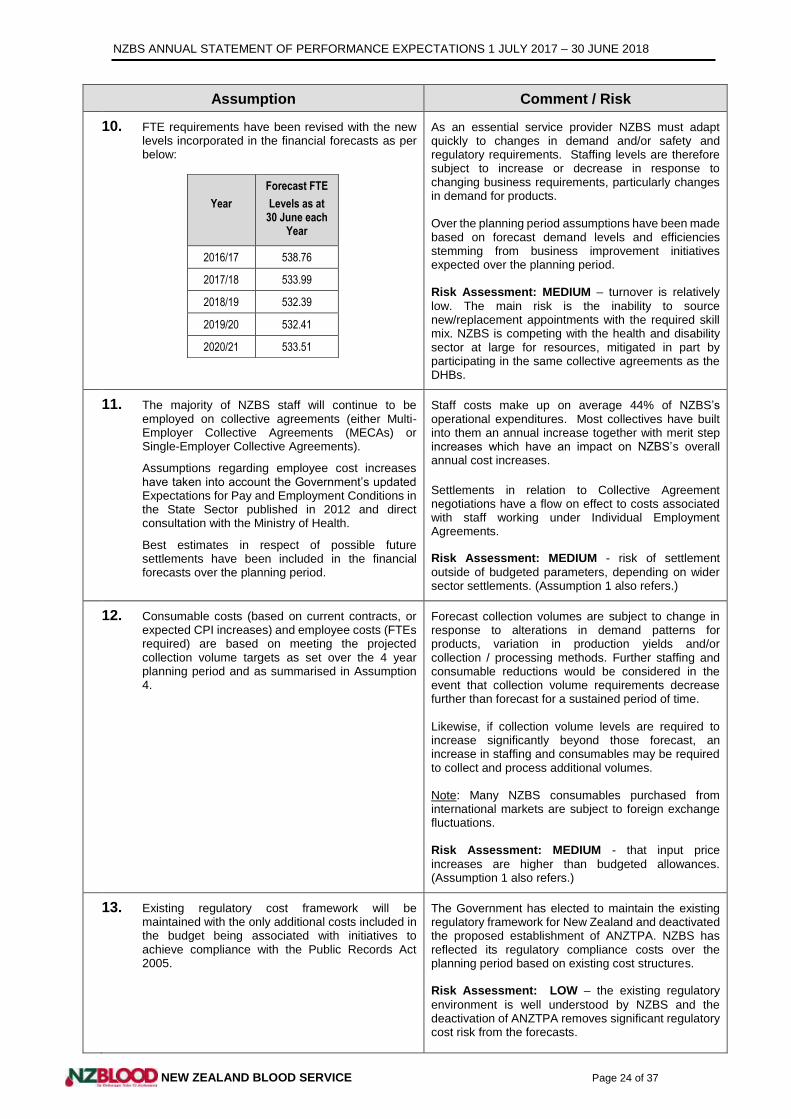
10. FTE requirements have been revised with the new levels incorporated in the financial forecasts as per below:
Year
Forecast FTE
Levels as at 30 June each
Year
2016/17 538.76
2017/18 533.99
2018/19 532.39
2019/20 532.41
2020/21 533.51
As an essential service provider NZBS must adapt quickly to changes in demand and/or safety and regulatory requirements. Staffing levels are therefore subject to increase or decrease in response to changing business requirements, particularly changes in demand for products. Over the planning period assumptions have been made based on forecast demand levels and efficiencies stemming from business improvement initiatives expected over the planning period. Risk Assessment: MEDIUM – turnover is relatively
low. The main risk is the inability to source new/replacement appointments with the required skill mix. NZBS is competing with the health and disability sector at large for resources, mitigated in part by participating in the same collective agreements as the DHBs.
11. The majority of NZBS staff will continue to be employed on collective agreements (either Multi-Employer Collective Agreements (MECAs) or Single-Employer Collective Agreements).
Assumptions regarding employee cost increases have taken into account the Government’s updated Expectations for Pay and Employment Conditions in the State Sector published in 2012 and direct consultation with the Ministry of Health.
Best estimates in respect of possible future settlements have been included in the financial forecasts over the planning period.
Staff costs make up on average 44% of NZBS’s operational expenditures. Most collectives have built into them an annual increase together with merit step increases which have an impact on NZBS’s overall annual cost increases.
Settlements in relation to Collective Agreement negotiations have a flow on effect to costs associated with staff working under Individual Employment Agreements.
Risk Assessment: MEDIUM - risk of settlement
outside of budgeted parameters, depending on wider sector settlements. (Assumption 1 also refers.)
12. Consumable costs (based on current contracts, or expected CPI increases) and employee costs (FTEs required) are based on meeting the projected collection volume targets as set over the 4 year planning period and as summarised in Assumption 4.
Forecast collection volumes are subject to change in response to alterations in demand patterns for products, variation in production yields and/or collection / processing methods. Further staffing and consumable reductions would be considered in the event that collection volume requirements decrease further than forecast for a sustained period of time. Likewise, if collection volume levels are required to increase significantly beyond those forecast, an increase in staffing and consumables may be required to collect and process additional volumes. Note: Many NZBS consumables purchased from international markets are subject to foreign exchange fluctuations. Risk Assessment: MEDIUM - that input price
increases are higher than budgeted allowances. (Assumption 1 also refers.)
13. Existing regulatory cost framework will be maintained with the only additional costs included in the budget being associated with initiatives to achieve compliance with the Public Records Act 2005.
The Government has elected to maintain the existing regulatory framework for New Zealand and deactivated the proposed establishment of ANZTPA. NZBS has reflected its regulatory compliance costs over the planning period based on existing cost structures. Risk Assessment: LOW – the existing regulatory
environment is well understood by NZBS and the deactivation of ANZTPA removes significant regulatory cost risk from the forecasts.
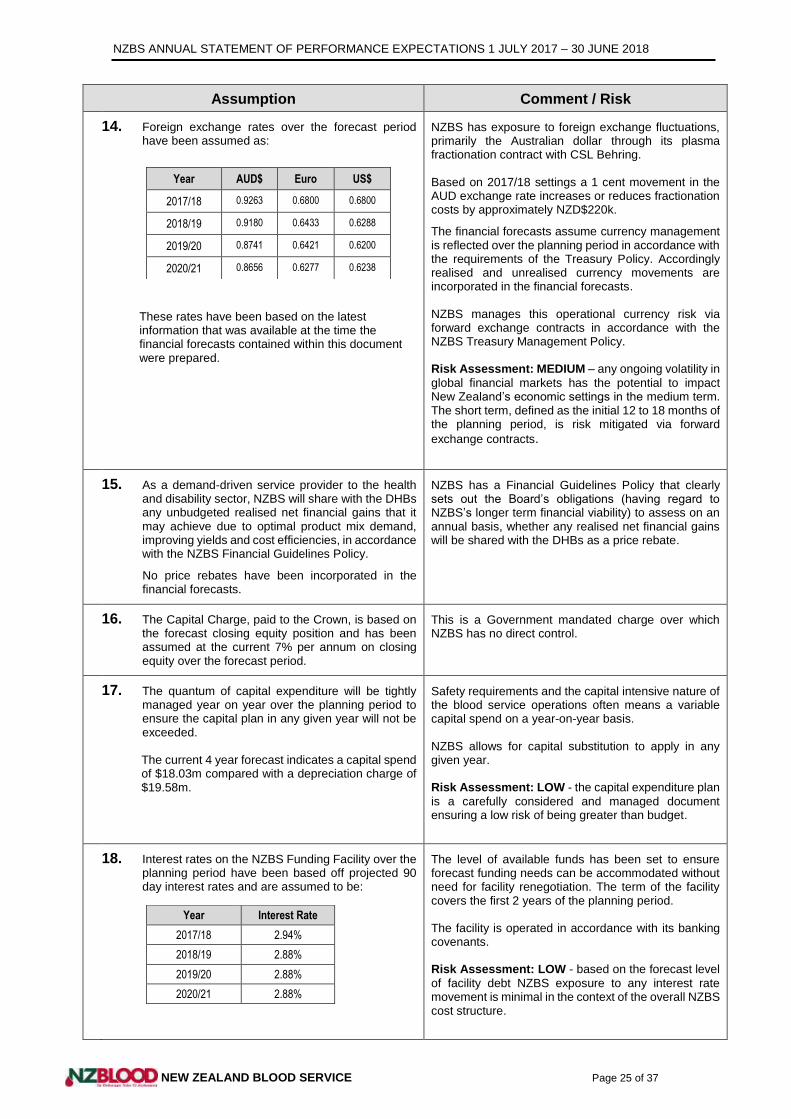
NZBS ANNUAL STATEMENT OF PERFORMANCE EXPECTATIONS 1 JULY 2017 – 30 JUNE 2018
NEW ZEALAND BLOOD SERVICE Page 25 of 37
Assumption Comment / Risk
14. Foreign exchange rates over the forecast period have been assumed as:
These rates have been based on the latest information that was available at the time the financial forecasts contained within this document were prepared.
Year AUD$ Euro US$
2017/18 0.9263 0.6800 0.6800
2018/19 0.9180 0.6433 0.6288
2019/20 0.8741 0.6421 0.6200
2020/21 0.8656 0.6277 0.6238
NZBS has exposure to foreign exchange fluctuations, primarily the Australian dollar through its plasma fractionation contract with CSL Behring. Based on 2017/18 settings a 1 cent movement in the AUD exchange rate increases or reduces fractionation costs by approximately NZD$220k.
The financial forecasts assume currency management is reflected over the planning period in accordance with the requirements of the Treasury Policy. Accordingly realised and unrealised currency movements are incorporated in the financial forecasts. NZBS manages this operational currency risk via forward exchange contracts in accordance with the NZBS Treasury Management Policy. Risk Assessment: MEDIUM – any ongoing volatility in
global financial markets has the potential to impact New Zealand’s economic settings in the medium term. The short term, defined as the initial 12 to 18 months of the planning period, is risk mitigated via forward
exchange contracts.
15. As a demand-driven service provider to the health and disability sector, NZBS will share with the DHBs any unbudgeted realised net financial gains that it may achieve due to optimal product mix demand, improving yields and cost efficiencies, in accordance with the NZBS Financial Guidelines Policy.
No price rebates have been incorporated in the financial forecasts.
NZBS has a Financial Guidelines Policy that clearly sets out the Board’s obligations (having regard to NZBS’s longer term financial viability) to assess on an annual basis, whether any realised net financial gains will be shared with the DHBs as a price rebate.
16. The Capital Charge, paid to the Crown, is based on the forecast closing equity position and has been assumed at the current 7% per annum on closing equity over the forecast period.
This is a Government mandated charge over which NZBS has no direct control.
17. The quantum of capital expenditure will be tightly managed year on year over the planning period to ensure the capital plan in any given year will not be exceeded.
The current 4 year forecast indicates a capital spend of $18.03m compared with a depreciation charge of $19.58m.
Safety requirements and the capital intensive nature of the blood service operations often means a variable capital spend on a year-on-year basis. NZBS allows for capital substitution to apply in any given year. Risk Assessment: LOW - the capital expenditure plan
is a carefully considered and managed document ensuring a low risk of being greater than budget.
18. Interest rates on the NZBS Funding Facility over the planning period have been based off projected 90 day interest rates and are assumed to be:
Year Interest Rate
2017/18 2.94%
2018/19 2.88%
2019/20 2.88%
2020/21 2.88%
The level of available funds has been set to ensure forecast funding needs can be accommodated without need for facility renegotiation. The term of the facility covers the first 2 years of the planning period. The facility is operated in accordance with its banking covenants. Risk Assessment: LOW - based on the forecast level
of facility debt NZBS exposure to any interest rate movement is minimal in the context of the overall NZBS cost structure.
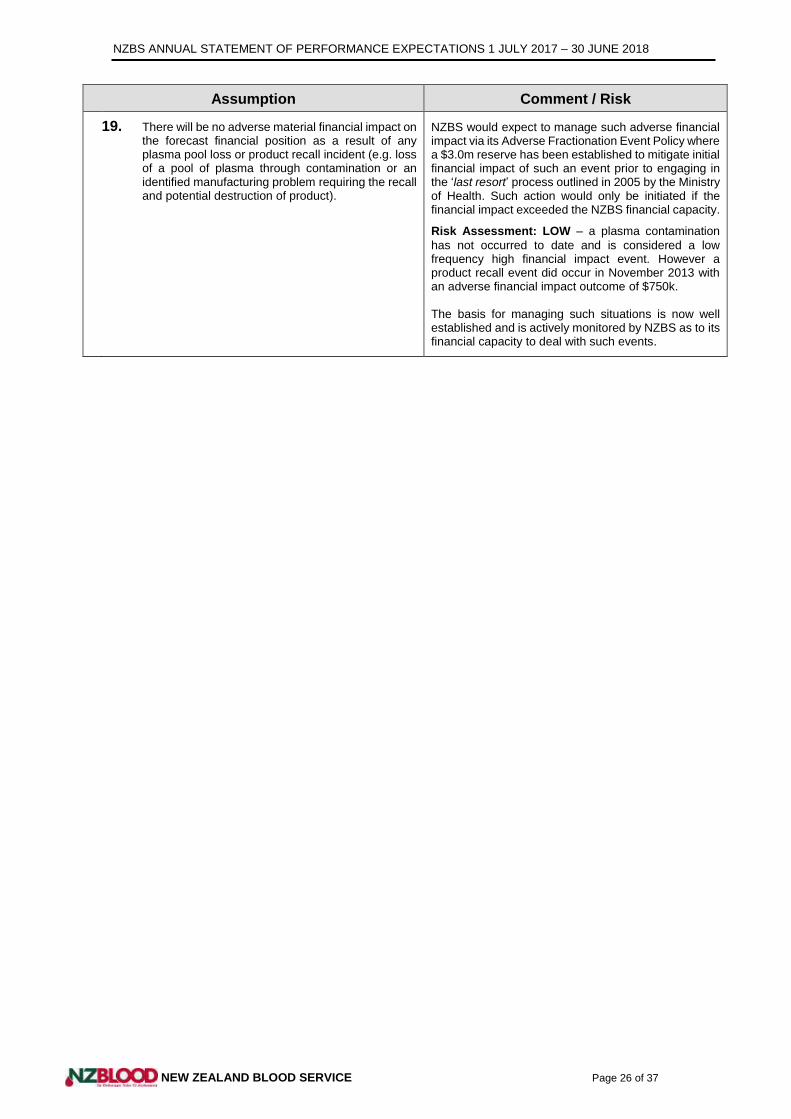
NZBS ANNUAL STATEMENT OF PERFORMANCE EXPECTATIONS 1 JULY 2017 – 30 JUNE 2018
NEW ZEALAND BLOOD SERVICE Page 26 of 37
Assumption Comment / Risk
19. There will be no adverse material financial impact on the forecast financial position as a result of any plasma pool loss or product recall incident (e.g. loss of a pool of plasma through contamination or an identified manufacturing problem requiring the recall and potential destruction of product).
NZBS would expect to manage such adverse financial impact via its Adverse Fractionation Event Policy where a $3.0m reserve has been established to mitigate initial financial impact of such an event prior to engaging in the ‘last resort’ process outlined in 2005 by the Ministry of Health. Such action would only be initiated if the financial impact exceeded the NZBS financial capacity.
Risk Assessment: LOW – a plasma contamination
has not occurred to date and is considered a low frequency high financial impact event. However a product recall event did occur in November 2013 with an adverse financial impact outcome of $750k. The basis for managing such situations is now well established and is actively monitored by NZBS as to its financial capacity to deal with such events.
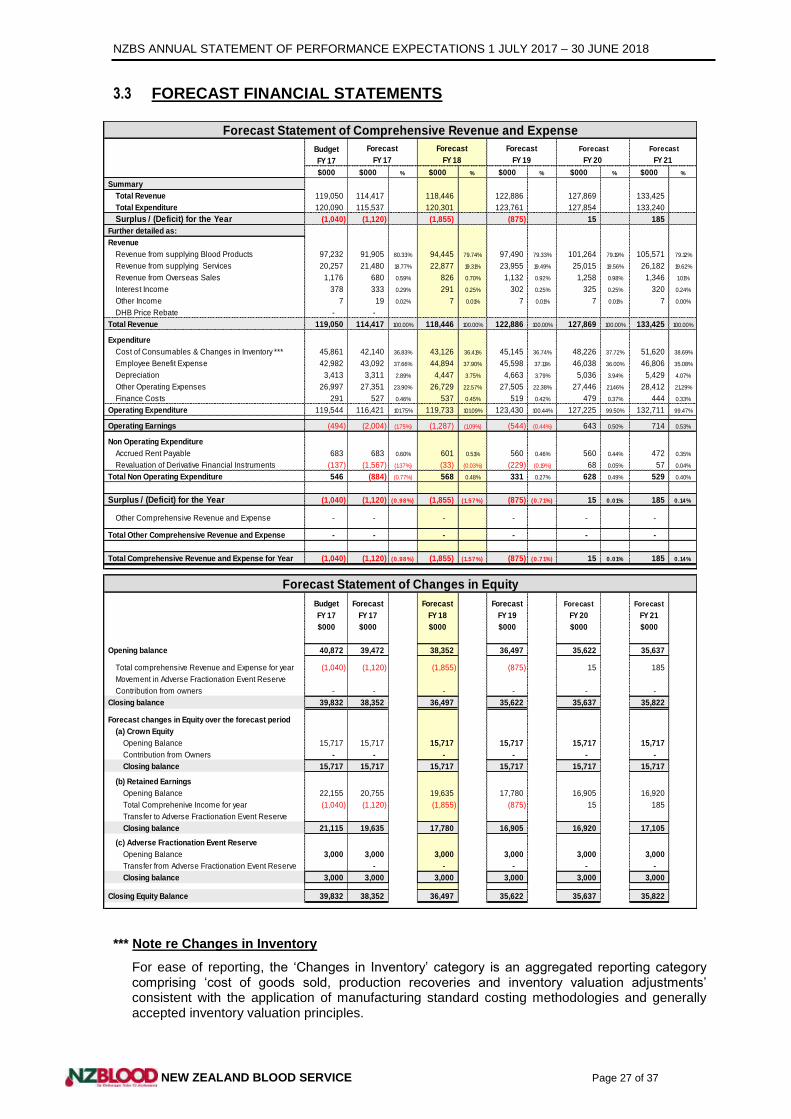
NZBS ANNUAL STATEMENT OF PERFORMANCE EXPECTATIONS 1 JULY 2017 – 30 JUNE 2018
NEW ZEALAND BLOOD SERVICE Page 27 of 37
3.3 FORECAST FINANCIAL STATEMENTS
*** Note re Changes in Inventory
For ease of reporting, the ‘Changes in Inventory’ category is an aggregated reporting category comprising ‘cost of goods sold, production recoveries and inventory valuation adjustments’ consistent with the application of manufacturing standard costing methodologies and generally accepted inventory valuation principles.
Forecast Statement of Comprehensive Revenue and Expense
Budget Forecast Forecast Forecast Forecast Forecast
FY 17 FY 17 FY 18 FY 19 FY 20 FY 21
$000 $000 % $000 % $000 % $000 % $000 %
Summary
Total Revenue 119,050 114,417 118,446 122,886 127,869 133,425
Total Expenditure 120,090 115,537 120,301 123,761 127,854 133,240
Surplus / (Deficit) for the Year (1,040) (1,120) (1,855) (875) 15 185
Further detailed as:
Revenue
Revenue from supplying Blood Products 97,232 91,905 80.33% 94,445 79.74% 97,490 79.33% 101,264 79.19% 105,571 79.12%
Revenue from supplying Services 20,257 21,480 18.77% 22,877 19.31% 23,955 19.49% 25,015 19.56% 26,182 19.62%
Revenue from Overseas Sales 1,176 680 0.59% 826 0.70% 1,132 0.92% 1,258 0.98% 1,346 1.01%
Interest Income 378 333 0.29% 291 0.25% 302 0.25% 325 0.25% 320 0.24%
Other Income 7 19 0.02% 7 0.01% 7 0.01% 7 0.01% 7 0.00%
DHB Price Rebate - -
Total Revenue 119,050 114,417 100.00% 118,446 100.00% 122,886 100.00% 127,869 100.00% 133,425 100.00%
Expenditure
Cost of Consumables & Changes in Inventory *** 45,861 42,140 36.83% 43,126 36.41% 45,145 36.74% 48,226 37.72% 51,620 38.69%
Employee Benefit Expense 42,982 43,092 37.66% 44,894 37.90% 45,598 37.11% 46,038 36.00% 46,806 35.08%
Depreciation 3,413 3,311 2.89% 4,447 3.75% 4,663 3.79% 5,036 3.94% 5,429 4.07%
Other Operating Expenses 26,997 27,351 23.90% 26,729 22.57% 27,505 22.38% 27,446 21.46% 28,412 21.29%
Finance Costs 291 527 0.46% 537 0.45% 519 0.42% 479 0.37% 444 0.33%
Operating Expenditure 119,544 116,421 101.75% 119,733 101.09% 123,430 100.44% 127,225 99.50% 132,711 99.47%
Operating Earnings (494) (2,004) (1.75%) (1,287) (1.09%) (544) (0.44%) 643 0.50% 714 0.53%
Non Operating Expenditure
Accrued Rent Payable 683 683 0.60% 601 0.51% 560 0.46% 560 0.44% 472 0.35%
Revaluation of Derivative Financial Instruments (137) (1,567) (1.37%) (33) (0.03%) (229) (0.19%) 68 0.05% 57 0.04%
Total Non Operating Expenditure 546 (884) (0.77%) 568 0.48% 331 0.27% 628 0.49% 529 0.40%
Surplus / (Deficit) for the Year (1,040) (1,120) (0 .98%) (1,855) (1.57%) (875) (0 .71%) 15 0.01% 185 0.14%
Other Comprehensive Revenue and Expense - - - - - -
Total Other Comprehensive Revenue and Expense - - - - - -
Total Comprehensive Revenue and Expense for Year (1,040) (1,120) (0 .98%) (1,855) (1.57%) (875) (0 .71%) 15 0.01% 185 0.14%
Forecast Statement of Changes in Equity
Budget Forecast Forecast Forecast Forecast Forecast
FY 17 FY 17 FY 18 FY 19 FY 20 FY 21
$000 $000 $000 $000 $000 $000
Rounding to Balance (if required)
Opening balance 40,872 39,472 38,352 36,497 35,622 35,637
Total comprehensive Revenue and Expense for year (1,040) (1,120) (1,855) (875) 15 185
Movement in Adverse Fractionation Event Reserve
Contribution from owners - - - - - -
Closing balance 39,832 38,352 36,497 35,622 35,637 35,822
Forecast changes in Equity over the forecast period
(a) Crown Equity
Opening Balance 15,717 15,717 15,717 15,717 15,717 15,717
Contribution from Owners - - - - - -
Closing balance 15,717 15,717 15,717 15,717 15,717 15,717
(b) Retained Earnings Rounding to Balance (if required)
Opening Balance 22,155 20,755 19,635 17,780 16,905 16,920
Total Comprehenive Income for year (1,040) (1,120) (1,855) (875) 15 185
Transfer to Adverse Fractionation Event Reserve
Closing balance 21,115 19,635 17,780 16,905 16,920 17,105
(c) Adverse Fractionation Event Reserve
Opening Balance 3,000 3,000 3,000 3,000 3,000 3,000
Transfer from Adverse Fractionation Event Reserve - - - - -
Closing balance 3,000 3,000 3,000 3,000 3,000 3,000 CROSS CHECK FOR IN BALANCE
Closing Equity Balance 39,832 38,352 36,497 35,622 35,637 35,822
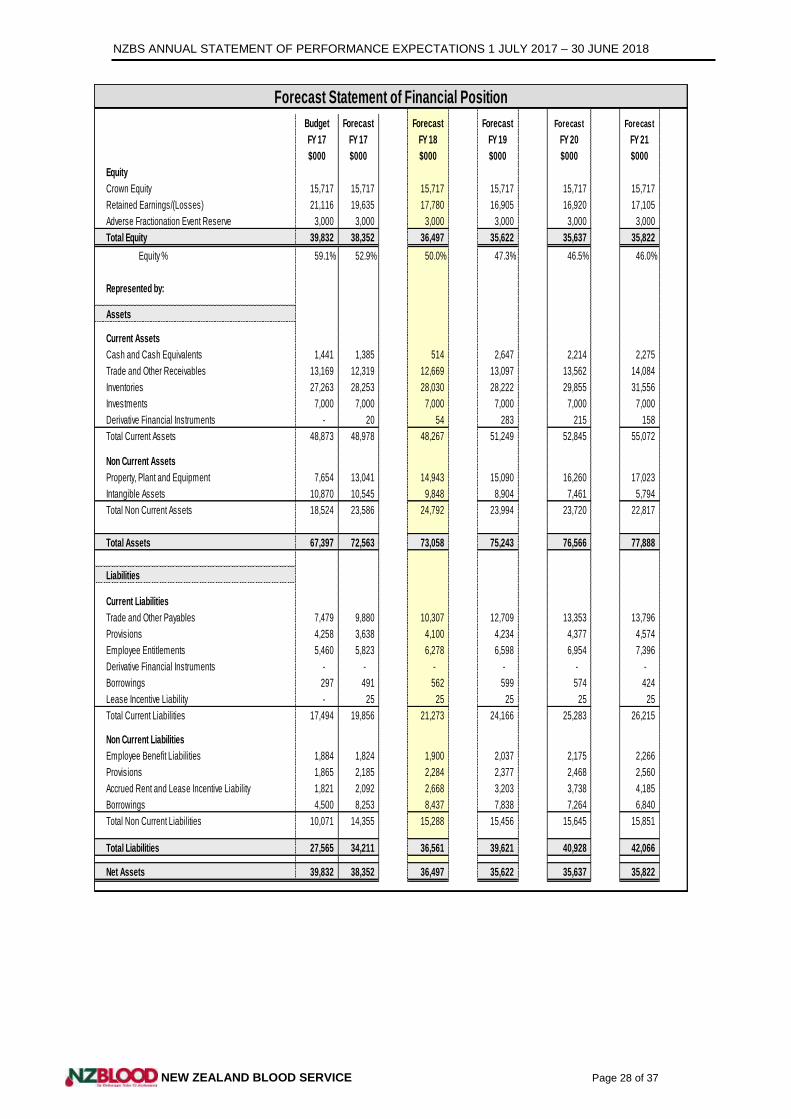
NZBS ANNUAL STATEMENT OF PERFORMANCE EXPECTATIONS 1 JULY 2017 – 30 JUNE 2018
NEW ZEALAND BLOOD SERVICE Page 28 of 37
Forecast Statement of Financial Position
Budget Forecast Forecast Forecast Forecast Forecast
FY 17 FY 17 FY 18 FY 19 FY 20 FY 21
$000 $000 $000 $000 $000 $000
Equity
Crown Equity 15,717 15,717 15,717 15,717 15,717 15,717
Retained Earnings/(Losses) 21,116 19,635 17,780 16,905 16,920 17,105
Adverse Fractionation Event Reserve 3,000 3,000 3,000 3,000 3,000 3,000
Total Equity 39,832 38,352 36,497 35,622 35,637 35,822
Equity % 59.1% 52.9% 50.0% 47.3% 46.5% 46.0%
Represented by:
Assets
Current Assets
Cash and Cash Equivalents 1,441 1,385 514 2,647 2,214 2,275
Trade and Other Receivables 13,169 12,319 12,669 13,097 13,562 14,084
Inventories 27,263 28,253 28,030 28,222 29,855 31,556
Investments 7,000 7,000 7,000 7,000 7,000 7,000
Derivative Financial Instruments - 20 54 283 215 158
Total Current Assets 48,873 48,978 48,267 51,249 52,845 55,072
Non Current Assets
Property, Plant and Equipment 7,654 13,041 14,943 15,090 16,260 17,023
Intangible Assets 10,870 10,545 9,848 8,904 7,461 5,794
Total Non Current Assets 18,524 23,586 24,792 23,994 23,720 22,817
Total Assets 67,397 72,563 73,058 75,243 76,566 77,888
Liabilities
Current Liabilities Rounding to Balance (if required)
Trade and Other Payables 7,479 9,880 10,307 12,709 13,353 13,796
Provisions 4,258 3,638 4,100 4,234 4,377 4,574
Employee Entitlements 5,460 5,823 6,278 6,598 6,954 7,396
Derivative Financial Instruments - - - - - -
Borrowings 297 491 562 599 574 424
Lease Incentive Liability - 25 25 25 25 25
Total Current Liabilities 17,494 19,856 21,273 24,166 25,283 26,215
Non Current Liabilities
Employee Benefit Liabilities 1,884 1,824 1,900 2,037 2,175 2,266
Provisions 1,865 2,185 2,284 2,377 2,468 2,560
Accrued Rent and Lease Incentive Liability 1,821 2,092 2,668 3,203 3,738 4,185
Borrowings 4,500 8,253 8,437 7,838 7,264 6,840
Total Non Current Liabilities 10,071 14,355 15,288 15,456 15,645 15,851
Total Liabilities 27,565 34,211 36,561 39,621 40,928 42,066 CROSS CHECK FOR IN BALANCE
Net Assets 39,832 38,352 36,497 35,622 35,637 35,822
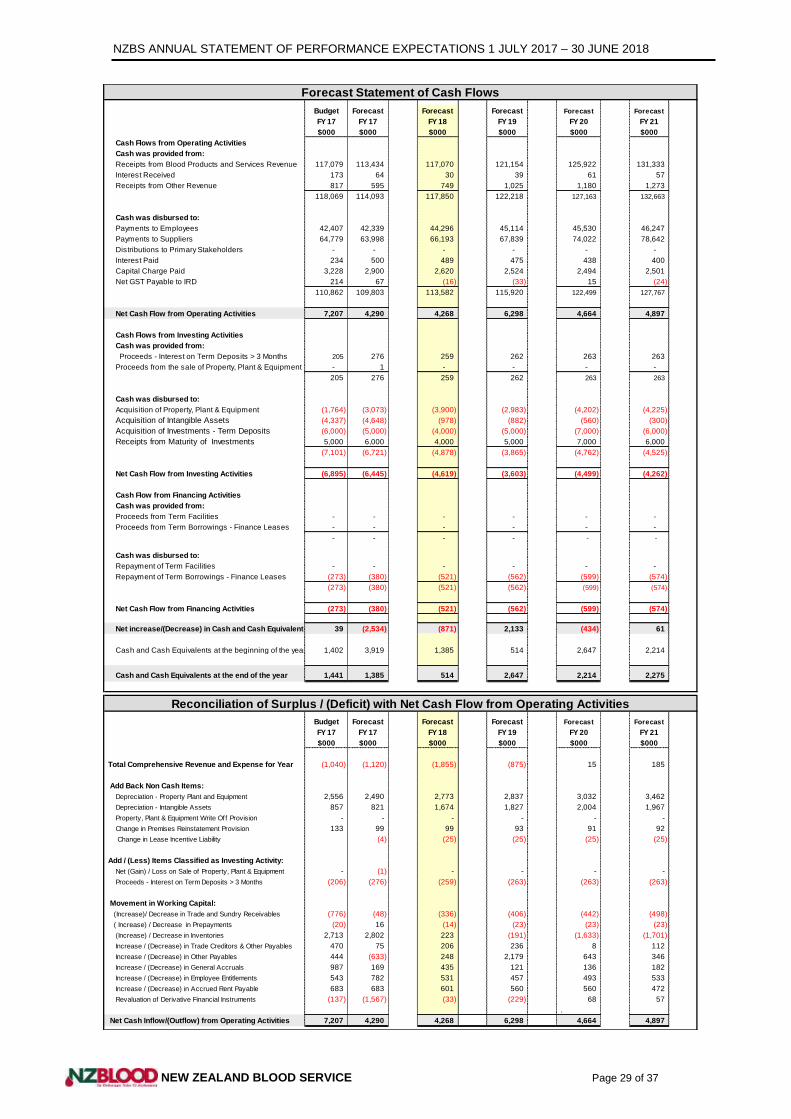
NZBS ANNUAL STATEMENT OF PERFORMANCE EXPECTATIONS 1 JULY 2017 – 30 JUNE 2018
NEW ZEALAND BLOOD SERVICE Page 29 of 37
Forecast Statement of Cash Flows
Budget Forecast Forecast Forecast Forecast Forecast
FY 17 FY 17 FY 18 FY 19 FY 20 FY 21
$000 $000 $000 $000 $000 $000
Cash Flows from Operating Activities
Cash was provided from:
Receipts from Blood Products and Services Revenue 117,079 113,434 117,070 121,154 125,922 131,333
Interest Received 173 64 30 39 61 57
Receipts from Other Revenue 817 595 749 1,025 1,180 1,273
118,069 114,093 117,850 122,218 127,163 132,663
Cash was disbursed to:
Payments to Employees 42,407 42,339 44,296 45,114 45,530 46,247
Payments to Suppliers 64,779 63,998 66,193 67,839 74,022 78,642
Distributions to Primary Stakeholders - - - - - -
Interest Paid 234 500 489 475 438 400
Capital Charge Paid 3,228 2,900 2,620 2,524 2,494 2,501
Net GST Payable to IRD 214 67 (16) (33) 15 (24)
110,862 109,803 113,582 115,920 122,499 127,767
Net Cash Flow from Operating Activities 7,207 4,290 4,268 6,298 4,664 4,897
Cash Flows from Investing Activities
Cash was provided from: CROSS CHECK FOR IN BALANCE
Proceeds - Interest on Term Deposits > 3 Months 205 276 259 262 263 263
Proceeds from the sale of Property, Plant & Equipment - 1 - - - -
205 276 259 262 263 263
Cash was disbursed to:
Acquisition of Property, Plant & Equipment (1,764) (3,073) (3,900) (2,983) (4,202) (4,225)
Acquisition of Intangible Assets (4,337) (4,648) (978) (882) (560) (300)
Acquisition of Investments - Term Deposits (6,000) (5,000) (4,000) (5,000) (7,000) (6,000)
Receipts from Maturity of Investments 5,000 6,000 4,000 5,000 7,000 6,000
(7,101) (6,721) (4,878) (3,865) (4,762) (4,525)
Net Cash Flow from Investing Activities (6,895) (6,445) (4,619) (3,603) (4,499) (4,262)
Cash Flow from Financing Activities
Cash was provided from:
Proceeds from Term Facilities - - - - - -
Proceeds from Term Borrowings - Finance Leases - - - - - -
- - - - - -
Cash was disbursed to:
Repayment of Term Facilities - - - - - -
Repayment of Term Borrowings - Finance Leases (273) (380) (521) (562) (599) (574)
(273) (380) (521) (562) (599) (574)
Net Cash Flow from Financing Activities (273) (380) (521) (562) (599) (574)
Net increase/(Decrease) in Cash and Cash Equivalents 39 (2,534) (871) 2,133 (434) 61 CROSS CHECK FOR IN BALANCE
Cash and Cash Equivalents at the beginning of the year 1,402 3,919 1,385 514 2,647 2,214
Cash and Cash Equivalents at the end of the year 1,441 1,385 514 2,647 2,214 2,275
Reconciliation of Surplus / (Deficit) with Net Cash Flow from Operating Activities
Budget Forecast Forecast Forecast Forecast Forecast
FY 17 FY 17 FY 18 FY 19 FY 20 FY 21
$000 $000 $000 $000 $000 $000
Total Comprehensive Revenue and Expense for Year (1,040) (1,120) (1,855) (875) 15 185
Add Back Non Cash Items:
Depreciation - Property Plant and Equipment 2,556 2,490 2,773 2,837 3,032 3,462
Depreciation - Intangible Assets 857 821 1,674 1,827 2,004 1,967
Property, Plant & Equipment Write Off Provision - - - - - -
Change in Premises Reinstatement Provision 133 99 99 93 91 92
Change in Lease Incentive Liability (4) (25) (25) (25) (25)
Add / (Less) Items Classified as Investing Activity:
Net (Gain) / Loss on Sale of Property, Plant & Equipment - (1) - - - -
Proceeds - Interest on Term Deposits > 3 Months (206) (276) (259) (263) (263) (263)
Movement in Working Capital:
(Increase)/ Decrease in Trade and Sundry Receivables (776) (48) (336) (406) (442) (498)
( Increase) / Decrease in Prepayments (20) 16 (14) (23) (23) (23) ADJUSTMENT FOR IN BALANCE
(Increase) / Decrease in Inventories 2,713 2,802 223 (191) (1,633) (1,701)
Increase / (Decrease) in Trade Creditors & Other Payables 470 75 206 236 8 112
Increase / (Decrease) in Other Payables 444 (633) 248 2,179 643 346
Increase / (Decrease) in General Accruals 987 169 435 121 136 182
Increase / (Decrease) in Employee Entitlements 543 782 531 457 493 533 CROSS CHECK FOR IN BALANCE
Increase / (Decrease) in Accrued Rent Payable 683 683 601 560 560 472
Revaluation of Derivative Financial Instruments (137) (1,567) (33) (229) 68 57
.
Net Cash Inflow/(Outflow) from Operating Activities 7,207 4,290 4,268 6,298 4,664 4,897
NZBS ANNUAL STATEMENT OF PERFORMANCE EXPECTATIONS 1 JULY 2017 – 30 JUNE 2018
NEW ZEALAND BLOOD SERVICE Page 30 of 37
3.4 STATEMENT OF ACCOUNTING POLICIES
1) Reporting Entity
The New Zealand Blood Service (NZBS) is an appointed entity pursuant to Section 63 of the Human Tissue Act 2008, primarily responsible for the performance of functions in relation to blood and controlled human substances in New Zealand.
NZBS is a Crown entity under the New Zealand Public Health and Disability Act 2000, and, more specifically a Statutory Entity under the Crown Entities Act 2004. NZBS’s ultimate parent is the New Zealand Crown.
NZBS is a public benefit entity as its primary objective is to support the New Zealand healthcare community through managing the collection, processing and supply of blood, controlled human substances and related services. Accordingly, NZBS has designated itself as a public benefit entity (PBE) for the purposes of applying the Public Benefit Entities Accounting Standards (PBE Standards), issued by the External Reporting Board (XRB).
2) Authorisation Statement
These forecast financial statements were authorised for issue on 30 March 2017 by the Chief Executive Officer of NZBS who is responsible for the forecast financial statements as presented. The preparation of these financial statements requires judgements, estimations and assumptions (refer section 3.2 for key assumption details) that affect the application of policies and reported amounts of assets, liabilities, income and expenses. The estimates and associated assumptions are based on historical experience and various other factors that are believed reasonable under the circumstances.
Actual financial results achieved for the period covered are likely to vary from the information presented and the variations may be material.
It is not intended that the prospective financial statements will be updated subsequent to presentation.
3) Basis of Preparation
The financial statements of NZBS have been prepared in accordance with the requirements of the Crown Entities Act 2004 and the New Zealand Public Health & Disability Act 2000.
These financial statements have been prepared in accordance with New Zealand generally accepted accounting practice (NZ GAAP), in accordance with Tier 1 PBE Standards. They comply with PBE Standards, as appropriate for PBEs.
The accounting policies set out below have been applied consistently to all periods presented in these financial statements.
The financial statements have been prepared on a historical cost basis, with the exception of certain items identified in specific accounting policies.
The financial statements are presented in New Zealand dollars. The functional currency of NZBS is New Zealand dollars.
4) Significant Assumptions
These forecast financial statements are based on the financial results reported to 31 January 2017 and the inherent trends reflected in those results and have been prepared on the basis of key assumptions as detailed in Section 3.2 as to future events that NZBS can reasonably expect to occur, associated with actions it reasonably expects to take.
These forecasts have been compiled on the basis of the strategic plan (as detailed in the Statement of Intent) and Ministerial expectations at the date the information was prepared. Estimated year-end information for 2016/17 is used as the opening position for the 2017/18 forecasts.
The forecast financial statements have been prepared in compliance with NZFRS 42 Prospective Financial Statements.
NZBS ANNUAL STATEMENT OF PERFORMANCE EXPECTATIONS 1 JULY 2017 – 30 JUNE 2018
NEW ZEALAND BLOOD SERVICE Page 31 of 37
5) Standards and Interpretation issued and not yet adopted
There are no standards issued and not yet effective that are relevant to NZBS.
6) Significant Accounting Policies
Revenue
Revenue is measured at the fair value of consideration received or receivable. The specific accounting policies for significant revenue items are explained below.
Sales of Products
Revenue from the sales of products is recognised at the time the risk and effective ownership transfers to the customer.
Provision of Services
Revenue from the rendering of services is recognised as the services are provided.
Price Rebate to District Health Boards
NZBS also considers annually in accordance with the financial guidelines policy, price rebates to District Health Boards which if elected by the Board to be paid are recognised at the point of decision and deducted from the amount of revenue received or receivable.
Interest Income
Interest income is recognised using the effective interest method.
Capital Charge
The capital charge is recognised as an expense in the financial year to which the charge relates.
Leases
Finance leases
A finance lease is a lease that transfers to the lessee substantially all the risks and rewards incidental to ownership of an asset, whether or not title is eventually transferred.
At the commencement of the lease term, NZBS recognises finance leases as assets and liabilities in the statement of financial position at the lower of the fair value of the leased item or the present value of the minimum lease payments.
The amount recognised as an asset is depreciated over its useful life. If there is no certainty as to whether NZBS will obtain ownership at the end of the lease term, the asset is fully depreciated over the shorter of the lease term and its useful life.
Operating leases
An operating lease is a lease that does not transfer substantially all the risks and rewards incidental to ownership of an asset. Lease payments under an operating lease are recognised as an expense on a straight-line basis over the lease term.
Cash and Cash Equivalents
Cash and cash equivalents include cash in hand, deposits held at call with banks, other short-term highly liquid investments with original maturities of three months or less, and bank overdrafts.
Bank overdrafts are shown within borrowings in current liabilities in the statement of financial position.
Trade and Other Receivables
Trade and other receivables are initially measured at fair value and subsequently measured at amortised cost using the effective interest method, less any provision for impairment.
A provision for impairment of receivables is established when there is objective evidence that NZBS will not be able to collect all amounts due according to the original terms of receivables.
Inventories
Inventories are measured at cost upon initial recognition. To the extent that inventory was received through non-exchange transactions (i.e. donated goods) for no cost or for a nominal cost, the cost of the inventory is its fair value at the date of acquisition.
NZBS ANNUAL STATEMENT OF PERFORMANCE EXPECTATIONS 1 JULY 2017 – 30 JUNE 2018
NEW ZEALAND BLOOD SERVICE Page 32 of 37
However, as NZBS is not legally permitted to purchase blood from the public, the accounting fair value of blood from donors is considered nil. Therefore the cost of inventories comprise all costs of collection, costs of conversion, and any other costs incurred in bringing the inventories to their present location and condition.
After initial recognition, inventory is measured at the lower of costs and net realisable value. The cost of inventory is determined using the FIFO or weighted average methods. The valuation includes allowance for slow moving items. Obsolete inventories are written off. The write down from cost to net realisable value is recognised in the surplus or deficit except for fractionated derived products manufactured from New Zealand sourced plasma (refer below).
Inventories are recognised as an expense when deployed for utilisation or consumption in the ordinary course of NZBS's operation.
Fractionated derived products manufactured from a principal pool
Fractionated derived products are manufactured into finished blood products by a third party manufacturer on a "toll" manufacturing basis using NZBS provided sourced plasma. Fractionated derived products in the main are manufactured from either 7.8 or 10.4 tonne plasma pools and the NZBS rolling manufacturing plan generally allows for 6 production pools in a financial year. The driver product group within the manufacturing process is the immunoglobulin product represented by Intragam P and Evogam product.
The principal pool work in progress (WIP) is included at full standard cost as the final output that the manufacturer must produce is locked in via the agreed production plan for a pool and contract yields per the toll manufacturing agreement. This high level of certainty enables the WIP to be viewed in the same light as finished fractionation product for the purposes of inventory valuation.
Valuation of fractionated derived products from these plasma pools, both finished goods and WIP, is based on allocating the actual input cost of manufacturing a plasma pool (NZBS source plasma input plus third party toll fractionation manufacturing fee) to prorated finished/WIP product output using actual product plasma yield, reported by the manufacturer.
Post this product cost allocation, if there are any products where cost exceeds the net realisable value then that cost excess is reallocated to the driver product group.
Financial Assets
NZBS classifies its financial assets within the scope of PBE IPSAS 29 Financial Instruments: Recognition and Measurement into the following four categories: (1) financial assets at fair value through surplus or deficit, (2) loans and receivables, (3) held to maturity investments or (4) available for sale financial assets.
The classification depends on the purpose for which the investments were acquired. Management determines the classification of its investments at initial recognition and re-evaluates this designation at every reporting date.
Financial assets and liabilities are initially measured at fair value plus transaction costs unless they are carried at fair value through profit or loss in which case the transaction costs are recognised in the surplus or deficit.
Purchases and sales of investments are recognised on trade date, the date on which NZBS commits to purchase or sell the asset. Financial assets are derecognised when the rights to receive cash flows from the financial assets have expired or have been transferred and NZBS has transferred substantially all the risks and rewards of ownership.
The fair value of financial instruments traded in active markets is based on quoted market prices at the balance date. The quoted market price used is the current bid price.
The fair value of financial instruments that are not traded in an active market is determined using valuation techniques. NZBS uses a variety of methods and makes assumptions that are based on market conditions existing at each balance date. Quoted market prices or dealer quotes for similar instruments are used for long-term debt instruments held. Other techniques, such as estimated discounted cash flows, are used to determine fair value for the remaining financial instruments.
The subsequent measurement of financial assets depends on their classification. The four categories of financial assets are:
NZBS ANNUAL STATEMENT OF PERFORMANCE EXPECTATIONS 1 JULY 2017 – 30 JUNE 2018
NEW ZEALAND BLOOD SERVICE Page 33 of 37
Category (1) - Financial assets at fair value through surplus or deficit
This category has two sub-categories: financial assets held for trading, and those designated at fair value through surplus or deficit at inception. A financial asset is classified in this category if acquired principally for the purpose of selling in the short term or if so designated by management.
Derivatives are also categorised as held for trading unless they are designated as hedges. Assets in this category are classified as current assets if they are either held for trading or are expected to be realised within 12 months of the balance date.
After initial recognition they are measured at their fair values. Gains or losses on re-measurement are recognised in the surplus or deficit.
Category (2) - Loans and receivables
These are non-derivative financial assets with fixed or determinable payments that are not quoted in an active market.
After initial recognition they are measured at amortised cost using the effective interest method, less impairment. Gains and losses when the asset is impaired or derecognised are recognised in the surplus or deficit. Loans and receivables are classified as “trade and other receivables” in the statement of financial position.
Category (3) - Held to maturity investments
Held to maturity investments are assets with fixed or determinable payments and fixed maturities that NZBS has the positive intention and ability to hold to maturity. After initial recognition they are measured at amortised cost using the effective interest method, less impairment. Gains or losses when the asset is impaired or derecognised are recognised in surplus or deficit. Currently, NZBS does not hold any financial assets in this category.
Category (4) - Available-for-sale financial assets
Non-derivative financial assets that are designated as available for sale or are not classified as category (1) financial assets at fair value through surplus or deficit, category (2) loans and receivables or category (3) held-to-maturity investments. This encompasses derivatives that are designated hedges. After initial recognition these investments are measured at their fair value.
If impairment evidence exists for derivatives that are designated hedges at fair value through other comprehensive revenue and expenses, the cumulative loss recognised in other comprehensive revenue or expenses is reclassified from equity to the surplus or deficit.
Impairment of Financial Assets
At each balance date NZBS assesses whether there is any objective evidence that a financial asset or group of financial assets is impaired. Any impairment losses are recognised in the surplus or deficit.
Financial Liabilities
NZBS classifies its financial liabilities within the scope of PBE IPSAS 29 Financial Instruments: Recognition and Measurement as either financial liabilities at fair value through surplus or deficit or loans and borrowings at amortised cost. The classification of financial liabilities are determined on initial recognition.
All financial liabilities are recognised initially at fair value, and in the case of loans and borrowings, plus directly attributable transaction costs.
NZBS's financial liabilities include trade and other payables, loans and borrowings.
Foreign Currency Translation
Foreign currency transactions are translated into the functional currency using the exchange rates prevailing at the dates of the transactions. Transactions denominated in foreign currency are reported at the reporting date by applying the exchange rate on that date. Foreign exchange gains and losses resulting from the settlement of such transactions are recognised in the surplus or deficit.
Accounting for Derivative Financial Instruments and Hedging Activities
NZBS uses derivative financial instruments to manage exposure to foreign exchange risks arising from financing activities. In accordance with its Treasury Management Policy, NZBS does not hold or issue derivative financial instruments for trading purposes. NZBS has not adopted hedge accounting.
NZBS ANNUAL STATEMENT OF PERFORMANCE EXPECTATIONS 1 JULY 2017 – 30 JUNE 2018
NEW ZEALAND BLOOD SERVICE Page 34 of 37
Derivatives are initially recognised at fair value on the date a derivative contract is entered into and are subsequently re-measured at their fair value at each balance date. The resulting gain or loss is recognised in the surplus or deficit.
Property, Plant and Equipment
Property, plant and equipment consists of operational assets which include plant and equipment, computer hardware, motor vehicles, furniture and fittings / office equipment and leasehold improvements.
Property, plant and equipment is shown at cost less accumulated depreciation and impairment losses.
Additions
The cost of an item of property, plant and equipment is recognised as an asset if, and only if, it is probable that future economic benefits or service potential associated with the item will flow to NZBS and the cost of the item can be measured reliably.
Property, plant and equipment is initially recognised at cost. Where an asset is acquired at no cost, or for a nominal cost, it is recognised at fair value as at the date of acquisition.
Work in progress is recognised at cost less impairment and is not depreciated.
Disposals
Gains and losses on disposals are determined by comparing the proceeds with the carrying amount of the asset. Gains and losses on disposals are included in the surplus or deficit.
Subsequent costs
The cost of replacing or improving part of an item of property, plant and equipment is recognised in the carrying amount of an item. The costs of day-to-day servicing of property, plant and equipment are recognised as incurred in the surplus or deficit.
Depreciation
Depreciation is provided on a straight-line basis on all property, plant and equipment, at rates that will write off the cost of the assets to their estimated residual values over their useful lives. The useful lives of major classes of assets have been estimated as follows:
Computer Equipment: - 3 to 5 years
Furniture and Fittings: - 5 to10 years
Motor Vehicles: - 3 to 4 years
Plant and Equipment: - 5 to10 years
Leasehold Improvements: - Shorter of term of lease or useful life
The residual value and useful life of an asset is reviewed, and adjusted if applicable, at each financial year end.
Intangible Assets
Acquired computer software licenses are capitalised on the basis of the costs incurred to acquire and bring to use the specific software.
Costs associated with maintaining computer software are recognised as an expense when incurred.
Amortisation
The carrying value of an intangible asset with a finite life is amortised on a straight-line basis over its useful life. Amortisation begins when the asset is available for use and ceases at the date that the asset is derecognised. The amortisation charge for each period is recognised in the surplus or deficit.
The useful lives of major classes of intangible assets have been estimated as follows:
Computer Software - 3 years
Computer Software Blood Management System (eProgesa and eTraceline) - 10 years
Changes in the expected useful life or the expected pattern of consumption are treated as changes in accounting estimates.
Intangible assets with a finite useful life are assessed for impairment whenever there is an indication that the asset may be impaired.
NZBS ANNUAL STATEMENT OF PERFORMANCE EXPECTATIONS 1 JULY 2017 – 30 JUNE 2018
NEW ZEALAND BLOOD SERVICE Page 35 of 37
Impairment of Non-Financial Assets
NZBS does not hold any cash-generating assets. Assets are considered cash-generating where their primary objective is to generate a commercial return.
Non-Cash-Generating Assets
Property, plant, and equipment and intangible assets held at cost that have a finite useful life are reviewed for impairment whenever events or changes in circumstances indicate that the carrying amount may not be recoverable. An impairment loss is recognised for the amount by which the asset’s carrying amount exceeds its recoverable service amount. The recoverable service amount is the higher of an asset’s fair value less costs to sell and value in use.
Value in use is determined using an approach based on either a depreciated replacement cost approach, restoration cost approach, or a service units approach. The most appropriate approach used to measure value in use depends on the nature of the impairment and availability of information.
If an asset’s carrying amount exceeds its recoverable service amount, the asset is regarded as impaired and the carrying amount is written-down to the recoverable amount. The total impairment loss is recognised in the surplus or deficit.
The reversal of an impairment loss is recognised in the surplus or deficit.
Creditors and Other Payables
Creditors and other payables are stated at cost.
Employee Benefits
Short-term benefits
Employee benefits that NZBS expects to be settled within 12 months of balance date are measured at nominal values based on accrued entitlements at current rates of pay. These include salaries and wages accrued up to balance date, annual leave earned to, but not yet taken at balance date, retiring and long service leave entitlements expected to be settled within 12 months, and sick leave.
NZBS recognises a liability for sick leave to the extent that absences in the coming year are expected to be greater than the sick leave entitlements earned in the coming year. The amount is calculated based on the unused sick leave entitlement that can be carried forward at balance date, to the extent that NZBS anticipates it will be used by staff to cover those future absences.
NZBS recognises a liability and an expense for bonuses where contractually obliged or where there is a past practice that has created a constructive obligation.
Long-term benefits
Long service leave and retirement leave
Entitlements that are payable beyond 12 months, such as long service leave and retirement gratuities, have been calculated on an actuarial basis. The calculations are based on:
Likely future entitlements accruing to staff, based on years (of service years) to entitlement, the likelihood that staff will reach the point of entitlement and contractual entitlements information; and
The present value of the estimated future cash flows. The discount rate is based on the weighted average of Government interest rates for stock with terms to maturity similar to those of the relevant liabilities. The inflation factor is based on the expected long-term increase in remuneration for employees.
Superannuation Schemes
Defined contribution schemes
Obligations for contributions to defined contribution superannuation schemes are recognised as an expense in the surplus or deficit.

NZBS ANNUAL STATEMENT OF PERFORMANCE EXPECTATIONS 1 JULY 2017 – 30 JUNE 2018
NEW ZEALAND BLOOD SERVICE Page 36 of 37
Defined benefit schemes
NZBS belongs to the Defined Benefit Plan Contributors Scheme (the scheme), which is managed by the Board of Trustees of the National Provident Fund. The scheme is a multi-employer defined benefit scheme.
Insufficient information is available to use defined benefit accounting, as it is not possible to determine from the terms of the scheme, the extent to which the surplus/deficit will affect future contributions by individual employers, as there is no prescribed basis for allocation. The scheme is therefore accounted for as a defined contribution scheme.
Provisions
NZBS recognises a provision for future expenditure of uncertain amount or timing when there is a present obligation (either legal or constructive) as a result of a past event, it is probable that expenditures will be required to settle the obligation and a reliable estimate can be made of the amount of the obligation.
Provisions are not recognised for future operating losses.
Provisions are measured at the present value of the expenditures expected to be required to settle then obligation using a pre-tax discount rate that reflects current market assessments of the time value of money and the risks specific to the obligation. The increase in the provision due to the passage of time is recognised as an interest expense.
Borrowings
Borrowings are initially recognised at their fair value. After initial recognition, all borrowings are measured at amortised cost using the effective interest method.
Borrowings are classified as current liabilities unless NZBS has an unconditional right to defer settlement of the liability for at least 12 months after balance date.
Adverse Fractionation Event Reserve and Matching Investment Funds
NZBS collects source plasma and contracts a third party to manufacture that source plasma, via a complex series of processes known as fractionation, to produce a range of derived fractionation products for use within the New Zealand health sector. The manufacturing contract clearly defines the party's respective risks and responsibilities inclusive of financial risk attribution should certain of those risks inherent in the manufacturing process actually occur. NZBS attributed financial risks have, based on historical performance, been classified as being of low frequency but with a potentially high financial impact if an event did occur.
Accordingly NZBS has elected to mitigate this manufacturing financial risk with the establishment of the Adverse Fractionation Event Policy that mandates the establishment of an Adverse Fractionation Event Reserve within the Equity section of the Statement of Financial Position that is complemented by a matching term deposit fund to ensure access to liquidity in the event of an adverse event occurring.
Under this policy NZBS is required to assess, on an annual basis, the upper level of potential financial risk, the current level of the reserve and whether further funds should be transferred to the reserve with matching liquidity also required to be then set aside.
Equity
Equity is the Crown's interest in NZBS.
The components of equity are:
Crown Equity - Crown Equity is the net asset and liability position at the time NZBS was established plus any subsequent equity injections.
Accumulated Comprehensive Revenue and Expense - is the accumulated surplus/deficit since NZBS establishment.
Adverse Fractionation Event Reserve - is the transfer from accumulated comprehensive revenue and expense commencing financial year ending 30 June 2015. The reserve has been established to mitigate the financial manufacturing risk associated with the production of fractionated derived products.
NZBS ANNUAL STATEMENT OF PERFORMANCE EXPECTATIONS 1 JULY 2017 – 30 JUNE 2018
NEW ZEALAND BLOOD SERVICE Page 37 of 37
Good and Service Tax (GST)
All items in the financial statements are stated exclusive of GST, except for receivables and payables, which are stated on a GST inclusive basis. Where GST is not recoverable as input tax then it is recognised as part of the related asset or expense.
The net amount of GST recoverable from, or payable to, the Inland Revenue Department (IRD) is included as part of receivables or payables in the Statement of Financial Position. The net GST paid to, or received from the IRD, including the GST relating to investing and financing activities, is classified as an operating cash flow in the statement of cash flows.
Commitments and contingencies are disclosed exclusive of GST.
Taxation
NZBS is a statutory corporation under the New Zealand Public Health & Disability Act 2000 and is exempt from income tax under Section CW38 of the Income Tax Act 2007.
Budget Figures
The budget figures are those approved by the Board of NZBS at the beginning of the year as presented in the Annual Statement of Performance Expectations. The budget figures have been prepared in accordance with NZ GAAP and comply with NZ GAAP, using accounting policies that are consistent with those adopted by the Board for the preparation of the financial statements.
Critical Accounting Estimates and Assumptions
In preparing these financial statements NZBS has made estimates and assumptions concerning the future. These estimates and assumptions may differ from the subsequent actual results. Estimates and assumptions are continually evaluated and are based on historical experience and other known or expected factors, including expectations or future events that are believed to be reasonable under the circumstances. Where this is the case the basis of those assumptions are detailed in the relevant accounting policy and / or Section 3.2 of this document.
Critical Judgements in Applying the NZBS Accounting Policies
In preparing these financial statements NZBS management has made judgements in applying the NZBS accounting policies. These judgements have been applied consistently to all periods presented in these financial statements. There are no material judgements that have a significant risk of causing a material adjustment to the carrying amounts of assets and liabilities that need disclosing.
Changes in Accounting Policy
There have been no changes in accounting policy.
======== /=/ ========