New York State Regents Examination in U.S. History and ... Field Test Analysis, Equating Procedure,...
108
New York State Regents Examination in U.S. History and Government 2012 Field Test Analysis, Equating Procedure, and Scaling of Operational Test Forms Technical Report Prepared for the New York State Education Department by Pearson May 2013
Transcript of New York State Regents Examination in U.S. History and ... Field Test Analysis, Equating Procedure,...

New York State Regents Examination in U.S. History and Government
2012 Field Test Analysis, Equating Procedure, and Scaling of
Operational Test Forms
Technical Report
Prepared for the New York State Education Department by Pearson
May 2013

Copyright
Developed and published under contract with the New York State Education Department by Pearson. Copyright © 2012 by the New York State Education Department. Secure Materials. All rights reserved. No part of this document may be reproduced or transmitted by any means. Use of these materials is expressly limited to the New York State Education Department.

Prepared for NYSED by Pearson i
Table of Contents
Table of Contents ................................................................................................... i
List of Tables ........................................................................................................ ii
Section I: Introduction ........................................................................................... 1
Purpose ....................................................................................................................................... 1
Section II: Field Test Analysis ............................................................................... 1
File Merging and Data Clean-up ................................................................................................. 2
Classical Analysis ........................................................................................................................ 2 Item Difficulty .......................................................................................................................... 3 Point-Biserial Correlation ........................................................................................................ 3 Test Reliability ......................................................................................................................... 5 Scoring Reliability ................................................................................................................... 6 Inter-rater Agreement .............................................................................................................. 7 Scaffold Questions and Essay Item Means and Standard Deviations ................................. 12 Intra-class Correlation ........................................................................................................... 12 Weighted Kappa ................................................................................................................... 12
Item Response Theory (IRT) Statistics ..................................................................................... 12 Item Calibration ..................................................................................................................... 13 Item Fit Evaluation ................................................................................................................ 14
Differential Item Functioning (DIF) Statistics ............................................................................. 16
Section III: Equating Procedure .......................................................................... 17
Equivalent-Group Equating Design ........................................................................................... 17
Common-Item Equating Design ................................................................................................ 19
Section IV: Scaling of Operational Test Forms ................................................... 20
References ......................................................................................................... 22
Appendix A: Classical Item Analysis ................................................................... 23
Appendix B: Partial-Credit Model Item Analysis .................................................. 50
Appendix C: DIF Statistics .................................................................................. 76
Appendix D: Operational Test Maps ................................................................... 91
Appendix E: Scoring Tables .............................................................................. 101

Prepared for NYSED by Pearson ii
List of Tables Table 1. Need/Resource Capacity Category Definitions ....................................... 1 Table 2. Classical Item Analysis ........................................................................... 4 Table 3. Test and Scoring Reliability ..................................................................... 6 Table 4. Point Differences Between First and Second Reads ............................. 8 Table 5. First and Second Read Descriptive Statistics and Agreement…………10 Table 6. Partial Credit Model Item Analysis ........................................................ 15 Table 7. Initial Mean Abilities and Equating Constants ....................................... 18 Table 8. Incomplete Data Matrix Structure .......................................................... 19 Table 9. Number of Anchor Items Not Meeting Stability Criteria ......................... 20

Prepared for NYSED by Pearson 1
Section I: Introduction
PURPOSE
The purpose of this report is to document the psychometric work on the New York State Regents Examination in U.S. History and Government in 2012. Specifically, contained within this report are procedures for, and results of, field test analysis, equating, and scaling of operational test forms. Because of a change in vendor mid-year, the field test equating was conducted by Pearson while the scaling was conducted by the previous vendor. Information on test development can be found in the test design and development report for the New York State Regents Examination in U.S. History and Government.
Section II: Field Test Analysis
In May 2012, field testing was conducted for the New York State Regents Examination in U.S. History and Government to better understand the psychometric quality of the items. The results of this testing are used to help determine which items will be selected for use on operational tests.
Target student samples for participation in this testing were selected such that
each would represent the student population expected to take the operational test. The Need/Resource Capacity Categories were used as variables in the sampling plan. See Table 1 for the seven Need/Resource Capacity Categories and their definitions. Table 1. Need/Resource Capacity Category Definitions
Need/Resource Capacity (N/RC) Category Definition
High N/RC Districts: New York City New York City
Large Cities Buffalo, Rochester, Syracuse, Yonkers
Urban-Suburban Districts at or above 70th percentile on the index with at least 100 students per square mile or enrollment greater than 2500
Rural All districts at or above the 70th percentile with fewer than 50 students per square mile or enrollment of fewer than 2500
Average N/RC Districts All districts between the 20th and 70th percentiles on the index
Low N/RC Districts All districts below the 20th percentile on the index
Charter Schools Each charter school is a district

Prepared for NYSED by Pearson 2
The data collected from field testing were scored by two entities. The multiple-choice items were scored by the New York State Education Department and the scaffold questions and essay items were scored by Measurement Incorporated. Therefore, it was necessary to combine data files for data analysis. Both classical-test and item-response theory analyses were conducted using the data to evaluate the quality of the test items.
FILE MERGING AND DATA CLEAN-UP
Response data were contained in two separate files. The multiple-choice data file contained 25573 student records, and the scaffold questions and essay data file contained 16682 student records.
Field test forms 731–747 only contained multiple-choice questions. Therefore,
data for these forms was included only in the multiple-choice data file. After the exclusion rules were applied, the resulting field test data file for these forms contained 13284 records.
Field test forms 748–759 contained multiple-choice, scaffold questions, and
essay item types. To combine the two files, the multiple-choice file served as the base file, and scaffold questions and essay records were merged to the multiple-choice records using unique test booklet numbers. After the exclusion rules were applied, the resulting field test data file contained 10893 records.
Multiple-choice response data were then compared to the answer key. All item
responses not matching the answer key were assigned scores of 0. The responses matching the answer key were assigned scores of 1. With respect to the scaffold questions and essay items, scores from 0 to the maximum point value available for each tested item were kept while out of range values were assigned scores of 0. For Item Response Theory (IRT) calibrations, blanks (i.e., missing data) were assigned scores of 0 to be consistent with how operational test items are scored.
The final data file contained both the scored and unscored student responses.
Unscored data were used to calculate the percentage of students who selected the various answer choices for the multiple-choice items or the percentage of students who received the range of possible raw score points for the scaffold questions and essay items. Thus, the frequency of students leaving items blank could be calculated. The scored data were used for all other analyses.
CLASSICAL ANALYSIS
Classical Test Theory is based on the assumption that an observed test score x is composed of both true score t and error score e. This assumption is expressed as follows:
x = t + e

Prepared for NYSED by Pearson 3
In other words, error is associated with measuring a student’s true score. For example, the choice of test items or administration conditions may influence student responses, making a student’s observed score higher or lower than the student’s true score. The error is considered random. After repeated administrations, the mean of the error scores is virtually zero (0). Thus, a student’s observed score is expected to equal his or her true score. This expectation is expressed as follows:
E(x) = t
Using a Classical Test Theory framework, field test data can be analyzed to provide information about the quality of test items. Item difficulties, point-biserial correlations, reliability estimates, and various statistics related to rater agreement have been calculated and are summarized in the following section.
Item Difficulty
Item difficulty is an indication of student achievement on a specific item. Because this examination contains polytomous items, item means are not appropriate for comparing difficulty across items. Instead, weighted item means were calculated by dividing an item’s mean by the maximum points possible for that item.
For multiple-choice items, item difficulty is determined by the proportion of
students who answer an item correctly. If 90% of the student responses to a multiple-choice item are correct, then this item is considered easier than a multiple-choice item having correct responses from only 30% of the students.
Point-Biserial Correlation
The point-biserial correlation is another classical statistic that can be used to evaluate items. For multiple-choice items, it is the correlation between students’ performance on a given item (correct or incorrect) and overall performance scores. This statistic is used to evaluate how well an item identifies students who understand the concept being measured and can be generalized for scaffold questions and essay items. The possible range for the point-biserial correlation is -1.0 to 1.0, with higher values being more desirable.
Table 2 presents a summary of the classical item analysis for each of the field
test forms. The first three columns identify the form number, the number of students who took each form, and the number of items on each field test form. The remaining columns are divided into two sections (i.e., item difficulty and point-biserial correlations). Recall that for scaffold questions and essay items, item means were divided by the maximum number of points possible in order to place them in the same metric as the multiple-choice items. For all but three items, item difficulties were below 0.90. With respect to the point-biserial correlations, most of these correlations were greater than 0.25.

Prepared for NYSED by Pearson 4
Table 2. Classical Item Analysis
Item Difficulty Point-Biserial
Form N-Count No. of Items <0.50 0.50 to 0.90 >0.90 <0.25 0.25 to
0.50 >0.50
731 782 30 4 26 0 0 13 17
732 785 32 8 24 0 1 27 4
733 782 32 5 27 0 1 23 8
734 776 32 8 24 0 3 20 9
735 775 32 6 26 0 2 20 10
736 792 32 6 26 0 0 19 13
737 778 32 7 25 0 0 24 8
738 788 32 7 25 0 0 20 12
739 777 32 5 27 0 2 23 7
740 793 32 8 24 0 2 24 6
741 789 32 8 24 0 4 15 13
742 792 32 9 23 0 3 22 7
743 781 32 11 21 0 2 25 5
744 770 32 15 17 0 5 23 4
745 771 32 14 17 1 3 21 8
746 767 32 17 14 1 3 25 4
747 786 32 11 20 1 5 22 5
748 953 1 1 0 0 0 0 1
749 974 1 1 0 0 0 0 1
750 978 1 1 0 0 0 0 1
751 980 1 1 0 0 0 0 1
752 979 1 1 0 0 0 0 1
753 976 1 1 0 0 0 0 1
754 980 1 1 0 0 0 0 1
755 823 10 1 9 0 0 6 4
756 815 13 1 12 0 0 9 4
757 817 12 3 9 0 0 9 3
758 807 12 1 11 0 0 9 3
759 811 12 1 11 0 0 4 8
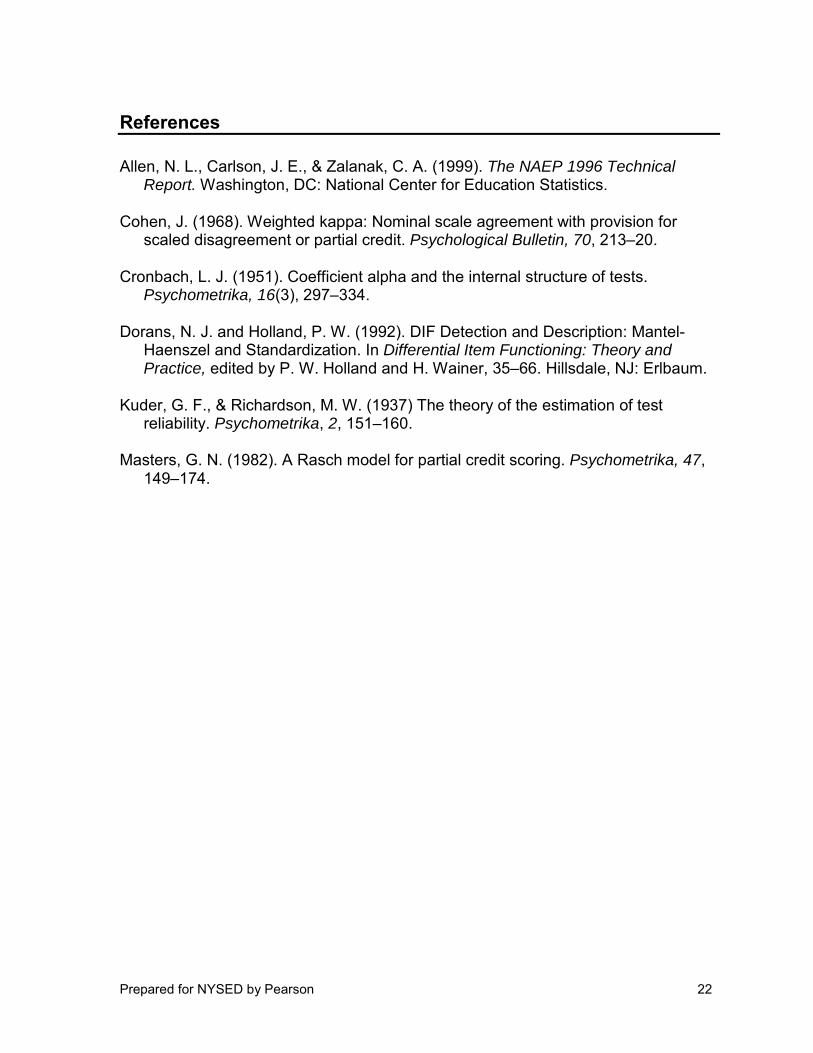
In addition to the summary information provided in Table 2, further classical item
statistics are provided in Appendix A. “Max” is the maximum number of possible

Prepared for NYSED by Pearson 5
points. “N-Count” refers to the number of student records in the analysis. “Alpha” contains the internal consistency statistics discussed below. For multiple-choice items, “B” represents the proportion of students who left the item blank and “M1” through “M4” are the proportions of students who selected each of the four answer choices. For scaffold questions and essay items, “B” represents the proportion of students who left the items blank and “M0” through “M5” are the proportions of students who received scores of 0 through 5. “Mean” is the average of the scores received by the students. The final (right) column contains the point-biserial correlation for each item. There are some instances of items with missing statistics; this occurs when an item is not scored.
Test Reliability
Classical analysis can also be used to measure the reliability of the test. Reliability is the consistency of the results obtained from a measurement with respect to time or among items or subjects that constitute a test. As such, test reliability can be estimated in a variety of ways. Internal consistency indices are a measure of how consistently examinees respond to items within a test. Two factors influence estimates of internal consistency: (1) test length and (2) homogeneity of items. In general, the more items on the examination the higher the reliability, and the more similar the items are the higher the reliability.
Cronbach's α (alpha) (Cronbach, 1951) has an important use as a measure of the internal consistency of a test. This formula is the extension of an earlier version, the Kuder-Richardson Formula 20 (KR-20; Kuder & Richardson, 1937), which is the equivalent for dichotomous items.
Table 3 contains the internal consistency statistics for all of the field test forms. These statistics ranged from 0.81 to 0.90 and are based solely on the items in the individual field test forms. It is expected that these statistics associated with the operational tests would be greater because there are more items on the operational test forms.

Prepared for NYSED by Pearson 6
Table 3. Test and Scoring Reliability Form Number Test Reliability Scoring Reliability
731 0.90 n/a
732 0.84 n/a
733 0.88 n/a
734 0.86 n/a
735 0.86 n/a
736 0.87 n/a
737 0.88 n/a
738 0.88 n/a
739 0.86 n/a
740 0.84 n/a
741 0.86 n/a
742 0.85 n/a
743 0.81 n/a
744 0.81 n/a
745 0.85 n/a
746 0.84 n/a
747 0.83 n/a
748 0.88 0.81
749 0.88 0.76
750 0.87 0.70
751 0.87 0.72
752 0.88 0.84
753 0.88 0.80
754 0.87 0.80
755 0.90 0.84
756 0.90 0.90
757 0.89 0.89
758 0.90 0.80
759 0.90 0.78
Scoring Reliability
One concern with scaffold questions and essay items is the reliability of the scoring process (i.e., consistency of the score assignment). Scaffold questions and essay items must be read by scorers who assign scores based on a comparison

Prepared for NYSED by Pearson 7
between the rubric and students’ responses. Consistency, in the way scores are assigned, is a critical part of the reliability of the assessment. To measure this consistency, 10% of the test booklets are scored a second time (i.e., second read scores) and compared to the original set of scores (i.e., first read scores).
As an overall measure of scoring reliability, the Pearson Correlation Coefficient
between the first and second scores for each of the scaffold questions and essay items was computed. This statistic is often used as an overall indicator of scoring reliability and generally ranges from 0.00 to near 1.00. Table 3 contains the results from these analyses in the column headed Scoring Reliability (forms composed solely of MC items have “n/a” in this column, indicating that they had no CR items and that this statistic therefore did not apply [not applicable]). The correlations ranged from 0.70 to 0.90, indicating high scoring reliability.
Inter-rater Agreement
For each scaffold questions and essay item, the difference between the first and second reads was computed. When examining inter-rater agreement statistics, it should be kept in mind that the maximum number of points per item varies as shown in the ‘Score Points’ column of the following tables.
Table 4 contains the proportion of occurrences of these differences for each item. There were no instances of the first read and second read differing by more than 2.00.

Prepared for NYSED by Pearson 8
Table 4. Point Differences Between First and Second Reads
Difference (First Read minus Second Read)
Form Item Score Points −3 −2 −1 0 1 2 3
748 THM 5 0.00 0.01 0.15 0.67 0.16 0.01 0.00 749 THM 5 0.00 0.02 0.15 0.63 0.16 0.04 0.00 750 THM 5 0.00 0.04 0.13 0.64 0.18 0.01 0.00 751 THM 5 0.00 0.02 0.14 0.62 0.22 0.01 0.00 752 THM 5 0.00 0.00 0.14 0.73 0.12 0.00 0.00 753 THM 5 0.00 0.01 0.14 0.71 0.12 0.02 0.00 754 THM 5 0.00 0.00 0.15 0.57 0.25 0.02 0.00 755 01 2 0.00 0.01 0.07 0.76 0.16 0.01 0.00 755 02 1 0.00 0.00 0.06 0.90 0.04 0.00 0.00 755 03 2 0.00 0.00 0.11 0.73 0.15 0.01 0.00 755 04 1 0.00 0.00 0.04 0.90 0.06 0.00 0.00 755 05 1 0.00 0.00 0.04 0.90 0.06 0.00 0.00 755 06 2 0.00 0.00 0.09 0.79 0.11 0.01 0.00 755 07 2 0.00 0.01 0.13 0.72 0.14 0.00 0.00 755 08 2 0.00 0.00 0.05 0.93 0.02 0.00 0.00 755 09 1 0.00 0.00 0.06 0.84 0.10 0.00 0.00 755 DBQ 5 0.00 0.00 0.14 0.77 0.09 0.00 0.00 756 01 2 0.00 0.00 0.07 0.86 0.06 0.01 0.00 756 02 2 0.00 0.00 0.04 0.91 0.05 0.00 0.00 756 03 1 0.00 0.00 0.05 0.92 0.03 0.00 0.00 756 04 1 0.00 0.00 0.05 0.89 0.05 0.00 0.00 756 05 1 0.00 0.00 0.03 0.96 0.01 0.00 0.00 756 6a 1 0.00 0.00 0.01 0.97 0.02 0.00 0.00 756 6b 1 0.00 0.00 0.03 0.95 0.02 0.00 0.00 756 07 1 0.00 0.00 0.05 0.93 0.02 0.00 0.00 756 8a 1 0.00 0.00 0.00 1.00 0.00 0.00 0.00 756 8b 1 0.00 0.00 0.06 0.90 0.03 0.00 0.00 756 9a 1 0.00 0.00 0.05 0.91 0.03 0.00 0.00 756 9b 1 0.00 0.00 0.03 0.95 0.02 0.00 0.00 756 DBQ 5 0.00 0.00 0.11 0.78 0.11 0.00 0.00 757 01 2 0.00 0.00 0.01 0.95 0.04 0.00 0.00 757 02 1 0.00 0.00 0.06 0.89 0.05 0.00 0.00 757 3a 1 0.00 0.00 0.03 0.91 0.06 0.00 0.00 757 3b 1 0.00 0.00 0.08 0.85 0.06 0.00 0.00 757 04 1 0.00 0.00 0.08 0.80 0.12 0.00 0.00 757 05 1 0.00 0.00 0.06 0.87 0.07 0.00 0.00
Prepared for NYSED by Pearson 9
Table 4. Point Differences Between First and Second Reads Difference (First Read minus Second Read)
Form Item Score Points −3 −2 −1 0 1 2 3
757 06 2 0.00 0.00 0.05 0.88 0.07 0.00 0.00 757 7a 2 0.00 0.01 0.01 0.96 0.03 0.00 0.00 757 7b 1 0.00 0.00 0.03 0.91 0.06 0.00 0.00 757 08 1 0.00 0.00 0.07 0.88 0.06 0.00 0.00 757 09 1 0.00 0.00 0.06 0.89 0.05 0.00 0.00 757 DBQ 5 0.00 0.00 0.11 0.80 0.09 0.00 0.00 758 01 2 0.00 0.01 0.17 0.72 0.09 0.01 0.00 758 02 1 0.00 0.00 0.04 0.90 0.06 0.00 0.00 758 3a 1 0.00 0.00 0.01 0.94 0.04 0.00 0.00 758 3b 1 0.00 0.00 0.05 0.92 0.03 0.00 0.00 758 04 1 0.00 0.00 0.03 0.93 0.04 0.00 0.00 758 05 1 0.00 0.00 0.01 0.94 0.04 0.00 0.00 758 06 1 0.00 0.00 0.03 0.95 0.01 0.00 0.00 758 7a 1 0.00 0.00 0.06 0.91 0.03 0.00 0.00 758 7b 1 0.00 0.00 0.03 0.89 0.08 0.00 0.00 758 08 1 0.00 0.00 0.10 0.82 0.08 0.00 0.00 758 09 1 0.00 0.00 0.03 0.95 0.03 0.00 0.00 758 DBQ 5 0.00 0.02 0.14 0.69 0.14 0.01 0.00 759 01 2 0.00 0.00 0.12 0.78 0.10 0.00 0.00 759 02 1 0.00 0.00 0.17 0.66 0.18 0.00 0.00 759 3a 1 0.00 0.00 0.08 0.84 0.08 0.00 0.00 759 3b 1 0.00 0.00 0.12 0.79 0.09 0.00 0.00 759 04 2 0.00 0.01 0.11 0.79 0.09 0.01 0.00 759 05 1 0.00 0.00 0.07 0.89 0.04 0.00 0.00 759 06 1 0.00 0.00 0.09 0.83 0.08 0.00 0.00 759 07 1 0.00 0.00 0.04 0.93 0.03 0.00 0.00 759 8a 1 0.00 0.00 0.05 0.91 0.04 0.00 0.00 759 8b 1 0.00 0.00 0.06 0.88 0.06 0.00 0.00 759 09 2 0.00 0.00 0.11 0.77 0.11 0.00 0.00 759 DBQ 5 0.00 0.00 0.11 0.76 0.13 0.01 0.00
Table 5 contains additional summary information regarding the first and second
reads. In the fourth column from the left the percent of exact matches between the first and second scores is provided. “Adj.” is the percentage of differences with a magnitude of one. “Total” is the sum of the two prior columns and contains values between 94.7% and 100%. These values indicate a high degree of agreement.
(continued)

Prepared for NYSED by Pearson 10
Table 5. First and Second Read Descriptive Statistics and Agreement
Agreement (%) Raw Score Mean Raw Score Standard Deviation
Form Item Score Points
Total N-
Count Exact Adj. Total First
Read Second
Read First Read
Second Read
Intra-Class Corre-lation
Wt Kappa
748 THM 5 173 67.1 30.6 97.7 1.4 1.4 1.06 1.02 0.81 0.69
749 THM 5 170 62.9 31.8 94.7 1.4 1.4 1.03 1.07 0.76 0.63
750 THM 5 176 64.2 30.7 94.9 1.4 1.4 0.91 0.95 0.70 0.59
751 THM 5 169 61.5 36.1 97.6 1.6 1.5 0.91 0.89 0.72 0.58
752 THM 5 169 73.4 26.6 100.0 1.3 1.3 0.92 0.90 0.84 0.72
753 THM 5 170 71.2 26.5 97.6 1.4 1.4 0.96 0.91 0.80 0.69
754 THM 5 169 57.4 40.8 98.2 2.2 2.1 1.05 1.11 0.80 0.63
755 01 2 152 75.7 23.0 98.7 1.6 1.5 0.66 0.72 0.71 0.62
755 02 1 145 90.3 9.7 100.0 0.8 0.8 0.43 0.43 0.74 0.74
755 03 2 150 72.7 26.7 99.3 1.2 1.2 0.77 0.79 0.76 0.66
755 04 1 145 89.7 10.3 100.0 0.7 0.7 0.46 0.47 0.76 0.76
755 05 1 146 89.7 10.3 100.0 0.7 0.7 0.44 0.45 0.74 0.74
755 06 2 148 79.1 20.3 99.3 1.5 1.5 0.65 0.72 0.76 0.67
755 07 2 142 71.8 27.5 99.3 1.4 1.4 0.77 0.73 0.73 0.61
755 08 2 147 93.2 6.8 100.0 1.4 1.5 0.82 0.82 0.95 0.91
755 09 1 146 84.2 15.8 100.0 0.7 0.7 0.45 0.47 0.63 0.63
755 DBQ 5 143 76.9 23.1 100.0 1.3 1.3 0.88 0.97 0.87 0.77
756 01 2 145 85.5 13.1 98.6 1.7 1.7 0.63 0.65 0.77 0.70
756 02 2 142 90.8 9.2 100.0 1.7 1.7 0.64 0.66 0.89 0.83
756 03 1 149 91.9 8.1 100.0 0.8 0.8 0.39 0.37 0.72 0.72
756 04 1 151 89.4 10.6 100.0 0.8 0.8 0.40 0.40 0.67 0.67
756 05 1 145 95.9 4.1 100.0 0.9 0.9 0.35 0.34 0.83 0.83
756 6a 1 147 96.6 3.4 100.0 0.8 0.8 0.36 0.37 0.87 0.87
756 6b 1 141 95.0 5.0 100.0 0.7 0.7 0.45 0.45 0.88 0.88
756 07 1 146 93.2 6.8 100.0 0.6 0.7 0.49 0.48 0.85 0.85
756 8a 1 152 100.0 0.0 100.0 0.8 0.8 0.42 0.42 1.00 1.00
756 8b 1 143 90.2 9.8 100.0 0.6 0.6 0.49 0.48 0.79 0.79
756 9a 1 151 91.4 8.6 100.0 0.7 0.7 0.45 0.44 0.78 0.78
756 9b 1 143 95.1 4.9 100.0 0.6 0.6 0.49 0.49 0.90 0.90
756 DBQ 5 142 78.2 21.8 100.0 1.3 1.3 1.14 1.09 0.91 0.82
757 01 2 142 95.1 4.9 100.0 1.8 1.8 0.57 0.59 0.93 0.88
757 02 1 147 89.1 10.9 100.0 0.6 0.6 0.49 0.49 0.77 0.77
757 3a 1 144 91.0 9.0 100.0 0.6 0.6 0.49 0.49 0.81 0.81
757 3b 1 143 85.3 14.7 100.0 0.6 0.7 0.48 0.47 0.68 0.68
757 04 1 145 80.0 20.0 100.0 0.5 0.5 0.50 0.50 0.60 0.60

Prepared for NYSED by Pearson 11
Table 5. First and Second Read Descriptive Statistics and Agreement Agreement (%) Raw Score Mean Raw Score
Standard Deviation
Form Item Score Points
Total N-
Count Exact Adj. Total First
Read Second
Read First Read
Second Read
Intra-Class Corre-lation
Wt Kappa
757 05 1 147 87.1 12.9 100.0 0.6 0.6 0.49 0.49 0.73 0.73
757 06 2 146 88.4 11.6 100.0 1.6 1.6 0.74 0.72 0.89 0.82
757 7a 2 147 95.9 3.4 99.3 1.4 1.4 0.87 0.87 0.96 0.94
757 7b 1 149 90.6 9.4 100.0 0.5 0.4 0.50 0.50 0.81 0.81
757 08 1 145 87.6 12.4 100.0 0.7 0.7 0.47 0.46 0.71 0.71
757 09 1 142 89.4 10.6 100.0 0.6 0.6 0.49 0.49 0.78 0.78
757 DBQ 5 144 79.9 20.1 100.0 1.0 1.0 0.82 0.82 0.85 0.77
758 01 2 143 72.0 26.6 98.6 1.2 1.3 0.68 0.69 0.67 0.59
758 02 1 146 89.7 10.3 100.0 0.8 0.8 0.41 0.42 0.70 0.70
758 3a 1 143 94.4 5.6 100.0 0.8 0.8 0.40 0.42 0.83 0.83
758 3b 1 140 92.1 7.9 100.0 0.8 0.8 0.41 0.39 0.75 0.75
758 04 1 147 92.5 7.5 100.0 0.8 0.7 0.43 0.44 0.80 0.80
758 05 1 142 94.4 5.6 100.0 0.6 0.5 0.50 0.50 0.89 0.89
758 06 1 147 95.2 4.8 100.0 0.9 0.9 0.36 0.34 0.80 0.80
758 7a 1 143 90.9 9.1 100.0 0.6 0.6 0.50 0.49 0.81 0.81
758 7b 1 145 89.0 11.0 100.0 0.7 0.6 0.47 0.49 0.76 0.76
758 08 1 142 81.7 18.3 100.0 0.5 0.5 0.50 0.50 0.63 0.63
758 09 1 147 94.6 5.4 100.0 0.7 0.7 0.46 0.46 0.87 0.87
758 DBQ 5 139 69.1 28.1 97.1 1.2 1.2 0.89 0.84 0.74 0.64
759 01 2 152 78.3 21.7 100.0 1.3 1.3 0.74 0.73 0.80 0.72
759 02 1 145 65.5 34.5 100.0 0.5 0.5 0.50 0.50 0.31 0.31
759 3a 1 146 84.2 15.8 100.0 0.7 0.7 0.47 0.47 0.64 0.64
759 3b 1 142 78.9 21.1 100.0 0.6 0.7 0.48 0.47 0.53 0.53
759 04 2 141 78.7 19.9 98.6 1.3 1.3 0.70 0.72 0.75 0.69
759 05 1 141 88.7 11.3 100.0 0.7 0.7 0.47 0.46 0.73 0.73
759 06 1 143 82.5 17.5 100.0 0.7 0.7 0.45 0.45 0.56 0.56
759 07 1 144 93.1 6.9 100.0 0.8 0.8 0.42 0.41 0.80 0.79
759 8a 1 145 91.0 9.0 100.0 0.7 0.7 0.46 0.46 0.79 0.79
759 8b 1 141 87.9 12.1 100.0 0.8 0.8 0.43 0.42 0.67 0.67
759 09 2 142 77.5 22.5 100.0 1.3 1.3 0.78 0.80 0.82 0.73
759 DBQ 5 140 75.7 23.6 99.3 1.2 1.2 0.98 0.93 0.86 0.76
*Adj. = difference of 1
(continued)

Prepared for NYSED by Pearson 12
Scaffold Questions and Essay Item Means and Standard Deviations
The average score for each scaffold question and essay item was computed based on the first and second reads. In addition, the standard deviation of the scores was computed.
Table 5 contains the means and standard deviations for the first and second read
scores. The largest difference between the item means for the first and second scores was 0.10, while there were minimal differences among the standard deviations.
Intra-class Correlation
The intra-class correlation was computed for each item. This correlation is an estimate of the reliability of scoring based on an average of the first and second reads. Correlations greater than 0.60 are considered very strong because they explain more than one-third of the variance in the scores. All but three items had intra-class correlations greater than 0.60 (see Table 5).
Weighted Kappa
Weighted Kappa (Cohen, 1968) was calculated for each item based on the first and second reads. This statistic produces an estimate of the reliability of the score classifications relative to what would be expected to occur by chance.
Weighted Kappa is an estimate of the reliability of the score classifications. That
is, the Kappa statistic is a measure of reproducibility for categorical data. Guidelines for the evaluation of this statistic are:
• k > 0.75 denotes excellent reproducibility • 0.4 < k < 0.75 denotes good reproducibility • 0 < k < 0.4 denotes marginal reproducibility
The results found in Table 5 show a high degree of consistency between the first and second reads. The Weighted Kappa statistics ranged from 0.31 to 1.00, which in all but one case indicates good to excellent reproducibility.
Based on the scoring reliability analyses, there is strong evidence that the
scoring of the scaffold questions and essay items was performed in a highly reliable manner.
ITEM RESPONSE THEORY (IRT) STATISTICS
As discussed above, the item mean is a statistic used to evaluate item difficulty. However, many different test forms are used during field testing, and different samples of students are responding to these items. The average ability of the

Prepared for NYSED by Pearson 13
different samples of students varies and a direct comparison of item means across test forms may lead to inaccurate interpretations. Therefore, Item Response Theory (IRT) was also used to evaluate item difficulty.
Specifically, the Rasch Partial Credit Model (PCM) (Masters, 1982) was used.
With use of this model, the difficulty of items and the ability of examinees are placed on the same metric. Thus, the difficulty of an item and the ability of a person can be meaningfully compared across field test forms. Also, the use of this model provides greater flexibility in situations where different samples or test forms are used because the parameters generated are generally not considered to be sample dependent or test dependent. A description of this model, results of item calibration, and the item fit evaluation are presented below.
The PCM provides an overall difficulty estimate for each item. Specifically for
scaffold questions and essay items when there are several points possible, individual estimates of difficulty for each of the possible score points are also calculated (i.e., step values). Each step value represents the difficulty of a student receiving a particular score point given that they have already received the prior score point. For example, if a 3-point item had step values of -1.0, 1.0, and 0.0, one could say that it is relatively easy to obtain a score of 1. However, it is much more difficult to obtain a 2 given the student has the ability to score a 1 because the difference in difficulty between a 1 and a 2 is much greater than the difference between a 0 and a 1. Also, the difference between a 2 and a 3 is not as great as the difference between a 1 and a 2. Thus, with this example, a small step is needed to go from a 0 to a 1, a large step is needed to move from a 1 to a 2, and a moderate step is needed to proceed from a 2 to a 3.
Item Calibration
As discussed above, the use of Rasch item difficulty statistics provides an advantage over the use of classical item means because they can be compared across test forms. Different samples of students responded to the various test forms. Although the samples were selected to be similar with respect to student ability, there were differences. By equating the test forms (See the Equating Procedure section below), the Rasch item difficulties account for those differences and these statistics can be compared across test forms.
Rasch item difficulty values generally range from -3.00 to 3.00. An item with a
Rasch difficulty greater than 2.00 is considered very difficult and should be examined carefully. If the item is measuring an important concept that students are having difficulty with, then the item can be useful. However, if the item is measuring a trivial concept or is written in a confusing manner, then it may not be appropriate to use on an operational test form. Likewise, any item with a Rasch difficulty less than −2.00 is considered very easy and usually provides little information regarding student achievement. The vast majority of test items should range between −2.00 and 2.00. This range represents approximately two standard deviations around the

Prepared for NYSED by Pearson 14
average difficulty of 0.00. Thus, one would expect that, based on chance, roughly 5% of the items will fall outside of that range and therefore, these are items that should be closely examined for content.
Item Fit Evaluation
The INFIT statistic is used to determine whether items are functioning in a way that is congruent with the assumptions of the Rasch model. Under these assumptions, how a student will respond to an item depends on the proficiency of the student and the difficulty of the item, both of which are on the same measurement scale. If an item is as difficult as a student is able, the student will have a 50% chance of getting the item correct. If a student is more able than an item is difficult, under the assumptions of the Rasch model, that student has a greater than 50% chance of correctly answering the item. On the other hand, if the item is more difficult than the student is able, he or she has a less than 50% chance of correctly responding to the item. Rasch fit statistics estimate the extent to which an item is functioning in this predicted manner. Items showing a poor fit with the Rasch model typically have values outside the range of 0.70 to 1.30.
Table 6 contains a summary of the Partial-Credit Model item analysis for each of
the field test forms. The left-most column lists the form numbers. The next two columns list the number of students who participated and the number of items on each field test form. The remaining columns are divided into two sections. The first section pertains to the Rasch item difficulty values while the second pertains to the INFIT statistics. Most of the items fell within the moderate −2.00 to 2.00 difficulty range and only six items had an INFIT statistic outside the typical range.

Prepared for NYSED by Pearson 15
Table 5. Partial Credit Model Item Analysis Rasch INFIT
Form N-Count No. of Items <−2.0 −2.0 to 2.0 >2.0 <−0.70 −0.70 to
1.30 >1.30
731 782 30 0 29 1 0 30 0
732 785 32 0 31 1 0 31 1
733 782 32 0 32 0 0 32 0
734 776 32 0 31 1 0 32 0
735 775 32 0 32 0 0 31 1
736 792 32 0 31 1 0 32 0
737 778 32 0 31 1 0 32 0
738 788 32 0 32 0 0 32 0
739 777 32 0 31 1 0 31 1
740 793 32 0 29 3 0 32 0
741 789 32 0 31 1 0 31 1
742 792 32 0 31 1 0 32 0
743 781 32 0 29 3 0 32 0
744 770 32 0 28 4 0 31 1
745 771 32 0 32 0 0 32 0
746 767 32 0 31 1 0 32 0
747 786 32 1 29 2 0 32 0
748 953 1 0 0 1 0 1 0
749 974 1 0 0 1 0 1 0
750 978 1 0 0 1 0 1 0
751 980 1 0 0 1 0 1 0
752 979 1 0 0 1 0 1 0
753 976 1 0 0 1 0 1 0
754 980 1 0 1 0 0 0 1
755 823 10 0 9 1 0 10 0
756 815 13 0 12 1 0 13 0
757 817 12 0 11 1 0 12 0
758 807 12 0 11 1 0 12 0
759 811 12 0 11 1 0 12 0
Further individual IRT item statistics are provided in Appendix B. The column
entitled “RID” contains the Rasch item difficulty statistics. S1–S6 contain the step values for the scaffold questions and essay items. Finally, “INFIT” contains the INFIT statistic for each item.

Prepared for NYSED by Pearson 16
DIFFERENTIAL ITEM FUNCTIONING (DIF) STATISTICS
Statistical procedures are employed to observe whether, on the basis of data, there exists the possibility of unfair treatment of different populations. DIF statistics are used to identify items for which members of a focal group have a different probability of getting the items correct than members of a reference group after the groups have been matched as to ability level on the test.
For the multiple-choice items, the Mantel-Haenszel Delta (MHD) DIF statistics
were computed (Dorans & Holland, 1992) to classify test items in three levels of DIF for each comparison: (A) negligible DIF, (B) moderate DIF, and (C) large DIF. An item was flagged if it exhibited a B or C category of DIF using the following rules derived from the National Assessment of Educational Progress (NAEP) guidelines (Allen, Carlson, & Zalanak, 1999):
• MHDs not significantly different from 0.00 (based on alpha = 0.05) or |MHD| < 1.00 are classified as A.
• MHDs significantly different from 0 and {|MHD| ≥ 1.00 and < 1.50} or
MHD not significantly different from 0 and |MHD| ≥ 1.00 are classified as B.
• |MHD| ≥ 1.50 and significantly different from 0 are classified as C.
For the scaffold questions and essay items, the effect size (ES)of the standardized mean difference (SMD) was used to flag the DIF. The SMD reflects the size of the differences in performance on scaffold questions and essay items between student groups matched on the total score. It is the difference between the unweighted item mean of the focal group and the weighted item mean of the reference group. The weights applied to the reference group are applied so that the weighted number of reference group students is the same as that in the focal group (within the same ability group). The SMD is divided by the total group item standard deviation to get a measure of the ES for the SMD. The SMD effect size groups each item into one of three categories: (AA) negligible DIF, (BB) moderate DIF, and (CC) large DIF. Only categories BB and CC were flagged in the results.
• Probability is > 0.05 or if |ES| is ≤ 0.17 is classified as AA.
• Probability is > 0.05 and if 0.17 < |ES| ≤ 0.25 is classified as BB.
• Probability is > 0.05 and if |ES| is > 0.25 is classified as CC.
Although DIF statistics are typically conducted by gender and ethnicity, the low N-counts for ethnic subgroups did not allow for these statistics to be meaningful. The N-counts for gender allowed for comparisons to be made, but they were still somewhat low, so resulting statistics should be interpreted with caution.

Prepared for NYSED by Pearson 17
The DIF statistics for gender are shown in Appendix C. Flagging of items
appears in the “DIF Category” column and if an item is flagged, the “Favored Group” column indicates which gender is favored.
Section III: Equating Procedure
The 2012 field test administration for the New York State Regents Examination in U.S. History and Government consisted of 28 field test forms numbered 732–759 and one anchor form labeled 731. The field test forms can be grouped into three sets. Forms 731–747 consisted of multiple-choice items only. Forms 748–754 contained the multiple-choice anchor items (form 731) and a thematic essay. Forms 755-759 contained the multiple-choice anchor items, scaffold questions, and a DBQ essay. All students participating in the field test were administered one of the 19 test forms. The test forms 731–759 were spiraled within the classroom so that the groups of students taking each form were equivalent. A complete listing of these field test forms is provided in Appendix A, containing the number of items, item type (e.g., multiple-choice, scaffold question, essay), and the maximum points for each item are displayed.
The field test forms were equated using two different equating designs. Forms
732–747 were equated using an equivalent-groups design. Forms 748–759 were equated using a common-items design.
EQUIVALENT-GROUP EQUATING DESIGN
The anchor form (form 731) was equated to the item bank using a common-item equating design. The anchor item difficulty parameters were fixed to their 2010 item bank values. This places the item difficulty estimates and the ability estimates of the students taking the anchor form onto the item bank scale. After the anchor form was placed onto the bank scale, the average mean ability estimates was computed using ability estimates of non-extreme students. This value was then used to equate field test forms 732–747 as well as updating the item parameters for the anchor forms.
As part of the anchor item equating, an item-stability check was performed. After
fixing all of the items to their 2010 bank values, any item with a displacement value with a magnitude greater than 0.30 was no longer fixed and the test form was reanalyzed. If more than one item had a displacement value with a magnitude greater than 0.30, then the item with the largest displacement was freed and the test form was reanalyzed. In a stepwise fashion, this procedure was repeated until all remaining fixed anchor items had displacements with magnitudes that were less than or equal to 0.30.

Prepared for NYSED by Pearson 18
Applying the anchor item-stability check to the anchor form resulted in no items having a displacement value with a magnitude greater than 0.30. This indicates a strong level of stability in the items used on the anchor forms.
The equated mean ability estimate for form 731 was 0.92. This value was used as the target mean ability for the remainder of the equating process.
After the anchor form was equated and the target mean was computed, the field
test forms 732–747 were equated using the equivalent-groups design. The first step was to calibrate each form separately where all the item parameters were free to estimate (without constraint). From those initial calibrations, the mean ability estimates for each field test form were obtained. The second step was to determine the equating constant for each form by subtracting the mean ability for a given field test form from the target mean ability calculated from the anchor form (i.e., form 731). The respective equating constant was then added to each of the item parameters on a given form. If the resulting mean of the ability estimates for those students did not equal that of the target mean, then the procedure was repeated until the mean abilities for each of the field test forms equaled the target mean ability. Table 7 shows the mean abilities and constants used for the equating. Table 6. Initial Mean Abilities and Equating Constants
Form Number Mean Ability Constant
732 0.60 0.31
733 0.61 0.30
734 0.45 0.46
735 0.68 0.24
736 0.63 0.28
737 0.59 0.32
738 0.65 0.26
739 0.54 0.37
740 0.38 0.52
741 0.46 0.45
742 0.56 0.36
743 0.08 0.81
744 0.04 0.85
745 0.23 0.67
746 0.19 0.71
747 0.34 0.57

Prepared for NYSED by Pearson 19
COMMON-ITEM EQUATING DESIGN
The remaining field test forms (748–759) were equated to the item bank using a common-item equating design. Each field test form was administered with the anchor form. The field test data were arranged in an incomplete data matrix so that the anchor items were in each data line along with the unique items for each field test form. Items not appearing on the field test form were left blank and treated as not administered when item parameters were calibrated. The entire data set was then calibrated using WINSTEPS and applying the Partial-Credit Model. In this calibration, the anchor items were fixed to their 2010 bank values. This places all of the item parameters on the bank scale.
Table 8 illustrates the matrix equating design for forms 748–750, where “X‘”represents the presence of data and “—“ represents the absence of data. Table 7. Incomplete Data Matrix Structure
Anchor Form 748 Form 749 Form 750 X X — — X — X — X — — X
As part of the anchor item equating, an item-stability check was performed by
examining the displacement values. The displacement values indicate the difference between the bank values for the anchor items and the difficulty values for those items as if they were not fixed to the bank values. After fixing all of the items to their 2010 bank values, any item with a displacement value with a magnitude greater than 0.30 was no longer fixed and the test form was reanalyzed. If more than one item had a displacement value with a magnitude greater than 0.30, then the item with the largest displacement was freed and the test form was reanalyzed. In a stepwise fashion, this procedure was repeated until all remaining fixed anchor items had displacements with magnitudes less than or equal to 0.30.
Table 9 lists the number of anchor items by form that did not meet the stability
criteria. The forms range from zero items to a maximum of two items out of 30 anchor items. This shows a high level of anchor item stability.

Prepared for NYSED by Pearson 20
Table 8. Number of Anchor Items Not Meeting Stability Criteria Form Number of Items 748 2 749 3 750 2 751 0 752 1 753 3 754 3 755 5 756 3 757 3 758 3 759 3
The equated item parameters for the field test items can now be compared
across test forms, given that the equating process places all items on the same scale. In addition, when items are combined to form unique operational test forms, raw score to scale score tables can be generated based on these parameters. The following section contains a description of the development of the operational test forms and scoring tables.
Section IV: Scaling of Operational Test Forms
Operational test items are selected based on content coverage, content accuracy, and statistical quality. The sets of items on each operational test conform to the coverage suggested by content experts. These expert judgments are based on the learning standards established by the New York State Education Department. With respect to statistical quality, classical and Rasch statistics are examined to determine how well items function. Also, items are selected such that they range in difficulty in order to measure students across ability levels. Appendix D contains the 2012 operational test maps with content information regarding each item included on the January 2012, June 2012, and August 2012 operational test forms.
In order to limit wide fluctuations of raw scores that correspond to scale scores of
65 and 85 across administrations, the average Rasch item difficulty for the operational test is considered. For this examination, an average Rasch difficulty of approximately 0.835 is used as a target for each administration. In most cases, meeting this target will provide raw scores of similar magnitude to other forms. However, differences with these scores also occur due to the distribution of the Rasch item difficulty parameters.
Scoring tables display the relationship between raw scores on the operational
test and assigned scale scores. Appendix E contains the scoring tables used for the

Prepared for NYSED by Pearson 21
January, June, and August 2012 operational test forms. Four steps are taken in order to produce these tables and resulting conversion charts.
The first step is to develop a raw score (i.e., number of points on the test form) to
theta (i.e., student ability) to scale score relationship for the baseline operational test form. This relationship is determined when standards are set and then used for every administration moving forward until the standards are revisited. The baseline target was determined by the New York State Education Department to be January 2005. The raw score to theta relationship from that examination was used and then scale scores are calculated based on the raw score cuts according to the following formula:
p(x) = m3x3 + m2x2 + m1x + m0
The raw score of zero (0) was assigned a scale score of zero and the maximum
raw score was assigned a scale score of 100. The raw scores corresponding to the scale scores of 65 and 85 were also fixed. The polynomial relationship shown above was then used to assign all scale scores to the remaining raw scores. The resulting values for m1–m3 are the transformation constants used to produce the final raw score to scale score table.
The second step is to develop a raw score to theta relationship for the new
operational test form using the field test equated PCM item parameters. This is accomplished by doing a calibration where all items are anchored to their field test parameters. One modification that is made is that for 5-point items, a constant based on existing bank values is used in place of the field test parameters. The number of points on the test form (i.e., raw score) expected across student ability levels is based on the difficulty of the items on the form. Thus, given a particular student ability level (i.e., theta), if the points are more difficult to earn on the new test than the points on the January 2005 test, the number of points expected of this student on the new test will be less than the number of points expected of this student on the baseline form.
The third step is to use linear interpolation to determine the raw score to theta to scale score relationship for the new test. The theta values associated with scale scores of 65 and 85 on the baseline form are used along with the raw score to theta relationship developed in the previous step. In other words, the baseline 65 and 85 theta values are used as reference points and linear interpolation assigns the other scale scores.
Finally, a conversion chart is created based on the scoring table generated in the
third step. Scale scores are rounded to the nearest whole number in all cases except for 0, 65, 85, and 100. A raw score of zero (0) is assigned a scale score of zero (0). The maximum raw score is assigned a scale score of 100. With respect to 65 and 85 scale scores, the raw scores with scale scores of 65 or 85 after rounding are assigned those values.
Prepared for NYSED by Pearson 22
References Allen, N. L., Carlson, J. E., & Zalanak, C. A. (1999). The NAEP 1996 Technical
Report. Washington, DC: National Center for Education Statistics. Cohen, J. (1968). Weighted kappa: Nominal scale agreement with provision for
scaled disagreement or partial credit. Psychological Bulletin, 70, 213–20. Cronbach, L. J. (1951). Coefficient alpha and the internal structure of tests.
Psychometrika, 16(3), 297–334. Dorans, N. J. and Holland, P. W. (1992). DIF Detection and Description: Mantel-
Haenszel and Standardization. In Differential Item Functioning: Theory and Practice, edited by P. W. Holland and H. Wainer, 35–66. Hillsdale, NJ: Erlbaum.
Kuder, G. F., & Richardson, M. W. (1937) The theory of the estimation of test
reliability. Psychometrika, 2, 151–160. Masters, G. N. (1982). A Rasch model for partial credit scoring. Psychometrika, 47,
149–174.

Prepared for NYSED by Pearson 23
Appendix A: Classical Item Analysis

Prepared for NYSED by Pearson 24
Test Form Type Item Max N-Count Alpha B M0 M1 M2 M3 M4 M5 M6 Mean Point- Biserial
2012_USHG_FT 731 MC 01 1 782 0.90 0.01 0.80 0.06 0.10 0.04 0.80 0.47
2012_USHG_FT 731 MC 02 1 782 0.90 0.01 0.04 0.79 0.08 0.09 0.79 0.45
2012_USHG_FT 731 MC 03 1 782 0.90 0.01 0.59 0.25 0.11 0.03 0.59 0.49
2012_USHG_FT 731 MC 04 1 782 0.90 0.00 0.08 0.84 0.02 0.05 0.84 0.42
2012_USHG_FT 731 MC 05 1 782 0.90 0.01 0.06 0.29 0.35 0.29 0.29 0.26
2012_USHG_FT 731 MC 06 1 782 0.90 0.01 0.04 0.75 0.11 0.09 0.75 0.50
2012_USHG_FT 731 MC 07 1 782 0.90 0.01 0.57 0.08 0.29 0.05 0.57 0.45
2012_USHG_FT 731 MC 08 1 782 0.90 0.01 0.07 0.64 0.01 0.27 0.64 0.58
2012_USHG_FT 731 MC 09 1 782 0.90 0.02 0.22 0.10 0.12 0.54 0.54 0.53
2012_USHG_FT 731 MC 10 1 782 0.90 0.01 0.14 0.05 0.75 0.05 0.75 0.54
2012_USHG_FT 731 MC 11 1 782 0.90 0.01 0.80 0.12 0.02 0.05 0.80 0.53
2012_USHG_FT 731 MC 12 1 782 0.90 0.01 0.08 0.09 0.14 0.68 0.68 0.51
2012_USHG_FT 731 MC 13 1 782 0.90 0.02 0.65 0.05 0.24 0.05 0.65 0.39
2012_USHG_FT 731 MC 14 1 782 0.90 0.01 0.05 0.12 0.77 0.04 0.77 0.56
2012_USHG_FT 731 MC 15 1 782 0.90 0.02 0.09 0.07 0.22 0.61 0.61 0.60
2012_USHG_FT 731 MC 16 1 782 0.90 0.02 0.15 0.06 0.70 0.08 0.70 0.59
2012_USHG_FT 731 MC 17 1 782 0.90 0.01 0.11 0.14 0.03 0.71 0.71 0.61
2012_USHG_FT 731 MC 18 1 782 0.90 0.02 0.05 0.04 0.06 0.83 0.83 0.54
2012_USHG_FT 731 MC 19 1 782 0.90 0.02 0.12 0.14 0.69 0.04 0.69 0.57
2012_USHG_FT 731 MC 20 1 782 0.90 0.02 0.05 0.20 0.14 0.59 0.59 0.51
2012_USHG_FT 731 MC 21 1 782 0.90 0.02 0.79 0.08 0.04 0.06 0.79 0.54
2012_USHG_FT 731 MC 22 1 782 0.90 0.03 0.08 0.46 0.26 0.16 0.46 0.37
2012_USHG_FT 731 MC 23 1 782 0.90 0.03 0.07 0.79 0.07 0.04 0.79 0.55
2012_USHG_FT 731 MC 24 1 782 0.90 0.03 0.45 0.06 0.07 0.38 0.45 0.41

Prepared for NYSED by Pearson 25
Test Form Type Item Max N-Count Alpha B M0 M1 M2 M3 M4 M5 M6 Mean Point- Biserial
2012_USHG_FT 731 MC 25 1 782 0.90 0.04 0.10 0.45 0.24 0.18 0.45 0.43
2012_USHG_FT 731 MC 26 1 782 0.90 0.04 0.54 0.13 0.16 0.13 0.54 0.50
2012_USHG_FT 731 MC 27 1 782 0.90 0.03 0.12 0.58 0.22 0.05 0.58 0.52
2012_USHG_FT 731 MC 28 1 782 0.90 0.03 0.13 0.16 0.54 0.13 0.54 0.54
2012_USHG_FT 731 MC 29 1 782 0.90 0.04 0.10 0.64 0.14 0.09 0.64 0.56
2012_USHG_FT 731 MC 30 1 782 0.90 0.03 0.08 0.07 0.05 0.76 0.76 0.50
2012_USHG_FT 732 MC 01 1 785 0.84 0.00 0.10 0.02 0.87 0.01 0.87 0.33
2012_USHG_FT 732 MC 02 1 785 0.84 0.00 0.05 0.81 0.10 0.03 0.81 0.38
2012_USHG_FT 732 MC 03 1 785 0.84 0.01 0.10 0.17 0.58 0.13 0.58 0.39
2012_USHG_FT 732 MC 04 1 785 0.84 0.01 0.20 0.19 0.05 0.55 0.55 0.40
2012_USHG_FT 732 MC 05 1 785 0.84 0.00 0.04 0.90 0.03 0.02 0.90 0.37
2012_USHG_FT 732 MC 06 1 785 0.84 0.01 0.17 0.07 0.03 0.71 0.71 0.35
2012_USHG_FT 732 MC 07 1 785 0.84 0.01 0.28 0.58 0.09 0.04 0.58 0.48
2012_USHG_FT 732 MC 08 1 785 0.84 0.01 0.07 0.64 0.13 0.16 0.64 0.44
2012_USHG_FT 732 MC 09 1 785 0.84 0.01 0.30 0.11 0.46 0.12 0.46 0.30
2012_USHG_FT 732 MC 10 1 785 0.84 0.01 0.24 0.10 0.57 0.08 0.24 0.09
2012_USHG_FT 732 MC 11 1 785 0.84 0.01 0.10 0.03 0.09 0.76 0.76 0.46
2012_USHG_FT 732 MC 12 1 785 0.84 0.01 0.03 0.80 0.06 0.10 0.80 0.51
2012_USHG_FT 732 MC 13 1 785 0.84 0.01 0.60 0.20 0.10 0.09 0.60 0.37
2012_USHG_FT 732 MC 14 1 785 0.84 0.01 0.06 0.56 0.26 0.10 0.56 0.49
2012_USHG_FT 732 MC 15 1 785 0.84 0.02 0.07 0.14 0.13 0.64 0.64 0.40
2012_USHG_FT 732 MC 16 1 785 0.84 0.01 0.14 0.71 0.05 0.09 0.71 0.38
2012_USHG_FT 732 MC 17 1 785 0.84 0.02 0.12 0.15 0.40 0.30 0.40 0.32
2012_USHG_FT 732 MC 18 1 785 0.84 0.01 0.62 0.14 0.12 0.11 0.62 0.37

Prepared for NYSED by Pearson 26
Test Form Type Item Max N-Count Alpha B M0 M1 M2 M3 M4 M5 M6 Mean Point- Biserial
2012_USHG_FT 732 MC 19 1 785 0.84 0.02 0.69 0.07 0.18 0.04 0.69 0.54
2012_USHG_FT 732 MC 20 1 785 0.84 0.01 0.70 0.07 0.17 0.05 0.70 0.51
2012_USHG_FT 732 MC 21 1 785 0.84 0.02 0.11 0.03 0.23 0.61 0.61 0.42
2012_USHG_FT 732 MC 22 1 785 0.84 0.02 0.72 0.14 0.10 0.02 0.72 0.47
2012_USHG_FT 732 MC 23 1 785 0.84 0.02 0.14 0.06 0.10 0.68 0.68 0.45
2012_USHG_FT 732 MC 24 1 785 0.84 0.02 0.30 0.28 0.09 0.30 0.30 0.29
2012_USHG_FT 732 MC 25 1 785 0.84 0.03 0.05 0.67 0.11 0.14 0.67 0.49
2012_USHG_FT 732 MC 26 1 785 0.84 0.03 0.65 0.07 0.14 0.11 0.65 0.49
2012_USHG_FT 732 MC 27 1 785 0.84 0.04 0.37 0.23 0.29 0.07 0.29 0.41
2012_USHG_FT 732 MC 28 1 785 0.84 0.04 0.36 0.14 0.39 0.07 0.39 0.31
2012_USHG_FT 732 MC 29 1 785 0.84 0.04 0.80 0.07 0.05 0.04 0.80 0.52
2012_USHG_FT 732 MC 30 1 785 0.84 0.06 0.11 0.13 0.26 0.44 0.44 0.41
2012_USHG_FT 732 MC 31 1 785 0.84 0.05 0.10 0.08 0.68 0.10 0.68 0.49
2012_USHG_FT 732 MC 32 1 785 0.84 0.06 0.15 0.24 0.18 0.37 0.37 0.47
2012_USHG_FT 733 MC 01 1 782 0.88 0.01 0.11 0.86 0.02 0.01 0.86 0.23
2012_USHG_FT 733 MC 02 1 782 0.88 0.01 0.30 0.14 0.41 0.15 0.41 0.35
2012_USHG_FT 733 MC 03 1 782 0.88 0.01 0.27 0.47 0.13 0.12 0.47 0.50
2012_USHG_FT 733 MC 04 1 782 0.88 0.01 0.10 0.06 0.64 0.19 0.64 0.46
2012_USHG_FT 733 MC 05 1 782 0.88 0.01 0.03 0.19 0.72 0.05 0.72 0.49
2012_USHG_FT 733 MC 06 1 782 0.88 0.00 0.75 0.07 0.10 0.08 0.75 0.46
2012_USHG_FT 733 MC 07 1 782 0.88 0.01 0.10 0.51 0.09 0.29 0.51 0.52
2012_USHG_FT 733 MC 08 1 782 0.88 0.01 0.03 0.10 0.04 0.82 0.82 0.41
2012_USHG_FT 733 MC 09 1 782 0.88 0.01 0.13 0.41 0.29 0.16 0.41 0.34
2012_USHG_FT 733 MC 10 1 782 0.88 0.01 0.17 0.55 0.17 0.10 0.55 0.41

Prepared for NYSED by Pearson 27
Test Form Type Item Max N-Count Alpha B M0 M1 M2 M3 M4 M5 M6 Mean Point- Biserial
2012_USHG_FT 733 MC 11 1 782 0.88 0.01 0.27 0.12 0.46 0.15 0.46 0.44
2012_USHG_FT 733 MC 12 1 782 0.88 0.01 0.16 0.11 0.66 0.07 0.66 0.49
2012_USHG_FT 733 MC 13 1 782 0.88 0.01 0.63 0.07 0.16 0.14 0.63 0.43
2012_USHG_FT 733 MC 14 1 782 0.88 0.02 0.08 0.24 0.64 0.03 0.64 0.46
2012_USHG_FT 733 MC 15 1 782 0.88 0.02 0.14 0.07 0.08 0.70 0.70 0.60
2012_USHG_FT 733 MC 16 1 782 0.88 0.02 0.19 0.11 0.60 0.08 0.60 0.53
2012_USHG_FT 733 MC 17 1 782 0.88 0.02 0.17 0.62 0.10 0.08 0.62 0.44
2012_USHG_FT 733 MC 18 1 782 0.88 0.02 0.06 0.54 0.06 0.31 0.54 0.43
2012_USHG_FT 733 MC 19 1 782 0.88 0.02 0.79 0.06 0.11 0.02 0.79 0.46
2012_USHG_FT 733 MC 20 1 782 0.88 0.03 0.58 0.04 0.31 0.03 0.58 0.35
2012_USHG_FT 733 MC 21 1 782 0.88 0.04 0.68 0.12 0.05 0.10 0.68 0.39
2012_USHG_FT 733 MC 22 1 782 0.88 0.04 0.49 0.11 0.11 0.25 0.49 0.37
2012_USHG_FT 733 MC 23 1 782 0.88 0.04 0.07 0.58 0.11 0.19 0.58 0.48
2012_USHG_FT 733 MC 24 1 782 0.88 0.04 0.21 0.58 0.10 0.07 0.58 0.40
2012_USHG_FT 733 MC 25 1 782 0.88 0.05 0.10 0.77 0.04 0.04 0.77 0.47
2012_USHG_FT 733 MC 26 1 782 0.88 0.05 0.23 0.07 0.51 0.14 0.51 0.52
2012_USHG_FT 733 MC 27 1 782 0.88 0.06 0.14 0.26 0.51 0.03 0.51 0.50
2012_USHG_FT 733 MC 28 1 782 0.88 0.06 0.69 0.06 0.07 0.11 0.69 0.58
2012_USHG_FT 733 MC 29 1 782 0.88 0.07 0.71 0.10 0.05 0.07 0.71 0.59
2012_USHG_FT 733 MC 30 1 782 0.88 0.08 0.19 0.64 0.06 0.04 0.64 0.50
2012_USHG_FT 733 MC 31 1 782 0.88 0.09 0.55 0.08 0.13 0.15 0.55 0.54
2012_USHG_FT 733 MC 32 1 782 0.88 0.10 0.06 0.23 0.55 0.07 0.55 0.52
2012_USHG_FT 734 MC 01 1 776 0.86 0.01 0.03 0.20 0.70 0.06 0.70 0.23
2012_USHG_FT 734 MC 02 1 776 0.86 0.00 0.54 0.31 0.10 0.04 0.54 0.43

Prepared for NYSED by Pearson 28
Test Form Type Item Max N-Count Alpha B M0 M1 M2 M3 M4 M5 M6 Mean Point- Biserial
2012_USHG_FT 734 MC 03 1 776 0.86 0.00 0.03 0.64 0.06 0.27 0.64 0.21
2012_USHG_FT 734 MC 04 1 776 0.86 0.01 0.17 0.14 0.48 0.20 0.48 0.55
2012_USHG_FT 734 MC 05 1 776 0.86 0.00 0.08 0.14 0.15 0.63 0.63 0.43
2012_USHG_FT 734 MC 06 1 776 0.86 0.00 0.03 0.12 0.80 0.05 0.80 0.48
2012_USHG_FT 734 MC 07 1 776 0.86 0.01 0.09 0.14 0.13 0.63 0.63 0.50
2012_USHG_FT 734 MC 08 1 776 0.86 0.00 0.11 0.06 0.76 0.06 0.76 0.48
2012_USHG_FT 734 MC 09 1 776 0.86 0.00 0.13 0.38 0.06 0.43 0.43 0.46
2012_USHG_FT 734 MC 10 1 776 0.86 0.00 0.54 0.36 0.06 0.04 0.54 0.27
2012_USHG_FT 734 MC 11 1 776 0.86 0.01 0.32 0.44 0.06 0.16 0.44 0.42
2012_USHG_FT 734 MC 12 1 776 0.86 0.01 0.62 0.11 0.14 0.11 0.62 0.27
2012_USHG_FT 734 MC 13 1 776 0.86 0.01 0.08 0.09 0.09 0.73 0.73 0.50
2012_USHG_FT 734 MC 14 1 776 0.86 0.01 0.10 0.09 0.71 0.09 0.71 0.40
2012_USHG_FT 734 MC 15 1 776 0.86 0.01 0.07 0.69 0.17 0.06 0.69 0.49
2012_USHG_FT 734 MC 16 1 776 0.86 0.02 0.32 0.06 0.14 0.47 0.47 0.52
2012_USHG_FT 734 MC 17 1 776 0.86 0.02 0.17 0.60 0.14 0.06 0.60 0.44
2012_USHG_FT 734 MC 18 1 776 0.86 0.02 0.22 0.15 0.09 0.52 0.52 0.48
2012_USHG_FT 734 MC 19 1 776 0.86 0.03 0.15 0.09 0.42 0.31 0.42 0.29
2012_USHG_FT 734 MC 20 1 776 0.86 0.04 0.64 0.19 0.10 0.03 0.64 0.58
2012_USHG_FT 734 MC 21 1 776 0.86 0.03 0.64 0.15 0.07 0.11 0.64 0.57
2012_USHG_FT 734 MC 22 1 776 0.86 0.04 0.42 0.26 0.05 0.23 0.26 0.20
2012_USHG_FT 734 MC 23 1 776 0.86 0.04 0.55 0.15 0.20 0.07 0.55 0.52
2012_USHG_FT 734 MC 24 1 776 0.86 0.04 0.27 0.22 0.40 0.06 0.40 0.43
2012_USHG_FT 734 MC 25 1 776 0.86 0.04 0.32 0.14 0.30 0.20 0.30 0.29
2012_USHG_FT 734 MC 26 1 776 0.86 0.04 0.09 0.07 0.77 0.03 0.77 0.53

Prepared for NYSED by Pearson 29
Test Form Type Item Max N-Count Alpha B M0 M1 M2 M3 M4 M5 M6 Mean Point- Biserial
2012_USHG_FT 734 MC 27 1 776 0.86 0.05 0.14 0.10 0.59 0.12 0.59 0.35
2012_USHG_FT 734 MC 28 1 776 0.86 0.05 0.80 0.04 0.06 0.05 0.80 0.48
2012_USHG_FT 734 MC 29 1 776 0.86 0.06 0.64 0.13 0.09 0.08 0.64 0.49
2012_USHG_FT 734 MC 30 1 776 0.86 0.06 0.19 0.08 0.05 0.62 0.62 0.51
2012_USHG_FT 734 MC 31 1 776 0.86 0.07 0.13 0.60 0.10 0.11 0.60 0.54
2012_USHG_FT 734 MC 32 1 776 0.86 0.07 0.08 0.65 0.04 0.16 0.65 0.54
2012_USHG_FT 735 MC 01 1 775 0.86 0.01 0.15 0.64 0.10 0.11 0.64 0.39
2012_USHG_FT 735 MC 02 1 775 0.86 0.01 0.14 0.68 0.12 0.05 0.68 0.25
2012_USHG_FT 735 MC 03 1 775 0.86 0.01 0.85 0.03 0.05 0.07 0.85 0.47
2012_USHG_FT 735 MC 04 1 775 0.86 0.01 0.76 0.04 0.12 0.08 0.76 0.51
2012_USHG_FT 735 MC 05 1 775 0.86 0.01 0.22 0.21 0.12 0.45 0.45 0.11
2012_USHG_FT 735 MC 06 1 775 0.86 0.01 0.02 0.68 0.20 0.09 0.68 0.51
2012_USHG_FT 735 MC 07 1 775 0.86 0.01 0.04 0.48 0.30 0.17 0.48 0.47
2012_USHG_FT 735 MC 08 1 775 0.86 0.02 0.47 0.18 0.11 0.21 0.47 0.41
2012_USHG_FT 735 MC 09 1 775 0.86 0.01 0.15 0.08 0.70 0.06 0.70 0.49
2012_USHG_FT 735 MC 10 1 775 0.86 0.02 0.11 0.10 0.60 0.17 0.60 0.55
2012_USHG_FT 735 MC 11 1 775 0.86 0.01 0.15 0.07 0.62 0.15 0.62 0.41
2012_USHG_FT 735 MC 12 1 775 0.86 0.01 0.69 0.11 0.13 0.06 0.69 0.38
2012_USHG_FT 735 MC 13 1 775 0.86 0.01 0.07 0.85 0.04 0.04 0.85 0.39
2012_USHG_FT 735 MC 14 1 775 0.86 0.02 0.11 0.04 0.09 0.75 0.75 0.57
2012_USHG_FT 735 MC 15 1 775 0.86 0.02 0.56 0.09 0.03 0.30 0.56 0.32
2012_USHG_FT 735 MC 16 1 775 0.86 0.02 0.70 0.09 0.08 0.11 0.70 0.54
2012_USHG_FT 735 MC 17 1 775 0.86 0.01 0.10 0.72 0.10 0.06 0.72 0.39
2012_USHG_FT 735 MC 18 1 775 0.86 0.02 0.29 0.06 0.61 0.03 0.61 0.20

Prepared for NYSED by Pearson 30
Test Form Type Item Max N-Count Alpha B M0 M1 M2 M3 M4 M5 M6 Mean Point- Biserial
2012_USHG_FT 735 MC 19 1 775 0.86 0.02 0.79 0.10 0.04 0.04 0.79 0.62
2012_USHG_FT 735 MC 20 1 775 0.86 0.02 0.13 0.62 0.17 0.06 0.62 0.47
2012_USHG_FT 735 MC 21 1 775 0.86 0.03 0.17 0.09 0.19 0.53 0.53 0.52
2012_USHG_FT 735 MC 22 1 775 0.86 0.03 0.04 0.21 0.06 0.67 0.67 0.50
2012_USHG_FT 735 MC 23 1 775 0.86 0.03 0.11 0.09 0.64 0.12 0.64 0.53
2012_USHG_FT 735 MC 24 1 775 0.86 0.04 0.47 0.20 0.12 0.17 0.47 0.40
2012_USHG_FT 735 MC 25 1 775 0.86 0.04 0.15 0.54 0.20 0.07 0.54 0.30
2012_USHG_FT 735 MC 26 1 775 0.86 0.05 0.03 0.27 0.17 0.47 0.47 0.50
2012_USHG_FT 735 MC 27 1 775 0.86 0.05 0.06 0.06 0.07 0.75 0.75 0.57
2012_USHG_FT 735 MC 28 1 775 0.86 0.05 0.12 0.17 0.60 0.05 0.60 0.43
2012_USHG_FT 735 MC 29 1 775 0.86 0.07 0.54 0.19 0.13 0.07 0.54 0.49
2012_USHG_FT 735 MC 30 1 775 0.86 0.06 0.09 0.24 0.57 0.05 0.57 0.45
2012_USHG_FT 735 MC 31 1 775 0.86 0.09 0.10 0.63 0.09 0.09 0.63 0.51
2012_USHG_FT 735 MC 32 1 775 0.86 0.09 0.23 0.49 0.13 0.07 0.49 0.38
2012_USHG_FT 736 MC 01 1 792 0.87 0.00 0.12 0.83 0.03 0.02 0.83 0.42
2012_USHG_FT 736 MC 02 1 792 0.87 0.01 0.53 0.13 0.14 0.20 0.53 0.34
2012_USHG_FT 736 MC 03 1 792 0.87 0.01 0.86 0.06 0.06 0.02 0.86 0.27
2012_USHG_FT 736 MC 04 1 792 0.87 0.01 0.05 0.73 0.04 0.18 0.73 0.52
2012_USHG_FT 736 MC 05 1 792 0.87 0.00 0.07 0.80 0.06 0.06 0.80 0.45
2012_USHG_FT 736 MC 06 1 792 0.87 0.01 0.31 0.05 0.18 0.45 0.45 0.37
2012_USHG_FT 736 MC 07 1 792 0.87 0.01 0.05 0.07 0.78 0.10 0.78 0.38
2012_USHG_FT 736 MC 08 1 792 0.87 0.00 0.09 0.06 0.04 0.81 0.81 0.37
2012_USHG_FT 736 MC 09 1 792 0.87 0.01 0.17 0.13 0.16 0.54 0.54 0.40
2012_USHG_FT 736 MC 10 1 792 0.87 0.00 0.04 0.65 0.08 0.22 0.65 0.33

Prepared for NYSED by Pearson 31
Test Form Type Item Max N-Count Alpha B M0 M1 M2 M3 M4 M5 M6 Mean Point- Biserial
2012_USHG_FT 736 MC 11 1 792 0.87 0.01 0.10 0.50 0.32 0.08 0.50 0.34
2012_USHG_FT 736 MC 12 1 792 0.87 0.00 0.80 0.06 0.12 0.02 0.80 0.40
2012_USHG_FT 736 MC 13 1 792 0.87 0.01 0.63 0.10 0.10 0.15 0.63 0.42
2012_USHG_FT 736 MC 14 1 792 0.87 0.01 0.11 0.76 0.03 0.08 0.76 0.47
2012_USHG_FT 736 MC 15 1 792 0.87 0.01 0.21 0.21 0.46 0.10 0.21 0.28
2012_USHG_FT 736 MC 16 1 792 0.87 0.02 0.38 0.19 0.13 0.28 0.38 0.29
2012_USHG_FT 736 MC 17 1 792 0.87 0.02 0.09 0.09 0.67 0.13 0.67 0.53
2012_USHG_FT 736 MC 18 1 792 0.87 0.02 0.14 0.10 0.51 0.23 0.51 0.29
2012_USHG_FT 736 MC 19 1 792 0.87 0.02 0.16 0.05 0.06 0.70 0.70 0.53
2012_USHG_FT 736 MC 20 1 792 0.87 0.03 0.22 0.18 0.08 0.49 0.49 0.54
2012_USHG_FT 736 MC 21 1 792 0.87 0.03 0.23 0.54 0.13 0.07 0.54 0.55
2012_USHG_FT 736 MC 22 1 792 0.87 0.04 0.18 0.63 0.11 0.04 0.63 0.51
2012_USHG_FT 736 MC 23 1 792 0.87 0.04 0.32 0.08 0.13 0.43 0.43 0.54
2012_USHG_FT 736 MC 24 1 792 0.87 0.04 0.17 0.66 0.10 0.03 0.66 0.46
2012_USHG_FT 736 MC 25 1 792 0.87 0.04 0.10 0.57 0.20 0.09 0.57 0.46
2012_USHG_FT 736 MC 26 1 792 0.87 0.05 0.42 0.12 0.15 0.25 0.42 0.40
2012_USHG_FT 736 MC 27 1 792 0.87 0.05 0.09 0.27 0.06 0.54 0.54 0.55
2012_USHG_FT 736 MC 28 1 792 0.87 0.05 0.07 0.07 0.07 0.74 0.74 0.60
2012_USHG_FT 736 MC 29 1 792 0.87 0.05 0.08 0.05 0.12 0.70 0.70 0.60
2012_USHG_FT 736 MC 30 1 792 0.87 0.08 0.54 0.21 0.12 0.05 0.54 0.51
2012_USHG_FT 736 MC 31 1 792 0.87 0.06 0.17 0.04 0.05 0.68 0.68 0.51
2012_USHG_FT 736 MC 32 1 792 0.87 0.07 0.09 0.66 0.09 0.09 0.66 0.52
2012_USHG_FT 737 MC 01 1 778 0.88 0.01 0.07 0.46 0.22 0.25 0.46 0.26
2012_USHG_FT 737 MC 02 1 778 0.88 0.01 0.20 0.54 0.09 0.17 0.54 0.37

Prepared for NYSED by Pearson 32
Test Form Type Item Max N-Count Alpha B M0 M1 M2 M3 M4 M5 M6 Mean Point- Biserial
2012_USHG_FT 737 MC 03 1 778 0.88 0.01 0.66 0.07 0.06 0.20 0.66 0.48
2012_USHG_FT 737 MC 04 1 778 0.88 0.01 0.17 0.53 0.20 0.09 0.53 0.47
2012_USHG_FT 737 MC 05 1 778 0.88 0.00 0.68 0.16 0.06 0.09 0.68 0.48
2012_USHG_FT 737 MC 06 1 778 0.88 0.01 0.37 0.12 0.04 0.47 0.47 0.41
2012_USHG_FT 737 MC 07 1 778 0.88 0.01 0.04 0.03 0.75 0.18 0.75 0.33
2012_USHG_FT 737 MC 08 1 778 0.88 0.01 0.09 0.05 0.84 0.02 0.84 0.43
2012_USHG_FT 737 MC 09 1 778 0.88 0.01 0.15 0.07 0.73 0.04 0.73 0.41
2012_USHG_FT 737 MC 10 1 778 0.88 0.01 0.08 0.77 0.06 0.07 0.77 0.56
2012_USHG_FT 737 MC 11 1 778 0.88 0.01 0.12 0.08 0.66 0.12 0.66 0.38
2012_USHG_FT 737 MC 12 1 778 0.88 0.01 0.19 0.17 0.16 0.47 0.47 0.55
2012_USHG_FT 737 MC 13 1 778 0.88 0.02 0.60 0.08 0.16 0.15 0.60 0.59
2012_USHG_FT 737 MC 14 1 778 0.88 0.02 0.25 0.48 0.04 0.21 0.48 0.44
2012_USHG_FT 737 MC 15 1 778 0.88 0.02 0.04 0.05 0.14 0.76 0.76 0.51
2012_USHG_FT 737 MC 16 1 778 0.88 0.02 0.06 0.07 0.75 0.10 0.75 0.54
2012_USHG_FT 737 MC 17 1 778 0.88 0.02 0.17 0.43 0.25 0.13 0.43 0.44
2012_USHG_FT 737 MC 18 1 778 0.88 0.02 0.11 0.19 0.52 0.16 0.52 0.51
2012_USHG_FT 737 MC 19 1 778 0.88 0.02 0.20 0.50 0.16 0.12 0.50 0.44
2012_USHG_FT 737 MC 20 1 778 0.88 0.02 0.76 0.06 0.07 0.09 0.76 0.48
2012_USHG_FT 737 MC 21 1 778 0.88 0.03 0.12 0.17 0.19 0.49 0.49 0.45
2012_USHG_FT 737 MC 22 1 778 0.88 0.03 0.03 0.78 0.08 0.08 0.78 0.47
2012_USHG_FT 737 MC 23 1 778 0.88 0.04 0.11 0.63 0.13 0.09 0.63 0.56
2012_USHG_FT 737 MC 24 1 778 0.88 0.04 0.63 0.11 0.10 0.12 0.63 0.39
2012_USHG_FT 737 MC 25 1 778 0.88 0.04 0.08 0.11 0.67 0.11 0.67 0.48
2012_USHG_FT 737 MC 26 1 778 0.88 0.04 0.08 0.61 0.16 0.11 0.61 0.55

Prepared for NYSED by Pearson 33
Test Form Type Item Max N-Count Alpha B M0 M1 M2 M3 M4 M5 M6 Mean Point- Biserial
2012_USHG_FT 737 MC 27 1 778 0.88 0.05 0.09 0.12 0.56 0.19 0.56 0.46
2012_USHG_FT 737 MC 28 1 778 0.88 0.04 0.06 0.73 0.09 0.07 0.73 0.46
2012_USHG_FT 737 MC 29 1 778 0.88 0.05 0.05 0.60 0.20 0.11 0.60 0.41
2012_USHG_FT 737 MC 30 1 778 0.88 0.06 0.08 0.12 0.56 0.18 0.56 0.47
2012_USHG_FT 737 MC 31 1 778 0.88 0.06 0.37 0.13 0.14 0.29 0.29 0.41
2012_USHG_FT 737 MC 32 1 778 0.88 0.06 0.12 0.54 0.16 0.11 0.54 0.47
2012_USHG_FT 738 MC 01 1 788 0.88 0.00 0.03 0.73 0.16 0.07 0.73 0.41
2012_USHG_FT 738 MC 02 1 788 0.88 0.01 0.19 0.14 0.55 0.11 0.55 0.31
2012_USHG_FT 738 MC 03 1 788 0.88 0.01 0.02 0.09 0.83 0.05 0.83 0.36
2012_USHG_FT 738 MC 04 1 788 0.88 0.00 0.07 0.65 0.11 0.16 0.65 0.33
2012_USHG_FT 738 MC 05 1 788 0.88 0.00 0.69 0.20 0.06 0.06 0.69 0.31
2012_USHG_FT 738 MC 06 1 788 0.88 0.01 0.09 0.05 0.18 0.67 0.67 0.48
2012_USHG_FT 738 MC 07 1 788 0.88 0.01 0.13 0.08 0.23 0.55 0.55 0.53
2012_USHG_FT 738 MC 08 1 788 0.88 0.01 0.47 0.11 0.08 0.32 0.47 0.36
2012_USHG_FT 738 MC 09 1 788 0.88 0.01 0.11 0.07 0.08 0.73 0.73 0.43
2012_USHG_FT 738 MC 10 1 788 0.88 0.02 0.09 0.25 0.22 0.42 0.42 0.39
2012_USHG_FT 738 MC 11 1 788 0.88 0.02 0.13 0.17 0.22 0.45 0.45 0.43
2012_USHG_FT 738 MC 12 1 788 0.88 0.02 0.77 0.07 0.07 0.07 0.77 0.48
2012_USHG_FT 738 MC 13 1 788 0.88 0.03 0.25 0.48 0.16 0.09 0.48 0.37
2012_USHG_FT 738 MC 14 1 788 0.88 0.02 0.21 0.15 0.47 0.15 0.47 0.42
2012_USHG_FT 738 MC 15 1 788 0.88 0.02 0.09 0.61 0.15 0.12 0.61 0.42
2012_USHG_FT 738 MC 16 1 788 0.88 0.02 0.69 0.11 0.10 0.09 0.69 0.47
2012_USHG_FT 738 MC 17 1 788 0.88 0.02 0.78 0.04 0.06 0.09 0.78 0.54
2012_USHG_FT 738 MC 18 1 788 0.88 0.02 0.07 0.80 0.05 0.06 0.80 0.53
Prepared for NYSED by Pearson 34
Test Form Type Item Max N-Count Alpha B M0 M1 M2 M3 M4 M5 M6 Mean Point- Biserial
2012_USHG_FT 738 MC 19 1 788 0.88 0.02 0.12 0.08 0.65 0.13 0.65 0.57
2012_USHG_FT 738 MC 20 1 788 0.88 0.02 0.08 0.09 0.78 0.03 0.78 0.52
2012_USHG_FT 738 MC 21 1 788 0.88 0.03 0.06 0.13 0.08 0.71 0.71 0.61
2012_USHG_FT 738 MC 22 1 788 0.88 0.03 0.05 0.31 0.51 0.10 0.51 0.51
2012_USHG_FT 738 MC 23 1 788 0.88 0.03 0.69 0.05 0.10 0.13 0.69 0.60
2012_USHG_FT 738 MC 24 1 788 0.88 0.05 0.45 0.10 0.19 0.22 0.45 0.35
2012_USHG_FT 738 MC 25 1 788 0.88 0.04 0.74 0.11 0.07 0.05 0.74 0.59
2012_USHG_FT 738 MC 26 1 788 0.88 0.06 0.12 0.09 0.60 0.14 0.60 0.57
2012_USHG_FT 738 MC 27 1 788 0.88 0.05 0.10 0.13 0.06 0.66 0.66 0.55
2012_USHG_FT 738 MC 28 1 788 0.88 0.06 0.08 0.09 0.66 0.12 0.66 0.57
2012_USHG_FT 738 MC 29 1 788 0.88 0.05 0.17 0.54 0.17 0.07 0.54 0.47
2012_USHG_FT 738 MC 30 1 788 0.88 0.07 0.09 0.25 0.44 0.16 0.44 0.41
2012_USHG_FT 738 MC 31 1 788 0.88 0.05 0.28 0.08 0.55 0.04 0.55 0.43
2012_USHG_FT 738 MC 32 1 788 0.88 0.06 0.15 0.12 0.58 0.09 0.58 0.49
2012_USHG_FT 739 MC 01 1 777 0.86 0.01 0.11 0.07 0.75 0.06 0.75 0.44
2012_USHG_FT 739 MC 02 1 777 0.86 0.00 0.07 0.37 0.53 0.03 0.53 0.31
2012_USHG_FT 739 MC 03 1 777 0.86 0.01 0.10 0.58 0.21 0.10 0.58 0.30
2012_USHG_FT 739 MC 04 1 777 0.86 0.01 0.49 0.15 0.28 0.08 0.49 0.42
2012_USHG_FT 739 MC 05 1 777 0.86 0.01 0.17 0.11 0.33 0.38 0.38 0.16
2012_USHG_FT 739 MC 06 1 777 0.86 0.01 0.07 0.16 0.60 0.17 0.60 0.49
2012_USHG_FT 739 MC 07 1 777 0.86 0.01 0.25 0.12 0.55 0.08 0.55 0.46
2012_USHG_FT 739 MC 08 1 777 0.86 0.00 0.18 0.04 0.71 0.07 0.71 0.49
2012_USHG_FT 739 MC 09 1 777 0.86 0.00 0.27 0.66 0.01 0.05 0.66 0.36
2012_USHG_FT 739 MC 10 1 777 0.86 0.01 0.09 0.09 0.68 0.13 0.68 0.50

Prepared for NYSED by Pearson 35
Test Form Type Item Max N-Count Alpha B M0 M1 M2 M3 M4 M5 M6 Mean Point- Biserial
2012_USHG_FT 739 MC 11 1 777 0.86 0.01 0.08 0.21 0.10 0.60 0.60 0.43
2012_USHG_FT 739 MC 12 1 777 0.86 0.00 0.04 0.77 0.05 0.13 0.77 0.45
2012_USHG_FT 739 MC 13 1 777 0.86 0.01 0.13 0.11 0.69 0.07 0.69 0.52
2012_USHG_FT 739 MC 14 1 777 0.86 0.00 0.03 0.86 0.04 0.06 0.86 0.42
2012_USHG_FT 739 MC 15 1 777 0.86 0.01 0.15 0.58 0.14 0.12 0.58 0.50
2012_USHG_FT 739 MC 16 1 777 0.86 0.01 0.69 0.06 0.13 0.13 0.69 0.55
2012_USHG_FT 739 MC 17 1 777 0.86 0.01 0.08 0.11 0.76 0.03 0.76 0.49
2012_USHG_FT 739 MC 18 1 777 0.86 0.02 0.55 0.07 0.08 0.29 0.55 0.47
2012_USHG_FT 739 MC 19 1 777 0.86 0.01 0.24 0.08 0.60 0.07 0.60 0.45
2012_USHG_FT 739 MC 20 1 777 0.86 0.01 0.15 0.09 0.52 0.23 0.52 0.47
2012_USHG_FT 739 MC 21 1 777 0.86 0.02 0.08 0.08 0.72 0.09 0.72 0.44
2012_USHG_FT 739 MC 22 1 777 0.86 0.03 0.13 0.71 0.09 0.05 0.71 0.58
2012_USHG_FT 739 MC 23 1 777 0.86 0.03 0.17 0.21 0.35 0.23 0.21 0.13
2012_USHG_FT 739 MC 24 1 777 0.86 0.04 0.09 0.17 0.51 0.19 0.51 0.38
2012_USHG_FT 739 MC 25 1 777 0.86 0.04 0.09 0.64 0.10 0.14 0.64 0.43
2012_USHG_FT 739 MC 26 1 777 0.86 0.05 0.66 0.12 0.11 0.06 0.66 0.51
2012_USHG_FT 739 MC 27 1 777 0.86 0.05 0.23 0.11 0.10 0.52 0.52 0.45
2012_USHG_FT 739 MC 28 1 777 0.86 0.05 0.26 0.17 0.08 0.42 0.42 0.53
2012_USHG_FT 739 MC 29 1 777 0.86 0.05 0.06 0.05 0.73 0.10 0.73 0.51
2012_USHG_FT 739 MC 30 1 777 0.86 0.06 0.07 0.61 0.23 0.05 0.61 0.41
2012_USHG_FT 739 MC 31 1 777 0.86 0.06 0.19 0.32 0.33 0.10 0.32 0.28
2012_USHG_FT 739 MC 32 1 777 0.86 0.06 0.19 0.17 0.54 0.04 0.54 0.52
2012_USHG_FT 740 MC 01 1 793 0.84 0.01 0.24 0.25 0.33 0.17 0.33 0.31
2012_USHG_FT 740 MC 02 1 793 0.84 0.01 0.07 0.51 0.04 0.37 0.51 0.24

Prepared for NYSED by Pearson 36
Test Form Type Item Max N-Count Alpha B M0 M1 M2 M3 M4 M5 M6 Mean Point- Biserial
2012_USHG_FT 740 MC 03 1 793 0.84 0.01 0.17 0.47 0.05 0.29 0.47 0.39
2012_USHG_FT 740 MC 04 1 793 0.84 0.01 0.09 0.41 0.24 0.25 0.25 0.38
2012_USHG_FT 740 MC 05 1 793 0.84 0.01 0.55 0.08 0.22 0.13 0.55 0.54
2012_USHG_FT 740 MC 06 1 793 0.84 0.01 0.07 0.48 0.27 0.18 0.48 0.17
2012_USHG_FT 740 MC 07 1 793 0.84 0.00 0.13 0.72 0.08 0.06 0.72 0.30
2012_USHG_FT 740 MC 08 1 793 0.84 0.01 0.24 0.28 0.31 0.16 0.28 0.27
2012_USHG_FT 740 MC 09 1 793 0.84 0.01 0.25 0.24 0.27 0.23 0.23 0.30
2012_USHG_FT 740 MC 10 1 793 0.84 0.00 0.81 0.08 0.05 0.06 0.81 0.43
2012_USHG_FT 740 MC 11 1 793 0.84 0.00 0.30 0.52 0.04 0.14 0.52 0.40
2012_USHG_FT 740 MC 12 1 793 0.84 0.01 0.12 0.09 0.11 0.68 0.68 0.53
2012_USHG_FT 740 MC 13 1 793 0.84 0.01 0.07 0.65 0.19 0.08 0.65 0.38
2012_USHG_FT 740 MC 14 1 793 0.84 0.01 0.18 0.07 0.12 0.63 0.63 0.39
2012_USHG_FT 740 MC 15 1 793 0.84 0.01 0.52 0.20 0.06 0.21 0.52 0.42
2012_USHG_FT 740 MC 16 1 793 0.84 0.00 0.07 0.84 0.06 0.03 0.84 0.45
2012_USHG_FT 740 MC 17 1 793 0.84 0.01 0.10 0.09 0.10 0.70 0.70 0.38
2012_USHG_FT 740 MC 18 1 793 0.84 0.01 0.15 0.08 0.65 0.11 0.65 0.52
2012_USHG_FT 740 MC 19 1 793 0.84 0.01 0.27 0.08 0.59 0.04 0.59 0.36
2012_USHG_FT 740 MC 20 1 793 0.84 0.01 0.19 0.57 0.12 0.11 0.57 0.39
2012_USHG_FT 740 MC 21 1 793 0.84 0.01 0.65 0.16 0.16 0.03 0.65 0.50
2012_USHG_FT 740 MC 22 1 793 0.84 0.01 0.13 0.70 0.13 0.03 0.70 0.46
2012_USHG_FT 740 MC 23 1 793 0.84 0.02 0.06 0.11 0.64 0.16 0.64 0.51
2012_USHG_FT 740 MC 24 1 793 0.84 0.03 0.17 0.08 0.19 0.52 0.52 0.50
2012_USHG_FT 740 MC 25 1 793 0.84 0.02 0.17 0.63 0.14 0.04 0.63 0.44
2012_USHG_FT 740 MC 26 1 793 0.84 0.04 0.13 0.19 0.39 0.25 0.39 0.27

Prepared for NYSED by Pearson 37
Test Form Type Item Max N-Count Alpha B M0 M1 M2 M3 M4 M5 M6 Mean Point- Biserial
2012_USHG_FT 740 MC 27 1 793 0.84 0.03 0.29 0.44 0.11 0.12 0.44 0.44
2012_USHG_FT 740 MC 28 1 793 0.84 0.04 0.15 0.12 0.14 0.55 0.55 0.49
2012_USHG_FT 740 MC 29 1 793 0.84 0.03 0.08 0.07 0.03 0.79 0.79 0.51
2012_USHG_FT 740 MC 30 1 793 0.84 0.04 0.62 0.19 0.10 0.05 0.62 0.52
2012_USHG_FT 740 MC 31 1 793 0.84 0.04 0.69 0.10 0.10 0.08 0.69 0.46
2012_USHG_FT 740 MC 32 1 793 0.84 0.05 0.13 0.14 0.65 0.03 0.65 0.48
2012_USHG_FT 741 MC 01 1 789 0.86 0.01 0.51 0.09 0.09 0.31 0.51 0.20
2012_USHG_FT 741 MC 02 1 789 0.86 0.00 0.07 0.11 0.70 0.12 0.70 0.51
2012_USHG_FT 741 MC 03 1 789 0.86 0.01 0.21 0.18 0.08 0.52 0.52 0.56
2012_USHG_FT 741 MC 04 1 789 0.86 0.00 0.03 0.52 0.20 0.24 0.52 0.24
2012_USHG_FT 741 MC 05 1 789 0.86 0.01 0.24 0.14 0.11 0.50 0.50 0.54
2012_USHG_FT 741 MC 06 1 789 0.86 0.01 0.85 0.04 0.07 0.03 0.85 0.46
2012_USHG_FT 741 MC 07 1 789 0.86 0.00 0.24 0.03 0.60 0.13 0.60 0.35
2012_USHG_FT 741 MC 08 1 789 0.86 0.00 0.47 0.10 0.36 0.07 0.47 0.49
2012_USHG_FT 741 MC 09 1 789 0.86 0.01 0.70 0.06 0.06 0.16 0.70 0.41
2012_USHG_FT 741 MC 10 1 789 0.86 0.01 0.50 0.27 0.18 0.04 0.50 0.43
2012_USHG_FT 741 MC 11 1 789 0.86 0.01 0.11 0.70 0.10 0.08 0.70 0.39
2012_USHG_FT 741 MC 12 1 789 0.86 0.00 0.16 0.04 0.76 0.04 0.76 0.56
2012_USHG_FT 741 MC 13 1 789 0.86 0.01 0.04 0.89 0.04 0.03 0.89 0.48
2012_USHG_FT 741 MC 14 1 789 0.86 0.01 0.05 0.13 0.59 0.22 0.59 0.39
2012_USHG_FT 741 MC 15 1 789 0.86 0.01 0.13 0.16 0.57 0.13 0.57 0.45
2012_USHG_FT 741 MC 16 1 789 0.86 0.01 0.06 0.79 0.04 0.10 0.79 0.55
2012_USHG_FT 741 MC 17 1 789 0.86 0.01 0.07 0.08 0.04 0.80 0.80 0.51
2012_USHG_FT 741 MC 18 1 789 0.86 0.01 0.46 0.22 0.16 0.14 0.22 0.30

Prepared for NYSED by Pearson 38
Test Form Type Item Max N-Count Alpha B M0 M1 M2 M3 M4 M5 M6 Mean Point- Biserial
2012_USHG_FT 741 MC 19 1 789 0.86 0.02 0.08 0.07 0.80 0.03 0.80 0.55
2012_USHG_FT 741 MC 20 1 789 0.86 0.02 0.12 0.11 0.05 0.70 0.70 0.51
2012_USHG_FT 741 MC 21 1 789 0.86 0.03 0.34 0.19 0.29 0.15 0.34 0.24
2012_USHG_FT 741 MC 22 1 789 0.86 0.04 0.08 0.14 0.65 0.09 0.65 0.60
2012_USHG_FT 741 MC 23 1 789 0.86 0.04 0.34 0.10 0.34 0.18 0.34 0.28
2012_USHG_FT 741 MC 24 1 789 0.86 0.04 0.13 0.10 0.61 0.11 0.61 0.47
2012_USHG_FT 741 MC 25 1 789 0.86 0.04 0.33 0.11 0.40 0.12 0.40 0.42
2012_USHG_FT 741 MC 26 1 789 0.86 0.04 0.48 0.17 0.14 0.16 0.48 0.55
2012_USHG_FT 741 MC 27 1 789 0.86 0.05 0.43 0.30 0.09 0.13 0.30 0.06
2012_USHG_FT 741 MC 28 1 789 0.86 0.06 0.10 0.09 0.66 0.09 0.66 0.65
2012_USHG_FT 741 MC 29 1 789 0.86 0.06 0.12 0.22 0.06 0.55 0.55 0.45
2012_USHG_FT 741 MC 30 1 789 0.86 0.06 0.11 0.06 0.38 0.38 0.38 0.26
2012_USHG_FT 741 MC 31 1 789 0.86 0.07 0.11 0.11 0.09 0.63 0.63 0.59
2012_USHG_FT 741 MC 32 1 789 0.86 0.07 0.19 0.11 0.56 0.06 0.56 0.51
2012_USHG_FT 742 MC 01 1 792 0.85 0.00 0.04 0.04 0.90 0.02 0.90 0.35
2012_USHG_FT 742 MC 02 1 792 0.85 0.00 0.24 0.49 0.13 0.14 0.49 0.35
2012_USHG_FT 742 MC 03 1 792 0.85 0.01 0.63 0.27 0.07 0.02 0.63 0.41
2012_USHG_FT 742 MC 04 1 792 0.85 0.00 0.06 0.07 0.17 0.70 0.70 0.50
2012_USHG_FT 742 MC 05 1 792 0.85 0.01 0.27 0.21 0.14 0.38 0.38 0.42
2012_USHG_FT 742 MC 06 1 792 0.85 0.01 0.50 0.14 0.06 0.30 0.50 0.38
2012_USHG_FT 742 MC 07 1 792 0.85 0.00 0.04 0.06 0.82 0.08 0.82 0.41
2012_USHG_FT 742 MC 08 1 792 0.85 0.00 0.03 0.87 0.07 0.03 0.87 0.46
2012_USHG_FT 742 MC 09 1 792 0.85 0.00 0.04 0.10 0.83 0.03 0.83 0.40
2012_USHG_FT 742 MC 10 1 792 0.85 0.02 0.36 0.16 0.22 0.25 0.22 0.17

Prepared for NYSED by Pearson 39
Test Form Type Item Max N-Count Alpha B M0 M1 M2 M3 M4 M5 M6 Mean Point- Biserial
2012_USHG_FT 742 MC 11 1 792 0.85 0.01 0.18 0.30 0.21 0.29 0.30 0.20
2012_USHG_FT 742 MC 12 1 792 0.85 0.01 0.57 0.18 0.12 0.12 0.57 0.50
2012_USHG_FT 742 MC 13 1 792 0.85 0.01 0.72 0.09 0.09 0.08 0.72 0.44
2012_USHG_FT 742 MC 14 1 792 0.85 0.01 0.06 0.10 0.78 0.04 0.78 0.53
2012_USHG_FT 742 MC 15 1 792 0.85 0.01 0.18 0.27 0.43 0.12 0.43 0.47
2012_USHG_FT 742 MC 16 1 792 0.85 0.01 0.61 0.24 0.09 0.04 0.61 0.50
2012_USHG_FT 742 MC 17 1 792 0.85 0.02 0.04 0.04 0.88 0.03 0.88 0.53
2012_USHG_FT 742 MC 18 1 792 0.85 0.02 0.10 0.19 0.17 0.52 0.52 0.31
2012_USHG_FT 742 MC 19 1 792 0.85 0.02 0.62 0.12 0.16 0.08 0.62 0.51
2012_USHG_FT 742 MC 20 1 792 0.85 0.03 0.54 0.19 0.07 0.17 0.54 0.43
2012_USHG_FT 742 MC 21 1 792 0.85 0.03 0.14 0.11 0.14 0.58 0.58 0.52
2012_USHG_FT 742 MC 22 1 792 0.85 0.03 0.10 0.11 0.11 0.65 0.65 0.43
2012_USHG_FT 742 MC 23 1 792 0.85 0.04 0.14 0.53 0.13 0.16 0.53 0.38
2012_USHG_FT 742 MC 24 1 792 0.85 0.04 0.49 0.13 0.16 0.18 0.49 0.22
2012_USHG_FT 742 MC 25 1 792 0.85 0.04 0.15 0.49 0.24 0.08 0.49 0.41
2012_USHG_FT 742 MC 26 1 792 0.85 0.04 0.15 0.09 0.67 0.05 0.67 0.52
2012_USHG_FT 742 MC 27 1 792 0.85 0.05 0.49 0.16 0.23 0.07 0.49 0.41
2012_USHG_FT 742 MC 28 1 792 0.85 0.06 0.16 0.14 0.45 0.18 0.45 0.39
2012_USHG_FT 742 MC 29 1 792 0.85 0.07 0.14 0.54 0.15 0.11 0.54 0.46
2012_USHG_FT 742 MC 30 1 792 0.85 0.08 0.18 0.07 0.59 0.08 0.59 0.59
2012_USHG_FT 742 MC 31 1 792 0.85 0.07 0.08 0.08 0.14 0.64 0.64 0.42
2012_USHG_FT 742 MC 32 1 792 0.85 0.08 0.07 0.10 0.71 0.04 0.71 0.58
2012_USHG_FT 743 MC 01 1 781 0.81 0.01 0.60 0.02 0.12 0.25 0.60 0.29
2012_USHG_FT 743 MC 02 1 781 0.81 0.01 0.29 0.48 0.10 0.12 0.48 0.35

Prepared for NYSED by Pearson 40
Test Form Type Item Max N-Count Alpha B M0 M1 M2 M3 M4 M5 M6 Mean Point- Biserial
2012_USHG_FT 743 MC 03 1 781 0.81 0.01 0.67 0.11 0.04 0.18 0.67 0.34
2012_USHG_FT 743 MC 04 1 781 0.81 0.00 0.03 0.55 0.07 0.35 0.55 0.32
2012_USHG_FT 743 MC 05 1 781 0.81 0.02 0.25 0.16 0.13 0.44 0.44 0.30
2012_USHG_FT 743 MC 06 1 781 0.81 0.01 0.25 0.58 0.08 0.08 0.58 0.46
2012_USHG_FT 743 MC 07 1 781 0.81 0.01 0.18 0.13 0.06 0.62 0.62 0.35
2012_USHG_FT 743 MC 08 1 781 0.81 0.01 0.18 0.24 0.06 0.52 0.24 0.11
2012_USHG_FT 743 MC 09 1 781 0.81 0.01 0.47 0.07 0.35 0.10 0.47 0.32
2012_USHG_FT 743 MC 10 1 781 0.81 0.03 0.53 0.23 0.11 0.11 0.53 0.31
2012_USHG_FT 743 MC 11 1 781 0.81 0.02 0.21 0.10 0.54 0.13 0.54 0.34
2012_USHG_FT 743 MC 12 1 781 0.81 0.01 0.59 0.16 0.17 0.07 0.59 0.45
2012_USHG_FT 743 MC 13 1 781 0.81 0.01 0.22 0.24 0.24 0.30 0.30 0.38
2012_USHG_FT 743 MC 14 1 781 0.81 0.01 0.57 0.06 0.19 0.17 0.57 0.45
2012_USHG_FT 743 MC 15 1 781 0.81 0.02 0.38 0.15 0.18 0.28 0.28 0.34
2012_USHG_FT 743 MC 16 1 781 0.81 0.02 0.16 0.41 0.21 0.20 0.16 0.13
2012_USHG_FT 743 MC 17 1 781 0.81 0.02 0.20 0.60 0.15 0.04 0.60 0.56
2012_USHG_FT 743 MC 18 1 781 0.81 0.02 0.07 0.09 0.61 0.21 0.61 0.43
2012_USHG_FT 743 MC 19 1 781 0.81 0.02 0.52 0.21 0.18 0.07 0.52 0.39
2012_USHG_FT 743 MC 20 1 781 0.81 0.02 0.27 0.52 0.09 0.10 0.52 0.47
2012_USHG_FT 743 MC 21 1 781 0.81 0.02 0.13 0.07 0.71 0.07 0.71 0.41
2012_USHG_FT 743 MC 22 1 781 0.81 0.03 0.06 0.21 0.52 0.19 0.52 0.41
2012_USHG_FT 743 MC 23 1 781 0.81 0.03 0.15 0.22 0.33 0.27 0.27 0.33
2012_USHG_FT 743 MC 24 1 781 0.81 0.04 0.42 0.39 0.07 0.08 0.39 0.35
2012_USHG_FT 743 MC 25 1 781 0.81 0.04 0.19 0.17 0.24 0.36 0.36 0.30
2012_USHG_FT 743 MC 26 1 781 0.81 0.04 0.09 0.59 0.20 0.07 0.59 0.58

Prepared for NYSED by Pearson 41
Test Form Type Item Max N-Count Alpha B M0 M1 M2 M3 M4 M5 M6 Mean Point- Biserial
2012_USHG_FT 743 MC 27 1 781 0.81 0.05 0.81 0.05 0.04 0.04 0.81 0.51
2012_USHG_FT 743 MC 28 1 781 0.81 0.05 0.11 0.62 0.10 0.12 0.62 0.55
2012_USHG_FT 743 MC 29 1 781 0.81 0.05 0.04 0.10 0.73 0.08 0.73 0.51
2012_USHG_FT 743 MC 30 1 781 0.81 0.05 0.62 0.06 0.08 0.19 0.62 0.40
2012_USHG_FT 743 MC 31 1 781 0.81 0.07 0.19 0.12 0.57 0.06 0.57 0.50
2012_USHG_FT 743 MC 32 1 781 0.81 0.08 0.07 0.25 0.46 0.14 0.46 0.33
2012_USHG_FT 744 MC 01 1 770 0.81 0.01 0.33 0.26 0.32 0.08 0.33 0.22
2012_USHG_FT 744 MC 02 1 770 0.81 0.00 0.31 0.11 0.34 0.24 0.24 0.07
2012_USHG_FT 744 MC 03 1 770 0.81 0.01 0.07 0.06 0.74 0.12 0.74 0.42
2012_USHG_FT 744 MC 04 1 770 0.81 0.01 0.12 0.80 0.04 0.03 0.80 0.43
2012_USHG_FT 744 MC 05 1 770 0.81 0.01 0.08 0.78 0.06 0.08 0.78 0.46
2012_USHG_FT 744 MC 06 1 770 0.81 0.00 0.05 0.72 0.13 0.10 0.72 0.29
2012_USHG_FT 744 MC 07 1 770 0.81 0.00 0.31 0.32 0.32 0.05 0.32 0.39
2012_USHG_FT 744 MC 08 1 770 0.81 0.01 0.14 0.11 0.56 0.19 0.56 0.37
2012_USHG_FT 744 MC 09 1 770 0.81 0.01 0.06 0.08 0.70 0.16 0.70 0.43
2012_USHG_FT 744 MC 10 1 770 0.81 0.03 0.21 0.10 0.48 0.19 0.48 0.26
2012_USHG_FT 744 MC 11 1 770 0.81 0.02 0.35 0.08 0.18 0.37 0.37 0.45
2012_USHG_FT 744 MC 12 1 770 0.81 0.01 0.10 0.19 0.59 0.11 0.59 0.40
2012_USHG_FT 744 MC 13 1 770 0.81 0.01 0.19 0.08 0.53 0.19 0.19 0.38
2012_USHG_FT 744 MC 14 1 770 0.81 0.01 0.29 0.18 0.43 0.09 0.43 0.43
2012_USHG_FT 744 MC 15 1 770 0.81 0.01 0.59 0.15 0.10 0.15 0.59 0.48
2012_USHG_FT 744 MC 16 1 770 0.81 0.01 0.41 0.07 0.43 0.08 0.41 0.46
2012_USHG_FT 744 MC 17 1 770 0.81 0.02 0.58 0.16 0.15 0.09 0.58 0.37
2012_USHG_FT 744 MC 18 1 770 0.81 0.02 0.08 0.84 0.04 0.03 0.84 0.40

Prepared for NYSED by Pearson 42
Test Form Type Item Max N-Count Alpha B M0 M1 M2 M3 M4 M5 M6 Mean Point- Biserial
2012_USHG_FT 744 MC 19 1 770 0.81 0.02 0.18 0.16 0.59 0.05 0.59 0.52
2012_USHG_FT 744 MC 20 1 770 0.81 0.02 0.10 0.34 0.50 0.04 0.50 0.43
2012_USHG_FT 744 MC 21 1 770 0.81 0.02 0.07 0.11 0.73 0.08 0.73 0.54
2012_USHG_FT 744 MC 22 1 770 0.81 0.03 0.08 0.18 0.22 0.48 0.22 0.24
2012_USHG_FT 744 MC 23 1 770 0.81 0.03 0.15 0.55 0.23 0.04 0.55 0.47
2012_USHG_FT 744 MC 24 1 770 0.81 0.04 0.09 0.62 0.18 0.07 0.62 0.53
2012_USHG_FT 744 MC 25 1 770 0.81 0.04 0.15 0.31 0.46 0.04 0.31 0.00
2012_USHG_FT 744 MC 26 1 770 0.81 0.04 0.17 0.11 0.37 0.31 0.37 0.19
2012_USHG_FT 744 MC 27 1 770 0.81 0.05 0.48 0.09 0.29 0.09 0.48 0.44
2012_USHG_FT 744 MC 28 1 770 0.81 0.05 0.08 0.17 0.48 0.22 0.48 0.49
2012_USHG_FT 744 MC 29 1 770 0.81 0.05 0.10 0.52 0.12 0.20 0.52 0.32
2012_USHG_FT 744 MC 30 1 770 0.81 0.06 0.18 0.17 0.07 0.53 0.53 0.49
2012_USHG_FT 744 MC 31 1 770 0.81 0.07 0.22 0.07 0.35 0.29 0.22 0.26
2012_USHG_FT 744 MC 32 1 770 0.81 0.08 0.40 0.20 0.21 0.11 0.40 0.52
2012_USHG_FT 745 MC 01 1 771 0.85 0.01 0.05 0.80 0.12 0.03 0.80 0.40
2012_USHG_FT 745 MC 02 1 771 0.85 0.02 0.16 0.39 0.33 0.10 0.33 0.47
2012_USHG_FT 745 MC 03 1 771 0.85 0.00 0.02 0.03 0.92 0.03 0.92 0.40
2012_USHG_FT 745 MC 04 1 771 0.85 0.01 0.12 0.06 0.25 0.55 0.55 0.40
2012_USHG_FT 745 MC 05 1 771 0.85 0.01 0.13 0.46 0.15 0.25 0.46 0.18
2012_USHG_FT 745 MC 06 1 771 0.85 0.01 0.52 0.07 0.08 0.33 0.52 0.35
2012_USHG_FT 745 MC 07 1 771 0.85 0.01 0.39 0.12 0.31 0.16 0.39 0.32
2012_USHG_FT 745 MC 08 1 771 0.85 0.01 0.39 0.08 0.49 0.03 0.49 0.39
2012_USHG_FT 745 MC 09 1 771 0.85 0.01 0.07 0.64 0.09 0.19 0.64 0.38
2012_USHG_FT 745 MC 10 1 771 0.85 0.02 0.05 0.34 0.16 0.44 0.44 0.36

Prepared for NYSED by Pearson 43
Test Form Type Item Max N-Count Alpha B M0 M1 M2 M3 M4 M5 M6 Mean Point- Biserial
2012_USHG_FT 745 MC 11 1 771 0.85 0.01 0.15 0.12 0.08 0.63 0.63 0.55
2012_USHG_FT 745 MC 12 1 771 0.85 0.02 0.39 0.12 0.24 0.22 0.39 0.41
2012_USHG_FT 745 MC 13 1 771 0.85 0.03 0.04 0.10 0.07 0.76 0.76 0.50
2012_USHG_FT 745 MC 14 1 771 0.85 0.03 0.32 0.16 0.27 0.22 0.32 0.15
2012_USHG_FT 745 MC 15 1 771 0.85 0.02 0.23 0.47 0.08 0.20 0.47 0.29
2012_USHG_FT 745 MC 16 1 771 0.85 0.03 0.25 0.10 0.11 0.50 0.50 0.45
2012_USHG_FT 745 MC 17 1 771 0.85 0.03 0.12 0.12 0.70 0.04 0.70 0.53
2012_USHG_FT 745 MC 18 1 771 0.85 0.03 0.19 0.57 0.08 0.14 0.57 0.38
2012_USHG_FT 745 MC 19 1 771 0.85 0.03 0.21 0.64 0.09 0.02 0.64 0.44
2012_USHG_FT 745 MC 20 1 771 0.85 0.04 0.06 0.77 0.09 0.05 0.77 0.51
2012_USHG_FT 745 MC 21 1 771 0.85 0.04 0.14 0.16 0.24 0.42 0.42 0.52
2012_USHG_FT 745 MC 22 1 771 0.85 0.04 0.05 0.75 0.09 0.07 0.75 0.56
2012_USHG_FT 745 MC 23 1 771 0.85 0.05 0.56 0.21 0.11 0.07 0.56 0.47
2012_USHG_FT 745 MC 24 1 771 0.85 0.06 0.23 0.26 0.34 0.11 0.34 0.38
2012_USHG_FT 745 MC 25 1 771 0.85 0.06 0.10 0.12 0.61 0.10 0.61 0.53
2012_USHG_FT 745 MC 26 1 771 0.85 0.07 0.66 0.07 0.12 0.08 0.66 0.50
2012_USHG_FT 745 MC 27 1 771 0.85 0.07 0.09 0.09 0.54 0.20 0.54 0.57
2012_USHG_FT 745 MC 28 1 771 0.85 0.08 0.16 0.08 0.17 0.51 0.51 0.57
2012_USHG_FT 745 MC 29 1 771 0.85 0.09 0.13 0.40 0.22 0.16 0.40 0.47
2012_USHG_FT 745 MC 30 1 771 0.85 0.10 0.09 0.07 0.28 0.46 0.46 0.48
2012_USHG_FT 745 MC 31 1 771 0.85 0.10 0.33 0.15 0.12 0.31 0.31 0.24
2012_USHG_FT 745 MC 32 1 771 0.85 0.11 0.15 0.46 0.16 0.12 0.46 0.41
2012_USHG_FT 746 MC 01 1 767 0.84 0.00 0.91 0.04 0.02 0.02 0.91 0.35
2012_USHG_FT 746 MC 02 1 767 0.84 0.01 0.17 0.26 0.12 0.44 0.44 0.36

Prepared for NYSED by Pearson 44
Test Form Type Item Max N-Count Alpha B M0 M1 M2 M3 M4 M5 M6 Mean Point- Biserial
2012_USHG_FT 746 MC 03 1 767 0.84 0.01 0.31 0.44 0.22 0.02 0.44 0.37
2012_USHG_FT 746 MC 04 1 767 0.84 0.01 0.16 0.18 0.27 0.39 0.39 0.47
2012_USHG_FT 746 MC 05 1 767 0.84 0.01 0.51 0.26 0.15 0.06 0.51 0.45
2012_USHG_FT 746 MC 06 1 767 0.84 0.01 0.21 0.32 0.34 0.12 0.32 0.32
2012_USHG_FT 746 MC 07 1 767 0.84 0.01 0.13 0.06 0.59 0.21 0.59 0.36
2012_USHG_FT 746 MC 08 1 767 0.84 0.01 0.07 0.06 0.81 0.06 0.81 0.36
2012_USHG_FT 746 MC 09 1 767 0.84 0.01 0.08 0.19 0.66 0.06 0.66 0.36
2012_USHG_FT 746 MC 10 1 767 0.84 0.01 0.11 0.64 0.09 0.14 0.64 0.47
2012_USHG_FT 746 MC 11 1 767 0.84 0.01 0.13 0.09 0.46 0.31 0.46 0.42
2012_USHG_FT 746 MC 12 1 767 0.84 0.01 0.08 0.05 0.62 0.24 0.62 0.50
2012_USHG_FT 746 MC 13 1 767 0.84 0.01 0.11 0.44 0.30 0.13 0.30 0.12
2012_USHG_FT 746 MC 14 1 767 0.84 0.01 0.07 0.49 0.22 0.20 0.49 0.46
2012_USHG_FT 746 MC 15 1 767 0.84 0.01 0.08 0.72 0.05 0.13 0.72 0.50
2012_USHG_FT 746 MC 16 1 767 0.84 0.01 0.39 0.05 0.07 0.49 0.49 0.48
2012_USHG_FT 746 MC 17 1 767 0.84 0.01 0.12 0.70 0.09 0.09 0.70 0.47
2012_USHG_FT 746 MC 18 1 767 0.84 0.01 0.10 0.49 0.10 0.30 0.49 0.44
2012_USHG_FT 746 MC 19 1 767 0.84 0.02 0.09 0.71 0.07 0.12 0.71 0.49
2012_USHG_FT 746 MC 20 1 767 0.84 0.02 0.12 0.32 0.46 0.07 0.46 0.33
2012_USHG_FT 746 MC 21 1 767 0.84 0.02 0.09 0.36 0.45 0.08 0.45 0.39
2012_USHG_FT 746 MC 22 1 767 0.84 0.03 0.29 0.08 0.12 0.48 0.48 0.38
2012_USHG_FT 746 MC 23 1 767 0.84 0.03 0.25 0.07 0.53 0.11 0.53 0.43
2012_USHG_FT 746 MC 24 1 767 0.84 0.03 0.22 0.25 0.11 0.40 0.25 0.21
2012_USHG_FT 746 MC 25 1 767 0.84 0.03 0.13 0.13 0.39 0.31 0.31 0.24
2012_USHG_FT 746 MC 26 1 767 0.84 0.04 0.31 0.08 0.13 0.45 0.45 0.52

Prepared for NYSED by Pearson 45
Test Form Type Item Max N-Count Alpha B M0 M1 M2 M3 M4 M5 M6 Mean Point- Biserial
2012_USHG_FT 746 MC 27 1 767 0.84 0.04 0.31 0.07 0.12 0.46 0.46 0.40
2012_USHG_FT 746 MC 28 1 767 0.84 0.04 0.08 0.19 0.40 0.29 0.29 0.26
2012_USHG_FT 746 MC 29 1 767 0.84 0.04 0.61 0.09 0.18 0.08 0.61 0.51
2012_USHG_FT 746 MC 30 1 767 0.84 0.04 0.07 0.72 0.10 0.07 0.72 0.58
2012_USHG_FT 746 MC 31 1 767 0.84 0.05 0.17 0.58 0.08 0.11 0.58 0.47
2012_USHG_FT 746 MC 32 1 767 0.84 0.06 0.75 0.06 0.05 0.08 0.75 0.55
2012_USHG_FT 747 MC 01 1 786 0.83 0.00 0.94 0.01 0.01 0.05 0.94 0.16
2012_USHG_FT 747 MC 02 1 786 0.83 0.01 0.67 0.04 0.07 0.21 0.67 0.50
2012_USHG_FT 747 MC 03 1 786 0.83 0.01 0.04 0.02 0.20 0.73 0.73 0.35
2012_USHG_FT 747 MC 04 1 786 0.83 0.00 0.05 0.75 0.03 0.18 0.75 0.47
2012_USHG_FT 747 MC 05 1 786 0.83 0.01 0.06 0.78 0.11 0.04 0.78 0.41
2012_USHG_FT 747 MC 06 1 786 0.83 0.01 0.41 0.27 0.08 0.23 0.23 0.16
2012_USHG_FT 747 MC 07 1 786 0.83 0.01 0.27 0.34 0.10 0.28 0.28 0.22
2012_USHG_FT 747 MC 08 1 786 0.83 0.01 0.10 0.10 0.73 0.06 0.73 0.48
2012_USHG_FT 747 MC 09 1 786 0.83 0.01 0.55 0.04 0.19 0.21 0.55 0.46
2012_USHG_FT 747 MC 10 1 786 0.83 0.01 0.07 0.44 0.09 0.39 0.44 0.49
2012_USHG_FT 747 MC 11 1 786 0.83 0.01 0.34 0.22 0.27 0.16 0.34 0.23
2012_USHG_FT 747 MC 12 1 786 0.83 0.01 0.54 0.06 0.27 0.12 0.54 0.40
2012_USHG_FT 747 MC 13 1 786 0.83 0.01 0.32 0.05 0.13 0.50 0.50 0.33
2012_USHG_FT 747 MC 14 1 786 0.83 0.01 0.06 0.13 0.45 0.34 0.45 0.47
2012_USHG_FT 747 MC 15 1 786 0.83 0.01 0.03 0.28 0.66 0.03 0.66 0.55
2012_USHG_FT 747 MC 16 1 786 0.83 0.02 0.19 0.33 0.13 0.33 0.33 0.37
2012_USHG_FT 747 MC 17 1 786 0.83 0.02 0.09 0.58 0.10 0.21 0.58 0.52
2012_USHG_FT 747 MC 18 1 786 0.83 0.01 0.11 0.21 0.60 0.06 0.60 0.42

Prepared for NYSED by Pearson 46
Test Form Type Item Max N-Count Alpha B M0 M1 M2 M3 M4 M5 M6 Mean Point- Biserial
2012_USHG_FT 747 MC 19 1 786 0.83 0.02 0.04 0.07 0.63 0.25 0.63 0.33
2012_USHG_FT 747 MC 20 1 786 0.83 0.02 0.05 0.02 0.84 0.07 0.84 0.38
2012_USHG_FT 747 MC 21 1 786 0.83 0.02 0.63 0.18 0.04 0.12 0.63 0.37
2012_USHG_FT 747 MC 22 1 786 0.83 0.03 0.10 0.32 0.13 0.42 0.32 0.32
2012_USHG_FT 747 MC 23 1 786 0.83 0.03 0.14 0.04 0.04 0.75 0.75 0.57
2012_USHG_FT 747 MC 24 1 786 0.83 0.04 0.12 0.10 0.61 0.13 0.61 0.50
2012_USHG_FT 747 MC 25 1 786 0.83 0.04 0.10 0.14 0.13 0.59 0.59 0.47
2012_USHG_FT 747 MC 26 1 786 0.83 0.05 0.19 0.17 0.50 0.09 0.50 0.34
2012_USHG_FT 747 MC 27 1 786 0.83 0.05 0.66 0.07 0.06 0.16 0.66 0.43
2012_USHG_FT 747 MC 28 1 786 0.83 0.06 0.67 0.06 0.09 0.12 0.67 0.51
2012_USHG_FT 747 MC 29 1 786 0.83 0.06 0.04 0.23 0.05 0.61 0.23 0.21
2012_USHG_FT 747 MC 30 1 786 0.83 0.07 0.14 0.47 0.24 0.09 0.47 0.54
2012_USHG_FT 747 MC 31 1 786 0.83 0.10 0.41 0.19 0.09 0.21 0.41 0.37
2012_USHG_FT 747 MC 32 1 786 0.83 0.10 0.16 0.12 0.46 0.16 0.46 0.38
2012_USHG_FT 748 ESS THM 5 953 0.88 0.07 0.15 0.41 0.24 0.12 0.01 0.00 1.31 0.66
2012_USHG_FT 749 ESS THM 5 974 0.88 0.07 0.17 0.35 0.26 0.14 0.01 0.00 1.37 0.63
2012_USHG_FT 750 ESS THM 5 978 0.87 0.06 0.13 0.39 0.28 0.12 0.01 0.00 1.37 0.60
2012_USHG_FT 751 ESS THM 5 980 0.87 0.06 0.08 0.37 0.37 0.11 0.01 0.00 1.48 0.59
2012_USHG_FT 752 ESS THM 5 979 0.88 0.05 0.11 0.45 0.28 0.09 0.01 0.00 1.33 0.63
2012_USHG_FT 753 ESS THM 5 976 0.88 0.04 0.14 0.40 0.31 0.10 0.01 0.00 1.37 0.60
2012_USHG_FT 754 ESS THM 5 980 0.87 0.04 0.05 0.18 0.37 0.26 0.10 0.00 2.11 0.56
2012_USHG_FT 755 SCF 01 2 823 0.90 0.02 0.06 0.27 0.65 1.56 0.43
2012_USHG_FT 755 SCF 02 1 823 0.90 0.03 0.18 0.79 0.79 0.48

Prepared for NYSED by Pearson 47
Test Form Type Item Max N-Count Alpha B M0 M1 M2 M3 M4 M5 M6 Mean Point- Biserial
2012_USHG_FT 755 SCF 03 2 823 0.90 0.05 0.13 0.34 0.47 1.29 0.51
2012_USHG_FT 755 SCF 04 1 823 0.90 0.07 0.26 0.67 0.67 0.41
2012_USHG_FT 755 SCF 05 1 823 0.90 0.07 0.21 0.73 0.73 0.49
2012_USHG_FT 755 SCF 06 2 823 0.90 0.07 0.05 0.20 0.68 1.56 0.47
2012_USHG_FT 755 SCF 07 2 823 0.90 0.10 0.08 0.26 0.57 1.39 0.56
2012_USHG_FT 755 SCF 08 2 823 0.90 0.10 0.06 0.14 0.70 1.53 0.57
2012_USHG_FT 755 SCF 09 1 823 0.90 0.11 0.18 0.71 0.71 0.49
2012_USHG_FT 755 ESS DBQ 5 823 0.90 0.02 0.25 0.31 0.32 0.09 0.00 0.00 1.24 0.60
2012_USHG_FT 756 SCF 01 2 815 0.90 0.04 0.07 0.17 0.72 1.61 0.50
2012_USHG_FT 756 SCF 02 2 815 0.90 0.04 0.04 0.15 0.77 1.68 0.50
2012_USHG_FT 756 SCF 03 1 815 0.90 0.05 0.16 0.79 0.79 0.42
2012_USHG_FT 756 SCF 04 1 815 0.90 0.07 0.15 0.77 0.77 0.45
2012_USHG_FT 756 SCF 05 1 815 0.90 0.07 0.06 0.87 0.87 0.40
2012_USHG_FT 756 SCF 6a 1 815 0.90 0.10 0.08 0.82 0.82 0.54
2012_USHG_FT 756 SCF 6b 1 815 0.90 0.09 0.12 0.79 0.79 0.47
2012_USHG_FT 756 SCF 07 1 815 0.90 0.10 0.24 0.65 0.65 0.40
2012_USHG_FT 756 SCF 8a 1 815 0.90 0.13 0.10 0.77 0.77 0.53
2012_USHG_FT 756 SCF 8b 1 815 0.90 0.14 0.26 0.60 0.60 0.47
2012_USHG_FT 756 SCF 9a 1 815 0.90 0.16 0.14 0.71 0.71 0.56
2012_USHG_FT 756 SCF 9b 1 815 0.90 0.17 0.27 0.56 0.56 0.48
2012_USHG_FT 756 ESS DBQ 5 815 0.90 0.05 0.28 0.19 0.32 0.16 0.01 0.00 1.34 0.60
2012_USHG_FT 757 SCF 01 2 817 0.89 0.04 0.05 0.08 0.84 1.75 0.43
2012_USHG_FT 757 SCF 02 1 817 0.89 0.08 0.32 0.60 0.60 0.48
2012_USHG_FT 757 SCF 3a 1 817 0.89 0.08 0.26 0.67 0.67 0.50

Prepared for NYSED by Pearson 48
Test Form Type Item Max N-Count Alpha B M0 M1 M2 M3 M4 M5 M6 Mean Point- Biserial
2012_USHG_FT 757 SCF 3b 1 817 0.89 0.07 0.26 0.67 0.67 0.34
2012_USHG_FT 757 SCF 04 1 817 0.89 0.06 0.47 0.47 0.47 0.38
2012_USHG_FT 757 SCF 05 1 817 0.89 0.08 0.27 0.65 0.65 0.46
2012_USHG_FT 757 SCF 06 2 817 0.89 0.10 0.04 0.14 0.72 1.58 0.56
2012_USHG_FT 757 SCF 7a 2 817 0.89 0.12 0.07 0.09 0.72 1.53 0.56
2012_USHG_FT 757 SCF 7b 1 817 0.89 0.12 0.45 0.43 0.43 0.50
2012_USHG_FT 757 SCF 08 1 817 0.89 0.12 0.21 0.66 0.66 0.47
2012_USHG_FT 757 SCF 09 1 817 0.89 0.14 0.28 0.58 0.58 0.44
2012_USHG_FT 757 ESS DBQ 5 817 0.89 0.04 0.27 0.37 0.27 0.04 0.00 0.00 1.06 0.55
2012_USHG_FT 758 SCF 01 2 807 0.90 0.05 0.13 0.45 0.37 1.19 0.49
2012_USHG_FT 758 SCF 02 1 807 0.90 0.05 0.26 0.69 0.69 0.36
2012_USHG_FT 758 SCF 3a 1 807 0.90 0.07 0.14 0.80 0.80 0.42
2012_USHG_FT 758 SCF 3b 1 807 0.90 0.06 0.17 0.76 0.76 0.40
2012_USHG_FT 758 SCF 04 1 807 0.90 0.06 0.16 0.77 0.77 0.44
2012_USHG_FT 758 SCF 05 1 807 0.90 0.08 0.32 0.60 0.60 0.51
2012_USHG_FT 758 SCF 06 1 807 0.90 0.07 0.11 0.82 0.82 0.41
2012_USHG_FT 758 SCF 7a 1 807 0.90 0.10 0.33 0.57 0.57 0.45
2012_USHG_FT 758 SCF 7b 1 807 0.90 0.10 0.18 0.72 0.72 0.46
2012_USHG_FT 758 SCF 08 1 807 0.90 0.14 0.32 0.54 0.54 0.46
2012_USHG_FT 758 SCF 09 1 807 0.90 0.13 0.15 0.72 0.72 0.51
2012_USHG_FT 758 ESS DBQ 5 807 0.90 0.05 0.24 0.35 0.26 0.08 0.01 0.00 1.16 0.62
2012_USHG_FT 759 SCF 01 2 811 0.90 0.04 0.11 0.37 0.48 1.33 0.47
2012_USHG_FT 759 SCF 02 1 811 0.90 0.09 0.36 0.55 0.55 0.38
2012_USHG_FT 759 SCF 3a 1 811 0.90 0.09 0.24 0.67 0.67 0.53

Prepared for NYSED by Pearson 49
Test Form Type Item Max N-Count Alpha B M0 M1 M2 M3 M4 M5 M6 Mean Point- Biserial
2012_USHG_FT 759 SCF 3b 1 811 0.90 0.11 0.30 0.59 0.59 0.43
2012_USHG_FT 759 SCF 04 2 811 0.90 0.10 0.08 0.38 0.45 1.27 0.60
2012_USHG_FT 759 SCF 05 1 811 0.90 0.12 0.22 0.66 0.66 0.48
2012_USHG_FT 759 SCF 06 1 811 0.90 0.12 0.16 0.72 0.72 0.59
2012_USHG_FT 759 SCF 07 1 811 0.90 0.11 0.11 0.78 0.78 0.55
2012_USHG_FT 759 SCF 8a 1 811 0.90 0.13 0.15 0.73 0.73 0.58
2012_USHG_FT 759 SCF 8b 1 811 0.90 0.13 0.12 0.75 0.75 0.51
2012_USHG_FT 759 SCF 09 2 811 0.90 0.14 0.07 0.24 0.55 1.35 0.64
2012_USHG_FT 759 ESS DBQ 5 811 0.90 0.04 0.27 0.34 0.27 0.08 0.00 0.00 1.13 0.64

Prepared for NYSED by Pearson 50
Appendix B: Partial-Credit Model Item Analysis

Prepared for NYSED by Pearson 51
Test Form Type Item Max N-Count RID S1 S2 S3 S4 S5 S6 INFIT
2012_USHG_FT 731 MC 01 1 782 −0.8000 0.97
2012_USHG_FT 731 MC 02 1 782 −0.7200 1.01
2012_USHG_FT 731 MC 03 1 782 0.2900 1.07
2012_USHG_FT 731 MC 04 1 782 −1.3000 1.04
2012_USHG_FT 731 MC 05 1 782 2.1500 1.29
2012_USHG_FT 731 MC 06 1 782 −0.6000 1.00
2012_USHG_FT 731 MC 07 1 782 0.5300 1.11
2012_USHG_FT 731 MC 08 1 782 0.3200 0.89
2012_USHG_FT 731 MC 09 1 782 0.5700 1.00
2012_USHG_FT 731 MC 10 1 782 −0.5200 0.92
2012_USHG_FT 731 MC 11 1 782 −1.0100 0.97
2012_USHG_FT 731 MC 12 1 782 0.0000 0.98
2012_USHG_FT 731 MC 13 1 782 0.2300 1.15
2012_USHG_FT 731 MC 14 1 782 −0.7100 0.89
2012_USHG_FT 731 MC 15 1 782 0.4100 0.88
2012_USHG_FT 731 MC 16 1 782 −0.0600 0.85
2012_USHG_FT 731 MC 17 1 782 −0.2800 0.85
2012_USHG_FT 731 MC 18 1 782 −0.9100 0.76
2012_USHG_FT 731 MC 19 1 782 −0.2700 0.96
2012_USHG_FT 731 MC 20 1 782 0.4000 1.02
2012_USHG_FT 731 MC 21 1 782 −0.8900 0.91
2012_USHG_FT 731 MC 22 1 782 1.0300 1.23
2012_USHG_FT 731 MC 23 1 782 −0.6700 0.85
2012_USHG_FT 731 MC 24 1 782 1.1000 1.15

Prepared for NYSED by Pearson 52
Test Form Type Item Max N-Count RID S1 S2 S3 S4 S5 S6 INFIT
2012_USHG_FT 731 MC 25 1 782 1.2600 1.15
2012_USHG_FT 731 MC 26 1 782 0.6200 1.05
2012_USHG_FT 731 MC 27 1 782 0.6300 1.00
2012_USHG_FT 731 MC 28 1 782 0.5900 0.97
2012_USHG_FT 731 MC 29 1 782 0.0400 0.95
2012_USHG_FT 731 MC 30 1 782 −0.6200 0.96
2012_USHG_FT 732 MC 01 1 785 −1.3201 1.01
2012_USHG_FT 732 MC 02 1 785 −0.8443 0.99
2012_USHG_FT 732 MC 03 1 785 0.4800 1.04
2012_USHG_FT 732 MC 04 1 785 0.6225 1.03
2012_USHG_FT 732 MC 05 1 785 −1.6380 0.93
2012_USHG_FT 732 MC 06 1 785 −0.1971 1.05
2012_USHG_FT 732 MC 07 1 785 0.5173 0.95
2012_USHG_FT 732 MC 08 1 785 0.2193 0.99
2012_USHG_FT 732 MC 09 1 785 1.0887 1.14
2012_USHG_FT 732 MC 10 1 785 2.2609 1.34
2012_USHG_FT 732 MC 11 1 785 −0.4948 0.94
2012_USHG_FT 732 MC 12 1 785 −0.7243 0.86
2012_USHG_FT 732 MC 13 1 785 0.3858 1.07
2012_USHG_FT 732 MC 14 1 785 0.5731 0.93
2012_USHG_FT 732 MC 15 1 785 0.1933 1.02
2012_USHG_FT 732 MC 16 1 785 −0.1971 1.02
2012_USHG_FT 732 MC 17 1 785 1.3645 1.12
2012_USHG_FT 732 MC 18 1 785 0.2775 1.06
2012_USHG_FT 732 MC 19 1 785 −0.0693 0.87
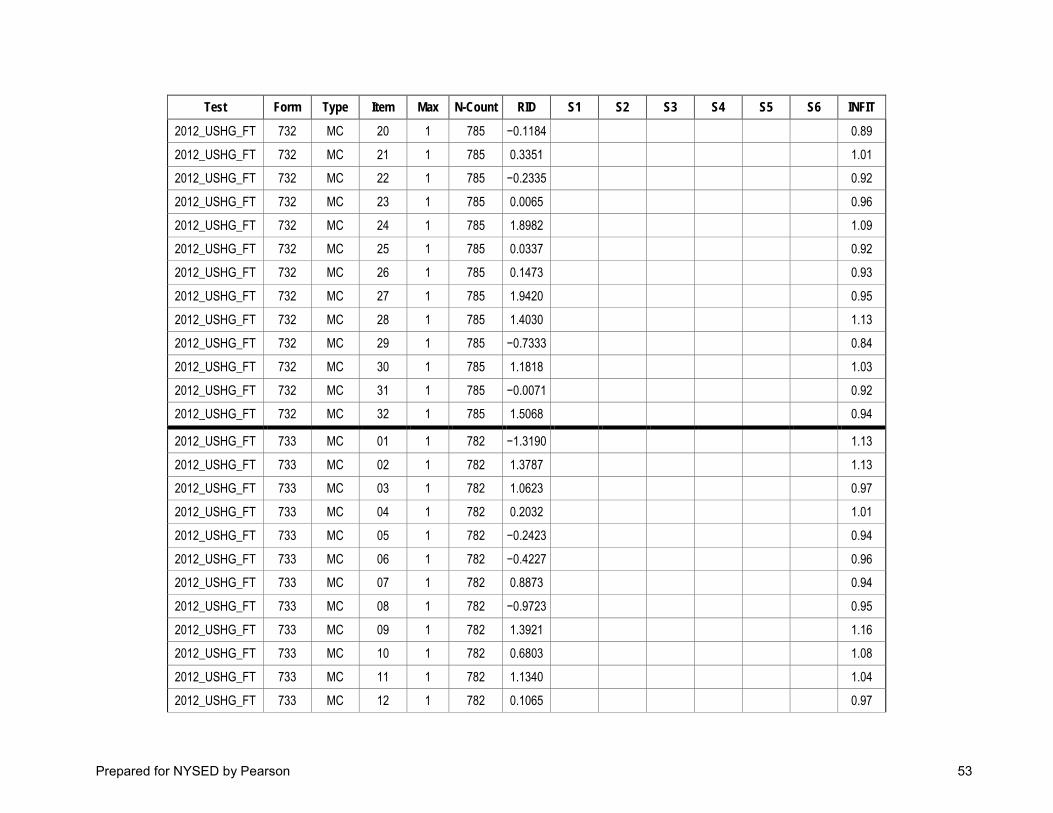
Prepared for NYSED by Pearson 53
Test Form Type Item Max N-Count RID S1 S2 S3 S4 S5 S6 INFIT
2012_USHG_FT 732 MC 20 1 785 −0.1184 0.89
2012_USHG_FT 732 MC 21 1 785 0.3351 1.01
2012_USHG_FT 732 MC 22 1 785 −0.2335 0.92
2012_USHG_FT 732 MC 23 1 785 0.0065 0.96
2012_USHG_FT 732 MC 24 1 785 1.8982 1.09
2012_USHG_FT 732 MC 25 1 785 0.0337 0.92
2012_USHG_FT 732 MC 26 1 785 0.1473 0.93
2012_USHG_FT 732 MC 27 1 785 1.9420 0.95
2012_USHG_FT 732 MC 28 1 785 1.4030 1.13
2012_USHG_FT 732 MC 29 1 785 −0.7333 0.84
2012_USHG_FT 732 MC 30 1 785 1.1818 1.03
2012_USHG_FT 732 MC 31 1 785 −0.0071 0.92
2012_USHG_FT 732 MC 32 1 785 1.5068 0.94
2012_USHG_FT 733 MC 01 1 782 −1.3190 1.13
2012_USHG_FT 733 MC 02 1 782 1.3787 1.13
2012_USHG_FT 733 MC 03 1 782 1.0623 0.97
2012_USHG_FT 733 MC 04 1 782 0.2032 1.01
2012_USHG_FT 733 MC 05 1 782 −0.2423 0.94
2012_USHG_FT 733 MC 06 1 782 −0.4227 0.96
2012_USHG_FT 733 MC 07 1 782 0.8873 0.94
2012_USHG_FT 733 MC 08 1 782 −0.9723 0.95
2012_USHG_FT 733 MC 09 1 782 1.3921 1.16
2012_USHG_FT 733 MC 10 1 782 0.6803 1.08
2012_USHG_FT 733 MC 11 1 782 1.1340 1.04
2012_USHG_FT 733 MC 12 1 782 0.1065 0.97

Prepared for NYSED by Pearson 54
Test Form Type Item Max N-Count RID S1 S2 S3 S4 S5 S6 INFIT
2012_USHG_FT 733 MC 13 1 782 0.2577 1.04
2012_USHG_FT 733 MC 14 1 782 0.2169 1.00
2012_USHG_FT 733 MC 15 1 782 −0.1151 0.83
2012_USHG_FT 733 MC 16 1 782 0.3919 0.93
2012_USHG_FT 733 MC 17 1 782 0.3050 1.03
2012_USHG_FT 733 MC 18 1 782 0.6998 1.06
2012_USHG_FT 733 MC 19 1 782 −0.6860 0.92
2012_USHG_FT 733 MC 20 1 782 0.4845 1.16
2012_USHG_FT 733 MC 21 1 782 −0.0424 1.07
2012_USHG_FT 733 MC 22 1 782 0.9585 1.15
2012_USHG_FT 733 MC 23 1 782 0.5042 1.00
2012_USHG_FT 733 MC 24 1 782 0.5305 1.10
2012_USHG_FT 733 MC 25 1 782 −0.5981 0.92
2012_USHG_FT 733 MC 26 1 782 0.8421 0.95
2012_USHG_FT 733 MC 27 1 782 0.8615 0.97
2012_USHG_FT 733 MC 28 1 782 −0.0786 0.84
2012_USHG_FT 733 MC 29 1 782 −0.2044 0.83
2012_USHG_FT 733 MC 30 1 782 0.1963 0.96
2012_USHG_FT 733 MC 31 1 782 0.6674 0.92
2012_USHG_FT 733 MC 32 1 782 0.6414 0.95
2012_USHG_FT 734 MC 01 1 776 −0.1232 1.21
2012_USHG_FT 734 MC 02 1 776 0.7362 1.02
2012_USHG_FT 734 MC 03 1 776 0.1926 1.25
2012_USHG_FT 734 MC 04 1 776 0.9871 0.88
2012_USHG_FT 734 MC 05 1 776 0.2796 1.01

Prepared for NYSED by Pearson 55
Test Form Type Item Max N-Count RID S1 S2 S3 S4 S5 S6 INFIT
2012_USHG_FT 734 MC 06 1 776 −0.7247 0.92
2012_USHG_FT 734 MC 07 1 776 0.2663 0.94
2012_USHG_FT 734 MC 08 1 776 −0.4804 0.93
2012_USHG_FT 734 MC 09 1 776 1.2713 0.97
2012_USHG_FT 734 MC 10 1 776 0.7236 1.21
2012_USHG_FT 734 MC 11 1 776 1.2076 1.01
2012_USHG_FT 734 MC 12 1 776 0.2995 1.20
2012_USHG_FT 734 MC 13 1 776 −0.3040 0.91
2012_USHG_FT 734 MC 14 1 776 −0.1674 1.02
2012_USHG_FT 734 MC 15 1 776 −0.0651 0.92
2012_USHG_FT 734 MC 16 1 776 1.0750 0.91
2012_USHG_FT 734 MC 17 1 776 0.4045 1.01
2012_USHG_FT 734 MC 18 1 776 0.7928 0.96
2012_USHG_FT 734 MC 19 1 776 1.2905 1.17
2012_USHG_FT 734 MC 20 1 776 0.2262 0.84
2012_USHG_FT 734 MC 21 1 776 0.2262 0.86
2012_USHG_FT 734 MC 22 1 776 2.1625 1.19
2012_USHG_FT 734 MC 23 1 776 0.6479 0.91
2012_USHG_FT 734 MC 24 1 776 1.3806 1.00
2012_USHG_FT 734 MC 25 1 776 1.9563 1.12
2012_USHG_FT 734 MC 26 1 776 −0.5307 0.85
2012_USHG_FT 734 MC 27 1 776 0.4498 1.10
2012_USHG_FT 734 MC 28 1 776 −0.7525 0.87
2012_USHG_FT 734 MC 29 1 776 0.2195 0.94
2012_USHG_FT 734 MC 30 1 776 0.3391 0.93

Prepared for NYSED by Pearson 56
Test Form Type Item Max N-Count RID S1 S2 S3 S4 S5 S6 INFIT
2012_USHG_FT 734 MC 31 1 776 0.4369 0.89
2012_USHG_FT 734 MC 32 1 776 0.1790 0.89
2012_USHG_FT 735 MC 01 1 775 0.2037 1.06
2012_USHG_FT 735 MC 02 1 775 0.0029 1.20
2012_USHG_FT 735 MC 03 1 775 −1.1209 0.89
2012_USHG_FT 735 MC 04 1 775 −0.4452 0.90
2012_USHG_FT 735 MC 05 1 775 1.1642 1.38
2012_USHG_FT 735 MC 06 1 775 0.0100 0.93
2012_USHG_FT 735 MC 07 1 775 1.0126 0.95
2012_USHG_FT 735 MC 08 1 775 1.0757 1.04
2012_USHG_FT 735 MC 09 1 775 −0.1271 0.94
2012_USHG_FT 735 MC 10 1 775 0.4094 0.88
2012_USHG_FT 735 MC 11 1 775 0.3439 1.04
2012_USHG_FT 735 MC 12 1 775 −0.0327 1.06
2012_USHG_FT 735 MC 13 1 775 −1.0984 0.95
2012_USHG_FT 735 MC 14 1 775 −0.3803 0.84
2012_USHG_FT 735 MC 15 1 775 0.6091 1.15
2012_USHG_FT 735 MC 16 1 775 −0.1345 0.88
2012_USHG_FT 735 MC 17 1 775 −0.2319 1.03
2012_USHG_FT 735 MC 18 1 775 0.3702 1.27
2012_USHG_FT 735 MC 19 1 775 −0.6598 0.76
2012_USHG_FT 735 MC 20 1 775 0.3042 0.97
2012_USHG_FT 735 MC 21 1 775 0.7548 0.92
2012_USHG_FT 735 MC 22 1 775 0.0802 0.93
2012_USHG_FT 735 MC 23 1 775 0.1969 0.90

Prepared for NYSED by Pearson 57
Test Form Type Item Max N-Count RID S1 S2 S3 S4 S5 S6 INFIT
2012_USHG_FT 735 MC 24 1 775 1.0820 1.06
2012_USHG_FT 735 MC 25 1 775 0.7421 1.18
2012_USHG_FT 735 MC 26 1 775 1.0378 0.93
2012_USHG_FT 735 MC 27 1 775 −0.4370 0.84
2012_USHG_FT 735 MC 28 1 775 0.4094 1.02
2012_USHG_FT 735 MC 29 1 775 0.6979 0.94
2012_USHG_FT 735 MC 30 1 775 0.5708 1.00
2012_USHG_FT 735 MC 31 1 775 0.2441 0.93
2012_USHG_FT 735 MC 32 1 775 0.9812 1.07
2012_USHG_FT 736 MC 01 1 792 −0.9906 0.96
2012_USHG_FT 736 MC 02 1 792 0.7862 1.16
2012_USHG_FT 736 MC 03 1 792 −1.2425 1.05
2012_USHG_FT 736 MC 04 1 792 −0.3231 0.90
2012_USHG_FT 736 MC 05 1 792 −0.7582 0.93
2012_USHG_FT 736 MC 06 1 792 1.1781 1.10
2012_USHG_FT 736 MC 07 1 792 −0.6075 1.03
2012_USHG_FT 736 MC 08 1 792 −0.8519 1.01
2012_USHG_FT 736 MC 09 1 792 0.7105 1.08
2012_USHG_FT 736 MC 10 1 792 0.1517 1.15
2012_USHG_FT 736 MC 11 1 792 0.9122 1.15
2012_USHG_FT 736 MC 12 1 792 −0.7400 1.01
2012_USHG_FT 736 MC 13 1 792 0.2591 1.04
2012_USHG_FT 736 MC 14 1 792 −0.4983 0.94
2012_USHG_FT 736 MC 15 1 792 2.5823 1.07
2012_USHG_FT 736 MC 16 1 792 1.5102 1.23

Prepared for NYSED by Pearson 58
Test Form Type Item Max N-Count RID S1 S2 S3 S4 S5 S6 INFIT
2012_USHG_FT 736 MC 17 1 792 0.0210 0.90
2012_USHG_FT 736 MC 18 1 792 0.8870 1.22
2012_USHG_FT 736 MC 19 1 792 −0.1358 0.89
2012_USHG_FT 736 MC 20 1 792 0.9626 0.90
2012_USHG_FT 736 MC 21 1 792 0.7105 0.89
2012_USHG_FT 736 MC 22 1 792 0.2724 0.94
2012_USHG_FT 736 MC 23 1 792 1.2614 0.90
2012_USHG_FT 736 MC 24 1 792 0.0903 0.99
2012_USHG_FT 736 MC 25 1 792 0.5709 1.01
2012_USHG_FT 736 MC 26 1 792 1.3001 1.07
2012_USHG_FT 736 MC 27 1 792 0.7231 0.89
2012_USHG_FT 736 MC 28 1 792 −0.3386 0.80
2012_USHG_FT 736 MC 29 1 792 −0.1431 0.81
2012_USHG_FT 736 MC 30 1 792 0.7105 0.95
2012_USHG_FT 736 MC 31 1 792 −0.0070 0.92
2012_USHG_FT 736 MC 32 1 792 0.1177 0.93
2012_USHG_FT 737 MC 01 1 778 1.1275 1.26
2012_USHG_FT 737 MC 02 1 778 0.7238 1.14
2012_USHG_FT 737 MC 03 1 778 0.0876 0.98
2012_USHG_FT 737 MC 04 1 778 0.7433 1.01
2012_USHG_FT 737 MC 05 1 778 −0.0191 0.98
2012_USHG_FT 737 MC 06 1 778 1.0489 1.07
2012_USHG_FT 737 MC 07 1 778 −0.4797 1.11
2012_USHG_FT 737 MC 08 1 778 −1.0676 0.95
2012_USHG_FT 737 MC 09 1 778 −0.3031 1.03

Prepared for NYSED by Pearson 59
Test Form Type Item Max N-Count RID S1 S2 S3 S4 S5 S6 INFIT
2012_USHG_FT 737 MC 10 1 778 −0.5895 0.84
2012_USHG_FT 737 MC 11 1 778 0.0664 1.10
2012_USHG_FT 737 MC 12 1 778 1.0424 0.90
2012_USHG_FT 737 MC 13 1 778 0.4084 0.85
2012_USHG_FT 737 MC 14 1 778 0.9837 1.04
2012_USHG_FT 737 MC 15 1 778 −0.5046 0.89
2012_USHG_FT 737 MC 16 1 778 −0.4714 0.86
2012_USHG_FT 737 MC 17 1 778 1.2596 1.04
2012_USHG_FT 737 MC 18 1 778 0.7953 0.96
2012_USHG_FT 737 MC 19 1 778 0.8927 1.05
2012_USHG_FT 737 MC 20 1 778 −0.5214 0.94
2012_USHG_FT 737 MC 21 1 778 0.9512 1.04
2012_USHG_FT 737 MC 22 1 778 −0.6595 0.91
2012_USHG_FT 737 MC 23 1 778 0.2399 0.89
2012_USHG_FT 737 MC 24 1 778 0.2467 1.09
2012_USHG_FT 737 MC 25 1 778 0.0239 0.97
2012_USHG_FT 737 MC 26 1 778 0.3213 0.90
2012_USHG_FT 737 MC 27 1 778 0.6064 1.02
2012_USHG_FT 737 MC 28 1 778 −0.3502 0.97
2012_USHG_FT 737 MC 29 1 778 0.3951 1.07
2012_USHG_FT 737 MC 30 1 778 0.5998 1.01
2012_USHG_FT 737 MC 31 1 778 2.0203 1.06
2012_USHG_FT 737 MC 32 1 778 0.6912 1.01
2012_USHG_FT 738 MC 01 1 788 −0.3117 1.06
2012_USHG_FT 738 MC 02 1 788 0.6775 1.21

Prepared for NYSED by Pearson 60
Test Form Type Item Max N-Count RID S1 S2 S3 S4 S5 S6 INFIT
2012_USHG_FT 738 MC 03 1 788 −1.0300 1.03
2012_USHG_FT 738 MC 04 1 788 0.1191 1.16
2012_USHG_FT 738 MC 05 1 788 −0.0577 1.17
2012_USHG_FT 738 MC 06 1 788 0.0068 0.98
2012_USHG_FT 738 MC 07 1 788 0.6452 0.93
2012_USHG_FT 738 MC 08 1 788 1.0711 1.14
2012_USHG_FT 738 MC 09 1 788 −0.3195 1.01
2012_USHG_FT 738 MC 10 1 788 1.3134 1.14
2012_USHG_FT 738 MC 11 1 788 1.1491 1.05
2012_USHG_FT 738 MC 12 1 788 −0.5969 0.93
2012_USHG_FT 738 MC 13 1 788 1.0258 1.13
2012_USHG_FT 738 MC 14 1 788 1.0776 1.07
2012_USHG_FT 738 MC 15 1 788 0.3433 1.06
2012_USHG_FT 738 MC 16 1 788 −0.0722 0.98
2012_USHG_FT 738 MC 17 1 788 −0.6402 0.86
2012_USHG_FT 738 MC 18 1 788 −0.7657 0.85
2012_USHG_FT 738 MC 19 1 788 0.1398 0.87
2012_USHG_FT 738 MC 20 1 788 −0.6402 0.89
2012_USHG_FT 738 MC 21 1 788 −0.1824 0.81
2012_USHG_FT 738 MC 22 1 788 0.8774 0.97
2012_USHG_FT 738 MC 23 1 788 −0.0867 0.83
2012_USHG_FT 738 MC 24 1 788 1.1752 1.16
2012_USHG_FT 738 MC 25 1 788 −0.3745 0.82
2012_USHG_FT 738 MC 26 1 788 0.4164 0.89
2012_USHG_FT 738 MC 27 1 788 0.0773 0.89

Prepared for NYSED by Pearson 61
Test Form Type Item Max N-Count RID S1 S2 S3 S4 S5 S6 INFIT
2012_USHG_FT 738 MC 28 1 788 0.0912 0.87
2012_USHG_FT 738 MC 29 1 788 0.7356 1.02
2012_USHG_FT 738 MC 30 1 788 1.2473 1.08
2012_USHG_FT 738 MC 31 1 788 0.6775 1.07
2012_USHG_FT 738 MC 32 1 788 0.5215 0.99
2012_USHG_FT 739 MC 01 1 777 −0.4556 0.96
2012_USHG_FT 739 MC 02 1 777 0.7216 1.15
2012_USHG_FT 739 MC 03 1 777 0.4930 1.17
2012_USHG_FT 739 MC 04 1 777 0.9421 1.03
2012_USHG_FT 739 MC 05 1 777 1.4969 1.32
2012_USHG_FT 739 MC 06 1 777 0.4028 0.95
2012_USHG_FT 739 MC 07 1 777 0.6521 0.99
2012_USHG_FT 739 MC 08 1 777 −0.2156 0.92
2012_USHG_FT 739 MC 09 1 777 0.0836 1.08
2012_USHG_FT 739 MC 10 1 777 −0.0488 0.92
2012_USHG_FT 739 MC 11 1 777 0.3768 1.01
2012_USHG_FT 739 MC 12 1 777 −0.5883 0.94
2012_USHG_FT 739 MC 13 1 777 −0.0844 0.90
2012_USHG_FT 739 MC 14 1 777 −1.2307 0.92
2012_USHG_FT 739 MC 15 1 777 0.4801 0.94
2012_USHG_FT 739 MC 16 1 777 −0.0559 0.86
2012_USHG_FT 739 MC 17 1 777 −0.4963 0.90
2012_USHG_FT 739 MC 18 1 777 0.6648 0.98
2012_USHG_FT 739 MC 19 1 777 0.3768 1.00
2012_USHG_FT 739 MC 20 1 777 0.7784 0.97

Prepared for NYSED by Pearson 62
Test Form Type Item Max N-Count RID S1 S2 S3 S4 S5 S6 INFIT
2012_USHG_FT 739 MC 21 1 777 −0.2606 0.97
2012_USHG_FT 739 MC 22 1 777 −0.1934 0.83
2012_USHG_FT 739 MC 23 1 777 2.4665 1.29
2012_USHG_FT 739 MC 24 1 777 0.8539 1.09
2012_USHG_FT 739 MC 25 1 777 0.2055 1.01
2012_USHG_FT 739 MC 26 1 777 0.0630 0.91
2012_USHG_FT 739 MC 27 1 777 0.7910 1.01
2012_USHG_FT 739 MC 28 1 777 1.2604 0.89
2012_USHG_FT 739 MC 29 1 777 −0.3370 0.89
2012_USHG_FT 739 MC 30 1 777 0.3638 1.04
2012_USHG_FT 739 MC 31 1 777 1.8089 1.16
2012_USHG_FT 739 MC 32 1 777 0.6838 0.91
2012_USHG_FT 740 MC 01 1 793 1.7172 1.08
2012_USHG_FT 740 MC 02 1 793 0.8478 1.20
2012_USHG_FT 740 MC 03 1 793 1.0216 1.03
2012_USHG_FT 740 MC 04 1 793 2.1536 0.96
2012_USHG_FT 740 MC 05 1 793 0.6194 0.88
2012_USHG_FT 740 MC 06 1 793 0.9976 1.28
2012_USHG_FT 740 MC 07 1 793 −0.2428 1.07
2012_USHG_FT 740 MC 08 1 793 2.0108 1.10
2012_USHG_FT 740 MC 09 1 793 2.2884 1.02
2012_USHG_FT 740 MC 10 1 793 −0.7808 0.93
2012_USHG_FT 740 MC 11 1 793 0.7998 1.02
2012_USHG_FT 740 MC 12 1 793 0.0077 0.87
2012_USHG_FT 740 MC 13 1 793 0.1721 1.03

Prepared for NYSED by Pearson 63
Test Form Type Item Max N-Count RID S1 S2 S3 S4 S5 S6 INFIT
2012_USHG_FT 740 MC 14 1 793 0.2553 1.02
2012_USHG_FT 740 MC 15 1 793 0.7639 1.01
2012_USHG_FT 740 MC 16 1 793 −1.0740 0.89
2012_USHG_FT 740 MC 17 1 793 −0.1291 1.02
2012_USHG_FT 740 MC 18 1 793 0.1657 0.90
2012_USHG_FT 740 MC 19 1 793 0.4426 1.07
2012_USHG_FT 740 MC 20 1 793 0.5345 1.04
2012_USHG_FT 740 MC 21 1 793 0.1527 0.91
2012_USHG_FT 740 MC 22 1 793 −0.1152 0.94
2012_USHG_FT 740 MC 23 1 793 0.2171 0.91
2012_USHG_FT 740 MC 24 1 793 0.7639 0.92
2012_USHG_FT 740 MC 25 1 793 0.2616 0.98
2012_USHG_FT 740 MC 26 1 793 1.4069 1.17
2012_USHG_FT 740 MC 27 1 793 1.1544 0.98
2012_USHG_FT 740 MC 28 1 793 0.6436 0.94
2012_USHG_FT 740 MC 29 1 793 −0.6491 0.85
2012_USHG_FT 740 MC 30 1 793 0.2869 0.90
2012_USHG_FT 740 MC 31 1 793 −0.0669 0.94
2012_USHG_FT 740 MC 32 1 793 0.1463 0.94
2012_USHG_FT 741 MC 01 1 789 0.8594 1.29
2012_USHG_FT 741 MC 02 1 789 −0.1348 0.92
2012_USHG_FT 741 MC 03 1 789 0.8098 0.88
2012_USHG_FT 741 MC 04 1 789 0.7787 1.25
2012_USHG_FT 741 MC 05 1 789 0.8842 0.89
2012_USHG_FT 741 MC 06 1 789 −1.1800 0.89

Prepared for NYSED by Pearson 64
Test Form Type Item Max N-Count RID S1 S2 S3 S4 S5 S6 INFIT
2012_USHG_FT 741 MC 07 1 789 0.4199 1.12
2012_USHG_FT 741 MC 08 1 789 1.0454 0.95
2012_USHG_FT 741 MC 09 1 789 −0.1639 1.03
2012_USHG_FT 741 MC 10 1 789 0.8904 1.02
2012_USHG_FT 741 MC 11 1 789 −0.1639 1.05
2012_USHG_FT 741 MC 12 1 789 −0.4957 0.84
2012_USHG_FT 741 MC 13 1 789 −1.5451 0.82
2012_USHG_FT 741 MC 14 1 789 0.4520 1.08
2012_USHG_FT 741 MC 15 1 789 0.5283 1.00
2012_USHG_FT 741 MC 16 1 789 −0.6917 0.83
2012_USHG_FT 741 MC 17 1 789 −0.7548 0.86
2012_USHG_FT 741 MC 18 1 789 2.3820 1.03
2012_USHG_FT 741 MC 19 1 789 −0.7823 0.82
2012_USHG_FT 741 MC 20 1 789 −0.1276 0.91
2012_USHG_FT 741 MC 21 1 789 1.6938 1.21
2012_USHG_FT 741 MC 22 1 789 0.1644 0.83
2012_USHG_FT 741 MC 23 1 789 1.7073 1.15
2012_USHG_FT 741 MC 24 1 789 0.3295 0.98
2012_USHG_FT 741 MC 25 1 789 1.3978 1.01
2012_USHG_FT 741 MC 26 1 789 0.9896 0.88
2012_USHG_FT 741 MC 27 1 789 1.9023 1.40
2012_USHG_FT 741 MC 28 1 789 0.0694 0.77
2012_USHG_FT 741 MC 29 1 789 0.6666 1.01
2012_USHG_FT 741 MC 30 1 789 1.4947 1.19
2012_USHG_FT 741 MC 31 1 789 0.2575 0.84

Prepared for NYSED by Pearson 65
Test Form Type Item Max N-Count RID S1 S2 S3 S4 S5 S6 INFIT
2012_USHG_FT 741 MC 32 1 789 0.5788 0.94
2012_USHG_FT 742 MC 01 1 792 −1.5996 0.98
2012_USHG_FT 742 MC 02 1 792 0.9387 1.10
2012_USHG_FT 742 MC 03 1 792 0.2521 1.04
2012_USHG_FT 742 MC 04 1 792 −0.1073 0.92
2012_USHG_FT 742 MC 05 1 792 1.4951 1.00
2012_USHG_FT 742 MC 06 1 792 0.9141 1.06
2012_USHG_FT 742 MC 07 1 792 −0.9119 0.96
2012_USHG_FT 742 MC 08 1 792 −1.3547 0.88
2012_USHG_FT 742 MC 09 1 792 −0.9618 0.98
2012_USHG_FT 742 MC 10 1 792 2.4519 1.20
2012_USHG_FT 742 MC 11 1 792 1.9089 1.18
2012_USHG_FT 742 MC 12 1 792 0.5383 0.94
2012_USHG_FT 742 MC 13 1 792 −0.2379 0.98
2012_USHG_FT 742 MC 14 1 792 −0.6103 0.86
2012_USHG_FT 742 MC 15 1 792 1.2536 0.96
2012_USHG_FT 742 MC 16 1 792 0.3425 0.93
2012_USHG_FT 742 MC 17 1 792 −1.3801 0.79
2012_USHG_FT 742 MC 18 1 792 0.8038 1.16
2012_USHG_FT 742 MC 19 1 792 0.3103 0.92
2012_USHG_FT 742 MC 20 1 792 0.7056 1.02
2012_USHG_FT 742 MC 21 1 792 0.5071 0.92
2012_USHG_FT 742 MC 22 1 792 0.1401 1.00
2012_USHG_FT 742 MC 23 1 792 0.7547 1.08
2012_USHG_FT 742 MC 24 1 792 0.9387 1.27

Prepared for NYSED by Pearson 66
Test Form Type Item Max N-Count RID S1 S2 S3 S4 S5 S6 INFIT
2012_USHG_FT 742 MC 25 1 792 0.9448 1.04
2012_USHG_FT 742 MC 26 1 792 0.0593 0.90
2012_USHG_FT 742 MC 27 1 792 0.9264 1.04
2012_USHG_FT 742 MC 28 1 792 1.1478 1.05
2012_USHG_FT 742 MC 29 1 792 0.7117 0.99
2012_USHG_FT 742 MC 30 1 792 0.4568 0.84
2012_USHG_FT 742 MC 31 1 792 0.2325 1.01
2012_USHG_FT 742 MC 32 1 792 −0.1865 0.82
2012_USHG_FT 743 MC 01 1 781 0.4191 1.10
2012_USHG_FT 743 MC 02 1 781 0.9555 1.05
2012_USHG_FT 743 MC 03 1 781 0.0918 1.04
2012_USHG_FT 743 MC 04 1 781 0.6419 1.08
2012_USHG_FT 743 MC 05 1 781 1.1816 1.09
2012_USHG_FT 743 MC 06 1 781 0.4920 0.94
2012_USHG_FT 743 MC 07 1 781 0.3206 1.04
2012_USHG_FT 743 MC 08 1 781 2.2060 1.23
2012_USHG_FT 743 MC 09 1 781 1.0324 1.08
2012_USHG_FT 743 MC 10 1 781 0.7368 1.09
2012_USHG_FT 743 MC 11 1 781 0.6835 1.06
2012_USHG_FT 743 MC 12 1 781 0.4617 0.95
2012_USHG_FT 743 MC 13 1 781 1.8719 0.99
2012_USHG_FT 743 MC 14 1 781 0.5582 0.95
2012_USHG_FT 743 MC 15 1 781 1.9499 1.01
2012_USHG_FT 743 MC 16 1 781 2.7457 1.13
2012_USHG_FT 743 MC 17 1 781 0.4191 0.84

Prepared for NYSED by Pearson 67
Test Form Type Item Max N-Count RID S1 S2 S3 S4 S5 S6 INFIT
2012_USHG_FT 743 MC 18 1 781 0.3516 0.97
2012_USHG_FT 743 MC 19 1 781 0.8019 1.01
2012_USHG_FT 743 MC 20 1 781 0.8078 0.93
2012_USHG_FT 743 MC 21 1 781 −0.1167 0.95
2012_USHG_FT 743 MC 22 1 781 0.8078 0.99
2012_USHG_FT 743 MC 23 1 781 2.0448 1.03
2012_USHG_FT 743 MC 24 1 781 1.3762 1.04
2012_USHG_FT 743 MC 25 1 781 1.5648 1.08
2012_USHG_FT 743 MC 26 1 781 0.4496 0.82
2012_USHG_FT 743 MC 27 1 781 −0.7799 0.83
2012_USHG_FT 743 MC 28 1 781 0.3020 0.84
2012_USHG_FT 743 MC 29 1 781 −0.2517 0.85
2012_USHG_FT 743 MC 30 1 781 0.3144 0.98
2012_USHG_FT 743 MC 31 1 781 0.5582 0.90
2012_USHG_FT 743 MC 32 1 781 1.0502 1.07
2012_USHG_FT 744 MC 01 1 770 1.6815 1.17
2012_USHG_FT 744 MC 02 1 770 2.1811 1.23
2012_USHG_FT 744 MC 03 1 770 −0.2977 0.95
2012_USHG_FT 744 MC 04 1 770 −0.6985 0.91
2012_USHG_FT 744 MC 05 1 770 −0.5679 0.90
2012_USHG_FT 744 MC 06 1 770 −0.2016 1.07
2012_USHG_FT 744 MC 07 1 770 1.7491 0.98
2012_USHG_FT 744 MC 08 1 770 0.6185 1.03
2012_USHG_FT 744 MC 09 1 770 −0.0738 0.94
2012_USHG_FT 744 MC 10 1 770 0.9919 1.14

Prepared for NYSED by Pearson 68
Test Form Type Item Max N-Count RID S1 S2 S3 S4 S5 S6 INFIT
2012_USHG_FT 744 MC 11 1 770 1.4789 0.94
2012_USHG_FT 744 MC 12 1 770 0.4532 1.00
2012_USHG_FT 744 MC 13 1 770 2.5518 0.94
2012_USHG_FT 744 MC 14 1 770 1.2165 0.97
2012_USHG_FT 744 MC 15 1 770 0.4594 0.91
2012_USHG_FT 744 MC 16 1 770 1.3152 0.94
2012_USHG_FT 744 MC 17 1 770 0.5332 1.03
2012_USHG_FT 744 MC 18 1 770 −0.9478 0.91
2012_USHG_FT 744 MC 19 1 770 0.4779 0.88
2012_USHG_FT 744 MC 20 1 770 0.8777 0.97
2012_USHG_FT 744 MC 21 1 770 −0.2308 0.84
2012_USHG_FT 744 MC 22 1 770 2.3117 1.08
2012_USHG_FT 744 MC 23 1 770 0.6609 0.93
2012_USHG_FT 744 MC 24 1 770 0.3221 0.87
2012_USHG_FT 744 MC 25 1 770 1.8042 1.39
2012_USHG_FT 744 MC 26 1 770 1.5174 1.21
2012_USHG_FT 744 MC 27 1 770 0.9558 0.97
2012_USHG_FT 744 MC 28 1 770 0.9799 0.92
2012_USHG_FT 744 MC 29 1 770 0.7815 1.08
2012_USHG_FT 744 MC 30 1 770 0.7514 0.91
2012_USHG_FT 744 MC 31 1 770 2.3542 1.07
2012_USHG_FT 744 MC 32 1 770 1.3339 0.88
2012_USHG_FT 745 MC 01 1 771 −0.7012 0.99
2012_USHG_FT 745 MC 02 1 771 1.7669 0.91
2012_USHG_FT 745 MC 03 1 771 −1.9020 0.89

Prepared for NYSED by Pearson 69
Test Form Type Item Max N-Count RID S1 S2 S3 S4 S5 S6 INFIT
2012_USHG_FT 745 MC 04 1 771 0.6738 1.04
2012_USHG_FT 745 MC 05 1 771 1.0851 1.28
2012_USHG_FT 745 MC 06 1 771 0.8176 1.10
2012_USHG_FT 745 MC 07 1 771 1.4203 1.10
2012_USHG_FT 745 MC 08 1 771 0.9482 1.05
2012_USHG_FT 745 MC 09 1 771 0.2081 1.06
2012_USHG_FT 745 MC 10 1 771 1.2167 1.08
2012_USHG_FT 745 MC 11 1 771 0.2882 0.87
2012_USHG_FT 745 MC 12 1 771 1.4203 1.01
2012_USHG_FT 745 MC 13 1 771 −0.4483 0.88
2012_USHG_FT 745 MC 14 1 771 1.8017 1.25
2012_USHG_FT 745 MC 15 1 771 1.0726 1.16
2012_USHG_FT 745 MC 16 1 771 0.8922 0.99
2012_USHG_FT 745 MC 17 1 771 −0.0998 0.88
2012_USHG_FT 745 MC 18 1 771 0.5918 1.06
2012_USHG_FT 745 MC 19 1 771 0.2148 0.99
2012_USHG_FT 745 MC 20 1 771 −0.5239 0.87
2012_USHG_FT 745 MC 21 1 771 1.2988 0.90
2012_USHG_FT 745 MC 22 1 771 −0.4236 0.83
2012_USHG_FT 745 MC 23 1 771 0.6171 0.97
2012_USHG_FT 745 MC 24 1 771 1.6914 1.02
2012_USHG_FT 745 MC 25 1 771 0.3606 0.90
2012_USHG_FT 745 MC 26 1 771 0.1058 0.91
2012_USHG_FT 745 MC 27 1 771 0.7177 0.86
2012_USHG_FT 745 MC 28 1 771 0.8363 0.85

Prepared for NYSED by Pearson 70
Test Form Type Item Max N-Count RID S1 S2 S3 S4 S5 S6 INFIT
2012_USHG_FT 745 MC 29 1 771 1.3817 0.94
2012_USHG_FT 745 MC 30 1 771 1.0851 0.95
2012_USHG_FT 745 MC 31 1 771 1.8795 1.19
2012_USHG_FT 745 MC 32 1 771 1.0789 1.03
2012_USHG_FT 746 MC 01 1 767 −1.6834 0.96
2012_USHG_FT 746 MC 02 1 767 1.2057 1.06
2012_USHG_FT 746 MC 03 1 767 1.1807 1.05
2012_USHG_FT 746 MC 04 1 767 1.4477 0.93
2012_USHG_FT 746 MC 05 1 767 0.8275 0.97
2012_USHG_FT 746 MC 06 1 767 1.7627 1.09
2012_USHG_FT 746 MC 07 1 767 0.4525 1.07
2012_USHG_FT 746 MC 08 1 767 −0.7744 0.98
2012_USHG_FT 746 MC 09 1 767 0.1115 1.06
2012_USHG_FT 746 MC 10 1 767 0.1990 0.94
2012_USHG_FT 746 MC 11 1 767 1.0872 1.00
2012_USHG_FT 746 MC 12 1 767 0.3044 0.91
2012_USHG_FT 746 MC 13 1 767 1.8832 1.26
2012_USHG_FT 746 MC 14 1 767 0.9510 0.97
2012_USHG_FT 746 MC 15 1 767 −0.2232 0.88
2012_USHG_FT 746 MC 16 1 767 0.9695 0.93
2012_USHG_FT 746 MC 17 1 767 −0.0839 0.92
2012_USHG_FT 746 MC 18 1 767 0.9695 0.99
2012_USHG_FT 746 MC 19 1 767 −0.1418 0.90
2012_USHG_FT 746 MC 20 1 767 1.0747 1.10
2012_USHG_FT 746 MC 21 1 767 1.1307 1.03

Prepared for NYSED by Pearson 71
Test Form Type Item Max N-Count RID S1 S2 S3 S4 S5 S6 INFIT
2012_USHG_FT 746 MC 22 1 767 0.9757 1.05
2012_USHG_FT 746 MC 23 1 767 0.7532 1.00
2012_USHG_FT 746 MC 24 1 767 2.2030 1.16
2012_USHG_FT 746 MC 25 1 767 1.8260 1.17
2012_USHG_FT 746 MC 26 1 767 1.1432 0.90
2012_USHG_FT 746 MC 27 1 767 1.1058 1.02
2012_USHG_FT 746 MC 28 1 767 1.9341 1.16
2012_USHG_FT 746 MC 29 1 767 0.3628 0.90
2012_USHG_FT 746 MC 30 1 767 −0.1933 0.80
2012_USHG_FT 746 MC 31 1 767 0.5286 0.95
2012_USHG_FT 746 MC 32 1 767 −0.4174 0.82
2012_USHG_FT 747 MC 01 1 786 −2.0929 1.06
2012_USHG_FT 747 MC 02 1 786 0.0514 0.90
2012_USHG_FT 747 MC 03 1 786 −0.2848 1.04
2012_USHG_FT 747 MC 04 1 786 −0.3599 0.92
2012_USHG_FT 747 MC 05 1 786 −0.5829 0.96
2012_USHG_FT 747 MC 06 1 786 2.2973 1.21
2012_USHG_FT 747 MC 07 1 786 1.9858 1.18
2012_USHG_FT 747 MC 08 1 786 −0.2553 0.90
2012_USHG_FT 747 MC 09 1 786 0.6733 0.96
2012_USHG_FT 747 MC 10 1 786 1.1566 0.92
2012_USHG_FT 747 MC 11 1 786 1.6509 1.18
2012_USHG_FT 747 MC 12 1 786 0.7216 1.02
2012_USHG_FT 747 MC 13 1 786 0.9083 1.10
2012_USHG_FT 747 MC 14 1 786 1.1322 0.95

Prepared for NYSED by Pearson 72
Test Form Type Item Max N-Count RID S1 S2 S3 S4 S5 S6 INFIT
2012_USHG_FT 747 MC 15 1 786 0.1044 0.84
2012_USHG_FT 747 MC 16 1 786 1.7046 1.04
2012_USHG_FT 747 MC 17 1 786 0.4906 0.89
2012_USHG_FT 747 MC 18 1 786 0.4228 0.99
2012_USHG_FT 747 MC 19 1 786 0.2787 1.08
2012_USHG_FT 747 MC 20 1 786 −1.0511 0.94
2012_USHG_FT 747 MC 21 1 786 0.2469 1.04
2012_USHG_FT 747 MC 22 1 786 1.7796 1.08
2012_USHG_FT 747 MC 23 1 786 −0.4137 0.80
2012_USHG_FT 747 MC 24 1 786 0.3543 0.91
2012_USHG_FT 747 MC 25 1 786 0.4845 0.95
2012_USHG_FT 747 MC 26 1 786 0.8722 1.09
2012_USHG_FT 747 MC 27 1 786 0.1306 0.97
2012_USHG_FT 747 MC 28 1 786 0.0780 0.89
2012_USHG_FT 747 MC 29 1 786 2.2891 1.16
2012_USHG_FT 747 MC 30 1 786 1.0411 0.88
2012_USHG_FT 747 MC 31 1 786 1.3294 1.05
2012_USHG_FT 747 MC 32 1 786 1.0835 1.05
2012_USHG_FT 748 ESS THM 5 953 3.5625 −3.8501 −1.7826 −0.7295 2.0746 4.2877 1.01
2012_USHG_FT 749 ESS THM 5 974 3.3334 −3.3082 −1.7352 −0.5593 2.4141 3.1886 1.10
2012_USHG_FT 750 ESS THM 5 978 3.5207 −3.8097 −1.8837 −0.4116 2.2620 3.8429 1.07
2012_USHG_FT 751 ESS THM 5 980 2.5173 −3.2171 −1.2741 0.9829 3.5084 1.10
2012_USHG_FT 752 ESS THM 5 979 3.4498 −4.1388 −1.6714 0.0990 2.4126 3.2986 1.01
2012_USHG_FT 753 ESS THM 5 976 3.2603 −3.7163 −1.6655 0.2568 2.6981 2.4269 1.10

Prepared for NYSED by Pearson 73
Test Form Type Item Max N-Count RID S1 S2 S3 S4 S5 S6 INFIT
2012_USHG_FT 754 ESS THM 5 980 1.0792 −1.9189 −1.1283 0.7804 2.2669 1.36
2012_USHG_FT 755 SCF 01 2 823 −0.4761 −0.5802 0.5802 1.16
2012_USHG_FT 755 SCF 02 1 823 −0.5629 0.93
2012_USHG_FT 755 SCF 03 2 823 0.3173 −0.5611 0.5611 1.14
2012_USHG_FT 755 SCF 04 1 823 0.1777 1.03
2012_USHG_FT 755 SCF 05 1 823 −0.1764 0.94
2012_USHG_FT 755 SCF 06 2 823 −0.3159 −0.0438 0.0438 1.16
2012_USHG_FT 755 SCF 07 2 823 0.1190 −0.2100 0.2100 1.05
2012_USHG_FT 755 SCF 08 2 823 −0.1293 0.4773 −0.4773 1.03
2012_USHG_FT 755 SCF 09 1 823 −0.0541 0.94
2012_USHG_FT 755 ESS DBQ 5 823 2.8433 −2.5390 −1.6905 0.3533 3.3577 0.5185 1.02
2012_USHG_FT 756 SCF 01 2 815 −0.4584 0.0546 −0.0546 1.06
2012_USHG_FT 756 SCF 02 2 815 −0.7015 0.0910 −0.0910 1.03
2012_USHG_FT 756 SCF 03 1 815 −0.5849 0.98
2012_USHG_FT 756 SCF 04 1 815 −0.5003 0.95
2012_USHG_FT 756 SCF 05 1 815 −1.2379 0.95
2012_USHG_FT 756 SCF 6a 1 815 −0.8404 0.85
2012_USHG_FT 756 SCF 6b 1 815 −0.6284 0.93
2012_USHG_FT 756 SCF 07 1 815 0.2195 1.06
2012_USHG_FT 756 SCF 8a 1 815 −0.4672 0.88
2012_USHG_FT 756 SCF 8b 1 815 0.4923 0.99
2012_USHG_FT 756 SCF 9a 1 815 −0.0701 0.86
2012_USHG_FT 756 SCF 9b 1 815 0.6934 0.99
2012_USHG_FT 756 ESS DBQ 5 815 2.4288 −1.5164 −1.9030 0.1241 3.2953 1.20

Prepared for NYSED by Pearson 74
Test Form Type Item Max N-Count RID S1 S2 S3 S4 S5 S6 INFIT
2012_USHG_FT 757 SCF 01 2 817 −0.7527 0.7781 −0.7781 1.02
2012_USHG_FT 757 SCF 02 1 817 0.5156 0.95
2012_USHG_FT 757 SCF 3a 1 817 0.1723 0.92
2012_USHG_FT 757 SCF 3b 1 817 0.1525 1.09
2012_USHG_FT 757 SCF 04 1 817 1.1723 1.07
2012_USHG_FT 757 SCF 05 1 817 0.2636 0.97
2012_USHG_FT 757 SCF 06 2 817 −0.2536 0.4185 −0.4185 0.96
2012_USHG_FT 757 SCF 7a 2 817 −0.0503 1.0102 −1.0102 1.04
2012_USHG_FT 757 SCF 7b 1 817 1.3661 0.91
2012_USHG_FT 757 SCF 08 1 817 0.1855 0.96
2012_USHG_FT 757 SCF 09 1 817 0.6381 1.01
2012_USHG_FT 757 ESS DBQ 5 817 2.8563 −2.4558 −1.2600 1.1155 2.6003 1.08
2012_USHG_FT 758 SCF 01 2 807 0.5501 −1.0360 1.0360 1.16
2012_USHG_FT 758 SCF 02 1 807 0.0611 1.10
2012_USHG_FT 758 SCF 3a 1 807 −0.5915 0.99
2012_USHG_FT 758 SCF 3b 1 807 −0.3510 1.02
2012_USHG_FT 758 SCF 04 1 807 −0.4342 0.98
2012_USHG_FT 758 SCF 05 1 807 0.5755 0.95
2012_USHG_FT 758 SCF 06 1 807 −0.7800 0.97
2012_USHG_FT 758 SCF 7a 1 807 0.7293 1.02
2012_USHG_FT 758 SCF 7b 1 807 −0.0704 0.98
2012_USHG_FT 758 SCF 08 1 807 0.8873 1.01
2012_USHG_FT 758 SCF 09 1 807 −0.1003 0.92
2012_USHG_FT 758 ESS DBQ 5 807 2.6306 −2.3029 −0.9887 0.6485 2.6432 1.03

Prepared for NYSED by Pearson 75
Test Form Type Item Max N-Count RID S1 S2 S3 S4 S5 S6 INFIT
2012_USHG_FT 759 SCF 01 2 811 0.1340 −0.7881 0.7881 1.18
2012_USHG_FT 759 SCF 02 1 811 0.7665 1.10
2012_USHG_FT 759 SCF 3a 1 811 0.1503 0.92
2012_USHG_FT 759 SCF 3b 1 811 0.5674 1.04
2012_USHG_FT 759 SCF 04 2 811 0.3025 −0.7513 0.7513 0.97
2012_USHG_FT 759 SCF 05 1 811 0.1774 0.97
2012_USHG_FT 759 SCF 06 1 811 −0.1624 0.82
2012_USHG_FT 759 SCF 07 1 811 −0.5112 0.86
2012_USHG_FT 759 SCF 8a 1 811 −0.1849 0.84
2012_USHG_FT 759 SCF 8b 1 811 −0.3710 0.91
2012_USHG_FT 759 SCF 09 2 811 0.2312 −0.0888 0.0888 0.94
2012_USHG_FT 759 ESS DBQ 5 811 3.1355 −2.7368 −1.6515 0.0950 2.3101 1.9832 0.97

Prepared for NYSED by Pearson 76
Appendix C: DIF Statistics

Prepared for NYSED by Pearson 77
Form Item Item Type
MH Delta
MH Chi-Sq
Effect Size
DIF Category
Favored Group
731 01 MC −0.14 0.07 −0.03
731 02 MC 0.20 0.16 −0.01
731 03 MC 0.14 0.12 0.00
731 04 MC −0.05 0.01 0.00
731 05 MC −0.41 1.02 −0.03
731 06 MC 0.17 0.13 0.02
731 07 MC −0.12 0.10 0.00
731 08 MC 0.09 0.04 0.03
731 09 MC −0.17 0.17 −0.06
731 10 MC −0.02 0.00 −0.04
731 11 MC −0.67 1.68 −0.08
731 12 MC 0.07 0.02 0.04
731 13 MC 0.19 0.24 0.05
731 14 MC −0.30 0.32 −0.02
731 15 MC 0.20 0.20 0.06
731 16 MC 0.27 0.31 0.07
731 17 MC −0.74 2.12 −0.09
731 18 MC 0.70 1.36 0.08
731 19 MC 0.29 0.39 0.05
731 20 MC −1.40 11.49 −0.24 B M
731 21 MC 0.06 0.01 −0.03
731 22 MC 1.53 15.51 0.26 C F
731 23 MC −0.19 0.13 −0.03
731 24 MC −0.44 1.29 −0.07
Form Item Item Type
MH Delta
MH Chi-Sq
Effect Size
DIF Category
Favored Group
731 25 MC −0.43 1.19 −0.06
731 26 MC 0.21 0.26 0.02
731 27 MC 0.50 1.39 0.06
731 28 MC 0.16 0.14 0.02
731 29 MC 0.47 1.06 0.09
731 30 MC −0.35 0.55 −0.07
732 01 MC −1.44 6.18 −0.18 B M
732 02 MC −0.79 2.57 −0.12
732 03 MC −0.65 2.84 −0.10
732 04 MC 0.26 0.44 0.04
732 05 MC 0.08 0.01 0.00
732 06 MC 1.28 9.31 0.23 B F
732 07 MC 0.64 2.56 0.12
732 08 MC −0.52 1.67 −0.08
732 09 MC −0.39 1.13 −0.05
732 10 MC −0.25 0.37 −0.03
732 11 MC −0.04 0.01 0.00
732 12 MC 0.23 0.20 0.04
732 13 MC 0.25 0.42 0.06
732 14 MC −1.41 12.13 −0.23 B M
732 15 MC 0.05 0.02 0.01
732 16 MC −0.55 1.71 −0.08
732 17 MC −0.51 1.83 −0.12
732 18 MC −0.49 1.63 −0.09

Prepared for NYSED by Pearson 78
Form Item Item Type
MH Delta
MH Chi-Sq
Effect Size
DIF Category
Favored Group
732 19 MC −0.38 0.69 −0.05
732 20 MC 0.30 0.45 0.01
732 21 MC −0.05 0.01 −0.03
732 22 MC 0.64 2.17 0.09
732 23 MC −0.27 0.41 −0.05
732 24 MC 0.37 0.78 0.08
732 25 MC −0.05 0.01 −0.02
732 26 MC −0.24 0.32 −0.06
732 27 MC 0.21 0.23 0.03
732 28 MC −0.17 0.21 −0.05
732 29 MC 1.93 12.58 0.23 C F
732 30 MC 0.61 2.51 0.13
732 31 MC 1.29 9.27 0.21 B F
732 32 MC 0.46 1.23 0.08
733 01 MC −0.92 2.89 −0.09
733 02 MC −1.62 17.50 −0.25 C M
733 03 MC −0.42 1.10 −0.05
733 04 MC −0.40 0.95 −0.05
733 05 MC −0.23 0.28 −0.03
733 06 MC 0.23 0.26 0.00
733 07 MC 0.25 0.39 0.04
733 08 MC 0.00 0.00 0.01
733 09 MC −1.70 19.11 −0.28 C M
733 10 MC 0.82 4.73 0.14
Form Item Item Type
MH Delta
MH Chi-Sq
Effect Size
DIF Category
Favored Group
733 11 MC −0.82 4.44 −0.14
733 12 MC 0.11 0.06 0.01
733 13 MC 1.04 6.67 0.17 B F
733 14 MC 0.01 0.00 0.00
733 15 MC 0.08 0.03 0.01
733 16 MC 0.01 0.00 0.00
733 17 MC −0.44 1.20 −0.09
733 18 MC 1.05 6.99 0.17 B F
733 19 MC 0.62 1.56 0.09
733 20 MC 0.48 1.66 0.07
733 21 MC 0.56 2.02 0.08
733 22 MC 0.10 0.07 0.05
733 23 MC −0.41 1.08 −0.05
733 24 MC −0.14 0.14 −0.01
733 25 MC 2.21 21.69 0.32 C F
733 26 MC 0.42 1.11 0.05
733 27 MC 0.45 1.28 0.07
733 28 MC 0.10 0.05 0.06
733 29 MC 0.04 0.01 −0.01
733 30 MC 0.22 0.29 0.03
733 31 MC 0.40 0.91 0.06
733 32 MC −1.50 13.10 −0.27 B M
734 01 MC −0.82 4.51 −0.15
734 02 MC −0.48 1.50 −0.07

Prepared for NYSED by Pearson 79
Form Item Item Type
MH Delta
MH Chi-Sq
Effect Size
DIF Category
Favored Group
734 03 MC 0.79 4.48 0.16
734 04 MC 0.41 0.95 0.07
734 05 MC −0.16 0.15 −0.04
734 06 MC −0.04 0.01 0.01
734 07 MC 0.06 0.02 0.02
734 08 MC 0.21 0.19 0.03
734 09 MC 0.25 0.41 0.03
734 10 MC 0.14 0.15 0.03
734 11 MC −0.74 3.54 −0.14
734 12 MC −0.20 0.29 −0.02
734 13 MC −0.24 0.26 −0.02
734 14 MC 0.04 0.01 0.01
734 15 MC −0.54 1.43 −0.08
734 16 MC −0.15 0.14 −0.02
734 17 MC −1.29 10.27 −0.25 B M
734 18 MC −0.71 3.07 −0.11
734 19 MC 1.05 7.93 0.20 B F
734 20 MC 0.89 3.68 0.14
734 21 MC 0.00 0.00 −0.02
734 22 MC 0.04 0.01 0.00
734 23 MC −0.03 0.01 −0.01
734 24 MC 0.46 1.36 0.08
734 25 MC −0.81 4.15 −0.16
734 26 MC 0.59 1.34 0.05
Form Item Item Type
MH Delta
MH Chi-Sq
Effect Size
DIF Category
Favored Group
734 27 MC 0.38 1.02 0.09
734 28 MC 1.32 6.26 0.17 B F
734 29 MC −0.02 0.00 −0.01
734 30 MC 0.87 4.45 0.12
734 31 MC −0.07 0.03 −0.01
734 32 MC −0.59 1.82 −0.11
735 01 MC −0.51 1.62 −0.08
735 02 MC −0.32 0.69 −0.08
735 03 MC 0.88 2.60 0.14
735 04 MC 0.57 1.39 0.07
735 05 MC 0.29 0.66 0.05
735 06 MC −0.44 1.05 −0.07
735 07 MC −0.39 0.94 −0.05
735 08 MC −0.50 1.73 −0.09
735 09 MC 1.13 6.64 0.18 B F
735 10 MC −0.98 4.83 −0.16
735 11 MC −1.67 17.09 −0.28 C M
735 12 MC 0.26 0.42 0.03
735 13 MC 0.22 0.18 0.03
735 14 MC −0.36 0.50 −0.05
735 15 MC 0.24 0.41 0.07
735 16 MC 0.33 0.53 0.06
735 17 MC 0.55 1.66 0.11
735 18 MC −0.96 6.70 −0.19

Prepared for NYSED by Pearson 80
Form Item Item Type
MH Delta
MH Chi-Sq
Effect Size
DIF Category
Favored Group
735 19 MC 0.72 1.62 0.06
735 20 MC 0.17 0.17 0.01
735 21 MC −0.26 0.41 −0.03
735 22 MC 0.92 4.60 0.14
735 23 MC −0.72 2.83 −0.13
735 24 MC 1.02 7.29 0.18 B F
735 25 MC −0.10 0.08 −0.02
735 26 MC −0.83 4.34 −0.15
735 27 MC 1.58 10.49 0.19 C F
735 28 MC 0.05 0.02 0.02
735 29 MC 0.57 1.95 0.10
735 30 MC 0.34 0.74 0.07
735 31 MC 0.34 0.66 0.08
735 32 MC −0.43 1.29 −0.09
736 01 MC −1.06 4.11 −0.14 B M
736 02 MC −0.83 5.06 −0.18
736 03 MC −0.01 0.00 −0.02
736 04 MC −0.25 0.30 −0.04
736 05 MC 0.04 0.01 0.02
736 06 MC −0.49 1.63 −0.08
736 07 MC −0.12 0.08 −0.03
736 08 MC −0.50 1.18 −0.05
736 09 MC −0.21 0.31 −0.04
736 10 MC 0.10 0.06 0.02
Form Item Item Type
MH Delta
MH Chi-Sq
Effect Size
DIF Category
Favored Group
736 11 MC 0.27 0.52 0.03
736 12 MC −0.11 0.06 −0.01
736 13 MC 0.36 0.83 0.05
736 14 MC −0.90 3.71 −0.11
736 15 MC −1.26 7.48 −0.17 B M
736 16 MC −0.30 0.63 −0.07
736 17 MC 0.04 0.01 0.01
736 18 MC −0.11 0.09 −0.03
736 19 MC 0.67 2.28 0.09
736 20 MC −0.09 0.05 −0.02
736 21 MC −0.79 3.57 −0.10
736 22 MC 0.09 0.05 0.02
736 23 MC −0.04 0.01 0.00
736 24 MC −0.02 0.00 0.00
736 25 MC 0.90 5.33 0.16
736 26 MC −0.28 0.58 −0.06
736 27 MC 0.24 0.32 0.04
736 28 MC 2.22 18.73 0.26 C F
736 29 MC 0.93 3.89 0.13
736 30 MC 0.11 0.07 0.01
736 31 MC 1.02 5.63 0.15 B F
736 32 MC 0.85 3.94 0.12
737 01 MC −1.10 9.43 −0.22 B M
737 02 MC −0.40 1.11 −0.07

Prepared for NYSED by Pearson 81
Form Item Item Type
MH Delta
MH Chi-Sq
Effect Size
DIF Category
Favored Group
737 03 MC 0.23 0.29 0.06
737 04 MC −0.83 4.42 −0.14
737 05 MC −0.19 0.20 −0.03
737 06 MC 0.34 0.76 0.06
737 07 MC −0.72 2.70 −0.12
737 08 MC 0.30 0.31 0.03
737 09 MC 0.03 0.00 0.00
737 10 MC −0.08 0.03 −0.04
737 11 MC −0.02 0.00 0.00
737 12 MC 0.08 0.03 0.00
737 13 MC −0.28 0.37 −0.03
737 14 MC −0.06 0.02 −0.03
737 15 MC 0.42 0.74 0.05
737 16 MC −0.76 2.30 −0.10
737 17 MC 0.68 2.98 0.14
737 18 MC −0.72 3.17 −0.13
737 19 MC 0.59 2.26 0.11
737 20 MC 0.31 0.45 0.03
737 21 MC 1.08 7.65 0.18 B F
737 22 MC 1.02 4.29 0.16 B F
737 23 MC 0.44 1.07 0.06
737 24 MC −0.06 0.02 0.00
737 25 MC 0.35 0.68 0.04
737 26 MC −0.49 1.33 −0.07
Form Item Item Type
MH Delta
MH Chi-Sq
Effect Size
DIF Category
Favored Group
737 27 MC −0.60 2.30 −0.11
737 28 MC −0.78 3.13 −0.09
737 29 MC 0.13 0.11 0.04
737 30 MC 0.64 2.57 0.13
737 31 MC 0.80 3.57 0.11
737 32 MC 0.06 0.03 0.01
738 01 MC −1.56 12.27 −0.26 C M
738 02 MC −0.57 2.50 −0.11
738 03 MC −0.10 0.04 0.02
738 04 MC 0.48 1.56 0.09
738 05 MC 0.45 1.29 0.07
738 06 MC −0.07 0.03 0.05
738 07 MC −1.26 9.30 −0.20 B M
738 08 MC −1.42 14.45 −0.27 B M
738 09 MC 0.91 4.40 0.12
738 10 MC 0.55 2.09 0.09
738 11 MC 0.49 1.59 0.07
738 12 MC 0.65 1.80 0.09
738 13 MC −0.50 1.75 −0.10
738 14 MC −1.54 15.47 −0.27 C M
738 15 MC −1.57 15.13 −0.28 C M
738 16 MC −0.55 1.69 −0.07
738 17 MC −0.70 1.77 −0.05
738 18 MC −1.01 3.33 −0.12

Prepared for NYSED by Pearson 82
Form Item Item Type
MH Delta
MH Chi-Sq
Effect Size
DIF Category
Favored Group
738 19 MC 0.19 0.19 0.00
738 20 MC 1.01 4.11 0.12 B F
738 21 MC −0.43 0.74 −0.06
738 22 MC −0.25 0.37 −0.05
738 23 MC 0.38 0.62 0.04
738 24 MC −0.42 1.32 −0.05
738 25 MC 0.57 1.23 0.07
738 26 MC 1.30 8.75 0.20 B F
738 27 MC 1.70 14.60 0.24 C F
738 28 MC 0.34 0.57 0.05
738 29 MC 0.84 4.40 0.15
738 30 MC 0.64 2.52 0.10
738 31 MC 1.79 20.56 0.30 C F
738 32 MC 0.22 0.33 0.03
739 01 MC −0.14 0.09 −0.04
739 02 MC −0.15 0.15 0.00
739 03 MC −0.36 0.96 −0.10
739 04 MC −0.51 1.70 −0.10
739 05 MC 1.23 10.26 0.27 B F
739 06 MC 0.12 0.08 −0.01
739 07 MC 0.01 0.00 0.01
739 08 MC −1.17 6.53 −0.16 B M
739 09 MC −0.14 0.13 0.02
739 10 MC 0.42 0.91 0.07
Form Item Item Type
MH Delta
MH Chi-Sq
Effect Size
DIF Category
Favored Group
739 11 MC 0.88 4.70 0.13
739 12 MC 0.66 1.88 0.11
739 13 MC −2.50 28.65 −0.40 C M
739 14 MC 1.44 5.77 0.11 B F
739 15 MC 0.04 0.01 0.02
739 16 MC 0.28 0.36 0.05
739 17 MC 0.90 3.49 0.12
739 18 MC 0.17 0.19 0.00
739 19 MC −1.03 6.38 −0.20 B M
739 20 MC −1.51 13.66 −0.25 C M
739 21 MC 1.35 9.14 0.21 B F
739 22 MC 0.19 0.17 −0.02
739 23 MC 0.21 0.23 0.05
739 24 MC 0.53 2.00 0.14
739 25 MC 0.71 3.00 0.11
739 26 MC 0.81 3.29 0.13
739 27 MC −0.31 0.61 −0.05
739 28 MC −1.73 15.90 −0.25 C M
739 29 MC 0.77 2.81 0.15
739 30 MC 0.00 0.00 0.02
739 31 MC −0.02 0.00 −0.02
739 32 MC −0.30 0.54 −0.09
740 01 MC −0.27 0.48 −0.04
740 02 MC −0.73 4.32 −0.16

Prepared for NYSED by Pearson 83
Form Item Item Type
MH Delta
MH Chi-Sq
Effect Size
DIF Category
Favored Group
740 03 MC −0.42 1.24 −0.09
740 04 MC 0.18 0.17 0.03
740 05 MC 0.84 4.30 0.14
740 06 MC 0.59 2.92 0.11
740 07 MC 0.83 4.17 0.16
740 08 MC −0.45 1.26 −0.07
740 09 MC −0.04 0.01 0.00
740 10 MC 0.84 3.06 0.13
740 11 MC −0.71 3.58 −0.11
740 12 MC −0.16 0.14 −0.01
740 13 MC 0.29 0.60 0.06
740 14 MC 0.47 1.41 0.09
740 15 MC −0.15 0.17 −0.04
740 16 MC −0.05 0.01 −0.02
740 17 MC 0.13 0.09 0.02
740 18 MC −0.53 1.58 −0.09
740 19 MC 0.72 3.76 0.13
740 20 MC −0.12 0.10 0.00
740 21 MC 0.89 4.42 0.16
740 22 MC −0.92 4.68 −0.13
740 23 MC 0.57 1.88 0.08
740 24 MC −0.29 0.53 −0.06
740 25 MC −1.39 12.14 −0.25 B M
740 26 MC −0.07 0.04 −0.03
Form Item Item Type
MH Delta
MH Chi-Sq
Effect Size
DIF Category
Favored Group
740 27 MC 0.09 0.05 0.00
740 28 MC 0.39 0.94 0.07
740 29 MC 1.09 4.36 0.11 B F
740 30 MC 1.14 7.40 0.17 B F
740 31 MC −0.73 3.03 −0.11
740 32 MC −1.26 9.41 −0.20 B M
741 01 MC −0.79 4.88 −0.16
741 02 MC −0.56 1.65 −0.09
741 03 MC 0.01 0.00 0.00
741 04 MC −0.29 0.65 −0.07
741 05 MC 0.07 0.03 0.00
741 06 MC 0.45 0.64 0.05
741 07 MC −0.39 1.07 −0.08
741 08 MC −0.03 0.01 0.00
741 09 MC −0.18 0.20 −0.04
741 10 MC 0.17 0.21 0.05
741 11 MC −1.23 8.82 −0.18 B M
741 12 MC 0.03 0.00 0.00
741 13 MC 0.42 0.40 0.01
741 14 MC 0.58 2.37 0.09
741 15 MC −0.25 0.42 −0.05
741 16 MC 0.90 2.94 0.11
741 17 MC 0.93 3.06 0.10
741 18 MC −0.94 4.31 −0.14

Prepared for NYSED by Pearson 84
Form Item Item Type
MH Delta
MH Chi-Sq
Effect Size
DIF Category
Favored Group
741 19 MC 1.16 4.68 0.14 B F
741 20 MC 0.32 0.51 0.05
741 21 MC 0.09 0.06 0.05
741 22 MC 0.15 0.11 0.01
741 23 MC −0.24 0.43 −0.07
741 24 MC 0.84 4.45 0.16
741 25 MC 1.41 12.65 0.24 B F
741 26 MC −0.63 2.34 −0.10
741 27 MC 0.09 0.05 0.03
741 28 MC 0.27 0.32 0.04
741 29 MC 0.40 1.06 0.05
741 30 MC −0.75 4.16 −0.14
741 31 MC 0.04 0.01 0.00
741 32 MC −0.18 0.20 −0.03
742 01 MC −0.44 0.50 −0.05
742 02 MC −0.84 5.04 −0.18
742 03 MC −0.20 0.26 −0.04
742 04 MC 0.17 0.15 0.03
742 05 MC 0.21 0.30 0.01
742 06 MC −1.03 7.59 −0.19 B M
742 07 MC −0.11 0.05 −0.01
742 08 MC 1.31 4.77 0.13 B F
742 09 MC 0.87 3.17 0.13
742 10 MC −0.10 0.06 −0.03
Form Item Item Type
MH Delta
MH Chi-Sq
Effect Size
DIF Category
Favored Group
742 11 MC 0.41 1.06 0.07
742 12 MC −0.41 0.99 −0.06
742 13 MC 1.09 6.69 0.19 B F
742 14 MC 1.27 6.47 0.17 B F
742 15 MC −0.45 1.30 −0.08
742 16 MC −0.02 0.00 0.00
742 17 MC 1.45 4.66 0.13 B F
742 18 MC −0.25 0.47 −0.04
742 19 MC 0.41 0.96 0.07
742 20 MC −0.87 5.25 −0.17
742 21 MC −0.23 0.31 −0.03
742 22 MC −1.34 10.76 −0.21 B M
742 23 MC 0.27 0.52 0.04
742 24 MC 0.72 4.04 0.15
742 25 MC 0.63 2.81 0.10
742 26 MC −0.35 0.67 −0.06
742 27 MC −0.48 1.64 −0.09
742 28 MC 0.14 0.14 0.03
742 29 MC 0.38 0.98 0.09
742 30 MC −0.70 2.63 −0.09
742 31 MC 0.00 0.00 0.02
742 32 MC 1.02 4.53 0.13 B F
743 01 MC 0.22 0.36 0.04
743 02 MC −0.09 0.05 −0.02

Prepared for NYSED by Pearson 85
Form Item Item Type
MH Delta
MH Chi-Sq
Effect Size
DIF Category
Favored Group
743 03 MC 0.43 1.16 0.10
743 04 MC 0.04 0.01 0.04
743 05 MC 0.74 4.01 0.14
743 06 MC 0.13 0.10 0.02
743 07 MC −0.17 0.19 −0.01
743 08 MC −0.26 0.43 −0.05
743 09 MC 0.49 1.71 0.11
743 10 MC 0.10 0.08 0.04
743 11 MC −0.23 0.37 −0.04
743 12 MC −0.53 1.76 −0.10
743 13 MC 0.06 0.02 0.04
743 14 MC 0.10 0.06 0.03
743 15 MC −1.33 10.35 −0.19 B M
743 16 MC 0.43 0.82 0.05
743 17 MC −1.48 10.70 −0.19 B M
743 18 MC −0.27 0.49 −0.05
743 19 MC −0.12 0.10 0.00
743 20 MC 0.18 0.21 0.03
743 21 MC −1.29 8.84 −0.20 B M
743 22 MC 0.68 3.10 0.11
743 23 MC 1.00 5.46 0.17
743 24 MC −0.47 1.53 −0.07
743 25 MC 0.35 0.83 0.07
743 26 MC 0.66 2.16 0.10
Form Item Item Type
MH Delta
MH Chi-Sq
Effect Size
DIF Category
Favored Group
743 27 MC 1.08 3.85 0.16
743 28 MC 0.21 0.22 0.04
743 29 MC 0.20 0.19 0.05
743 30 MC 0.14 0.13 0.04
743 31 MC 0.53 1.63 0.11
743 32 MC −1.11 9.44 −0.23 B M
744 01 MC −0.31 0.66 −0.06
744 02 MC 0.23 0.32 0.05
744 03 MC −0.21 0.25 −0.01
744 04 MC −0.56 1.41 −0.08
744 05 MC −0.27 0.32 −0.04
744 06 MC 0.59 2.19 0.11
744 07 MC −0.17 0.16 −0.03
744 08 MC 0.20 0.29 0.03
744 09 MC −0.15 0.13 −0.03
744 10 MC −0.34 0.90 −0.07
744 11 MC −0.24 0.36 −0.04
744 12 MC 0.80 4.28 0.13
744 13 MC −0.09 0.04 −0.02
744 14 MC −0.96 6.04 −0.16
744 15 MC 0.33 0.67 0.06
744 16 MC 0.25 0.40 0.05
744 17 MC 0.07 0.04 0.00
744 18 MC 0.46 0.75 0.05

Prepared for NYSED by Pearson 86
Form Item Item Type
MH Delta
MH Chi-Sq
Effect Size
DIF Category
Favored Group
744 19 MC −0.89 4.77 −0.13
744 20 MC −0.68 3.20 −0.12
744 21 MC −0.89 3.74 −0.11
744 22 MC 0.14 0.12 0.02
744 23 MC −0.69 3.11 −0.10
744 24 MC 0.42 1.02 0.08
744 25 MC 0.53 2.02 0.09
744 26 MC 0.62 2.96 0.10
744 27 MC −0.04 0.01 −0.01
744 28 MC 0.61 2.39 0.11
744 29 MC 0.28 0.59 0.04
744 30 MC −0.26 0.44 −0.03
744 31 MC 0.36 0.67 0.05
744 32 MC 0.51 1.52 0.07
745 01 MC −1.12 5.29 −0.16 B M
745 02 MC −0.99 5.32 −0.15
745 03 MC −0.20 0.07 −0.03
745 04 MC 0.17 0.20 0.03
745 05 MC 0.75 4.51 0.16
745 06 MC −0.13 0.12 −0.04
745 07 MC −0.73 3.67 −0.12
745 08 MC −0.53 1.99 −0.09
745 09 MC 0.36 0.84 0.04
745 10 MC 0.65 3.00 0.13
Form Item Item Type
MH Delta
MH Chi-Sq
Effect Size
DIF Category
Favored Group
745 11 MC −0.11 0.06 −0.02
745 12 MC −0.85 4.62 −0.15
745 13 MC 0.67 2.01 0.09
745 14 MC 0.48 1.55 0.09
745 15 MC −0.03 0.01 0.01
745 16 MC −0.03 0.01 −0.01
745 17 MC 0.26 0.35 0.04
745 18 MC −0.21 0.32 −0.03
745 19 MC −0.12 0.09 −0.02
745 20 MC −0.56 1.24 −0.07
745 21 MC 0.75 3.26 0.12
745 22 MC −0.86 3.02 −0.11
745 23 MC −1.29 10.50 −0.21 B M
745 24 MC 0.20 0.25 0.05
745 25 MC 0.88 4.41 0.13
745 26 MC 0.00 0.00 0.01
745 27 MC −0.83 3.86 −0.13
745 28 MC 0.25 0.38 0.03
745 29 MC 0.29 0.53 0.04
745 30 MC 0.34 0.74 0.06
745 31 MC 0.38 0.99 0.05
745 32 MC 1.04 7.71 0.20 B F
746 01 MC −0.54 0.68 −0.04
746 02 MC −0.45 1.49 −0.06

Prepared for NYSED by Pearson 87
Form Item Item Type
MH Delta
MH Chi-Sq
Effect Size
DIF Category
Favored Group
746 03 MC −1.24 10.73 −0.21 B M
746 04 MC 0.88 4.62 0.13
746 05 MC −0.93 5.62 −0.16
746 06 MC −0.39 0.98 −0.06
746 07 MC 1.15 9.04 0.23 B F
746 08 MC 0.01 0.00 0.00
746 09 MC −0.04 0.01 −0.02
746 10 MC −0.54 1.68 −0.07
746 11 MC −0.33 0.73 −0.04
746 12 MC −0.51 1.47 −0.06
746 13 MC 0.31 0.64 0.05
746 14 MC −0.25 0.41 −0.04
746 15 MC −0.73 2.44 −0.08
746 16 MC −0.46 1.28 −0.06
746 17 MC −0.11 0.06 0.01
746 18 MC 0.38 0.91 0.08
746 19 MC 0.21 0.22 0.05
746 20 MC 0.17 0.21 0.04
746 21 MC 1.32 12.23 0.26 B F
746 22 MC 0.07 0.03 0.03
746 23 MC 0.75 3.65 0.12
746 24 MC 0.22 0.29 0.06
746 25 MC 0.93 5.77 0.18
746 26 MC −0.23 0.31 −0.03
Form Item Item Type
MH Delta
MH Chi-Sq
Effect Size
DIF Category
Favored Group
746 27 MC 0.77 4.27 0.14
746 28 MC 0.20 0.26 0.05
746 29 MC −0.91 4.39 −0.11
746 30 MC −0.32 0.39 −0.03
746 31 MC −0.53 1.74 −0.07
746 32 MC 0.15 0.09 0.03
747 01 MC 0.07 0.01 0.00
747 02 MC 0.14 0.11 0.03
747 03 MC −0.73 3.11 −0.10
747 04 MC −0.01 0.00 0.02
747 05 MC −1.11 5.43 −0.16 B M
747 06 MC 0.63 2.30 0.12
747 07 MC −0.15 0.15 −0.02
747 08 MC 0.59 1.85 0.11
747 09 MC −0.28 0.54 −0.03
747 10 MC −0.21 0.28 −0.03
747 11 MC 0.35 0.82 0.07
747 12 MC 0.54 2.06 0.10
747 13 MC −0.94 6.90 −0.17
747 14 MC 0.02 0.00 0.02
747 15 MC 1.03 5.51 0.16 B F
747 16 MC 0.11 0.08 0.02
747 17 MC −0.69 2.81 −0.09
747 18 MC 0.59 2.40 0.12

Prepared for NYSED by Pearson 88
Form Item Item Type
MH Delta
MH Chi-Sq
Effect Size
DIF Category
Favored Group
747 19 MC −0.09 0.06 −0.01
747 20 MC 0.72 1.79 0.08
747 21 MC 0.37 0.93 0.08
747 22 MC 0.23 0.35 0.06
747 23 MC 1.39 7.69 0.17 B F
747 24 MC −0.36 0.78 −0.04
747 25 MC 0.60 2.47 0.13
747 26 MC 0.10 0.08 0.05
747 27 MC 0.14 0.11 0.03
747 28 MC 0.67 2.49 0.12
747 29 MC −1.20 8.09 −0.20 B M
747 30 MC −0.09 0.04 0.00
747 31 MC −1.12 8.36 −0.19 B M
747 32 MC −0.40 1.11 −0.08
748 THM OE 27.46 0.24 BB F
749 THM OE 4.02 0.09
750 THM OE 1.23 0.07
751 THM OE 18.28 0.23 BB F
752 THM OE 7.68 0.13
753 THM OE 5.78 0.11
754 THM OE 7.51 0.16
755 01 OE 4.37 0.12
755 02 OE 1.87 −0.09
755 03 OE 2.30 0.08
Form Item Item Type
MH Delta
MH Chi-Sq
Effect Size
DIF Category
Favored Group
755 04 OE 9.75 0.20 BB F
755 05 OE 7.84 0.22 BB F
755 06 OE 7.47 0.18 BB F
755 07 OE 12.74 0.23 BB F
755 08 OE 7.41 0.18 BB F
755 09 OE 1.15 0.15
755 DBQ OE 43.16 0.39 CC F
756 01 OE 3.65 0.15
756 02 OE 10.08 0.22 BB F
756 03 OE 8.81 0.21 BB F
756 04 OE 1.23 0.08
756 05 OE 2.79 0.13
756 6a OE 1.61 0.08
756 6b OE 9.43 0.21 BB F
756 07 OE 11.17 0.19 BB F
756 8a OE 7.39 0.15
756 8b OE 2.59 0.07
756 9a OE 4.50 0.14
756 9b OE 0.79 0.06
756 DBQ OE 29.47 0.32 CC F
757 01 OE 2.31 0.13
757 02 OE 5.17 0.15
757 3a OE 5.57 0.15
757 3b OE 3.03 0.13

Prepared for NYSED by Pearson 89
Form Item Item Type
MH Delta
MH Chi-Sq
Effect Size
DIF Category
Favored Group
757 04 OE 2.78 −0.13
757 05 OE 2.05 −0.10
757 06 OE 0.09 0.02
757 7a OE 1.53 0.09
757 7b OE 1.19 0.05
757 08 OE 0.34 0.02
757 09 OE 0.79 0.06
757 DBQ OE 28.03 0.33 CC F
758 01 OE 3.22 0.11
758 02 OE 14.02 0.27 CC F
758 3a OE 10.72 0.23 BB F
758 3b OE 5.69 0.20 BB F
758 04 OE 21.51 0.33 CC F
758 05 OE 4.15 0.13
758 06 OE 2.81 0.10
758 7a OE 0.00 0.00
758 7b OE 9.77 0.20 BB F
Form Item Item Type
MH Delta
MH Chi-Sq
Effect Size
DIF Category
Favored Group
758 08 OE 7.53 0.19 BB F
758 09 OE 13.90 0.26 CC F
758 DBQ OE 25.87 0.29 CC F
759 01 OE 1.21 0.07
759 02 OE 2.70 0.12
759 3a OE 9.04 0.18 BB F
759 3b OE 1.66 0.09
759 04 OE 3.96 0.16
759 05 OE 5.80 0.18 BB F
759 06 OE 9.61 0.19 BB F
759 07 OE 0.21 0.03
759 8a OE 2.57 0.10
759 8b OE 7.29 0.20 BB F
759 09 OE 2.25 0.12
759 DBQ OE 38.00 0.39 CC F
*DIF Category meanings: A/AA = negligible, B/BB = moderate, C/CC = large

Prepared for NYSED by Pearson 90

Prepared for NYSED by Pearson 91
Appendix D: Operational Test Maps

Prepared for NYSED by Pearson 92
January 2012
Position Item Type
Max Points Weight Mean Point-
Biserial Rasch S1 S2 S3 S4 S5 S6
1 MC 1 1 0.80 0.36 −0.82
2 MC 1 1 0.69 0.31 −0.14
3 MC 1 1 0.67 0.49 0.11
4 MC 1 1 0.65 0.42 0.05
5 MC 1 1 0.68 0.49 −0.10
6 MC 1 1 0.52 0.47 0.70
7 MC 1 1 0.66 0.34 −0.01
8 MC 1 1 0.68 0.41 −0.09
9 MC 1 1 0.58 0.46 0.43
10 MC 1 1 0.75 0.50 −0.49
11 MC 1 1 0.60 0.39 0.33
12 MC 1 1 0.46 0.46 1.00
13 MC 1 1 0.61 0.52 0.29
14 MC 1 1 0.68 0.50 −0.13
15 MC 1 1 0.70 0.48 −0.21
16 MC 1 1 0.79 0.29 −0.73
17 MC 1 1 0.43 0.46 1.17
18 MC 1 1 0.62 0.57 0.24
19 MC 1 1 0.72 0.49 −0.33
20 MC 1 1 0.51 0.48 0.77
21 MC 1 1 0.58 0.40 0.41
22 MC 1 1 0.51 0.48 0.77

Prepared for NYSED by Pearson 93
Position Item Type
Max Points Weight Mean Point-
Biserial Rasch S1 S2 S3 S4 S5 S6
23 MC 1 1 0.60 0.49 0.34
24 MC 1 1 0.52 0.38 0.70
25 MC 1 1 0.56 0.41 0.50
26 MC 1 1 0.73 0.53 −0.37
27 MC 1 1 0.55 0.51 0.56
28 MC 1 1 0.50 0.45 0.82
29 MC 1 1 0.76 0.57 −0.59
30 MC 1 1 0.53 0.45 0.64
31 MC 1 1 0.61 0.40 0.26
32 MC 1 1 0.55 0.42 0.58
33 MC 1 1 0.68 0.46 −0.10
34 MC 1 1 0.64 0.45 0.08
35 MC 1 1 0.50 0.52 0.82
36 MC 1 1 0.63 0.51 0.14
37 MC 1 1 0.60 0.48 0.29
38 MC 1 1 0.65 0.45 0.02
39 MC 1 1 0.50 0.39 0.84
40 MC 1 1 0.59 0.54 0.37
41 MC 1 1 0.72 0.47 −0.35
42 MC 1 1 0.82 0.56 −0.96
43 MC 1 1 0.48 0.48 0.91
44 MC 1 1 0.82 0.37 −0.99
45 MC 1 1 0.73 0.47 −0.40

Prepared for NYSED by Pearson 94
Position Item Type
Max Points Weight Mean Point-
Biserial Rasch S1 S2 S3 S4 S5 S6
46 MC 1 1 0.55 0.45 0.59
47 MC 1 1 0.50 0.49 0.84
48 MC 1 1 0.73 0.51 −0.37
49 MC 1 1 0.75 0.50 −0.43
50 MC 1 1 0.63 0.49 0.14
ESS ESS 5 3 1.32 0.61 3.42 −3.10 −2.50 −0.50 6.10
1 SCF 2 1 1.51 0.45 −0.25 −0.61 0.61
2a SCF 1 1 0.91 0.39 −1.62
2b SCF 1 1 0.85 0.38 −0.98
3 SCF 1 1 0.81 0.39 −0.68
4 SCF 1 1 0.76 0.41 −0.30
5a SCF 1 1 0.46 0.46 1.30
5b SCF 1 1 0.73 0.49 −0.11
6a SCF 1 1 0.80 0.44 −0.59
6b SCF 1 1 0.71 0.46 −0.01
7a SCF 1 1 0.62 0.47 0.52
7b SCF 1 1 0.67 0.49 0.22
8 SCF 1 1 0.62 0.45 0.52
DBQ ESS 5 3 1.29 0.59 3.20 −2.17 −2.32 −0.72 5.21

Prepared for NYSED by Pearson 95
June 2012
Position Item Type
Max Points Weight Mean Point-
Biserial Rasch S1 S2 S3 S4 S5 S6
1 MC 1 1 0.59 0.37 0.36
2 MC 1 1 0.57 0.39 0.49
3 MC 1 1 0.45 0.35 1.06
4 MC 1 1 0.73 0.45 −0.39
5 MC 1 1 0.58 0.35 0.42
6 MC 1 1 0.50 0.43 0.84
7 MC 1 1 0.58 0.45 0.41
8 MC 1 1 0.70 0.52 −0.23
9 MC 1 1 0.49 0.43 0.88
10 MC 1 1 0.65 0.48 0.09
11 MC 1 1 0.56 0.30 0.53
12 MC 1 1 0.51 0.45 0.80
13 MC 1 1 0.54 0.56 0.62
14 MC 1 1 0.45 0.37 1.08
15 MC 1 1 0.64 0.47 0.13
16 MC 1 1 0.69 0.44 −0.14
17 MC 1 1 0.77 0.48 −0.62
18 MC 1 1 0.62 0.49 0.24
19 MC 1 1 0.67 0.54 −0.03
20 MC 1 1 0.63 0.51 0.16
21 MC 1 1 0.85 0.48 −1.24
22 MC 1 1 0.49 0.54 0.87

Prepared for NYSED by Pearson 96
Position Item Type
Max Points Weight Mean Point-
Biserial Rasch S1 S2 S3 S4 S5 S6
23 MC 1 1 0.51 0.40 0.98
24 MC 1 1 0.82 0.56 −1.01
25 MC 1 1 0.47 0.53 0.99
26 MC 1 1 0.51 0.37 0.77
27 MC 1 1 0.50 0.32 0.80
28 MC 1 1 0.54 0.48 0.61
29 MC 1 1 0.58 0.40 0.43
30 MC 1 1 0.64 0.49 0.11
31 MC 1 1 0.57 0.40 0.47
32 MC 1 1 0.64 0.42 0.11
33 MC 1 1 0.65 0.49 0.08
34 MC 1 1 0.80 0.40 −0.78
35 MC 1 1 0.62 0.50 0.25
36 MC 1 1 0.59 0.51 0.36
37 MC 1 1 0.65 0.55 0.07
38 MC 1 1 0.65 0.50 0.07
39 MC 1 1 0.47 0.51 0.95
40 MC 1 1 0.75 0.33 −0.36
41 MC 1 1 0.42 0.32 1.22
42 MC 1 1 0.83 0.49 −1.01
43 MC 1 1 0.66 0.45 0.02
44 MC 1 1 0.48 0.44 0.90
45 MC 1 1 0.63 0.51 0.19

Prepared for NYSED by Pearson 97
Position Item Type
Max Points Weight Mean Point-
Biserial Rasch S1 S2 S3 S4 S5 S6
46 MC 1 1 0.66 0.43 0.05
47 MC 1 1 0.57 0.51 0.49
48 MC 1 1 0.65 0.53 0.09
49 MC 1 1 0.57 0.50 0.47
50 MC 1 1 0.58 0.50 0.42
51 ESS 5 3 1.34 0.59 1.51 −1.73 −0.28 2.00
52 SCF 1 1 0.92 0.31 −1.74
53 SCF 1 1 0.92 0.33 −1.85
54 SCF 1 1 0.87 0.38 −1.24
55 SCF 2 1 1.60 0.48 −0.31 0.23 −0.23
56 SCF 1 1 0.88 0.41 −1.30
57 SCF 1 1 0.90 0.43 −1.50
58 SCF 1 1 0.83 0.43 −0.81
59 SCF 1 1 0.80 0.47 −0.59
60 SCF 1 1 0.62 0.40 0.47
61 SCF 1 1 0.77 0.45 −0.38
62 SCF 2 1 1.61 0.52 −0.28 0.61 −0.61
63 SCF 1 1 0.72 0.47 −0.10
64 DBQ 5 3 1.15 0.56 1.93 −0.74 −1.19 1.94

Prepared for NYSED by Pearson 98
August 2012
Position Item Type
Max Points Weight Mean Point-
Biserial Rasch S1 S2 S3 S4 S5 S6
1 MC 1 1 0.70 0.51 −0.17
2 MC 1 1 0.84 0.20 −1.08
3 MC 1 1 0.78 0.32 −0.71
4 MC 1 1 0.67 0.40 −0.04
5 MC 1 1 0.80 0.51 −0.84
6 MC 1 1 0.62 0.53 0.22
7 MC 1 1 0.66 0.53 0.00
8 MC 1 1 0.83 0.52 −1.05
9 MC 1 1 0.70 0.41 −0.18
10 MC 1 1 0.72 0.40 −0.32
11 MC 1 1 0.81 0.45 −0.92
12 MC 1 1 0.55 0.47 0.58
13 MC 1 1 0.57 0.54 0.48
14 MC 1 1 0.48 0.48 0.94
15 MC 1 1 0.76 0.51 −0.60
16 MC 1 1 0.73 0.47 −0.39
17 MC 1 1 0.69 0.48 −0.11
18 MC 1 1 0.50 0.51 0.87
19 MC 1 1 0.52 0.46 0.75
20 MC 1 1 0.46 0.47 1.03
21 MC 1 1 0.63 0.58 0.21
22 MC 1 1 0.68 0.52 −0.08

Prepared for NYSED by Pearson 99
Position Item Type
Max Points Weight Mean Point-
Biserial Rasch S1 S2 S3 S4 S5 S6
23 MC 1 1 0.66 0.57 0.01
24 MC 1 1 0.64 0.48 0.12
25 MC 1 1 0.61 0.41 0.31
26 MC 1 1 0.79 0.46 −0.75
27 MC 1 1 0.64 0.47 0.13
28 MC 1 1 0.64 0.43 0.13
29 MC 1 1 0.83 0.44 −1.06
30 MC 1 1 0.66 0.50 0.04
31 MC 1 1 0.81 0.53 −0.89
32 MC 1 1 0.73 0.45 −0.39
33 MC 1 1 0.64 0.44 0.16
34 MC 1 1 0.71 0.40 −0.27
35 MC 1 1 0.66 0.60 0.04
36 MC 1 1 0.63 0.52 0.19
37 MC 1 1 0.51 0.41 0.81
38 MC 1 1 0.55 0.46 0.61
39 MC 1 1 0.68 0.54 −0.05
40 MC 1 1 0.67 0.54 −0.02
41 MC 1 1 0.65 0.49 0.11
42 MC 1 1 0.65 0.57 0.07
43 MC 1 1 0.62 0.54 0.26
44 MC 1 1 0.78 0.38 −0.66
45 MC 1 1 0.80 0.42 −0.85

Prepared for NYSED by Pearson 100
Position Item Type
Max Points Weight Mean Point-
Biserial Rasch S1 S2 S3 S4 S5 S6
46 MC 1 1 0.72 0.50 −0.31
47 MC 1 1 0.76 0.52 −0.56
48 MC 1 1 0.64 0.66 0.16
49 MC 1 1 0.49 0.49 0.91
50 MC 1 1 0.49 0.36 0.91
51 ESS 5 3 1.35 0.56 2.70 −2.57 −1.65 −0.67 4.88
52 SCF 2 1 0.94 0.56 0.89 −0.39 0.39
53 SCF 1 1 0.55 0.55 0.49
54 SCF 1 1 0.56 0.48 0.45
55 SCF 1 1 0.54 0.54 0.53
56 SCF 1 1 0.59 0.50 0.27
57 SCF 1 1 0.64 0.55 0.04
58 SCF 1 1 0.42 0.57 1.15
59 SCF 2 1 0.96 0.64 0.83 −0.15 0.15
60 SCF 1 1 0.50 0.49 0.73
61 SCF 1 1 0.59 0.60 0.29
62 SCF 1 1 0.48 0.55 0.84
63 SCF 1 1 0.47 0.61 0.90
64 ESS 5 3 0.97 0.62 3.12 −1.92 −2.25 −0.16 4.11 0.22

Prepared for NYSED by Pearson 101
Appendix E: Scoring Tables

Prepared for NYSED by Pearson 102
January 2012
Raw Score Ability Scale
Score 0 −5.485 0.000 1 −4.266 0.923 2 −3.552 1.868 3 −3.126 2.767 4 −2.818 3.779 5 −2.574 4.743 6 −2.371 5.769 7 −2.196 6.789 8 −2.041 7.845 9 −1.903 8.956
10 −1.776 10.069 11 −1.660 11.220 12 −1.552 12.382 13 −1.451 13.537 14 −1.355 14.791 15 −1.265 16.054 16 −1.179 17.315 17 −1.097 18.626 18 −1.018 19.941 19 −0.942 21.259 20 −0.868 22.565 21 −0.797 23.929 22 −0.728 25.350 23 −0.661 26.709
Raw Score Ability Scale
Score 24 −0.596 28.075 25 −0.532 29.497 26 −0.469 30.967 27 −0.408 32.419 28 −0.348 33.835 29 −0.289 35.315 30 −0.230 36.760 31 −0.173 38.239 32 −0.116 39.741 33 −0.060 41.187 34 −0.005 42.663 35 0.050 44.165 36 0.105 45.673 37 0.159 47.115 38 0.213 48.580 39 0.267 50.076 40 0.321 51.567 41 0.374 52.991 42 0.428 54.444 43 0.482 55.874 44 0.536 57.331 45 0.590 58.753 46 0.644 60.195 47 0.699 61.612
Raw Score Ability Scale
Score 48 0.754 62.991 49 0.809 64.367 50 0.866 65.749 51 0.922 67.121 52 0.980 68.441 53 1.039 69.759 54 1.098 71.084 55 1.159 72.359 56 1.221 73.630 57 1.285 74.904 58 1.350 76.132 59 1.416 77.303 60 1.485 78.479 61 1.556 79.653 62 1.628 80.838 63 1.704 81.991 64 1.782 83.075 65 1.864 84.170 66 1.949 85.244 67 2.037 86.270 68 2.130 87.367 69 2.227 88.372 70 2.329 89.324 71 2.437 90.303
Raw Score Ability Scale
Score 72 2.550 91.317 73 2.669 92.293 74 2.795 93.276 75 2.927 94.194 76 3.064 95.162 77 3.207 96.069 78 3.354 96.983 79 3.504 97.770 80 3.656 98.240 81 3.809 98.514 82 3.964 98.692 83 4.120 98.929 84 4.279 99.067 85 4.443 99.207 86 4.616 99.354 87 4.801 99.484 88 5.007 99.609 89 5.243 99.750 90 5.533 99.882 91 5.924 100.000 92 6.578 100.000 93 7.727 100.000

Prepared for NYSED by Pearson 103
June 2012
Raw Score Ability Scale
Score 0 −5.600 0.000 1 −4.377 0.787 2 −3.656 1.683 3 −3.224 2.474 4 −2.910 3.451 5 −2.661 4.341 6 −2.454 5.321 7 −2.274 6.304 8 −2.116 7.293 9 −1.974 8.364
10 −1.844 9.453 11 −1.725 10.543 12 −1.614 11.712 13 −1.511 12.820 14 −1.414 13.996 15 −1.321 15.269 16 −1.234 16.482 17 −1.150 17.761 18 −1.070 19.051 19 −0.993 20.353 20 −0.919 21.648 21 −0.848 22.935 22 −0.778 24.309 23 −0.711 25.709
Raw Score Ability Scale
Score 24 −0.645 27.018 25 −0.581 28.388 26 −0.519 29.791 27 −0.457 31.251 28 −0.397 32.666 29 −0.338 34.061 30 −0.280 35.534 31 −0.223 36.941 32 −0.166 38.417 33 −0.110 39.894 34 −0.055 41.315 35 0.000 42.784 36 0.054 44.268 37 0.108 45.763 38 0.162 47.186 39 0.216 48.645 40 0.269 50.131 41 0.323 51.613 42 0.376 53.029 43 0.429 54.479 44 0.483 55.901 45 0.537 57.357 46 0.591 58.777 47 0.645 60.219
Raw Score Ability Scale
Score 48 0.699 61.635 49 0.755 63.014 50 0.810 64.392 51 0.867 65.776 52 0.924 67.151 53 0.982 68.473 54 1.040 69.796 55 1.100 71.122 56 1.161 72.402 57 1.223 73.678 58 1.287 74.953 59 1.352 76.182 60 1.419 77.357 61 1.488 78.535 62 1.559 79.712 63 1.632 80.899 64 1.708 82.049 65 1.787 83.135 66 1.868 84.233 67 1.953 85.300 68 2.042 86.334 69 2.135 87.425 70 2.233 88.425 71 2.335 89.376
Raw Score Ability Scale
Score 72 2.443 90.355 73 2.556 91.370 74 2.675 92.339 75 2.801 93.319 76 2.932 94.233 77 3.070 95.200 78 3.212 96.100 79 3.359 97.011 80 3.508 97.787 81 3.660 98.247 82 3.813 98.517 83 3.967 98.697 84 4.122 98.933 85 4.281 99.068 86 4.445 99.209 87 4.617 99.355 88 4.803 99.485 89 5.008 99.610 90 5.245 99.751 91 5.534 99.882 92 5.926 100.000 93 6.580 100.000 94 7.729 100.000

Prepared for NYSED by Pearson 104
August 2012
Raw Score Ability Scale
Score 0 −5.479 0.000 1 −4.261 0.929 2 −3.548 1.875 3 −3.123 2.776 4 −2.815 3.787 5 −2.572 4.751 6 −2.370 5.775 7 −2.195 6.792 8 −2.041 7.845 9 −1.903 8.953
10 −1.777 10.063 11 −1.661 11.210 12 −1.553 12.370 13 −1.452 13.520 14 −1.357 14.769 15 −1.267 16.030 16 −1.181 17.285 17 −1.099 18.593 18 −1.020 19.903 19 −0.944 21.217 20 −0.871 22.520 21 −0.800 23.873 22 −0.731 25.288 23 −0.664 26.647
Raw Score Ability Scale
Score 24 −0.599 28.000 25 −0.535 29.414 26 −0.473 30.870 27 −0.412 32.318 28 −0.353 33.725 29 −0.294 35.184 30 −0.236 36.628 31 −0.179 38.080 32 −0.123 39.571 33 −0.067 41.009 34 −0.012 42.459 35 0.042 43.942 36 0.096 45.427 37 0.150 46.868 38 0.203 48.295 39 0.256 49.767 40 0.309 51.233 41 0.362 52.658 42 0.414 54.059 43 0.467 55.487 44 0.520 56.886 45 0.572 58.316 46 0.625 59.692 47 0.679 61.118
Raw Score Ability Scale
Score 48 0.732 62.460 49 0.787 63.809 50 0.841 65.151 51 0.896 66.504 52 0.952 67.829 53 1.009 69.078 54 1.067 70.399 55 1.125 71.654 56 1.185 72.891 57 1.246 74.133 58 1.308 75.369 59 1.372 76.530 60 1.438 77.675 61 1.505 78.818 62 1.575 79.967 63 1.646 81.122 64 1.721 82.225 65 1.798 83.286 66 1.878 84.359 67 1.962 85.394 68 2.049 86.417 69 2.141 87.483 70 2.237 88.463 71 2.338 89.401
Raw Score Ability Scale
Score 72 2.444 90.368 73 2.556 91.372 74 2.675 92.333 75 2.799 93.308 76 2.930 94.217 77 3.067 95.180 78 3.209 96.080 79 3.355 96.990 80 3.505 97.773 81 3.657 98.240 82 3.810 98.515 83 3.964 98.692 84 4.120 98.929 85 4.279 99.067 86 4.443 99.207 87 4.615 99.354 88 4.801 99.484 89 5.006 99.609 90 5.243 99.750 91 5.533 99.882 92 5.924 100.000 93 6.578 100.000 94 7.727 100.000