Asphalt internal structure characterization with X-Ray computed tomography
7th Conference on Industrial Computed Tomography, Leuven, Belgium (iCT 2017)
1
New X-ray computed tomography methods for research and industry
Johann Kastner1, Christoph Heinzl1, Bernhard Plank1, Dietmar Salaberger1, Christian Gusenbauer1, Sascha Senck1
1University of Applied Sciences Upper Austria, Stelzhamerstrasse 23, 4600 Wels, Austria, e-mail: [email protected]
Abstract During the last years, a number of novel X-ray imaging and data processing methods have been developed. This work gives an
overview of some selected X-ray computed tomography (CT)-developments, which are relevant for research and industry:
1) Advanced CT-data processing and visualization methods: Only through processing, segmentation, evaluation and
visualization of CT data, insights of a sample can be facilitated and selected features can be extracted.
2) Quantitative CT: In the beginning of industrial CT images were generated mainly for visual inspection. Nowadays
software tools and methods are getting increasingly important to determine quantitative data from CT scans with
reasonable accuracy. These quantitative values can be 3D-geometry, lengths, diameters, distances, fiber orientations,
porosity values, parameters characterizing the 3D-microstructure, etc.
3) 4DCT or In-situ CT: Typical 4DCT and in-situ investigations include the thermo-mechanical behavior (tension,
compression, torsion at different temperatures) of materials, phase transitions, physical reactions (e.g. melting, sintering,
curing, diffusion...), chemical reactions, etc. CT is one of the most powerful methods for in-situ investigations of a
material since it generates the complete 3D information without, in most of the cases, affecting the system studied.
4) Phase contrast CT: X-ray computed tomography phase imaging methods can be classified into propagation based methods,
interferometric methods and other techniques. In this presentation, we discuss an interferometric method based on the
Talbot-Lau interferometer as well as propagation based phase contrast CT-methods.
5) Further trends: In addition we report on further trends and methods such as High resolution CT, XXL-CT / Robot-CT , In-
line CT/High speed CT, coupling of CT with material simulation, application of new X-ray sources and detectors (e.g.
photon counting detectors), application of multi-energy techniques, etc..
Keywords: X-ray computed tomography, grating interferometer, phase contrast, new CT-methods, quantitative CT.
1 Introduction The application areas of CT are diverse and extensive, since any material or component can be examined with CT. The major
application areas of CT in science and industry are non-destructive testing, 3D materials characterization and dimensional
measurements (metrology) [1-7]. The industrial CT-market is a steadily growing market but the full potential for industry is
not tapped yet. There are many useful applications which still have to be discovered. Rough estimates for the worldwide
industrial CT-market give values of 2000–3000 CT-systems for non-medical applications in 2016 [4]. Additional numbers are:
there are more than 30 CT-suppliers including small companies and big international enterprises and more than 10 CT-
software companies for industrial CT-applications [4].
This contribution aims to give an overview of some activities, trends and developments in the field of industrial X-ray
computed tomography. Some of the most important trends and advanced CT-methods for industrial applications are
summarized in Table 1. It is clear that Table 1 can summarize only some aspects since there are so many ongoing research
activities and developments.
Trend Method
Higher resolution Micro-, Sub-micro and Nano-CT with < (1 µm)³ voxel size and resolution
Extraction of quantitative data, CT as a
measurement tool
Quantitative CT, application of advanced image processing methods for CT
data including reconstruction, denoising, segmentation, feature extraction,
feature characterization, visualization, etc.
Observation of a process 4DCT/In-situ CT (mechanical loading, solidification, etc.)
New modalities of CT imaging Phase-contrast CT (Propagation based phase contrast CT, grating
interferometer CT, crystal interferometer CT and analyzer based imaging)
Scanning of bigger parts Robot-CT/XXL-CT
Higher speed In-line CT/High speed CT with an inspection of < 1-5 minutes per part
CT as a tool for materials science and
product development
Coupling of CT with material simulation and FEM (finite element method)
Elemental / Spectral imaging Application of multi-energy techniques, photon counting detectors, X-ray
fluorescence tomography, etc.
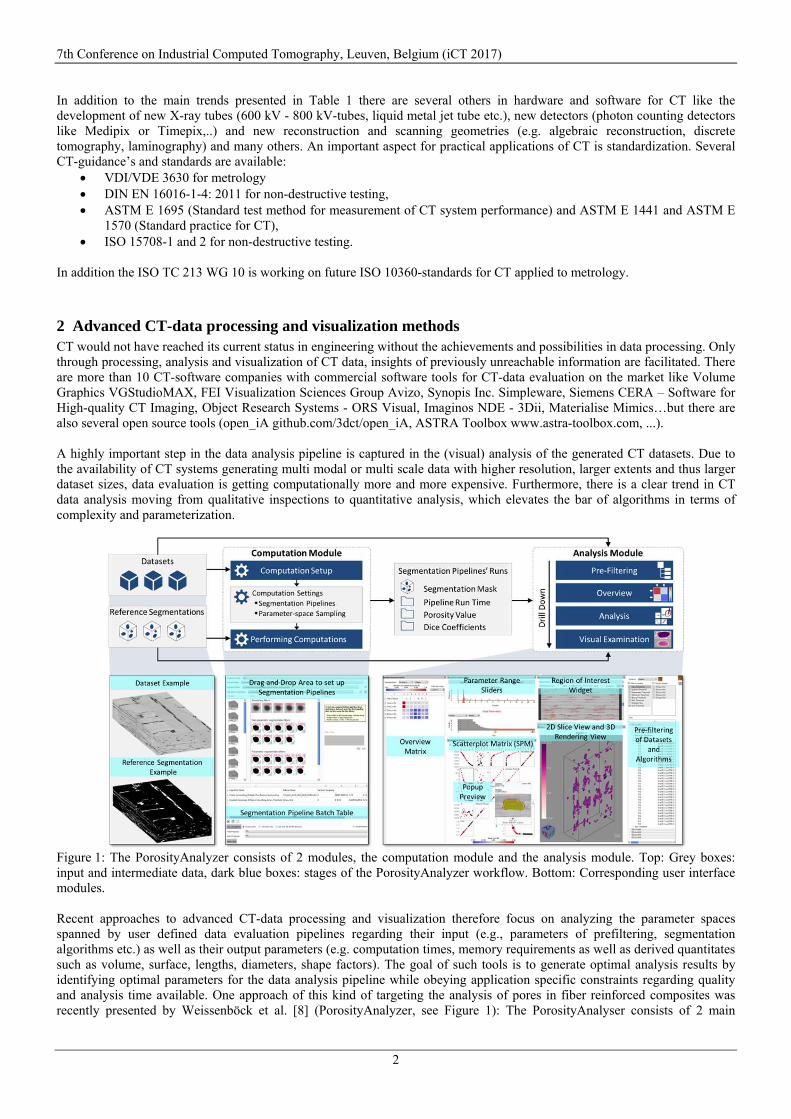
Table 1: Trends in industrial X-ray computed tomography.
Mor
e in
fo a
bout
this
art
icle
: ht
tp://
ww
w.n
dt.n
et/?
id=
2088
4
7th Conference on Industrial Computed Tomography, Leuven, Belgium (iCT 2017)
2
In addition to the main trends presented in Table 1 there are several others in hardware and software for CT like the
development of new X-ray tubes (600 kV - 800 kV-tubes, liquid metal jet tube etc.), new detectors (photon counting detectors
like Medipix or Timepix,..) and new reconstruction and scanning geometries (e.g. algebraic reconstruction, discrete
tomography, laminography) and many others. An important aspect for practical applications of CT is standardization. Several
CT-guidance’s and standards are available: VDI/VDE 3630 for metrology DIN EN 16016-1-4: 2011 for non-destructive testing, ASTM E 1695 (Standard test method for measurement of CT system performance) and ASTM E 1441 and ASTM E
1570 (Standard practice for CT), ISO 15708-1 and 2 for non-destructive testing.
In addition the ISO TC 213 WG 10 is working on future ISO 10360-standards for CT applied to metrology.
2 Advanced CT-data processing and visualization methods CT would not have reached its current status in engineering without the achievements and possibilities in data processing. Only
through processing, analysis and visualization of CT data, insights of previously unreachable information are facilitated. There
are more than 10 CT-software companies with commercial software tools for CT-data evaluation on the market like Volume
Graphics VGStudioMAX, FEI Visualization Sciences Group Avizo, Synopis Inc. Simpleware, Siemens CERA – Software for
High-quality CT Imaging, Object Research Systems - ORS Visual, Imaginos NDE - 3Dii, Materialise Mimics…but there are
also several open source tools (open_iA github.com/3dct/open_iA, ASTRA Toolbox www.astra-toolbox.com, ...).
A highly important step in the data analysis pipeline is captured in the (visual) analysis of the generated CT datasets. Due to
the availability of CT systems generating multi modal or multi scale data with higher resolution, larger extents and thus larger
dataset sizes, data evaluation is getting computationally more and more expensive. Furthermore, there is a clear trend in CT
data analysis moving from qualitative inspections to quantitative analysis, which elevates the bar of algorithms in terms of
complexity and parameterization.
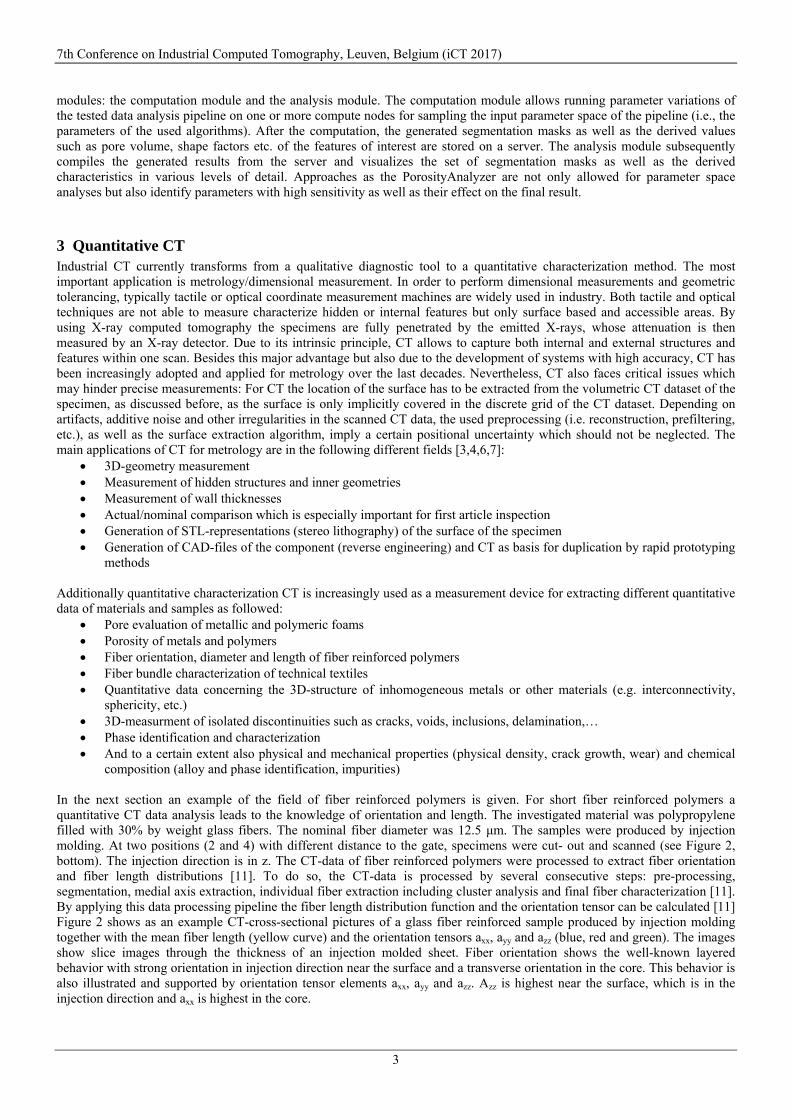
Figure 1: The PorosityAnalyzer consists of 2 modules, the computation module and the analysis module. Top: Grey boxes:
input and intermediate data, dark blue boxes: stages of the PorosityAnalyzer workflow. Bottom: Corresponding user interface
modules.
Recent approaches to advanced CT-data processing and visualization therefore focus on analyzing the parameter spaces
spanned by user defined data evaluation pipelines regarding their input (e.g., parameters of prefiltering, segmentation
algorithms etc.) as well as their output parameters (e.g. computation times, memory requirements as well as derived quantitates
such as volume, surface, lengths, diameters, shape factors). The goal of such tools is to generate optimal analysis results by
identifying optimal parameters for the data analysis pipeline while obeying application specific constraints regarding quality
and analysis time available. One approach of this kind of targeting the analysis of pores in fiber reinforced composites was
recently presented by Weissenböck et al. [8] (PorosityAnalyzer, see Figure 1): The PorosityAnalyser consists of 2 main
7th Conference on Industrial Computed Tomography, Leuven, Belgium (iCT 2017)
3
modules: the computation module and the analysis module. The computation module allows running parameter variations of
the tested data analysis pipeline on one or more compute nodes for sampling the input parameter space of the pipeline (i.e., the
parameters of the used algorithms). After the computation, the generated segmentation masks as well as the derived values
such as pore volume, shape factors etc. of the features of interest are stored on a server. The analysis module subsequently
compiles the generated results from the server and visualizes the set of segmentation masks as well as the derived
characteristics in various levels of detail. Approaches as the PorosityAnalyzer are not only allowed for parameter space
analyses but also identify parameters with high sensitivity as well as their effect on the final result.
3 Quantitative CT Industrial CT currently transforms from a qualitative diagnostic tool to a quantitative characterization method. The most
important application is metrology/dimensional measurement. In order to perform dimensional measurements and geometric
tolerancing, typically tactile or optical coordinate measurement machines are widely used in industry. Both tactile and optical
techniques are not able to measure characterize hidden or internal features but only surface based and accessible areas. By
using X-ray computed tomography the specimens are fully penetrated by the emitted X-rays, whose attenuation is then
measured by an X-ray detector. Due to its intrinsic principle, CT allows to capture both internal and external structures and
features within one scan. Besides this major advantage but also due to the development of systems with high accuracy, CT has
been increasingly adopted and applied for metrology over the last decades. Nevertheless, CT also faces critical issues which
may hinder precise measurements: For CT the location of the surface has to be extracted from the volumetric CT dataset of the
specimen, as discussed before, as the surface is only implicitly covered in the discrete grid of the CT dataset. Depending on
artifacts, additive noise and other irregularities in the scanned CT data, the used preprocessing (i.e. reconstruction, prefiltering,
etc.), as well as the surface extraction algorithm, imply a certain positional uncertainty which should not be neglected. The
main applications of CT for metrology are in the following different fields [3,4,6,7]: 3D-geometry measurement Measurement of hidden structures and inner geometries Measurement of wall thicknesses Actual/nominal comparison which is especially important for first article inspection Generation of STL-representations (stereo lithography) of the surface of the specimen Generation of CAD-files of the component (reverse engineering) and CT as basis for duplication by rapid prototyping
methods
Additionally quantitative characterization CT is increasingly used as a measurement device for extracting different quantitative
data of materials and samples as followed: Pore evaluation of metallic and polymeric foams Porosity of metals and polymers Fiber orientation, diameter and length of fiber reinforced polymers Fiber bundle characterization of technical textiles Quantitative data concerning the 3D-structure of inhomogeneous metals or other materials (e.g. interconnectivity,
sphericity, etc.) 3D-measurment of isolated discontinuities such as cracks, voids, inclusions, delamination,… Phase identification and characterization And to a certain extent also physical and mechanical properties (physical density, crack growth, wear) and chemical
composition (alloy and phase identification, impurities)
In the next section an example of the field of fiber reinforced polymers is given. For short fiber reinforced polymers a
quantitative CT data analysis leads to the knowledge of orientation and length. The investigated material was polypropylene
filled with 30% by weight glass fibers. The nominal fiber diameter was 12.5 μm. The samples were produced by injection
molding. At two positions (2 and 4) with different distance to the gate, specimens were cut- out and scanned (see Figure 2,
bottom). The injection direction is in z. The CT-data of fiber reinforced polymers were processed to extract fiber orientation
and fiber length distributions [11]. To do so, the CT-data is processed by several consecutive steps: pre-processing,
segmentation, medial axis extraction, individual fiber extraction including cluster analysis and final fiber characterization [11].
By applying this data processing pipeline the fiber length distribution function and the orientation tensor can be calculated [11]
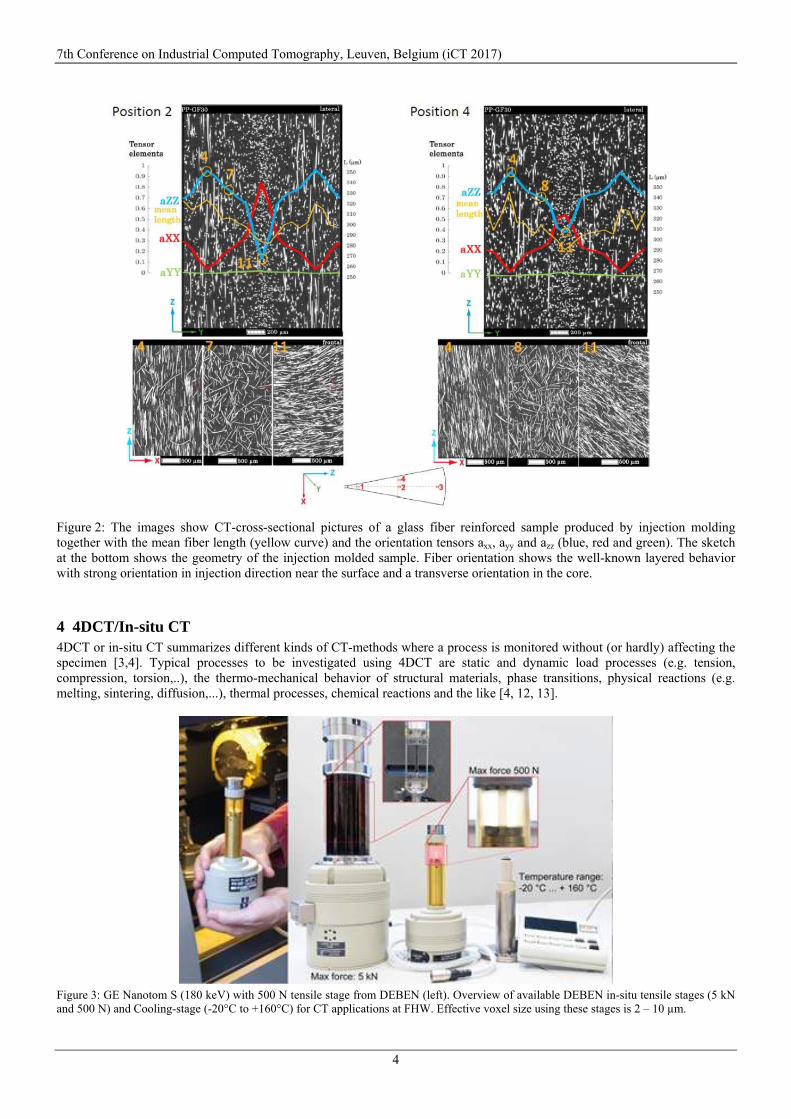
Figure 2 shows as an example CT-cross-sectional pictures of a glass fiber reinforced sample produced by injection molding
together with the mean fiber length (yellow curve) and the orientation tensors axx, ayy and azz (blue, red and green). The images
show slice images through the thickness of an injection molded sheet. Fiber orientation shows the well-known layered
behavior with strong orientation in injection direction near the surface and a transverse orientation in the core. This behavior is
also illustrated and supported by orientation tensor elements axx, ayy and azz. Azz is highest near the surface, which is in the
injection direction and axx is highest in the core.
7th Conference on Industrial Computed Tomography, Leuven, Belgium (iCT 2017)
4
Figure 2: The images show CT-cross-sectional pictures of a glass fiber reinforced sample produced by injection molding
together with the mean fiber length (yellow curve) and the orientation tensors axx, ayy and azz (blue, red and green). The sketch
at the bottom shows the geometry of the injection molded sample. Fiber orientation shows the well-known layered behavior
with strong orientation in injection direction near the surface and a transverse orientation in the core.
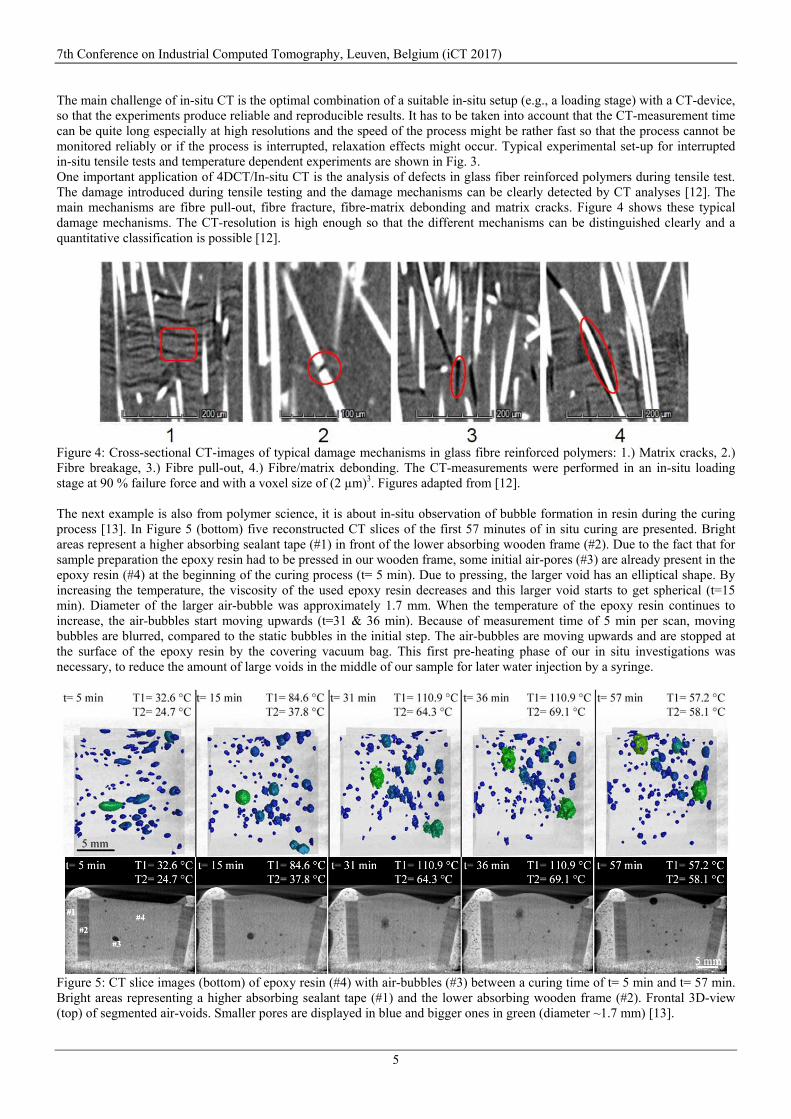
4 4DCT/In-situ CT 4DCT or in-situ CT summarizes different kinds of CT-methods where a process is monitored without (or hardly) affecting the
specimen [3,4]. Typical processes to be investigated using 4DCT are static and dynamic load processes (e.g. tension,
compression, torsion,..), the thermo-mechanical behavior of structural materials, phase transitions, physical reactions (e.g.
melting, sintering, diffusion,...), thermal processes, chemical reactions and the like [4, 12, 13].
Figure 3: GE Nanotom S (180 keV) with 500 N tensile stage from DEBEN (left). Overview of available DEBEN in-situ tensile stages (5 kN
and 500 N) and Cooling-stage (-20°C to +160°C) for CT applications at FHW. Effective voxel size using these stages is 2 – 10 µm.
7th Conference on Industrial Computed Tomography, Leuven, Belgium (iCT 2017)
5
The main challenge of in-situ CT is the optimal combination of a suitable in-situ setup (e.g., a loading stage) with a CT-device,
so that the experiments produce reliable and reproducible results. It has to be taken into account that the CT-measurement time
can be quite long especially at high resolutions and the speed of the process might be rather fast so that the process cannot be
monitored reliably or if the process is interrupted, relaxation effects might occur. Typical experimental set-up for interrupted
in-situ tensile tests and temperature dependent experiments are shown in Fig. 3.
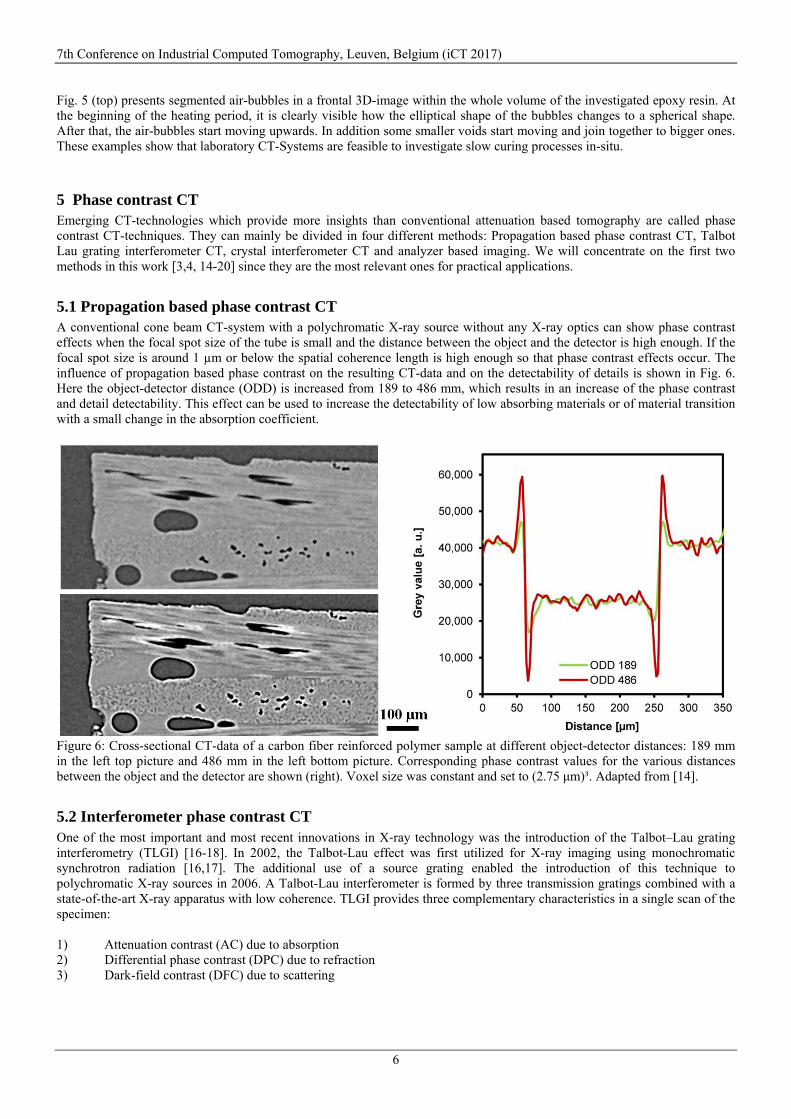
One important application of 4DCT/In-situ CT is the analysis of defects in glass fiber reinforced polymers during tensile test.
The damage introduced during tensile testing and the damage mechanisms can be clearly detected by CT analyses [12]. The
main mechanisms are fibre pull-out, fibre fracture, fibre-matrix debonding and matrix cracks. Figure 4 shows these typical
damage mechanisms. The CT-resolution is high enough so that the different mechanisms can be distinguished clearly and a
quantitative classification is possible [12].
Figure 4: Cross-sectional CT-images of typical damage mechanisms in glass fibre reinforced polymers: 1.) Matrix cracks, 2.)
Fibre breakage, 3.) Fibre pull-out, 4.) Fibre/matrix debonding. The CT-measurements were performed in an in-situ loading
stage at 90 % failure force and with a voxel size of (2 µm)3. Figures adapted from [12].
The next example is also from polymer science, it is about in-situ observation of bubble formation in resin during the curing
process [13]. In Figure 5 (bottom) five reconstructed CT slices of the first 57 minutes of in situ curing are presented. Bright
areas represent a higher absorbing sealant tape (#1) in front of the lower absorbing wooden frame (#2). Due to the fact that for
sample preparation the epoxy resin had to be pressed in our wooden frame, some initial air-pores (#3) are already present in the
epoxy resin (#4) at the beginning of the curing process (t= 5 min). Due to pressing, the larger void has an elliptical shape. By
increasing the temperature, the viscosity of the used epoxy resin decreases and this larger void starts to get spherical (t=15
min). Diameter of the larger air-bubble was approximately 1.7 mm. When the temperature of the epoxy resin continues to
increase, the air-bubbles start moving upwards (t=31 & 36 min). Because of measurement time of 5 min per scan, moving
bubbles are blurred, compared to the static bubbles in the initial step. The air-bubbles are moving upwards and are stopped at
the surface of the epoxy resin by the covering vacuum bag. This first pre-heating phase of our in situ investigations was
necessary, to reduce the amount of large voids in the middle of our sample for later water injection by a syringe.
Figure 5: CT slice images (bottom) of epoxy resin (#4) with air-bubbles (#3) between a curing time of t= 5 min and t= 57 min.
Bright areas representing a higher absorbing sealant tape (#1) and the lower absorbing wooden frame (#2). Frontal 3D-view
(top) of segmented air-voids. Smaller pores are displayed in blue and bigger ones in green (diameter ~1.7 mm) [13].
7th Conference on Industrial Computed Tomography, Leuven, Belgium (iCT 2017)
6
Fig. 5 (top) presents segmented air-bubbles in a frontal 3D-image within the whole volume of the investigated epoxy resin. At
the beginning of the heating period, it is clearly visible how the elliptical shape of the bubbles changes to a spherical shape.
After that, the air-bubbles start moving upwards. In addition some smaller voids start moving and join together to bigger ones.
These examples show that laboratory CT-Systems are feasible to investigate slow curing processes in-situ.
5 Phase contrast CT Emerging CT-technologies which provide more insights than conventional attenuation based tomography are called phase
contrast CT-techniques. They can mainly be divided in four different methods: Propagation based phase contrast CT, Talbot
Lau grating interferometer CT, crystal interferometer CT and analyzer based imaging. We will concentrate on the first two
methods in this work [3,4, 14-20] since they are the most relevant ones for practical applications.
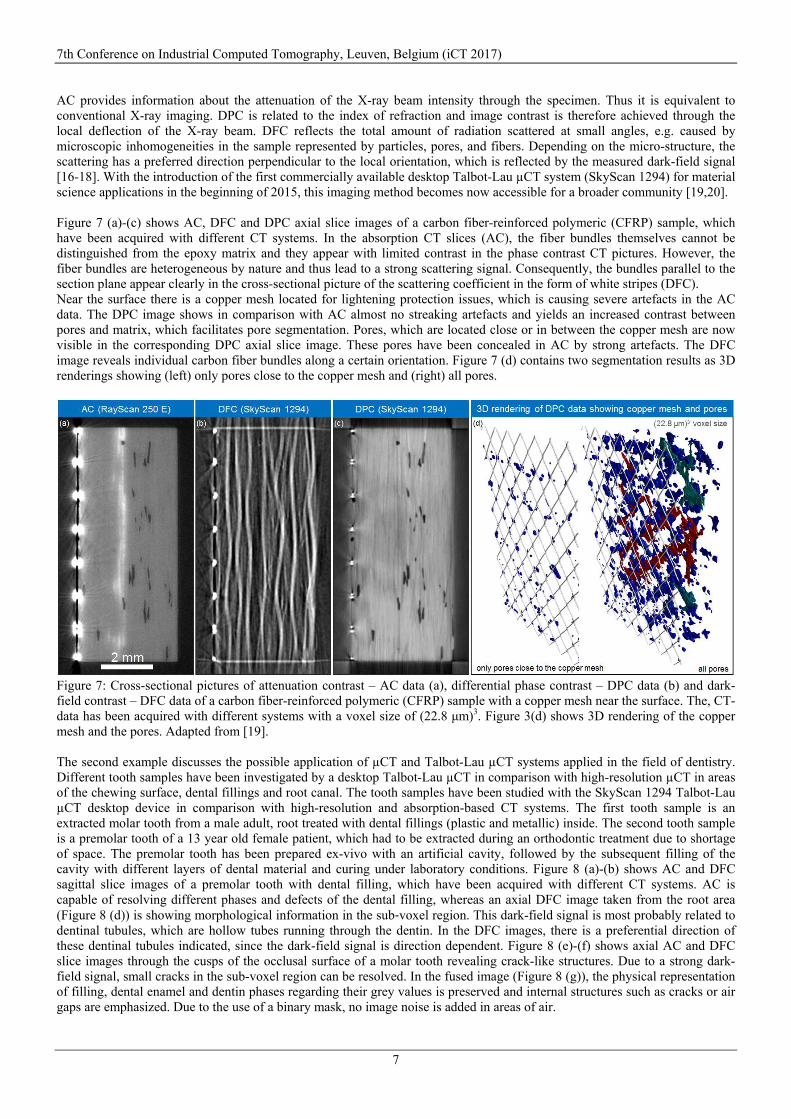
5.1 Propagation based phase contrast CT A conventional cone beam CT-system with a polychromatic X-ray source without any X-ray optics can show phase contrast
effects when the focal spot size of the tube is small and the distance between the object and the detector is high enough. If the
focal spot size is around 1 µm or below the spatial coherence length is high enough so that phase contrast effects occur. The
influence of propagation based phase contrast on the resulting CT-data and on the detectability of details is shown in Fig. 6.
Here the object-detector distance (ODD) is increased from 189 to 486 mm, which results in an increase of the phase contrast
and detail detectability. This effect can be used to increase the detectability of low absorbing materials or of material transition
with a small change in the absorption coefficient.
Figure 6: Cross-sectional CT-data of a carbon fiber reinforced polymer sample at different object-detector distances: 189 mm
in the left top picture and 486 mm in the left bottom picture. Corresponding phase contrast values for the various distances
between the object and the detector are shown (right). Voxel size was constant and set to (2.75 μm)³. Adapted from [14].
5.2 Interferometer phase contrast CT One of the most important and most recent innovations in X‐ray technology was the introduction of the Talbot–Lau grating
interferometry (TLGI) [16-18]. In 2002, the Talbot-Lau effect was first utilized for X-ray imaging using monochromatic
synchrotron radiation [16,17]. The additional use of a source grating enabled the introduction of this technique to
polychromatic X-ray sources in 2006. A Talbot-Lau interferometer is formed by three transmission gratings combined with a
state-of-the-art X-ray apparatus with low coherence. TLGI provides three complementary characteristics in a single scan of the
specimen:
1) Attenuation contrast (AC) due to absorption
2) Differential phase contrast (DPC) due to refraction
3) Dark-field contrast (DFC) due to scattering
7th Conference on Industrial Computed Tomography, Leuven, Belgium (iCT 2017)
7
AC provides information about the attenuation of the X-ray beam intensity through the specimen. Thus it is equivalent to
conventional X-ray imaging. DPC is related to the index of refraction and image contrast is therefore achieved through the
local deflection of the X-ray beam. DFC reflects the total amount of radiation scattered at small angles, e.g. caused by
microscopic inhomogeneities in the sample represented by particles, pores, and fibers. Depending on the micro-structure, the
scattering has a preferred direction perpendicular to the local orientation, which is reflected by the measured dark-field signal
[16-18]. With the introduction of the first commercially available desktop Talbot-Lau µCT system (SkyScan 1294) for material
science applications in the beginning of 2015, this imaging method becomes now accessible for a broader community [19,20].
Figure 7 (a)-(c) shows AC, DFC and DPC axial slice images of a carbon fiber-reinforced polymeric (CFRP) sample, which
have been acquired with different CT systems. In the absorption CT slices (AC), the fiber bundles themselves cannot be
distinguished from the epoxy matrix and they appear with limited contrast in the phase contrast CT pictures. However, the
fiber bundles are heterogeneous by nature and thus lead to a strong scattering signal. Consequently, the bundles parallel to the
section plane appear clearly in the cross-sectional picture of the scattering coefficient in the form of white stripes (DFC).
Near the surface there is a copper mesh located for lightening protection issues, which is causing severe artefacts in the AC
data. The DPC image shows in comparison with AC almost no streaking artefacts and yields an increased contrast between
pores and matrix, which facilitates pore segmentation. Pores, which are located close or in between the copper mesh are now
visible in the corresponding DPC axial slice image. These pores have been concealed in AC by strong artefacts. The DFC
image reveals individual carbon fiber bundles along a certain orientation. Figure 7 (d) contains two segmentation results as 3D
renderings showing (left) only pores close to the copper mesh and (right) all pores.
Figure 7: Cross-sectional pictures of attenuation contrast – AC data (a), differential phase contrast – DPC data (b) and dark-
field contrast – DFC data of a carbon fiber-reinforced polymeric (CFRP) sample with a copper mesh near the surface. The, CT-
data has been acquired with different systems with a voxel size of (22.8 μm)3. Figure 3(d) shows 3D rendering of the copper
mesh and the pores. Adapted from [19].
The second example discusses the possible application of µCT and Talbot-Lau µCT systems applied in the field of dentistry.
Different tooth samples have been investigated by a desktop Talbot-Lau µCT in comparison with high-resolution µCT in areas
of the chewing surface, dental fillings and root canal. The tooth samples have been studied with the SkyScan 1294 Talbot-Lau
µCT desktop device in comparison with high-resolution and absorption-based CT systems. The first tooth sample is an
extracted molar tooth from a male adult, root treated with dental fillings (plastic and metallic) inside. The second tooth sample
is a premolar tooth of a 13 year old female patient, which had to be extracted during an orthodontic treatment due to shortage
of space. The premolar tooth has been prepared ex-vivo with an artificial cavity, followed by the subsequent filling of the
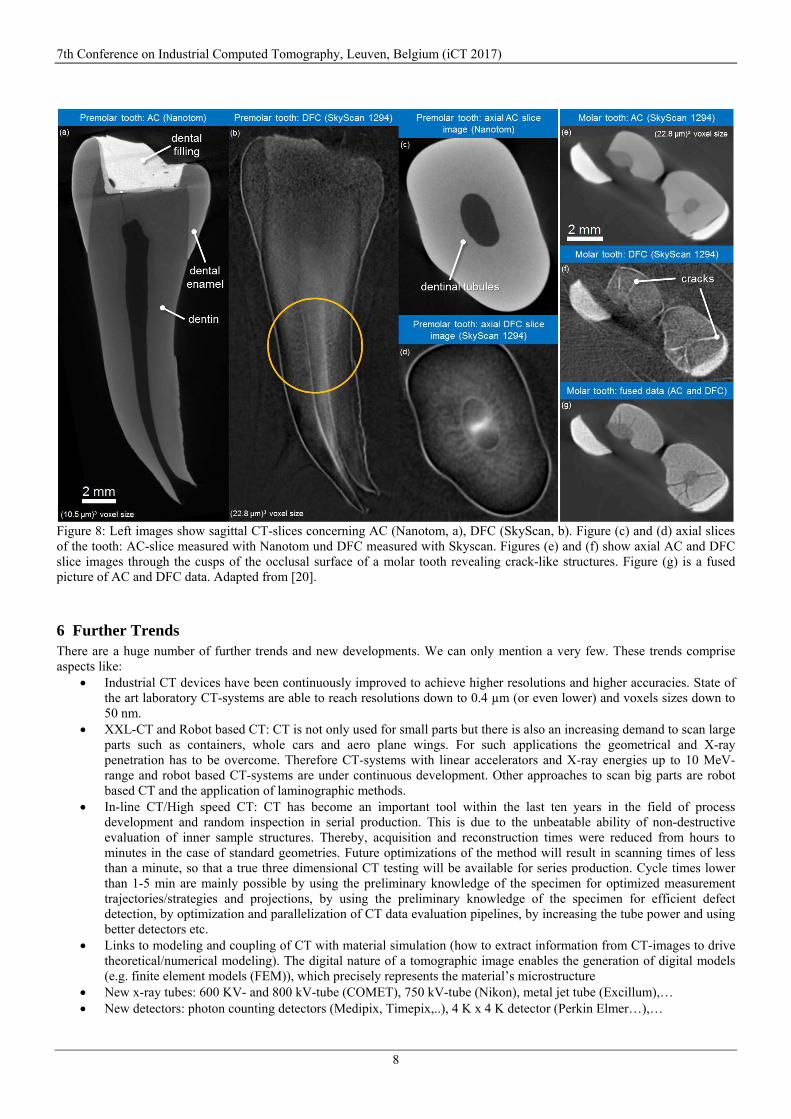
cavity with different layers of dental material and curing under laboratory conditions. Figure 8 (a)-(b) shows AC and DFC
sagittal slice images of a premolar tooth with dental filling, which have been acquired with different CT systems. AC is
capable of resolving different phases and defects of the dental filling, whereas an axial DFC image taken from the root area
(Figure 8 (d)) is showing morphological information in the sub‐voxel region. This dark-field signal is most probably related to
dentinal tubules, which are hollow tubes running through the dentin. In the DFC images, there is a preferential direction of
these dentinal tubules indicated, since the dark-field signal is direction dependent. Figure 8 (e)-(f) shows axial AC and DFC
slice images through the cusps of the occlusal surface of a molar tooth revealing crack-like structures. Due to a strong dark-
field signal, small cracks in the sub-voxel region can be resolved. In the fused image (Figure 8 (g)), the physical representation
of filling, dental enamel and dentin phases regarding their grey values is preserved and internal structures such as cracks or air
gaps are emphasized. Due to the use of a binary mask, no image noise is added in areas of air.
7th Conference on Industrial Computed Tomography, Leuven, Belgium (iCT 2017)
8
Figure 8: Left images show sagittal CT-slices concerning AC (Nanotom, a), DFC (SkyScan, b). Figure (c) and (d) axial slices
of the tooth: AC-slice measured with Nanotom und DFC measured with Skyscan. Figures (e) and (f) show axial AC and DFC
slice images through the cusps of the occlusal surface of a molar tooth revealing crack-like structures. Figure (g) is a fused
picture of AC and DFC data. Adapted from [20].
6 Further Trends There are a huge number of further trends and new developments. We can only mention a very few. These trends comprise
aspects like: Industrial CT devices have been continuously improved to achieve higher resolutions and higher accuracies. State of
the art laboratory CT-systems are able to reach resolutions down to 0.4 µm (or even lower) and voxels sizes down to
50 nm. XXL-CT and Robot based CT: CT is not only used for small parts but there is also an increasing demand to scan large
parts such as containers, whole cars and aero plane wings. For such applications the geometrical and X-ray
penetration has to be overcome. Therefore CT-systems with linear accelerators and X-ray energies up to 10 MeV-
range and robot based CT-systems are under continuous development. Other approaches to scan big parts are robot
based CT and the application of laminographic methods. In-line CT/High speed CT: CT has become an important tool within the last ten years in the field of process
development and random inspection in serial production. This is due to the unbeatable ability of non-destructive
evaluation of inner sample structures. Thereby, acquisition and reconstruction times were reduced from hours to
minutes in the case of standard geometries. Future optimizations of the method will result in scanning times of less
than a minute, so that a true three dimensional CT testing will be available for series production. Cycle times lower
than 1-5 min are mainly possible by using the preliminary knowledge of the specimen for optimized measurement
trajectories/strategies and projections, by using the preliminary knowledge of the specimen for efficient defect
detection, by optimization and parallelization of CT data evaluation pipelines, by increasing the tube power and using
better detectors etc. Links to modeling and coupling of CT with material simulation (how to extract information from CT-images to drive
theoretical/numerical modeling). The digital nature of a tomographic image enables the generation of digital models
(e.g. finite element models (FEM)), which precisely represents the material’s microstructure New x-ray tubes: 600 KV- and 800 kV-tube (COMET), 750 kV-tube (Nikon), metal jet tube (Excillum),… New detectors: photon counting detectors (Medipix, Timepix,..), 4 K x 4 K detector (Perkin Elmer…),…
7th Conference on Industrial Computed Tomography, Leuven, Belgium (iCT 2017)
9
Improved and new reconstruction algorithms and scanning strategies (e.g. algebraic reconstruction, statistical
reconstruction methods, discrete tomography, laminography, tomosynthesis) Improved and new methods for measurement artefact reduction Improved and new methods for more accurate CT-simulation Elemental CT and spectral imaging by application of multi-energy CT, K-Edge Imaging and X-ray fluorescence
tomography Multimodal Imaging by combination of X-ray CT with other imaging methods and many others.
Of course, new applications of CT in industry (non-destructive testing, 3D-material characterization and metrology) and
different fields like science, material application, fibrous materials, porous materials, crystalline materials, wood based
materials, paper, physics, engineering, geology, biology, medical engineering, paleontology, archeology, cultural heritage lead
to new questions and new developments in hardware and software.
7 Summary and Conclusions X-ray computed tomography is still an emerging technology with many applications which are not known yet. The main trends
are: Better resolution, better accuracy – more quantitative values, faster scanning, scanning of bigger parts, coupling of CT
with material simulation and better reconstruction, artefact reduction, simulation, image processing and visualization methods.
In this review we have reported on different aspects and trends of industrial CT with a main focus on the following aspects: Advanced CT-data processing and visualization methods Quantitative CT 4DCT or In-situ CT Phase contrast CT – Propagations based methods and Talbot Lau grating interferometer phase contrast CT
Summarizing, the industrial CT-market is a steadily growing market but the full potential for industry is not tapped yet. There
are many useful applications which still have to be discovered in the future. Some of these upcoming applications might be
treated by CT-technology which is already available and some will need a further progress in CT-technology.
Acknowledgements This work was supported by the K-Project for “non-destructive testing and tomography plus” (ZPT+) and by the COMET
program of FFG and the federal government of Upper Austria and Styria and supported by the project “multimodal and in-situ
characterization of inhomogeneous materials” (MiCi) by the federal government of Upper Austria and the European Regional
Development Fund (EFRE) in the framework of the EU-program IWB2020.
References [1.] J. Kastner (Editor), Proceedings Industrial CT-Conference iCT2012, Wels, Austria, 19.-20. September 2012, ISBN 978-
3-8322-9418-2, Shaker, Aachen (2012).
[2.] J. Kastner (Editor), Proceedings Industrial CT-Conference iCT2014, Wels, Austria, 25.-28. February 2014, ISBN-13:
978-3844025576, Shaker, Aachen (2014).
[3.] J. Kastner, B. Plank and C. Heinzl Advanced X-ray computed tomography methods: High resolution CT, quantitative
CT, 4DCT and phase contrast CT, Proceedings Industrial Radiology and Computed Tomography (DIR 2015), Ghent,
Belgium (2015)
[4.] J. Kastner (Editor), Case Studies in nondestructive testing and evaluation vol6/ B, pp1-131, Special Issue 6th conference
on industrial CT 2016 (iCT2016), Wels, Austria, 2016.
[5.] E. Maire and P. J. Withers, Quantitative X-ray tomography. International materials reviews vol 59, pp 1-43, 2014.
[6.] J.P. Kruth,M. Bartscher, S. Carmignato, R. Schmitt, L. De Chiffre, and A.Weckenmann, Computed tomography for
dimensional metrology. CIRP Annals-Manufacturing Technology vol 60, pp 821-842, 2011
[7.] L. De Chiffre, S. Carmignato, J.P., Kruth, R. Schmitt, and A.Weckenmann, Industrial applications of computed
tomography. CIRP Annals-Manufacturing Technology vol 63, pp 655-677, 2014.
[8.] J. Weissenböck, A. Amirkhanov, E. Gröller, J. Kastner, C. Heinzl:- PorosityAnalyzer: Visual Analysis and Evaluation
of Segmentation Pipelines to Determine the Porosity in Fiber-Reinforced Polymers, IEEE Conference on Visual
Analytics Science and Technology (IEEE VAST 2016), Baltimore, USA, pp 10-18, 2016.
[9.] J. Kastner, B. Harrer, G. Requena, O. Brunke, A comparative study of high resolution cone beam X-ray tomography
and synchrotron tomography applied to Fe- and Al-alloys, NDT&E International vol 43, pp 599-605, 2010.
[10.] J. Kastner, B. Harrer, and H.P. Degischer, High resolution cone beam X-ray computed tomography of 3D-
microstructures of cast Al-alloys. Materials Characterization vol 62, pp 99-107, 2011.
7th Conference on Industrial Computed Tomography, Leuven, Belgium (iCT 2017)
10
[11.] D. Salaberger, K.A. Kannappan, J. Kastner, J. Reussner and T. Auinger. Evaluation of computed tomography data from
fibre reinforced polymers to determine fibre length distribution. International Polymer Processing vol 26, pp 283-291,
2011.
[12.] A. Amirkhanov, A.Amirkhanov, D. Salaberger, J. Kastner, M. Gröller, C. Heinzl, Visual Analysis of Defects in Glass
Fiber Reinforced Polymers for 4DCT Interrupted In situ Tests, Computer Graphics Forum 35, pp 201-210, 2016.
[13.] B. Plank, R. Helmus, M. Gschwandtner, R. Hinterhölzl, J. Kastner - In-Situ Observation of Bubble Formation in Neat
Resin during the Curing Process by Means of X-Ray Computed Tomography - 19th World Conference on Non-
Destructive Testing (WCNDT 2016), Munich, Germany, pp. 1-8, 2016.
[14.] J. Kastner, B. Plank, and G. Requena. Non-destructive characterisation of polymers and Al-alloys by polychromatic
cone-beam phase contrast tomography. Materials characterization vol 64, pp 79-87, 2012.
[15.] en.wikipedia.org/wiki/Phase-contrast_X-ray_imaging
[16.] F. Pfeiffer, T. Weitkamp, O. Bunk, and C. David, Phase retrieval and differential phase-contrast imaging with low-
brilliance X-ray sources, Nat. Phys. vol 2, pp 258-261, 2006.
[17.] W. Yashiro, Y. Terui, K. Kawabata, and A. Momose, On the origin of visibility contrast in x-ray Talbot interferometry,
Optics Express vol 18, pp 16890-16901, 2010.
[18.] V. Revol, B. Plank, R. Kaufmann, J. Kastner, C. Kottler, A. Neels, Laminate fibre structure characterisation of carbon
fibre-reinforced polymers by X-ray scatter dark field imaging with a grating interferometer, NDT&E Int. vol 58, pp 64-
71, 2013.
[19.] C. Gusenbauer, M. Reiter, B. Plank, S. Senck, C. Hannesschläger, S. Renner, R. Kaufmann, J. Kastner, Multi-modal
Talbot-Lau grating interferometer data for the characterization of fibre reinforced polymers with metal components, 7th
Conference on Industrial Computed Tomography (iCT2017), Leuven, Belgium, 2017
[20.] C. Gusenbauer, S. Hunger, S. Senck, J. Kastner, Characterization of Tooth Samples with a Talbot-Lau Grating
Interferometer μXCT Desktop Device, Proceedings of 4th International Conference on Image Formation in X-Ray
Computed Tomography, Bamberg, Germany, 2016