New Visions for CIPS and DCVG · 28 JUNE 2018 A FEATURE ARTICLE New Visions for CIPS and DCVG New...
5
28 JUNE 2018 WWW.MATERIALSPERFORMANCE.COM A FEATURE ARTICLE New Visions for CIPS and DCVG New instrumentation technology in the pipeline survey industry has helped produce and deliver results for the pipeline surveyor, analyst, and operator. Elizabeth Nicholson, Cathodic Technology, Ltd. As pipeline survey data increase with the use of close interval potential survey (CIPS) and direct current voltage gradient (DCVG) technologies in the cathodic protection (CP) industry, the way data are visualized has changed to reflect the increased amount of data. Because each stakeholder—pipeline surveyor, analyst, and operator—needs to view and understand the data differently, how the data are formatted also needs to vary. The surveyor is limited to the options available on the instrumentation. The analyst has com- mercially available and proprietary software that can output sev- eral different graphical views, with a goal of optimizing visualiza- tion. The pipeline operator and regulators must be able to comprehend the data and make decisions for the continued opera- tion of the pipeline. History of Survey Instruments Practical voltmeters were first developed in the 1880s and had a dial face connected to a moving coil galvanometer. This style of voltmeter is still used today as it is simple to manufacture and use. 1 Beginning in the 1920s, the corrosion industry sent surveyors out to measure structure potentials and identify potential corrosion areas. Initially, the corrosion surveyors had limited instrumenta- tion available to them. In the 1950s, the digital voltmeter was first invented (but it was not a practical device until semiconductors became readily available in the 1970s). One of the main developers of the digital voltmeter was Fluke Corp., a company still recognized today as a manufacturer of test and measurement tools. 2 Voltmeters consisted of moving coil meters with various ranges and settings. Multiple-use meters were created by installing multi- ple meters within a case. Most of the equipment was large and heavy, making it difficult to use in an outdoor field environment. All recording was done manually and dependent on the interpretation of the surveyor. In the 1960s, an attempt was made to automate corrosion surveys by replacing handwritten notes with an ampli- fier connected to a paper chart recorder. While it could produce faster and more accurate results, it was not a practical, portable field instrument. 3 Innovation continued through the years, driven by frustrated field surveyors, electronics technicians, and engineers. The explosion of semiconductors, integrated circuits, and computers in the 1970s and 1980s revolutionized the corrosion industry. Companies began to develop computerized instruments that could display the voltage readings, as well as record the voltage data for computer-assisted analysis. To evaluate the pipeline coating, the DCVG survey was developed in the 1980s and has typically been performed with very sensitive moving coil meters. Despite some digital meters being available, many surveyors pre- fer to use a dial voltmeter for simple interpretation in the field. Survey accuracy improved since there was less opportunity for interpretation and transcription error. The electronic instru- ments could record the data faster, allowing the surveyor to obtain more readings and/or cover more ground. Liquid crystal displays (LCDs) were added to instruments for the first time to allow the surveyor some choices in how the data were pre- sented—numerically or graphically. In the 1990s, the addition of global positioning satellite (GPS) capabilities kept the survey instruments in perfect synchronization with the supporting equipment, such as the current interrupters. 4 This also sped up the survey, allowing more data to be recorded and ensuring that the surveyor could obtain proper IR-free CIPS measurements. Now, new technological innovations, such as Bluetooth † , allow the integration of more survey methods and data into one instrument. Modern devices, such as the tablet and cell phone, can be used to display the survey data in a variety of formats. † Trade name.
Transcript of New Visions for CIPS and DCVG · 28 JUNE 2018 A FEATURE ARTICLE New Visions for CIPS and DCVG New...

28 JUNE 2018 WWW.MATERIALSPERFORMANCE.COM
A
FEATURE ARTICLE
New Visions for CIPS
and DCVGNew instrumentation technology in the pipeline survey industry has helped produce and deliver results for the pipeline surveyor, analyst, and operator. Elizabeth Nicholson, Cathodic Technology, Ltd.
As pipeline survey data increase with the use of close interval
potential survey (CIPS) and direct current voltage gradient
(DCVG) technologies in the cathodic protection (CP) industry, the
way data are visualized has changed to reflect the increased
amount of data.
Because each stakeholder—pipeline surveyor, analyst, and
operator—needs to view and understand the data differently, how
the data are formatted also needs to vary. The surveyor is limited to
the options available on the instrumentation. The analyst has com-
mercially available and proprietary software that can output sev-
eral different graphical views, with a goal of optimizing visualiza-
tion. The pipeline operator and regulators must be able to
comprehend the data and make decisions for the continued opera-
tion of the pipeline.
History of Survey InstrumentsPractical voltmeters were first developed in the 1880s and had a
dial face connected to a moving coil galvanometer. This style of
voltmeter is still used today as it is simple to manufacture and use.1
Beginning in the 1920s, the corrosion industry sent surveyors out to
measure structure potentials and identify potential corrosion
areas. Initially, the corrosion surveyors had limited instrumenta-
tion available to them. In the 1950s, the digital voltmeter was first
invented (but it was not a practical device until semiconductors
became readily available in the 1970s). One of the main developers
of the digital voltmeter was Fluke Corp., a company still recognized
today as a manufacturer of test and measurement tools.2
Voltmeters consisted of moving coil meters with various ranges
and settings. Multiple-use meters were created by installing multi-
ple meters within a case. Most of the equipment was large and
heavy, making it difficult to use in an outdoor field environment. All
recording was done manually and dependent on the interpretation
of the surveyor. In the 1960s, an attempt was made to automate
corrosion surveys by replacing handwritten notes with an ampli-
fier connected to a paper chart recorder. While it could produce
faster and more accurate results, it was not a practical, portable
field instrument.3
Innovation continued through the years, driven by frustrated
field surveyors, electronics technicians, and engineers. The
explosion of semiconductors, integrated circuits, and computers
in the 1970s and 1980s revolutionized the corrosion industry.
Companies began to develop computerized instruments that
could display the voltage readings, as well as record the voltage
data for computer-assisted analysis. To evaluate the pipeline
coating, the DCVG survey was developed in the 1980s and has
typically been performed with very sensitive moving coil meters.
Despite some digital meters being available, many surveyors pre-
fer to use a dial voltmeter for simple interpretation in the field.
Survey accuracy improved since there was less opportunity
for interpretation and transcription error. The electronic instru-
ments could record the data faster, allowing the surveyor to
obtain more readings and/or cover more ground. Liquid crystal
displays (LCDs) were added to instruments for the first time to
allow the surveyor some choices in how the data were pre-
sented—numerically or graphically. In the 1990s, the addition of
global positioning satellite (GPS) capabilities kept the survey
instruments in perfect synchronization with the supporting
equipment, such as the current interrupters.4 This also sped up
the survey, allowing more data to be recorded and ensuring that
the surveyor could obtain proper IR-free CIPS measurements.
Now, new technological innovations, such as Bluetooth†,
allow the integration of more survey methods and data into one
instrument. Modern devices, such as the tablet and cell phone,
can be used to display the survey data in a variety of formats.
†Trade name.
29MATERIALS PERFORMANCE: VOL. 57, NO. 6 JUNE 2018
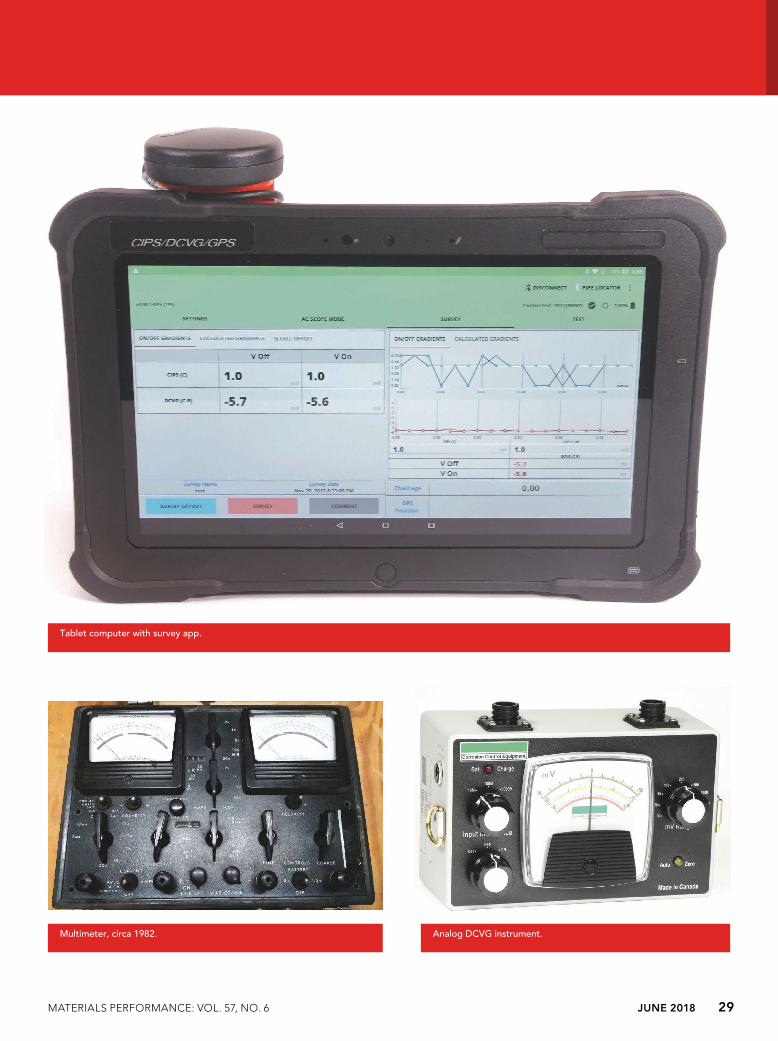
Tablet computer with survey app.
Multimeter, circa 1982. Analog DCVG instrument.

30 JUNE 2018 WWW.MATERIALSPERFORMANCE.COM
FEATURE ARTICLE
GPS and DCVG indications are plotted over a satellite photo.
Bird’s-eye view on a field tablet gives the survey team a view from the top looking down, and uses
colored arrows to indicate the gradient current flow.
Survey Stakeholders’ NeedsThe three main types of corrosion
industry professionals who need to monitor
and visualize external corrosion direct
assessment (ECDA) data are the surveyor in
the field, the analyst in the office, and the
pipeline operators/regulators in the field.
Each has unique needs for the type, quan-
tity, and presentation of the data.
The Surveyor
When performing pipeline integrity sur-
veys, it is important for the surveyor to have
a method to monitor the incoming data.
This is the first step in quality control.
Improving the quality of the raw field data
leads to less post-processing and more accu-
rate reports. With the use of electronic field
instruments, it can be easier for the surveyor
to verify that he or she is recording accurate
data when the reading is taken; however, the
success of this process depends on how the
data are presented to the surveyor and the
ease with which he or she can interpret
them in fast moving field conditions.
A typical CIPS dataset involves two
numbers: the structure’s potential with the
CP “on” and the potential with the CP “off.”
It is relatively easy for anyone to monitor
two numbers and store the reading if those
numbers are viable. The surveyor can
determine whether they are practicable
based on training and experience. By graph-
ing the data on the survey instrument
screen, the surveyor can also begin to per-
form some basic analyses in the field by
looking for trends. If there is an abrupt
change in the data, the data can be viewed
immediately by the surveyor and investi-
gated to validate or correct.
DCVG surveys can have increased com-
plexity. Since the DCVG survey was
invented, the standard field instrument has
been an optimized moving coil dial meter.
Higher end computerized CP survey instru-
ments have offered electronic DCVG sur-
veys, but the method of visualizing the data
for the surveyor has not been widely
accepted as it is not easy to read. Standard
DCVG surveys are similar to a car speed-
ometer: both are shown on dials since it is
easy for a person to monitor for movement
with a glance. Unlike CIPS, where the abso-
lute precision of the reading is always
important, the surveyor is initially looking
for spikes or trends in the data when using
DCVG. This can be monitored with a quick
glance with an analog meter, but it is much
more difficult to spot on an electronic sur-
vey using a digital display.
The availability of handheld computers
and tablets has allowed increased flexibility
in designing different interfaces for CP sur-
vey instrument users. The simplest imple-
mentation involves showing numbers on
the screen, which is similar to digital
meters. The next stage, especially for CIPS,
is to show a graph on the screen. This allows
the surveyor to monitor both the precise
number being recorded and the overall
trend of previous readings. The recent intro-
duction of touchscreen tablets also has
allowed for zoom functionality to be imple-
mented, which permits the surveyor to
review and, if necessary, focus on previous
readings to quality check the work.
Modern graphical displays can now be
programmed to mimic the older analog dis-
plays. An analog DCVG meter can be repli-
cated graphically on a modern display
device, such as a tablet. This display can
improve the analog meter through accu-
rately timed measurement and graphics
manipulation. The analog DCVG meter
shows movement if there is any change in
the voltage in synchronization with the CP
interruption cycle. The larger the shift or
gradient, the closer the surveyor is to the
coating defect. To monitor this effectively,
the interruption cycle used to be set to a
level that the human eye could see and the
gradient later measured by the surveyor.
Now, using electronics and GPS syn-
chronization, data measurement can be
sped up considerably, and the gradient can
be displayed in a more readable fashion.
This is accomplished by using two needles
on the graphics dial; the more distance
between the two needles, the larger the gra-
dient. Also, the instrument stores the
DCVG “on” and “off ” values for every read-
ing, not just the defects the surveyor
observes, so the analyst is able to confirm
the presence or absence of a defect.
In addition, the direction of current
flow can be detected with DCVG surveys.
This indicates whether the current is flow-
ing to the structure and is protected (posi-
tive value), or flowing away from the struc-

31MATERIALS PERFORMANCE: VOL. 57, NO. 6 JUNE 2018
New Visions for CIPS and DCVG
A graph showing “off,” “on,” and calculated gradient values for four DCVG channels is visually
confusing.
A graph of combined CIPS, DCVG, and depolarization survey results uses a secondary y-axis.
ture (negative value). A new graph,
nicknamed “bird’s eye view,” gives a view
from the top looking down at the survey
team. It uses colored arrows to indicate the
gradient current flow, and it offers the sur-
veyor the choice to see the “on” and “off ”
readings separately or with the calculated
gradient in real time. When this view is
combined with additional DCVG channels
on one device, it provides a straightforward
method of locating the center of the defect.
The Analyst
In an ideal world, the analyst would
receive data files in an easy-to-manipulate
format with accurate data from the field. In
the real world, however, a significant por-
tion of the analyst’s time may be spent
removing inconsistent readings, such as a
poor contact or broken wire, before any
conclusions about CP effectiveness or coat-
ing integrity can be reached.
There are some common practices
within the industry for data clarity. Voltage
values are shown on the vertical y-axis and
plotted against distance on the horizontal
x-axis. CIPS data are often presented with
the axes reversed and a horizontal line for
the criterion used, often –850 mV. DCVG
data is usually centered around zero, with
equal room on both the positive and nega-
tive portion of the axis.
The most common form of graphing
data is to use an x- and y-axis plot that rep-
resents voltage vs. distance traveled, with
the data scale showing the distance
walked.4-5 Most other forms of graphing
have a common fault—they spread the data
points out evenly. This does not scale the
data to the length of pipe walked or expose
any areas missed by the surveyor.
As survey equipment has evolved, data
can be obtained from multiple channels at
the same time. Now, instead of three or four
lines, there can be 10 or more. When dis-
played in a typical manner on one graph,
the extra data create a visual mess, making
it difficult to interpret. Three lines of survey
data are typically present: CIPS “on,” CIPS
“off,” and the DCVG gradient. Some analysts
also add a line for the CP criterion of –850
mV. DCVG can also be graphed with three
lines showing the DCVG “on,” DCVG “off,”
and the calculated gradient. Attempting to
show multiple channels, raw data, and cal-
culated data all on the same graph can lead
to visual confusion.
A combined CIPS and DCVG survey is
one of the most common types of survey
performed worldwide. It gathers informa-
tion on the CP level and the coating integ-
rity in one pass. The challenge when graph-
ing the data is that CIPS values are typically
between –700 and –1,500 mV, while DCVG
values are between –50 and +50 mV, but can
spike by 200+ mV in either direction. When
graphed together, the CIPS values are easy
to read but the DCVG values are often very
small and hard to decipher. By changing the
DCVG line to a secondary y-axis, the scal-
ing of the DCVG readings can be adjusted
to emphasize the appearance of any
defects. If available, the analyst may add
other data such as a polarization study or
inline inspection indications to the graph.

32 JUNE 2018 WWW.MATERIALSPERFORMANCE.COM
FEATURE ARTICLE
A stacked graph of DCVG calculated gradients shows a defect (circled in black).
Performing a double impedance CIPS
survey allows the analyst to calculate the
true potential of the pipeline in high-
resistance conditions. If the calculated
potential is graphed along with the low and
high readings, there are six lines of data in
the same space—too many to easily inter-
pret. To emphasize the calculated true
potential of the pipe, the data from the low
and high impedance readings are adjusted
to be a lighter color or more transparent.
The same technique can be used when
combining data over different years or
when doing a depolarization study; lighter
colors are used for older data and darker
colors are used for the current condition. If
any of the data sets are very close together,
the lines will stack on the graph and both
results may not be visible.
Obtaining two DCVG channels with a
CIPS survey can provide extra clarity when
surveying in congested areas. The surveyor
and analyst can confirm that the defect
shown in the data belongs to the pipe being
surveyed rather than a neighboring pipe.
Depending on the terrain, the surveyors
may be walking to either side of the pipe
being surveyed (lateral) or walking in a line
on top of the pipe (longitudinal). These two
scenarios present different graphical results.
As with the CIPS and DCVG discussed ear-
lier, it is important to separate and scale the
DCVG results separately from the CIPS. This
can be done with both DCVG on a second-
ary y-axis or by creating stacked graphs.
The Pipeline Operator
The pipeline operator has many inputs
to monitor. These may include current
operational conditions, equipment status,
employees, financial markets, and more.
Corrosion protection is one small—yet
important—item. All data, reports, data-
bases, and analyses need to be combined to
provide the data that the pipeline operator
needs. Usually this is to answer one ques-
tion: Is my asset protected and in compli-
ance with the regulations?
There are many tools to use for collect-
ing and processing the survey data to help
answer this question. They include the
ECDA process, prioritization calculations,
defect sizing, and others.
Assembling and distilling this informa-
tion is necessary, and failure to properly
analyze the source data can lead to cata-
strophic errors.
During most corrosion-related surveys,
information about the location of each
reading is commonly obtained, either
through chainage or GPS coordinates. As
this information is readily available, it can
be used to produce reports that are easier
to comprehend. By creating icons and col-
ors for certain types of results and overlay-
ing those results on a satellite or similar
map, a better view of the overall pipeline
integrity can be understood. This can be
combined with other information about the
pipeline (e.g., assets, high consequence
areas, age, etc.) if available.
ConclusionTechnological improvements for mea-
surement and data processing have created
more data and more ways to view the data.
This can lead to improvements at all levels.
As the surveyor records higher quality data,
it is easier for the analyst to interpret it. As
the analyst utilizes more information
sources, it is easier for the pipeline operator
to make informed decisions. The technol-
ogy creates an opportunity to tailor the
data display for the diverse needs of each
individual.
References1 Edison Tech Center, “Voltmeters,” Universe of
Instrumentation, http://www.edisontc.org/
ui/home/course/unit-i/voltmeters/ (Septem-
ber 26, 2017).
2 Edison Tech Center, “Digital Multimeters,”
Universe of Instrumentation, http://www.
edisontc.org/ui/home/course/unit-i/
multimeters/ (September 26, 2017).
3 R.J. Finch, “Recording Pipeline Corrosion Sur-
veys,” Proceedings of the Ninth Annual Appa-
lachian Underground Corrosion Short Course
(Morgantown, WV: West Virginia University,
1964), pp. 388- 399.
4 W.B. Holtsbaum, Cathodic Protection Survey
Procedures, 3rd ed. (Houston, TX: NACE Inter-
national, 2016).
5 A.W. Peabody, Control of Pipeline Corrosion,
2nd ed. (Houston, TX: NACE International,
2001).
BibliographyNicholson, J.P. “Is Your Pipeline Corroding?”
CORROSION 2008, paper no. 09123. Houston,
TX: NACE International, 2008.
Smart, A.L. “Early CIS—From the Backpack to
the Slurpy Cell.” CORROSION 2009, paper no.
09131. Houston, TX: NACE, 2009.
This article is based on CORROSION 2018
paper no. 11518, “New Visions for CIPS &
DCVG,” by Elizabeth Nicholson.
ELIZABETH NICHOLSON is general man-ager of Cathodic Technology, Ltd., Bolton, Ontario, Canada, email: [email protected]. Her varied field experience has led to a career of cathodic protection design, consultation, equipment development, and teaching worldwide. Nicholson is a NACE International-certified Corrosion Technician, CP2—Cathodic Protection Technician, and CP3— Cathodic Protection Technologist, and has been a NACE mem-ber for nine years. She holds a B.Eng. degree.