New Topic - The George Washington Universityphy21bio/Presentations/probabi… · ·...
15
1 Page 1 PHYS 1021: Chap. 10, Pg 2 New Topic
Transcript of New Topic - The George Washington Universityphy21bio/Presentations/probabi… · ·...

1
Page 1
PHYS 1021: Chap. 10, Pg 2 New Topic

2
Page 2
PHYS 1021: Chap. 10, Pg 3
Statistics must be used to model physics systems that have large numbers of particles.
Why is this??
We can only follow one or two or at best 3 particles at a time mathematically
All is no lost, for if we can understand the dynamics of two particles at a
time, we can consider these to be average values for a much larger number particles
Because we have a large number of objects, we can us the law of large
numbers to make accurate predictions of average or expected values.
Today we will see that expectation values of expected averages and
standard deviations have statistical,that is actual, real significance.
PHYS 1021: Chap. 10, Pg 4 New Topic

3
Page 3
PHYS 1021: Chap. 10, Pg 5
We ask the question, if there are m ways to get the desired state, and there are n ways not to get it
What is the probability to get the desired state?
First, we change the question. Let L = m + n, and the question becomes one of what are the chances to get the desired state out of L possible possibilities.
Then, just by counting:
PHYS 1021: Chap. 10, Pg 6
If we have more than one desired outcome?
What is the probability to get several desired states simultaneously?
Some examples:
Getting heads 5 times in a row … We have a ½ chance to get heads on one flip. If we flip twice, then only half of the heads we flip on the first one will be heads the second time, half of those the third time, etc.
P5H = (½)5
Now, in general, if there is the probability to get an outcome one time is P, the probability to achieve this m times is
Pm = Pm

4
Page 4
PHYS 1021: Chap. 10, Pg 7
You have in front of you 10 boxes, each with a rd, green, blue, and
orange ball.
If you reach into one and randomly pull a ball out, what is the
probability to pull out a red ball:
P = m/L = ¼ = 25%
What is the probability to pull a red ball out of all 10 boxes?
P = (P1)n = (¼)10 = 9.5 x 10⁻⁷
What is the probability to pull a red, then a green, then a second
green, then a blue ball (that is RGGB)?
P = (P1)n = (¼)4 = 0.0039 = 0.39%
PHYS 1021: Chap. 10, Pg 8
1. If you flip a coin one time, what is the probability to get heads?
To get tails?
2. Now if you flip a coin twice, what is the probability to get two
heads, two tails, one head and one tail?
3. Flip a coin 10 times. What is the probability to get 10 heads in a row?

5
Page 5
PHYS 1021: Chap. 10, Pg 9 New Topic
PHYS 1021: Chap. 10, Pg 10
Most times there is more than one way to get the desired state. In
the previous example, you can see that there is more than one way to get 2 Gs, an R, and a B.
The number of ways is the multiplicity, and it is calculated by:
That is when there are A ways to get one possibility and B ways to
get the other.
The can be extended to three possibilities:
Or even more
€
WABC =(A + B +C)!A!B!C!
€
WABCDE ... =(A + B +C +D+ E + ...)!
A!B!C!D!E!...

6
Page 6
PHYS 1021: Chap. 10, Pg 11
How many ways are there to get 2 Gs, an R, and a B (that is
2G1R1B)? Remember that there are 4 balls, so we are really asking about the
number of ways to get 2G1R1B0O (zero orange!)
The number of ways is the multiplicity, and it is calculated by:
What is the probability to get 2G1R1B?
Remember that there are now 4 boxes, each of which has 4
different balls in it: L = the number of possible arrangements = (#of balls/box)(# of boxes)
L = 44 and P2G1R1B = 12/44= 0.047 = 4.7%
€
W2G1R1B 0O =(2 +1+1+ 0)!2!1!1!0!
=4!2!
=12....(0!=1)
PHYS 1021: Chap. 10, Pg 12
1. Imagine that you flip a coin 4 times in a row, list the possible
combinations of heads and tails (e.g. 2H2T. 1H3T, ...)? How many permutations are there for each of the combinations? What is the
probability for each? --- you may want to make a table.
2. Which is most likely?
3. How many total permutations are there? Does this add up to 24?
4. For 10 flips, what is the number of outcomes with 7 heads, with 3
tails?
5. What is the probability to have 7 heads, with 3 tails?
6. What is the probability to have 5 heads, with 5 tails?

7
Page 7
PHYS 1021: Chap. 10, Pg 13 New Topic
PHYS 1021: Chap. 10, Pg 14
1. Think about the distribution of coin flips and their probability. For H assign
a value 1, for T, a value of -1. Now considering what you remember about the properties of the distribution (do not perform any calculations or coin
flips), predict your score after:
1. 1 flip
2. 2 flips
3. 4 flips
4. 10 flips
5. 100 flips
2. Now calculate the standard deviation for the above cases. You may have
to calculate this for 1, 2, and 4, but seeing the pattern that is emerging,
can you make a reasoned guess for 10 and 100?

8
Page 8
PHYS 1021: Chap. 10, Pg 15
If we assign a numerical value to certain outcomes, then we can
calculate the predicted score when all outcomes are sampled randomly.
How do we use this? We need rules that assign scores to each possible combination, and then we can calculate the expected
value of the score we would get. That is the value we would
measure if we made a large number of samples:
PHYS 1021: Chap. 10, Pg 16
In a game of dice, the person who rolls gets the number of points (1-6) on
the face of the die. So rolling a single die, what is the expectation value of the score?
There are 6 possible values, and each has equal probability, 1/6. We
can make a table:
As expected, the sum of the probabilities is 1 and <s> = the average
dice score
S (score) Ps sPs
1 1/6 1/6 2 1/6 2/6 3 1/6 3/6 4 1/6 4/6 5 1/6 5/6 6 1/6 6/6
Sums 1 21/6=3.5

9
Page 9
PHYS 1021: Chap. 10, Pg 17
Let’s give values to certain colors of balls: B = 4, R = 2, G = 1, V = 0.
What is the probability to get a total score of 4, if we have 4 boxes of balls?
Think about the probability to get 4, we can only have
4G, 1B3O, 2R2O, or 1R2G1V.
W4 = W4G + W1B + W2R + W1R2G
= 4!/4! + 4!/1!3! + 4!/2!2! + 4!/2! = 1+4+6+12 = 23
P4 = W4/44 = 0.090 = 9%
Now, what are 17 possible scores, 0, 1, 2, 3, … , 14, 15, 16
We have to calculate P for each, multiply P by the score and add them
all up. 4P4 = 4(.09) = .36, 16P16 = 16(1/44), 0P0 = 0, 1P1 = 1(4/44) = 0.016
…. See next slide
PHYS 1021: Chap. 10, Pg 18
It is easiest to make a table at this point:
Score (s) Ps sPs Score (s) Ps sPs 1 4/44 1/64 9 2 10 3 11 4 23/44 23/64 12 10/44 30/64 5 24/44 30/64 13 6 14 4/44 14/64 7 15 0 0 8 16 1/44 1/16
W12 = W3B1V + W2B2G = 4 + 6 = 10
W5 = W1B1G2V + W2R1G1V = 12 + 12 = 24
Add up all 16 values of sPs (the 17th value 0P0 = 0) to get <s>
10
Page 10
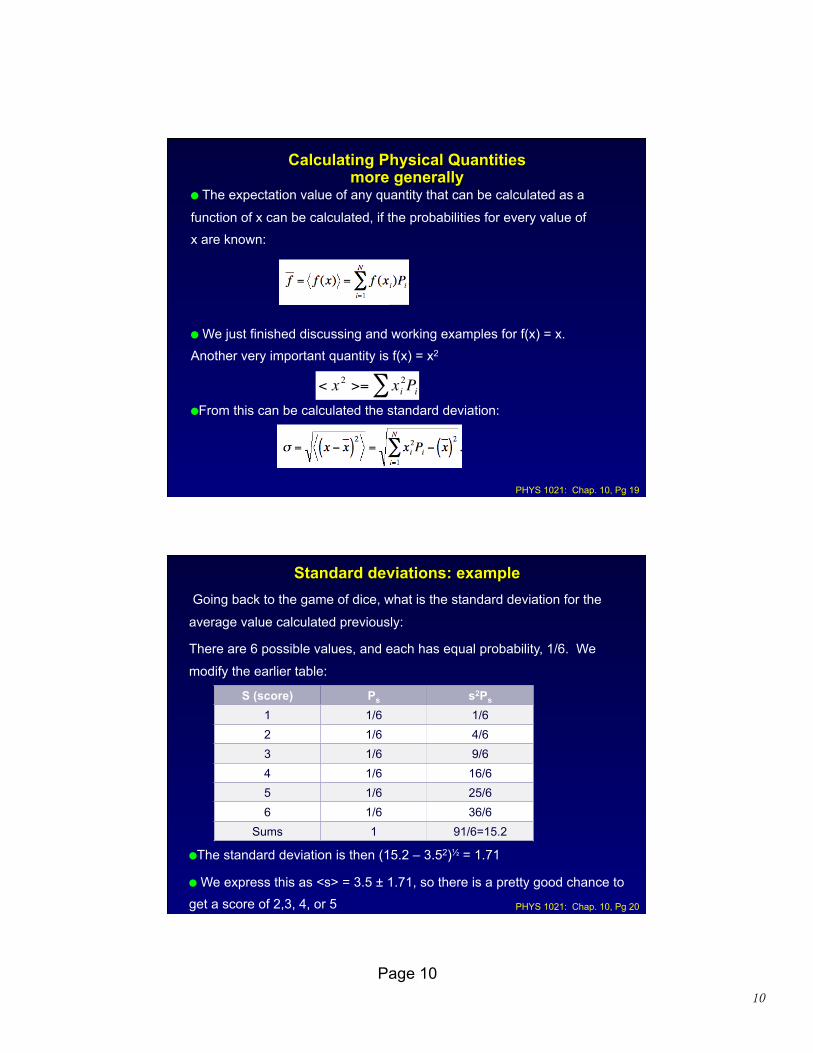
PHYS 1021: Chap. 10, Pg 19
The expectation value of any quantity that can be calculated as a
function of x can be calculated, if the probabilities for every value of x are known:
We just finished discussing and working examples for f(x) = x. Another very important quantity is f(x) = x2
From this can be calculated the standard deviation:
€
< x 2 >= xi2∑ Pi
PHYS 1021: Chap. 10, Pg 20
Going back to the game of dice, what is the standard deviation for the
average value calculated previously:
There are 6 possible values, and each has equal probability, 1/6. We
modify the earlier table:
The standard deviation is then (15.2 – 3.52)½ = 1.71
We express this as <s> = 3.5 ± 1.71, so there is a pretty good chance to get a score of 2,3, 4, or 5
S (score) Ps s2Ps
1 1/6 1/6 2 1/6 4/6 3 1/6 9/6 4 1/6 16/6 5 1/6 25/6 6 1/6 36/6
Sums 1 91/6=15.2

11
Page 11
PHYS 1021: Chap. 10, Pg 21
1. Think about the distribution of coin flips and their probability. For H assign
a value 1, for T, a value of -1. Now considering what you remember about the properties of the distribution (do not perform any calculations or coin
flips), predict your score after:
1. 1 flip
2. 2 flips
3. 4 flips
4. 10 flips
5. 100 flips
2. Now calculate the standard deviation for the above cases. You may have
to calculate this for 1, 2, and 4, but seeing the pattern that is emerging,
can you make a reasoned guess for 10 and 100?
PHYS 1021: Chap. 10, Pg 22
1. Consider flipping a coin four times. This time, assign -1/2 to tails and +1/2 to heads
2. From the earlier ponderable, and the homework, what are the 5 possible scores you can get by adding the result of each of the 4 flips ... these we will call the state of the system.
3. For the 5 states, what is the probability for each? Does the sum of probabilities add to one -- L in GOAL check?
4. Which is most likely?
5. Predict the average value and the standard deviation for each state. These are the values that define the
ideal case and we say that they represent the parent distribution.
6. Go to the google docs spreadsheet that you and your classmates made last night. Copy and paste the
values into a loggerPro worksheet.
7. For each set of 4 flips, add them to get the scores
8. Now calculate the average and standard deviation of all scores.
9. How does it compare to the predicted value from step 5?
10. Now flip the coin 30 times and keep a running tally of the score after each of 30 steps, where you start at
0, then add 1/2 for tails, subtract 1/2 for tails.
11. Make a graph of the the score vs. step number. To do this, add a sheet with your team number to the
teamcoinflips spreadsheet in Google docs. Plot the data. Your graph should be 30 steps long.
12. Also copy and paste your column of step values in the google spreadsheet, teamcoinflips.

12
Page 12
New Topic
In our lab, we have a ball of mass, m, pulling down against a string, which goes over a pulley and pulls the cart of mass Mc=500g down the track with acceleration, a. Ignore friction, viscosity, and buoyancy, what is m in terms of a, g, and Mc?
Group a (m/s2) aMc/g (grams) 2 0.085 4.34
MR 0.14 7.14 6 0.30 15.3 4 0.64 32.6
What does this tell us? We all used different masses and/
or different length calibrations.

13
Page 13
For some of the fluids, you observed that the velocity increased and started to curve over, but did not saturate. Now the terminal velocity is found from the coefficients of the Taylor series expansion for the v(t) equation,
Let’s imagine (not so hard really) that we know the mass of the cart, and have measured the acceleration but do not know the mass of the ball. Starting with the free-body diagrams of the ball and of the cart, write an expression for mass of the ball. Your expression should include the mass of the cart (500g), the buoyant force, the acceleration of the ball (F0/m), and the coefficient of friction of the cart (0.0023). How can you use this to find a better value of the mass than we did in the previous example?
€
v(t) =F0m(t − t0) +
12F0
2
m2vt(t − t0)
2 = A(t − t0)2 + B(t − t0) +C, C = 0
Now, we can take our previously calculated mass and find correction factors to the mass calculated in the example in class for the effects of buoyancy, and friction. These actually turn out to be quite large in some cases. Compute the correction factors for glycerine (ρ = 1250 kg/m3)
Group a (m/s2) aMc/g (grams)
µg/a a/g(1-ρf/ρb) Correction factor
2 0.085 4.34 0.27 0.008 1.28
MR 0.14 7.14 0.16 0.012 1.17
6 0.30 15.3 0.077 0.027 1.14
4 0.64 32.6 0.056 0.065 1.09
Why do the smaller masses have larger correction factors? Given that a smaller mass is observed to reach terminal velocity, how do the results of the table guide our experimental design?
Finally, I still had a 10% difference between by calculated mass and measured mass and so checked the calibration of the optical gate. It was 7% too low. Thus, the correction factor must be multiplied by 1.07.

14
Page 14
For some of the fluids, you observed that the velocity increased and then saturated, at the terminal velocity. Starting with the free-body diagrams of the ball and of the cart, write an expression for the terminal velocity of the ball. Your expression should include the weight, the buoyant force, the drag on the string, the drag on the ball (and nut and magnet) and the friction of the cart. Now solve this equation for the viscosity.
For some of the fluids, you observed that the velocity increased and started to curve over, but did not saturate. Now the terminal velocity is found from the coefficients of the Taylor series expansion for the v(t) equation,
Starting with the free-body diagrams of the ball and of the cart, write an expression for the terminal velocity of the ball. Now your velocity is large enough that you have to include the second term and consider drag. Your expression should include the weight, the buoyant force, the drag on the string, the drag on the ball (and nut and magnet), the acceleration of the ball, and the friction of the cart. How does this equation differ from the one found in the previous tangible? Now solve this equation for the viscosity. Should you find the same value if you allow the ball to actually reach its terminal velocity?
€
v(t) =F0m(t − t0) +
12F0
2
m2vt(t − t0)
2
€
v(t) =F0m(t − t0) +
12F0
2
m2vt(t − t0)
2 = A(t − t0)2 + B(t − t0) +C, C = 0
15
Page 15
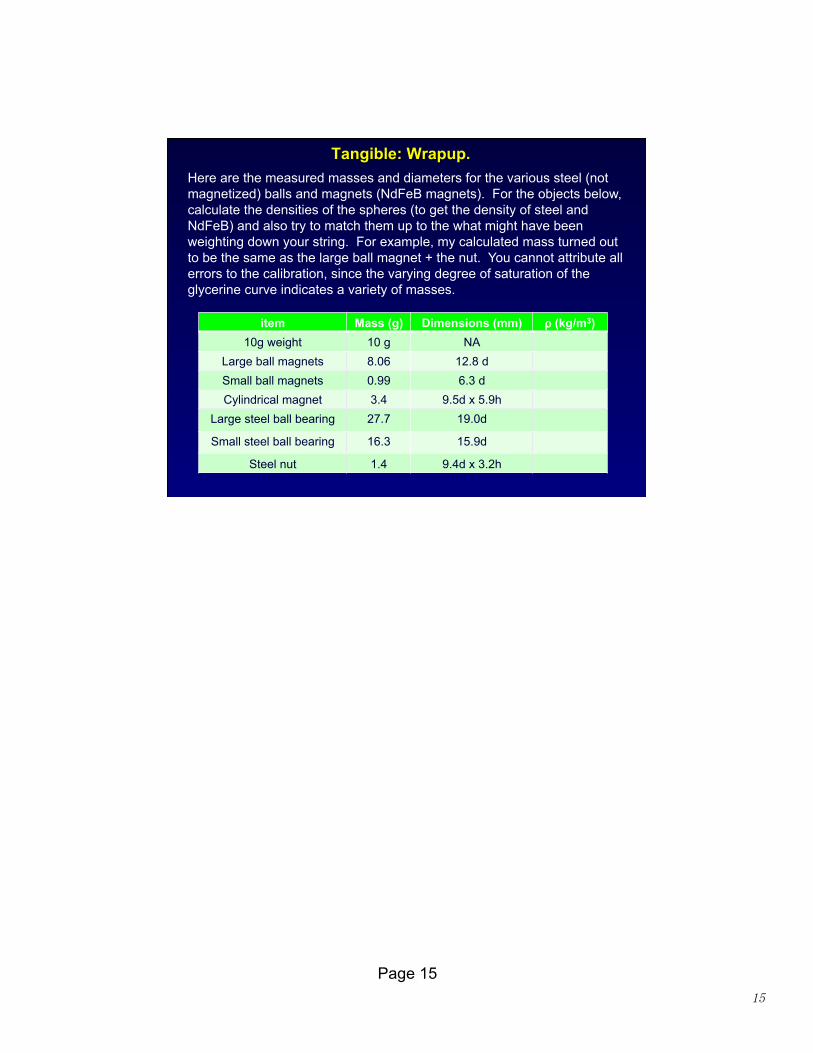
Here are the measured masses and diameters for the various steel (not magnetized) balls and magnets (NdFeB magnets). For the objects below, calculate the densities of the spheres (to get the density of steel and NdFeB) and also try to match them up to the what might have been weighting down your string. For example, my calculated mass turned out to be the same as the large ball magnet + the nut. You cannot attribute all errors to the calibration, since the varying degree of saturation of the glycerine curve indicates a variety of masses.
item Mass (g) Dimensions (mm) ρ (kg/m3) 10g weight 10 g NA
Large ball magnets 8.06 12.8 d Small ball magnets 0.99 6.3 d Cylindrical magnet 3.4 9.5d x 5.9h
Large steel ball bearing 27.7 19.0d
Small steel ball bearing 16.3 15.9d
Steel nut 1.4 9.4d x 3.2h


![Probabi 2 [Modo de Compatibilidade]euler.mat.ufrgs.br/~viali/estatistica/mat2246/material/laminaspi/... · Determine o valor de “c” para que ... Para determinar o valor de “c”,](https://static.fdocuments.net/doc/165x107/5c495c8493f3c31f4a7adc01/probabi-2-modo-de-compatibilidadeeulermatufrgsbrvialiestatisticamat2246materiallaminaspi.jpg)


![Probabi 2 [Modo de Compatibilidade] - mat.ufrgs.brviali/estatistica/mat2246/material/laminaspi/... · 2 Prof. Lorí Viali, Dr. – UFRGS – Instituto de Matemática - Departamento](https://static.fdocuments.net/doc/165x107/5be5ee3c09d3f28a428cf225/probabi-2-modo-de-compatibilidade-matufrgsbr-vialiestatisticamat2246materiallaminaspi.jpg)