New technology in echocardiography II: imaging techniques - Heart
8
Heart (Supplement 2) 1996;75:9-16 New technology in echocardiography II: imaging techniques W Norman McDicken, Carmel M Moran, Peter R Hoskins, Mark J Monaghan, George R Sutherland Department of Medical Physics and Medical Engineering, University of Edinburgh, Edinburgh W N McDicken C M Moran P R Hoskins Department of Medicine, University of Edinburgh, Edinburgh G R Sutherland Department of Cardiology, King's College Hospital, Denmark Hill, London M J Monaghan Correspondence to: Professor W N McDicken, Department of Medical Physics and Medical Engineering, University of Edinburgh, Edinburgh EH3 9YW, UK. Intravascular techniques Intravascular ultrasound (IVUS) coronary arteries has become poss improvements in the miniaturisatic sound transducers. Intravascular B ing consists of cross sectional i vessels by miniature ultrasound mounted on wires which are contain catheter sheath (fig 1). The scanni directed at right angles to the axis and sweeps through 3600 (fig 2). In imaging of structures related to the efforts are being made to classify present with a view to predicting th interventional procedures. Few ( companies produce such systex X~ ~ -- ------ ----- - - - B approaches to the generation of an ultrasound imaging of image have been reported.' -ible due to * A single transducer element is rotated an of ultra- directly by the drive shaft. scan imag- 0 A single element is fixed and the ultra- imaging of sound beam swept through 3600 by reflec- transducers tion of the beam from a rotating acoustic ied within a mirror. ing beam is 0 Array of elements are arranged in a circle of the wire around the catheter tip. addition to In this last approach typically 32 elements vessel wall, are used in present systems and the beam is the tissues rotated in a circle by firing groups of elements e success of in turn. This is technically demanding and it is commercial difficult to generate a narrow beam with a rela- ms. Three tively small number of elements. With mechanical scanners geometrical distortion of 2 the image may occur as a result of changes in the angular rotational speed of the drive wire. One advantage of the array systems is that sweeping of the beam is electronically con- - trolled and such distortion will not occur. < The ultrasound beam characteristics deter- mine the spatial resolution of the intravascular image which in turn determines the ability to __ < perceive detail in the image. Measurements of - the spatial resolution characteristics of a single 3 30 MHz element intravascular scanner have been reported, where it was noted that consid- erable deterioration of the lateral spatial reso- 2 3 lution occurs with increasing depth.2 The limited space available in general makes it diffi- cult to incorporate the advanced beam focus- ing techniques found in external transducers. Prototype single crystal catheter scanners have been described operating at frequencies as XI / high as 60 MHz. 4 1 2 C Figure 1 Catheter scanners. (A) Rotating transducer, drive shaft (1), window (2, transducer (3); (B) rotating mirror, drive shaft (1), window (2), transducer (3), n (4); (C) circular electronic array, preamplifiers (1), transducer elements (2), guide (3). (Reprinted by permission of Kluwer Academic PIublishers from Bom N, ten Ho Lancee CT, Gussenhoven WJ, Bosch J'G. Early and recent intraluminal ultrasounm devices. Int J Cardiac Imaging 1989;4:79-88) Three dimensional imaging 3D ultrasonic techniques for visualisation of the heart have been reported for 20 years.34 With the ever increasing speed and storage capacity of computers, 3D manipulation of ultrasonic images has in recent years become feasible on a commercial basis; this requires the transfer of a complete set of 2D images to the computer. Several approaches are possible 7 X for acquisition of the 2D ultrasound images. One common approach is to acquire a set of transoesophageal 2D ultrasound images using a multiplane probe.5 The transducer is mechanically rotated in steps through 1800, and sequential scans are acquired and stored nirror by the computer. The multiplane probe has wire been used to acquire a set of B scan images of if H, the left ventricle.6 Automatic algorithms may be employed to trace the edges of the left ven- - l 9 I L. _v ---l F on 31 December 2018 by guest. Protected by copyright. http://heart.bmj.com/ Heart: first published as 10.1136/hrt.75.6_Suppl_2.9 on 1 June 1996. Downloaded from
Transcript of New technology in echocardiography II: imaging techniques - Heart

Heart (Supplement 2) 1996;75:9-16
New technology in echocardiography II: imagingtechniques
W Norman McDicken, Carmel M Moran, Peter R Hoskins, Mark J Monaghan,George R Sutherland
Department ofMedical Physics andMedical Engineering,University ofEdinburgh, EdinburghWN McDickenC M MoranP R HoskinsDepartment ofMedicine, UniversityofEdinburgh,EdinburghG R SutherlandDepartment ofCardiology, King'sCollege Hospital,Denmark Hill, LondonM J MonaghanCorrespondence to:ProfessorWN McDicken,Department of MedicalPhysics and MedicalEngineering, University ofEdinburgh, EdinburghEH3 9YW, UK.
Intravascular techniquesIntravascular ultrasound (IVUS)coronary arteries has become possimprovements in the miniaturisaticsound transducers. Intravascular Bing consists of cross sectional ivessels by miniature ultrasoundmounted on wires which are containcatheter sheath (fig 1). The scannidirected at right angles to the axisand sweeps through 3600 (fig 2). Inimaging of structures related to theefforts are being made to classifypresent with a view to predicting thinterventional procedures. Few (
companies produce such systex
X~ ~-- ------ ----- - - -
B
approaches to the generation of an ultrasoundimaging of image have been reported.'-ible due to * A single transducer element is rotatedan of ultra- directly by the drive shaft.scan imag- 0 A single element is fixed and the ultra-imaging of sound beam swept through 3600 by reflec-transducers tion of the beam from a rotating acousticied within a mirror.ing beam is 0 Array of elements are arranged in a circleof the wire around the catheter tip.addition to In this last approach typically 32 elementsvessel wall, are used in present systems and the beam isthe tissues rotated in a circle by firing groups of elementse success of in turn. This is technically demanding and it iscommercial difficult to generate a narrow beam with a rela-ms. Three tively small number of elements. With
mechanical scanners geometrical distortion of2 the image may occur as a result of changes in
the angular rotational speed of the drive wire.One advantage of the array systems is thatsweeping of the beam is electronically con-
- trolled and such distortion will not occur.< The ultrasound beam characteristics deter-
mine the spatial resolution of the intravascularimage which in turn determines the ability to
__ < perceive detail in the image. Measurements of- the spatial resolution characteristics of a single3 30 MHz element intravascular scanner have
been reported, where it was noted that consid-erable deterioration of the lateral spatial reso-
2 3 lution occurs with increasing depth.2 Thelimited space available in general makes it diffi-cult to incorporate the advanced beam focus-ing techniques found in external transducers.Prototype single crystal catheter scanners havebeen described operating at frequencies as
XI / high as 60 MHz.
4
1 2
C
Figure 1 Catheter scanners. (A) Rotating transducer, drive shaft (1), window (2,transducer (3); (B) rotating mirror, drive shaft (1), window (2), transducer (3), n(4); (C) circular electronic array, preamplifiers (1), transducer elements (2), guide(3). (Reprinted by permission ofKluwer Academic PIublishers from Bom N, ten HoLancee CT, Gussenhoven WJ, Bosch J'G. Early and recent intraluminal ultrasounmdevices. Int J Cardiac Imaging 1989;4:79-88)
Three dimensional imaging3D ultrasonic techniques for visualisation ofthe heart have been reported for 20 years.34With the ever increasing speed and storagecapacity of computers, 3D manipulation ofultrasonic images has in recent years becomefeasible on a commercial basis; this requiresthe transfer of a complete set of 2D images tothe computer. Several approaches are possible
7X for acquisition of the 2D ultrasound images.One common approach is to acquire a set oftransoesophageal 2D ultrasound images usinga multiplane probe.5 The transducer ismechanically rotated in steps through 1800,and sequential scans are acquired and stored
nirror by the computer. The multiplane probe haswire been used to acquire a set of B scan images ofif H,
the left ventricle.6 Automatic algorithms maybe employed to trace the edges of the left ven-
-l
9
IL. _v
---l F on 31 Decem
ber 2018 by guest. Protected by copyright.
http://heart.bmj.com
/H
eart: first published as 10.1136/hrt.75.6_Suppl_2.9 on 1 June 1996. D
ownloaded from
McDicken, Moran, Hoskins, Monaghan, Sutherland
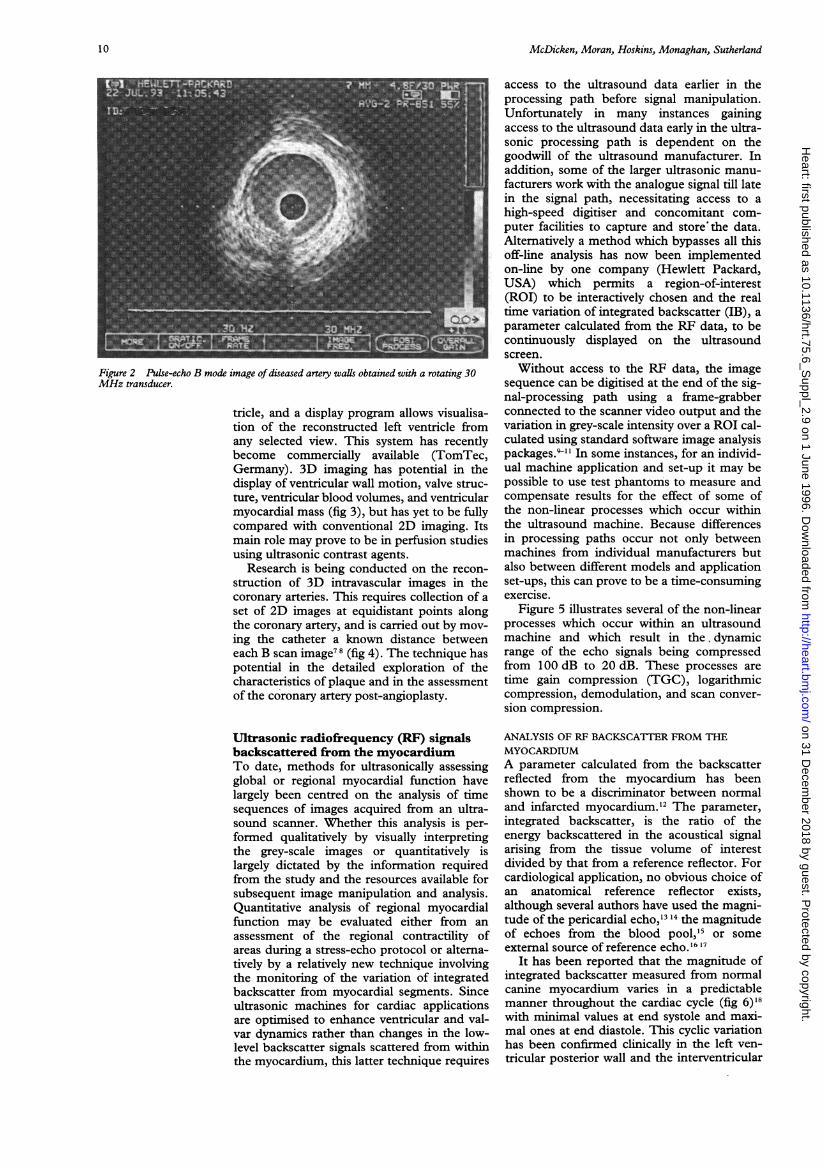
Figure 2 Pulse-echo B mode image of diseased artety waUs obtained with a rotating 30MHz transducer.
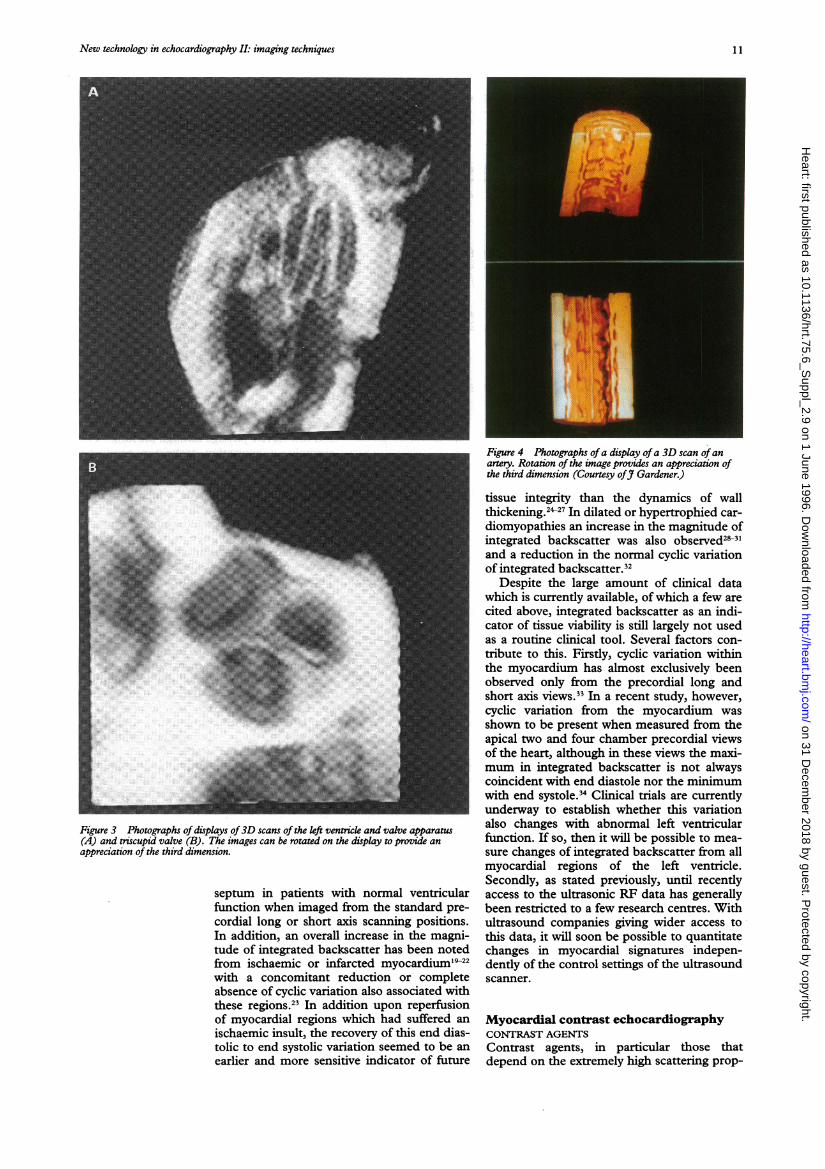
tricle, and a display program allows visualisa-tion of the reconstructed left ventricle fromany selected view. This system has recentlybecome commercially available (TomTec,Germany). 3D imaging has potential in thedisplay of ventricular wall motion, valve struc-ture, ventricular blood volumes, and ventricularmyocardial mass (fig 3), but has yet to be fullycompared with conventional 2D imaging. Itsmain role may prove to be in perfusion studiesusing ultrasonic contrast agents.
Research is being conducted on the recon-
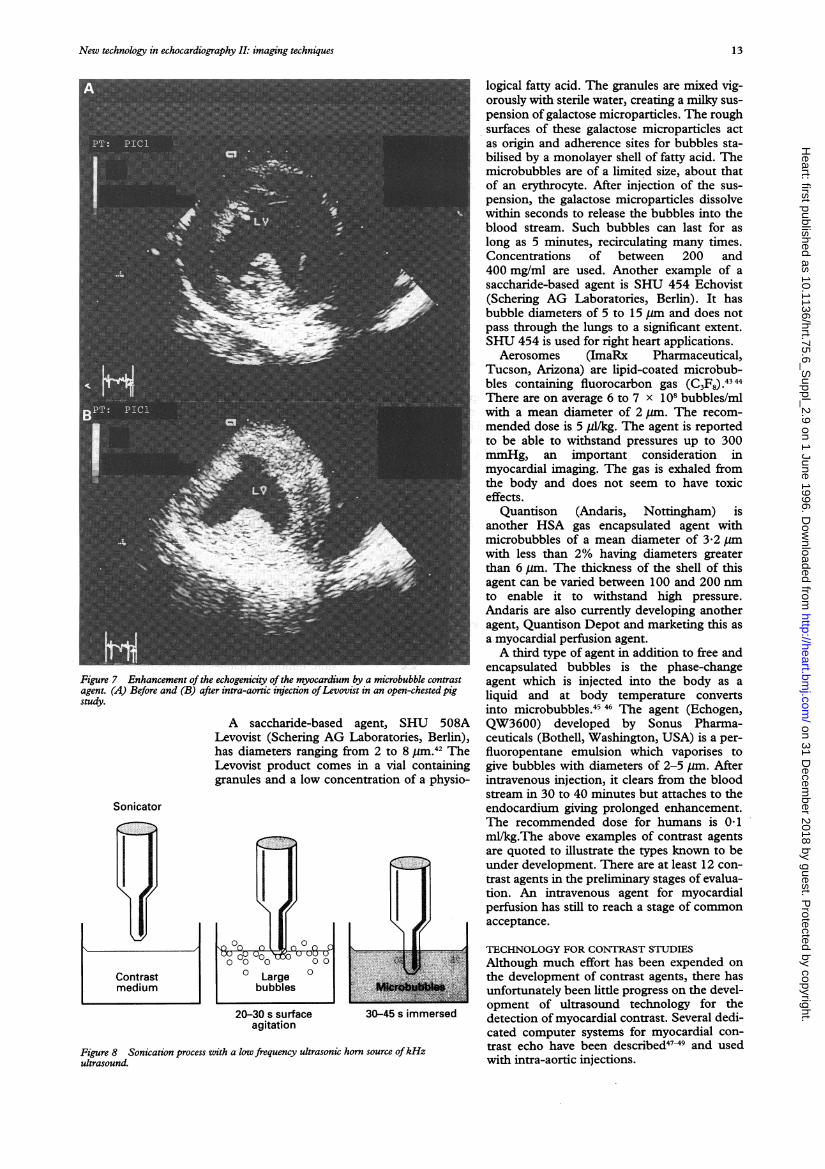
struction of 3D intravascular images in thecoronary arteries. This requires collection of a
set of 2D images at equidistant points alongthe coronary artery, and is carried out by mov-ing the catheter a known distance betweeneach B scan image78 (fig 4). The technique haspotential in the detailed exploration of thecharacteristics of plaque and in the assessmentof the coronary artery post-angioplasty.
Ultrasonic radiofrequency (RF) signalsbackscattered from the myocardiumTo date, methods for ultrasonically assessingglobal or regional myocardial function havelargely been centred on the analysis of timesequences of images acquired from an ultra-sound scanner. Whether this analysis is per-formed qualitatively by visually interpretingthe grey-scale images or quantitatively islargely dictated by the information requiredfrom the study and the resources available forsubsequent image manipulation and analysis.Quantitative analysis of regional myocardialfunction may be evaluated either from an
assessment of the regional contractility ofareas during a stress-echo protocol or alterna-tively by a relatively new technique involvingthe monitoring of the variation of integratedbackscatter from myocardial segments. Sinceultrasonic machines for cardiac applicationsare optimised to enhance ventricular and val-var dynamics rather than changes in the low-level backscatter signals scattered from withinthe myocardium, this latter technique requires
access to the ultrasound data earlier in theprocessing path before signal manipulation.Unfortunately in many instances gainingaccess to the ultrasound data early in the ultra-sonic processing path is dependent on thegoodwill of the ultrasound manufacturer. Inaddition, some of the larger ultrasonic manu-facturers work with the analogue signal till latein the signal path, necessitating access to ahigh-speed digitiser and concomitant com-puter facilities to capture and store'the data.Alternatively a method which bypasses all thisoff-line analysis has now been implementedon-line by one company (Hewlett Packard,USA) which permits a region-of-interest(ROI) to be interactively chosen and the realtime variation of integrated backscatter (IB), aparameter calculated from the RF data, to becontinuously displayed on the ultrasoundscreen.
Without access to the RF data, the imagesequence can be digitised at the end of the sig-nal-processing path using a frame-grabberconnected to the scanner video output and thevariation in grey-scale intensity over a ROI cal-culated using standard software image analysispackages.9-1 In some instances, for an individ-ual machine application and set-up it may bepossible to use test phantoms to measure andcompensate results for the effect of some ofthe non-linear processes which occur withinthe ultrasound machine. Because differencesin processing paths occur not only betweenmachines from individual manufacturers butalso between different models and applicationset-ups, this can prove to be a time-consumingexercise.
Figure 5 illustrates several of the non-linearprocesses which occur within an ultrasoundmachine and which result in the. dynamicrange of the echo signals being compressedfrom 100 dB to 20 dB. These processes aretime gain compression (TGC), logarithmiccompression, demodulation, and scan conver-sion compression.
ANALYSIS OF RF BACKSCAT-TER FROM THEMYOCARDIUMA parameter calculated from the backscatterreflected from the myocardium has beenshown to be a discriminator between normaland infarcted myocardium."2 The parameter,integrated backscatter, is the ratio of theenergy backscattered in the acoustical signalarising from the tissue volume of interestdivided by that from a reference reflector. Forcardiological application, no obvious choice ofan anatomical reference reflector exists,although several authors have used the magni-tude of the pericardial echo,'3 14 the magnitudeof echoes from the blood pool,'5 or someexternal source of reference echo.16 17
It has been reported that the magnitude ofintegrated backscatter measured from normalcanine myocardium varies in a predictablemanner throughout the cardiac cycle (fig 6)18with minimal values at end systole and maxi-mal ones at end diastole. This cyclic variationhas been confirmed clinically in the left ven-tricular posterior wall and the interventricular
10
on 31 Decem
ber 2018 by guest. Protected by copyright.
http://heart.bmj.com
/H
eart: first published as 10.1136/hrt.75.6_Suppl_2.9 on 1 June 1996. D
ownloaded from
New technology in echocardiography II: imaging techniques
Figure 3 Photographs ofdisplays of3D scans of the left ventricle and valve apparatus(A) and triscupid valve (B). The images can be rotated on the display to provide anappreciation of the third dimension.
septum in patients with normal ventricularfunction when imaged from the standard pre-cordial long or short axis scanning positions.In addition, an overall increase in the magni-tude of integrated backscatter has been notedfrom ischaemic or infarcted myocardium'9-22with a concomitant reduction or completeabsence of cyclic variation also associated withthese regions.2' In addition upon reperfusionof myocardial regions which had suffered an
ischaemic insult, the recovery of this end dias-tolic to end systolic variation seemed to be an
earlier and more sensitive indicator of future
Figure 4 Photographs ofa display ofa 3D scan ofanartery. Rotation of the image provides an appreciation ofthe third dimension (Courtesy ofy Gardener.)
tissue integrity than the dynamics of wallthickening.?7 In dilated or hypertrophied car-diomyopathies an increase in the magnitude ofintegrated backscatter was also observed2831and a reduction in the normal cyclic variationof integrated backscatter.2
Despite the large amount of clinical datawhich is currently available, of which a few arecited above, integrated backscatter as an indi-cator of tissue viability is still largely not usedas a routine clinical tool. Several factors con-tribute to this. Firstly, cyclic variation withinthe myocardium has almost exclusively beenobserved only from the precordial long andshort axis views.33 In a recent study, however,cyclic variation from the myocardium wasshown to be present when measured from theapical two and four chamber precordial viewsof the heart, although in these views the maxi-mum in integrated backscatter is not alwayscoincident with end diastole nor the minimumwith end systole.34 Clinical trials are currentlyunderway to establish whether this variationalso changes with abnormal left ventricularfunction. If so, then it will be possible to mea-sure changes of integrated backscatter from allmyocardial regions of the left ventricle.Secondly, as stated previously, until recentlyaccess to the ultrasonic RF data has generallybeen restricted to a few research centres. Withultrasound companies giving wider access tothis data, it will soon be possible to quantitatechanges in myocardial signatures indepen-dently of the control settings of the ultrasoundscanner.
Myocardial contrast echocardiographyCONTRAST AGENTSContrast agents, in particular those thatdepend on the extremely high scattering prop-
1 1
on 31 Decem
ber 2018 by guest. Protected by copyright.
http://heart.bmj.com
/H
eart: first published as 10.1136/hrt.75.6_Suppl_2.9 on 1 June 1996. D
ownloaded from

McDicken, Moran, Hoskins, Monaghan, Sutherland
Figure 5 Stages of compression of the dynamic range ofecho signals in a cocultrasonic scanner.
(D 2
4.0
-2
-4
Time (1 cardiac cycle)Figure 6 Variation of integrated backscatter echo signal over a cardiac cycle
erties of microbubbles, have beenused to enhance the power of Dopfrom blood. Myocardial contrast esraphy is a relatively new method fmyocardial perfusion.'5 It has the Iprovide information on myocardia
which perfectly complements the anatomical,functional, and haemodynamic informationderived from routine echo studies.
This technique was first described withintra-aortic and intracoronary injections ofcontrast microbubbles to demonstrate myo-
Integrated cardial perfusion.'6 When the microbubbles
backscatter enter the myocardium they cause an increaseof backscattered ultrasound energy (power)and hence raise the myocardial grey levelintensity in the image (fig 7).
Early contrast agents were derived by agita-tion of solutions such as indocyanine green,saline, dextrose, hydrogen peroxide, and bloodto produce free gas bubbles of air.'6Unfortunately these bubbles that are notencapsulated have a wide range of diametersand the gas diffuses back into the liquid tooquickly to allow widespread distribution in thebody. Free gas bubbles cannot pass throughthe lungs so no opacification of the left heart
nventionalcan be achieved unless a right-to-left shunt ispresent.
Techniques have been devised to createencapsulated bubbles which have a longer lifeand can survive passage through the lungs. Forexample, a sonication technique producedmicrobubbles in human serum albumin(HSA) with diameters less than 10 gMm.3738Sonication is a technique which producessmall microbubbles in a fluid by exposing it tovery high intensity ultrasound, typically20 kHz. Cavitation occurs causing smallmicrobubbles to be produced in the fluid. Theprocess of sonication is illustrated in figure 8.There is at present considerable commercialresearch and development related tomicrobubble contrast agents. Some productswhich are undergoing trials are- describedbelow and in the table.
Albunex, marketed in Europe as Infoson(Nycomed, Norway) is made from sonicationof 5% HSA and has a shelf life of 6 months.Injections range from 0-025 to 1 0 ml/kg. It isan isotonic, ready to use suspension of
e. 5 x 10⁸/ml air-filled microspheres with diam-eters of 4 to 10JUm.40 At room temperature thesuspension remains stable for up to 20
extensively weeks.4' Nycomed is currently developing a
bpler signals more stable agent called NUS, which will bechocardiog- marketed as a myocardial perfusion agent.or studying This agent is also sonicated human serum
potential to albumin but the shell is degraded syntheticl perfusion polymer.
Properties ofsome common left heart contrast agents
Left heart agent Manufacturer Type of agent Capsule Gas Bubble size Doselconcentration *
Albunex Nycomed Encapsulated Albumin Air Range (4-10,um), 0025-10 mllkg(Europe) bubble mean 4 ,um
(Infoson in Europe) Mallinckrodt(USA)
Levovist Schering Encapsulated Palmitic Acid Air Range (2-8 gm), 17 ml of 200 mg/mlbubble median 3,um 11 ml of 300 mg/ml
8 ml of 400 mg/mlAerosomes ImaRx Encapsulated Lipid C, F, Mean (2 ,um) 5 ,ul/kg
bubbleQuantison Andaris Encapsulated HSA Air Mean (3-2 ,um), 20-200 pl/kg
bubble range (< 2% > 6,um)Echogen Sonus Phase-shift N/A Perfluoropentane Range (2-5 ,m) 0 1 ml/kg
Pharmaceuticals
HSA = human serum albumin.*Particles/ml solution.
12
on 31 Decem
ber 2018 by guest. Protected by copyright.
http://heart.bmj.com
/H
eart: first published as 10.1136/hrt.75.6_Suppl_2.9 on 1 June 1996. D
ownloaded from
New technology in echocardiography II: imaging techniques
Figure 7 Enhancement of the echogenicity of the myocardium by a microbubble contrastagent. (A) Before and (B) after intra-aoric injection ofLevovist in an open-chested pigstudy.
A saccharide-based agent, SHU 508ALevovist (Schering AG Laboratories, Berlin),has diameters ranging from 2 to 8 Um.42 TheLevovist product comes in a vial containinggranules and a low concentration of a physio-
Sonicator
Contrastmedium
>cr11|
s x,> X
30-45 s immersed
Figure 8 Sonication process with a low frequency ultrasonic horn source ofkHzultrasound.
logical fatty acid. The granules are mixed vig-orously with sterile water, creating a milky sus-pension of galactose microparticles. The roughsurfaces of these galactose microparticles actas origin and adherence sites for bubbles sta-bilised by a monolayer shell of fatty acid. Themicrobubbles are of a limited size, about thatof an erythrocyte. After injection of the sus-pension, the galactose microparticles dissolvewithin seconds to release the bubbles into theblood stream. Such bubbles can last for aslong as 5 minutes, recirculating many times.Concentrations of between 200 and400 mg/ml are used. Another example of asaccharide-based agent is SHU 454 Echovist(Schering AG Laboratories, Berlin). It hasbubble diameters of 5 to 15 jum and does notpass through the lungs to a significant extent.SHU 454 is used for right heart applications.Aerosomes (ImaRx Pharmaceutical,
Tucson, Arizona) are lipid-coated microbub-bles containing fluorocarbon gas (C,F8) .
There are on average 6 to 7 x 10⁸ bubbles/mlwith a mean diameter of 2,m. The recom-mended dose is 5 pll/kg. The agent is reportedto be able to withstand pressures up to 300mmHg, an important consideration inmyocardial imaging. The gas is exhaled fromthe body and does not seem to have toxiceffects.
Quantison (Andaris, Nottingham) isanother HSA gas encapsulated agent withmicrobubbles of a mean diameter of 3-2 pmwith less than 2% having diameters greaterthan 6,m. The thickness of the shell of thisagent can be varied between 100 and 200 nmto enable it to withstand high pressure.Andaris are also currently developing anotheragent, Quantison Depot and marketing this asa myocardial perfusion agent.A third type of agent in addition to free and
encapsulated bubbles is the phase-changeagent which is injected into the body as aliquid and at body temperature convertsinto microbubbles.45 46 The agent (Echogen,QW3600) developed by Sonus Pharma-ceuticals (Bothell, Washington, USA) is a per-fluoropentane emulsion which vaporises togive bubbles with diameters of 2-5 jm. Afterintravenous injection, it clears from the bloodstream in 30 to 40 minutes but attaches to theendocardium giving prolonged enhancement.The recommended dose for humans is 0 1ml/kg.The above examples of contrast agentsare quoted to illustrate the types known to beunder development. There are at least 12 con-trast agents in the preliminary stages of evalua-tion. An intravenous agent for myocardialperfusion has still to reach a stage of commonacceptance.
TECHNOLOGY FOR CONTRAST STUDIESAlthough much effort has been expended onthe development of contrast agents, there hasunfortunately been little progress on the devel-opment of ultrasound technology for thedetection of myocardial contrast. Several dedi-cated computer systems for myocardial con-trast echo have been described4749 and usedwith intra-aortic injections.
20-30 s surfaceagitation
13
on 31 Decem
ber 2018 by guest. Protected by copyright.
http://heart.bmj.com
/H
eart: first published as 10.1136/hrt.75.6_Suppl_2.9 on 1 June 1996. D
ownloaded from
McDicken, Moran, Hoskins, Monaghan, Sutherland
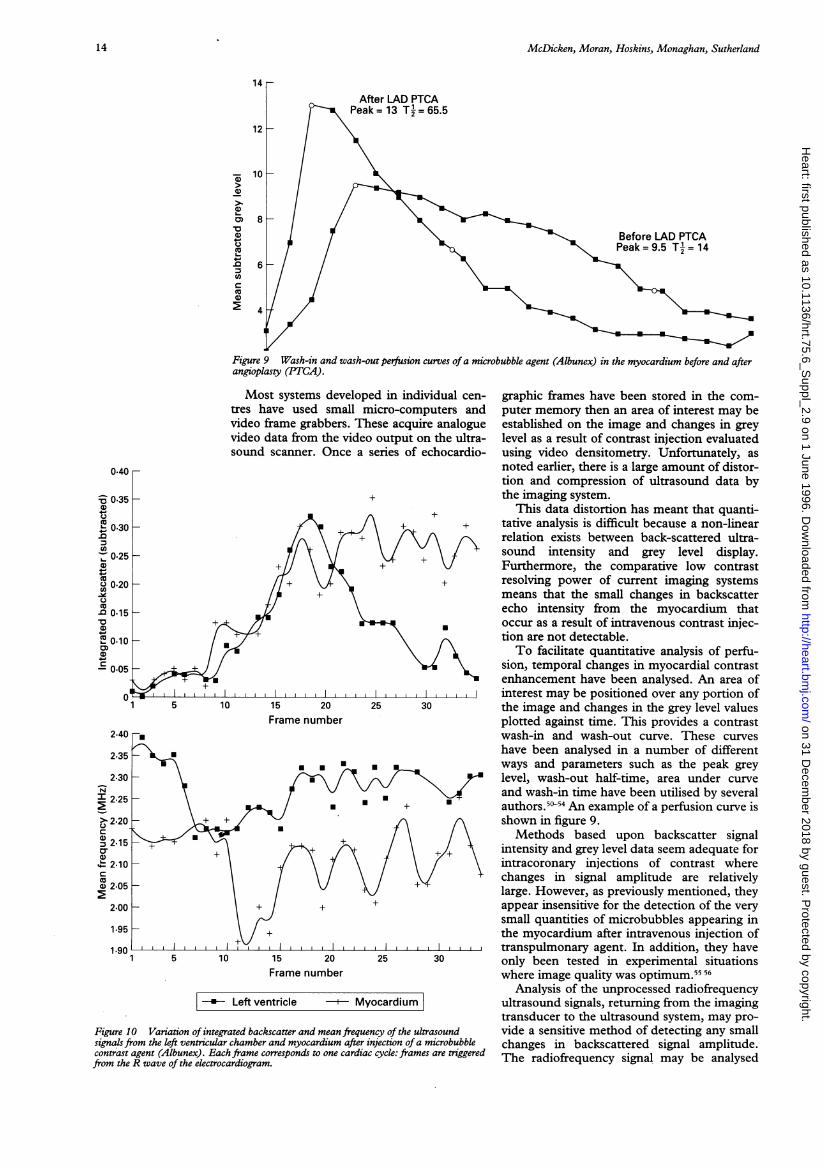
After LAD PTCAPeak= 13 T = 65.5
~' 8
Before LAD PTCA
C,,;, .
Figure 9 Wash-in and wash-out perfusion curves of a microbubble agent (Albunex) in the myocardium before and afterangioplasty (PTCA).
Most systems developed in individual cen-tres have used small micro-computers andvideo frame grabbers. These acquire analoguevideo data from the video output on the ultra-sound scanner. Once a series of echocardio-
15 20Frame number
15 20Frame number
* Left ventricle Myocardium
Figure 10 Variation of integrated backscatter and mean frequency of the ultrasoundsignals from the left ventricular chamber and myocardium after injection ofa microbubblecontrast agent (Albunex). Each frame corresponds to one cardiac cycle: frames are triggeredfrom the R wave of the electrocardiogram.
graphic frames have been stored in the com-puter memory then an area of interest may beestablished on the image and changes in greylevel as a result of contrast injection evaluatedusing video densitometry. Unfortunately, asnoted earlier, there is a large amount of distor-tion and compression of ultrasound data bythe imaging system.
This data distortion has meant that quanti-tative analysis is difficult because a non-linearrelation exists between back-scattered ultra-sound intensity and grey level display.Furthermore, the comparative low contrastresolving power of current imaging systemsmeans that the small changes in backscatterecho intensity from the myocardium thatoccur as a result of intravenous contrast injec-tion are not detectable.To facilitate quantitative analysis of perfu-
sion, temporal changes in myocardial contrastenhancement have been analysed. An area ofinterest may be positioned over any portion ofthe image and changes in the grey level valuesplotted against time. This provides a contrastwash-in and wash-out curve. These curveshave been analysed in a number of differentways and parameters such as the peak greylevel, wash-out half-time, area under curveand wash-in time have been utilised by severalauthors.50-54 An example of a perfusion curve isshown in figure 9.Methods based upon backscatter signal
intensity and grey level data seem adequate forintracoronary injections of contrast wherechanges in signal amplitude are relativelylarge. However, as previously mentioned, theyappear insensitive for the detection of the verysmall quantities of microbubbles appearing inthe myocardium after intravenous injection oftranspulmonary agent. In addition, they haveonly been tested in experimental situationswhere image quality was optimum.55 56
Analysis of the unprocessed radiofrequencyultrasound signals, returning from the imagingtransducer to the ultrasound system, may pro-vide a sensitive method of detecting any smallchanges in backscattered signal amplitude.The radiofrequency signal may be analysed
0.40
= 0.35
0.30
Ca,, 0.25
Ca0 0.20CO)Q0 0-15
X 0.10CD
-' 0.05
0
2.40
2.35
2.30N
2.25
> 2.20CDa 2.15a)
2.10
2.05
2.00
1.95
14
on 31 Decem
ber 2018 by guest. Protected by copyright.
http://heart.bmj.com
/H
eart: first published as 10.1136/hrt.75.6_Suppl_2.9 on 1 June 1996. D
ownloaded from
New technology in echocardiography II: imaging techniques
not only for changes in backscattered ampli-tude, but also for any changes in its frequencyspectrum that might have occurred as a resultof interaction with contrast microspheres.57From an instrumentation point of view, it maybe technically easier to create methods foranalysis of small changes in frequency thansmall changes in amplitude. The backscatterfrom Albunex is frequency dependent and itsresonant frequency appears to be within thebandwidth of cardiac diagnostic imagingtransducers. Therefore, it is not surprising thatsignificant changes in the mean frequency ofthe scattered signal may be seen after Albunexinjections.58
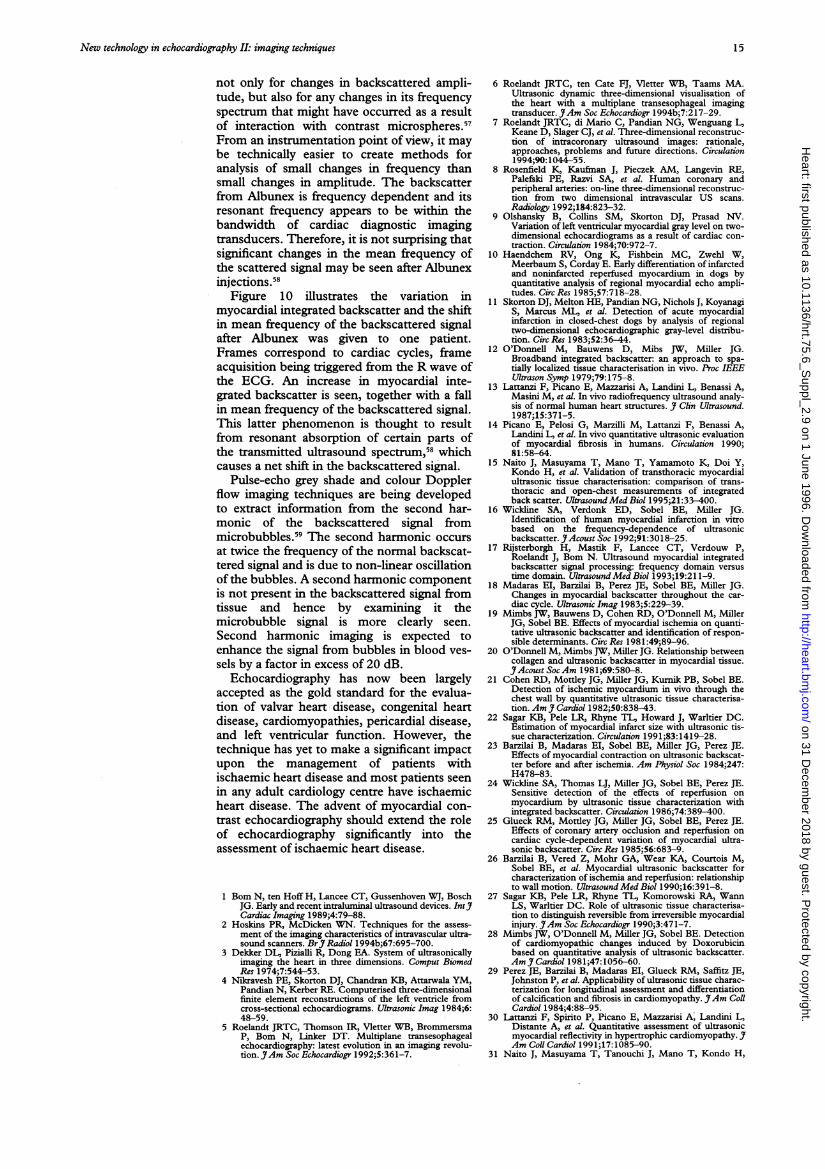
Figure 10 illustrates the variation inmyocardial integrated backscatter and the shiftin mean frequency of the backscattered signalafter Albunex was given to one patient.Frames correspond to cardiac cycles, frameacquisition being triggered from the R wave ofthe ECG. An increase in myocardial inte-grated backscatter is seen, together with a fallin mean frequency of the backscattered signal.This latter phenomenon is thought to resultfrom resonant absorption of certain parts ofthe transmitted ultrasound spectrum,58 whichcauses a net shift in the backscattered signal.
Pulse-echo grey shade and colour Dopplerflow imaging techniques are being developedto extract infornation from the second har-monic of the backscattered signal frommicrobubbles.59 The second harmonic occursat twice the frequency of the normal backscat-tered signal and is due to non-linear oscillationof the bubbles. A second harmonic componentis not present in the backscattered signal fromtissue and hence by examining it themicrobubble signal is more clearly seen.Second harmonic imaging is expected toenhance the signal from bubbles in blood ves-sels by a factor in excess of 20 dB.
Echocardiography has now been largelyaccepted as the gold standard for the evalua-tion of valvar heart disease, congenital heartdisease, cardiomyopathies, pericardial disease,and left ventricular function. However, thetechnique has yet to make a significant impactupon the management of patients withischaemic heart disease and most patients seenin any adult cardiology centre have ischaemicheart disease. The advent of myocardial con-trast echocardiography should extend the roleof echocardiography significantly into theassessment of ischaemic heart disease.
1 Bom N, ten Hoff H, Lancee CT, Gussenhoven WJ, BoschJG. Early and recent intraluminal ultrasound devices. IntJ7Cardiac Imaging 1989;4:79-88.
2 Hoskins PR, McDicken WN. Techniques for the assess-ment of the imaging characteristics of intravascular ultra-sound scanners. BrJ Radiol 1994b;67:695-700.
3 Dekker DL, Pizialli R, Dong EA. System of ultrasonicallyimaging the heart in three dimensions. Comput BiomedRes 1974;7:544-53.
4 Nikravesh PE, Skorton DJ, Chandran KB, Attarwala YM,Pandian N, Kerber RE. Computerised three-dimensionalfinite element reconstructions of the left ventricle fromcross-sectional echocardiograms. Ultrasonic Imag 1984;6:48-59.
5 Roelandt JRTC, Thomson IR, Vletter WB, BrommersmaP, Bom N, Linker DT. Multiplane transesophagealechocardiography: latest evolution in an imaging revolu-tion.3'Am Soc Echocardiogr 1992;5:361-7.
6 Roelandt JRTC, ten Cate FJ, Vletter WB, Taams MA.Ultrasonic dynamic three-dimensional visualisation ofthe heart with a multiplane transesophageal imagingtransducer. JAm Soc Echocardiogr 1994b;7:217-29.
7 Roelandt JRTC, di Mario C, Pandian NG, Wenguang L,Keane D, Slager CJ, et al. Three-dimensional reconstruc-tion of intracoronary ultrasound images: rationale,approaches, problems and future directions. Circulation1994;90:1044-55.
8 Rosenfield K, Kaufman J, Pieczek AM, Langevin RE,Palefski PE, Razvi SA, et al. Human coronary andperipheral arteries: on-line three-dimensional reconstruc-tion from two dimensional intravascular US scans.Radiology 1992;184:823-32.
9 Olshansky B, Collins SM, Skorton DJ, Prasad NV.Variation of left ventricular myocardial gray level on two-dimensional echocardiograms as a result of cardiac con-traction. Circulation 1984;70:972-7.
10 Haendchem RV, Ong K, Fishbein MC, Zwehl W,Meerbaum S, Corday E. Early differentiation of infarctedand noninfarcted reperfused myocardium in dogs byquantitative analysis of regional myocardial echo ampli-tudes. Circ Res 1985;57:718-28.
11 Skorton DJ, Melton HE, Pandian NG, Nichols J, KoyanagiS, Marcus ML, et al. Detection of acute myocardialinfarction in closed-chest dogs by analysis of regionaltwo-dimensional echocardiographic gray-level distribu-tion. Circ Res 1983;52:36-44.
12 O'Donnell M, Bauwens D, Mibs JW, Miller JG.Broadband integrated backscatter: an approach to spa-tially localized tissue characterisation in vivo. Proc IEEEUltrason Symp 1979;79:175-8.
13 Lattanzi F, Picano E, Mazzarisi A, Landini L, Benassi A,Masini M, et al. In vivo radiofrequency ultrasound analy-sis of normal human heart structures. Jf Clin Ultrasound.1987;15:371-5.
14 Picano E, Pelosi G, Marzilli M, Lattanzi F, Benassi A,Landini L, et al. In vivo quantitative ultrasonic evaluationof myocardial fibrosis in humans. Circulation 1990;81:58-64.
15 Naito J, Masuyama T, Mano T, Yamamoto K, Doi Y,Kondo H, et al. Validation of transthoracic myocardialultrasonic tissue characterisation: comparison of trans-thoracic and open-chest measurements of integratedback scatter. Ultrasound Med Biol 1995;21:33-400.
16 Wickline SA, Verdonk ED, Sobel BE, Miller JG.Identification of human myocardial infarction in vitrobased on the frequency-dependence of ultrasonicbackscatter. JAcoust Soc 1992;91:3018-25.
17 Rijsterborgh H, Mastik F, Lancee CT, Verdouw P,Roelandt J, Bom N. Ultrasound myocardial integratedbackscatter signal processing: frequency domain versustime domain. Ultrasound Med Biol 1993;19:211-9.
18 Madaras EI, Barzilai B, Perez JE, Sobel BE, Miller JG.Changes in myocardial backscatter throughout the car-diac cycle. Ultrasonic Imag 1983;5:229-39.
19 Mimbs JW, Bauwens D, Cohen RD, O'Donnell M, MillerJG, Sobel BE. Effects of myocardial ischemia on quanti-tative ultrasonic backscatter and identification of respon-sible determinants. Circ Res 1981:49;89-96.
20 O'Donnell M, Mimbs JW, Miller JG. Relationship betweencollagen and ultrasonic backscatter in myocardial tissue.JAcoust SocAm 1981;69:580-8.
21 Cohen RD, Mottley JG, Miller JG, Kurnik PB, Sobel BE.Detection of ischemic myocardium in vivo through thechest wall by quantitative ultrasonic tissue characterisa-tion. Am J Cardiol 1982;50:838-43.
22 Sagar KB, Pele LR, Rhyne TL, Howard J, Warltier DC.Estimation of myocardial infarct size with ultrasonic tis-sue characterization. Circulation 1991;83: 1419-28.
23 Barzilai B, Madaras EI, Sobel BE, Miller JG, Perez JE.Effects of myocardial contraction on ultrasonic backscat-ter before and after ischemia. Am Physiol Soc 1984;247:H478-83.
24 Wickline SA, Thomas LJ, Miller JG, Sobel BE, Perez JE.Sensitive detection of the effects of reperfusion onmyocardium by ultrasonic tissue characterization withintegrated backscatter. Circulation 1986;74:389-400.
25 Glueck RM, Mottley JG, Miller JG, Sobel BE, Perez JE.Effects of coronary artery occlusion and reperfusion oncardiac cycle-dependent variation of myocardial ultra-sonic backscatter. Circ Res 1985;56:683-9.
26 Barzilai B, Vered Z, Mohr GA, Wear KA, Courtois M,Sobel BE, et al. Myocardial ultrasonic backscatter forcharacterization of ischemia and reperfusion: relationshipto wall motion. Ultrasound Med Biol 1990;16:391-8.
27 Sagar KB, Pele LR, Rhyne TL, Komorowski RA, WannLS, Warltier DC. Role of ultrasonic tissue characterisa-tion to distinguish reversible from irreversible myocardialinjury. JAm Soc Echocardiogr 1990;3:471-7.
28 Mimbs JW, O'Donnell M, Miller JG, Sobel BE. Detectionof cardiomyopathic changes induced by Doxorubicinbased on quantitative analysis of ultrasonic backscatter.Am J Cardiol 1981;47:1056-60.
29 Perez JE, Barzilai B, Madaras EI, Glueck RM, Saffitz JE,Johnston P, et al. Applicability of ultrasonic tissue charac-terization for longitudinal assessment and differentiationof calcification and fibrosis in cardiomyopathy. J Am CollCardiol 1984;4:88-95.
30 Lattanzi F, Spirito P, Picano E, Mazzarisi A, Landini L,Distante A, et al. Quantitative assessment of ultrasonicmyocardial reflectivity in hypertrophic cardiomyopathy. JAm Coil Cardiol 1991;17:1085-90.
31 Naito J, Masuyama T, Tanouchi J, Mano T, Kondo H,
15
on 31 Decem
ber 2018 by guest. Protected by copyright.
http://heart.bmj.com
/H
eart: first published as 10.1136/hrt.75.6_Suppl_2.9 on 1 June 1996. D
ownloaded from

McDicken, Moran, Hoskins, Monaghan, Sutherland
Yamamoto K, et al. Analysis of transmural trend ofmyocardial integrated ultrasound backscatter for differ-entiation ofhypertrophic cardiomyopathy and ventricularhypertrophy due to hypertension. J Am Coil Cardiol1994;24:517-24.
32 Vered Z, Barzilia B, Mohr BA, Thomas U, Genton R,Sobel BE, et al. Quantitative ultrasonic tissue characteri-sation with real-time integrated backscatter imaging innormal human subjects and in patients with dilated car-diomyopathy. Circulation 1987;5:1067-73.
33 Vandenberg BF, Rath I, Shoup TA, Kerber RE, CollinsSM, Skorton DJ. Cyclic variation of ultrasound backscat-ter in normal myocardium is view dependent: clinicalstudies with real time backscatter imaging system. J7AmSoc Echocardiogr 1989;2:308-14.
34 Lange A, Moran CM, Palka P, Fenn LN, Sutherland GR,McDicken WN. The variation of integrated backscatterin human hearts from different ultrasonic transthoracicviews. J7Am Soc Echocardiogr 1995;8:830-8.
35 Kaul S, Force T. Assessment of myocardial perfusion withcontrast two-dimensional echocardiography. In: WeymanAE, ed. Ptinciples and practice of echocardiography. 2nd ed.Lea and Febiger 1993;687-720.
36 Bommer WJ, Miller L, Takeda P, Mason DT, De MariaANL. Contrast echocardiography: Pulmonary transmis-sion and myocardial perfusion injury using surfactant sta-bilized microbubbles. Circulation 1979;59:IV-203.
37 Ziskin MC, Bonakdapour A, Weinstein DP, Lynch PR.Contrast agents for diagnostic ultrasound. Invest Radiol1972;7:500-5.
38 Feinstein SB, ten Cate FJ, Zwehl W, Ong K, MaurerG, Tei C, et al. Two dimensional contrast echo-cardiography, 1: in vivo development and quantitativeanalysis of echo contrast agents. JAm Colt Cardiol 1984;3:14-20.
39 Keller MW, Segal SS, Kaul S, Duling BR. The behaviourof sonicated albumin microbubbles in the microcircula-tion: A basis for their use as myocardial echo contrastagents. JAm Coil Cardiol 1988;11:75A.
40 Feinstein SB, Heindrich PA, Dick CD, Schneider JM,Pastoret AF, Rubenstein WA, et al. Albunex: A newintravascular ultrasound contrast agent: Preliminarysafety and efficacy results. Circulation 1988;78:II-565.
41 Barnhart J, Leven H, Villapando E. Characteristics ofAlbunex: Air-filled albumin microspheres for echocardio-graphy contrast enhancement. Invest Radiol 1990;25:S162-4.
42 Fritsch T, Hilmann J, Kampfe M. SHU 508A a transpul-monary echo contrast agent: Initial experience. InvestRadiol 1990;25: 160-1.
43 Unger E, Lund PJ, Shen DK, Fritz TA, Yellowhair DE,New TE. Nitrogen-filled liposomes as a vascular US con-trast agent: Preliminary evaluation. Radiology 1992;185:453-6.
44 Unger E, Shen DK, Fritz T, Lund P, Wu GL, Kulik B, et al.Gas-filled liposomes as echocardiographic contrastagents in rabbits with myocardial infarcts. Invest Radiol1993;28:1155-9.
45 Quay SC. Ultrasound contrast agent development: Phaseshift colloids (abstract). J Ultrasound Med 1994;13:S9.
46 Beppu S, Matsuda H, Shishido T, Miyatake K. Success ofmyocardiol contrast echocardiography by peripheralvenous injection methods: Visualisation of area at risk.Circulation 1993;88:I-401.
47 Ong K, Maurer G, Feinstein S, Zwehl W, Meerbaum S,Conday E. Computer methods for myocardial contrasttwo-dimensional echocardiography. J Am Coil Cardiol1984;3:1212-8.
48 Maurer G, Ong K, Haendchen R, Torres M, Tei C,Wood F, et al. Myocardial contrast two-dimensionalechocardiography: comparison of contrast disappearancerates in normal and underperfused myocardium.Circulation 1984;69:418-29.
49 Powsner SM, Wood J, Prieto P, Charleston D, FeinsteinSB. Computer acquisition of echocardiographic data forcontrast studies of myocardial perfusion. Circulation1987;76:suppl IV:505.
50 Powsner SM, Keller MW, Saniie J, Feinstein SB.Quantitation of echo contrast effects. Am J Physiol Imag1987;1: 124-8.
51 Monaghan MJ, Quigley PJ, Metcalfe JM, Jewitt DE.Assessment of myocardial perfusion by contrastenhanced digital subtraction echocardiography. J AmCoil Cardiol 1987;9:112A.
52 Monaghan MJ, Quigley PJ, Metcalfe JM, Thomas SD,Jewitt DE. Digital subtraction contrast echocardiogra-phy: A new method for the evaluation of regionalmyocardial perfusion. Br HeartJ 1988;59: 12-9.
53 ten Cate FJ, Serruys PW, Huang H, de Jong N, Roelandt J.Is the rate of disappearance of echo contrast from theinterventricular septum a measure of left anteriordescending stenosis? Eur HeartJ 1988;9:728-833.
54 Dick CD, Heidenreich P, Aronson S, Gluck D, Tamler B,Feinstein SB. Reproducible myocardial perfusion withintravenous contrast echocardiography. Circulation 1988;78 suppl II:5664.
55 Skyba DM, Jawaweera AR, Goodman NC, Ismail S,Camarano GP, Kaul S. Quantification of myocardial per-fusion with myocardial contrast echocardiography fromleft arterial injection of contrast: implications for venousinjection. Circulation 1994;90:1513-21.
56 de Jong N, Hoff L, Skotland T, Bom N. Absorption andscatter of encapsulated gas filled microspheres: theoreti-cal considerations and some measurements. Ultrasonics1992;2:95-103.
57 Glass JM, Yao LX, Rahko PS, Zagzebski JA. Frequencydependence of the backscatter coefficient of Albunex(abstract). JAm Coil Cardiol 1991;17:349.
58 Monaghan MJ, Metcalfe JM, Odunlami S, Thomas SD,Waaler A, Jewitt DE. Digital radiofrequency echocardiog-raphy in the detection of myocardial contrast followingintravenous administration of Albunex. EurHeartJY 1993;14: 1200-19.
59 Burns PN, Powers JE, Fritzsch T. Harmonic imaging: newimaging and Doppler method for contrast-enhancedultrasound. Radiology 1992;182(P):142.
16
on 31 Decem
ber 2018 by guest. Protected by copyright.
http://heart.bmj.com
/H
eart: first published as 10.1136/hrt.75.6_Suppl_2.9 on 1 June 1996. D
ownloaded from