New technology adoption in an innovative marketplace … · International Journal of Forecasting 7...
14
International Journal of Forecasting 7 (1901) 257-270 North-Holland 257 New technology adoption in an innovative marketplace: Micro- and macro-level decision making models Eileen Bridges * Jesse H. Jones Graduate School of Administration, Rice Unir’ersity, Houston, TX 77251, USA Anne T. Coughlan * Kellogg Graduate School of Management, Northwestern Unillersity, Ecanston, IL 60208, USA Shlomo Kalish * Recanati Graduate School of Management, Tel Ark, Unirlersity, Ramat-Al,il’, 69978 Tel-Arks, Israel Abstract: Innovative markets are those which are undergoing rapid development due to changing customer needs or improving technological capability. Because these markets are so dynamic, new products are introduced frequently, and there is a high degree of uncertainty regarding their potential for success. We review literature relevant to firm decision-making, including such topics as timing the adoption of a technological innovation, determining optimal spending on an innovative technology, and predicting the success of a class of products which are based on a particular innovative technology. We consider these problems both at the micro (individual firm) and macro (aggregate) levels. Keywords: Innovation, Diffusion, Technology, Adoption A major means of competition in capitalistic economies is the introduction of innovations, some of which carry with them substantial profits. Successful innovations represent improvements over existing alternatives, replacing older prod- ucts through a process of ‘creative destruction’. Over time, then organizations which do not inno- vate will not be able to compete [Schumpeter (194211. This process is accelerated in ‘innovative markets’, i.e. product markets where the rate of commercialization of innovations is high. Our fo- cus is on such markets, and in particular, on the * The authors wish to express their appreciation to the Mar- keting Science Institute for providing funding for this re- search. desirability and timing of adoption of new tech- nologies in these markets. Innovative markets are characterized by change and uncertainty. Early models for adoption of innovation generally represented the marketplace deterministically, and made their recommenda- tions based on assumptions of certainty. Al- though more recent models incorporate dynamic effects (such as learning) and risk, their recom- mendations to the decision maker have not changed dramatically. Rather, they elaborate on and improve the earlier models, and provide un- derstanding of additional variables. There are other literature reviews which cover topics included in this survey. Kamien and Schwartz (1982) and Reinganum (1989) describe 0169-207O/Y1/$03.50 0 1091 - Elsevier Science Publishers B.V. All rights reserved
Transcript of New technology adoption in an innovative marketplace … · International Journal of Forecasting 7...

International Journal of Forecasting 7 (1901) 257-270
North-Holland 257
New technology adoption in an innovative marketplace: Micro- and macro-level decision making models
Eileen Bridges *
Jesse H. Jones Graduate School of Administration, Rice Unir’ersity, Houston, TX 77251, USA
Anne T. Coughlan *
Kellogg Graduate School of Management, Northwestern Unillersity, Ecanston, IL 60208, USA
Shlomo Kalish *
Recanati Graduate School of Management, Tel Ark, Unirlersity, Ramat-Al,il’, 69978 Tel-Arks, Israel
Abstract: Innovative markets are those which are undergoing rapid development due to changing customer needs or improving technological capability. Because these markets are so dynamic, new products are introduced frequently, and there is a high degree of uncertainty regarding their potential for success. We review literature relevant to firm decision-making, including such topics as timing the adoption of a technological innovation, determining optimal spending on an innovative technology, and predicting the success of a class of products which are based on a particular innovative technology. We consider these problems both at the micro (individual firm) and macro (aggregate) levels.
Keywords: Innovation, Diffusion, Technology, Adoption
A major means of competition in capitalistic economies is the introduction of innovations, some of which carry with them substantial profits. Successful innovations represent improvements over existing alternatives, replacing older prod- ucts through a process of ‘creative destruction’. Over time, then organizations which do not inno- vate will not be able to compete [Schumpeter (194211. This process is accelerated in ‘innovative markets’, i.e. product markets where the rate of commercialization of innovations is high. Our fo- cus is on such markets, and in particular, on the
* The authors wish to express their appreciation to the Mar-
keting Science Institute for providing funding for this re- search.
desirability and timing of adoption of new tech- nologies in these markets.
Innovative markets are characterized by change and uncertainty. Early models for adoption of innovation generally represented the marketplace deterministically, and made their recommenda- tions based on assumptions of certainty. Al- though more recent models incorporate dynamic effects (such as learning) and risk, their recom- mendations to the decision maker have not changed dramatically. Rather, they elaborate on and improve the earlier models, and provide un- derstanding of additional variables.
There are other literature reviews which cover topics included in this survey. Kamien and Schwartz (1982) and Reinganum (1989) describe
0169-207O/Y1/$03.50 0 1091 - Elsevier Science Publishers B.V. All rights reserved

models for firm adoption of innovation, and Gatignon and Robertson (1988) discuss organiza- tion adoption decisions in a competitive cnviron- ment. Mahajan, Muller and Bass (1990) provide an extensive review of deterministic models for diffusion of innovation; Kalish and Sen (1986) discuss the impact of marketing mix variables on diffusion. Stochastic models for innovation diffu- sion arc reviewed by Eliashberg and Chatterjce ( 1986).
Our survey differs from previous reviews in that we address timing of new technology adop- tion both at the micro (individual firm) level and at the macro (aggregate) level. We first discuss models which aid individual firms in decisions regarding innovation adoption and the timing thereof. Next, we consider aggregate sales models which predict marketplace behavior. These two levels of adoption behavior are actually interde- pendent: firm decisions may be aggregated to estimate overall market growth, but predictions of market growth are useful to each individual firm in deciding upon its strategy. Therefore, we suggest future research developing models to dc- scribe this micro- and macro-level interdepen- dence, and using the results to make normative recommendations.
1. The individual firm adoption decision
A new technology available to a firm may be an industrial ‘process’ innovation, providing im- provement to the production process, or a ‘prod- uct’ innovation, which may be incorporated into a product or service. For example, Hewlett-Packard (HP) may wish to incorporate a new integrated circuit technology into a microprocessor chip for personal computers (PCs). If the major benefit obtained from use of the technology is a reduc- tion in production costs, we say that HP is consid- ering adoption of a process innovation. If the primary benefit is a faster PC, HP would be adopting a product innovation. We use the term ‘adoption’ in Part 1 to denote the time at which a firm begins using an innovative technology. The first firm to adopt a new technology is called an ‘innovator’; we occasionally refer to later adopters as ‘imitators’.
Firms considering use of a new technology must decide whether and when to adopt. In gen-
eral, this involves comparing the present value of expected benefits of innovation to the present value of the cost. A complicating factor is that an innovation may be available for purchase (and have a known present value of cost), or it may be developed by the adopting firm, requiring some flow of expenditures during an uncertain devel- opment period (so the present value of cost is not known).
Part I of this review describes models designed to aid in the firm’s decision regarding adoption of a new technology. Some of the topics included are timing of the adoption, optimal expenditures for either purchase of an innovation or a flow of development costs, and comparison of multiple future innovations.
1.1. Timing of firm innor>ation
A number of researchers, particularly in the economics literature, have addressed the problem of individual firm timing of innovation adoption. If the decision is modeled deterministically, a firm need only consider known future events in deciding whether and when to adopt a new tech- nology. For example, Barzel (1968) develops a decision theoretic model which compares the pre- sent value of cost savings (or profit gains) to the present value of the investment required to ob- tain the innovation. In this model, the net present value (NPV) is the difference between antici- patcd cost savings and investment cost:
Npv = kX,, e p(‘pp)’ -I ep” for r>p,
r-p
where k = cost savings per unit of product manufac-
tured, X,, = demand for the product at time 0,
P = growth rate of demand, r = discount rate, I = investment cost required to obtain the
technology. Solving for the optimal time of innovation
adoption, Barzel obtains:
In(r) + In( I) - In( kX,,) t Opt = for r>p.
P
If t,p, is replaced into the original expression for NPV, the results indicate that the optimal time of adoption occurs when the present value of invest- ment cost is equal to the present value of produc- tion cost savings. Thus, the optimal adoption time balances the cost of earlier adoption and the cost of producing without the innovation. This optimal adoption time is earlier if there are decreases in the required investment or in the discount rate (either of which leads to decreases in adoption cost), or if there are increases in initial demand, growth rate of demand, or cost savings per unit.
Barzel’s deterministic model does not allow for the probabilistic effects of competition on the individual firm’s adoption timing decision. Kamien and Schwartz (1972) extend his model such that if the firm is first to adopt the new technology, rewards are greater than if the firm adopts after at least one competitor has adopted. To do this, their model for production cost sav- ings (or increased revenue> incorporates a ‘com- posite rival,’ represented by a probability distri- bution over possible dates for rival adoption. Pro- duction cost savings (or additional profit contri- bution) are assumed to be greater for the firm which adopts earlier. Investment costs are mod- eled as being independent of the firm’s status as first or later adopter. Similar to Barzel, Kamien and Schwartz conclude that the firm’s adoption time should be earher if the rewards for first adoption increase, or if the rewards for later adoption decrease. They also note that if the probability of early rival adoption increases, the firm should innovate earlier.
Surnmar3:: The optimal adoption time is earlier for lower investment costs, higher expected prof- its, lower rewards for later adoption, or a higher probability of early rival innovation.
ExampEe: One example of differences in adop- tion timing is the speed at which retailers begin stocking various types of products. Consider, for example, department stores which sold both Cab- bage Patch dolls and home computers. There was good reason for Cabbage Patch dolls to be adopted into a store’s line more quickly than home computers: the dolls required a much smaller investment to se11 successfully (because sales personnel did not need special training); also, there was a large proven market for the dolls, while there was doubt as to the size of the home computer market. Thus, Cabbage Patch
dolls were characterized by a lower cost of adop- tion than home computers, and they also offered a high initial demand.
1.2. Optimal R&D ~xp~ndit~r~.~ for inmwatiotz
If a firm develops an innovative technology in-house (as opposed to purchasing the technol- ogy), the investment cost is not incurred at a single point in time, but instead requires a stream of expenditures. In this case, the expenditure per period influences the timing of innovation: higher rates of investment are expected to lead to earlier innovation. The optimal investment in an innova- tion is criticahy dependent on whether the model assumes that the innovation is purchased with a one-time investment or with a flow of develop- ment expenditures which may be curtailed imme- diately upon rival innovation.
Assuming a flow of development costs, Kamien and Schwartz (1978) use a decision theoretic model to determine a firm’s optimal expenditure plan as a function of time. They assume an ex- pected profit stream that depends on relative timing of the firm’s innovation and rival innova- tion (which is assumed to follow a probability distribution). Their analysis indicates that as the number of competitors increases, a rival innova- tion is expected earlier, and the firm’s optimal investment rate increases, in order to obtain an earlier innovation. Also, a firm which has the only currently successful technology will not be motivated to innovate unless threatened by the possibility of rival innovation. If a rival does enter the market, leading to severely decreased re- wards, investment may slow or cease; however, if rewards for imitation are large enough, invest- ment may increase upon rival innovation.
Because earlier models assume a probability distribution for rival innovation, Lout-y (1979, p. 396) notes that ‘R&D strategies chosen by other market participants . . . cannot be treated as a parameter’. To avoid forcing rival response into a prespecified distribution, Loury develops a game-theoretic model for n identical firms, in which he treats innovation as a stochastic func- tion of R&D investment; thus, the firm’s innova- tion time and rival innovation times are both uncertain. In this model, investment costs and profits due to successful (i.e. first) innovation are given as the present value of infinite flows, and

later adopters receive no reward. Thus, in con- trast to Kamien and Schwartz, he models invest- ment cost as a one-time expenditure. This leads to the opposite result regarding the optimal in- vestment strategy: as the number of competing firms increases, the optimal investment per firm decreases. Lee and Wilde (1980) use a model similar to Loury’s, but instead of modeling R & D investment as a one-time cost, they allow for both a fixed cost and a continuing flow of expendi- tures. Their results agree with those of Lout-y and of Kamien and Schwartz, in that if both fixed and flow costs are incurred, whichever has the larger present value dominates the other in determining the effects of number of competing firms on investment strategy.
Reinganum (1981a, 1982) obtains a similar R 81 D spending plan using a more general game theoretic model. In her research, rival firms com- pete to be the first to innovate; perfect patent protection is assumed, so that only the first adopter receives rewards. Timing of the innova- tion is modeled as a stochastic random variable whose distribution improves (likelihood of inno- vation increases) as R&D expenditures increase. The model incorporates uncertainty both in the expenditures required for innovation and in the date of rival innovation. Reinganum’s optimal R&D spending path indicates that perfect patent protection leads to increases in innovative activ- ity, while increasing likelihood of R&D imitation and rewards for imitation lead to decreases in innovative activity. These results are consistent with those of Lee and Wilde because develop- ment costs are modeled as flow costs; if one-time expenditures were used instead, increasing rivalry would lead to lower investment in R&D, similar to the result obtained by Loury.
Surnmu~: If the firm’s investment requires a one-time expenditure, then the optimal invest- ment is larger when there is a smaller probability of rival innovation. If the investment requires a flow of expenditures, and a rival hus not yet innovated, then the optimal rate of investment is larger when there is a higher probability of rival innovation, when patent protection increases, and when rewards for imitation decrease. If the in- vestment requires a flow of expenditures and a rival has already innovated, the optimal rate of investment is larger if rewards for imitation in- crease.
Exumples: As an example of a one-time R&D investment, consider the City of Houston’s re- quest for proposals to develop a light rail system. Several firms have submitted designs and bids for construction of the system. The ‘winner’ will be the firm which receives the contract; this firm will obtain the rewards accruing to the first innovator. Theoretical results suggest that to encourage the greatest possible R&D investment from each competitor, it may have been optimal for the City to limit the number of rivals permitted to submit proposals. Without this restriction, firms may not have incentive to invest a sufficient amount in the proposal preparation, due to the low probability of winning the contract.
As an example of R & D investments requiring a flow of expenditures, consider the development of semiconductor components. Computer mem- ory chip (DRAM) design offers a considerable reward for imitation: although the first firm to introduce a 16 megabit DRAM is expected to reap the greatest rewards, firms which enter the market later are still expected to make a profit. The design of microprocessors is more of a ‘winner takes all’ proposition. When Intel intro- duced the 80386 in 1985, it was the most powerful microprocessor on the market and was compati- ble with Intel’s earlier models, but is was not covered under previous licensing agreements with other manufacturers. Intel protected the design and was able to be the sole supplier of the 80386, thus obtaining full rewards of innovation.
1.3. Incorporating uncertain rewards to inno~~ators
Some of the models described thus far make timing of innovation a stochastic function of R&D spending. However, none of the above models incorporates the effects of uncertain profitability on timing of innovation adoption. Reinganum (1983) allows for uncertain rewards to innovators and finds that the higher a firm’s costs are for using the current technology, the more likely that firm is to innovate. This conclusion is plausible, because less is at risk if current costs are high.
Jensen (1982) also incorporates uncertain prof- itability, by assuming that a firm has a prior probability regarding the profitability of an inno- vation, which is revised indefinitely until a thresh- old probability is reached. The results indicate that firms should adopt an innovative rechnology

E. Bridges et al. / New technology adoption models 261
earlier if there is an increase in the expected profitability, or a decrease in the adoption cost or the discount rate. McCardle (1985) extends Jensen’s model, making it more realistic by as- suming a cost of delaying adoption and continu- ing to gather information. In addition, McCardle assumes two thresholds, defined as follows: if the probability that an innovation will be profitable exceeds the upper threshold, the firm should adopt, while if this probability crosses the lower threshold, the technology should be permanently rejected. Analysis of the model indicates that an increase in information cost or a decrease in the discount rate leads to a more rapid decision.
Another approach to stochastic modeling of innovation costs and rewards is offered by Mamer and McCardle (1987). In this game theoretic model, technological development and competi- tive activity are both modeled stochastically. Each firm is assumed to have a prior estimate of an innovation’s profitability, and to gather more in- formation regarding this profitability. Following Bayesian updating of the profitability estimate, a firm may adopt the innovation, reject the innova- tion, or continue to purchase information. In the analysis of this model, if a competitive firm is likely to introduce a (similar) substitute product, the firm should be less inclined to adopt, while if a complementary product is likely, the firm should be more inclined to adopt. These results are consistent with those obtained earlier for invest- ment requiring a one-time expenditure.
Summary: When rewards are uncertain, opti- mal firm adoption timing results are consistent with those obtained when rewards are assumed known.
1.4. What if more than one innovation is acailable or expected?
The models discussed to this point can be used to determine optimal timing of firm investment in a particular innovation (given assumptions), but if multiple innovations are available or expected, the decision is more difficult. In this case, a selection must be made among the alternatives, and timing of the investment(s) optimized.
When multiple innovations are available simul- taneously, a firm may compare all of the alterna- tives and select the best one. Jensen (1983) as- sumes that a firm must select one of two available
innovations; a prior probability is updated until sufficient information gathering eventually leads the firm to select the better innovation. A more realistic approach to multiple innovations is sug- gested by Balcer and Lippman (1984). If a firm expects a stream of innovations, a decision must be made to either adopt the best curent technol- ogy or to postpone adoption. If a firm decides to tolerate a certain degree of technological ‘gap’ between its own technology and the best cur- rently available technology, adoption will not oc- cur until the gap exceeds this threshold. Higher expectations regarding future innovations lead to a higher threshold and consequently, later adop- tion. An implication of this result is that an ‘existing technology which was previously rejected may be adopted, if an expected advance does not occur, because the lack of this advance leads to a reduction in expectations. Another important im- plication is that increased uncertainty does not necessarily lead to slower adoption: it implies a wider spread of expectations and consequently a wider range of adoption times (both earlier and later than previously).
Weiss and John (1989) develop a similar adop- tion time decision model, incorporating uncer- tainty, belief updating, technological obsoles- cence, switching cost, and technological expecta- tions. Their model allows three possible deci- sions, including adopting, waiting for more infor- mation, or ‘leapfrogging’, which is defined by the authors as a decision to wait for the next techno- logical generation before adopting. Analysis of the model indicates that adoption is more likely for firms having a large technological gap, while leapfrogging is more likely for firms expecting greater technological improvements and/or ear- lier introductions of these improvements.
Summary: A firm making a decision among a stream of innovations is more likely to postpone adoption if it has higher expectations of future developments or if its current technology is more advanced.
Example: The situation in the steel industry which faced U.S. and Japanese steel producers at the end of World War II is an example of how adoption speed depends on technological gap. Japanese steel production facilities had all been destroyed, so their technological gap was im- mense. The Japanese quickly adopted the latest production technology, while U.S. producers did
Exh
ibit
1
Indi
vidu
al
firm
ad
optio
n de
cisi
ons.
Aut
hor/
date
Mod
e1
type
N
o.
of f
irm
s
in m
arke
t
Typ
e of
expe
nditu
re
for
inno
vatio
n
Any
re
war
d5
to i
mita
tors
Key
fi
ndin
gs
Bar
zel
Dec
isio
n 1
(196
8)
theo
ry
Kam
ien
and
Schw
artz
(197
2)
Kam
ien
and
Schw
artz
(197
8)
Lou
ry
(197
9)
Lee
an
d
Wild
e
(198
0)
Rei
ngan
um
(198
1al
Dec
isio
n
theo
ry
Dec
isio
n
theo
ry
2 (one
fi
rm
is
a ‘c
ompo
site
riva
l’)
Gam
e
theo
ry
Gam
e
theo
ry
tone
fi
rm
is
a co
mpo
site
riva
l)
n n
Rei
ngan
um
(198
2)
n
Rei
ngan
um
(198
3)
Jens
en
(198
2)
McC
ardl
e
(198
5)
Mam
er
and
McC
ardl
e
(198
7)
Jens
en
(198
3)
2
Com
bine
s
gam
e an
d
deci
sion
th
eory
Com
bine
s
gam
e an
d
deci
sion
th
eory
Gam
e
theo
ry
Dec
isio
n
theo
ry
Dec
isio
n
theo
ry
Gam
e
theo
ry
1 2
Dec
isio
n
theo
ry
1
Bal
cer
and
Lip
pman
(198
4)
Dec
isio
n
theo
ry
Wei
ss
and
John
(198
9)
Dec
isio
n
theo
ry
1
One
-tim
e
One
-tim
e
Flow
One
-tim
e
(pre
sent
va
lue)
One
-tim
e
plus
fl
ow
Flow
Flow
One
-tim
e
One
-tim
e
One
-tim
e
plus
fl
ow
One
-tim
e
plus
fl
ow
One
-tim
e
One
-tim
e
One
-tim
e
Non
e
Red
uced
as
com
pare
d to
firs
t ad
opte
r
Red
uced
as
com
pare
d to
firs
t ad
opte
r
Non
e
Non
e
Non
e
Non
e
Non
e
Non
e
Non
e
Yes
Non
e
Non
e
Non
e
Inno
vatio
ns
shou
ld
be
adop
ted
earl
ier
if t
here
ar
e de
crea
ses
in t
he
requ
ired
in
vest
men
t or
in
the
di
scou
nt
rate
, or
if
the
re
are
incr
ease
s in
initi
al
dem
and,
gr
owth
ra
te
of d
eman
d,
or c
ost
savi
ngs
per
unit.
Inno
vatio
ns
shou
ld
be
adop
ted
earl
ier
if t
he
prob
abili
ty
of r
ival
in
nova
tion
incr
ease
s or
if
the
re
war
ds
for
inno
vatin
g in
crea
se.
Inno
vatio
ns
shou
ld
be
adop
ted
late
r if
the
pr
obab
ility
of
riv
al
imita
tion
incr
ease
s,
or
if t
he
rew
ards
fo
r im
itatin
g in
crea
se.
Incr
ease
s in
com
petit
ion
lead
to
inc
reas
es
in o
ptim
al
inve
stm
ent
in i
nnov
atio
n.
Mon
opol
ists
w
ith
little
th
reat
of
riv
al
inno
vatio
n ha
ve
little
m
otiv
atio
n to
inve
st
in d
evel
opm
ent
of n
ew
tech
nolo
gy.
Incr
ease
s in
num
ber
of c
ompe
titor
s (n
) le
ad
to d
ecre
ases
in
per
fi
rm
R&
D
inve
stm
ent.
Incr
ease
s in
num
ber
of c
ompe
titor
s (n
) le
ad
to i
ncre
ases
in
per
fi
rm
R&
D
inve
stm
ent,
if t
his
inve
stm
ent
is p
rim
arily
a
flow
of
exp
endi
ture
s.
No
unam
bigu
ous
resu
lts
are
obta
ined
, du
e to
com
plex
ity
of t
he
proc
ess.
Perf
ect
pate
nt
prot
ectio
n,
low
pro
babi
lity
of i
mita
tion,
an
d lo
w r
ewar
ds
for
imita
tion
lead
to
inc
reas
es
in i
nnov
ativ
e ac
tivity
.
The
hi
gher
a
firm
’s
curr
ent
cost
s ar
e.
the
mor
e lik
ely
that
fi
rm
shou
ld
be t
o in
nova
te.
Firm
s sh
ould
ad
opt
inno
vativ
e te
chno
logy
ea
rlie
r if
the
re
is a
dec
reas
e in
the
adop
tion
cost
or
an
in
crea
se
in t
he
disc
ount
ra
te
or
the
expe
cted
pr
ofita
bilit
y.
Firm
s sh
ould
ga
ther
le
ss
info
rmat
ion
prio
r to
an
adop
tion
deci
sion
if t
he
cost
of
sea
rch
incr
ease
s or
th
e di
scou
nt
rate
de
crea
ses.
Firm
5 sh
ould
be
le
ss w
illin
g to
ado
pt
if t
he
prof
itabi
lity
of a
com
petit
ive
subs
titut
e in
crea
ses.
an
d m
ore
will
ing
if t
he
prof
itabi
lity
of a
com
petit
ive
com
plem
ent
incr
ease
s.
By
gath
erin
g in
form
atio
n an
d up
datin
g pr
iors
, fi
rms
may
op
timiz
e a
choi
ce
betw
een
alte
rnat
e in
nova
tions
. T
his
deci
sion
de
pend
s on
th
e na
ture
of
th
e
info
rmat
ion
colle
cted
an
d on
ch
arac
teri
stic
s of
the
fi
rm.
Firm
s to
lera
te
a ce
rtai
n de
gree
of
tec
hnol
ogic
al
“gap
”,
they
ad
opt
a
new
te
chno
logy
w
hen
the
curr
ent
tech
nolo
gy
exce
eds
this
th
resh
old.
Hig
her
expe
ctat
ions
re
gard
ing
futu
re
inno
vatio
ns
lead
to
a h
ighe
r
thre
shol
d an
d co
nseq
uent
ly,
late
r ad
optio
n.
Ado
ptio
n is
mor
e lik
ely
for
firm
s ha
ving
a
larg
e te
chno
logi
cal
gap;
leap
frog
ging
is
mor
e lik
ely
for
firm
s ex
pect
ing
grea
ter
tech
nolo
gica
l
impr
ovem
ents
an
d/or
ea
rlie
r re
aliz
atio
n of
the
se
impr
ovem
ents
.

not upgrade their facilities. As a result, U.S. steel producers fell from their leadership position.
1.5. Conclusions regarding firm adoption decision models
The models reviewed in Part 1, for predicting timing of firm adoption of innovation, are theo- retically interesting and provide intuitively satisfy- ing normative results. However, the predictive variables used in these models are not generally available to marketplace decision makers. Luke- warm generic variables such as ‘high rewards to imitators’ are used in place of variables measur- ing fundamental market forces which influence actual firm decisions regarding timing. For exam- ple, rewards to imitators may be high if the first firm to innovate underestimates demand, if de- mand is segmented such that specialized entries targeted at particular market niches are expected to be profitable, or if reverse engineering allows a product with identical benefits to be produced at low cost without patent infringement.
Perhaps because of this incomplete mapping from the model variables to real-world funda- mentals, the theoretical models described in this section are generally not subjected to empirical testing. Testing this type of model on market- place data would increase credibility for the de- sign of the model and provide confirmation of the recommendations which stem from the analysis.
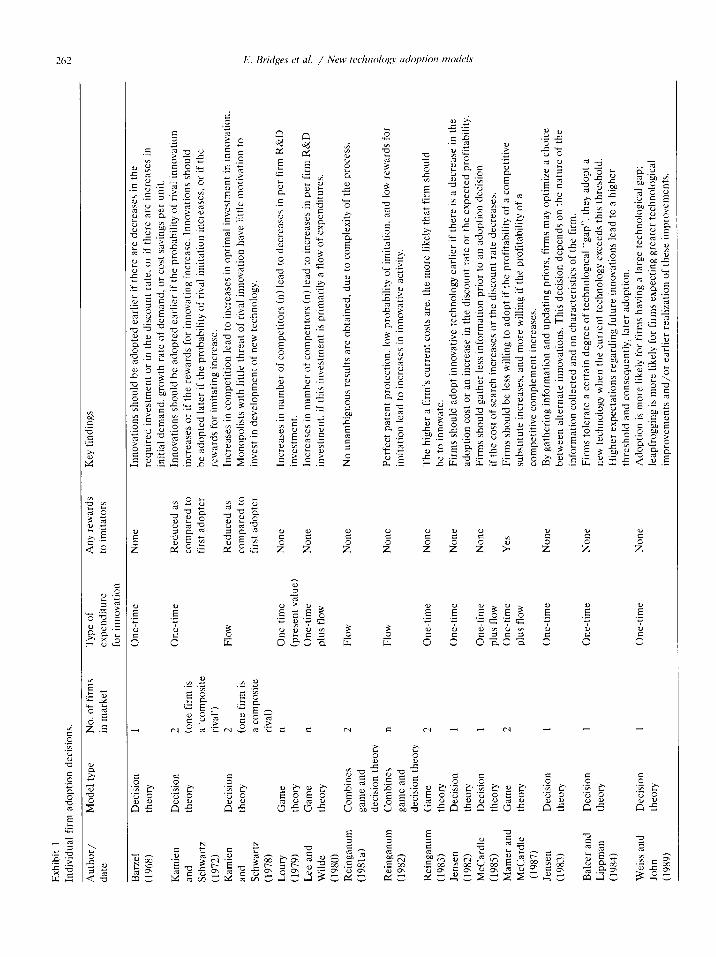
A summary of the firm adoption models dis- cussed in this section is provided in Exhibit 1.
2. Prediction of aggregate sales
Although the economics literature addresses modeling the timing of firm adoption of innova- tion, these models generally require a forecast of profits which will accrue following adoption. Whether the innovation reduces production costs or enhances the value of a product, the amount of profit due to the innovation depends on sales. Thus, to make an estimate of future profits, the firm needs to be able to forecast industry sales of the product over time.
In this section, we first discuss models which forecast aggregate sales as a new product diffuses into a homogeneous target market. Next, we con- sider recent models which include individual dif-
ferences, either by assuming a heterogeneous tar- get population described by a probability distri- bution, or by aggregating the results of individual level adoption decision models. In Part 2, we use the term ‘adopter’ to describe a purchaser of a product, whether this purchaser is a firm or a consumer. We use the words ‘innovative’ and ‘imitative’ to describe influences which affect a purchase decision: when a purchase is made due to imitative influences, information from previous purchasers (called ‘word-of-mouth effects’) im- pacts the decision, while if a purchase is innova- tive, this is not the case. There is, however, some overlap, because both influences may act in a purchase decision.
2.1. Aggregate level diffusion models
Diffusion models, which predict sales as a function of time, are commonly found in the marketing literature, although a few key papers are from economics. A large body of literature in marketing deterministically models the behavior of the target market at the aggregate level. Later models have incorporated uncertainty by making the models stochastic; however, very few of these have been developed, probably because they are difficult or impossible to solve analytically.
The simplest diffusion models assume that a fixed total potential market (or target population) exists for an innovation, and that each purchaser buys the innovation only once. The cumulative number of purchasers is modeled to approach this total potential (or some known fraction of it) as time passes.
One of these simple diffusion models is an ‘external influence’ model, which considers only influences outside the adopting population in predicting how many of the remaining potential market members will purchase during a particu- lar time period. External influences include ad- vertising, promotion, price, and distribution. An example of this type of model is that described by Fourt and Woodlock (19601, which has the form
Q<t+ 1) -Q(t) =a[M-Q(t)],
where Q(t) = the cumulative number of adopters at time
t. a = the ‘coefficient of innovation’, a constant
which indicates how likely members of the
target population are to innovate (given a constant set of external influences),
M = the maximum total number of adopters. In this model, the number of potential adopters who have not purchased by time t is given by
[M-Q(t)]. Another simple diffusion model is an ‘internal
influence’ model, which considers only influences within the adopting population in predicting pur- chases among the remaining members of the po- tential market. These influences include such ef- fects as word of mouth. Examples of this type of model are those of Mansfield (1961) and Fisher and Pry (19711, which have the form
where b = the ‘coefficient of imitation’, a constant which indicates how likely members of the target popu- lation are to imitate previous adopters in their adoption decision.
Blackman (1974) extends the internal influ- ence model such that products based on a new technology replace those based on an older tech- nology; he predicts market share for the new technology as a function of time. He notes that the rate of substitution of a new technology de- pends not only on its profitability and investment cost, but also on the nature of the industry. More innovative industries are generally more competi- tive and dynamic; they tend to be those which produce durable products, including aircraft, electrical machinery, and communication devices. Less innovative industries tend to produce non- durable products, such as paper. rubber, and textiles.
A generalized diffusion model, which com- bines the effects of external and internal influ- ence, is suggested by Bass (1969). His model takes the form
Q(t + 1) - Q<f,
where the variables are defined as they were previously. Bass applied this model to eleven consumer durable products, and was able to ob- tain good fits to actual data as well as successful prediction of sales growth for color television.
2.2. Enhuncements of aggregate lerlel dif@sion models
A number of improvements have been made to aggregate level diffusion models, to allow consid- eration of the impact of additional variables (such as marketing mix, changes in the potential mar- kct, and replacement purchases) on the diffusion of an innovation. For example, Horsky and Simon (1983) include effects of advertising in a Bass-type diffusion model for sales of banking services. They note that increasing advertising leads to greater external effects relative to internal ef- fects; consequently, advertising for a new product should optimally start high and decrease gradu- ally.
Another enhancement of a sales diffusion model relaxes the assumption of a fixed total potential adopter population. For example, Ma- hajan and Peterson (1978) modeled sales of wash- ing machines in the United States from 1950 to 1074. They used a generalized Bass-type model, with a dynamic potential market proportional to the number of housing starts during that time period. By allowing for a dynamic adopter popu- lation, the model obtained a significantly better fit to actual data, indicating that size of the potential market may impact diffusion. For addi- tional information on this topic, see Bass (1980), Horsky (19901, Kalish (19851, or Sharif and Ra- manathan (1981).
Defining a portion of sales as replacements (based on age of the products which have been sold and their expected life) has improved the performance of sales diffusion models [Kamakura and Balasubramanian (1987); Lilien, Rao, and Kalish (1981); Mahajan, Wind, and Sharma (1983); Olson and Choi (1985); Rao and Yamada (1988)]. Further improvement would be expected if multiple purchases for simultaneous use were considered separately.
Norton and Bass (1987) also segment pur- chasers, in a model for sales diffusion of inte- grated circuits based on sequential generations of technologies. Each technological innovation may be adopted by new users, and may attract a percentage of the market which has already adopted earlier technologies. A key assumption is that there is a constant per user per period aver- age consumption, and that sales growth comes through an increase in the number of users. This
assumption is believable for the integrated circuit industry, and the model obtains good fits to ac- tuaI sales peaks. However, the mode1 may not be generalizable to other industries.
Sales diffusion in the presence of supply re- strictions is modeled by Jain, Mahajan, and Muller (1991), following the work of Simon and Sebas- tian (1987). Both papers use data from monopolistic telephone companies; the former uses Israeli data and the latter uses German data. Jain et al. confirm a Simon and Sebastian finding that supply restrictions cause the diffusion curve to he negativeIy skewed (i.e. to have a slow growth rate and a rapid rate of decline). In addition, they show that an optimal marketing mix policy gener- ally includes monotonically decreasing advertising and monotonically increasing distribution, with advertising starting prior to distribution. This re- sult occurs because it is costly to make the prod- uct available, so advertising first creates a queue of applicants who will adopt immcdiateiy upon availability. Interestingly, in their empirical analy- sis, Jain et al. show that these waiting applica- tions tend to generate negative word-of-mouth, reducing the positive interna effects on diffusion due to word-of-mouth from previous adopters.
S’urnmauf: Both fits and forecasts obtained us- ing diffusion models are improved by incorporat- ing the effects of marketing mix variables like advertising, economic fundamentals like housing starts, and product characteristics like replace- ment propensity. External constraints on norma diffusion, such as supply restrictions, can over- turn some accepted intuition from the basic model as well.
A few aggregate level stochastic diffusion mod- els have been developed. Some of these are struc- turally stochastic, representing diffusion itself as a stochastic process. Tapiero (1983) models movements of target customers from unaware to aware to purchasing as a stochastic Markov pro- cess (having non-stationa~ transition probabili- ties). He describes methods for estimating param- eters of this modei under very general conditions; for example, the model may be modified to incor- porate a dynamic potential adopter population or a heterogeneous target market. Although a gen- eral analytical solution cannot be obtained, the
results of this model provide a better understand- ing of the impact of external and internal influ- ences on adoption behavior: for example, Tapiero finds that advertising may increase word-of~mout~ activity among aware potential buyers. Baker (1987) develops a model similar to that of Tapiero, but uses a counting process approach rather than a Markov process to stochastically model adop- tion of an innovation by members of a target population.
Aggregate level models may instead be para- metrically stochastic, incorporating stochasticity into the parameters of the modeI. For example, Lilien, Rao and Kalish (1981) incorporate five stochastic parameters into their repeat purchase diffusion model. Eliashberg, Tapiero and Wind (1987) model the coefficients of innovation and imitation in the Bass (1969) diffusion model as stochastic parameters. They observe that the tem- poral pattern for the stochastic model is always below that for the deterministic model, and sug- gest that when there are large differences, the stochastic model should be used. They note that the discrepancy is larger if the coefficient of imitation increases, either absolutely or relative to the coefficient of innovation.
Sr~~~zff~: Little incremental analytical insight is currently available due to taking a stochastic approach to modeling diffusion. Given the find- ing that diffusion patterns differ for deterministic and stochastic diffusion models, an empirical ap- plication can be expected to generate better fore- casts of dynamic sales patterns if the nature of uncertainty is correctly modeled.
2.4. Diffihm as an aggregate of individual adop-
tions
A key assumption of the diffusion models dis- cussed thus far is that the target market is homo- geneous. In order to relax this assumption, two types of extensions of diffusion models have been proposed to allow for heterogeneous potential target markets. The first type is a Markov process model, in which potential adopters move between various states (e.g. unaware, aware, purchaser), and during any given time period the members of each of these states have a fixed propensity to adopt [Jeuland (1981a, b); KaIish (1985); Oren and Rothkopf (198411. At the aggregate level, these models result in deterministic diffusion pat-

266
Exhibit 2
Diffusion of innovation.
E. Bridges et al. / New technology &option models
Author/date External Deterministic Level Variables found to influence diffusion
or internal or stochastic of model
effects
modeled
Fourt and External
Woodlock (1960) Mansfield (1961) Internal
Fisher and Fry (1971) Internal
Blackman (19741
Bass (I Y6Y)
Horsky and Simon (1983)
Bass (1980)
Horsky (1990)
Mahajan and
Peterson (1978)
Sharif and
Ramanathan
(1981)
Kamakura and
Balasubramanian
(1987)
Mahajan, Wind
and Sharma (1983) Olson and
Choi (1985)
Norton and
Bass (I 987)
Wilson and
Norton (1989)
Mahajan and
Muller (1989)
Simon and
Sebastian (1987)
Jain. Mahajan
and Muller (1989)
Tapiero (1983)
Boker (1987)
Eliashberg,
Tapiero and Wind (1987)
Lilien, Rao
and Kalish (1981)
Feder and
O’Mara (1982)
Jensen
(1982)
Reinganum
(1981b)
Quirmbach (1986)
Jeuland (1981a. b)
Internal
Both
Both
Both
Deterministic
Deterministic
Deterministic
Deterministic
Both Deterministic
Both Deterministic
Both Deterministic
Both Deterministic
Both Deterministic
Both Deterministic
Both Deterministic
Both Deterministic
Both
Both
Both
Both
Both
Both
Both
Deterministic
Deterministic
Deterministic
Deterministic
Stochastic
Stochastic
Stochastic
Both
Both
Stochastic
Stochastic
Both Stochastic
N/A Stochastic
N/A Stochastic
Both Stochastic
Deterministic Aggregate
Aggregate
Aggregate
Aggregate
Aggregate
Aggregate
Aggregate
Aggregate
Aggregate
Aggregate
Aggregate
Aggregate
Aggregate
Aggregate
Aggregate
Aggregate
Aggregate
Aggregate
Aggregate
Aggregate
Aggregate
Aggregate
Aggregate
of individual
level results
Aggregate of individual
level results
Aggregate of individual level results
Aggregate of individual level results
Aggregate
of individual
level results
Advertising effects
Dynamic maximum
Price, advertising, dynamic maximum, and income
Dynamic maximum
Dynamic maximum
Repeat purchases included
Repeat purchases included
Repeat purchases included
Considers multiple generations of technology
Considers incremental products based on one technology
Considers successive generations
Considers supply restrictions
Considers supply restrictions. advertising, and distribution
Structurally stochastic
Structurally stochastic
Stochastic parameters
Stochastic parameters
Incorporates firm’s Bayesian updating of profitability
Incorporates firm’s Bayesian updating of probability of success
Incorporates game theoretical assumptions regarding firm behavior
Incorporates game theoretical assumptions regarding firm behavior
Incorporates a Markov process describing consumer behavior
E. Bridges et al. / New technology adoption models 267
Exhibit 2 (continued)
Author/date External
or internal
effects
modeled
Deterministic
or stochastic
Level
of model
Variables found to influence diffusion
Kalish
(1985)
Oren and
Rothkopf
(1984)
Chatterjee
and Eliashberg
(1989)
Lattin and
Roberts
(1989)
Oren and
Schwartz
(1988)
Roberts
and Urban (1988)
Both
Both
Both
Both
Both
Both
Stochastic
Stochastic
Stochastic
Stochastic
Stochastic
Stochastic
Aggregate of individual
level results
Aggregate
of individual
level results
Aggregate
of individual
level results
Aggregate of individual
level results
Aggregate
of individual
level results
Aggregate of individual
level results
Incorporates a Markov process describing consumer behavior: price, advertising, and dynamic
maximum influence diffusion
Incorporates a Markov process describing consumer behavior
Incorporates consumer’s Bayesian updating of desirability
Incorporates consumer’s Bayesian updating of desirability
Incorporates consumer’s Bayesian updating of desirability
Incorporates consumer’s Bayesian updating of desirability
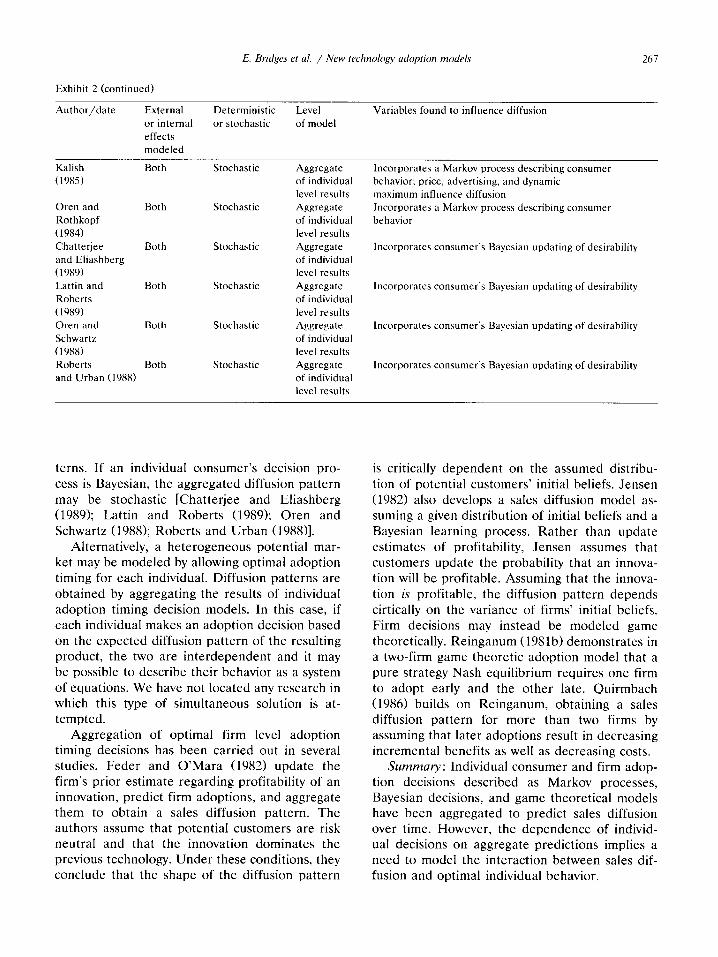
terns. If an individual consumer’s decision pro- cess is Bayesian, the aggregated diffusion pattern may be stochastic [Chatterjee and Eliashberg (1989); Lattin and Roberts (1989); Oren and Schwartz (1988); Roberts and Urban (198811.
Alternatively, a heterogeneous potential mar- ket may be modeled by allowing optimal adoption timing for each individual. Diffusion patterns are obtained by aggregating the results of individual adoption timing decision models. In this case, if each individual makes an adoption decision based on the expected diffusion pattern of the resulting product, the two are interdependent and it may be possible to describe their behavior as a system of equations. We have not located any research in which this type of simultaneous solution is at- tempted.
Aggregation of optimal firm level adoption timing decisions has been carried out in several studies. Feder and O’Mara (1982) update the firm’s prior estimate regarding profitability of an innovation, predict firm adoptions, and aggregate them to obtain a sales diffusion pattern, The authors assume that potential customers are risk neutral and that the innovation dominates the previous technology. Under these conditions, they conclude that the shape of the diffusion pattern
is critically dependent on the assumed distribu- tion of potential customers’ initial beliefs. Jensen (1982) also develops a sales diffusion model as- suming a given distribution of initial beliefs and a Bayesian learning process. Rather than update estimates of profitability, Jensen assumes that customers update the probability that an innova- tion will be profitable. Assuming that the innova- tion is profitable, the diffusion pattern depends cirtically on the variance of firms’ initial beliefs. Firm decisions may instead be modeled game theoretically. Reinganum (1981b) demonstrates in a two-firm game theoretic adoption model that a pure strategy Nash equilibrium requires one firm to adopt early and the other late. Quirmbach (1986) builds on Reinganum, obtaining a sales diffusion pattern for more than two firms by assuming that later adoptions result in decreasing incremental benefits as well as decreasing costs.
Summary: Individual consumer and firm adop- tion decisions described as Markov processes, Bayesian decisions, and game theoretical models have been aggregated to predict sales diffusion over time. However, the dependence of individ- ual decisions on aggregate predictions implies a need to model the interaction between sales dif- fusion and optimal individual behavior.

2.5. Conclusions regarding sales diffusion models
Aggregate level diffusion models are useful in forecasting sales over time for a new technology. Sales forecasts are necessary to determine whether or not an innovative technology should be adopted, and if so, the optimal time at which to adopt. These predictions arc also useful in planning production and in forecasting obsoles- cence of previous products.
Models for forecasting sales diffusion are be- ing improved and extended in useful directions. Incorporation of such managerially relevant vari- ables as product attributes, pricing, advertising, and distribution allows the model results to be applicable in a variety of decisions. Prediction of sales under such circumstances as changing po- tential market and restricted supply arc impor- tant in actual decision situations. Not only are the theoretical results which have been obtained intu- itively appealing, the majority of these models have been subjected to empirical testing for con- firmation of fit to marketplace data. We see a key future development direction as being integration of the sales diffusion forecast into other models which make use of estimates of future sales or profits. A summary of models described in this section is provided in Exhibit 2.
3. Conclusions and directions for future research
We review models for optimizing firms’ deci- sions regarding adoption of a technological inno- vation in Part 1. The models discussed in this section predict expenditure patterns and timing of firms’ adoption of innovation as a function of variables which are at best difficult to measure, such as rewards accruing to the first innovator, the expected cost and time required to obtain the knowledge needed to develop the innovation, the desirability of imitating the innovation should an- other firm develop it first, and the gap between the firm’s current technology and the innovation. Although the resulting models provide analytical results which are consistent with intuition, empir- ical testing for confirmation is generally not per- formed. Future research in this area would bene- fit from use of more concrete predictors and application of the models to marketplace data.
In Part 2, we discuss models useful in forecast- ing aggregate sales for products based on a new technology. These sales diffusion models gener- ally incorporate measurcable or controllable vari- ables such as size of the potential market, num- ber of previous adopters, and components of the merketing mix. The development of aggregate level sales diffusion models has taken useful, practical directions, and the majority of these models have been verified using data from the marketplace. Further development of these mod- els along the current lines will be valuable. Per- haps more importantly, the sales predictions from these models will be useful as inputs to other models.
Sales forecasts from diffusion models may be incorporated into models for firm adoption of innovation, as an indicator of expected profitabil- ity. Use of a diffusion curve to determine optimal timing of innovation is described by Kalish and Lilien (1986) and Yoon and Lilien (1986). Opti- mal timing of an incremental product based on the same technology as previous product(s) is discussed by Wilson and Norton (1989). Their analysis indicates that any incremental product should be introduced simultaneously with other product(s) based on the same technology, if it should be introduced at all. The authors call this the ‘now or never’ decision (p. 10). They test their results empirically using data for books which are printed in both hardcover and paperback. Timing the introduction of products based on successive generations of technologies may also make use of sales diffusion forecasts. Mahajan and Muller (1989) find that a new technology should be intro- duced either as soon as it is available, or else not until after the maturity stage of the previous generation. They call this the ‘ASAP or at matu- rity’ rule, which is a refinement of the ‘now or never’ rule of Wilson and Norton. Mahajan and Muller apply their model to introduction timing decisions for mainframe computers. Considerable further work is needed to better integrate sales diffusion models with firm innovation adoption models.
Sales forecasts impact firm decisions regarding adoption of a technological innovation which has not yet been adopted by other firms, as we have already discussed; these forecasts may also be useful in firm decisions to enter a market in which competing firms are already active. Al-
E. Bridges et al. / New technology adoption models 269
though the number of firms competing in an industry has been modeled previously [Gort and
Klepper (1982); Gottinger (1987)1, the attraction of a market depends on both the expected sales and the number of competitors. Therefore, we recommend development of models which cap- ture the interaction of sales and number of firms in the marketplace.
It has been suggested that there is an optimal number of products per firm for a given techno- logical innovation, and that this number is con- stant over time [Modis and Debecker (198811. We expect, however, that there is a more complex relationship between the optimal number of products and the optimal number of firms com- peting in the marketplace. One way to approach this question may be to model the relationship between sales and the number of products on the market. It may even be possible to simultaneously model sales, number of competing firms, and number of competing products. These are key directions for future research.
References
Balcer. Y. and S.A. Lippman. 1984, “Technological expecta-
tions and adoption of improved technology”, Journal of Economic Theory, 34. 292-318.
Barzel, Y.. 196X. “Optimal timing of innovations”. Ret,& r?f
Economics and Statistics, 34%X5.
Bass, F.M., 1969, “A new product growth model for consumer
durables”, Management Science. 15, 215-227. Bass, F.M., 1980, “The relationship between diffusion rates,
experience curves. and demand elasticities for consumer
durable technological innovations”. Journal of Business,
53. 3(2), SSl-Sh7. Blackman, A.W., 1974. “The market dynamics of technologi-
cal substitutions”. Technological Forecasting and Social
Change. 6, 41-63. Bilker, F., 1987, “A stochastic first purchase diffusion model:
A counting process approach”. Journal of Marketing Re-
search, 24. 64-73. Eliashberg, _I. and R. Chatterjee, 1986, “Stochastic issues in
innovation diffusion models”, in: V. Mahajan and Y. Wind.
eds., Innol,atlon Diffusion Models of New Product Accep-
tance (Ballinger. Cambridge, MA) 151-199.
Eliashberg. J.. C.S. Tapiero and Y. Wind, 1987, “Innovation
diffusion models with stochastic parameters: Forecasting and planning implications”. Working paper no. 87-003
(The Wharton School. University of Pennsylvania. Philadelphia, PA).
Feder, G. and G.T. O’Mara, 1982, “On information and innovation diffusion: A Bayesian approach”, American
Journal of Agricultural Economics, 64. I45- 147.
Fisher, J.C. and R.H. Pry, 1971, “A simple substitution model
of technological change”, Technological Forecasting and
Social Change, 3, 75-88.
Fourt, L.A. and J.W. Woodlock, 1960, “Early prediction of
market success for grocery products”, Journal of Market-
ing. 25,31-38.
Gatignon. H. and T.S. Robertson, 1988, “The adoption of
new technologies in a competitive environment”, Working
paper no. X8-007 (The Wharton School, University of
Pennsylvania, Philadelphia, PA).
Gort, M. and S. Klepper, 1982, “Time paths in the diffusion
of product innovations”, The Economic Journal, 92, 630-
653.
Gottinger, H.W., 1987, “Economic choice and technology
diffusion in new product markets”, Weltwirtschaftliches
Archic,. 123, 93-120.
Horsky, D., 1990. “A diffusion model incorporating product
benefits, price, income and information”. Marketing Sci-
ence, 9(4), 342-365. Horsky, D. and L.S. Simon, 1983. “Advertising and the diffu-
sion of new products”, Marketing Science, 2( 1). I - 17.
Jain, D., V. Mahajan and E. Muller, 1991. “Innovation diffu-
sion in the presence of supply restrictions”, Marketing
Science, IO(l). 83-90.
Jensen, R., 1982, “Adoption and diffusion of an innovation of
uncertain profitability”, Journal of Economic Theorv, 27,
182-193.
Jensen, R., 1983. “Innovation adoption and diffusion when
there are competing innovations”, Journal of Econornit
Theory. 2Y, 161-171.
Jeuland, A.P., 1981a. “Parsimonious models of diffusion of
innovation. Part A: Derivations and comparisons”, Work-
ing paper (University of Chicago, Chicago, IL).
Jeuland, A.P., 19Xlb, “Parsimonious models of diffusion of
innovation, Part B: Incorporating the variable of price”,
Working paper (University of Chicago. Chicago, IL).
Kalish. S.. 198.5. “A new product adoption model with price,
advertising, and uncertainty”. Management Science, 31( 12). 1569-1585.
Kalish, S. and G.L. Lilien. 1986. “A market entry timing model for new technologies”, Management Science. 32(2),
lY4-205.
Kalish. S. and S.K. Sen, lYX6. “Diffusion models and the
marketing mix for single products”. in: V. Mahajan and Y.
Wind. eds., Innol,ation Dij$sion Mode0 of New Product
Acceptance, (Ballinger, Cambridge, MA) 877115.
Kamakura, W.A. and S.K. Balasubramanian, 1987, “Long-
term forecasting with innovation diffusion models: The
impact of replacement purchases”. Journal of Forecasting, 6. 1-19.
Kamien, M.I. and N.L. Schwartz, 1972, “Timing of innova-
tions under rivalry”. Econometnca, 40(l), 43-60.
Kamien. MI. and N.L. Schwartz, 1978, “Potential rivalry.
monopoly profits and the pace of inventive activity”, Rr-
c,iew qf Ecorzomic Studies. 45, 5477557. Kamien, M.I. and N.L. Schwartz. 1982. Murket Structure and
Innot~ation. (Cambridge University Press, Cambridge, UK).
Lattin. J.M. and J.H. Roberts, 1989, “The role of individual-
level risk-adjusted utility in the diffusion of innovation”,
Working paper (Graduate School of Business. Stanford University, Stanford. CA).

Lee, T. and L.L. Wilde. 19X0. “Market structure and innova- tion: A reformulation”, Quarterly Jmrnul of‘ Econonrics,
94(2), 42Y%4.36.
Lilien, G. L., A.G. Rao and S. Kalish, 19x1, “Bayesian estima-
tion and control of detailing effort in a repeat purchase
diffusion environment”. Mrrnugetncrrl Science. 27, 493-506.
Loury. G.C.. 197’). “Market structure and innovation”. Quctr-
trrly Jourmrl of E~nomics, 93(3). 3YS-4 IO.
Mahajan, V. and E. Muller. 1989, “Timing, diffusion and
substitution of technological innovation: the IBM main-
frame case”. Working paper (Edwin L. Cox School ot
Business, Southern Methodist University, Dallas, TX).
Mahajan. V., E. Muller and F.M. Baas. 1900. ‘New product
diffusion models in marketing: A review and directions for
future research”. Jour~d of Murkrritq, S4( I ), I-26. Mahajan. V. and R.A. Peterson. lY78. “Innovation diffusion
in a dynamic potential adopter population”, ,~~zrxrx:~‘rner~t
Scicncr, 24, ISXY-1SYl.
Mahajan. V.. Y. Wind and S. Sharma. 19X3, “An approach to
repeat purchase diffusion models”. Procc~dir~gc of‘ fhe A MA
Educntoncs’ Cmfrrcvxcr (American Marketing Association.
Chicago, IL). 442-446. Mamer. J.W. and K.F. McCardle, 19X7, “Uncertainty. compe-
tition and the adoption of new technology”. Mrrrlu~erne,~r
ScicW?, x3(2), 16-177.
Mansfield. E., 1961, “Technical change and the rate of imib
tion”. Ecorm~~etrica. 20(4), 74 I-766.
McCardle, K.F., lYX5. “Information acquisition and the adop-
tion of new technology”. iMrrrlujier71er~r Scicvrcc. 3 I( I 1 ), 1373-13x’).
Modis, T. and A. Debecker, 19X8. “Innovation in the com-
puter industry”, Techrdogicul Forec’a.sliyg urrtl Sod
C‘hcrr1ge. 33. 267-27X.
Norton. J.A. and F.M. Bass. 1987. “A diffusion theofv model of adoption and substitution for successive generation5 ot
high-technology products”, Mumrgermmt Scirrrce, 33(Y).
1069-1086.
Olson. J. and S. Choi, 1985, “A product diffusion model
incorporating repeat purchases”. Tcd~r~dogicul Foreco.~tin,g
md soclrrl ci7mgc, 27, 38%3Y7.
Oren. S.S. and M.H. Rothkopf, 1984, “A market dynamics
model for new industrial products and its application”.
Marketing .Ciencc, 30). 241-265.
Oren, S.S. and R.G. Schwartz, I9XX. “Diffusion of new prod-
ucts in risk-sensitive markets”. Jmrr~ul of Formzstmg . 7.
273-287.
Quirmbach, H.C., 19X6. “The diffusion of new technology and the market for an innovation”. Rmd Journul of Eco-
nomics. 17( I), x-47. Ran, A.G. and M. Yamada. lYX8. “Forecasting with a repeat
purchase diffusion model”. Munqement Science. 34(6), 734-752.
Reinganum. J.F., IYXla. “Dynamic games of innovation”.
Jmrrml of‘ Ecormnic~ Throw, 25, 2 l-4 1,
Reinganum. J.F., 198lb, “On the diffusion of new technology:
A game theoretic approach”, Review of Economic Studies.
4x. 395-40s.
Reinganum, J.F., iY82, “A dynamic game of R&D: Patent protection and competitive behavior”, Econotnrtncu, SO(3).
671-6xX.
Reinganum, J.F.. lY83, “Technology adoption under imper-
fect information”, Bell Jourrd of Ecorzonzics. 14. 57-h’).
Reinganum, J.F.. 198’). “The timing of innovation: Research,
development and diffusion”, in: R. Schmalensee and R.
Willig. eds.. Hurdhook of Idusmul Orguniztrrim, I (North-Holland, New York, NY) 84Y-908.
Roberts. J.H. and G.L. Urhan. 198X, “Modeling multiat-
tribute utility. risk. and belief dynamics for new consumer
durahle brand choice”. Murlu~e:rrrzmr Sci~cc. 34(2). 167-
1x5.
Schumpeter, J., 1932. Ctrp~ulitrn. Socicrli.tn~ trnd Democruc~
(Harper and Row, New York, NY).
Sharif. M.N. and K. Ramanathan. 19x1. “Binomial innovation
diffusion models with dynamic potential adopter popula-
tion”, T~chr1olugictrl Forcvusting untl Social Chcm~e, 20,
f&X7.
Simon. Il. and K. Sebastian. IYX7. “Diffusion and advertising:
The German telephone campaign”, Mrr/lcr@~m?nt SciCWcc.
33. April. 45 I-466.
Tapiero, C.S., 19X3, “Stochastic diffusion models with adver-
tising and word-o-mouth effects”. Europem Jourrd of
Opmltiom~l Rc.~a~lr ( I 7, 34X%356.
Weiss. A.M. and G. John, 1981). “Leapfrogging behavior and
the purchase of industrial innovations”, Technical working
paper no. XY-I 10 (Marketing Science Institute. Cam-
bridge, MA). Wilson. L.O. and J.A. Norton, 10X9, “Optimal entry timing
for a product line extension”, Murkcting Scirmc. X(1 ).
I-17.
Yoon. E. and G.L. Lilien, 14X6, “When to go to market?: A
new product launch-time devision model”. Proceedings of
rhc AMA Erlucutors ConfLvvlce (American Marketing As-
sociation, Chicago. IL) 4OOb4OS.
Biographies: Eileen BRIDGES is Assistant Professor of Mar- keting at the Jesse 11. Jones Graduate School of Administra- tion. Rice University. Anne T. COUGHLAN is Associate Professor of Marketing at the Kellogg Graduate School of Management and holder of the Kraft Professorship. Northwestern University. Shlomo KALISH is Associate Professor of Marketing at the Recanati Graduate School of Management. Tel Aviv Univer- sity.