New technologies or innovative treatment lines for reliable water
147
AquaFit4Use is co-financed by the European Union’s 7 th Framework Programme The project for sustainable water use in chemical, paper, textile and food industries New technologies or innovative treatment lines for reliable water treatment for P&P and minimization of waste production Authors : S. Mauchauffée, M.-P. Denieul (VEO) B. Simstich, J. Rumpel, H. Jung, P. Hiermeier, G. Weinberger, D. Pauly, S. Bierbaum, H.-J. Öller, C. Hentschke (PTS) M. Engelhart, J.v. Düffel, M. Wozniak (ENV) D. Hermosilla, N. Merayo, R. Ordoñez, L. Blanco, H. Barndok, L. Cortijo, P. López, J. Tijero, C. Negro, A. Blanco (UCM) A. Rodriguez (HOL) M. Bromen, J. Vogt, J. Mielcke, (WED) January 2012
Transcript of New technologies or innovative treatment lines for reliable water

AquaFit4Use is co-financed by the European Union’s 7th
Framework Programme
The project for sustainable water use in chemical, paper, textile and
food industries
New technologies or innovative treatment lines for reliable water treatment for P&P and minimization of
waste production
Authors : S. Mauchauffée, M.-P. Denieul (VEO) B. Simstich, J. Rumpel, H. Jung, P. Hiermeier, G. Weinberger,
D. Pauly, S. Bierbaum, H.-J. Öller, C. Hentschke (PTS) M. Engelhart, J.v. Düffel, M. Wozniak (ENV) D. Hermosilla, N. Merayo, R. Ordoñez, L. Blanco, H. Barndok, L.
Cortijo, P. López, J. Tijero, C. Negro, A. Blanco (UCM) A. Rodriguez (HOL) M. Bromen, J. Vogt, J. Mielcke, (WED)
January 2012
New technologies or innovative treatment lines for reliable water treatment for P&P and minimization of waste production
VEO,PTS, ENV, UCM, HOL, WED, January 2012
Page | 2
Executive summary This report is a result of the project AquaFit4Use, a large-scale European research project co-financed by the 7th framework program of the European Union on water treatment technologies and processes. In the Pulp&Paper industry a lot of effort is put into to water saving and closing water circuits, also reducing substantially the environmental impact, both by process modelling and Kidney technologies as internal process water treatment. However a number of problems around the removal of substances are not solved yet and further closing of the water cycle causes other problems. Challenges for water re-use in the Pulp&Paper industry are the following:
- The elimination of residual (soluble) COD and BOD which can both affect the production process and the paper quality;
- The removal of sticky solids and suspended solids, which can induce plugging of pipes and showers, deposit formation, abrasion, loss of tensile strength;
- The treatment of concentrate streams containing calcium, sulphate, chloride and organics which can lead to salt accumulation in case of water loop closure, corrosion, scaling of pipes and showers in the paper production process. The removal of calcium carbonate is crucial in the last case.
Therefore there is a need to find new and reliable (combinations of) technologies to solve this challenges to achieve the water quality target for water re-use and which are tailored to suit product demands and standards. The work described in this report concerned the laboratory and preliminary work for the implementation of pilot trials on two industrial paper mills. The emphasis was on different technologies as part of a global treatment line to solve the above challenges. On the basis of waste water characterization and the defined water quality requirements for paper mills, new treatment lines were defined to reach the water quality target including effectiveness, reliability and minimization in waste and concentrate production. These new treatment lines are focused on internal recycling. The emphasis was on different key steps of the global treatment train:
- Biological treatment: anaerobic processes and MBR; - Filtration processes: 3FM high speed technology and nanofiltration; - Tertiary treatments to reduce hard COD: AOPs, coagulation/precipitation; - Integration of processes (evapoconcentration, electrodialysis and softening) in the
treatment line: o To treat the concentrate streams containing calcium, sulphate, chloride, organics; o To minimize the waste production and enhance internal recycling.
Technologies were tested at lab scale on the waste waters from 3 different paper mills:
• Paper mill 1 (PM1), producing corrugated board and board; • Paper mill 2 (PM2), producing high quality coated and uncoated board from recycled
paper; • Paper mill 3 (PM3), producing standard newsprint, improved newsprint (higher brightness)
and light weight coated paper (for magazines). On basis of the obtained results, the best treatment combinations to be implemented and tested at pilot scale within WP5.1.4 were selected as summarized below for each type of paper mill:
New technologies or innovative treatment lines for reliable water treatment for P&P and minimization of waste production
VEO,PTS, ENV, UCM, HOL, WED, January 2012
Page | 3
a) Corrugated board paper mills (PM1 and PM2)
Most important findings are:
• Stable MBR operation is not possible at calcium concentrations > 400 mg/l due to scaling problems. Softening upstream of the MBR is than absolutely necessary. Trials with a lime softening stage showed a removal of 50 – 80 % of the Ca2+ concentration in the feed (600 – 1000 mg/l).
• Ozone trials with pre-filtered final effluent of both mills led to a COD reduction by about 20- 25%. Economical viable specific ozone dosages of 0.25 to 0.7 g O3/g COD0 have been used. Overall it is more costly and complex to achieve COD levels below ~50 mg/l. The increased BOD5 shows that a subsequent biological treatment can be promising for further COD reduction. The water can be reused in the production process, especially because the water after ozone treatment is visibly colour-free. Possible reuse processes are showers at the paper machine were it can be used instead of fresh water. Calcium concentrations may be a limiting factor for reuse.
• NF membranes with high retention capacity for monovalent ions (Dow Filmtec NF 90 and Koch TFC ULP) are able to fulfil quality requirements for white grade paper reclamation water (for PM1 and PM2).
• Intensive pre-treatment or conditioning is needed to obtain steady NF membrane performance and high recovery rates due to the high scaling tendency (membrane blocking) of aerobic effluents of both PMs. Reduction of pH to around pH 6.5 (HCl) and dosing of anti-scalant was necessary to achieve recovery rates of 80%. Softening of wastewater allowed higher recovery up to 93% and lower chemical consumption for conditioning (no-use of hydrochloric acid). In this view, the MultifloTM softening technology (lime softening) is well adapted to remove calcium carbonate. Long term stability of membrane treatment (plateau formation, high system recovery) needs to be evaluated on pilot scale continuously.
• 3FM technology showed good performances at lab scale regarding TSS removal and turbidity reduction. These have to be confirmed at pilot scale.
Most important findings concerning the treatment of concentrates of PM1 and PM2 are: • Evapoconcentration proved to be an adapted technology to treat NF concentrates in terms
of production of a colourless water with a quality fulfilling the water quality criteria of both paper mills for re-use and to reduce the final volume of concentrates:
o Reduction of wastes as a global volumic concentration factor VCF up to 50 for combined “NF+evapoconcentration” could be obtained at lab scale for PM2 and 25 for PM1. These global VCFs should be increased at industrial scale to 60 without NF membrane pre-treatment and up to 250 with 3FM/softening as pre-treatment provided conversion rate on NF process and pre-treatment processes are the same at pilot scale. Then the addition of evapoconcentration would lead to a final concentrate to be disposed off representing respectively 1.7% to 0.4% in the last case in volume of the waste water treated by the global treatment line.
o Pre-treatments before NF process have a positive impact on the global VCF which could be reached at industrial scale leading to a very substantial reduction of the volume of final waste to be disposed off down to 0.4% in the case of 3FM combined with softening as pre-treatment.

New technologies or innovative treatment lines for reliable water treatment for P&P and minimization of waste production
VEO,PTS, ENV, UCM, HOL, WED, January 2012
Page | 4
• AOP treatment: High conductivity and chloride concentrations > 4,000 mg/l prevented biological degradation after AOP treatment. To reduce chloride intake to the wastewater, softening before membrane processes is preferable to acidification with HCl.
• Re-injection of NF concentrates has a negative impact on anaerobic degradation rate in pellet sludge reactors.
Based on these results, following treatment trains have been selected to be tested on site at pilot scale within WP5.1.4:
Impact of reinjection???
Water to bere-used ?
Final waste
Water to bere-used ?
Water to bere-used ?
NF
PM2 AnaerobicMultiflo
softening
AOP (O3)
AOP (O3)
Evapo
MBR
Water to bere-used ?
Can berecycled into
Anaerobic ???
Final waste
Water to bere-used ?
NF
PM2 Anaerobic Aerobic
AOP (O3)
AOP (O3)
Evapo
3FM
Multiflosoftening
Water to bere-used ?
Impact of reinjection???
Water to bere-used ?
Final waste
Water to bere-used ?
Water to bere-used ?
NFNFNF
PM2PM2 AnaerobicAnaerobicMultiflo
softeningMultiflo
softening
AOP (O3)AOP (O3)
AOP (O3)AOP (O3)
EvapoEvapo
MBRMBR
Water to bere-used ?
Can berecycled into
Anaerobic ???
Final waste
Water to bere-used ?
NFNF
PM2PM2 AnaerobicAnaerobic AerobicAerobic
AOP (O3)
AOP (O3)AOP (O3)
EvapoEvapo
3FM3FM
MultiflosofteningMultiflo
softening
Water to bere-used ?
b) Newsprint paper mill (PM3)
Most important findings derived from PM3 effluent treatment are: • Although AOP treatments are efficient for bio-recalcitrant organics removal, due to the
high amount of volatile fatty acids that are difficult to oxidize and consume high amounts of OH·, in the effluent of PM3 a previous biological treatment is expected to be more reliable. Despite this, colour removal was higher than 95% and COD removals vary between 20 to 40%. In addition, AOPs processes improve biodegradability of the treated effluent.
• Anaerobic pre-treatment showed very good performance treating a low organic load wastewater as the effluent of a 100% recycled NP/LWC paper mill, and assisting the aerobic stage on removing organics and sulphates; besides it produced enough biogas for being considered as cost-effective.
• The biological treatments studied in the two pilot plants achieved a final COD, BOD5 and sulphates removal of 80-85%, 95-99% and 25-35%, respectively. Wastewater quality after biological treatment resulted suitable to further perform a posterior membrane treatment

New technologies or innovative treatment lines for reliable water treatment for P&P and minimization of waste production
VEO,PTS, ENV, UCM, HOL, WED, January 2012
Page | 5
• Membrane treatment by UF + RO is able to generate permeates of high water quality, fulfilling all the requirements for being used in critical points of the paper machine that require a very high water quality.
• 3FM filtration followed by acidification seemed to have a positive effect on membrane treatment. A higher recovery rate was obtained and permeate with a very good quality was obtained. These results would have to be confirmed at pilot scale as the RO process was performed on a membrane test cell.
Most important findings derived from the application of evapoconcentration, coagulation / softening / flocculation treatment and AOPs to the treatment of RO concentrates from PM3 are:
• Evapoconcentration proved to be an adapted technology to treat membrane concentrates of both tested treatment trains (Anaerobic � Aerobic � 3FM � RO and Anaerobic � MBR � RO). In both cases the produced water (final VCF = 11.5-11.7) has a very good quality respecting all PM3 requirements for re-use as fresh water. Considering the VCF of the RO step, the addition of evapoconcentration would then lead to a final waste to be disposed off representing respectively 2.8% and 7% in volume of the waste water treated by the global treatment line.
• Coagulation eliminated more than 95% of coloured compounds with a high level of resonance (A500), however, high coagulant doses were needed, making the process economically unfeasible. Besides, PACl addition by itself increases conductivity.
• Lime-softening was a good alternative to reduce conductivity. Organic matter was adsorbed on Mg(OH)2 and CaCO3 surface and, thus, additionally removed in the precipitation process.
• Coagulating water with 2500 mg/L of PACl1 in the presence of lime and a PAM produces a 60% COD removal, independently of the pH and the dosage.
• Fenton and photo-Fenton processes were optimised by response surface methodology. Low pH and high [H2O2] were optimum conditions for both methods. Low ferrous ion concentration might achieve good COD removals with photo-Fenton process and Fenton process need higher ferrous ion concentrations. More than 50% of COD removal may be obtained at neutral pH.
• AOPs led to a high removal of COD at laboratory scale. Photo-Fenton obtained the best COD removal (99%) followed by Fenton (90%) processes in comparison to the 40% achieved by ozone processes.
• Photocatalysis at laboratory scale did not obtain so high COD and TOC removals from RO reject, but the combination of photocatalysis treatment (10 g/L of TiO2) with biological treatments got a total removal of COD from the wastewater.
Based on these results, following treatment trains have been selected to be tested on site at pilot scale within WP5.1.4 in PM3:
New technologies or innovative treatment lines for reliable water treatment for P&P and minimization of waste production
VEO,PTS, ENV, UCM, HOL, WED, January 2012
Page | 6
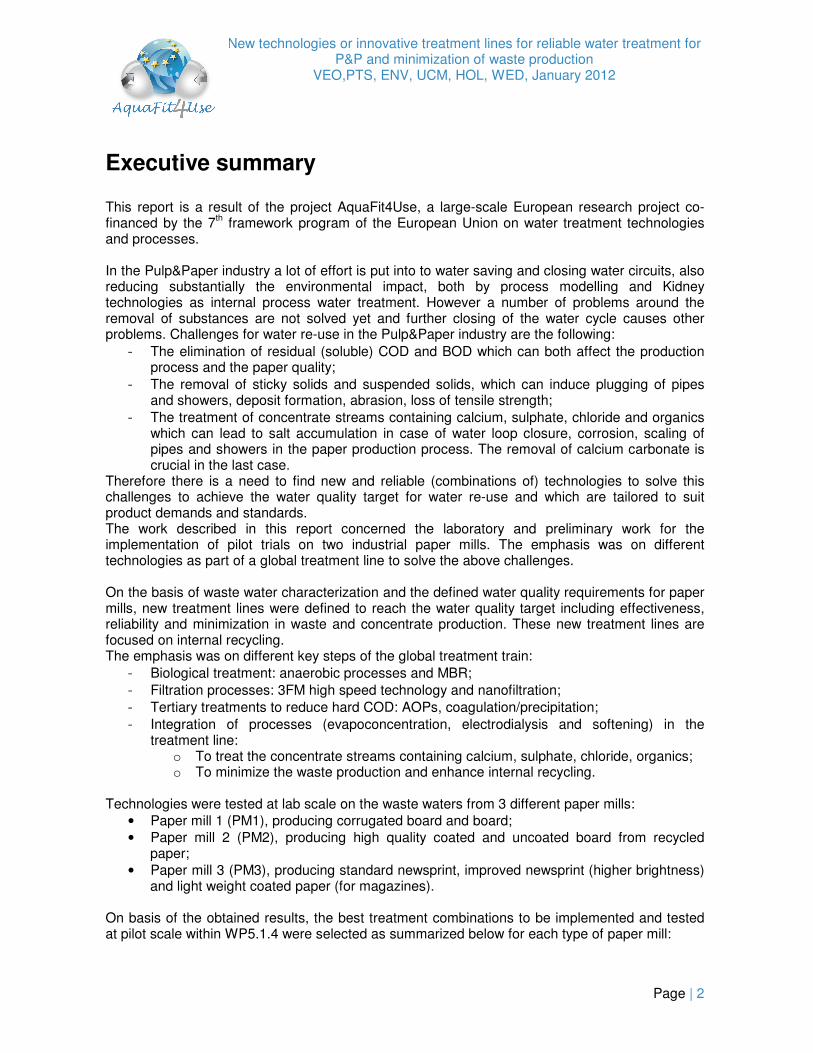
SCREENER LAMELLA
CLARIFIER
PRE-ACIDIFICATION TANK
ANAEROBIC REACTOR
AEROBIC REACTOR
LAMELLA C LARIFIER
U LTRAFILTRATION REVERSE OSMOSIS
Sludge
Biogas
Nutrients
Backwash
NaOH/HCl
PermeateWastewater from DAFs
Pilot plant 1.
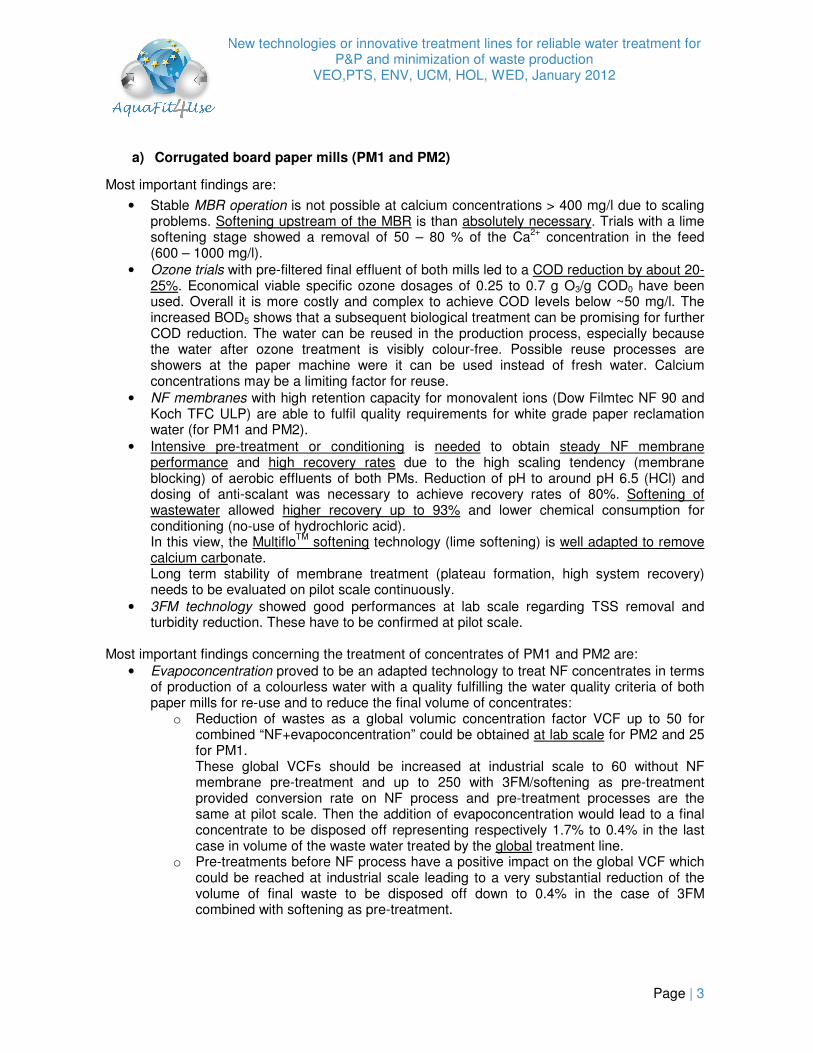
SCREENER ANAEROBIC
REACTOR
REVERSE OSMOSIS
Purge ���� Sludge
Biogas
Nutrients
Permeate
NaOH/HCl
Permeate
MEMBRANE BIOREACTOR
Purge
Wastewater
from DAFs
Antiscalant
Backwash
CONDITIONING
TANK Pilot plant 2.
Important note: This final deliverable is a compilation of all lab scale results performed within WP3.1, which have been reported in details in following internal results:
• I3.1.1.1 Proof of concept of aerobic water treatment technologies and separation techniques on bench scale for Pulp & Paper
• I3.1.1.2 Proof of concept of anaerobic water treatment technologies and MBR techniques on bench scale for Pulp & Paper
• I3.1.1.3 Assessment of technologies for the treatment of membrane retentate streams for Pulp & Paper
• I3.1.1.4 Assessment of technologies for the elimination of inorganic compounds for Pulp & Paper

New technologies or innovative treatment lines for reliable water treatment for P&P and minimization of waste production
VEO,PTS, ENV, UCM, HOL, WED, January 2012
Page | 7
Content
EXECUTIVE SUMMARY ............................................................................................................... 2
CONTENT ..................................................................................................................................... 7
1 INTRODUCTION .................................................................................................................... 9
1.1 STATE OF THE ART ............................................................................................................................... 9 1.1.1 Waste water treatment in Paper industry (Jung and Pauly, 2011) ............................................ 9 1.1.2 State-of-the-art of tested technologies within the study ........................................................... 14
1.2 OBJECTIVES ...................................................................................................................................... 35
2 METHODS ............................................................................................................................ 36
2.1 METHODS .......................................................................................................................................... 36 2.1.1 Paper mill 1 (PM1) ................................................................................................................... 37 2.1.2 Paper mill 2 (PM2) ................................................................................................................... 39 2.1.3 Paper mill 3 (PM3) ................................................................................................................... 41
2.2 MATERIALS AND EQUIPMENT ............................................................................................................... 43 2.2.1 MBR processes ........................................................................................................................ 43 2.2.2 3FM technology ....................................................................................................................... 44 2.2.3 Membrane technologies (UF, NF, RO) .................................................................................... 46 2.2.4 AOP technologies .................................................................................................................... 47 2.2.5 Evapoconcentration ................................................................................................................. 50 2.2.6 Electrodialysis .......................................................................................................................... 51 2.2.7 Softening and controlled precipitation technologies ................................................................. 52 2.2.8 Biodegradability experiments (PM1, PM2 and PM3) ............................................................... 52
3 RESULTS AND ACHIEVEMENTS ........................................................................................ 55
3.1 MAJOR RESULTS AND ACHIEVEMENTS ................................................................................................. 55 3.1.1 Corrugated paper mill (PM1 and PM2) .................................................................................... 55 3.1.2 News print paper mill (PM3) ..................................................................................................... 58
3.2 TECHNICAL PROGRESS OF THE WORK ................................................................................................. 60 3.2.1 Corrugated paper mill (PM1 and PM2) .................................................................................... 60 3.2.2 Newsprint paper mill (PM3) ...................................................................................................... 86
4 CONCLUSIONS ................................................................................................................. 116
4.1 MAJOR ACHIEVEMENTS .................................................................................................................... 116 4.1.1 Corrugated board paper mills (PM1 and PM2) ...................................................................... 116 4.1.2 Newsprint paper mill (PM3) .................................................................................................... 117
4.2 FUTURE WORK ................................................................................................................................. 119 4.2.1 Within AquaFit4Use ............................................................................................................... 119 4.2.2 General recommendations ..................................................................................................... 120
5 LITERATURE ..................................................................................................................... 121
6 ANNEX ............................................................................................................................... 128
6.1 ANNEX ON EVAPOCONCENTRATION ................................................................................................... 128 6.2 DETAILED RESULTS ON PM1 ............................................................................................................. 129 6.3 DETAILED RESULTS ON PM2 ............................................................................................................. 130 6.4 DETAILED RESULTS ON PM3 ............................................................................................................. 132 6.5 3FM FILTRATION TESTS ON PM1 AND PM2 ANAEROBIC EFFLUENT ..................................................... 133 6.6 NF90 APPLIED TO 3FM FILTRATE OF PM2 (OSMONIC FILTRATION CELL) ............................................. 135

New technologies or innovative treatment lines for reliable water treatment for P&P and minimization of waste production
VEO,PTS, ENV, UCM, HOL, WED, January 2012
Page | 8
6.7 SOFTENING TESTS ON PM2 WASTE WATER ....................................................................................... 137 6.7.1 Softening on Aerobic effluent ................................................................................................. 137 6.7.2 Multiflo
TM Softening on 3FM filtrate ........................................................................................ 138
6.8 EVAPOCONCENTRATION APPLIED TO NF CONCENTRATES FROM PM1 AND PM2 .................................. 139 6.9 ELECTRODIALYSIS ON RO CONCENTRATES FROM PM2 AND PM3 ....................................................... 140 6.10 3FM FILTRATION APPLIED TO PM3 ANAEROBIC/AEROBIC EFFLUENT .................................................... 141 6.11 NF/RO SCREENING ON 3FM FILTRATE FROM PM3 (OSMONIC FILTRATION CELL) ................................. 142 6.12 EVAPOCONCENTRATION ON RO CONCENTRATES FROM PM3 ............................................................. 144
6.12.1 RO concentrates from “PM3 waste water � Anaerobic � Aerobic � 3FM � RO” .............. 144 6.12.2 RO concentrates from “PM3 waste water � Anaerobic � MBR � RO” ............................... 145
6.13 COAGULATION/SOFTENING/FLOCCULATION OF RO CONCENTRATES FROM PM3 .................................. 146

New technologies or innovative treatment lines for reliable water treatment for P&P and minimization of waste production
VEO,PTS, ENV, UCM, HOL, WED, January 2012
Page | 9
1 Introduction This report is a result of the project AquaFit4Use, a large-scale European research project co-financed by the 7th framework programme of the European Union on water treatment technologies and processes. The research objectives of AquaFit4Use are the development of new, reliable cost-effective technologies, tools and methods for sustainable water supply use and discharge in the main water using industries in Europe in order to reduce fresh water needs, mitigate environmental impact, produce and use water of a quality in accordance with the industries specifications (fit-for-use), leading to a further closure of water cycle. This report corresponds to the Task 3.1.1 “Evaluation of tailor-made water treatment concepts for different water qualities, sustainable water reuse and more reliable technologies connected with Pulp&Paper” of WP3.1 in SP3. For more information on AquaFit4Use, please visit the project website: www.aquafit4use.eu. In the Pulp&Paper industry a lot of effort is used to water saving and closing water circuits, and to reducing substantially the environmental impact, also by process modelling and Kidney technologies as internal process water treatment. However a number of problems around the removal of substances are not solved yet and further closing of the water cycle causes other problems. Challenges for water re-use in the Pulp&Paper industry are the following (Negro et al. 1995):
- The elimination of residual (soluble) COD and BOD which can both affect the production process and the paper quality;
- The removal of sticky solids and suspended solids, which can induce plugging of pipes and showers, deposit formation, abrasion, loss of tensile strength;
- The treatment of concentrate streams containing calcium, sulphate chloride organics which can lead to salt accumulation in case of case of water loop closure, corrosion, scaling of pipes and showers in the paper production process. The removal of calcium carbonate is crucial in the last case.
Therefore there is a need to find new and reliable (combinations of) technologies to solve this challenges to achieve the water quality target for water re-use and which are tailored to suit product demands and standards. The work described in this report concerned the laboratory and preliminary work for the implementation of pilot trials on two industrial paper mills. Focus was done on different technologies as part of a global treatment line to solve the above challenges. Comparison was done to select the best treatment combinations to be implemented at pilot scale.
1.1 State of the art
1.1.1 Waste water treatment in Paper industry (Jung and Pauly, 2011)
1.1.1.1 Preliminary mechanical treatment - Mechanical processes for solids removal
Effluents from pulp and paper mills contain solids and dissolved matter. Principal methods used to remove solids from pulp and paper mills effluents are screening, settling/clarification and flotation. The method chosen depends on the characteristics of the solid matter to be removed and the requirements placed on the purity of the treated water.

New technologies or innovative treatment lines for reliable water treatment for P&P and minimization of waste production
VEO,PTS, ENV, UCM, HOL, WED, January 2012
Page | 10
The separation of solids from the effluents is accomplished with help of screens, grid chambers and settling tanks. Screens are units which operate according to the sieving/filtration process. The function of the screens is to remove coarse, bulky and fibrous components from the effluents. If necessary, fractionated particle separation can be achieved by graduating the gap width (bar screen, fine screen, inlet screen, ultra-fine screen). For reasons of operating reliability of waste water treatment plants, it is also necessary to separate the grit transported with the effluents and other mineral materials from the degradable organic material. Grit separation from effluents can prevent operational troubles such as grit sedimentation, increased wear and clogging. The grit separating systems currently in use are subdivided into longitudinal grit traps, circular grit traps and vortex grit traps, depending on their design and process layout. Sedimentation technology is the simplest and most economical method of separating solid substances from the liquid phase. High efficiency is achieved in subsequent effluent treatment processes when the solid substances suspended in the effluents settle in a sedimentation tank as completely as possible, and settled sludge is removed from the sedimentation tank. Sedimentation tanks must be appropriately designed and operated. Alternative sedimentation equipment with sets of lamella-shaped passages, are employed in the paper industry, especially for effluents with high fibre concentrations. Mechanical effluent treatment alone, however, is not sufficient to keep lakes and rivers clean, since it is incapable of removing colloidal suspended and dissolved substances.
1.1.1.2 Biological treatment
Biological waste water treatment is designed to degrade pollutants dissolved in effluents by the action of micro-organisms. The micro-organisms utilize these substances to live and reproduce. Pollutants are used as nutrients. Prerequisite for such degradation activity, however, is that the pollutants are soluble in water and non-toxic. Degradation process can take place either in the presence of oxygen (aerobic treatment) or in the absence of oxygen (anaerobic treatment). Both naturally occurring principles of effluent treatment principles give rise to fundamental differences in the technical and economic processes involved (Table 1).
Table 1: Advantages and disadvantages of anaerobic and aerobic waste water treatment (Chernicharo, 2007)
Anaerobic treatment Aerobic treatment
Usually needed COD > 1000 mg/l High amount of excess sludge
Tolerance of high organic loads High energy demand
Low production of excess sludge 3 to 5 times less than in aerobic processes
Higher tolerance to toxic substances
Energy generation by use of biogas High required space
Low energy demand Fully biological degradation
Low required space Higher tolerance to variations in the effluent
Sensitive against high sulphate and calcium concentrations
No fully biological degradation

New technologies or innovative treatment lines for reliable water treatment for P&P and minimization of waste production
VEO,PTS, ENV, UCM, HOL, WED, January 2012
Page | 11
Possibility of preservation of the biomass with no reactor feeding for several months
Low nutrient consumption
Application in small and large scale The paper industry uses a variety of effluent treatment systems. The preferred process combination for each individual case depends on the grade-specific quality of the effluent that is going to be treated. Experience shows that multi-stage processes based on an aerobic-aerobic or anaerobic-aerobic processing principle enables significantly more reliable operation of the plant. The same effect can be achieved through a cascade system which allows a graduation of the loading conditions. Among the German pulp and paper mills with on-site waste water treatment plants, 60 % have only aerobic treatment (operated as one- or two-stage processes) for their effluents, whereas 40 % have an additional anaerobic stage (Jung et al., 2009).
a) Anaerobic treatment
Anaerobic processes are employed for treatment of more highly polluted effluents such as effluents from recovered paper converting mills (Hamm, 2006). Anaerobic micro-organisms conduct their metabolism only in the absence of oxygen. Anaerobic processes are characterized by a small amount of excess sludge produced and low energy requirements. As biogas is produced during the degradation process, anaerobic processes produce an excess of energy. Biogas is a mixture of its principal components methane and carbon dioxide with traces of hydrogen sulfide, nitrogen and oxygen. Biogas is energetically utilized mainly in internal combustion engines or boilers. In its function as a regenerative energy carrier, biogas replaces fossil fuels in generation of process steam, heat and electricity. Composition and quality of biogas depends on both effluent properties and process conditions such as temperature, retention time and volume load. Before discharge into surface waters, anaerobically treated effluents have to undergo aerobic post-treatment, because – according to the current state of the art – fully biological degradation of paper mill effluents is not feasible (Möbius, 2002). When introducing anaerobic technology into the pulp and paper industry, operational problems and their possible consequences shown in Table 2 must be taken into account:
Table 2: Operational problems and possible consequences on anaerobic treatment in the pulp and paper industry
Operational problem Possible consequences
High concentrations of suspended solids in the feed flow
Displacement of biomass
Loss of pellets
High sulfate concentrations Displacement of methane bacteria
Inhibiting or toxic effects of sulfide
Performance losses
High calcium concentrations Precipitation of CaCO3
Displacement of biomass

New technologies or innovative treatment lines for reliable water treatment for P&P and minimization of waste production
VEO,PTS, ENV, UCM, HOL, WED, January 2012
Page | 12
Additives used in production (especially biocides and detergents)
Inhibiting/toxic influences
Poorer degradation performance
Decomposition/wash-out of pellets
Insufficient supply of nitrogen and phosphorus
Unstable operation
Performance losses
Loss of pellets
Temperature variations Unstable operation
Performance losses
Fluctuating organics loads (e.g. shock loads) Excessive production of organic acids
Methanation disturbed
b) Aerobic treatment
Aerobic micro-organisms require oxygen to support their metabolic activity. In effluent treatment, oxygen is supplied to the effluent in the form of air by special aeration equipment. Bacteria use dissolved oxygen to convert organic components into carbon dioxide and biomass. In addition, aerobic micro-organisms convert ammonified organic nitrogen compounds and oxidize ammonium and nitrite to form nitrate (nitrification). The key factors for the success of an aerobic process are an adequate amount of nutrients in relation to the amount of biomass, certain temperature and pH regime and the absence of toxic substances (Hynninen, 2000). Aerobic processes are characterized by high volumes of excess sludge and higher energy demands compared to anaerobic processes. Furthermore, these reactors typically have large space requirements. Aerobic treatment allows fully biological degradation of paper mill effluents. The BOD5 efficiency achievable with well operated activated sludge processes is typically within the range of 90-98 % (Hamm, 2006). The drawbacks of aerobic treatment technology are the relatively high operating costs due to the aeration of the effluent. On the other hand, aerobically operated plants exhibit higher plant stability and are less sensitive to fluctuations in effluent and plant parameters. Among different types of aerobic treatment technologies, activated sludge processes are currently the most frequently used treatment technologies in the German pulp and paper industry and have achieved a share of three quarters of the operating reactors. Both Moving Bed Bio Reactors (MBBR) and biofilters represent another 10 % of the reactors used (Jung et al., 2009).
c) Secondary clarification
Secondary clarification is intended to separate the biomass (activated sludge) formed in biological reactors and is therefore a key element in all processes employed in the final stage of a treatment plant. The quality of the separation process is just as crucial for the final effluent quality as is biological treatment itself. As far as activated sludge process is concerned, secondary clarification determines the bioreactor performance. Separation and thickening of the recirculated sludge is crucial for sludge volumes in biological treatment and also for the potential sludge loading. Correct dimensioning of secondary clarification is therefore of maximum importance for overall plant performance.

New technologies or innovative treatment lines for reliable water treatment for P&P and minimization of waste production
VEO,PTS, ENV, UCM, HOL, WED, January 2012
Page | 13
1.1.1.3 Advanced and tertiary treatment
Tertiary and/or advanced waste water treatment is used to remove specific waste water constituents that cannot be removed by secondary treatment. Different treatment processes are necessary to remove nitrogen, phosphorus, additional suspended solids, refractory organics or dissolved solids. Sometimes it is referred to as tertiary treatment because advanced treatment usually follows high-rate secondary treatment. However, advanced treatment processes are sometimes combined with primary or secondary treatment (e.g., chemical addition to primary clarifiers or aeration basins to remove phosphorus) or used in place of secondary treatment (e.g. overland flow treatment of primary effluent). Reasons for advanced effluent treatment are:
• Reduction in costs (discharge fee); • Compliance with limit values; • Increase in production.
Table 3: Treatment aims of different advanced treatment methods
Treatment method Aim of treatment
Biofiltration Reduction in COD and BOD concentration
Removal of suspended solids
Ozone treatment Elimination of residual COD
Decoloration
Membrane treatment Elimination of residual COD
Elimination of suspended solids
Demineralization
Decoloration
Filtration processes Removal of suspended solids
De-nitrification and phosphate precipitation Nitrogen and phosphate elimination
Advanced waste water treatment in the pulp and paper industry is focused mainly on additional biological membrane reactors, ozone treatment and membrane filtration techniques such as micro-, ultra- or nanofiltration and reverse osmosis. Due to relatively little full-scale experience, relatively high costs and greater complexity of water treatment, there have been only few full-scale applications of tertiary treatment of mill effluents up to now. The method that is ultimately chosen depends on the treatment aim and economic efficiency of the method in a given application.
1.1.1.4 Water circuits and quality demands in paper production
In the history of papermaking, the water circuit was created as a result of the invention of the paper machine and with it the advent of endless papermaking. As industrial papermaking evolved and developed, so did the importance and scope of water circuits as well. Factors that have shaped and influenced this development are:
• A reduction in the specific water volume: As the specific water volume is reduced, the demands on the contaminant removal efficiency of the installed circulation water treatment rise, since the water must be used several times and fresh water is also replaced by

New technologies or innovative treatment lines for reliable water treatment for P&P and minimization of waste production
VEO,PTS, ENV, UCM, HOL, WED, January 2012
Page | 14
circulation water at critical locations. This means that more water must be treated and higher requirements are placed on the treated water.
• Development of production capacities: The increased productivity, which in some cases is considerable, makes it necessary to hydraulically adapt the elements of the water circuit.
• Increased product quality and greater use of recovered paper: High requirements on water quality make it necessary to separate heavily loaded and slightly loaded water and the removal of components detrimental to the product. The greater use of recovered paper significantly aggravates the above-mentioned conditions even more.
• Greater raw material efficiency: This requires the collection and recirculation of all partial flows containing solids. Only clarified water is discharged. A system that is integrated into the water system must take over solids management.
The requirements mentioned above result in practice in the construction of complex water circulation systems. Their appearance, the mode of operation of the elements contained in them and possibilities for system closure were investigated in the SP1. In the related reports an in-depth analysis of the water quality requirements can be found. On the basis of waste water characterization and the defined water quality requirements in SP1 for paper mills, WP3.1 aimed at defining new treatment lines to reach the water quality target including effectiveness, reliability and minimization in waste and concentrate production. These new treatment lines should be focused on internal recycling. Therefore a focus has been done on different key steps of the global treatment train:
- Biological treatment: anaerobic processes and MBR; - Filtration processes: 3FM high speed technology and nanofiltration; - Tertiary treatments to reduce hard COD: AOPs, coagulation/precipitation; - Integration of processes (evapoconcentration, electrodialysis and softening) in the
treatment line to: o treat the concentrate streams containing calcium, sulphate, chloride, organics
which can lead to salt accumulation in case of water loop closure, corrosion, scaling of pipes and showers in the production process. The removal of CaCO3 is crucial in the last case
o minimize the waste production and enhance internal recycling. A state-of-the art of each of these technologies is done in following chapter.
1.1.2 State-of-the-art of tested technologies within the study
1.1.2.1 Anaerobic technology
Since the early 1980s, anaerobic treatment of industrial effluents has found widespread application in the pulp and paper industry. Several hundreds of installations are treating a large variety of different pulp and paper mill effluents. Of 205 operating anaerobic installations for the treatment of industrial wastewater in e.g. Germany around 75 plants are located in the pulp and paper industry. Most of the reactors rely on granulation of biomass (sludge pellets, sludge granules). Granulation allows for effective separation of hydraulic and solids retention times. Pelletized biomass forms the so called anaerobic sludge bed which is flowed through in upward direction by the wastewater fed to the reactor bottom using an inlet distribution system. Treated effluent is discharged at the reactor top after separation of biogas and sludge pellets in a three phase separator. Some effluent may be recirculated to the inlet distribution system to adjust hydraulic upflow velocity in

New technologies or innovative treatment lines for reliable water treatment for P&P and minimization of waste production
VEO,PTS, ENV, UCM, HOL, WED, January 2012
Page | 15
the reactor compartment. Consequently these reactors are named UASB reactors (upflow anaerobic sludge bed). EGSB reactors (expanded granular sludge bed) are a further development of the UASB type. The main difference is that EGSB type reactors are operated at much higher upward velocities (5 – 10 m/h compared to 0.5 – 1.5 m/h) and therefore higher recirculation rates. The increased upward flow permits partial expansion of the sludge bed, improved mass transfer between wastewater and biomass as well as some wash-out of inert influent suspended particles (provided different settling velocities of biomass granules and suspended matter). Higher upward velocities lead to taller reactors (approx. 15 – 25 m) compared to conventional UASB systems (5 – 8 m). For example there are 22 UASB-type installations and altogether 42 EGSB-type reactors of different manufacturers (DWA IG 5.1, 2009) in German Pulp&Paper industry. In recent years EGSB-type reactors are almost exclusively built for the treatment of pulp and paper effluent. Anaerobic treatment is most commonly used for effluents originating from recycle paper mills, especially during production of containerboard. Moreover wastewater of mechanical pulping (peroxide bleached), semi-chemical pulping and sulphite and kraft evaporator condensates may be treated. The advantages of anaerobic pre-treatment are (1) net production of renewable energy (biogas), (2) minimized bio-solids production leading to reduced disposal of excess sludge, (3) minimal footprint because of high volumetric loading rate and (4) reduced emission of greenhouse gases (Habets and Driessen, 2007). Via in-line application of anaerobic treatment in closed circuits (paper kidney technology) further savings on cost of fresh water intake and effluent discharge levies may be generated. Some major prerequisites have to be fulfilled for successful application of anaerobic treatment technology in pulp and paper industry (see also chapter 1.1.1.2 above):
• Elevated temperature: In most cases the temperature optimum of mesophilic microorganisms (30°C - 37°C) is adjusted in anaerobic reactors. Thermophilic conditions (50°C – 55°C) have been also applied in P&P sector and may be successfully used at existing elevated temperature of effluents (van Lier, 1996).
• Optimum pH: The pH in anaerobic reactors has to be kept at 6.5 ≤ pH ≤ 7.5 in the optimum range for methanogenic bacteria. Fermentative bacteria my also proliferate at lower pH e.g. in hydrolysis reactors or equalisation tanks.
• Reduced suspended solids (SS) concentrations: High concentrations of suspended solids (SS) have to be removed before modern high rate anaerobic reactors, because SS may accumulate in the reactor and replace active biomass or prevent successful granulation respectively. The acceptable solids load in the influent varies depending on reactor system and nature of solids (e.g. fibre, inorganic solids). COD of organic SS should not exceed around 10 % of the total COD load (DWA IG 5.1, 2002).
• Sulphate toxicity: Effluents of P&P production are often rich in sulphates. Reduction of sulphate will predominantly lead to generation of H2S, which is toxic for anaerobic bacteria at certain concentrations, depending on reactor pH. As reduction of sulphate also is energetically more favourable than methanogenesis, high sulphate concentrations in the influent to the anaerobic reactors will limit methane production. COD/S ratio is the major governing factor. At COD/S > 100 limitations are not to be expected, at COD/S < 50 inhibition may occur.
• Precipitation products: Inorganic precipitates: - especially CaCO3 - will influence reactor performance. Because of pH-shift in the anaerobic reactor precipitation will occur starting at around 100 mg Ca2+/L. As Ca2+ concentration in effluents of containerboard production may easily exceed 1000 mgCa2+/L heavy precipitation of CaCO3 has to be expected, which will lead to clogging and calcification of sludge pellets. Selective removal of precipitates in- or outside the anaerobic reactor has to be accomplished. There are some technologies for softening available, relying on precipitation of CaCO3 through pH-shift and oversaturation.

New technologies or innovative treatment lines for reliable water treatment for P&P and minimization of waste production
VEO,PTS, ENV, UCM, HOL, WED, January 2012
Page | 16
Softened water may be recycled to the anaerobic treatment in order to dilute Ca2+ concentrations.
• Nutrient balance: Nutrient (N, P) and trace element concentrations (e.g. Fe, Co, Ni, Se, W, Mg) for anaerobic processes have to be controlled regularly. P&P wastewater usually is deficient in nutrients and trace elements. Nutrient balance COD:N:P:S should be maintained at around COD:N:P:S ≈ 800-500:5:1:0.5 (DWA IG 5.1, 2002).
1.1.2.2 MBR processes
There is currently growing interest in the MBR (membrane bioreactor) process in municipal and industrial wastewater treatment. A membrane bioreactor employs ultrafiltration (pore size 0.01 - 0.05 microns) to retain solids and micro-organisms in the aeration tanks of the biological treatment stage. The ultrafiltration module thus replaces the final clarification stage. The first generations of the MBR were developed in 1960. They are based on side stream configuration, which is usually designed with tubular membrane. They are operated under cross-flow conditions with a very high liquid velocity. In this concept, the activated sludge is pumped into the membrane modules placed on the side of the biological tank resulting in high performances and high fluxes, but at significant energy consumption and a larger footprint. Therefore this technology is preferred for difficult wastewaters and small-scale high strengths water application.
Biological tank
Sludge in excess
Mixed liquor recirculation Waste water
MF/UF
module
Treated
water
Figure 1: Side stream configuration
Submerged bioreactors (MBRs) have been developed in the middle of 1980s in order to simplify the use of these systems and to reduce operating costs. In this configuration the membranes are immersed in a tank containing the biological sludge and the permeate water is extracted. Air coarse bubbles are used to promote proper turbulences and circulation around the membrane modules. They are designed with hollow fibres or flat sheet membranes. MBRs exist in two configurations. In the inside configuration, membrane modules are immersed directly into the bioreactor. In the outside configuration, membrane modules are placed outside the bioreactor. A pump circulates the mixed liquor from the bioreactor to the membrane module or back at a flow rate of 100 to 500 % of the influent flow. Advantages associated with the outside submerged MBR implementation are among others easier maintenance and cleaning, and higher operational flexibility. This probably explains why outside submerged MBRs quickly became the favoured MBR design for municipal plants in Europe. However, the inside configuration is strongly preferred for smaller plants, for flat sheet membrane applications.

New technologies or innovative treatment lines for reliable water treatment for P&P and minimization of waste production
VEO,PTS, ENV, UCM, HOL, WED, January 2012
Page | 17
Treated
water
Biological tank
Effluent
Sludge in excess
Treated
water
Biological tank
Effluent
Sludge in excess
Figure 2: Inside Submerged membrane bioreactor
Biological tank
Sludge in excess
Mixed liquor recirculationEffluent
MF/UFModule
Treated
water
Biological tank
Sludge in excess
Mixed liquor recirculationEffluent
MF/UFModule
Treated
water
Figure 3: Outside Submerged membrane bioreactor
There is currently growing interest in the MBR (membrane bioreactor) process in municipal and industrial wastewater treatment. In the year 2007, Germany already boasted about 70 - 80 MBR facilities, 17 of which were in municipal wastewater treatment plants (Pinnekamp, 2007). Since 2007, three German paper mills have invested in this technology too, putting MBR plants into service. Added up, this means that at the European level paper mills are currently operating at least nine MBR plants (Simstich and Öller, 2010). Generally speaking, the operating costs of the MBR process are still higher compared to the conventional version with a final clarifier (Möbius and Helble, 2007). If the costs are higher than those of conventional systems, what speaks in favour of this technology? The advantages for a use in the paper industry can be narrowed down to the following three points (Judd, 2011):
• Sedimentation becomes a thing of the past: this means not only smaller space requirements but also the end to problems caused by bulking or floating sludge or sludge overflow in general.
• Better effluent quality: solids and micro-organisms are retained, only dissolved substances and salts can pass through the membrane.
• Higher sludge age and MLSS (mixed liquor suspended solids) concentration: this results in a more compact construction and shorter hydraulic retention times being possible.
MBR is used in the paper industry as end-of-pipe technology as well as process integrated measure for the reduction of the concentration of detrimental substances in the water circuit. A typical problem of the membrane filtration of paper industry wastewaters is calcium scaling. Calcium carbonate is used in paper production as filler and coating pigment. Due to the common use of recovered paper as raw material, high concentrations of calcium can occur in the water circuit. Especially mills producing board or corrugated paper typically have a nearly closed water circuit with low specific effluent volumes of << 5 l/kg paper. This combination of dissolved calcium from the raw material and high process water reuse rates leads to high water hardness and problems with scaling and precipitation. As filtration processes are susceptible to scaling problems, measures have to be studied to enable the successful use of membrane technologies in the paper industry. Despite the challenge of the water hardness, the MBR technology was chosen in the project as it is a feasible and reliable process to reach a further reduction in water use in the paper industry. Especially in terms of effluent quality and economical aspects a MBR is a sustainable technology
New technologies or innovative treatment lines for reliable water treatment for P&P and minimization of waste production
VEO,PTS, ENV, UCM, HOL, WED, January 2012
Page | 18
for the industrial wastewater treatment. But, however, precondition for a more common use is research on fouling and scaling if an application in the paper sector is considered.
1.1.2.3 3FM technology
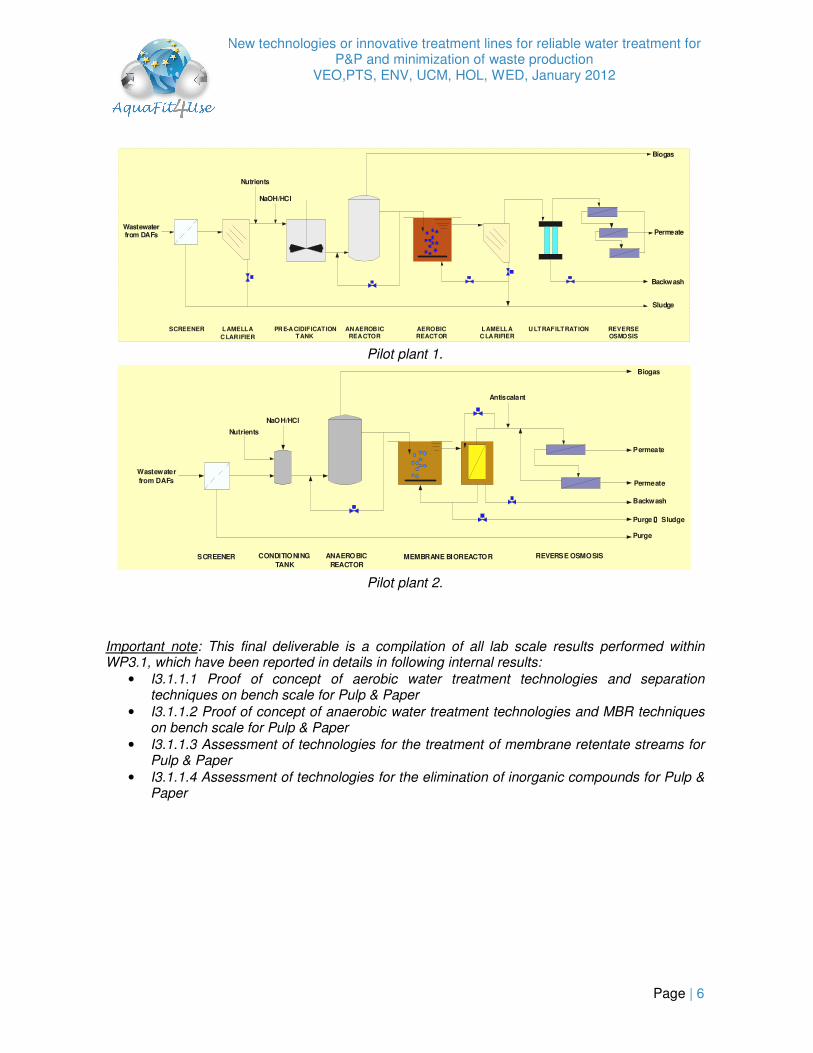
Tertiary treatment of secondary treated wastewater is the easiest way to improve first step in the direct reuse of water. The filtration of water and wastewater plays indeed an important role within industrial water treatment lines and the removal of particles and sticky solids can be a major problem to implement a membrane process after a biological treatment, when speaking of recycling water. The purpose of water filtration is to remove particles and colloids which either disturb the industrial process, deteriorate the quality of the final product or support bacteria and viruses that are a danger for human health. The conventional treatment generally consists of coagulation, flocculation, sedimentation and sand filtration. One of the main disadvantages of this process combining sedimentation and sand filtration is the rather long residence time, mostly due to the flocculation and sedimentation phases. Sand filters are as well used but though a good removal efficiency of particle including colloids, they need relatively low filtration velocities thus requiring a large installation area. Although applied at full scale for pre-treatment before a following nano-filtration or reverse osmosis step, the performances of these pre-treatments is not as effective as that of MF and UF (Vedavyasan, 2007). Another disadvantage of the conventional pre-treatments is their relatively low filtration velocity (maximum velocity of 20 m/h). A high rate fibre filter was then developed by Veolia Water STI and its high efficacy for the tertiary treatment of waste waters was proved in terms of high filtration velocity and good removal of particulate matter (Ben Aim et al. 2004). The 3FM® system (Flexible Fibre Filter Module) is a new high speed filtration device that can be substituted for conventional solid-liquid separation process such as coagulation, settling and sand filtration (Jeanmaire et al. 2007; Lee et al. 2008). Compared with existing rapid sand filters, the 3FM filtration system has a velocity more than 10 times faster at 120 m/hr and has a smaller footprint, requiring up to 1/10th the space of sand filters. Suspended solids are filtrated by flexible fibres in polyamide in a module, which have softness, elasticity and a degree of surface roughness. These fibres have a three branch star shape and are not porous (Figure 4).
Figure 4: 3FM fibres
The filter is packed with bundles of fibres along the module length and influent flow is introduced to the bottom of 3FM. Utilising all of the filter area through deep bed filtration suspended solids particles are captured (Figure 5). The optimum operating parameters are managed according to the influent characteristics desired quality of the treated water.

New technologies or innovative treatment lines for reliable water treatment for P&P and minimization of waste production
VEO,PTS, ENV, UCM, HOL, WED, January 2012
Page | 19
AIR
(FOR BACKWASH)
REJECT
(SLUDGE)
FILTRATED
WATER
SERVICE
WATER
AIR
(FOR BACKWASH)
REJECT
(SLUDGE)
FILTRATED
WATER
SERVICE
WATER
�
�
�
�
3FM fibers3FM fibers
Principle of 3FM filtration system: Alternation of filtration periods and backwash
o Filtration process (�+�): Service water is
fed through the inlet pipe of the lower
part of the apparatus and introduced
uniformly into fibrous filter layer. During
the filtration process, SS are removed by
the fibers and clean effluent water is
discharged to upper part.
o Backwash process (�+�+�): When
inner pressure reaches predetermined
value of pressure switch due to SS clogged
in the filtering process or time reaches
predetermined value on the timer, the
backwash process is initiated. SS clogged
in the filter are remove in a short time by
introduction of air which shake the fibers.
Figure 5: 3FM® technology and its principle
Although an innovative process, 3FM® operation is easy as a sand filter. Head-loss increases during the filtration cycle and the filtration capacity is recovered by periodic backwashing with a small amount of influent waste water and scouring air (Figure 5). Backwash is generally operated every 3 hrs approximately (depending of inlet specifications) and needs less than 1% of the maximum treated water. Main impact of 3FM is on TSS content in the water and thus on turbidity as well. A cut size of ~5-10 µm is obtained. Applicable fields are SS removal from sewage/WTTP, from industrial and agricultural water, water re-use, algae removal from river and reservoir, preliminary treatment of drinking water (Korea, China).This technology is currently used at industrial scale on several WWTP in Korea for obtaining treated water of high quality (Ben Aim et al. 2004) and has been applied as well as pre-treatment to minimize the organic fouling of SWRO membranes used for desalination (Lee et al. 2009; Lee et al. 2010). Until now 3FM technology has never been applied as tertiary treatment to P&P waste waters.
For more details regarding this technology and its industrial operation, refer to the report “D6.1.1 Knowledge and technological portfolio” and as well to internal report “I3.1.1.1 Proof of concept of aerobic water treatment technologies and separation techniques on bench scale for Pulp & Paper”.
1.1.2.4 Membrane technologies (UF, NF, RO)
Membrane treatment in P&P-industry serves to optimize loop closure and therefore helps to reduce fresh water intake as well as wastewater treatment. Other purposes of membrane processes are: improved product quality because of lowered pollution of loop water, re-use of treated effluent in production, recovery of valuable substances e.g. coating pigments and minimizing environmental impact because of improved effluent quality (Simstich and Öller, 2007). Different types of modules have been use for NF in pulp and paper industry. A wide range of spiral wound modules is commercially available, but also cross-rotational or vibratory shear enhanced modules were tested. The latter two are basically circular flat sheet arrangements, where high shear or cross-flow is created through rotation or vibration (Nyström et al., 2005). These module configurations are used for cleaning of internal circuits, when a lot of fiber and

New technologies or innovative treatment lines for reliable water treatment for P&P and minimization of waste production
VEO,PTS, ENV, UCM, HOL, WED, January 2012
Page | 20
suspended matter has to be expected. Spiral-wound modules are mostly installed in typical post-treatment configurations, when suspended and colloidal matter has been reduced down to very low concentrations in preceding treatment steps. Full scale membrane filtration of Pulp & Paper effluents has been already installed in some mills. Nanofiltration treatment of total effluent was installed in a newsprint paper mill several years ago (Lien et al., 1995). Since no biological treatment had been installed, effluent was treated by physico-chemical pretreatment and several pre-filtration steps before NF in order to reduce fouling and clogging tendencies. In a Finnish paper mill paper machine clear filtrate is treated with ultrafiltration using CR-filters (Metso Paper Chem Oy) and subsequent NF with spiral wound modules (Sutela, T., 2001). Nanofiltration with spiral-wound modules has been used for full-scale tertiary effluent treatment in one German mill producing newspaper from 100 % recovered paper. NF was chosen in order to reduce residual COD, AOX, colour and salinity for direct discharge or partial loop closure (Schirm et al., 2002). Another full-scale installation in Germany has been started up recently (2008) in the production of cardboard and packaging paper featuring a membrane bioreactor and reverse osmosis for the production of around 27 m³/h reclamation water for reuse in the mill (90 % recovery). The advantage of NF in the recovery of water for recirculation is mainly that the clean water can be used even in the most demanding places in the paper mill. With NF, the COD reduction is 70 % – 90 %, the AOX reduction between 60 % and 97 %, most multivalent metals are reduced by more than 90 % and colour is reduced for more than 90 % (Nyström et al., 2005, Schirm et al., 2002). A combination of UF-NF-RO was even used in a pilot system to produce reclamation water for the irrigation of crops in Australia (Cox et al., 2008). Drawbacks in the use of commercially available NF modules are the need for heavy pretreatment e.g. the addition of chemicals for water conditioning, clarification and filtration for removal of suspended solids (sand, screen or bag filters, Mänttäri et al., 2006). In case of the German newspaper mill using NF two stages and filtration is used for pre-treatment. MBR technology serves as modern alternative because of superior quality of UF filtrate. A combination of MBR + NF / RO therefore seems promising for water recycling in pulp & paper industry, but there is lacking experience to name it a proven technology.. Recovery rates of up to 90 % – 93 % (volume concentration factor 10 – 15) have been reported for the NF treatment of biologically pre-treated effluents depending on wastewater load and membrane type (Mänttäri et al., 2006). Still the combination of membrane technology and high inorganic content - which remains present in pre-treated effluents of paper board mills - needs to be addressed in detail, since recovery rates and treatment costs are interconnected closely. Economic assessment of NF treatment of ground wood mill effluent water has shown, that depending on flux and pre-treatment associated cost for reclaimed NF permeate varied from around 0.9 €/m³ - 1.4 €/m³. Schrader (2006) estimates around 0.2 €/m³ - 0.6 €/m³ for the reclamation of NF permeate from municipal wastewater effluent, which is lower than for NF treatment of P&P effluents. Cost for NF concentrate handling through incineration or hazardous waste disposal (subsequent to evapoconcentration and drying) varied from 5 €/m³ to 38 €/m³ (total cost referring to permeate volume at around 83 % recovery of permeate). Governing factor for economic feasibility of reclamation of NF permeate therefore are concentrate handling costs. Consequently Schrader (2006) stated the need for a tailored concentrate treatment, which will also be assessed during pilot trials in this project.

New technologies or innovative treatment lines for reliable water treatment for P&P and minimization of waste production
VEO,PTS, ENV, UCM, HOL, WED, January 2012
Page | 21
1.1.2.5 Ozone/AOP technologies
Today Ozone and UV are well known and proven in the field of water and waste water treatment – ozone as multifunctional powerful oxidant and UV as best available technique for disinfection regarding treatment results, plant design and cost (Ried, 2009).
Nowadays so called advanced oxidation process (AOP) combining Ozone, UV and H2O2 or other techniques (e.g. Fe/H2O2, TiO2/UV) are more in the focus of public interest and are studied for a broader potential use (Sievers, 2011). The main goal of these combined processes is to enhance the oxidation potential. The reason for this enhancement is the increased generation of hydroxyl radicals, which have a higher oxidation potential (Glaze, 1987). It is known that hydroxyl radicals are almost twice as reactive as chlorine and its oxidation potential is close to that of fluorine (E = 2.32 V/NHE at pH=7) (Bigda, 1995) and they react very quickly with nearly all organic compounds. Therefore this enhanced reaction leads to better treatment results regarding advanced degradation and faster kinetics. Figure 6 gives an overview of possible pathways to generate hydroxyl radicals. There are 4 main ways of using Ozone, UV, H2O2 and their combinations.
ozone (O3)
• OH radical
UV - h • γγγγ , λλλλ = 254 nm , εεεε = 19 M-1cm-1
Water compounds
OH- , Fe , TOC
Initiation
Promotion
O1
2 • OH H2O2
H2O2 HO2-
UV h • γγγγ λλλλ = 254 nm,
εεεε = 3.300 M-1 cm-1
H2O2
+ h • γγγγ
O3 + HO2-
O3
+ HO2-
O1
+H2O
+ H2O2
a)a) b)b) c)c)
+ H2O244
332211
Figure 6: O3 / UV / H2O2 - possible pathways (1- 4) for OH-radical formation
Possible pathways for hydroxyl radical formation: 1. Typical water compounds, e.g. hydroxyl anions, iron ions or organic compounds can
initiate/promote a decomposition of dissolved Ozone and generate hydroxyl radicals. Consequently a part of Ozone reactions in waste water goes with generation of hydroxyl radicals without using any additional enhancement. These highly reactive hydroxyl radicals usually initiate the oxidative destruction of organic substances (R) present in wastewater by OH� addition reaction or hydrogen atom abstraction (Huang, 1993). Organic free radicals (R�) are formed as transient intermediates and are further oxidized by other intermediates to form stable, oxidized products (Huang, 1993).
2. Different oxidized species will be generated during the UV radiation of Ozone molecules in water. The typical wavelength for this process is 254 nm. The molar extinction coefficient, which describes the amount of absorbed photons by the ozone molecule, is 3300 mol-1 cm-1.
New technologies or innovative treatment lines for reliable water treatment for P&P and minimization of waste production
VEO,PTS, ENV, UCM, HOL, WED, January 2012
Page | 22
Depending on the generated intermediates, e.g. excited oxygen atoms (O), hydrogen peroxide (H2O2) or the conjugated base of H2O2 (HO2
-), there are different further pathways (a-c) for hydroxyl radical generation. In practice there are more than these three mentioned pathways. So the Ozone/UV process is very complex. It is not really possible to describe exactly all chemical reaction details or the kinetics and the hydroxyl radical yield.
3. In the presence of hydrogen peroxide Ozone reacts with the conjugated base of H2O2 to form hydroxyl radicals.
4. The UV radiation of H2O2 leads directly to the formation of hydroxyl radicals. From the stoichiometric yield (1 mol H2O2 → 2 mol OH� radicals) this process is the most efficient. But the molar extinction coefficient for the wavelength 254 nm is only 19 mol-1 cm-1. For a given UV-radiation this low coefficient leads to a much lower OH-radical yield than the Ozone/ UV process (20 times higher). One way for compensation is to use high concentrations of H2O2 (> 10 mg/l). Moreover it is possible to work with wavelengths in the range of 200 to 250 nm to improve the molar extinction coefficient. Therefore, typically, a medium pressure UV-lamp is used. But, in that case the required energy input becomes the limiting factor compared with other AOP`s.
Applying advanced oxidation processes AOPs Combined chemical (AOP) and biological oxidation processes have a well-known potential for removing recalcitrant and anthropogenic substances from wastewater. e.g., Scott and Ollis, 1995, reviewed 58 publications – mostly based on lab scale studies – and identified four different types of wastewater contaminants which can benefit from combined processes:
1) Process streams containing high concentrations of recalcitrant compounds; 2) Biodegradable wastewaters with small amounts of recalcitrant compounds; 3) Inhibitory compounds; 4) Intermediate dead-end products.
Additionally the decolourisation with ozone has already been established as an application of polishing of biological treated effluents. The positively synergistic effect of process combination is based on the enhancement of the biodegradability of such compounds by chemical oxidation (ad 1, 3, 4) and the need of polishing of biologically treated effluents (ad 2). (i.e.: Balcioglu, 2007; Bijan, 2008; Chang, 2004; Mounteer, 2007). Complete oxidation of organic compounds is usually not economically feasible because large amounts of energy and chemicals are necessary. Direct oxidation and the enhancement of COD degradability compared to the untreated sample are crucial for total COD elimination (Simstich, 2010). In general the following items are important when using AOPs:
- the potential yield of hydroxyl radicals; - amount of radical scavengers; - the required energy input; - plant design; - investment and operational cost.
Consequently, the application of AOPs for the treatment of retentates coming out from membrane treatments of pulp and paper industries must mainly take into account i) the influence of wastewater composition (these waters are usually high organic loaded and they have high values of alkalinity and chlorides that could reduce the efficiency (De Laat, 2004)), ii) the efficiency of the process and iii) as well as the economic study.

New technologies or innovative treatment lines for reliable water treatment for P&P and minimization of waste production
VEO,PTS, ENV, UCM, HOL, WED, January 2012
Page | 23
In practice a high amount of so called scavengers, e.g. carbonates might quench hydroxyl radicals. So the generated radicals are not available for the treatment process itself. In real waste waters further possible pathways exist for radicals to react without increasing the treatment result significantly. Due to this complexity of real waste waters in practice pilot trials have to prove the best technique (Acero and Gunten, 2001; Ternes et. al., 2001). What do we know so far?
a) Ozone based oxidation
Ozone can oxidize other compounds in two different ways: directly reacting with dissolved compounds, or indirectly via hydroxyl radicals produced in its decomposition (Esplugas, 2002). Due to the short half-life of ozone, continuous ozonation is required to keep the process going on. This is one of the major drawbacks of the treatment, considering the cost of ozone generation (Catalkaya, 2007; Kreetachat, 2007; Ried, 2009). Furthermore, reactivity of ozone is also affected by the presence of salts, pH and temperature (Catalkaya, 2007); and the process efficiency is highly dependent on efficient gas-liquid mass transfer.
The combination of ozone with hydrogen peroxide (O3/H2O2) is considered a promising alternative to remove refractory organic chemicals from wastewaters (Masten, 1994). HO2
− (conjugate base of H2O2) at millimolar concentrations can initiate the decomposition of ozone into hydroxyl radicals much more rapidly than the hydroxide ion (Catalkaya, 2007), therefore the addition of hydrogen peroxide produces a faster ozone degradation (Gogate, 2004a; Mounteer, 2007, Ried, 2005). Ozonation is a successful method to oxidize chemicals present in wastewaters from pulp and paper mills, such as eugenol, cathecol, phenol, trichlorophenol and cinnamic acid derivatives. The double and triple bonds of lignin compounds that produce the colour of paper industry wastewater are easily oxidized by ozone (i.e.: Kreetachat, 2007; Öller, 2009). Moreover, ozonation usually increases biodegradability of paper mill effluents by toxic compound degradation and changes in molecular weight fractions from HMW to LMW (Amat, 2005; Balcioglu, 2007). Two large-scale ozone plants are operating successfully in paper mills in Germany and Austria (Schmidt et al., 2000; Kaindl, 2009) for the tertiary treatment of wastewater. Conducting systematic laboratory tests is recommended with the scope of meeting the envisage target values in each case, as the structure of the organic compounds present in the effluents is very important in terms of oxidation by ozone or other AOPs. Oxidation by ozone as a standalone technology is considered as impractical for pulp and paper mill effluents and may not offer sufficient removal and mineralization of organics (Bijan, 2008). However using ozone oxidation to get partial oxidation of organics and enhance its biodegradability is more feasible (Bijan, 2008; Tuhkanen 2002). An interesting possibility is to use a biological or membrane treatment to separate the HMW fraction, avoiding the unnecessary oxidation of the LMW organic fraction (Bijan, 2008).
b) Fenton method
Fenton method is one of the most common and efficient AOPs for wastewater treatment. Moreover, it usually implies a lower capital cost than other AOPs (Esplugas, 2002; Tang, 1996; Krichevskaya, 2010). It is based on the electron transfer between H2O2 and Fe2+, which acts as a homogenous catalyst to yield hydroxyl radicals (OH·) that can degrade organic compounds (Harber, 1934), as it can be expressed by:
Fe2+ + H2O2 → Fe3+ + OH- + OH� K1 = 70.0 M-1•s-1 (3)

New technologies or innovative treatment lines for reliable water treatment for P&P and minimization of waste production
VEO,PTS, ENV, UCM, HOL, WED, January 2012
Page | 24
Typically, Fenton treatment is performed in the following four stages (Bigda, 1995): pH adjustment, oxidation reaction, neutralization-coagulation, and precipitation (centrifugation); whereas organic substances are removed by both oxidation and coagulation. pH is one of the major factors limiting the performance of the Fenton process. It is optimum between pH 2.5-3 due to a higher solubility of iron and a higher stability of hydrogen peroxide (Hermosilla, 2009a). Moreover, the effectiveness of the Fenton method is directly related to the amount of hydroxyl radicals formed, which is function to the concentration of hydrogen peroxide and the amount of ferrous ion available. Fenton treatment has two important drawbacks: the acid pH and the production of iron sludge, which requires ultimate disposal (Pignatello, 2006). In order to diminishing the production of iron sludge, the modification of the conventional Fenton process by the combined application of UV-light has been suggested. The photo-Fenton process has two major features: (a) the reduction of ferric to ferrous iron, producing additional hydroxyl radicals via photolysis (Kavitha, 2004), i.e.:
Fe(III)OH2+ + hν → Fe2+ + OH� (4)
and (b) the photo-decarboxylation of ferric carboxylates (Kavitha, 2004), namely:
Fe(III)(RCO2)2+ + hν → Fe2+ + CO2 + R. � (5)
R� + O2 → RO� 2 → Products (6)
As shown above, the amount of catalytic iron required, and consequently the volume of sludge produced, could be strongly reduced and, moreover, some additional organic compounds (carboxylates) may also be effectively treated (Hermosilla, 2009a).
c) Photocatalysis using a catalyst semiconductor (TiO2)
New tendencies are focused in the UV assisted AOPs with reusable catalysts, such as TiO2
(Yeber, 2000). These treatments imply the irradiation of a semiconductor (e.g. TiO2, ZnO) with UV light at a wavelength shorter than 390 nm (Yeber, 2000). Heterogeneous photocatalysis employing TiO2 and UV light has demonstrated its efficiency in degrading a wide range of ambiguous refractory organics via creating an electron-hole pair, whereas photogenerated “holes” may react directly with organics and charge carriers might migrate to the surface where they react with adsorbed water and oxygen to produce radical species that attack any adsorbed organic molecule and can, ultimately, lead to complete decomposition into CO2 and H2O (Ahmed, 2009).
Pérez (2001) reported that the heterogeneous photocatalytic process catalyzed by titanium dioxide (UV/TiO2) efficiently removes colour and dissolved organic carbon (DOC) from ECF bleaching effluents and lignin containing solutions. A rapid decrease of toxicity in different solutions was also reported by different authors (Catalkaya, 2008; Perez, 2001; Yeber, 2000) and the enhancement of biodegradability shows that photocatalytic systems may be an interesting pre-oxidation step preceding biological treatment (Yeber, 2000).
1.1.2.6 Advanced flocculation
Colloidal material is stable in dispersion because of its high specific area, which allows it to interact with the solvent. Therefore, removing this material by filtration, sedimentation or flotation in an economic viable way is difficult. Chemical flocculation process is crucial because promotes the aggregation of particles after being destabilized by a chemical agent. As a result, many environmental technologies comprehend a flocculation stage: treatment of domestic and industrial wastewater and removal of soil contaminants are some examples, as well as water softening, fermentation processes, mineral separation by selective flocculation and papermaking.

New technologies or innovative treatment lines for reliable water treatment for P&P and minimization of waste production
VEO,PTS, ENV, UCM, HOL, WED, January 2012
Page | 25
In pulp and paper industry, flocculation is involved in different parts of the process: it is essential to form the paper sheet in the forming wire, determining retention, drainage rate and the formation, and it is also used in the wastewater treatment to separate the colloidal material and in the sludge thickening.
Factors, that affect the flocculation process and that are related to the flocculent, are nature, structure, molecular weight and charge density of flocculent. However, flocculent dosage and polymer chain conformation are also critical factors (Ordoñez, 2009). In addition, many different chemical aids can be used to induce flocculation process. In this project, different polyaluminium chlorides (PACs) and FeCl3 have been used as coagulants; and combinations of a PAC with an anionic and a cationic polyacrylamide (aPAM and cPAM) have been used as dual systems to induce the flocculation of colloidal material. The study and control of the flocculation or coagulation process is carried out by monitoring the evolution of the particles chord size distribution on real time, which is obtained by a Focused Beam Reflectance Measurement technique (FBRM) and contains information about the size and concentration of the particles in the dispersion, whose variation is the image of the flocculation process for all the flocculation mechanisms (Blanco, 2002).
The FBRM technique implies the use of commercial Mettler Toledo equipment with a probe, which is entered into the suspension or into the pipe, and an electronic box with a detector (Figure 1). A computer system controls the equipment and receives the data. This equipment has a laser diode which emits a laser beam divided in different parallel rays that are focused on a focal point on the external sapphire probe window (sited in the extreme of the probe that is introduced in the suspension) through a rotating lens. The focal point describes a circular path at high speed because of the rotation of the rotating lens. When a particle intercepts with the focal point path, the light is reflected and conduced to the detector, which receives light impulses, whose duration is proportional to the chord length of the particle that has intercepted the focal point path (Figure 1).The equipment can measure thousands of particles per second and thus, obtain a chord length distribution that represents the particle population.
Figure 7: How the FBRM probe works.
This technology is applicable to study any flocculation process, independently of the aggregation mechanism or the suspension nature. The traditional methodologies, based on the measurement of the surface charge of the particle, are appropriate to study the aggregation process only when it implies the modification of these properties, but not when the flocculation is carried out by other mechanisms, as bridging with neutral polymers, for example (Blanco, 1996; Blanco, 2002).

New technologies or innovative treatment lines for reliable water treatment for P&P and minimization of waste production
VEO,PTS, ENV, UCM, HOL, WED, January 2012
Page | 26
One of the main advantages of this methodology developed by UCM is that it does not require manipulating the suspension before using it. Most of the optical techniques used to study the flocculation process require the previous manipulation of the suspension, to dilute or to adjust pH or ionic strength, because many of them are based on measuring turbidity or on image analysis, being useful only if the suspension is diluted enough to allow the pass of the light, as in the dispersion photometric analyser, for example. Furthermore, these techniques assume that the turbidity or the colour of the suspension does not change and/or that the particles are spherical.
The FBRM methodology has been used on-line to control flocculation process in the pre-treatment of fresh water used in refrigerating towers, in a Hatschek machine that produces fibre cement, in the headbox of a paper machine (as part of the European project: RODET-QLK5-CT-2001-00749) and in the fed to the first cylinder sieve of a board machine (as part of the European project: SHAKER-COOP-CT-2004-032352). When this technology is used for controlling flocculation, it is possible to detect any alteration in the process before it affects the downstream and, because of that, it possibilities to carry out the pertinent action in the most efficient way.
1.1.2.7 Evapoconcentration
Evapoconcentration is a unit operation which consists in the separation of two liquid constitutes: the removal of solvent (generally water) as vapour from a solution or slurry. The objective may be to concentrate a solution containing the desired product or to recover the solvent; Sometimes both may be accomplished (Minton, 1986). Evapoconcentration is principally used to concentrate aqueous solutions and as well to minimize final wastes to be disposed of. Evaporation involves the removal of water from the solution by boiling the liquor / effluent in an evaporator (see Figure 8). The generated vapour is usually removed and condensed as a distillate, while the non-volatile phase remains liquid as a concentrate, which is rich in dissolved products.
EVAPORATOR Effluent Concentrate
Energy
Condensate
Vapor to condensate
Body
Vapor
Circulation
Heat transfer
Condensate
Solution to concentrate Concentrate
Vapor to condensate
Body
Vapor
Circulation
Heat transfer
Condensate
Solution to concentrate Concentrate
Figure 8: Evaporation scheme
Figure 9: Evaporator design
The aim of evapoconcentration is to obtain a very clean distillate which could be rejected in the nature, sent in a sewage treatment plant or reused. The concentrate is considered as an ultimate waste usually disposed to landfill or which can be incinerated as well. When the solution to concentrate is rich in salts, the enrichment of the liquid phase can exceed the saturation limit and a crystallized solid phase appears. Evaporator design consists of three principal elements as shown in Figure 9 (Minton, 1986). The heat transfer takes place in heating units or calandrias: in most cases the solvent is water. The vapour-liquid separations take place in a vapour-liquid separator called bodies, vapour heads, or flash chambers. Finally, the circulation of solute assures the thermal transfer and the evaporation.

New technologies or innovative treatment lines for reliable water treatment for P&P and minimization of waste production
VEO,PTS, ENV, UCM, HOL, WED, January 2012
Page | 27
For efficient evaporation, the selected equipment must be able to accomplish several things: - Transfer large amounts of heat to the solution with a minimum amount of metallic surface
area. This requirement, more than all other factors, determines the type, size, and cost of the evaporator system.
- Achieve the specified separation of liquid and vapour and do it with the simplest devices available, while using efficiently the available energy.
- Meet the conditions imposed by the liquid to be evaporated or by the solution to be concentrated. Factors to be considered include product quality, salting and scaling, corrosion, foaming, product degradation, hold-up, temperature sensitivity, and the need for special types of construction.
Salting, scaling, and fouling result in steadily diminishing heat transfer rates until the evaporator must be shut down and cleaned. Some deposits may be difficult and expensive to remove: it is thus very important to reduce deposition (Minton, 1986). Evapoconcentration needs a great heat transfer, on one hand to heat the solution up to boiling temperature and then to assure the phase transfer. It is essential to find the industrial conception which enables the great compromise between energetic and investment cost considering characteristics solution. Concentration of solution by solvent evaporation is carried out in single or multistage evaporation units with or without thermal or mechanical vapour compression, or in multistage flash evaporation units. The most used conceptions and their characteristics are presented in the Annex 8.1. Evaporation has proven to be a very efficient and reliable technology for treatment of industrial waste-water mainly due to its flexibility in the treatment of very different types of wastes, with a very high load of pollutants (Cox, 2007). Evaporation is applied, for example to:
- The treatment of exhausted oil emulsion and die casting waste-waters producing a condensate that is re-used in the preparation of new emulsions.
- The treatment of effluents from surface treatments, e.g. the plating industry (chrome plating, zinc plating, etc…), degreasing, tumbling waters, pickling solutions, regeneration eluates from resin demineralisation plants, etc., (LIFE Zero Plus, 2007).
- The concentration of leachates and exhausted solutions from landfill and effluent disposal centres.
- The treatment of printing waste-waters containing ink, glue, etc., and waste-water from flexo printing etc.
- Several different applications in the chemical and pharmaceutical industries; - Power plants with zero liquid discharge (ZLD) for the treatment of reverse osmosis
concentrate and resins eluates from demineralisation plants, or from desulphurization processes.
- Pulp & paper industry for the removal of inorganics. In most applications the condensate produced (treated stream) is recycled to the working process, thus achieving the status of Zero Liquid Discharge. If recycling is not possible as for instance in landfills, the condensate can be discharged. In some cases it is also possible to reach the ZTD when the concentrate is recovered. An example is the electrolytic tinning for industrial packaging (mainly in food industry) where the tinning bath becomes diluted from carry over of water by the washed parts to be treated in the bath. Evaporation continuously removes water thus maintaining the concentration of the bath constant. The evaporated water can be used as wash water for prior treatments before tinning. The advantages of the evapoconcentration technique for water treatment are:

New technologies or innovative treatment lines for reliable water treatment for P&P and minimization of waste production
VEO,PTS, ENV, UCM, HOL, WED, January 2012
Page | 28
- The reduction of the remaining solution volume, which generates a reduction of the disposal costs. It is characterised by the volume concentration factor (VCF) which is defined as the feed volume divided concentrate volume.
- The wide range of effluents which can be treated: this property is very interesting in the cases of industrial effluents which composition varies in time. Whereas strong pH variations make bacteria involved in biological treatment die (loss of biomass), and the change of compounds can completely foul a membrane, evapoconcentration is much less sensitive to these changes.
However, contamination of the distillate may happen when volatile compounds are present in the feed and foam, corrosion and fouling have to be controlled. In addition, evapoconcentration has high energy consumption (from 15-500 kWh depending on the applied technology): for this last reason, evapoconcentration is only focused on concentrated streams. Considering these, evapoconcentration has been applied within AquaFit4Use to the treatment of membrane concentrates in order to remove inorganics to produce high water quality water for re-use purposes and to reduce the final amount of wastes to be disposed of.
1.1.2.8 Electrodialysis
Electrodialysis is an electrochemical membrane separation technique for ionic solutions that has been used in industry for several decades. It can be used in the separation and concentration of salts, acids, and bases from aqueous solutions, the separation of monovalent ions from multivalent ions, and the separation of ionic compounds from uncharged molecules. It can be used for either electrolyte reduction in feed streams or recovery of ions from dilute streams. Industrial applications encompass several industries and include the production of potable water from brackish water, removal of metals from wastewater, demineralization of whey, deacidification of fruit juices, and the removal of organic acids from fermentation broth (Krol, 1969). Additional examples of the applications of electrodialysis are given in Table 4 (Farrell, 2003).
Table 4: Industrial applications of electrodialysis
Potable water from brackish waterNitrate removal for drinking waterBoiler water, cooling tower water, effluent steam desaltingCheese whey demineralizationFruit juice deacidif icationSugar and molasses desaltingPotassium tartrate removal from wineBlood plasma protein recoveryDemineralization of amino acid solutions in the food industryAcid removal from organic productsEdible salt production from seawaterAg(I) salts from photographic wasteZn(II) from galvanizing rinse waterOrganic salts from fermentation brothAmino acids from protein hydrolysatesSalts, acids, and alkali from industrial rinse watersConversion of organic salts into acid and base (bipolar membrane ED)Salt splitting
Electrolyte
reduction
Electrolyte
recovery
Miscellanous

New technologies or innovative treatment lines for reliable water treatment for P&P and minimization of waste production
VEO,PTS, ENV, UCM, HOL, WED, January 2012
Page | 29
As a selective transport technique, electrodialysis uses an ion-selective membrane as a physical barrier through which ions are transported away from a feed solution. An energy intensive phase change is unnecessary, in contrast to the common separation techniques of distillation and freezing. The use of an organic solvent, as is often required with other selective transport techniques such as liquid extraction, is avoided with electrodialysis. In addition, electrodialysis is typically performed under mild temperature conditions, making it particularly attractive for food, beverage, and pharmaceutical applications that deal with heat liable substances. The principle that governs electrodialysis is an electrical potential difference across an alternating series of cation and anion exchange membranes between an anode and a cathode. The feed solution containing both positive and negative ions enters the membrane stack to which a voltage is applied, thus causing the migration of the ions toward their respective electrodes. The cation exchange membranes allow the transfer of cations but inhibit the transfer of anions. Conversely, anion exchange membranes allow the transfer of anions but inhibit the transfer of cations. The result is alternating compartments containing streams of dilute ion concentration (diluate) and streams rich in ion concentration (concentrate) exiting the stack. An ionic rinse solution is circulated past the electrodes to maintain conductivity of the membrane stack while preventing potentially corrosive ions from the feed solution from contacting the electrodes. This concept is illustrated in Figure 10 with a feed solution of a salt (C+A-) in aqueous solution. The electrodialysis membrane stack comprises electrodes and membranes separated by gaskets and spacers. The spacers are turbulence-promoting support mesh used to create the compartments through which the solutions flow. Uniform flow distribution and prevention of internal leakage through spacer and gasket design are critical to system performance.
Figure 10: Electrodialysis principle
Within the project, this technology has been tested in view of removing salts from membrane concentrates in order to enhance the water recycling into the biological treatment and prevent thus salts accumulation in the waste water’s treatment processes.
1.1.2.9 Softening and controlled precipitation technologies
In industry, especially in the Pulp and Paper, the removal of scaling compound, especially calcium carbonate, is a key point in the perspective of a re-use of the wastewater: the recycling of water can indeed induce salt accumulation and thus scaling issues.

New technologies or innovative treatment lines for reliable water treatment for P&P and minimization of waste production
VEO,PTS, ENV, UCM, HOL, WED, January 2012
Page | 30
Generally, the physicochemical treatment of wastewater from industrial operations (softening, acid waste neutralization …) typically involves chemical precipitation of the contaminants via acid-base neutralization (or other means) followed by separation of the solids from the solution. The precipitation reaction, core of the chemical engineering in such processes, is generally a very unstable mechanism when poor homogenization and dispersion of the reagents are applied in the reactor. The consequences are: - Lower removal efficiency (hydraulic short-cut, long induction time); - Over-consumption of reagents (poor dispersion around the reagent input); - Scaling on walls and pipes / residual TSS in treated water (post precipitation); - Low density sludge presenting a high moisture rate (nucleation >>> growth).
Moreover, the size, shape, and density of the precipitated particles can have a significant impact on sludge rheology, settling rate and dewatering performance. In turn, these properties can affect the efficacy of solid recovery and/or recycle of these by-products. According to crystallization theory, precipitation is defined as reactive crystallization. This definition is preferred as it emphasizes the formation of the solid product via a chemical reaction. The correlation of the precipitation processing conditions to product properties is determined via the study and control of the following aspects of the process (Figure 11): - Solid-liquid equilibrium; - Crystallization kinetics, i.e. super saturation, nucleation and growth; - Colloid surface chemistry, i.e. the aggregation of particles and the adsorption of impurities; - Reactor selection and design (Demopoulos 2009).
Figure 11: A new paradigm for aqueous precipitation research (G.P. Demopoulos, 2009)
To ensure and satisfy the quality of sludge produced, full attention to all these issues is then critical importance. Spanos and Koutsoukos (1998) studied the impact of the solid sowing on the reduction of induction times during the precipitation of calcium carbonate. The induction times decrease with increasing super saturation while the rates of precipitation increase. Moreover, it may be observed that the induction times are sufficiently shorter in the seeded precipitation experiments where the precipitation rates are higher especially at high super saturations.

New technologies or innovative treatment lines for reliable water treatment for P&P and minimization of waste production
VEO,PTS, ENV, UCM, HOL, WED, January 2012
Page | 31
Figure 12: Initial rate of precipitation as a function of the mass of the added solid. Total calcium concentration, Cat = total carbonate concentration, Ct = 7.10
-4 M, pH = 10,0, 25°C
(Spanos and Koutsoukos, 1998)
From another side, Nason and Lawler (2008) described the influence of the solid sowing on the processes of softening. During precipitative softening, particle size distributions are shaped by three simultaneous processes: homogeneous nucleation, precipitative growth, and flocculation. The individual and relative rates of these three processes are strongly influenced by the saturation ratio, the seed concentration and the mixing intensity. Increase in the initial seed concentration prevent (or delay) the formation of new, small particles by homogeneous nucleation.
Figure 13: Heterogeneous calcite precipitation rate as a function of seed surface area at 25°C. Solution composition: Ct/Ca
2+ (0.004 M), pH = 7.95 (Lin and Singer, 2005)
Concerning the impact of reactor design on particle size distribution, the solids produced in conventional precipitation processes generally have a low median particle size (D50) and wide particle size distribution (PSD) compared to more advanced precipitation processes. A low D50 manifests itself as sludge that is difficult to settle and dewater and may exhibit undesirable pseudo plastic or Bingham plastic tendencies. This can negatively affect the efficacy of recycle from a practical process or operational perspective and be deleterious to the quality and composition of the recovered solids in general. Most precipitation processes are positively impacted (size of particles, reduced post precipitation, increase of precipitation kinetics, etc.) by increasing solid content (sludge recirculation). Indeed, in a conventional neutralization plant, scaling due to saturated or metastable levels of constituents in

New technologies or innovative treatment lines for reliable water treatment for P&P and minimization of waste production
VEO,PTS, ENV, UCM, HOL, WED, January 2012
Page | 32
the treated effluent can be problematic. Calcium carbonate scaling is commonly observed. Processes that include solids recirculation back to the point of neutralization can reduce or totally eliminate scaling because the increased surface area fosters secondary nucleation and reduces the level of calcium carbonate (and other constituent) super saturation (Barbier et al. 2010, as shown in Figure 14).
Full post-precipitation avoided
Figure 14: CaCO3 post precipitation comparison measurement on in clarified softened water after neutralization tank on Multiflo process – impact of reactor design and solid ratio (Hard water
composition : 80-100 ppm Ca & 130-170 Total Alkalinity - hard water softened to pH 10.5 with lime – Turbidity monitoring with time)
To solve such problems, advanced precipitation and crystallization processes were developed that address the science of particle formation and growth to improve the recovered solids properties.
a) Multifo-softening technology (Veolia)
Veolia has developed and used advanced precipitation processes (Cook 2003; Prokop 2006) with sludge recirculation (Barbier et al. 2009) including forced-circulation, draft-tube crystallizers with custom mixers that yield very high circulation to minimize supersaturated zones. Internal design of the Turbomix reactor improves solid particle homogenization which allows operating at higher mineral load and reaches high solid/liquid ratio in the reactor. Veolia Water Solutions & Technologies developed new high rate softening processes: ActifloTM Softening and MultifloTM Softening (Figure 15) (i.e. Chemical precipitation of hardness, alkalinity, silica and other constituents (e.g., heavy metals) for water production and wastewater reuse by the addition of lime, carbonate ion, metallic salts, polymer and recycled sludge.

New technologies or innovative treatment lines for reliable water treatment for P&P and minimization of waste production
VEO,PTS, ENV, UCM, HOL, WED, January 2012
Page | 33
Turbomix reactorTurbomix reactorTurbomix reactor
Figure 15: High rate precipitation process MultifloTM
with Turbomix reactor
These high rate precipitation processes combines within a single treatment line: - A dynamic mixing stage for chemicals injection; - An enhanced precipitation reactor with TurbomixTM system to improve reaction kinetics of
chemical inputs; - A conventional lamellar settling unit that removes the suspended matter; - A sludge recirculation system that allows the re-injection of sludge in the crystallization
chamber. Compactness is in addition one of the main advantages of high rate softener:
Conventional precipitation softening 2 – 6m.h-1
Multiflo™ Softener 20 – 30m.h-1
Actiflo® Softener
60 – 80m.h-1
Figure 16: Comparison of process compactness
Thus the challenge for high rated softeners is based on enhanced reaction zone (reactor) satisfying at the same time the abilities of a Continuous Flow Stirred Tank Reactor (CFSTR) for liquid and solid phases while minimizing energy input necessary for mixing. As the reactor is well mixed, the total crystal surface area can be increased by increasing the slurry concentration (recirculation). Within the project, this technology has been tested in view of removing scaling compounds before membrane processes (NF, UF, RO and MBR) in order to prevent scaling of the membranes and thus enhance recovery rates of the membrane processes. This last one can generally be evaluated by measuring the Silt density Index (SDI) of the waste water. Therefore scaling potential can be assessed performing detailed analysis on scaling components like calcium, magnesium, barium, carbonates and sulphates. Detailed ion analysis was taken as input to

New technologies or innovative treatment lines for reliable water treatment for P&P and minimization of waste production
VEO,PTS, ENV, UCM, HOL, WED, January 2012
Page | 34
simulation programs for scaling potential such as ROSA (Dow Company) and JChess (Armines, France). Furthermore silt density index (SDI) and turbidity give a general insight on suitability of the pre-treated waste water for membrane filtration.
b) Filtration Assisted Crystallization Technology (TNO)
Filtration Assisted Crystallization Technology (FACT) is a hybrid process, patented by TNO, combining heterogeneous crystallization and a simple filtration step. The heterogeneous seeds should allow both fast crystallization and easy filtration. The principle can be applied in aqueous solvents and organic solvents to remove hardness and other salts. The heterogeneous seeds grow during the FACT process until the moment that they have sufficient size and are separated. A relatively small amount of heterogeneous seeds (about 1 g/l) create a significant increase of the crystallization kinetics, while at the other hand the use of seeds allows a compact and cheap filter for the S-L separation. The type of the seeds, the concentration, the residence time and the pH are important parameters, as shown in Figure 17:
8,00
8,50
9,00
9,50
10,00
10,50
0 500 1000 1500 2000
Tijd (sec)
pH
(-)
blanc o5hydrc 95
har F1hrdoca60
har 60
casse
No seeds
Seed 3
Seed 5
Seed 1
Seed 4
Seed 2
Figure 17: Comparison of the effect of various seed material for CaCO3-removal in a laboratory test
Figure 18: Pilot to be tested in Paper industry
Advantages in paper industry are the following: - Closing of water cycles (and saving energy for heating water); - Product (= seeds + CaCO3) can be used as filler, resulting in ± 25-50% reduction of raw
filler material; - Removal of hardness can be easily tuned between approximately 50 and 98%; - More efficient use of cationic additives in the wet section (due to low [Ca2+] ); - Small volume and footprint, because of relative fast reactions; - Competitive to conventional techniques like the pellet reactor.
The FACT technology will be tested at another paper industry (SAPPI); the results will be reported in D3.2.2 “New technology for removal of hardness, tested at pilot scale in location”.

New technologies or innovative treatment lines for reliable water treatment for P&P and minimization of waste production
VEO,PTS, ENV, UCM, HOL, WED, January 2012
Page | 35
1.1.2.10 Biodegradability experiments
Biodegradability screening tests are a basic tool for the assessment of treatment alternatives for wastewater and the evaluation of pre-biological treatment steps (e.g. oxidative) applied to bio-recalcitrant residual water. There are several methods for evaluating biodegradability; among others, different bioassays have been used to assess detoxification, as the inhibition of the luminescence of Vibrio fischeri bacteria (Pérez-Estrada et al., 2007); there are mixed methods that aim to evaluate toxicity and biodegradability, e.g. Pseudomonas putida test measures the biocompatibility of this micro-organism present in activated sludge, studying its growth in a solution (García Ripoll et al., 2009). Other methods focus the study of the behaviour of activated sludge micro-organisms, such as several methodologies that evaluate respiration rates of bacteria trying to provide a rapid screening method to assess the effects of substances on the micro-organisms present in activated sludge (OECD, 2009). An increase in the biodegradability of the sample has been also measured using biological oxygen demand (Guhl and Steber, 2006), or other methods aiming to simulate biological treatment conditions in standardized situations, such as Zahn–Wellens test (EPA, 1998). This test is commonly used to determine the inherent biodegradability of a substance under biological treatment conditions, and it provides more useful information than just determining the BOD/COD ratio, toxicity, or testing respiration rates, although it implies a greater analytical effort and time to be performed (28 days); whereas 5 days are required for BOD5, some hours for respirometry or toxicity tests, or about 36 h for P. putida test.
1.2 Objectives
The objectives of the work described in this report were: - The identification of the best suitable new water technologies to reduce environmental
impacts by advanced closure of the water cycle and produce the required water quality for re-use in the Pulp&Paper sector;
- Minimizing the waste production by testing new technologies to increase recycling, treat the concentrates and separate salts (membrane separation, evapoconcentration,….) in order to propose optimized treatment lines (efficient, reliable, cost effective);
- To define the best use of AOP’s by comparison of full stream and concentrated stream ozonisation.

New technologies or innovative treatment lines for reliable water treatment for P&P and minimization of waste production
VEO,PTS, ENV, UCM, HOL, WED, January 2012
Page | 36
2 Methods Focus was done on technologies as part of a global treatment line to solve the challenges of reuse in the Pulp&Paper industry (see Introduction of this report), as described in the scheme below:
Evaluation of technologies:
- AOP technologies
- Evapo-concentration
- Controled precipitation
- Electrodialysis
Low water qualityto be reused
High water qualityto be
reused
Reten
tate
Waste minimization(or recycling)
Waterto be re-used
or
Paper mill
wastewater
AOP
NF
3FM
Anaerobic
Process
Aerobic
Process
MBR
Softening
Figure 19: Global treatment line
On the basis of waste water characterization and the defined water quality requirements for paper mills, these new treatment lines were defined to reach the water quality target including effectiveness, reliability and minimization in waste and concentrate production. These new treatment lines are focused on internal recycling. The emphasis was on different key steps of the global treatment train:
- Biological treatment: anaerobic processes and MBR; - Filtration processes: 3FM high speed technology and nanofiltration; - Tertiary treatments to reduce hard COD: AOPs, coagulation/precipitation; - Integration of processes (evapoconcentration, electrodialysis and softening) in the
treatment line: o To treat the concentrate streams containing calcium, sulphate, chloride, organics; o To minimize the waste production and enhance internal recycling.
2.1 Methods
Technologies were tested at lab scale on the waste waters from 3 different paper mills: • Paper mill 1 (PM1), producing corrugated board and board; • Paper mill 2 (PM2), producing high quality coated and uncoated board from recycled
paper; • Paper mill 3 (PM3), producing standard news print, improved news print (higher
brightness) and lightweight coated paper (for magazines).

New technologies or innovative treatment lines for reliable water treatment for P&P and minimization of waste production
VEO,PTS, ENV, UCM, HOL, WED, January 2012
Page | 37
2.1.1 Paper mill 1 (PM1)
Paper mill 1 (PM1) annually produces 230.000 tons paper for corrugated board and 83.000 tons of board. The specific water consumption of the mill is 3.8 m3/t board and 2.3 m3/t corrugated board. Freshwater consumption amounted to 1800 m3/d. The wastewater (1080 m3/d) is treated in the mill’s own treatment plant. Part of the biologically treated water (240 m3/d) is reclaimed in the water cycle and 850 m3/d is discharged. The following sketch shows the WWTP of PM1.
Dissolved
Air Flotation
Hydrolysis
Anaerobic Reactor
Capacity 1 2 tons CO D/ d ay
Biogas Tank
Desulfurization
Final
Sedimentation
Tank
Clarified Water Tank
River
5.00 0 m3/d NaOH
Buffer Tank
ActivatedSludge Tank
Capacity 5,0 tons COD/day
Wa ter
Sludge
PM3
POWER PLANT
PM2 Con densate
Rainwater
3 50 m3/d1 0,5 t/d COD
1 680 m3 /d1 2,5 t/d COD
1330 m3/d2,0 t/d COD
Dissolved
Air Flotation
Hydrolysis
Anaerobic Reactor
Capacity 1 2 tons CO D/d ay
Biogas Tank
Desulfurization
Final
Sedimentation
Tank
Clarified Water Tank
River
5.00 0 m3/d
NaOH
Buffer Tank
ActivatedSludge Tank
Capacity 5,0 tons COD/day
Wa ter
Sludge
PM3
POWER PLANT
PM2 Con densate
Rainwater
3 50 m3/d1 0,5 t/d COD
1 680 m3 /d1 2,5 t/d COD
1330 m3/d2,0 t/d COD
Figure 20: WWTP of paper mill 1 (PM1): Process flow diagram and image
Main treatment steps and related figures are:
- Two-step anaerobic-aerobic wastewater treatment plant; - About 100.000 PE (population equivalent); - Anaerobic reactor with internal circulation (IC reactor); - Three-stage activated sludge tank with denitrification stage; - Anaerobic capacity: 12.000 kg/d COD; - Aerobic capacity: 5.000 kg/d COD; - Anaerobic COD degradation: 75 - 85 %; - Aerobic COD degradation: 90 - 95 %; - Overall COD elimination efficiency: 95 %; - Biogas quantity: 4.500 m³/d.

New technologies or innovative treatment lines for reliable water treatment for P&P and minimization of waste production
VEO,PTS, ENV, UCM, HOL, WED, January 2012
Page | 38
The following table shows the main parameters:
Table 5: Waste water characteristics of PM1
Parameters Unit Outflow Anaerobic Total effluent of
WWTP
pH - 6.9 8.5 Conductivity mS/cm 5 2,5 Temperature °C 30 27 dissolved COD mg/l 1000 - 2000 250 - 320 BOD5 mg/l 750 14 TSS mg/l 900 - 1300 < 10 Si mg/l 17 14 NH4-N mg/l 39 3,8 PO4-P mg/l 11 0,3 SO4
2- mg/l 140 135 Ca mg/l 650 - 850 77.5 - 150 Hardness °dH 120 25
The Figure 21 below represents all the experiments carried out on PM1 waste waters:
PM1 wastewater
Anaerobicprocess
Aerobicprocess
3FM
Anaerobic
lab reactor
AOP (O3)
MBR
NF
Impact of reinjection into
anaerobicprocess ?
EvapoWater to bere-used ?
AOP (O3)Biodeg.
tests
Possibility to
reinject intobiological
processes ?
Water to bere-used ?
AOP
(Fenton)
Biodeg.
tests
Possibility to reinject into
biologicalprocesses ?
Water to be
re-used ?
Water to bere-used ?
PM1 wastewater
Anaerobicprocess
Aerobicprocess
3FM
Anaerobic
lab reactor
AOP (O3)
MBR
NFNF
Impact of reinjection into
anaerobicprocess ?
EvapoWater to bere-used ?
AOP (O3)Biodeg.
tests
Possibility to
reinject intobiological
processes ?
Water to bere-used ?
AOP
(Fenton)
Biodeg.
tests
Possibility to reinject into
biologicalprocesses ?
Water to be
re-used ?
Water to bere-used ?
Figure 21: Tests carried out on Paper mill 1 waste waters
The water quality requirements for re-use purpose were not clearly defined by PM1. Therefore, the targets considered in the above experiments for re-use were the ones described in the Internal result 1.2.2.1 “Description of required water quality in 4 sectors of the industry”, which are more general valid for paper industry and very well adjusted to a “typical” mill.

New technologies or innovative treatment lines for reliable water treatment for P&P and minimization of waste production
VEO,PTS, ENV, UCM, HOL, WED, January 2012
Page | 39
2.1.2 Paper mill 2 (PM2)
Paper mill 2 (PM2) produces with 2 machines more than 160,000 t/year paper and board for containerboard and packaging from 100 % recycling fibbers. The wastewater of the mill is cleaned with a 2 stage plant (anaerobic/aerobic). It is constructed for 100,000 inhabitant equivalent and 120 m³/h. About 150 m³/h biogas is used for power generation and heating water in a public swimming bath.
Main treatment steps and related figures are:
- Two-step anaerobic-aerobic wastewater treatment plant; - About 100.000 PE (population equivalent); - Anaerobic UASB reactor with recirculation; - Two-stage activated sludge tank with pre-denitrification stage; - Anaerobic capacity: 9.000 kg/d COD; - Aerobic capacity: 2000 kg/d COD; - Anaerobic COD degradation: 70 - 80 %; - Aerobic COD degradation: 85 - 90 %; - Overall COD elimination efficiency: 96 - 97 %; - Biogas quantity: 3000-5000 m³/d.
Figure 22: WWTP of PM2 - Process flow diagram and image of paper mill

New technologies or innovative treatment lines for reliable water treatment for P&P and minimization of waste production
VEO,PTS, ENV, UCM, HOL, WED, January 2012
Page | 40
Table 6: Characteristics of PM2 waste waters
Parameter Unit Mean 2009
Volume m3/d 2699
Solids inflow kg/d 249
COD inflow mg/l 2977
COD effluent mg/l 109
COD elimination total % 96
COD elimination anaerobic % 73
BOD5 inflow mg/l 1617
BOD5 effluent mg/l 7
Conductivity inflow µS 1871
Conductivity effluent µS 2111
pH inflow - 6.25
pH effluent - 8.02
Solids effluent mg/l 35
NH4-N effluent mg/l 1.58
NO3-N effluent mg/l 2.93
PO4 effluent mg/ 1.14
AOX effluent mg/l 0.17
Concerning the quality of recirculation water, it depends what quality of paper is produced, and where the water should substitute fresh water. Printing paper, produced of virgin fibbers and low grammage and high brightness require higher quality of the recirculation water than brown paper produced with recycling fibbers. A lot of fresh water in paper production is used for cleaning wires and felts of the paper machine with high pressure spray nozzles. The requirement for this task is low calcium content to prevent precipitation. For the production of paper with high brightness the requirement is low colour of the water. For highly closed water circles the requirement asks for not too high chloride content, because this would lead to corrosion. More detailed water requirements for re-use purpose at PM2 are presented in table below:
Table 7: Water quality criteria for re-use purpose at PM2
Quality of reclamation water
LOW quality (misc. dilution)
MEDIUM quality (spraying nozzle)
HIGH quality (white paper grade)
Conductivity 500 µS/cm 500 µS/cm 500 µS/cm
Cl- < 300 mg/l < 200 mg/l < 200 mg/l
Ca < 200 mg/l < 60 mg/l < 60 mg/l
Colour don’t matter Don’t matter None
Solids Coarse particle filtration
10-15 mg/l Particles < 5 µm
10 mg/l
COD Don’t matter < 200 mg O2/l Not so important
< 50 mg O2/l
BOD Reduced low < 3 mg/l

New technologies or innovative treatment lines for reliable water treatment for P&P and minimization of waste production
VEO,PTS, ENV, UCM, HOL, WED, January 2012
Page | 41
The Figure 23 below represents all the experiments carried out on PM2 waste waters.
NFNF
PM2waste water
NFNF
Anaerobicprocess
Aerobicprocess
Evapo
Anaerobiclab reactor
ED
AOP (O3)
AOP (O3)Biodeg.
tests
Biodeg.
testsFenton
Evapo
3FM
Evapo
Softening
NFNF
Water to bere-used ?
Possibility to reinject into
biologicalprocesses?
Possibility to reinject intobiological
processes?
Water to be
re-used ?
Water to be
re-used ?
Water to bere-used ?
Water to be re-used
Impact of reinjection into
anaerobic
process?
Water to bere-used ?
Water to bere-used ?
Water to be
re-used ?
Line 1
Line 2
Figure 23: Tests carried out on Paper mill 2 waste waters
2.1.3 Paper mill 3 (PM3)
Paper mill 3 (PM3) has two paper machines producing 575000 t/year of standard newsprint, improved newsprint (higher brightness) and light weight coated paper (for magazines). The raw material used is a 100% recovered-paper and the current water consumption is 8m3/t.
Its actual wastewater treatment consists in a dissolve air flotation unit followed by 4 moving bed bioreactors (MBBRs) and two final microflotations for final clarification according with Figure 24.

New technologies or innovative treatment lines for reliable water treatment for P&P and minimization of waste production
VEO,PTS, ENV, UCM, HOL, WED, January 2012
Page | 42
Water Sludge
Gravitytable
Movingbedbioreactor
(R1)
Microflotator 1 (F1)
Water Sludge
Effluent
DAF
To process(DIP4)
PM2
To process(DIP2 & 3)
Gravitytable (x2)
DAF (x2)Movingbedbioreactor
(R2)
Movingbedbioreactor
(R3)
Water Sludge
Gravitytable
Movingbedbioreactor
(R1)
Microflotator 1 (F1)
Water Sludge
PM1Movingbedbioreactor
(R4)
Microflotator 2 (F2)
Water Sludge
Effluent
DAF
To process(DIP4)
PM2
To process(DIP2 & 3)
Water Sludge
Gravitytable
Movingbedbioreactor
(R1)
Microflotator 1 (F1)
Water Sludge
Effluent
DAF
To process(DIP4)
PM2
To process(DIP2 & 3)
Gravitytable (x2)
DAF (x2)Movingbedbioreactor
(R2)
Movingbedbioreactor
(R3)
Water Sludge
Gravitytable
Movingbedbioreactor
(R1)
Microflotator 1 (F1)
Water Sludge
PM1Movingbedbioreactor
(R4)
Microflotator 2 (F2)
Water Sludge
Effluent
DAF
To process(DIP4)
PM2
To process(DIP2 & 3)
Figure 24: Actual wastewater treatment plant at PM3
Figure 25 represents all the experiments carried out on PM3 waste waters.
PM3
waste water
Anaerobic
process
Aerobic
process3FM
NF / RO screening
Evapo
O3
Solarphotocatalysis
with TiO2
UV/TiO2
Water to bere-used ?
Water to bere-used ?
Water to bere-used ?
Water to be
re-used ?
Water to bere-used ?
MBR RO
AOP (O3)
AOP (Fenton)
AOP (UV/TiO2)
AOP
(O3/H2O2)
AOP(Photo-Fenton)
ED
Evapo
Water to bere-used ?
Water to bere-used ?
Water to bere-used ?
Water to bere-used ?
Water to bere-used ?
Water to bere-used ?
Water to bere-used ?
Water to bere-used ?
FLOCCULATIONWater to bere-used ?
PM3
waste water
Anaerobic
process
Aerobic
process3FM
NF / RO screening
Evapo
O3
Solarphotocatalysis
with TiO2
UV/TiO2
Water to bere-used ?
Water to bere-used ?
Water to bere-used ?
Water to be
re-used ?
Water to bere-used ?
MBR RORO
AOP (O3)
AOP (Fenton)
AOP (UV/TiO2)
AOP
(O3/H2O2)
AOP(Photo-Fenton)
ED
Evapo
Water to bere-used ?
Water to bere-used ?
Water to bere-used ?
Water to bere-used ?
Water to bere-used ?
Water to bere-used ?
Water to bere-used ?
Water to bere-used ?
FLOCCULATIONWater to bere-used ?
Figure 25: Tests carried out on PM3 waste waters

New technologies or innovative treatment lines for reliable water treatment for P&P and minimization of waste production
VEO,PTS, ENV, UCM, HOL, WED, January 2012
Page | 43
Experiments were done with the following water quality criteria for re-use defined by PM3 as target quality. Table 8 summarizes the important requirements on water quality for re-use purposes at PM3:
Table 8: Water re-use requirements for PM3
pH 6.5 – 7.5 Ptotal (mg/L) < 0.2
Conductivity (µS/cm) < 500 Ca (mg/L) < 60
Alkalinity (mg CaCO3/L) < 100 Al (mg/L) 0.1
Turbidity (NTU) - Fe (mg/L) < 15
TSS (mg/L) < 5 Mg (mg/L) < 0.05
Cl- (mg/L) < 50 Mn (mg/L) < 0.05
SO42-
(mg/L) < 100 Dissolved silicate (mg SiO2/L) < 5
2.2 Materials and equipment
2.2.1 MBR processes
2.2.1.1 MBR process on Paper mill 1
The inflow to the MBR was the anaerobically treated wastewater from the full-scale anaerobic reactor of the paper mill 1. The activated sludge tank of the MBR had a liquid volume of 200 to 250 litres. The external membrane tank had a volume of 30 litres in which a hollow fibre membrane was immersed. The membrane had a surface of about 1 m2 and a pore size of 0.04 µm. The trials were programmed in 450 second cycles including 420 s of filtration and 30 s of backwash. The net permeate volume stream (= flux volumes minus backwash volumes) of the total system was designed to be 10 l/m2/h.
Table 9: Feed characteristics (mean values)
Parameter Unit Feed MBR
pH - 6.8
Cond. mS/cm 5
Temp. °C 30
CODdiss mg/l 4295
BOD5 mg/l 1100
TSS mg/l 1122 Si mg/l 17
NH4-N mg/l 39
PO4-P mg/l 11
SO42- mg/l 140
Ca2+ mg/l 771
Cl- mg/l 82
Hardness °dH 120 Towards the end of the trial period, the plant was supplemented by an upstream stage in which CaCO3 was precipitated. The addition of Ca(OH)2 (lime milk) causes the pH to rise and CaCO3 to be precipitated. The hydraulic retention time of the precipitation pilot was about 2.5 h. A pH of

New technologies or innovative treatment lines for reliable water treatment for P&P and minimization of waste production
VEO,PTS, ENV, UCM, HOL, WED, January 2012
Page | 44
about 7.9 seemed sufficient for the process. The concentration of lime milk used was optimized during the first week of on-site trials from 1.2 g/l to an economical optimum of 0.47 g/l. The MLSS concentration in the MBR tank was in the range of 10 to 15 g/l. The sludge from the full-scale aerobic treatment plant was used for start-up. The F/M ratio in terms of kg BOD5/kg MLSS/d was adjusted in the range of 0.07 to 0.12. The hydraulic retention time of the MBR was designed to be 20 h. With 65 to 75 %, the ratio of MLVSS/MLSS was nearly constant during the trials (MLVSS: “mixed liquor volatile suspended solids”). The following table shows the mean feed parameters (without softening). Methods: The parameters BOD5, TNb, temperature, conductivity, pH, total suspended solids TSS, mixed liquor suspended solids MLSS and volatile suspended solids MLVSS were measured according to German Standard Methods for the Examination of Water, Wastewater and Sludge (DEV) or according to the standards of the German Institute for Standardization (DIN). The parameters COD, Ca2+, Cl-, PO4
3-, SO42-, NH4
+, were measured by means of photometric cuvette tests from the company HACH-LANGE GmbH, Germany. COD was measured only in dissolved form. Silicon was analysed by ICP-MS according to standard methods ISO 11885 and ISO 17294-2.
2.2.1.2 MBR process on Paper mills 2 and 3
For both paper mills no MBR tests were performed at lab scale but tests have been performed at pilot scale within WP5.1: - MBR technology will be directly validated on PM2 during on site pilot trials performed in
WP5.1.4, on the basis of the results obtained on PM1 waste waters in WP3.1 trials, both type of waste waters containing a high load of calcium (refer as well to §1.3.4 and 1.3.5).
- MBR was directly applied at pilot scale on PM3 within WP5.1.4. For more details concerning the MBR pilot configuration, refer to §3.2.2.2 of this report.
2.2.2 3FM technology
Lab scale tests were done on a small size pilot of the Flexible Fibre Filter module as batch system (see Figure 26). The mini pilot consisted of:
- a tank with a capacity of 115 L for the raw water equipped with a stirrer; - a volumetric pump (max. flow rate 100L/h) that delivers the filter module with raw; - the mini module containing the fibre bundle; - a further tank (capacity 115 L) which collects the filtrate.

New technologies or innovative treatment lines for reliable water treatment for P&P and minimization of waste production
VEO,PTS, ENV, UCM, HOL, WED, January 2012
Page | 45
RAW
WATER
FILTRATED
WATER
3FM module (Ø 32 mm)
�
�
�
� Mechanical stirrer
� Pump
� Probes (pH, temperature, conductivity, redox)
RAW
WATER
FILTRATED
WATER
3FM module (Ø 32 mm)
�
�
�
� Mechanical stirrer
� Pump
� Probes (pH, temperature, conductivity, redox)
Figure 26: Small pilot 3FM
Contrary to an industrial 3FM module, the configuration of this pilot 3FM filter didn’t include an industrial collector. However, in order to have a realistic approach to the industrial 3FM version, the density of the fibre packing is respected, the flow is also as parallel as perpendicular to the fibres and the fibres are only attached to the bottom and can move freely in the upper part of the casing. No backwash process is either done, but this small size module should deliver first results for the applicability of this technique on paper mill effluents.
Each raw effluent was fully characterized before 3FM filtration including its constitution in salts and ions, which is important for the selection of nanofiltration membranes and other operating conditions. The raw water tank was filled with the effluent to be treated. In order to prevent the particles from sedimentation the agitator was switched on. 80-100 L of effluent was then filtered at a velocity of ca. 45 m/h with a flow rate of ca. 40 L/h and with maximal stirring. 1 L samples were taken at at the outlet of the filter every 30 min and the turbidity, temperature, pH and conductivity were measured and recorded online. On the same sample COD, TSS and dry matters (105°C) were as well measured in the laboratory. The following table shows the important analysis and values that should be obtained after the 3FM filtration.
Table 10: Important parameters and aspired results
Parameter Methods Expected results
TSS [mg/l] Filtration at 1,2 µm 10
Turbidity [NTU] Infrared 2100PISO HACH turbidimeter (nephelometric measure) 1-3
Particle size cut-off [µm] Granulometer ≤ 10
Interesting parameters concerning filtration tests are the total suspended solids (TSS), turbidity, COD and particle size distribution. The aim of the 3FM filtration is to reduce the particle

New technologies or innovative treatment lines for reliable water treatment for P&P and minimization of waste production
VEO,PTS, ENV, UCM, HOL, WED, January 2012
Page | 46
concentration, to hold back particles of a certain size, to reduce organic particles and thus to improve the filterability of the effluent for nanofiltration and reduce the clogging of these membranes.
2.2.3 Membrane technologies (UF, NF, RO)
2.2.3.1 NF tests on PM 1 and PM2 effluents
For assessment of membrane performance in treatment lines of effluents PM1 and PM2 existing membrane units together with pilot equipment were used to produce wastewater samples suitable for nanofiltration:
- In the case of PM1 effluent from a MBR pilot (PTS) was used without prior treatment; - PM2 full scale effluent from the secondary clarifier of a conventional activated sludge plant
was subjected to particle filtration (single use filter cartridge, 25 µm) before performing the tests (see Figure 27).
PM1: Liner board, heavy book board from 100% recovered paper
PM2: Coated / uncoated board (Testliner) from 100% rec. paper
EGSB Pilot MBR NFEGSB Pilot MBR NF
UASB Act. Sludge Clarifier Lab Filter NFUASB Act. Sludge Clarifier Lab Filter NF
Figure 27: Wastewater treatment lines including NF
Nanofiltration experiments were done on two different scales. Lab experiments were performed using a bench-scale Osmota membrane test cell (A = 80 cm²), membrane flat sheets and just a few litres of wastewater. Concentration runs were done in batch mode. Pilot scale experiments were performed in ENV workshop using a fully automated membrane plant, 4 inches spiral wound technical modules and batches of wastewater (1 – 2 m³) delivered by the PMs. From these batches nanofiltration concentrates were sampled and sent to other WP3.1 partners for further experiments on concentrate handling.
Focus was given to control of process conditions (T, pH, conductivity, p (TMP), F) in the tests in order to be able to compare and reproduce results. Basic calculations such as membrane retention (as function of permeate and concentrate), recovery rate (conversion rate, %) or volumetric conversion factor (VCF) respectively, flux (L/m²·h) and permeability rate (L/m²·h·bar) were done routinely. Routine analysis was done using commercially available photometric tests for e.g. COD, Ca2+, Cl- and else. On selected samples detailed analysis was done on relevant parameters for assessment of permeate and concentrate quality.
2.2.3.2 NF tests on 3FM filtrate from PM2
Membrane screening tests on 3FM filtrate from PM2 were done on an Osmonics membrane filtration cell pilot: the filtration is frontal and membrane surface is of 140 cm2. The pilot is

New technologies or innovative treatment lines for reliable water treatment for P&P and minimization of waste production
VEO,PTS, ENV, UCM, HOL, WED, January 2012
Page | 47
configured in batch mode i.e. the concentrate is reinjected into the feed tank: the recirculation feed is set by the high pressure pump which can be regulated. As the feed vessel is only of 5 L, effluent is regularly added and the tests lasted several days. For each one of them, the permeate flux, the feed temperature, the conductivity of the concentrate and of permeate were followed.
2.2.3.3 UF and RO applied to PM3 effluent
UF and RO were directly applied at pilot scale on PM3 waste water. For more details concerning the pilots configuration, refer to §3.2.2.2 of this report and as well to the internal report I5.1.4.4 “Multi-barrier processes, in combination with disinfection” (Hermosilla and al., 2010).
2.2.4 AOP technologies
2.2.4.1 Applied to PM1 and PM2
Ozone trials were performed by PTS and WED on samples of NF-concentrates of PM1 and PM2 as well as on MBR permeate of PM1.
a) Ozone lab equipment of PTS:
The ozone treatment trials of PTS were conducted using PTS’ own ozone test system. The ozone was produced in a generator manufactured by WEDECO which is infinitely variable and has a maximum output of 670 W. The reactor for ozonization of the effluents features a glass tube at whose lower end the ozone-containing gas is supplied via a frit to the sample water in counter current flow. During treatment, the reactor chamber is filled with about one litre of sample (pre-filtered with black ribbon paper filter). Online probes installed in the effluent outlet of the reactor determine the pH, redox potential, conductivity and spectral absorption coefficient.
Figure 28: Ozone test system
Fully biologically treated effluents from the paper mills were subjected to laboratory scale continuous and batch wise ozone testing with defined amounts of ozone being supplied to the water. A batch trial enables the study of a wide range of ozone dosages and first assessment of the ozone dosage needed to optimally enhance the biodegradability. In batch trials 1.3 L of the sample were treated with ozone. On-going ozonisation results in an ever increasing introduction of ozone into the sample. Continuous trials are most suitable to represent the operation of large-scale plants. Typically two continuous ozone trials were performed per sample in the laboratory plant. The amount of ozone

New technologies or innovative treatment lines for reliable water treatment for P&P and minimization of waste production
VEO,PTS, ENV, UCM, HOL, WED, January 2012
Page | 48
was based upon the results of the batch trials. Sample flow rates were adjusted to realise a hydraulic retention time of 15 to 20 min for each sample in the reactor.
b) Ozone lab equipment of WED:
The ozone gas is generated from oxygen (pressurized gas cylinders) either by a Modular (capacity: 4 g O3/h) or GSO ozone system (capacity: 30 g O3/h) (manufactured by the WEDECO). These generators operate on the basis of silent electrical discharge. The product gas (O2/O3) is determined with a BMT 964 measurement device manufactured by the BMT Messtechnik GmbH. The ozone concentration in gas phase is measured by using the direct UV-photometric method (standard procedure 002/87 (F) of the International Ozone Association).
The bench scale laboratory set-up features a glass tube reactor. The sample water is circulated by a booster pump. The ozone gas is injected in the recirculation loop by a pump/injection system. The off-gas is captured at the top of the glass reactor and vented via an ozone monitor to a catalytical ozone destructor. During treatment the glass reactor is filled with about seven litre of sample. Optionally, online probes installed in the effluent outlet of the reactor determine the pH or dissolved ozone concentration.
Basic components:
1. Oxygen supply (Oxygen, LOX, PSA)
2. Ozone generator (WEDECO 4HC, ozone capacity
of 4g/h)
3. Ozone analyzer for feed gas (BMT 964C)
4. Venturi injection system (injection of ozone)
5. Booster pump
6. Reaction column (glass-reactor/ volume of 10L)
7. Sample point (ball valve)
8. Ozone (dissolved) measurement - optional
9. Ozone analyzer for off gas (BMT 964C) with
cooling trap for device protection
10. Catalytic ozone destructor
11. Circulation pump
12. Ambient air control (safety equipment)
Figure 29: Schematic diagram of the laboratory ozone plant
In case of AOP testing (= here specifically O3/H2O2) a certain amount of H2O2 is added to the batch. By controlling the progress of the reaction by sampling, the residual H2O2 concentration is monitored as well (DIN 38409 part 15) and kept on certain level.
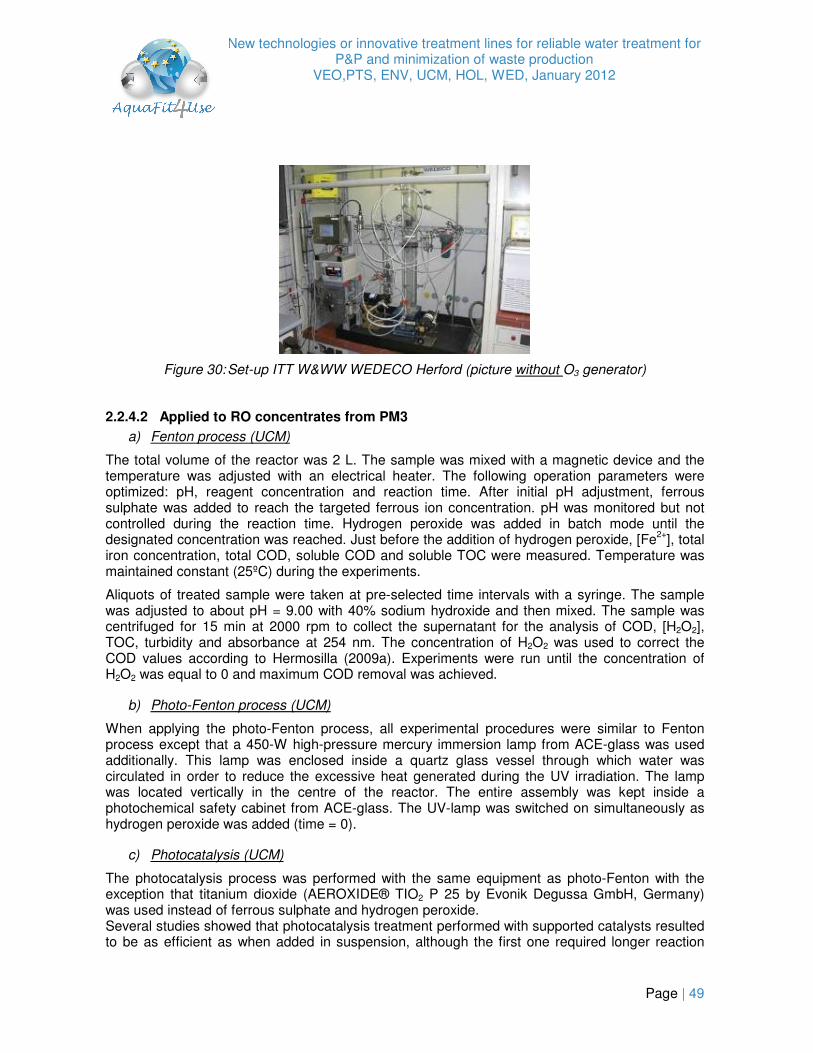
New technologies or innovative treatment lines for reliable water treatment for P&P and minimization of waste production
VEO,PTS, ENV, UCM, HOL, WED, January 2012
Page | 49
Figure 30: Set-up ITT W&WW WEDECO Herford (picture without O3 generator)
2.2.4.2 Applied to RO concentrates from PM3
a) Fenton process (UCM)
The total volume of the reactor was 2 L. The sample was mixed with a magnetic device and the temperature was adjusted with an electrical heater. The following operation parameters were optimized: pH, reagent concentration and reaction time. After initial pH adjustment, ferrous sulphate was added to reach the targeted ferrous ion concentration. pH was monitored but not controlled during the reaction time. Hydrogen peroxide was added in batch mode until the designated concentration was reached. Just before the addition of hydrogen peroxide, [Fe2+], total iron concentration, total COD, soluble COD and soluble TOC were measured. Temperature was maintained constant (25ºC) during the experiments.
Aliquots of treated sample were taken at pre-selected time intervals with a syringe. The sample was adjusted to about pH = 9.00 with 40% sodium hydroxide and then mixed. The sample was centrifuged for 15 min at 2000 rpm to collect the supernatant for the analysis of COD, [H2O2], TOC, turbidity and absorbance at 254 nm. The concentration of H2O2 was used to correct the COD values according to Hermosilla (2009a). Experiments were run until the concentration of H2O2 was equal to 0 and maximum COD removal was achieved.
b) Photo-Fenton process (UCM)
When applying the photo-Fenton process, all experimental procedures were similar to Fenton process except that a 450-W high-pressure mercury immersion lamp from ACE-glass was used additionally. This lamp was enclosed inside a quartz glass vessel through which water was circulated in order to reduce the excessive heat generated during the UV irradiation. The lamp was located vertically in the centre of the reactor. The entire assembly was kept inside a photochemical safety cabinet from ACE-glass. The UV-lamp was switched on simultaneously as hydrogen peroxide was added (time = 0).
c) Photocatalysis (UCM)
The photocatalysis process was performed with the same equipment as photo-Fenton with the exception that titanium dioxide (AEROXIDE® TIO2 P 25 by Evonik Degussa GmbH, Germany) was used instead of ferrous sulphate and hydrogen peroxide. Several studies showed that photocatalysis treatment performed with supported catalysts resulted to be as efficient as when added in suspension, although the first one required longer reaction

New technologies or innovative treatment lines for reliable water treatment for P&P and minimization of waste production
VEO,PTS, ENV, UCM, HOL, WED, January 2012
Page | 50
time (Yeber, 2000). Considering the previous research we have developed the experimental work with suspended TiO2. The concentration of TiO2 and reaction time were studied maintaining pH (as received, 7.5) and temperature (25ºC) constant during the experiments. The suspension was first stirred in the dark for 10 min before irradiation (reaction time = 0). This was sufficient to reach an equilibrated adsorption as deduced from the steady-state concentrations. Subsequently the UV-lamp was switched on.
d) Solar photocatalysis (UCM)
Solar photocatalaysis experiments were carried out in a solar simulator equipped with a Xenon lamp (1000W), model M-9119X. Intensity or power can be pre-selected. A filter, P/N 81011, is used to correct the illuminator out to obtain solar spectrum under ideal conditions, ASTM E490-73a.
In these experiments the concentration of TiO2 and reaction time were studied at different pH (7 and 12) and constant temperature (25ºC). pH, redox potential and dissolved oxygen were measured on-line during five hours of each experiment. Aliquots of treated sample were taken at pre-selected time intervals and quality was characterized by COD, TOC, turbidity and absorbance at 254 nm. The suspension was first stirred in the dark for 10 min before irradiation (reaction time = 0). This was sufficient to reach an equilibrated adsorption as deduced from the steady-state concentrations. Subsequently the Xenon lamp was switched on.
2.2.5 Evapoconcentration
Lab scale evapoconcentration trials were done with Laborata 4002-control Heidolph (230/240V, 50/60 Hz) evaporator displayed in Figure 31. The objective was to obtain the target VCF determined on the basis of the effluent characteristics, which is mainly based on a final chloride concentration > 45-50 g/L of chlorides in the final concentrate.
Figure 31: Lab-scale evaporator
Since the flask volumes were not sufficient to run the experiment, feed was regularly added to the remaining concentrate until the target VCF was achieved. The range of temperature range and

New technologies or innovative treatment lines for reliable water treatment for P&P and minimization of waste production
VEO,PTS, ENV, UCM, HOL, WED, January 2012
Page | 51
pressure applied during lab-tests depending of treated effluent, were: 60°C < T < 70°C and 140 mbar < P < 180 mbar. Analyses were carried out both on feed, concentrate and distillate. Focus was done on the quality of the distillate to assess the fulfilment of waste water quality criteria defined by the paper mills for re-use in P&P production processes.
2.2.6 Electrodialysis
Electrodialysis tests were run on a lab scale PC Cell BED 1-2 electrodialysis pilot which is displayed in Figure 32. The diluate and concentrate compartments can contain 2 L and each of them is connected to a pump to enable the electrodialysis cell supply. Conductivity is measured out of each compartment.
Figure 32: Lab scale electrodialysis experiment
Table 10 shows the membrane characteristics. The electrode is in platinum titanium.
Table 11: Membranes characteristics
Membranes characteristics
Type Eurodia MA-AMX and MC-CMX
Membrane size 110 mm x 110 mm
Active surface per membrane 64 cm2
Number 11 CMX and 10 AMX
Two important parameters had first to be considered before proceeding to the desalination test: the faradic yield, which measures the electrodialysis efficiency, and the limiting current, corresponding to the current which must not be exceeded in order to preserve the integrity of the membranes. Once these two parameters were determined, the feed desalination was achieved: the compartments were filled in the same way as in the limiting current experiment. The intensity was fixed at 80 percent of the raw effluent limiting current value until the voltage reached 18 V. The voltage was then set as 18 V and the intensity evolved freely. This was done to preserve the membranes integrity. At the end of the experiments, focus was done on COD and salts in both diluate and concentrate.

New technologies or innovative treatment lines for reliable water treatment for P&P and minimization of waste production
VEO,PTS, ENV, UCM, HOL, WED, January 2012
Page | 52
2.2.7 Softening and controlled precipitation technologies
In order to reduce scaling tendencies in membrane processes softening experiments have been carried out at laboratory scale also in batches (see §3.2.1.3c in Technical progress of the work). Rather than pre-conditioning (acidification, dosing of antiscalant) for aerobic effluent, the removal of hardness seems to be a viable option for improving NF performance and operational stability. Two types of experiments have been carried out. Firstly softening with conventional cationic resins was done in small ion exchange columns. Secondly precipitation of calcium carbonate by addition of lime milk or NaOH, seeding crystals and pH adjustment was performed. Subsequent filtration using a calcite filter bed removed residual turbidity in some of the experiments. Main focus was given on process conditions for optimum removal of calcium (pH, temperature, concentration of seeds, dosing rates of chemicals) and lowest residual Ca2+ concentrations and conductivity levels. Softening experiments were as well performed on 3FM filtrate from PM2 using the advanced precipitation MultifloTM softening technology. Figure 33 displays the bench-scale Multiflo softening unit which was used: it includes a precipitation reactor and a solid-liquid separator. The precipitation tank is a draft tube reactor of 5 litres. Calcium and carbonates removal were done by addition of lime and calcium chloride. The produce mineral sludge is separate from water by a lamellar settling. Part of precipitated sludge is evacuated by the bottom of the settler, the other part is returned in the precipitation tank.
Settler
Precipitationtank
Feedpumps
Recirculationpump
Treatedeffluent
Sludge
Settler
Precipitationtank
Feedpumps
Recirculationpump
Treatedeffluent
Sludge
Figure 33: Lab scale softening experiment
Lime and calcium chloride are added taking account of pH in the precipitation tanks to the use of a pH electrode. Two experiments were carried out at pH equal to 8.1 and 9. Softening has only an impact on calcium and carbonates and as well on TSS and thus turbidity. However, at the end of each experiment, complete analyses were carried out.
2.2.8 Biodegradability experiments (PM1, PM2 and PM3)
2.2.8.1 Anaerobic bench scale tests
Biodegradation experiments for re-injection of non-treated NF concentrates were performed on laboratory scale using a 4.5 L anaerobic sludge bed reactor. Real wastewater of partner mills was fed continuously to the reactor under varying load conditions to evaluate degradation performance and COD-removal. Concentrates produced in pilot scale batch filtration experiments were added to the feed (around 20 % of feed volume) intermittently for several weeks and deterioration of
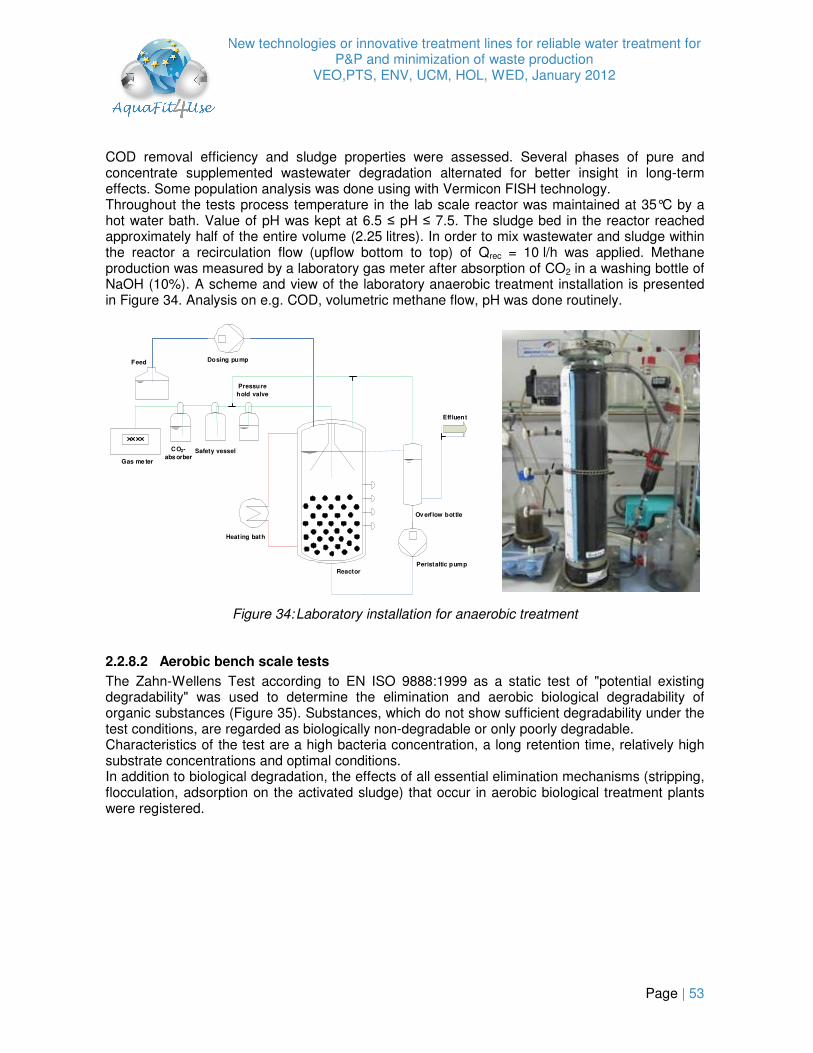
New technologies or innovative treatment lines for reliable water treatment for P&P and minimization of waste production
VEO,PTS, ENV, UCM, HOL, WED, January 2012
Page | 53
COD removal efficiency and sludge properties were assessed. Several phases of pure and concentrate supplemented wastewater degradation alternated for better insight in long-term effects. Some population analysis was done using with Vermicon FISH technology. Throughout the tests process temperature in the lab scale reactor was maintained at 35°C by a hot water bath. Value of pH was kept at 6.5 ≤ pH ≤ 7.5. The sludge bed in the reactor reached approximately half of the entire volume (2.25 litres). In order to mix wastewater and sludge within the reactor a recirculation flow (upflow bottom to top) of Qrec = 10 l/h was applied. Methane production was measured by a laboratory gas meter after absorption of CO2 in a washing bottle of NaOH (10%). A scheme and view of the laboratory anaerobic treatment installation is presented in Figure 34. Analysis on e.g. COD, volumetric methane flow, pH was done routinely.
Safety vessel
Reactor
CO2-
abs orber
Dosing pump
Gas me ter
Feed
Ov erf low bottle
Peristaltic pump
Heating bath
Pressure
hold valve
Eff luent
Figure 34: Laboratory installation for anaerobic treatment
2.2.8.2 Aerobic bench scale tests
The Zahn-Wellens Test according to EN ISO 9888:1999 as a static test of "potential existing degradability" was used to determine the elimination and aerobic biological degradability of organic substances (Figure 35). Substances, which do not show sufficient degradability under the test conditions, are regarded as biologically non-degradable or only poorly degradable. Characteristics of the test are a high bacteria concentration, a long retention time, relatively high substrate concentrations and optimal conditions. In addition to biological degradation, the effects of all essential elimination mechanisms (stripping, flocculation, adsorption on the activated sludge) that occur in aerobic biological treatment plants were registered.

New technologies or innovative treatment lines for reliable water treatment for P&P and minimization of waste production
VEO,PTS, ENV, UCM, HOL, WED, January 2012
Page | 54
Test conditions
COD : 100 - 1000 mg/l
T: 20 - 25 ° C
pH: 7,0 ± 0,5
: 0,1 - 0,2 g/l TSS / 100 mg/l COD
effluent sample
+ activated sludge
stirrer
pH,T
pH - adjustment
(NaOH, HCl )
magnetic
stirrer
pressurized air
O 2
diffuser
Figure 35: Zahn-Wellens Test: principle and test conditions

New technologies or innovative treatment lines for reliable water treatment for P&P and minimization of waste production
VEO,PTS, ENV, UCM, HOL, WED, January 2012
Page | 55
3 Results and achievements
3.1 Major results and achievements
3.1.1 Corrugated paper mill (PM1 and PM2)
Following results were obtained for PM1 (detailed flow sheet with main analysis in Annex 8.2):
PM1 wastewater
Anaerobicprocess
Aerobicprocess
3FM
O3
MBR
NF
Evapo
AOP (O3)
AOP (Fenton)
- TSS reduced to 3-5 mg/L
- Turbidity level < 2-3 NTU
White papergrade processwater quality
SOD = 0.25 – 0.7 gO3/gCOD
As fresh water surrogate(e.g. in showers)
Feed pH = 6.5Antiscalant 3-8 ppmSystem RR ≈ 80%P = 15 - 20 barA = 7.3 - 7.6 m²
As fresh water surrogate(e.g. in showers)
for direct re-injection
upstream the anaerobicprocess
Lab scale: VCF = 3(� Industrial scale: VCFmax = 6-7)
VCF = 8.3 Fe = 32.2 mg/LH2O2 (100%) = 483 mg/L
for re-injection into the
aerobic process (dependson Cl- concentration)
for re-injection into the aerobic process (dependson Cl- concentration)
SOD = 0.5 gO3/gCOD
PM1 wastewater
Anaerobicprocess
Aerobicprocess
3FM
O3
MBR
NFNF
Evapo
AOP (O3)
AOP (Fenton)
- TSS reduced to 3-5 mg/L
- Turbidity level < 2-3 NTU
White papergrade processwater quality
SOD = 0.25 – 0.7 gO3/gCOD
As fresh water surrogate(e.g. in showers)
Feed pH = 6.5Antiscalant 3-8 ppmSystem RR ≈ 80%P = 15 - 20 barA = 7.3 - 7.6 m²
As fresh water surrogate(e.g. in showers)
for direct re-injection
upstream the anaerobicprocess
for direct re-injection
upstream the anaerobicprocess
Lab scale: VCF = 3(� Industrial scale: VCFmax = 6-7)
VCF = 8.3 Fe = 32.2 mg/LH2O2 (100%) = 483 mg/L
for re-injection into the
aerobic process (dependson Cl- concentration)
for re-injection into the
aerobic process (dependson Cl- concentration)
for re-injection into the aerobic process (dependson Cl- concentration)
for re-injection into the aerobic process (dependson Cl- concentration)
SOD = 0.5 gO3/gCOD
Most important findings are:
• Stable MBR operation is not possible at calcium concentrations > 400 mg/l due to scaling problems. Softening upstream of the MBR is than absolutely necessary. Trials with a lime softening stage showed a removal of 50 – 80 % of the Ca2+ concentration in the feed (600 – 1000 mg/l).
• Ozone trials with pre-filtered final effluent of both mills led to a COD reduction by about 20- 25%. Economical viable specific ozone dosages of 0.25 to 0.7 g O3/g COD0 have been used. Overall it is more costly and complex to achieve COD levels below ~50 mg/l. The increased BOD5 shows that a subsequent biological treatment can be promising for further COD reduction. The water can be reused in the production process, especially because the water after ozone treatment is visibly colour-free. Possible reuse processes are showers at the paper machine were it can be used instead of fresh water. Calcium concentrations may be a limiting factor for reuse.
• NF membranes with high retention capacity for monovalent ions are able to fulfil quality requirements for white grade paper reclamation water (for PM1 and PM2). Conductivity requirements and low corrosion potential (reduction of chloride) are achieved with high

New technologies or innovative treatment lines for reliable water treatment for P&P and minimization of waste production
VEO,PTS, ENV, UCM, HOL, WED, January 2012
Page | 56
rejection NF membranes only. Dow Filmtec NF 90 and Koch TFC ULP have shown to be suited for these goals.
• Intensive pre-treatment or conditioning is needed to obtain steady NF membrane performance and high recovery rates. High scaling tendency (membrane blocking) of aerobic effluents of both PMs was observed without conditioning or pre-treatment of waste water. Reduction of pH to around pH 6.5 (HCl) and dosing of antiscalant was necessary to achieve recovery rates of 80%. Softening of wastewater allowed higher recovery up to 93% and lower chemical consumption for conditioning (no use of hydrochloric acid). In this view, the MultifloTM softening technology (lime softening) is well adapted to remove calcium carbonate. According to theoretical calculations flux rates should not exceed 20 L/(m²·h) and long term stability of membrane treatment (plateau formation, high system recovery) needs to be evaluated on pilot scale continuously.
• 3FM technology showed good performances at lab scale regarding TSS removal (85%) and turbidity reduction (81-90%) for both paper mills waste waters. As the bench scale 3FM unit has only a limited representation of the efficiency of an industrial 3FM module, these results have to be confirmed at pilot scale.
Most important findings concerning the treatment of concentrates of PM1 and PM2 are: • Evapoconcentration proved to be an adapted technology to treat NF concentrates in terms
of production of a colourless water with a quality fulfilling the water quality criteria of both paper mills for re-use and to reduce the final volume of concentrates:
o Reduction of wastes as a global volumic concentration factor VCF up to 50 for combined “NF+evapoconcentration” could be obtained at lab scale for PM2 and 25 for PM1). However, due to feed characteristics and more specifically the chloride concentration in the final concentrates (45 g/L max. for conventional materials), these global VCFs should be increased at industrial scale to 60 without NF membrane pre-treatment and up to 250 with 3FM/softening provided conversion rate on NF process and pre-treatment processes are the same at pilot scale. Then the addition of evapoconcentration would lead to a final concentrate to be disposed of representing respectively 1.7% to 0.4% in the last case in volume of the waste water treated by the global treatment line.
o Pre-treatments (3FM and softening) before NF process have a positive impact on the global VCF which could be reached at industrial scale leading to a very substantial reduction of the volume of final waste to be disposed of down to 0.4%.
• AOP treatment: High conductivity and chloride concentrations > 4,000 mg/l prevented biological degradation after AOP treatment. To reduce chloride intake to the wastewater, softening before membrane processes is preferable to acidification with HCl.
• Re-injection of NF concentrates has a negative impact on anaerobic degradation rate in pellet sludge reactors. For all combinations of wastewater and concentrates a distinct deterioration in COD removal was observed. COD balancing revealed, that this could not be explained by persistency of recalcitrant COD in concentrates alone, but also by negative impact on degradation of incoming wastewater COD. In long-term runs formation of inorganic deposits in sludge took place as well as reduction in share of living cells as confirmed by FISH technology.
• Electrodialysis can’t be used as a salt draining technology for reducing salts accumulation in view of reinjecting the desalinated NF concentrates upstream biological processes. Due to the presence of organic charged matter, salts can’t be properly separated.

New technologies or innovative treatment lines for reliable water treatment for P&P and minimization of waste production
VEO,PTS, ENV, UCM, HOL, WED, January 2012
Page | 57
Following results were obtained for PM2 (see as well detailed flow sheet with main analysis in Annex 8.3):
NF
NF
PM
2w
as
tew
ate
r
NF
NF
An
ae
rob
icp
roc
es
sA
ero
bic
pro
ce
ss
Eva
po
ED
AO
P (
O3)
AO
P (
O3)
Fe
nto
n
Eva
po
3F
M
Eva
po
So
fte
nin
g
NF
NF
Line
1
Line
2
Fee
d pH
= 6
.5A
ntis
cala
nt3-
8 pp
mR
RS
yste
m≈
80 %
P =
15
-20
bar
Fo
r H
RT
lo
w,
me
diu
m &
hig
hq
ua
liti
es
-T
SS
≤2
mg
/L-
Tu
rbid
ity≤
3 N
TU
Fee
d: p
H =
6P
max
= 25
bar
sR
RS
yste
m=
80
%A
= 1
40 c
m2
Fo
r H
RT
lo
w,
me
diu
m &
hig
hq
ua
liti
es
Ant
isca
lant
RR
Sys
tem
≈9
3 %
P =
15
-20
bar
Fo
r H
RT
lo
w,
me
diu
m &
hig
hq
ua
liti
es
As
fre
sh
wa
ter
su
rro
ga
te(e
.g.
sh
ow
ers
)
Fo
r re
-in
jec
tio
nu
ps
trea
m
an
ae
rob
icp
roc
ess
no
t re
co
mm
en
de
d
Lab
scal
e: V
CF
= 5
(�In
dust
rial s
cale
: VC
Fm
ax=
8)
VC
F =
10
As
fre
sh
wa
ter
su
rro
ga
te(e
.g.
in s
ho
wers
)
As
fre
sh
wa
ter
su
rro
ga
te
(e.g
. in
sh
ow
ers
)
As
fre
sh
wa
ter
su
rro
ga
te(e
.g.
in s
ho
we
rs)
Lab
scal
e: V
CF
= 1
0(�
Indu
stria
l sca
le: V
CF
max
= 12
)
VC
F =
8.3
VC
F =
14
Indu
stria
l sca
le: V
CF
max
= 18
[Ca
2+]
= 4
0 m
g/L
[Ca
2+]
= 1
20
mg
/L
No
re
-in
jec
tio
nu
ps
tre
am
an
ae
rob
icp
roc
es
sn
ot
rec
om
me
nd
ed
0.8
g O
3 / g
CO
D
Fe
= 5
6 m
g/L
H2O
2(1
00%
) =
133
mg/
L
for
re-i
nje
cti
on
into
the
aero
bic
pro
cess
(dep
en
ds
on
Cl-
co
ncen
trati
on
)
for
re-i
nje
cti
on
into
the
aero
bic
pro
cess
(dep
en
ds
on
Cl-
co
ncen
trati
on
)
for
re-i
nje
cti
on
into
the
aero
bic
pro
cess
(dep
en
ds
on
Cl-
co
ncen
trati
on
)
for
re-i
nje
cti
on
into
the
aero
bic
pro
cess
(dep
en
ds
on
Cl-
co
ncen
trati
on
)

New technologies or innovative treatment lines for reliable water treatment for P&P and minimization of waste production
VEO,PTS, ENV, UCM, HOL, WED, January 2012
Page | 58
3.1.2 News print paper mill (PM3)
Most important findings derived from the application of AOPs to PM3 effluent are: • Although AOPs treatments are efficient for organics removal due to the high amount of
volatile fatty acids in the effluent of PM3 a previous biological treatment could be more reliable.
• Colour removal is higher than 95% and COD removals vary between 20 to 40%. AOPs processes improve biodegradability of the treated effluent.
PM3waste water
O3
Solar
photocatalysiswith TiO2
UV/TiO2
pH = 7
pH = 7, [TiO2] = 5 g/L
pH = 7, [TiO2] = 5 g/L
for reuse, pulp
preparationas fresh water
in mill
for reuse, pulppreparation
as fresh water in mill
For reuse, e.g. pulp preparation
PM3waste water
O3
Solar
photocatalysiswith TiO2
UV/TiO2
pH = 7
pH = 7, [TiO2] = 5 g/L
pH = 7, [TiO2] = 5 g/L
for reuse, pulp
preparationas fresh water
in mill
for reuse, pulppreparation
as fresh water in mill
For reuse, e.g. pulp preparation
(See as well detailed flow sheet with main analyses in Annex 8.4) Most important findings derived from the treatments applied to RO concentrates from PM3 are:
• Evapoconcentration proved to be an adapted technology to treat membrane concentrates of both tested treatment trains (Anaerobic � Aerobic � 3FM � RO and Anaerobic � MBR � RO). In both cases the produced water (final VCF = 11.5-11.7) has a very good quality respecting all PM3 requirements for re-use as fresh water. Considering the VCF of the RO step, the addition of evapoconcentration would then lead to a final waste to be disposed off representing respectively 2.8% and 7% in volume of the waste water treated by the global treatment line.
• Coagulation eliminated more than 95% of coloured compounds with a high level of resonance (A500), however, high coagulant doses were needed, making the process economically unfeasible. Besides, PACl addition by itself increases conductivity.
• Lime-softening was a good alternative to reduce conductivity. Organic matter was adsorbed on Mg(OH)2 and CaCO3 surface and, thus, additionally removed in the precipitation process.
• Coagulating water with 2500 mg/L of PACl1 in the presence of lime and aPAM produces a 60% COD removal, independently of the pH and the dosage.
• Fenton and photo-Fenton processes were optimised by response surface methodology. Low pH (= 2.8) and high [H2O2] (4.5 x COD) were optimum conditions for both methods. Low ferrous ion concentration might achieve good COD removals with photo-Fenton process ([H2O2]/[Fe2+] = 30) and Fenton process need higher ferrous ion concentrations ([H2O2]/[Fe2+] = 1.5). More than 50% of COD removal may be obtained at neutral pH.
• AOPs obtained a high removal of COD. Photo-Fenton obtained the best COD removal (99%) followed by Fenton (90%) in comparison to the 40% achieved by ozone.
• Photocatalysis did not obtain so high COD and TOC removals from RO reject, but the combination of photocatalysis treatment (10 g/L of TiO2) with biological treatments got a total removal of organic matter from the wastewater.

New technologies or innovative treatment lines for reliable water treatment for P&P and minimization of waste production
VEO,PTS, ENV, UCM, HOL, WED, January 2012
Page | 59
• Electrodialysis isn’t adapted as a salt draining technology for reducing salts accumulation in view of reinjecting the desalinated NF concentrates upstream biological processes.
An
ae
rob
icp
rocess
Aero
bic
pro
cess
3F
MN
F / R
O
scre
en
ing
Evap
o
MB
RR
O
O3
Fen
ton
UV
/TiO
2
O3/H
2O
2
Ph
oto
-F
en
ton
ED
Evap
o
Ad
van
ced
flo
ccu
lati
on
-T
SS
≤6 m
g/L
-T
urb
idit
y≤
8 N
TU
MLT
S =
10
g/L
Flux
= 1
2 LM
HF/
M =
0.1
5 kg
CO
D/d
.kgM
LTS
PM
3w
aste
wate
r
Spi
ral w
ound
mem
bran
es1
pass
/2 s
teps
Mem
bran
e su
rface
= 2
6 m
2
Feed
pH =
5.5
P =
20
bars
Mem
bran
e ar
ea =
140
cm
2
As f
resh
wate
r su
rro
gate
(e.g
. in
sh
ow
ers
)
Vel
ocity
= 65
L/h
VC
F =
5
VC
F =
1.25
VC
F =
7 VC
F =
11.
5
pH w
aste
wat
er
pH w
aste
wat
er
pH w
aste
wat
er[T
iO2]
= 5
g/L
pH =
2.8
H2O
2/C
OD
ratio
= 2
.125
H2O
2/Fe
2+ra
tio =
2.5
pH =
2.8
H2O
2/C
OD
ratio
= 2
.125
H2O
2/Fe
2+ra
tio =
30
as f
res
hw
ate
rin
th
e m
ill
for
reu
se
, e.g
. p
ulp
pre
para
tio
n
As f
resh
wa
ter
su
rro
gate
(e.g
. in
sh
ow
ers
)
for
re-u
se
for
reu
se,
e.g
. p
ulp
pre
para
tio
nas
fre
sh
wate
r
in t
he m
ill
for
reu
se,
e.g
. p
ulp
pre
para
tio
nas
fre
sh
wate
r in
th
e m
ill
for
reu
se,
e.g
. p
ulp
pre
para
tio
nas
fre
sh
wate
r in
th
e m
ill
for
reu
se,
e.g
. p
ulp
pre
para
tio
nas
fre
sh
wate
r in
th
e m
ill
for
reu
se,
e.g
. p
ulp
pre
para
tio
nas
fre
sh
wate
r in
th
e m
ill
for
reu
se,
e.g
. p
ulp
pre
para
tio
nas
fre
sh
wate
r in
th
e m
ill
An
ae
rob
icp
rocess
Aero
bic
pro
cess
3F
MN
F / R
O
scre
en
ing
Evap
o
MB
RR
OR
O
O3
Fen
ton
UV
/TiO
2
O3/H
2O
2
Ph
oto
-F
en
ton
ED
Evap
o
Ad
van
ced
flo
ccu
lati
on
-T
SS
≤6 m
g/L
-T
urb
idit
y≤
8 N
TU
MLT
S =
10
g/L
Flux
= 1
2 LM
HF/
M =
0.1
5 kg
CO
D/d
.kgM
LTS
PM
3w
aste
wate
r
Spi
ral w
ound
mem
bran
es1
pass
/2 s
teps
Mem
bran
e su
rface
= 2
6 m
2
Feed
pH =
5.5
P =
20
bars
Mem
bran
e ar
ea =
140
cm
2
As f
resh
wate
r su
rro
gate
(e.g
. in
sh
ow
ers
)A
s f
resh
wate
r su
rro
gate
(e.g
. in
sh
ow
ers
)
Vel
ocity
= 65
L/h
VC
F =
5
VC
F =
1.25
VC
F =
7 VC
F =
11.
5
pH w
aste
wat
er
pH w
aste
wat
er
pH w
aste
wat
er[T
iO2]
= 5
g/L
pH =
2.8
H2O
2/C
OD
ratio
= 2
.125
H2O
2/Fe
2+ra
tio =
2.5
pH =
2.8
H2O
2/C
OD
ratio
= 2
.125
H2O
2/Fe
2+ra
tio =
30
as f
res
hw
ate
rin
th
e m
ill
for
reu
se
, e.g
. p
ulp
pre
para
tio
n
As f
resh
wa
ter
su
rro
gate
(e.g
. in
sh
ow
ers
)A
s f
resh
wa
ter
su
rro
gate
(e.g
. in
sh
ow
ers
)
for
re-u
se
for
reu
se,
e.g
. p
ulp
pre
para
tio
nas
fre
sh
wate
r
in t
he m
ill
for
reu
se,
e.g
. p
ulp
pre
para
tio
nas
fre
sh
wate
r
in t
he m
ill
for
reu
se,
e.g
. p
ulp
pre
para
tio
nas
fre
sh
wate
r in
th
e m
ill
for
reu
se,
e.g
. p
ulp
pre
para
tio
nas
fre
sh
wate
r in
th
e m
ill
for
reu
se,
e.g
. p
ulp
pre
para
tio
nas
fre
sh
wate
r in
th
e m
ill
for
reu
se,
e.g
. p
ulp
pre
para
tio
nas
fre
sh
wate
r in
th
e m
ill
for
reu
se,
e.g
. p
ulp
pre
para
tio
nas
fre
sh
wate
r in
th
e m
ill
for
reu
se,
e.g
. p
ulp
pre
para
tio
nas
fre
sh
wate
r in
th
e m
ill
for
reu
se,
e.g
. p
ulp
pre
para
tio
nas
fre
sh
wate
r in
th
e m
ill
for
reu
se,
e.g
. p
ulp
pre
para
tio
nas
fre
sh
wate
r in
th
e m
ill
for
reu
se,
e.g
. p
ulp
pre
para
tio
nas
fre
sh
wate
r in
th
e m
ill
for
reu
se,
e.g
. p
ulp
pre
para
tio
nas
fre
sh
wate
r in
th
e m
ill
(See as well detailed flow sheet with main analyses in Annex 8.4)

New technologies or innovative treatment lines for reliable water treatment for P&P and minimization of waste production
VEO,PTS, ENV, UCM, HOL, WED, January 2012
Page | 60
3.2 Technical progress of the work
3.2.1 Corrugated paper mill (PM1 and PM2)
3.2.1.1 Comparison of anaerobic/aerobic/3FM treatment with Anaerobic/MBR treatment
a) 3FM filtration applied to the anaerobic/aerobic effluent
3FM tests were run on the effluent coming from the final clarifier of the WWTP from PM1 and PM2. The aim of these trials was to determine the performances of the 3FM on TSS and turbidity levels in order to fine-tune the quality of the effluent with the inlet specifications of AOPs and NF processes. For each effluent 100 L of raw water were filtrated at 65 L/h and samples were regularly taken. Complete analyses of the two clarifier’s effluents are given in Table 43 in the Annex 8.5. Stable performances in time were obtained and no breakthrough was observed (see Figure 80 in Annex 8.5). For both waste waters very good results were observed regarding TSS content abatement with at least 86% and 85% for waste water from PM1 and PM2 respectively and as well for turbidity with 91% and 80% abatement respectively. As expected, no impact was seen on dissolved COD removal but only particular COD was removed. (See as well Annex 8.5 of this report). PM1 PM2
Raw water
3FM filtrate Raw water
3FM filtrate
pH 8.4 8.3 8.09 8.09
Cond. (mS/cm) 3.4 3.48 2.7 2.7
TSS (mg/L) 28 ≤ 5 (86%) 23 ≤ 2 (85%)
Turbidity (NTU) 33.7 ≤ 3 (91%) 21 ≤ 3 (80%)
tCOD (mgO2/L) 258 235 154 99
Granulometry analysis carried out on both effluents showed a cut size of about 5 µm (Figure 36), which is in accordance with 3FM industrial specifications (indicated cut size for industrial module ca. 5-10 µm).
0
2
4
6
8
10
12
14
16
0,01 0,1 1 10 100 1000 10000
d µm (log scale)
Feed15' filtration30' filtration60' filtration90' filtration
Figure 36: Particle size distribution of 3FM filtrate from PM2

New technologies or innovative treatment lines for reliable water treatment for P&P and minimization of waste production
VEO,PTS, ENV, UCM, HOL, WED, January 2012
Page | 61
In conclusion, the 3FM tests run at lab scale showed encouraging performances on the effluent from PM1 and PM2 clarifiers although the 3FM bench scale unit has only a limited representation of the efficiency of an industrial 3FM module as it has no backwash process and is not representative of the hydrodynamic of an industrial module. These results thus give an indication of the performances which should be expected at pilot scale, and for which better performances should be obtained. These results will be validated during pilot trials which will be run on site within WP5.1.4.
b) Application of MBR to the Anaerobic effluent
It was possible to operate a MBR lab scale plant for a period of > 130 days with a stable COD degradation in excess of 90 %. One particular challenge was the extremely high water hardness that caused massive scaling problems. MBR operation would not be economically possible on an industrial scale without a preceding softening stage. Since it proved necessary to clean the membrane every 5-10 days, an upstream lime softening process was designed, constructed and put into operation for the final 22 trial days which removed 50 – 80 % of the calcium concentration upstream of the MBR stage. The flux increased again as a result and the cleaning intervals could be extended significantly.
Experiments with the described MBR lab scale plant were performed only at the site of PM1 in SP3. In PM2 a MBR pilot trial is planned to be conducted in SP5.
The feed COD concentration showed very high fluctuations during the trial. The maximum inflow concentration amounted to 9900 mg/l. On average, the COD concentration in the inflow amounted to 4295 mg/l. COD elimination was very good during the entire trial period. The concentration in the permeate averaged 378 mg/l, thus yielding an elimination in excess of 90 %. BOD5 inflow concentrations were in many cases also subject to great fluctuations during the entire trial period. The maximum value amounted to 2443 mg/l here. The lowest value was 195 mg/l. BOD5 elimination was good during the entire trial period with degradation averaging more than 95 %. The concentration in the permeate averaged 25 mg/l and was thus relatively high, although still within limits. Figure 37 shows the development of pressures in filtration and backwash cycle:
-0.8
-0.6
-0.4
-0.2
0.0
0.2
0.4
0.6
0.8
1.0
0 10 20 30 40 50 60 70 80 90 100 110 120 130 140
Time [d]
Pre
ss
ure
[b
ar]
Filtration pressure Backwash pressure Membrane cleaning
OP I OP II OP III
Figure 37: Filtration and backwash pressures during the MBR trials at high water hardness

New technologies or innovative treatment lines for reliable water treatment for P&P and minimization of waste production
VEO,PTS, ENV, UCM, HOL, WED, January 2012
Page | 62
During start-up in the first operating phase (OP I), an almost constant pressure increase was observed which reached its maximum on day 26. Initial cleaning processes showed a positive effect on both filtration and backwash pressures. The cleaning sequences are indicated by vertical dotted lines in Figure 37. Due to rapid scaling phenomena, the pressure increased very fast to the maximum level of -0.4 bars (see “OP II” on Figure 37) within 5-10 days after every acidic cleaning. The high pressure drop during backwash indicates that calcium scaling occurred not only on the membrane surface, but also in the support layer and hollow fibres. Best cleaning results were obtained with citric acid at a concentration of 3 to 5 g/l. After the start-up of the softening stage at the beginning of operating phase III (“OP III” in Figure 37), the filtration pressure curve was smoothened after a very short time and rapid pressure increases were no longer observed. The large pressure drops due to scaling affected also the flux. After a fast decrease from 16 to 10 l/m2/h in the start-up of operating phase I, a further decrease was observed in operating phase II. The numerous cleaning operations showed some effect but could not fully restore the flux. A minimum flux of 2 to 5 l/m2/h was achieved at the end of operating phase II, which is far too low for the reasonable operation of a full-scale plant. After installing the softening stage, the flux increased and seemed to stabilize at 8 l/m2/h. Another increase seemed possible but could not be studied as the on-site trial time had ended. The inflow calcium concentration reached maximum values over 1000 mg/l. The mean value was 771 mg/l. Due to the high concentration in combination with a pH of around 8.0, severe CaCO3 scaling was observed in the whole system. The mean calcium concentration of 217 mg/l in the permeate indicates that a huge amount of CaCO3 was precipitated in the sludge and membrane tanks (Figure 38). It was not economically feasible to lower the pH in the MBR feed by adding acid to prevent precipitation, since the high buffering capacity would necessitate excessive amounts of acid. An upstream lime softening pilot was designed and constructed instead. In Figure 38, the good efficiency of the softening pilot used in operating phase III is visible from the much lower calcium concentration in the inflow. Especially the smaller difference between in- and outflow of the MBR system indicates that scaling can be expected to be reduced.
0
200
400
600
800
1000
1200
1400
1 25 45 60 75 95 117 132
Time [d]
Calc
ium
co
nce
ntr
ati
on
[m
g/l
]
Feed Permeate
OP IIIOP IIOP I
Figure 38: Calcium feed and permeate concentrations during the trials at high water hardness
The calcium precipitation plant reduced the calcium concentration by 50 - 80 %. Additionally the dissolved COD was also significantly reduced by 20 - 40 % in the softening pilot due to adsorption effects and flocculation.

New technologies or innovative treatment lines for reliable water treatment for P&P and minimization of waste production
VEO,PTS, ENV, UCM, HOL, WED, January 2012
Page | 63
c) Conclusion
Stable MBR operation is not possible with calcium concentrations > 400 mg/l. However, a positive fact is that scaling can be cleaned off well using acidic chemicals (best results were gained with HCl and citric acid). This in turn means that flux can be restored by cleaning. Nonetheless, a softening stage upstream of the MBR is absolutely necessary when the calcium concentrations are so high. It showed not to be economical feasible to lower the pH in the MBR feed by adding acid, since the high buffering capacity would necessitate too huge amounts of acid. The lime milk precipitation/flocculation that was used instead showed very good results in terms of flux increase.
3FM filtration is well applied to the removal of TSS and reduction of the turbidity of the WWTP final effluent. However, this is only a polishing step before membrane processes: the produced water can’t be re-used.
MBR Softening / MBR Aerobic / 3FM
Produced water quality & Type of re-use Low to medium
grade of water. Suitable for reuse (depends on water hardness). Possibly at showers or as sealing water for pumps.
Medium grade of water. Suitable for reuse at showers or as sealing water for pumps.
3FM has only an impact on TSS level and turbidity. � All other parameters (Cl-, Ca2+, conductivity…) are not impacted excepted particular COD
Main parameters of the produced water
COD: 200 – 400 mg/l BOD5: < 10 mg/l (in an industrial scale plant) TSS: none Conductivity: approx. the same as in feed Ca2+: Removal depends on pH in aeration tank
COD: 200 – 400 mg/l BOD5: < 10 mg/l (in an industrial scale plant) TSS: none Ca2+: Removal of 50 to 80 % can be expected
TSS ≤ 5 mg/L (85% removal) Turbidity ≤ 3 NTU Soluble COD: not impacted Ca2+, Cl-, conductivity and other parameters not impacted
Withdrawal and/or critical points to pay attention to
Calcium concentrations of about > 400 mg/l cause severe flux decrease; Chloride is not decreased by MBR; Permeate still coloured
Chloride is not decreased by MBR; Permeate still coloured
3FM is only a preliminary treatment on the propo-sed treatment train (at the outlet of biological treatment). Caution should be paid on high TSS level (> 100 mg/L), for which 3FM is not recommended, which can induce high frequency of backwash
3.2.1.2 Comparison of AOP and NF treatment applied to MBR effluent (PM1)
a) Application of AOP to the MBR effluent
In laboratory ozone trials the COD concentration was reduced by about 20 %. The increased BOD5 shows that a subsequent biological treatment can be promising for further COD reduction.
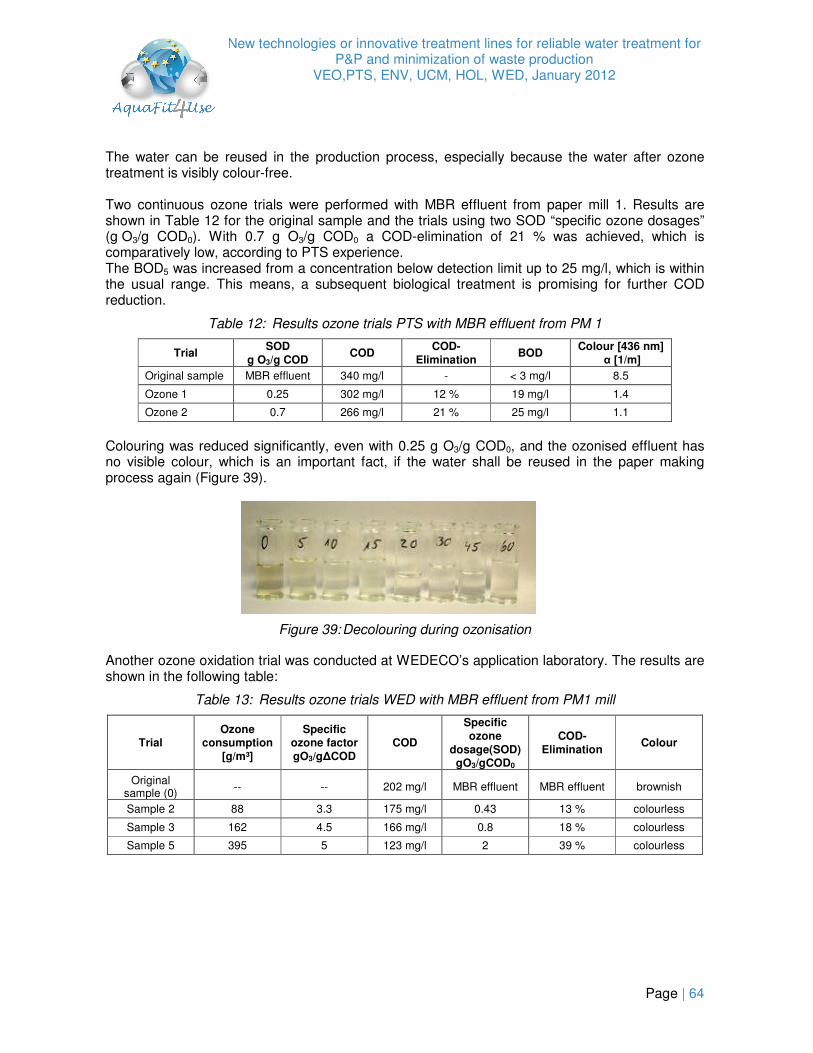
New technologies or innovative treatment lines for reliable water treatment for P&P and minimization of waste production
VEO,PTS, ENV, UCM, HOL, WED, January 2012
Page | 64
The water can be reused in the production process, especially because the water after ozone treatment is visibly colour-free. Two continuous ozone trials were performed with MBR effluent from paper mill 1. Results are shown in Table 12 for the original sample and the trials using two SOD “specific ozone dosages” (g O3/g COD0). With 0.7 g O3/g COD0 a COD-elimination of 21 % was achieved, which is comparatively low, according to PTS experience. The BOD5 was increased from a concentration below detection limit up to 25 mg/l, which is within the usual range. This means, a subsequent biological treatment is promising for further COD reduction.
Table 12: Results ozone trials PTS with MBR effluent from PM 1
Trial SOD
g O3/g COD COD COD-
Elimination BOD Colour [436 nm]
α [1/m] Original sample MBR effluent 340 mg/l - < 3 mg/l 8.5
Ozone 1 0.25 302 mg/l 12 % 19 mg/l 1.4
Ozone 2 0.7 266 mg/l 21 % 25 mg/l 1.1
Colouring was reduced significantly, even with 0.25 g O3/g COD0, and the ozonised effluent has no visible colour, which is an important fact, if the water shall be reused in the paper making process again (Figure 39).
Figure 39: Decolouring during ozonisation
Another ozone oxidation trial was conducted at WEDECO’s application laboratory. The results are shown in the following table:
Table 13: Results ozone trials WED with MBR effluent from PM1 mill
Trial Ozone
consumption
[g/m³]
Specific ozone factor
gO3/g∆COD
COD
Specific
ozone
dosage(SOD) gO3/gCOD0
COD-
Elimination Colour
Original sample (0)
-- -- 202 mg/l MBR effluent MBR effluent brownish
Sample 2 88 3.3 175 mg/l 0.43 13 % colourless
Sample 3 162 4.5 166 mg/l 0.8 18 % colourless
Sample 5 395 5 123 mg/l 2 39 % colourless

New technologies or innovative treatment lines for reliable water treatment for P&P and minimization of waste production
VEO,PTS, ENV, UCM, HOL, WED, January 2012
Page | 65
second phase
first phase
COD reduction by ozone treatment
(SMK, effluent MBR )
110
130
150
170
190
210
0 50 100 150 200 250 300 350 400
Ozone feed [g/m³]
CO
D [
mg
/l]
1st phase
2nd phasesecond phase
first phase
COD reduction by ozone treatment
(SMK, effluent MBR )
110
130
150
170
190
210
0 50 100 150 200 250 300 350 400
Ozone feed [g/m³]
CO
D [
mg
/l]
1st phase
2nd phase
Figure 40: COD reduction (batch trial) in MBR effluent by ozone
The achieved results are consistent with PTS results: - It is feasible to reduce the remaining, persistent COD by means of ozone oxidation. The
required ozone dosages increase during the treatment (demonstrated by the increasing specific ozone factors). The effects of relatively high COD reduction rates (higher than ~ 15%) have to be questioned concerning the gained benefit/effect relation.
- The residual colour was reduced. Already with an ozone dosage of 46 g O3/m³ (SOD = 0.23 gO3/g COD0) the treated effluent showed no visible colour.
Additional remarks: - Since the chloride content (Cl¯ = 360 mg/l) is notable in the effluent, the risk to (re-)generate
AOX contamination has to be considered for higher ozone dosages (SOD > 0.75). - Due to the fact that the UV-transmission [@254 nm, 1 cm] of the MBR effluent is not higher
than 2% (!), all conventional UV-based AOP approaches are considered to be not feasible. - For advanced COD reduction (SOD > 0.75) the combination of O3/H2O2 might be interesting
to improve the ozone reaction effectiveness towards slow reacting, residual compounds.
b) Application of NF to the MBR effluent
Evaluation of membrane performance was first done in a membrane test cell on MBR effluent (treatment of PM1 wastewater). As seen in Figure 41 there are distinct variations in retention properties and permeabilities of a wide range of membranes tested. In consideration of all criteria NF 270 seems the obvious choice because it combines reasonable retention of salts with high permeability. In terms of high salt rejection NF 90 and TFC ULP have to be considered more suitable, but at the expense of lower permeability rates. Nevertheless better performance was reached than obtained with a standard RO membrane (SW 30).
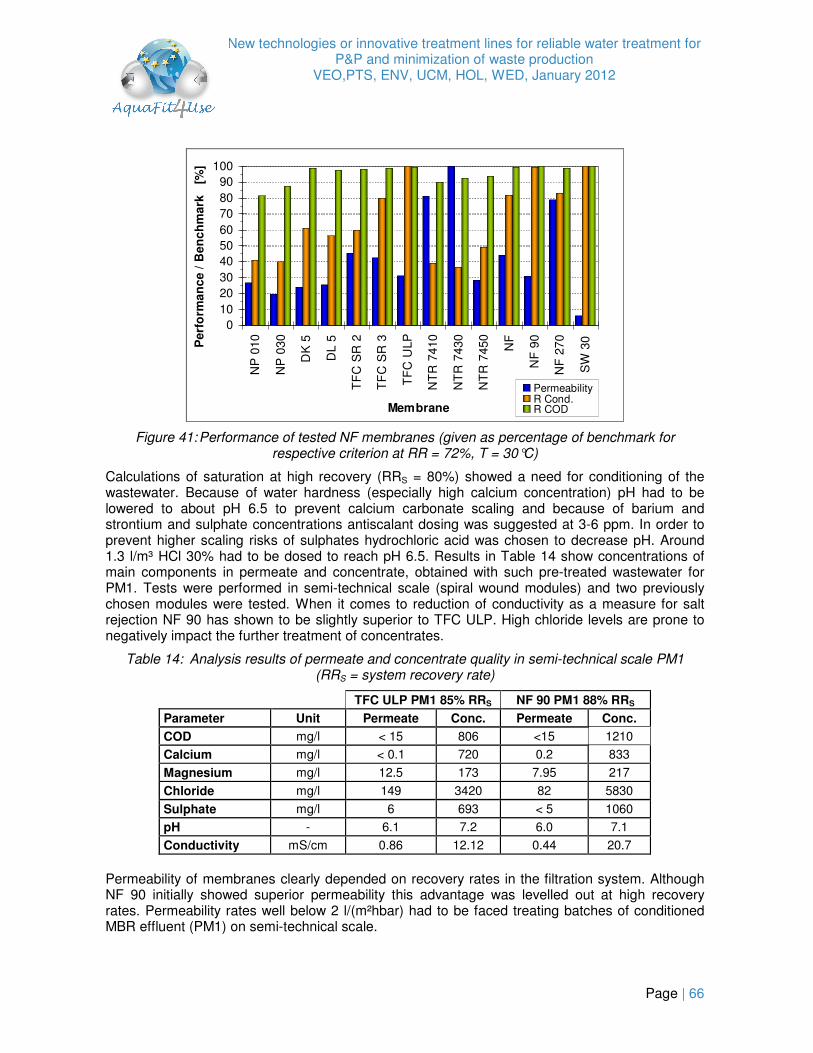
New technologies or innovative treatment lines for reliable water treatment for P&P and minimization of waste production
VEO,PTS, ENV, UCM, HOL, WED, January 2012
Page | 66
0102030405060708090
100
NP
010
NP
030
DK
5
DL
5
TF
C S
R 2
TF
C S
R 3
TF
C U
LP
NT
R 7
410
NT
R 7
430
NT
R 7
450
NF
NF
90
NF
270
SW
30
Membrane
Perf
orm
an
ce /
Be
nc
hm
ark
[
%]
PermeabilityR Cond.R COD
Figure 41: Performance of tested NF membranes (given as percentage of benchmark for respective criterion at RR = 72%, T = 30°C)
Calculations of saturation at high recovery (RRS = 80%) showed a need for conditioning of the wastewater. Because of water hardness (especially high calcium concentration) pH had to be lowered to about pH 6.5 to prevent calcium carbonate scaling and because of barium and strontium and sulphate concentrations antiscalant dosing was suggested at 3-6 ppm. In order to prevent higher scaling risks of sulphates hydrochloric acid was chosen to decrease pH. Around 1.3 l/m³ HCl 30% had to be dosed to reach pH 6.5. Results in Table 14 show concentrations of main components in permeate and concentrate, obtained with such pre-treated wastewater for PM1. Tests were performed in semi-technical scale (spiral wound modules) and two previously chosen modules were tested. When it comes to reduction of conductivity as a measure for salt rejection NF 90 has shown to be slightly superior to TFC ULP. High chloride levels are prone to negatively impact the further treatment of concentrates.
Table 14: Analysis results of permeate and concentrate quality in semi-technical scale PM1 (RRS = system recovery rate)
TFC ULP PM1 85% RRS NF 90 PM1 88% RRS
Parameter Unit Permeate Conc. Permeate Conc.
COD mg/l < 15 806 <15 1210
Calcium mg/l < 0.1 720 0.2 833
Magnesium mg/l 12.5 173 7.95 217
Chloride mg/l 149 3420 82 5830
Sulphate mg/l 6 693 < 5 1060
pH - 6.1 7.2 6.0 7.1
Conductivity mS/cm 0.86 12.12 0.44 20.7
Permeability of membranes clearly depended on recovery rates in the filtration system. Although NF 90 initially showed superior permeability this advantage was levelled out at high recovery rates. Permeability rates well below 2 l/(m²hbar) had to be faced treating batches of conditioned MBR effluent (PM1) on semi-technical scale.

New technologies or innovative treatment lines for reliable water treatment for P&P and minimization of waste production
VEO,PTS, ENV, UCM, HOL, WED, January 2012
Page | 67
Figure 42: Permeability rates of TFC ULP and NF 90 elements with increasing system recovery rates at feed temperatures of 27 °C ± 1.5 °C. Element recovery rates from 5.9 to 8.5 % for TFC
ULP and 5.9 to 8.8 % for NF 90.
c) Conclusion on applicability of AOP and NF to MBR effluent
Main conclusions are the following:
Ozone (PTS/WED) NF (ENV)
Produced water quality
& Type of re-use Reuse is possible as fresh water surrogate. Especially for e.g. showers, as the water is solid free.
Possible constriction: water hardness
Reuse is possible as white paper grade process water or as fresh water surrogate. Water is color-less, reduced in chlorides and COD. For best grade paper production, usage of NF 90 module is advised.
Main parameters of the produced water
- COD reduction up to 25 % seems economical feasible;
- BOD5 is increased: 25 mg/l - Colour completely removed; - Water disinfected; - Ozone has no effect on minerals
(Ca/Mg) and salt content (chloride, sulfate, etc…)
- COD (mgO2/L) < 15; - BOD5 (mgO2/L) < 3; - Conductivity rejection > 90; - Colour completely removed; - Calcium concentration < 1 mg/l; - Chloride concentration < 100 mg/l
for NF 90 (88% RR) module and < 150 mg/l for TFC ULP (85% RR).
- Solids completely removed;
Process conditions
- Specific ozone dosage SOD 0.23-0.55 g O3/g COD0
- Water preferably filtered - Temperature: 5-30°C
- pH: 7,8÷8 for bench scale tests - pH adjustment to 6,5 for semi-
technical scale tests; - Antiscalant addition of 3-6 ppm (for
semi-technical tests) - Temperature app. 30°C for bench
scale - Temperature: 27°C ± 1.5°C for semi-
technical scale tests

New technologies or innovative treatment lines for reliable water treatment for P&P and minimization of waste production
VEO,PTS, ENV, UCM, HOL, WED, January 2012
Page | 68
Ozone (PTS/WED) NF (ENV)
Withdrawal and/or critical points to pay attention to
At low ozone dosing: BOD, respectively AOC increase in may lead to biofouling, if treated water is used at critical location. At high ozone dosing: in the presence of high chloride contents AOX re-formation might be critical. Accumulation of salts or hardness in water circuits, due to circuit narrowing, can not be prevented by ozone treatment.
- Due to high calcium concentration in MBR permeate, pH reduction by HCl was necessary for scaling prevention. Conditioning of feed water with acid will negatively impact desalination.
- Usage of antiscaling agents is highly recommended;
- To prevent chloride concentration increase (HCl for pH adjustment), softening before NF system would be recommended.
- NF filtered effluent also will be reduced in bacterial counts, but regrowth is possible (no measurements available). If disinfection must be guaranteed additional disinfection might be necessary
Both technologies will be tested and evaluated at pilot scale within WP5.1.4.
3.2.1.3 Comparison of direct NF, 3FM/NF and 3FM/softening/NF applied to anaerobic/aerobic effluent (PM2)
As some scaling phenomena were observed when applying NF treatment to the MBR effluent of PM1, impact of pre-treatment on NF process was then studied on PM2 anaerobic/aerobic effluent. Following treatments combinations were compared: direct NF, 3FM/NF and 3FM/softening/NF.
a) Direct NF applied to anaerobic/aerobic effluent
As a result of the previous PM1 experiments the NF 90 and TFC ULP membrane were chosen for the acidified feed experiments with PM2 effluent. The pH value in these tests was lowered with hydrochloric acid in order to reduce carbonate scaling risks. Around 1 l/m3 of 30% HCl had to be dosed to reach pH 6,5 of PM2 anaerobically/aerobically pre-treated effluent. In order to prevent calcium carbonate scaling and because of barium and strontium and sulphate concentrations antiscalant dosing was suggested at 3-6 ppm. Results in Table 15 show concentrations of main components in permeate and concentrate, obtained with such pre-treated wastewater of PM2. Tests were performed in semi-technical scale (spiral wound modules) and two previously chosen modules were tested. When it comes to reduction of conductivity as a measure for salt rejection NF 90 has shown to be superior to TFC ULP. High chloride levels are prone to negatively impact the further treatment of concentrates.
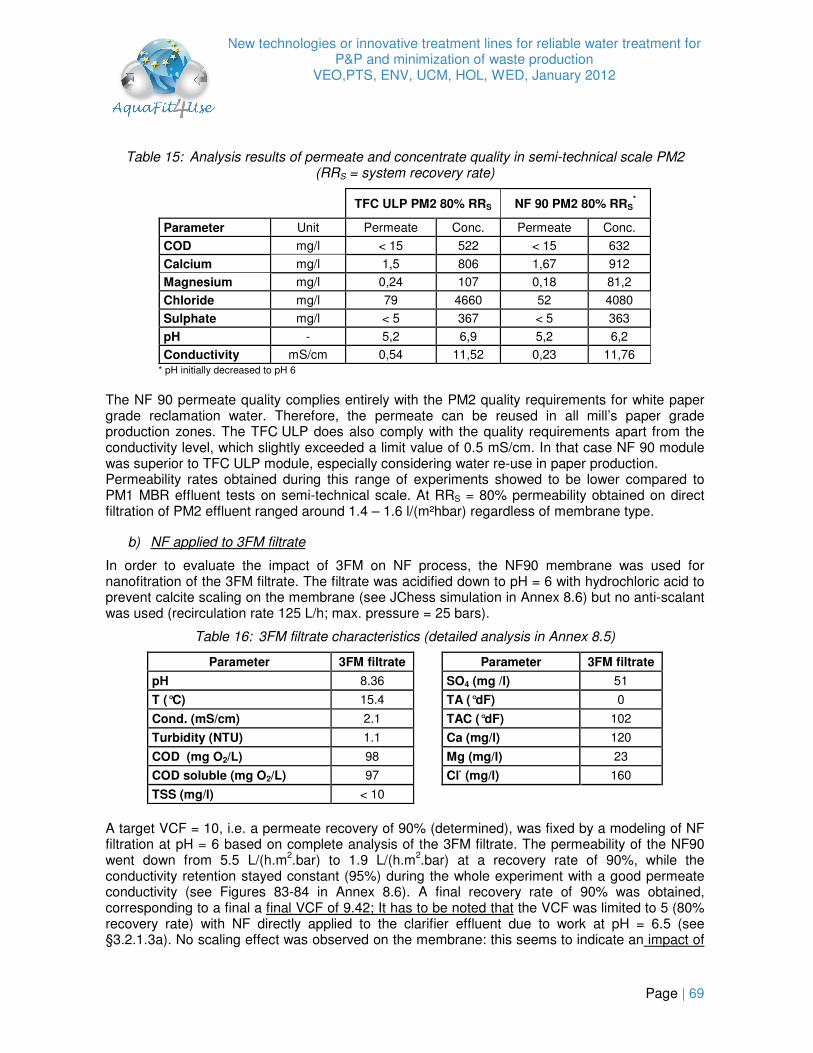
New technologies or innovative treatment lines for reliable water treatment for P&P and minimization of waste production
VEO,PTS, ENV, UCM, HOL, WED, January 2012
Page | 69
Table 15: Analysis results of permeate and concentrate quality in semi-technical scale PM2 (RRS = system recovery rate)
TFC ULP PM2 80% RRS NF 90 PM2 80% RRS
*
Parameter Unit Permeate Conc. Permeate Conc.
COD mg/l < 15 522 < 15 632
Calcium mg/l 1,5 806 1,67 912
Magnesium mg/l 0,24 107 0,18 81,2
Chloride mg/l 79 4660 52 4080
Sulphate mg/l < 5 367 < 5 363
pH - 5,2 6,9 5,2 6,2
Conductivity mS/cm 0,54 11,52 0,23 11,76 * pH initially decreased to pH 6
The NF 90 permeate quality complies entirely with the PM2 quality requirements for white paper grade reclamation water. Therefore, the permeate can be reused in all mill’s paper grade production zones. The TFC ULP does also comply with the quality requirements apart from the conductivity level, which slightly exceeded a limit value of 0.5 mS/cm. In that case NF 90 module was superior to TFC ULP module, especially considering water re-use in paper production. Permeability rates obtained during this range of experiments showed to be lower compared to PM1 MBR effluent tests on semi-technical scale. At RRS = 80% permeability obtained on direct filtration of PM2 effluent ranged around 1.4 – 1.6 l/(m²hbar) regardless of membrane type.
b) NF applied to 3FM filtrate
In order to evaluate the impact of 3FM on NF process, the NF90 membrane was used for nanofitration of the 3FM filtrate. The filtrate was acidified down to pH = 6 with hydrochloric acid to prevent calcite scaling on the membrane (see JChess simulation in Annex 8.6) but no anti-scalant was used (recirculation rate 125 L/h; max. pressure = 25 bars).
Table 16: 3FM filtrate characteristics (detailed analysis in Annex 8.5)
Parameter 3FM filtrate Parameter 3FM filtrate
pH 8.36 SO4 (mg /l) 51
T (°C) 15.4 TA (°dF) 0
Cond. (mS/cm) 2.1 TAC (°dF) 102
Turbidity (NTU) 1.1 Ca (mg/l) 120
COD (mg O2/L) 98 Mg (mg/l) 23
COD soluble (mg O2/L) 97 Cl- (mg/l) 160
TSS (mg/l) < 10
A target VCF = 10, i.e. a permeate recovery of 90% (determined), was fixed by a modeling of NF filtration at pH = 6 based on complete analysis of the 3FM filtrate. The permeability of the NF90 went down from 5.5 L/(h.m2.bar) to 1.9 L/(h.m2.bar) at a recovery rate of 90%, while the conductivity retention stayed constant (95%) during the whole experiment with a good permeate conductivity (see Figures 83-84 in Annex 8.6). A final recovery rate of 90% was obtained, corresponding to a final a final VCF of 9.42; It has to be noted that the VCF was limited to 5 (80% recovery rate) with NF directly applied to the clarifier effluent due to work at pH = 6.5 (see §3.2.1.3a). No scaling effect was observed on the membrane: this seems to indicate an impact of

New technologies or innovative treatment lines for reliable water treatment for P&P and minimization of waste production
VEO,PTS, ENV, UCM, HOL, WED, January 2012
Page | 70
the 3FM filtration on the NF process but this last one could as well be attributed to the lower pH. This trend will have to be confirmed/validated at pilot scale.
Table 17: NF90 permeate and concentrate at 90% system recovery rate at pH =6
Permeate Concentrate Permeate Concentrate
COD (mgO2/L) 44 799 Turbidity (FAU) < 0.2
TOC < 2 n.d. Ca2+
(mg/L) < 1 1 090
BOD5 (mgO2/L) 2 n.d. Mg2+
(mg/L) < 1 220
TSS (mg/L) < 10 n.d. Na+ (mg/L) 100 n.d.
pH 5.9 6.05 Cl- (mg/L) 180 5 880
C (mS/cm) 1.06 19.21 SO42-
(mg/l) < 20 558
The permeate quality at 90% recovery rate complies with PM2 requirements for re-use except regarding conductivity which is too high (Table 17; complete analysis are reported in Annex 8.6). However, a conductivity level below 500 µS/cm can be reached working at lower recovery rate of 80%: the produced permeate fulfills then all water quality criteria (low, medium and high water quality criteria) fixed by PM2 for re-use purposes (Important note: The positive impact of 3FM on NF process has to be validated at pilot scale as these results were obtained with a filtration cell.)
c) Softening applied to 3FM filtrate
As EnviroChemie carried out nanofiltration on PM1 clarifier effluent wastewater (see §3.2.1.3a): high scaling tendency of the membrane due to calcium carbonate was observed. It was then shown that this scaling phenomena could be minimized by working at pH = 6.5 with hydrochloric acid and the use of antiscalant. However acidification with HCl will lead to a higher chloride concentration in the concentrates and thus may induce some treatment problems of these concentrates. Softening before NF was then studied as an alternative to remove CaCO3: such a process would indeed allow increasing conversion rate of NF step and decreasing chemical reagents consumption.
A first set of softening experiments was done by EnviroChemie on the clarifier effluent from PM2: softening by addition of lime (Ca(OH)2) to pH = 10 and with CaCO3 seeding showed very good results regarding calcium removal. The use of lime milk instead of caustic soda to raise the pH was shown to be efficient to control the evolution of conductivity of the softened water which is an important for a subsequent NF treatment (see details of experiments in Annex 7.7.1). Thus, it was decided to add an intermediate step of softening using Multiflo technology combining precipitation and separation (performed by Veolia) to the initial treatment train which was “3FM � NF � Evapoconcentration on NF concentrate”. MultifloTM softening consists of the abatement of carbonates by joint addition of lime and calcium chloride (see §1.1.2.8 in the State of art and §2.2.7 in Methods). It was applied on PM2 aerobic effluent after 3FM pretreatment. It was carried out at pH = 9 with a joint injection of CaCl2 (10 g/L) and Ca(OH)2 (5 g/L). Calcium chloride was used for calcium contribution to remove alkalinity and lime to reach a basic pH to allow calcium carbonate precipitation. The retention time was of 30 min and the sludge recirculation of 10:1 (10 kg of recirculated dry solid for 1 kg of dry solid produced by the reaction). As expected, main observed impact is on alkalinity and calcium and concentration as shown in Table 18. Very good results were obtained regarding Ca and alkalinity removal with 67% and 60% abatement respectively (detailed analyses are reported in Annex 7.7.2).

New technologies or innovative treatment lines for reliable water treatment for P&P and minimization of waste production
VEO,PTS, ENV, UCM, HOL, WED, January 2012
Page | 71
Table 18: Results of MultifloTM
softening applied to 3FM filtrate from PM2
3FM filtrate
Softened water
pH 8.09 9.0
Ca (mg/L) 120 40
TAC (°dF) 102 36.3
TSS (mg/L) < 10 22
TS at 105°C (mg/L) 1600 220
Turbidity (NTU) 1.1 30
tCOD (mgO2/L) 98 90
sCOD (mgO2/L) 97 90
Na (mg/L) 460 369
A slight increase of TSS (22 mg/L) in the effluent after treatment could be observed. However, the test was carried out without seeding of the reactor with pure CaCO3 and neither coagulant / flocculent addition. Regarding results on the lamellar settler, retention rate was equal to 98.5% taking into account the quantity of created solid by precipitation and the TSS content in the outflow. Results on TSS and on retention rate of lamellar settler can be both improved by seeding of the reactor or adding reagents as coagulant and flocculent. MultifloTM-softening pilot allows indeed the addition of coagulant and flocculent. Better results on TSS removal should then be obtained at pilot scale.
d) Impact of softening on NF filtration
The comparison of the bench-scale filtration experiments with un-, pre-treated (chemically conditioned: pH = 6.5 + anti-scalant) and additionally softened effluent in Figure 43 illustrates the development of permeability during increasing recovery rates. For these tests softened aerobic PM2 effluent had been provided by Veolia.
0
1
2
3
4
5
6
7
8
9
10
0 10 20 30 40 50 60 70 80 90 100
Permeate Recovery RRP [%]
Pe
rme
ab
ilit
y [
L/(m
²hb
ar)
]
NF 90
NF 90+pH6.5+Antisc. 1
NF 90+pH6.5+Antisc. 2
NF 90+Softened+Antisc.
Figure 43: Comparison of permeability rates of with un-, pre-treated and softened PM2 effluent
At first the permeability obtained with all pre-treated effluents and the softened effluent decreased almost equally until a recovery rate (= RRP) of 50 %. Then the permeability of the softened

New technologies or innovative treatment lines for reliable water treatment for P&P and minimization of waste production
VEO,PTS, ENV, UCM, HOL, WED, January 2012
Page | 72
effluent developed a plateau until 70 % recovery and a second one until 85 % RRP. Finally, it continually decreased to the permeability rate of 3 l/m2hbar at 92% recovery. Up to RRP = 65 - 70 % there is a first plateau, followed by the second permeability stage up to RRP = 85 % and the final decline. Tests with pre-treated effluents exhibited lower permeability rates at comparable RRP or lower overall RRP respectively. This development should be further investigated in (semi-) pilot scale experiments. As also shown beforehand lower permeability has to be expected using spiral wound technical membrane elements compared to flat sheets used in the bench-scale unit. A summary table of pre-treatment impacts on filtration and analysis results for PM2 effluent is given below.
Table 19: Impact of pre-treatment on analysis results of PM2 effluent NF permeate
Parameter Unit PM2 effluent
pH 6.5 + Antiscalant PM2 effluent
Softened + Antiscalant
Permeability at 80% recovery l/ (m2hbar) 2.24 4.15
Max. permeate recovery rate RRP % max. 90# 93
Permeate concentration at RRP % 80 93
El. Conductivity mS/cm 300 – 350* 160
Calcium mg/l 2 – 14* < 0.1
Sodium mg/l 30 – 70* 28
Chloride mg/l 50 – 80* (400) 32
Sulfate mg/l < 5* < 5
DOC mg/l 1 – 2* 2
COD mg/l < 15* (24) < 5 # visible scaling detected * Results of test runs on semi-technical scale at 80 % recovery rate
e) Main conclusions on NF treatment and pre-treatments before NF
Most important conclusions on NF treatment and the impact of pre-treatment are summarized below: Direct NF 3FM/NF 3FM/softening/NF
Produced water quality & Type of re-use Re-use in all paper
grade production zones as defined by PM2 (low, medium, high water quality).
In machinery: felt and wire cleaning, ring vacuum pumps, preparation of chemicals (for re-use in felt and wire cleaning only NF 90 permeate applicable due to conductivity criterion)
The produced water respects all water quality requirements for water re-use fixed by PM2 for water re-use (low, medium, high water quality)
Re-use in all paper grade production zones as defined by PM2 (low, medium, high water quality).
In machinery: felt and wire cleaning, ring vacuum pumps, preparation of chemicals (for re-use in felt and wire cleaning only NF 90 permeate applicable due to conductivity criterion)

New technologies or innovative treatment lines for reliable water treatment for P&P and minimization of waste production
VEO,PTS, ENV, UCM, HOL, WED, January 2012
Page | 73
Direct NF 3FM/NF 3FM/softening/NF
Main parameters of the produced water
- COD (mgO2/L) < 15 - BOD5 (mgO2/L) < 3
- Cl- (mg/L) 82 -149
- Ca2+
(mg/L) 0.1 - 2
- Mg2+
(mg/L) 8.5 - 12.5
- SO42-
(mg/L) 5 - 6 - Conductivity (mS/cm)
0.35 - 0.86
- COD (mgO2/L) < 44 - BOD5 (mgO2/L) 2
- Cl- (mg/L) < 180
- Ca2+
(mg/L) < 1
- Mg2+
(mg/L) < 1
- SO42-
(mg/L) < 20 - Conductivity (mS/cm)
< 0.5
- COD (mgO2/L) < 5 - BOD5 (mgO2/L) < 3
- Cl- (mg/L) 32
- Ca2+
(mg/L) 0.1 - 0.2
- Mg2+
(mg/L) n.d. - SO
4+ (mg/L) < 5
- Conductivity (mS/cm) 0.16
Process conditions - 80% recovery rate - Feed acidification (pH
= 6.5) - Anti-scalant dosing
applied (3-6 ppm) - Feed temperature 30°C.
- 80% recovery rate - Feed acidification to
pH = 6 with HCl - No anti-scalant
- > 90% recovery rate - Feed softening - Anti-scalant dosing
(3 – 6 ppm) - T = 30°C
Withdrawal and/or critical points to pay attention to
- Levels of hardness in raw effluent might inhibit long term membrane operations, therefore further optimization of dosing or pretreatment necessary.
- Element recovery / element flux has to be optimized.
- Levels of chloride due to acidification have negative impact on further process steps, such as AOP (sulphuric acid not applicable for acidification because of sulphate scaling risks).
Same as for direct NF - Assessment of additional treatment step (+ chemical consumption) vs. chemical conditioning necessary.
- Minimization of effluent suspended solids from softening unit before NF!
In view of these results NF treatment will be applied at pilot scale with 3FM/softening pre-treatment.
3.2.1.4 AOP after anaerobic/aerobic/3FM
The water after anaerobic/aerobic/3FM is virtually free of BOD5, solids and has a reduced concentration of calcium due to precipitation in the anaerobic and aerobic treatment. Only if the recalcitrant COD and colour has to be reduced further to reach a very high water quality for reuse, AOP could be considered after anaerobic/aerobic/3FM. But, however, AOP technologies in this treatment train wouldn’t reduce the concentrations of ions or the conductivity. In an industrial scale plant the quality of treated water could be expected to be comparable to the results described in §3.2.1.2 “Comparison of AOP and NF treatment applied to MBR effluent” of this report.

New technologies or innovative treatment lines for reliable water treatment for P&P and minimization of waste production
VEO,PTS, ENV, UCM, HOL, WED, January 2012
Page | 74
With 3FM effluent from paper mill 2 two continuous and one batch ozone trials were performed. The results are shown in the following table for the original sample and the trials at two SOD “specific ozone dosages” (g O3/g COD0). Using 0.7 g O3/g COD0 a COD-elimination of 26 % was achieved. The BOD5 was increased only up to 7 mg/l, which goes with the low COD level. A subsequent biological treatment would only lead to poor effects concerning COD concentration. Colouring was reduced significantly, even with 0.4 g O3/g COD0, and the ozonised effluent has no visible colour, which is an important fact, if the water shall be reused in the paper making process again.
Table 20: Results of ozone trials PTS with 3FM effluent from PM2
Trial SOD (g O3/g COD) COD COD-
Elimination BOD Colour [436 nm] α [1/m]
Original sample 3FM effluent 95 mg/l - 4 mg/l 5.9
Ozone 1 0.4 76 mg/l 20 % 7 mg/l 0.8
Ozone 2 0.7 70 mg/l 26 % 7 mg/l 0.5
Further ozone oxidation trials were conducted at WEDECO’s application laboratory. The results, which are over all in line with PTS results, are shown in the following tables:
Table 21: Results ozone trials WED with 3FM effluent from PM2
Trial
Ozone
consumption (g/m³)
Specific
ozone factor (gO3/g∆COD)
COD
(filtrated)
Specific ozone
dosage (SOD) (gO3/gCOD0)
COD-
elimination Colour
Original sample (0)
-- -- 83 mg/l 3FM effluent 3FM effluent slight yellow
Sample 1 16 2.2 76 mg/l 0.19 8% colourless
Sample 2 30 3.3 74 mg/l 0.36 11% colourless
Sample 5 187 6.6 55 mg/l 2.25 34% colourless
Table 22: Results ozone/H2O2 trials WED with 3FM effluent from PM2
Trial
Ozone
consumption (g/m³)
Specific
ozone factor (gO3/g∆COD)
COD
(filtrated)
Specific ozone dosage
(SOD) (gO3/gCOD0)
COD-
elimination
H2O2
consumption Colour
Original (0) -- -- 66 mg/l 3FM effluent 3FM effluent -- slight yellow
Sample 1 53 5.1 55 mg/l 0.8 17% 22 mg/l colourless
Sample 2 89 4.2 44 mg/l 1.35 33% 46 mg/l colourless
Sample 5 539 8.7 4 mg/l 8.2 94% 224 mg/l colourless
Ozone treated
Ozone/H2O2 treated
Figure 44: Treated 3FM effluent aliquots

New technologies or innovative treatment lines for reliable water treatment for P&P and minimization of waste production
VEO,PTS, ENV, UCM, HOL, WED, January 2012
Page | 75
0
1 0
2 0
3 0
4 0
5 0
6 0
7 0
8 0
9 0
0 10 0 20 0 300 400 5 00 600
Ozone fee d [g/m ³]
CO
D [m
g/L
]
O 3AO P [H2O 2 +O 3]
0
1 0
2 0
3 0
4 0
5 0
6 0
7 0
8 0
9 0
0 10 0 20 0 300 400 5 00 600
Ozone fee d [g/m ³]
CO
D [m
g/L
]
O 3AO P [H2O 2 +O 3]
Figure 45: COD reduction (batch trials, WED) in 3FM filtrate from PM2 by ozone/AOP
The main achieved results are: - It is feasible to reduce the remaining, persistent COD by means of ozone oxidation. The
required ozone dosages increase during the treatment (demonstrated by the increasing specific ozone factors). The effects of relatively high COD reduction rates (higher than ~ 10%) have to be questioned concerning the gained benefit/effect relation.
- The residual colour was reduced. Already with an ozone dosage of 16 g O3/m³ (SOD = 0.19 gO3/g COD0) the treated effluent showed no visible colour.
In case higher COD reduction rates (> 10%) would be actually required for special re-use purposes, advanced oxidation technology (ozone based (O3/H2O2)) might be considered. Only for an increased oxidation goal the additional technical requirements and cost might be reasonable.
3.2.1.5 Treatment of NF concentrates: Comparison of evapoconcentration, AOP, direct re-injection into anaerobic and electrodialysis
Four different approaches were evaluated: - Evapoconcentration (thermal approach) to produce water with high quality, further promote
the re-use of water and reduce the final volume of waste to be disposed off; - AOPs processes to reduce recalcitrant COD, TOC and remove as well colour; - Direct re-injection of NF concentrates upstream anaerobic process; - Electrodialysis as a salt draining technology for reducing salts accumulation in view of re-
injecting of the desalinated concentrates upstream biological processes.
a) Evapoconcentration
Evapoconcentration test were done on a lab-scale evaporator tests on NF concentrates from PM1 and PM2 coming from the different tested treatment trains (Table 23). Objectives of these tests were to determine the distillate quality which can be reached after concentration and then the possibility to reuse it in the P&P process by comparison with paper mill water quality requirements. This experiment also allows giving recommendations on the material in the event of pilot tests and industrialization by taking into account the concentrate characteristics.

New technologies or innovative treatment lines for reliable water treatment for P&P and minimization of waste production
VEO,PTS, ENV, UCM, HOL, WED, January 2012
Page | 76
Table 23: Analysis of NF concentrates from PM1 and PM2
PM1 PM2
NF Concentrates Ana./MBR/NF Ana./Aer./NF Ana./Aer./3FM/NF Ana./Aer./3FM/ Softening/NF
NF treatment: Recovery rate (%) ���� Equivalent VCF
88% 8.3
80%
5
90% 10
93% 14
pH 7.2 6.9 6.05 8.5
T (°C) 25 29 20 25
Conductivity (mS/cm) 20.56 13.3 19.2 12.3
TSS (mg/L) 22 < 10
DM at 105°C (mg/L) 14 000 8 500
Alkalinity (mg CaCO3/L) 381 220 41
tCOD (mgO2/L) 1309 522 799 696
SO4 (mg/L) 841 367 558 329
Cl- (mg/L) 6 660 4 660 5 880 2 490
N-NH4 (mg/L) 68 0.3 0.7 1
Ca (mg/L) 930 912 1 092 97.5
(Detailed analyses can be found in Annex 8.8) Based on these analyses, scaling risks were first evaluated (Table 24). The target VCF was then determined on basis on scaling risks and as well taking into consideration that the concentration of chlorides in the final waste in order not to exceed 45 g/L of chlorides which is the limit for using evaporators in conventional materials such as Uranus B6 and Superduplex:
Table 24: Major risks during evapoconcentration and target VCF
PM1 PM2
NF conc. Ana./MBR/NF Ana./Aer./NF Ana./Aer./3FM/NF Ana./Aer./3FM/ Softening/NF
Characteristics of NF conc.
- High [Cl-] = 6.7 g/L - High conductivity - Presence of
sulphates, calcium, magnesium
- Presence of Ca - Lower sulphates
concentration compared to PM1
- Presence of Ca - Lower sulphates
concentration compared to PM1
- pH = 6, slightly acidic
- [Cl-] = 6 g/L
- Very low calcium concentration
- Lower chloride concentration since no HCl was used during the NF step
- Basic pH = 8.8
Major risks during concentration
Scaling risks (major): - Calcium sulphate - Calcium carbonate - Magnesium
carbonate
Scaling risks: - Calcium sulphate,
but minor
Scaling risks: - Calcium sulphate,
but minor Corrosion risks due to slightly acidic pH of NF concentrates and [Cl-] = 6 g/L
Almost no scaling risks No corrosion risks due to basic pH of NF concentrates
���� Target VCF 3 10* 5** 18*
* Based on acceptable chloride concentration in the final waste (< 45 g/L)
** Final VCF was set to 5 to have a global VCF = 50 (NF + evapoconcentration) similar to the one of the treatment train “Anaerobic/Aerobic/NF”. (Note: Global VCF = VCFevapoconcentration x VCFNF)

New technologies or innovative treatment lines for reliable water treatment for P&P and minimization of waste production
VEO,PTS, ENV, UCM, HOL, WED, January 2012
Page | 77
For each NF concentrate, a colourless distillate of very good quality was produced (process conditions: T = 67 ± 2°C, P = 170 mbar) and which respected quality requirements fixed by PM1 and PM2 (all three water qualities) for re-use purposes. Moreover, there are no microbiological risks to re-use the produced water in paper production processes e.g. like in showers. Important note: As not enough NF concentrates from the treatment train “Anaerobic/Aerobic/ 3FM/Softening/NF” were available to run evapoconcentration tests, only theoretical calculations were done and will be described in this report.
Table 25: Analysis of produced distillates for PM1 and PM2
PM1 PM2
Distillates Ana./MBR/NF Ana./Aer./NF Ana./Aer./3FM/NF
Reached VCF 3 10 5
pH 9.9 5.98 6.7
Cond. (mS/cm) 0.25 0.006 0.004
TSS (mg/L) n.d. 0 0
tCOD (mgO2/L) 51.5 11.8 39
SO4 (mg/L) n.d. < 0.2 n.d.
Cl- (mg/L) n.d. 1.6 10.4
N-NH4 (mg/L) 74.3 < 2 1.6
P-PO4 (mg/L) < 0.2
Ca (mg/L) 9.97 0.0003 n.d.
tFe (µg/L) - < 0.5 n.d.
Mg (mg/L) - 0.015 n.d.
Na (mg/L) 0.260 6.0 Respect of water quality criteria for re-use?
Yes Yes Yes
(n.d : not detected) Final VCF were confirmed by calculation taking into account the concentrations of parameters in the feed and in the concentrate (see detailed analysis of concentrates in Annex 8.8). Scaling risks were assessed in the same way together with visual observations (Table 26). As corrosion risks cannot be directly observed on a lab scale experiment (experiments done in glassware), chloride concentration and pH were chosen as representative parameters of corrosion in this report, knowing that corrosion risks increase with chlorides concentration and the acidity. Global VCF of combined NF and evapoconcentration were then calculated (Table 26).

New technologies or innovative treatment lines for reliable water treatment for P&P and minimization of waste production
VEO,PTS, ENV, UCM, HOL, WED, January 2012
Page | 78
Table 26: Experimental VCF and assessed risks at lab scale
PM1 PM2
At lab scale Ana./MBR/NF Ana./Aer./NF Ana./Aer./3FM/NF
VCF evapoconcentration 3 10 5
[Cl-] in final waste 11.2 g/L 34 g/L 28.8 g/L
Assessed scaling and corrosion risks at lab scale
- High risk of calcium sulphate scaling
- Corrosion risks remain acceptable for an evaporator of specific stainless steel (final waste: pH = 8.3, [Cl-] = 11.2 g/L)
- No scaling - Corrosion not
acceptable for an evaporator in 316nTi stainless steel ([Cl-] = 34 g/L in final waste), but acceptable for Superduplex or UB6 material
None
VCF of NF treatment 8.3 5 10
���� Experimental global VCFNF+evapo 25 50 50
The main difference between the treatment trains lays on the global VCF which can be reached and thus the final volume of waste to be disposed off. Feed characteristics and more specifically the chloride concentration limit the volume concentration factor which can be reached at industrial scale by evapoconcentration. To work with evaporators made of conventional materials like Uranus B6, surperduplex (or hastelloy), a maximum of 45 g/L of chlorides in the concentrate is indeed acceptable. On basis of the final concentration of chlorides in the produced final wastes (see Table 26), higher VCFs could be indeed reached by evapoconcentration at industrial scale and thus a higher global VCF as shown in Table 27 below.
Table 27: Expected performances at industrial scale
PM1 PM2
At industrial scale
Ana./MBR/NF Ana./Aer./NF Ana./Aer./3FM/NF Ana./Aer./3FM/ Softening/NF
Max. VCFevapo 6-7 12 8 18
VCFNF treatment 8.3 5 10 14
���� Global VCFNF+evapo
47-58 60 80 252
The addition of evapoconcentration would thus lead to following final waste (concentrate) to be disposed off:
���� Final waste to be disposed off
2-2.5% in volume of waste water treated by the global treatment line
1.7% in volume of waste water treated by the global treatment line
1.2% in volume of waste water treated by the global treatment line
0.4% in volume of waste water treated by the global treatment line

New technologies or innovative treatment lines for reliable water treatment for P&P and minimization of waste production
VEO,PTS, ENV, UCM, HOL, WED, January 2012
Page | 79
In conclusion: - Evapoconcentration could be used as a final treatment of NF concentrates to produce
water fit-for-use corresponding to the water quality criteria of both PM1 and PM2 and to reduce the final volume of concentrates.
- Softening has a positive impact on the reduction of final waste to be disposed off. As the calcium concentration is lower in the softened water, the NF recovery is higher and no hydrochloric is used to prevent scaling on the membrane: chloride and calcium concentrations are then lower in the produced NF concentrates compared to the ones produced without softening. Thus a higher VCF can be reached by evapoconcentration leading to a much higher global VCF (NF + evapo) up to 252 provided conversion rate on NF process and pre-treatment processes are the same at pilot scale. Final volume of wastes to be disposed of would then be of only 0.4% in volume of the waste water treated by the global treatment line.
However, with higher VCF for evapoconcentration, scaling risks which were minor at a lower VCF may then appear. At pilot/industrial scale following could then happen:
- For PM1: With a VCF = 6-7 for evapoconcentration, several scaling risks could appear: calcium carbonate, calcium sulphate and, to a lesser extent, calcium phosphate: • Calcium carbonate and calcium phosphate formation can be avoided by acidification of
the feed to 5.9 with nitric acid. In this case, the necessary quantities of HNO3 (60%) for acidification would be approximately of 0.35 kg/feed m3.
• Calcium sulphate scaling cannot be avoided by acidification. The use of specific antiscalant (like phosphonate, for example), resisting to evaporation temperature, is strongly advised.
- For PM2 “Ana./Aer./3FM/NF” treatment train: the limit of calcium sulphate solubility would be exceeded in the concentrate (waste) and some scaling could appear during evapoconcentration. An antiscalant has thus to be used to prevent these risks.
- For PM2 “Ana./Aer./3FM/NF” treatment train: some scaling by calcium sulphate could be observed and the use of an anti-scaling reagent is recommended.
b) AOP for treatment of NF-concentrates
High water hardness led to severe scaling on the NF membrane. The most economical method chosen for the NF trials in this work package was acidification with HCl. In the end, the NF trials were possible, but acidification increased the treatment problem of the concentrates dramatically. Ozone trials were performed with specific ozone dosages of 0.3-0.5 gO3/g COD with NF concentrates of PM1 and PM2. The direct COD elimination by ozone oxidation amounted up to 25%. The possibility of recirculation to the biological treatment was studied in aerobic bench scale tests. Results showed very poor biological degradability (max. 15-25 % of COD) after the AOP procedures ozone oxidation and Fenton that were studied. Purely oxidative COD reduction with ozone or Fenton would have been possible, although the economy of the method is brought about precisely by combining first oxidative cracking following by biological degradation. And it was the latter factor that was hardly possible, probably due to the high conductivity (13 - 28 mS/cm) and chloride concentrations (3,500 – 8,500 mg/l). The trial results indicate that, if concentrated should be recirculated through the biological WWTP, a process for water softening should be used preferably prior to membrane filtration. Acidification of the NF feed is a possible measure to stabilise the flux but high chloride concentrations will cause problems in subsequent process steps.
New technologies or innovative treatment lines for reliable water treatment for P&P and minimization of waste production
VEO,PTS, ENV, UCM, HOL, WED, January 2012
Page | 80
It should be taken into consideration that high Cl- concentrations (> ca. 600-1000 mg/l) will cause corrosion damage to the materials commonly used in the paper industry. It must be taken into account that very high concentrations can occur in the concentrate, even if there is no acidification prior to NF or RO treatment. The chloride concentration in the concentrate already amounts to max. 1500 mg/l with a feed concentration of only 150 mg/l and a permeate yield of 90% of RO. This means that special requirements must be placed on the material. This problem could be avoided by substituting chloride containing production additives during papermaking. Instead of using aluminium chloride products, for example, chemicals could be used that contain nitrate or sulphate instead of chloride. These chemicals, however, are somewhat more expensive at present. Generally speaking, the combined method for concentrate treatment consisting of AOP + recirculation through the biological stage seems feasible and economical, if the chloride concentration doesn’t exceed a value depending on the volume streams of the WWTP and the persistency of the materials. Results from other projects, in which the water parameters in the concentrate were not so extreme, were able to verify this (Simstich, 2010).
c) Direct re-injection of concentrates upstream the anaerobic process
In order to assess the recycling effects of NF concentrates to the anaerobic process in terms of degradation performance, long-term effects and sludge integrity/disintegration of granular sludge, anaerobic tests on mixtures of paper mill effluents and NF concentrates were done as described in §2.2.8.1. Long-term anaerobic biodegradation tests at varying load conditions were performed in order to get hands-on experience of inhibition effects by recycling of nanofiltration concentrates to an anaerobic system. Experiments were done in continuous mode on laboratory scale using real wastewater samples (not single substrates) delivered by the partners. In order to assess overall inhibition effects phasing of experiments was considered using “pure” fresh wastewater (optimum conditions) and “NF concentrate supplemented” wastewater (inhibition conditions) alternatively. Figure 46 shows eliminated COD load as a function of COD load for one set of experiments in the lab-scale anaerobic reactor. Anaerobic tests of PM1 wastewater and NF concentrate were conducted in three phases. In each phase a distinct influent composition was used. These phases are:
1. PM1 fresh wastewater (named PM1), 2. PM2 fresh wastewater mixed with PM1 nanofiltration (NF) concentrate,
(mixed in ratio 4:1 v/v, named PM2 + NF PM1), 3. PM2 fresh wastewater (named PM2).
All experimental data collected within each phase, can be approximated with linear equations with a good fit coefficient. In case of raw wastewater originating from PM1 paper mill, COD load elimination efficiencies reached levels between ηCOD = 70 % - 90 %. However, most of results ranged from ηCOD = 87 % - 91 % (symbols PM1, light green). Average value of COD in the effluent was 750 mg/L and 500 mg/L when COD load did not exceed 20000 mg/d or BR,COD = 4.4 kg/(m³·d) respectively. However, when COD load was higher than 45000 mg/d (BR,COD = 10 kg/(m³·d)), COD in the effluent slightly exceeded CCOD,out = 1000 mg/l. Effluent pH value slightly oscillated around pH 7.4.

New technologies or innovative treatment lines for reliable water treatment for P&P and minimization of waste production
VEO,PTS, ENV, UCM, HOL, WED, January 2012
Page | 81
y = 0.91x
R2 = 1.00
y = 0.81x
R2 = 0.98
0
10000
20000
30000
40000
50000
60000
70000
0 10000 20000 30000 40000 50000 60000 70000 80000
COD Load [mg/d]
Eli
min
ate
d C
OD
Lo
ad
[m
g/d
]
PM1
PM2
PM2 + NF PM1
Figure 46: COD load elimination as a function of COD load (PM1)
During the second phase, when a mixture of PM2 wastewater and PM1 NF concentrate was used, COD load elimination efficiencies were lower app. 10% than elimination efficiencies of PM1 fresh wastewater (symbols PM2 + NF PM1, 4/1-mixture of raw wastewater with NF concentrate) compare Figure 46 above). Addition of NF concentrate clearly led to lower COD load elimination efficiency as indicated by the linear fit (brown line). According to Figure 46 there is lower eliminated COD load, which is confirmed by the slope coefficient of experimental data approximation. Average influent COD of mixture was CCOD,in = 4116 mg/l. Assuming that there was no degradation of NF concentrate COD, average value of fresh PM2 wastewater COD used for mixture preparation was 4893 mg/l. For preparation of this wastewater mixture the following amounts of wastewater were used:
• 80% of final volume came from PM2 fresh wastewater (3915 mg/l of final COD coming from PM2 fresh wastewater).
• 20% of final volume was taken from PM1 NF concentrate (202 mg/l of final COD coming from PM1 NF concentrate).
Assuming that PM2 fresh wastewater part was degraded with the same average yield as fresh PM2 wastewater before NF concentrate tests (app. 91%), the part of PM2 fresh wastewater COD in the effluent would have been 352 mg/L. This value - together with 202 mg/l of NF concentrate COD - would equal 554 mg/l of effluent COD. However, measurements in effluent result in 757 mg/l of effluent COD. This means that not only NF concentrate COD had not been degraded, but presumably also degradation of incoming PM2 wastewater COD had been negatively affected because of some inhibition mechanism induced by NF concentrate. A similar set of experiments was performed for the re-injection of PM2 concentrates to the anaerobic lab-scale reactor. Degradation results obtained with fresh wastewater (PM2) were assessed before and after PM2 NF concentrates had been re-directed (PM2+ PM2 NF). Results are presented in Figure 47. As detected in previous tests on PM1 wastewater, results also indicate immediate negative effects of direct concentrate recycling.

New technologies or innovative treatment lines for reliable water treatment for P&P and minimization of waste production
VEO,PTS, ENV, UCM, HOL, WED, January 2012
Page | 82
y = 0.88x
R2 = 0.99
y = 0.79x
R2 = 0.95
y = 0.90x
R2 = 0.97
0
10000
20000
30000
40000
50000
0 10000 20000 30000 40000 50000 60000
COD Load [mg/d]
Eli
min
ate
d C
OD
Lo
ad
[m
g/d
]PM2 (before PM2+PM2 NF)
PM2+PM2 NF
PM2 (after PM2+PM2 NF)
Figure 47: COD load elimination as a function of COD load (PM2)
In case of tests with fresh wastewater from PM2 (before tests with NF concentrate), COD load elimination efficiencies reached the range of ηCOD = 70%-92%, however most of results were higher than ηCOD= 85% (linear fit y = 0.88x). COD concentrations in the effluent ranged around CCOD,out = 300 mg/l – 800 mg/l whereas most values did not exceed 500 mg/l even when COD load was higher than 45000 mg/d or BR,COD = 10 kg/(m³·d) respectively. pH in the effluent was basically stable and it varied from 6.8 to 7.2. After mixing fresh wastewater with NF concentrate, considerable COD load elimination efficiency decrease was observed. These value varied from ηCOD = 65% to 86% with the average of 77% (linear fit y = 0.79x). COD concentrations analyzed in effluent were in the range CCOD,out = 350 mg/l – 665 mg/l. However, when COD load was higher than 30000 mg/d, COD concentrations in effluent exceeded CCOD,out = 500 mg/l and when this load was lower than 25000 mg/d, COD concentrations in effluent were not higher than CCOD,out = 400 mg/l. Moreover, recovery of reactor performance after switching the feed back into PM2 pure wastewater (Figure 47, PM2 after PM2+PM2 NF), indicate that this inhibition might be reversible. Slope coefficient of this set of tests reached values close to this before NF mixture experiments. As test phase for PM2 NF concentrate addition was limited due to the amount of available NF concentrate, further assessment of long-term effects should be made on pilot-scale. Sludge analysis by Vermicon spanning the whole test period (PM1 and PM2 tests) indicates that during the operation of the anaerobic bench scale reactors, the number of living micro-organisms remained stable around 1.2*109 counts without considerable changes. However an increasing number of dead cells was detected (see Figure 48). The ratio of living cells / total cells was therefore negatively affected during the tests with NF concentrate. Maybe inorganic incrustation could result in lower future contribution of active, alive micro-organisms to organic matter degradation, as inorganic content of pellet sludge was increased during the tests, too (see internal results I3.1.1.3 “Assessment of technologies for the treatment of membrane retentate streams for Pump & Paper”, Hermosilla,D., Engelhart, M., Mauchauffée, S., Simstich, B. et al., 2011). As tests for concentrate addition for NF PM1 have been performed over a period of 4 months altogether, any further adaptation effects on concentrate addition are not likely to take place within this period of time.

New technologies or innovative treatment lines for reliable water treatment for P&P and minimization of waste production
VEO,PTS, ENV, UCM, HOL, WED, January 2012
Page | 83
74 78 81 82
26% 22% 19% 18%
0
10
20
30
40
50
60
70
80
90
100
27.05.2010
24.06.2010
21.07.2010
16.08.2010
Date of analysis
Sh
are
[%
]
Living cells
Dead cells
Figure 48: Relation of living and dead cells in anaerobic sludge.
As a consequence of long-term observations in anaerobic degradation tests the direct re-injection of NF concentrates to the anaerobic reactor in full-scale systems cannot be recommended.
d) Electrodialysis followed by re-injection of concentrates upstream the anaerobic process
Electrodialysis was finally tested as a salt draining technology for reducing salts accumulation and then re-injection of the desalinated concentrates upstream biological processes. Results of tests showed that electrodialysis isn’t adapted to separate the salts form organic matter in the NF concentrates due to the presence of charged organic matter. Salts concentration and thus conductivity were too high in the produced desalted water (see Annex 8.9). Furthermore, it was shown that the biodegradability of the desalinated water containing organics wasn’t sufficient to have no impact when reinjecting it upstream the anaerobic treatment. (Details on experiments can be found in report I3.1.1.4 “Assessment of technologies for the elimination of inorganic compounds for P&P”, Mauchauffée, S., Denieul, M.-P, 2010).
e) Conclusion on treatment of NF concentrates
It should be taken into consideration that high Cl- concentrations (> ca. 600-1000 mg/l) in the NF concentrates to be treated will cause corrosion damage to the materials commonly used in the paper industry. It must be taken into account that very high concentrations can occur in the concentrate, even if there is no acidification prior to NF or RO treatment. The chloride concentration in the concentrate already amounts to max. 1500 mg/l with a feed concentration of only 150 mg/l and a permeate yield of 90% of RO. This means that special requirements must be placed on the material. This problem could be avoided by substituting chloride containing production additives during papermaking. Instead of using aluminium chloride products, for example, chemicals could be used that contain nitrate or sulphate instead of chloride. These chemicals, however, are somewhat more expensive at present. Keeping in mind these considerations, main conclusions of the different tested approaches are the following:

New technologies or innovative treatment lines for reliable water treatment for P&P and minimization of waste production
VEO,PTS, ENV, UCM, HOL, WED, January 2012
Page | 84
Evapoconcentration AOP Direct re-injection of
concentrates into anaerobic process
Produced water quality & Type of re-use for re-use as fresh
water High quality of distillate respecting all water qualities from PM1 and PM2 No microbiological risk for re-use in showers
for recirculation in the aerobic activated sludge treatment. (critical point: chloride concentration).
for re-use in the paper mill.
for re-injection
Reduced effluent quality as compared to anaerobic treatment without re-injection. Anaerobic effluent not suited for re-use.
Main parameters of the produced water
- pH = - Conductivity < - Ca: none - Alkalinity = °dF
- COD is reduced by about 25 %.
- BOD5 is increased - Colour completely
removed. - Water disinfected.
Ozone has no effect on minerals (Ca/Mg) and salt content (chloride, sulphate, etc…)
- 6.8 ≤ pH ≤ 7.2 - CODmax = 1000 mg/l - Cl-max = 1060 mg/l
(as calculated for PM2)
Withdrawal and/or critical points to pay attention to
- Chloride concentration limits the VCF which can be applied � To get higher VCF (final [Cl-] > 45 g/L), use of more corrosion resistant materials for the evaporator is needed
- Scaling risks due to carbonates, sulphates species � Acidification before evaporation or use of specific anti-scalants
Critical points are chloride and calcium concentrations
- No further degradation of concentrate COD to be expected.
- Deterioration of degradation efficiency of anaerobic process likely to occur according to COD balance considerations.
- Reduction of share of living cells in granular sludge indicated, presumably because of formation of inorganic deposits (Ca, Mg).
- Chlorides will pass the anaerobic reactor.
3.2.1.6 Conclusion on best treatment trains
Most important findings are:
• Stable MBR operation is not possible at calcium concentrations > 400 mg/l. Softening upstream of the MBR is than absolutely necessary. Trials with a lime softening stage showed a removal of 50 – 80 % of the Ca2+.
New technologies or innovative treatment lines for reliable water treatment for P&P and minimization of waste production
VEO,PTS, ENV, UCM, HOL, WED, January 2012
Page | 85
• Ozone trials with pre-filtered final effluent of both mills led to a COD reduction by about 20- 25%. Economical reliable specific ozone dosages of 0.25 to 0.7 g O3/g COD0 have been used. The increased BOD5 shows that a subsequent biological treatment can be promising for further COD reduction. The water can be reused in the production process, especially because the water after ozone treatment is visibly colour-free. Possible reuses processes are showers at the paper machine were it can be used instead of fresh water. Calcium concentrations may be a limiting factor for reuse.
• NF membranes with high retention capacity for monovalent ions are able to fulfil quality requirements for white grade paper reclamation water (for PM1 and PM2). Conductivity requirements and low corrosion potential (reduction of chloride) are achieved with high rejection NF membranes only. Dow Filmtec NF 90 and Koch TFC ULP showed to be suited for these goals.
• Intensive pre-treatment or conditioning is needed to obtain steady NF membrane performance and high recovery rates. High scaling tendency (membrane blocking) of aerobic effluents of both PMs was observed without conditioning or pre-treatment of waste water. Reduction of pH to around pH 6.5 (HCl) and dosing of antiscalant was necessary to achieve recovery rates of 80%. Softening of wastewater allowed higher recovery up to 93% and lower chemical consumption for conditioning (no use of hydrochloric acid). In this view, the MultifloTM softening technology (lime softening) is well adapted to remove calcium carbonate. According to theoretical calculations flux rates should not exceed 20 L/(m²·h) and long term stability of membrane treatment (plateau formation, high system recovery) needs to be evaluated on pilot scale continuously.
• 3FM technology showed good performances at lab scale regarding TSS removal and turbidity reduction. These have to be confirmed at pilot scale.
Most important findings concerning the treatment of concentrates of PM1 and PM2 are: • Evapoconcentration proved to be an adapted technology to treat NF concentrates in terms
of production of a colourless water with a quality fulfilling the water quality criteria of both paper mills for re-use and to reduce the final volume of concentrates:
o Reduction of wastes as a global volumic concentration factor VCF up to 50 for combined “NF+evapoconcentration” could be obtained at lab scale for PM2 and 25 for PM1). However, due to feed characteristics and more specifically the chloride concentration in the final concentrates (45 g/L max. for conventional materials), these global VCFs should be increased at industrial scale to 60 without NF membrane pre-treatment and up to 252 with 3FM/softening as pre-treatment. Then the addition of evapoconcentration would lead to a final concentrate to be disposed off representing respectively 1.7% to 0.4% in the last case in volume of the waste water treated by the global treatment line.
o Pre-treatments (3FM and softening) before NF process have a positive impact on the global VCF which could be reached at industrial scale leading to a very substantial reduction of the volume of final waste to be disposed off down to 0.4%.
• AOP treatment: High conductivity and chloride concentrations > 4,000 mg/l prevented biological degradation after AOP treatment. To reduce chloride intake to the wastewater, softening before membrane processes is preferable to acidification with HCl.
• Re-injection of NF concentrates has a negative impact on anaerobic degradation rate in pellet sludge reactors. For all combinations of wastewater and concentrates a distinct deterioration in COD removal was observed. COD balancing revealed, that this could not be explained by

New technologies or innovative treatment lines for reliable water treatment for P&P and minimization of waste production
VEO,PTS, ENV, UCM, HOL, WED, January 2012
Page | 86
persistency of recalcitrant COD in concentrates alone, but also by negative impact on degradation of incoming wastewater COD. In long-term runs formation of inorganic deposits in sludge took place as well as reduction in share of living cells as confirmed by FISH technology.
• Electrodialysis can’t be used as a salt draining technology for reducing salts accumulation in view of reinjecting the desalinated NF concentrates upstream biological processes. Due to the presence of organic charged matter, salts can’t be properly separated.
Based on these results, following treatment trains have been selected to be tested on site at pilot scale within WP5.1.4 in PM2:
Impact of reinjection???
Water to bere-used ?
Final waste
Water to bere-used ?
Water to bere-used ?
NF
PM2 AnaerobicMultiflo
softening
AOP (O3)
AOP (O3)
Evapo
MBR
Water to bere-used ?
Can berecycled into
Anaerobic ???
Final waste
Water to bere-used ?
NF
PM2 Anaerobic Aerobic
AOP (O3)
AOP (O3)
Evapo
3FM
Multiflosoftening
Water to bere-used ?
Impact of reinjection???
Water to bere-used ?
Final waste
Water to bere-used ?
Water to bere-used ?
NFNFNF
PM2PM2 AnaerobicAnaerobicMultiflo
softeningMultiflo
softening
AOP (O3)AOP (O3)
AOP (O3)AOP (O3)
EvapoEvapo
MBRMBR
Water to bere-used ?
Can berecycled into
Anaerobic ???
Final waste
Water to bere-used ?
NFNF
PM2PM2 AnaerobicAnaerobic AerobicAerobic
AOP (O3)
AOP (O3)AOP (O3)
EvapoEvapo
3FM3FM
MultiflosofteningMultiflo
softening
Water to bere-used ?
3.2.2 Newsprint paper mill (PM3)
Two main approaches were tested in the case of PM3: - Direct oxidation of the waste water to re-use it as fresh water surrogate in paper
production processes; - Biological processes (Anaerobic/Aerobic or Anaerobic/MBR) combined with further
membrane processes (UF/RO or RO) to re-use it as fresh water surrogate in paper production processes. Treatment of membrane concentrates was then investigated for fulfilling the legislation for dumping.

New technologies or innovative treatment lines for reliable water treatment for P&P and minimization of waste production
VEO,PTS, ENV, UCM, HOL, WED, January 2012
Page | 87
3.2.2.1 AOP applied to PM3 wastewater
a) UV-photocatalysis
COD removals obtained with UV-photocatalysis treatment using TiO2 as catalyst, are showed in Figure 49. After 5 hours of treatment, the COD removal obtained was 19% for the best conditions tested. These results are closed to those obtained by Pérez (2001). This low COD reduction could be explained according with the existing literature by the presence of high concentrations of hydroxyl radical scavengers, like chloride and bicarbonate ions, or for the high presence of aliphatic carboxylic acids, which are difficult to oxidize by AOPs (Balcioglu, 1999; Gogate, 2004a; 2004b). Experiments for further assessing of effect of inorganic ions in wastewaters were developed. The results obtained show that no scavenging effect is due to the different inorganic tested (Cl-, NO3
-, SO4
2-, CO32-; 250-2000 ppm) (Figure 51). Therefore, the low efficiency of this process in PM3
effluent may be attributed to the characteristics of the organic compounds present.
[TiO
2]=0 ,5
g/L
[TiO
2]=1g/L
[TiO
2]=5g/L
[TiO
2]=10g
/L
% C
OD
rem
oval
0
10
20
30
40
50
pH=7
pH=12
[TiO
2]=0 ,5
g/L
[TiO
2]=1g/L
[TiO
2]=5g/L
[TiO
2]=10g
/L
% C
OD
rem
oval
0
10
20
30
40
50
pH=7
pH=12
CO
D r
emo
val,
%
Inorganic anions, ppm
0 250 500 1000 20000
10
20
30
40
a a a a a
b
b b bTukey's test
p<0.05
No anionsCl- (a)
CO32-
(a)
SO42-
(a)
NO3- (b)
CO
D r
emo
val,
%
Inorganic anions, ppm
0 250 500 1000 20000
10
20
30
40
a a a a a
b
b b bTukey's test
p<0.05
No anionsCl- (a)
CO32-
(a)
SO42-
(a)
NO3- (b)
Inorganic anions, ppm
0 250 500 1000 20000
10
20
30
40
a a a a a
b
b b bTukey's test
p<0.05
No anionsCl- (a)
CO32-
(a)
SO42-
(a)
NO3- (b)
Figure 49: COD removal obtained in photocatalysis experiments
Figure 50: Influence of inorganic ions in the photocatalysis process
The efficiency of the process is influenced by the dosage of TiO2 as it is shown in Figure 50 (Tanaka, 1999; Chang, 2004); the degradation of organics is improved until an excessive catalyst dosage causes a shadow effect interfering with the transmission of UV light, so electron–hole pairs generation cannot effectively occur (Catalkaya, 2008; Chang, 2004). The results are according with the obtained for other authors as Chang (2004) that found an optimum dosage of 10 g•L-1 TiO2 for the treatment of lignin powder.
COD removal is higher at pH 7 than 12. Several authors have found good removals of organic compounds working at neutral or basic pH (Catalkaya, 2008; Chang, 2004; Gouvêa, 2000), but neutral pH achieves better results because anions, cations and neutral molecules compete with contaminants for the reactive sites on the surface of TiO2 particles. At acid pH, reaction rate is slowed by anion adsorption on the surface of catalyst positively charged, while at basic pH, catalyst particles are negatively charged and cations presence decrease the reaction rate (Kormann, 1991).

New technologies or innovative treatment lines for reliable water treatment for P&P and minimization of waste production
VEO,PTS, ENV, UCM, HOL, WED, January 2012
Page | 88
b) Solar photocatalysis
COD removals obtained with solar photocatalysis treatment using TiO2 as catalyst, are showed in Figure 51. Solar photocatalysis treatment was carried out at pH 7 as the results obtained with UV-photocatalysis showed that working at basic pH did not improve the results.
After five hours of treatment, COD removal is slightly higher than the obtained with UV-photocatalysis treatment (Figure 49). Better efficiencies of COD removal were achieved when 10 g/L TiO2 were added.
[TiO2]=0,5g/L
[TiO2]=1g/L
[TiO2]=5g/L
[TiO2]=10g/L
% C
OD
rem
oval
0
5
10
15
20
25
30
Figure 51: COD removal obtained in solar photocatalysis experiments at pH = 7
c) Ozone treatment
COD removal versus consumed ozone dose during the treatment is showed in Figure 52. COD removal was 35% and 43%, at pH 7 and 12, respectively. COD removal obtained by ozone treatment was higher than COD removal obtained with photocatalysis processes. These results agree with the literature (Amat, 1999; 2005; Fontanier, 2005; Miranda, 2001).
[O3] (g/L)
0,0 0,5 1,0 1,5 2,0 2,5 3,0 3,5
% C
OD
Rem
ov
al
0
10
20
30
40
50
60
70
80
90
100
pH = 7
pH = 12
Figure 52: COD removal obtained in ozonation experiments

New technologies or innovative treatment lines for reliable water treatment for P&P and minimization of waste production
VEO,PTS, ENV, UCM, HOL, WED, January 2012
Page | 89
Further research was developed for understanding inorganic compounds behaviour and as shown in Figure 53 sulphates, nitrates and chlorides has no impact on COD removal and carbonates has a little scavenger effect.
anions, 2000 mg·L-1
no anions sulphate chloride nitrate carbonate
CO
D r
em
ov
al, %
20
40
60
80
100Initial pH=5.7Initial pH=5.7 (buffered)pH=6.5 (adjusted)pH=12 (adjusted)
a a abab
b
Tukey's test P<0.05
c c c c
ab
Figure 53: COD removal after 30 min of ozonation in the presence of inorganic anions (pHini = 6.5±0.2 controlled)
During oxidation processes usually, more easily oxidized compounds are firstly oxidized and as result refractory organic compounds to oxidation process are formed along the reaction (Fontanier, 2005; Salokannel, 2007). In our experiments COD removal was faster until 1 g/L O3 was consumed, but after this initial COD removal, the presence of more biodegradable compounds as VFA, that are oxi-recalcitrant compounds (Hermosilla, 2009b), reduce the efficiency of the treatment, so higher ozone doses are needed to increase COD removal until 35%. Fontainer (2005) studied the behaviour of several organic compounds in response to ozonation and he described how the oxidation of compounds like phenol, chlorophenol and trichloropehnol takes place in one stage, attributable to aromatic ring opening reactions, whether other compounds as catechol, vanillin, guaiacol and syringaldehyde react in two stages due to the generation of intermediates that are more resistant to ozone attack. The carboxylic acids formed by the aromatic ring opening are very resistant to oxidation by ozone (Amat, 2003; 2005; Bailey, 1982; Balcioglu, 2007; Fontanier, 2005; Hoigne, 1983; Kreetachat, 2007) and are usually responsible of the TOC abatement limitation (Hoigne, 1983); although they are usually highly biodegradable. In this particular case, the oxidation is in two stages, the Figure 52 shows this tendency. Although several authors have considered more effectiveness of ozone at basic pH (Amat, 2005; 2004; Bijan, 2005; Sevimli, 2005; Wang, 2004), because it usually implies more efficient formation of hydroxyl radicals (pH higher than 7) (Bijan, 2005; Glaze, 1987), this effluent shows no significant differences between pH 7 and 12 and it agrees with Bijan, (2005). Therefore, in PM3 will be suitable working at the usual neutral pH of its effluent (Kreetachat, 2007; Oeller, 1997; Salokannel, 2007). Tables 28-29 show ozone required calculations depending on COD removal (mgO2/L). In the first hour, between 1.7 to 2 g of ozone are needed to oxidize 1 g of COD, but ozone consumption increase when the experiment continuous and organic compounds are more difficult to oxidize. Between the 2nd and 4th hour of experimental time easy oxidized compounds are formed and less

New technologies or innovative treatment lines for reliable water treatment for P&P and minimization of waste production
VEO,PTS, ENV, UCM, HOL, WED, January 2012
Page | 90
ozone is needed for further oxidation. This behaviour is similar at pH 7 and 12 and is reflected in the previous Figure 53.
Table 28: O3 consumption regarding COD removal obtained at pH=7.
Time (h) O3 (mg/L) COD removal
(mgO2/L) O3/COD COD (mgO2/L) Global COD removal (%)
0 0 0 0 2569 0 1 674 385 1.7 2184 15 2 650 154 4.2 2030 21 3 581 206 2.8 1824 29 4 485 77 6.3 1747 32 5 461 77 6.0 1670 35
Table 29: O3 consumption regarding COD removal obtained at pH=12.
Time (h) O3 (mg/L) COD removal
(mgO2/L) O3/COD COD (mgO2/L) Global COD removal (%)
0 0 0 0 2432 0 1 708 349 2.0 2083 20 2 605 122 5.0 1961 25 3 361 268 1.3 1693 36 4 419 72 5.7 1621 39 5 423 98 4.3 1523 43
d) Advanced oxidation processes in combination with biological treatment
The previous results showed the difficulty of the oxidation of PM3 effluent. The values obtained by photocatalysis treatment are lower than in other industries (Rodrigues, 2008) and it required higher radiation times (5h) for achieving 20% COD removal. Ozonation treatment required high ozone concentrations, more than 3.0 gO3/L, for obtaining removal efficiencies about 35% at pH 7 (usual wastewater pH). Similar results were obtained by Amat (2005) and Fontanier (2006) treating wastewaters from pulp and paper industry. Hence, combination with biological treatments could improve COD removal efficiency at lower cost. Hence, it is necessary the study of minimal pre-treatment for increasing biodegradability. For photocatalysis process, only solar UV radiation was considered in this research as UV radiation and solar treatments obtained similar results and the last treatment has an important advantage over UV radiation, that is its lower energy demands due to use of solar light as source of UV radiation.
Oxidation treatment conditions tested were: ozone treatment (1 g/L and 0.5 g/L of ozone dosage) and solar photocatalysis (10 and 5 g/L of TiO2; both at 1 h and 0.5 h of photocatalysis treatment). In addition, bio-recalcitrant compounds presence in the effluent without treatment was evaluated by the determination of the limit of biological oxidation.
Results obtained are shown in Figures 54-55. Final COD and standard deviation obtained by the effluent without treatment were always around 550±50 mgO2/L. Biodegradability is not strongly improved by previous oxidation treatments 1 g/L of ozone concentration and 5 g/L of TiO2 concentration improve slightly the biodegradability. Solar photocatalysis treatment employing 10 g/L of TiO2 concentration does not result in a higher biodegradability, probably due to consumption of biodegradable material during the oxidation process, while ozone oxidation needs more than 1 g/L of ozone concentration for getting a biodegradability improvement. Thus, AOPs as pre-treatment of such a biodegradable effluent would induce costs which are not negligible. Moreover the data have shown that there are not statistically significative differences between the direct biological treatment of the effluent and the combination of a pre-treatment with AOPs and a

New technologies or innovative treatment lines for reliable water treatment for P&P and minimization of waste production
VEO,PTS, ENV, UCM, HOL, WED, January 2012
Page | 91
posterior biological treatment. In conclusion, using ozonation or photocatalysis as pre-treatment of biological process for this wastewater does not involve meaningful improvement.
Time (h)
0 25 50 75 100 125 150 175 200
% B
iod
eg
rad
ab
ilit
y
0
20
40
60
80
100
1g/L O3
0.5g/L O3
1h solar ph. [TiO2]=10g/L
0.5h solar ph. [TiO2]=10g/L
1h solar ph. [TiO2]=0.5g/L
0.5h solar ph. [TiO2]=5g/L
Effluent without treatment
Time (h)
0 25 50 75 100 125 150 175 200
% B
iod
eg
rad
ab
ilit
y
0
20
40
60
80
100
1g/L O3
0.5g/L O3
1h solar ph. [TiO2]=10g/L
0.5h solar ph. [TiO2]=10g/L
1h solar ph. [TiO2]=0.5g/L
0.5h solar ph. [TiO2]=5g/L
Effluent without treatment
Effluent without treatment
1g/L O3
0.5g/L O3
1h solar ph. [TiO2]=10g/L
0.5h solar ph. [TiO2]=10g/L
1h solar ph. [TiO2]=5g/L
0.5h solar ph. [TiO2]=5g/L
% B
iod
eg
rad
ab
ilit
y
50
60
70
80
90
100
Figure 54: Evolution of biodegradability with time
Figure 55: Percentage of biodegradability obtained after different treatments and
conditions
e) Conclusion on AOPs
Ozone Photocatalysis
(TiO2) Combination O3
and biology
Combination photocatalysis
and biology
Produced water quality &Type of re-use
Reuse is possible for e.g. pulp preparation.
Post-treated water doesn’t fulfil the requirements for reuse as fresh water in this mill. Additional treatments as membrane processes are needed for re-use
Reuse is possible for e.g. pulp preparation.
Post-treated water doesn’t fulfil the requirements for reuse as fresh water in this mill. Additional treatments as membrane processes are needed for re-use
Post-treated water not accomplishes the requirements for reuse as fresh water in this mill.
Additional treatments as membrane processes are needed for re-use
Post-treated water not accomplishes the requirements for reuse as fresh water in this mill.
Additional treatments as membrane processes are needed for re-use

New technologies or innovative treatment lines for reliable water treatment for P&P and minimization of waste production
VEO,PTS, ENV, UCM, HOL, WED, January 2012
Page | 92
Ozone Photocatalysis
(TiO2) Combination O3
and biology
Combination photocatalysis
and biology
Main parameters of the produced water
- 40% COD removal.
- Ozone has no effect on ions.
- Slightly increase in biodegradability
- 20% COD removal.
- Slight increase in biodegradability
- 79% COD removal of raw water by aerobic biological treatment.
- 81% COD removal of ozonized water + aerobic biological treatment.
- 79% COD removal of raw water by aerobic biological treatment.
- 83% COD removal of photocatalyzed water + aerobic biological treatment.
Process conditions
- pH = 7 and 12. - Sample filtered - 25 °C - Experiment time
= 5h
- pH = 7 and 12. - Sample filtered - 25 °C - Experiment time
= 5h - [TiO2] = 0.5, 1, 5
and 10 g/L.
- pH as received - Sample filtered - 25 ºC - [O3] =1 g/L - [Sludge] ≈ 4 g/L - Biological
experiment time = 8 days.
- pH as received - Sample filtered - 25 ºC - [TiO2] = 5 g/L - Radiation time =
0.5h - [Sludge] ≈ 4 g/L - Biological
experiment time = 8 days.
Withdrawal and/or critical points to pay attention to
Accumulation of ions in water circuits. Energy consumption
Accumulation of ions in water circuits. Energy and reagents consumption
AOPs, as pre-treatment of biological, has poor effect on this wastewater compared to biological treatment alone.
AOPs, as pre-treatment of biological, has poor effect on this wastewater compared to biological treatment alone.
3.2.2.2 Comparison of anaerobic/aerobic/3FM treatment with Anaerobic/MBR treatment as pre-treatment for membrane process (RO)
a) Anaerobic/Aerobic/UF vs. Anaerobic/MBR
Comparison of “Anaerobic � Aerobic � UF” and “Anaerobic � MBR” combinations was directly done at pilot scale and these results are reported in a specific report (see internal result I5.1.4.4 “Multi-barrier processes in combination with disinfection”, Ordóñez, R., 2010). As the effluents produced during those pilot trials have been used for lab scale trials reported hereafter, a brief summary of these pilot trials is reported below in order to help the comprehension of the reader. Figures 56-57 show the flow diagrams of both pilot plants evaluated at PM3. Capacity of both pilot plants: 1 m3/h.

New technologies or innovative treatment lines for reliable water treatment for P&P and minimization of waste production
VEO,PTS, ENV, UCM, HOL, WED, January 2012
Page | 93
SCREENER LAMELLA
CLARIFIER
PRE-ACIDIFICATION
TANK
ANAEROBIC
REACTOR
AEROBIC
REACTOR
LAMELLA
CLARIFIER
ULTRAFILTRATION REVERSE
OSMOSIS
Sludge
Biogas
Nutrients
Backwash
NaOH/HCl
PermeateWastewater
from DAFs
Figure 56: Pilot plant 1.
Figure 57: Pilot plant 2.
Equipment description in pilot plant 1: - Anaerobic reactor: Internal circulation modified. Organic load: 7-15 kgCOD/m3·d. External
pH control with HCl/NaOH to guarantee pH = 6.5 in the reactor. Nutrients supply (H3PO4 and urea) to maintain relation BOD5:N:P = 100:5:1.
- Aerobic reactor: Moving bed bio-reactor running at 2-3 g/L of MLTSS. Air supply to guarantee ≥ 2 mg/L of dissolved oxygen.
- Ultrafiltration: Pressurized system in dead-end mode. PVDF hollow fiber membranes. Backwashes programmed each 20-30 min to keep TMP stable (duration: 3 min). Chemical cleanings when TMP>110 kPa with NaOCl at pH 9.0-9.5 and 35ºC.
- Reverse osmosis: 3 membrane modules operating in cross-flow mode. Spiral wound membranes with a pore size in the range of 0.0001 µm. Chemical cleaning when permeate flux decreases about 10%, with citric acid at pH = 2 and T = 35ºC first, and then, an alkaline product (Ultrasil 10®) at pH = 9-10 and T = 35ºC.
Equipment description in pilot plant 2: - Anaerobic reactor: Expanded granular sludge bed (EGSB). Organic load: 7-15
kgCOD/m3·d. External pH control with HCl/NaOH to guarantee pH = 6.5 in the reactor. Nutrients supply (H3PO4 and urea) to maintain relation BOD5:N:P = 100:5:1.
- MBR: PVDF hollow fiber membranes filtering 400 L/h. F/M relations tested: 0.15 and 0.18 kgCOD/kgMLTSS. MLTSS = 8-10 g/L. Permeate fluxes tested: 10 and 12 15 LMH. Two different routine cleanings: (1st) 25 seconds-long backwashes every 6 min; (2nd) weekly maintenance cleanings consisting of a first 40 min-long oxidizing step with NaOH (1 g/L),
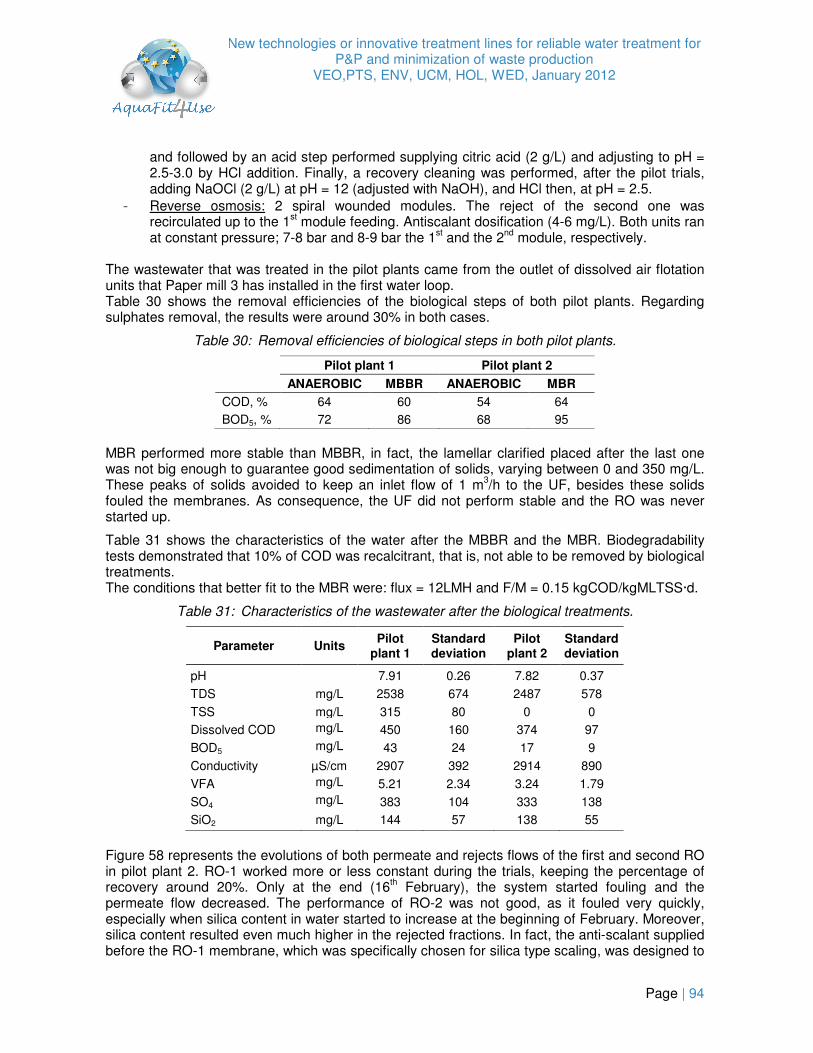
New technologies or innovative treatment lines for reliable water treatment for P&P and minimization of waste production
VEO,PTS, ENV, UCM, HOL, WED, January 2012
Page | 94
and followed by an acid step performed supplying citric acid (2 g/L) and adjusting to pH = 2.5-3.0 by HCl addition. Finally, a recovery cleaning was performed, after the pilot trials, adding NaOCl (2 g/L) at pH = 12 (adjusted with NaOH), and HCl then, at pH = 2.5.
- Reverse osmosis: 2 spiral wounded modules. The reject of the second one was recirculated up to the 1st module feeding. Antiscalant dosification (4-6 mg/L). Both units ran at constant pressure; 7-8 bar and 8-9 bar the 1st and the 2nd module, respectively.
The wastewater that was treated in the pilot plants came from the outlet of dissolved air flotation units that Paper mill 3 has installed in the first water loop. Table 30 shows the removal efficiencies of the biological steps of both pilot plants. Regarding sulphates removal, the results were around 30% in both cases.
Table 30: Removal efficiencies of biological steps in both pilot plants.
Pilot plant 1 Pilot plant 2
ANAEROBIC MBBR ANAEROBIC MBR
COD, % 64 60 54 64
BOD5, % 72 86 68 95
MBR performed more stable than MBBR, in fact, the lamellar clarified placed after the last one was not big enough to guarantee good sedimentation of solids, varying between 0 and 350 mg/L. These peaks of solids avoided to keep an inlet flow of 1 m3/h to the UF, besides these solids fouled the membranes. As consequence, the UF did not perform stable and the RO was never started up.
Table 31 shows the characteristics of the water after the MBBR and the MBR. Biodegradability tests demonstrated that 10% of COD was recalcitrant, that is, not able to be removed by biological treatments. The conditions that better fit to the MBR were: flux = 12LMH and F/M = 0.15 kgCOD/kgMLTSS·d.
Table 31: Characteristics of the wastewater after the biological treatments.
Parameter Units Pilot
plant 1 Standard deviation
Pilot plant 2
Standard deviation
pH 7.91 0.26 7.82 0.37
TDS mg/L 2538 674 2487 578
TSS mg/L 315 80 0 0
Dissolved COD mg/L 450 160 374 97
BOD5 mg/L 43 24 17 9
Conductivity µS/cm 2907 392 2914 890
VFA mg/L 5.21 2.34 3.24 1.79
SO4 mg/L 383 104 333 138
SiO2 mg/L 144 57 138 55
Figure 58 represents the evolutions of both permeate and rejects flows of the first and second RO in pilot plant 2. RO-1 worked more or less constant during the trials, keeping the percentage of recovery around 20%. Only at the end (16th February), the system started fouling and the permeate flow decreased. The performance of RO-2 was not good, as it fouled very quickly, especially when silica content in water started to increase at the beginning of February. Moreover, silica content resulted even much higher in the rejected fractions. In fact, the anti-scalant supplied before the RO-1 membrane, which was specifically chosen for silica type scaling, was designed to

New technologies or innovative treatment lines for reliable water treatment for P&P and minimization of waste production
VEO,PTS, ENV, UCM, HOL, WED, January 2012
Page | 95
work with silica levels up to 200-220 mg·L-1, however it was not enough. Therefore, scaling phenomena could not be totally avoided at the silica levels present in the mill. But, despite the problems with silica scaling, the permeate generated in RO-1 and RO-2 met the requirements set by PM3 to substitute current fresh water supply.
0
25
50
75
100
125
150
175
200
225
07/0
1/10
12/0
1/10
17/0
1/10
22/0
1/10
27/0
1/10
01/0
2/10
06/0
2/10
11/0
2/10
16/0
2/10
21/0
2/10
26/0
2/10
03/0
3/10
08/0
3/10
Flo
w (
L/h
)
0
25
50
75
100
125
150
175
200
225
SiO
2 (
mg/L
)
RO-1 perm.
RO-1 reject
RO-2 perm.
RO-2 reject
SiO2
Figure 58: Permeate and reject flows of RO membranes in pilot plant 2. Evolution of the silica content in the water feeding the RO membranes.
Table 32 shows the main parameters of both, permeate and retentate streams.
Table 32: Permeate water quality of both RO stages of pilot plant 2.
Parameter Units RO-1
Permeate RO-2
Permeate RO-1
Reject RO-1
Reject
Total COD mg/L 0.00 0.00 477 582
BOD5 mg/L 0.00 0.00 15 22.9
TSS mg/L 0.00 0.00 16 26
N-total mg/L 4.00 12.00 90 121
P-total mg/L 0.00 0.00 9 15.6
Alkalinity mEQ/L 0.80 1.00 16 15
T ºC 21.70 23.00 24.27 24.82
Conductivity µS/cm 36 117 3 280 4 078
NH4-N mg/L 1.30 9.00 17 18
NO3 mg/L 1.60 1.20 56 33
Cl- mg/L - 7.00 176 218
SO42- mg/L 5.00 < 3.00 446 473
SiO2 mg/L 1.30 2.30 182 197
F mg/L < 0.10 < 0.10 0.36 0.20
B mg/L 0.40 0.50 0.77 -
Ba mg/L 0.10 0.10 0.26 -
Sr mg/L < 0.03 < 0.03 0.61 -
Mn mg/L < 0.03 < 0.03 0.82 -
Al mg/L < 0.03 < 0.03 0.06 -
K mg/L 0.30 0.60 23 -

New technologies or innovative treatment lines for reliable water treatment for P&P and minimization of waste production
VEO,PTS, ENV, UCM, HOL, WED, January 2012
Page | 96
Na mg/L 5.80 21.70 736 -
Mg mg/L 0.10 0.30 10 1.4
Ca mg/L 15.00 23.00 116 582
Fe mg/L < 0.10 < 0.10 0.42 22
b) Anaerobic/aerobic (Pilot plant 1) � 3FM
The aim of these trials was to determine the performances of the 3FM on TSS and turbidity levels in order to fine-tune the quality of the effluent with the inlet specifications of further membrane process. NF/RO tests were then done on the 3FM filtrates to assess the quality of the produce permeate and the impact of the 3FM technology as pre-treatment for membrane processes.
• 3FM filtration:
3FM test was run on the effluent from the aerobic process of PM3 pilot plant 1 (see Figure 56).
Table 33: Effluent from PM3 anaerobic/aerobic pilot before 3FM filtration
Parameter Clarifier Parameter Clarifier
pH 7.9 Dry matters (105°C – mg/L) 2 700
Cond. (mS/cm) 3.8 SO42-
(mg /L) 470
Turbidity (NTU) 35 Ca (mg/L) 71
COD (mg O2/L) 791 Na (mg/L) 680
COD soluble (mg O2/L) 584 Cl- (mg/L) 150
TSS (mg/l) 89 SiO2 (mg Si/L) 4.7
(Detailed analyses are reported in Annex 8.10)
Compared to PM1 and PM2, the turbidity is similar but the TSS content is 3-4 times higher and COD level as well. As the sample was received, white particles were observed in the effluent, which are not usually present in PM3 waste water (NB: this particle might come from the IPC container in which the effluent was sampled). Therefore, a pre-filtration step at 200 µm was applied to the effluent before 3FM filtration in order to get rid off these particles. 3FM filtration test was performed with a flow of 60-65 L/h through the filter (samples taken every 30 min). Stable performances in time were obtained and no breakthrough, drilling or saturation of the filter was observed. Very good results were regarding TSS abatement (70%) and turbidity (77%) with final levels of 6 mg/L of TSS and 8 NTU of turbidity (see Figure 85 in Annex 8.10). After filtration, total COD was about 610 mg O2/L which corresponds to the soluble COD measured on the raw effluent (see Table 33), showing thus that 3FM filtration has an impact only on particular COD and none on the soluble COD. Granulometry analysis showed a cut off of 10 µm the pre-filtered effluent which is in accordance with 3FM industrial specifications (indicated cut size for industrial module 5-10 µm).

New technologies or innovative treatment lines for reliable water treatment for P&P and minimization of waste production
VEO,PTS, ENV, UCM, HOL, WED, January 2012
Page | 97
Effluent pre-filtered at 200 µm
0
2
4
6
8
10
12
14
0,01 0,1 1 10 100 1000 10000
d µm (log scale)
% s
ize
Raw effluent pre-filtered
After 5 min filtration
After 30 min filtration
After 75 min filtration
Figure 59: Evolution of granulometry during 3FM filtration
Additional tests were done with coagulation pre-treatment to see if performances of the 3FM could be enhanced by coagulation of the finest particles. 3FM filtration after coagulation pre-treatment led to a filtrate with a quality as good as the one obtained with 3FM filtration applied to the effluent pre-filtered at 200 µm. (More details can be found in report I3.1.1.1 “Proof of concept of aerobic water treatment technologies and separation techniques on bench scale for Pulp&Paper”, 2010). In conclusion, the 3FM tests run at lab scale showed encouraging performances on the effluent from PM3 anaerobic/aerobic pilot effluent. The addition of coagulant (50 ppm of FeCl3) before filtration may improve the quality of the filtrate, but the operating conditions have to be optimized (NB: this could be done during the onsite pilot tests within WP5.1.4).
Raw
effluent
Pre-filtration 200 µm
(*)(*)
3FM filtrate
TSS (mg/L) : 89 20 6 (70%)*
Turbidity (NTU) : 35 34.2 8 (77%)*
tCOD (mg O2/L) : 791 644 611
sCOD (mg O2/L) : 584 598 596
The 3FM bench scale unit has only a limited representation of the efficiency of an industrial 3FM module as it has no backwash process and is not representative of the hydrodynamic of an industrial module. These results thus give an indication of the performances which should be expected at pilot scale, at which better performances should be obtained.
• Membrane screening and impact of 3FM on membrane process
The objective of these tests was to produce a permeate and a concentrate with equivalent qualities to the one produced at pilot scale in the treatment line Anaerobic � Aerobic � UF/RO in order to evaluate the impact of 3FM on membrane filtration and to further assess the efficiency of evapoconcentration technology on membrane concentrates (see internal report “I3.1.1.3 Assessment of technologies for the treatment of membrane retentate streams for P&P”).
Four membranes were tested at lab scale on the 3FM filtrate (Table 34) in a membrane test cell to evaluate the combination of 3FM/NF and compare it with the one obtained by UF/RO filtration applied to the anaerobic/aerobic effluent (see §3.2.2.2a): two NF type membranes (NF200 and NF90) and two RO type membranes (BW30 (low pressure) and SW30 (high pressure).

New technologies or innovative treatment lines for reliable water treatment for P&P and minimization of waste production
VEO,PTS, ENV, UCM, HOL, WED, January 2012
Page | 98
Table 34: 3FM filtrate characteristics
Parameter Clarifier Parameter Clarifier
pH 7.9 Hardness (°dH) 13.1
Cond. (mS/cm) 3.6 TA (°dF) 0
Turbidity (NTU) 8 TAC (°dF) 111
COD (mg O2/L) 497 Ca (mg/L) 84.5
COD soluble (mg O2/L) 494 K (mg/L) 10
TSS (mg/l) 6 Mg (mg/L) 5.44
N-NH4 (mg N/L) 80 Na (mg/L) 680
N-NO2 (mg N/L) 61 tFe (mg/L) 0.41
N-NO3 (mg N/L) 20 Mn (mg/L) 0.7
Ptotal (mg P/L) 16.9 F- (mg/L) < 1
P-PO4 (mg P/L) 16 Cl- (mg/L) 150
SO42-
(mg /L) 426 SiO2 (mg Si/L) 4.7
(Note: Analyses of 3FM filtrate slightly defer from the previous one since there has been some delay between the experiments)
Calcium carbonate, calcium phosphate and calcium sulphate were identified as the major scaling risks together with silicate when increasing the VCF (see JChess simulation in Annex 8.11). However, if the effluent is acidified, scaling risks diminish and the one lasting are calcium sulphate and silicate. Tests were thus performed at pH = 5.5 in order to minimize the calcium sulphate and silicate precipitation risks. Evaluation was done taking in consideration variations in permeability, retention properties and final conductivity (threshold for re-use purpose in PM3 was fixed to 500 µS/cm max.).
0,00
10,00
20,00
30,00
40,00
50,00
60,00
70,00
80,00
0,0 10,0 20,0 30,0 40,0 50,0 60,0 70,0 80,0 90,0
Recovery (%)
Flo
w (
L/(
h.m
²) (
co
rre
cte
d a
t 2
5°C
)
NF200 NF200 pH = 5.5
NF90 pH = 5.5 BW30 pH = 5.5
SW30 pH = 5.5
0,00
10,00
20,00
30,00
40,00
50,00
60,00
70,00
80,00
90,00
100,00
0,0 10,0 20,0 30,0 40,0 50,0 60,0 70,0 80,0 90,0
Recovery (%)
Co
nd
uc
tiv
ity
re
ten
tio
n (
%)
NF200 NF200 pH = 5.5
NF90 pH = 5.5 BW30 pH = 5.5
SW30 pH = 5.5
Figure 60: Evolution of permeate recovery Figure 61: Conductivity retention
In consideration of all criteria the SW30 was finally the membrane which gave the best results in terms of permeability which doesn’t get degraded (30-35 L/h.m2 until a conversion rate of ca.75% and then gets lower), retention of salts (98%) and of permeate quality which is stable (< 400 µS/cm) whatever the conversion rate. (NB: Analyses of average permeates and concentrates are reported in Annex 8.11).
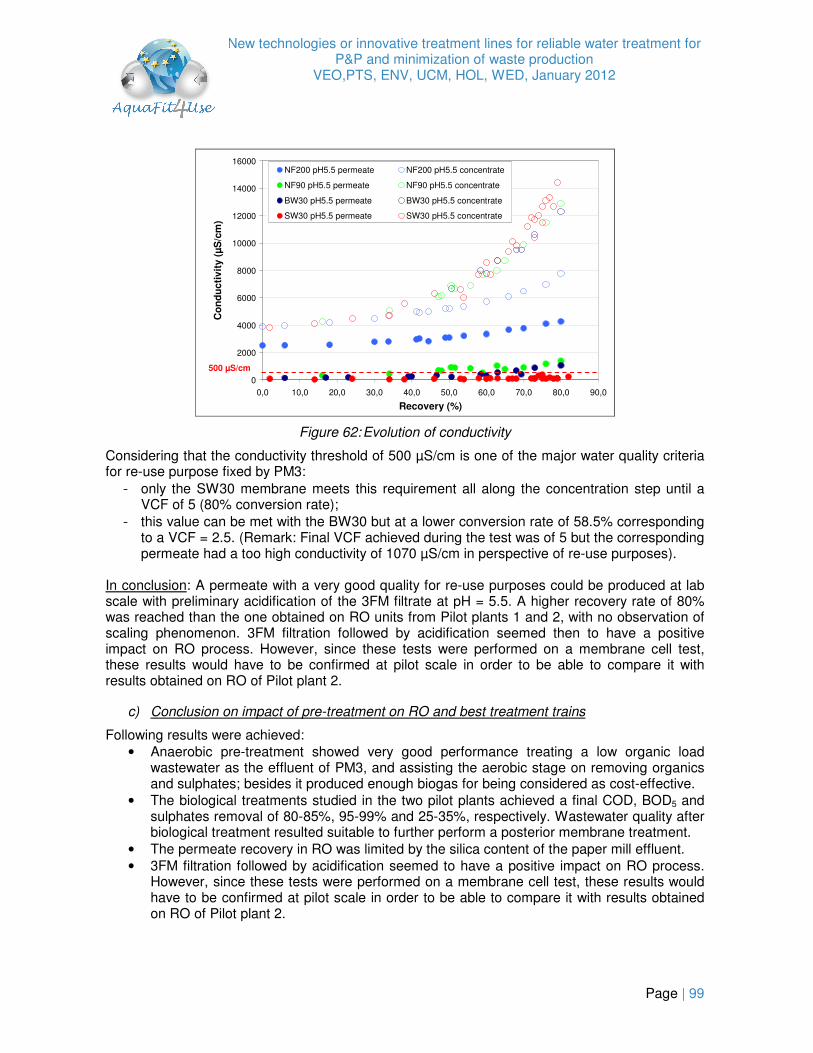
New technologies or innovative treatment lines for reliable water treatment for P&P and minimization of waste production
VEO,PTS, ENV, UCM, HOL, WED, January 2012
Page | 99
0
2000
4000
6000
8000
10000
12000
14000
16000
0,0 10,0 20,0 30,0 40,0 50,0 60,0 70,0 80,0 90,0
Recovery (%)
Co
nd
uc
tiv
ity (
µS
/cm
)
NF200 pH5.5 permeate NF200 pH5.5 concentrate
NF90 pH5.5 permeate NF90 pH5.5 concentrate
BW30 pH5.5 permeate BW30 pH5.5 concentrate
SW30 pH5.5 permeate SW30 pH5.5 concentrate
500 µS/cm
Figure 62: Evolution of conductivity
Considering that the conductivity threshold of 500 µS/cm is one of the major water quality criteria for re-use purpose fixed by PM3: - only the SW30 membrane meets this requirement all along the concentration step until a
VCF of 5 (80% conversion rate); - this value can be met with the BW30 but at a lower conversion rate of 58.5% corresponding
to a VCF = 2.5. (Remark: Final VCF achieved during the test was of 5 but the corresponding permeate had a too high conductivity of 1070 µS/cm in perspective of re-use purposes).
In conclusion: A permeate with a very good quality for re-use purposes could be produced at lab scale with preliminary acidification of the 3FM filtrate at pH = 5.5. A higher recovery rate of 80% was reached than the one obtained on RO units from Pilot plants 1 and 2, with no observation of scaling phenomenon. 3FM filtration followed by acidification seemed then to have a positive impact on RO process. However, since these tests were performed on a membrane cell test, these results would have to be confirmed at pilot scale in order to be able to compare it with results obtained on RO of Pilot plant 2.
c) Conclusion on impact of pre-treatment on RO and best treatment trains
Following results were achieved: • Anaerobic pre-treatment showed very good performance treating a low organic load
wastewater as the effluent of PM3, and assisting the aerobic stage on removing organics and sulphates; besides it produced enough biogas for being considered as cost-effective.
• The biological treatments studied in the two pilot plants achieved a final COD, BOD5 and sulphates removal of 80-85%, 95-99% and 25-35%, respectively. Wastewater quality after biological treatment resulted suitable to further perform a posterior membrane treatment.
• The permeate recovery in RO was limited by the silica content of the paper mill effluent. • 3FM filtration followed by acidification seemed to have a positive impact on RO process.
However, since these tests were performed on a membrane cell test, these results would have to be confirmed at pilot scale in order to be able to compare it with results obtained on RO of Pilot plant 2.
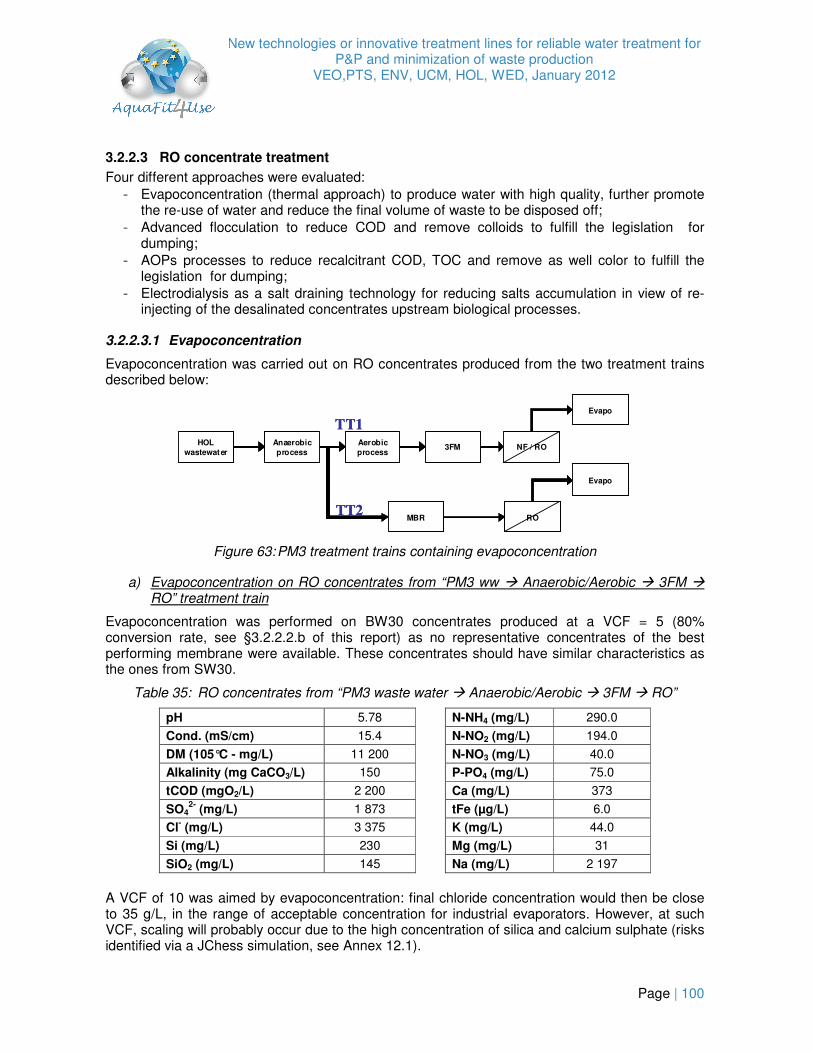
New technologies or innovative treatment lines for reliable water treatment for P&P and minimization of waste production
VEO,PTS, ENV, UCM, HOL, WED, January 2012
Page | 100
3.2.2.3 RO concentrate treatment
Four different approaches were evaluated: - Evapoconcentration (thermal approach) to produce water with high quality, further promote
the re-use of water and reduce the final volume of waste to be disposed off; - Advanced flocculation to reduce COD and remove colloids to fulfill the legislation for
dumping; - AOPs processes to reduce recalcitrant COD, TOC and remove as well color to fulfill the
legislation for dumping; - Electrodialysis as a salt draining technology for reducing salts accumulation in view of re-
injecting of the desalinated concentrates upstream biological processes.
3.2.2.3.1 Evapoconcentration
Evapoconcentration was carried out on RO concentrates produced from the two treatment trains described below:
HOL
wastewater
Anaerobic
process
Aerobic
process3FM NF / RO
Evapo
MBR RO
Evapo
HOL
wastewater
Anaerobic
process
Aerobic
process3FM NF / RONF / RO
Evapo
MBR RORO
Evapo
TT2
TT1HOL
wastewater
Anaerobic
process
Aerobic
process3FM NF / RO
Evapo
MBR RO
Evapo
HOL
wastewater
Anaerobic
process
Aerobic
process3FM NF / RONF / RO
Evapo
MBR RORO
Evapo
TT2
TT1
Figure 63: PM3 treatment trains containing evapoconcentration
a) Evapoconcentration on RO concentrates from “PM3 ww � Anaerobic/Aerobic � 3FM � RO” treatment train
Evapoconcentration was performed on BW30 concentrates produced at a VCF = 5 (80% conversion rate, see §3.2.2.2.b of this report) as no representative concentrates of the best performing membrane were available. These concentrates should have similar characteristics as the ones from SW30.
Table 35: RO concentrates from “PM3 waste water � Anaerobic/Aerobic � 3FM � RO”
pH 5.78 N-NH4 (mg/L) 290.0
Cond. (mS/cm) 15.4 N-NO2 (mg/L) 194.0
DM (105°C - mg/L) 11 200 N-NO3 (mg/L) 40.0
Alkalinity (mg CaCO3/L) 150 P-PO4 (mg/L) 75.0
tCOD (mgO2/L) 2 200 Ca (mg/L) 373
SO42-
(mg/L) 1 873 tFe (µg/L) 6.0
Cl- (mg/L) 3 375 K (mg/L) 44.0
Si (mg/L) 230 Mg (mg/L) 31
SiO2 (mg/L) 145 Na (mg/L) 2 197
A VCF of 10 was aimed by evapoconcentration: final chloride concentration would then be close to 35 g/L, in the range of acceptable concentration for industrial evaporators. However, at such VCF, scaling will probably occur due to the high concentration of silica and calcium sulphate (risks identified via a JChess simulation, see Annex 12.1).

New technologies or innovative treatment lines for reliable water treatment for P&P and minimization of waste production
VEO,PTS, ENV, UCM, HOL, WED, January 2012
Page | 101
A final VCF of 11.7 was achieved (T = 67 ± 2°C, P = 170 mbar) leading to a colourless distillate which respects all quality standards fixed by PM3 for re-use as fresh water surrogate (Table 36) even though a deterioration of the distillate quality with growing VCF could be observed (see details in Annex 12.1).
Table 36: Physico-chemical analyses of final distillate (VCF = 11.7)
pH 3.8 N-NH4 (mg/L) 19.3
Cond. (mS/cm) 0.3 N-NO2 (mg/L) 2.9
DM (105°C - mg/L) 0.06 N-NO3 (mg/L) -
Alkalinity (mg CaCO3/L) 0 P-PO4 (mg/L) < 0.4
tCOD (mgO2/L) 66 Ca (mg/L) 0
SO42-
(mg/L) - tFe (mg/L) < 0.1
Cl- (mg/L) 2.3 K (mg/L) -
Si (mg/L) - Mg (mg/L) 0.53
SiO2 (mg/L) < 16 Na (mg/L) 0
The final VCF and potential scaling risk were confirmed by calculation taking into account the concentration in the feed and in the concentrate; this was as well confirmed by scaling observed during the experiment. The acidification of 3FM filtrate before RO enabled to reduce the carbonates precipitation risks but the gypsum precipitation risk is still present due to the high SO4 concentration in the effluent. As for calcium sulphate, it is difficult to avoid silica precipitation. This compound is a major problem when present in solution. During evapoconcentration, the foam formation was very moderate. Foam should thus not contaminate the distillate in future pilot scale trials but would require a particular attention. � In conclusion: Evapoconcentration up to a VCF of 11.7 (which is equivalent to 8.5% of final waste in volume) enabled a good distillate quality which respected PM3 quality requirements for the reuse of water. However a distillate deterioration was observed together with the increase of the VCF, especially from VCF = 7. Attention should be paid on scaling risks (mainly gypsum and silica).
Lab-scale tests: VCF = 11.7� Scaling risks
Industrial scaleVCF = 7
� Acidification + Antiscalants�Lab-scale tests: VCF = 11.7
� Scaling risksIndustrial scale
VCF = 7� Acidification + Antiscalants�
Considering that the VCF of the RO step (RO screening) in this treatment train was of equal to 5 (BW30 membrane), the global VCF for the combined RO + evapoconcentration will thus be of 35 (for details about the RO screening step, refer to internal result I3.1.1.1). The addition of evapoconcentration would thus lead to a final concentrate representing 2.8% in volume of the waste water treated by the global treatment line.
b) Evapoconcentration on RO concentrates from “PM3 ww � MBR � RO” treatment train
NF concentrate were produced by UCM using a reverse osmosis pilot plant/equipment. Reached VCF was very low, comprised between 1.2 and 2 due to important scaling by silica: these concentrates had thus lower ions concentrations (Table 37) than the previous RO concentrates.

New technologies or innovative treatment lines for reliable water treatment for P&P and minimization of waste production
VEO,PTS, ENV, UCM, HOL, WED, January 2012
Page | 102
Table 37: RO concentrates from “PM3 waste water � MBR � RO”
pH 8.35 N-NO3 (mg/L) 4.4
Cond. (mS/cm) 2 930 Ptotal (mg/L) 10.7
DM (105°C - mg/L) 2 200 P-PO4 (mg/L) 6.4
Alkalinity (mg CaCO3/L) 1 140 Ca (mg/L) 73
tCOD (mgO2/L) 399 tFe (mg/L) 1.7
SO42-
(mg/L) 312 K (mg/L) 12.0
Cl- (mg/L) 100 Mg (mg/L) 6.6
Si (mg/L) 92 Mn (µg/L) 50
SiO2 (mg/L) 120 Na (mg/L) 699
As the chloride concentration was very low, a VCF close to 50 was aimed by evapoconcentration; however, due to time consumption, a VCF similar to the one of TT1 was fixed, close to 12.
A final VCF of 11.5 was achieved (T = 67 ± 2°C, P = 170 mbar) leading to a colourless distillate which respects all quality standards fixed by PM3 for re-use as fresh water surrogate (Table 38). No microbiological risks were either identified.
Table 38: Physico-chemical analyses of final distillate (VCF = 11.5)
pH 7.3 N-NO3 (mg/L) -
Cond. (mS/cm) 0.009 Ptotal (mg/L) < 0.05
DM (105°C - mg/L) 0 P-PO4 (mg/L) < 0.05
Turbidity (FAU) 0.4 Ca (mg/L) -
Alkalinity (mg CaCO3/L) 17 tFe (mg/L) < 0.2
tCOD (mgO2/L) 20.2 K (mg/L) -
SO42-
(mg/L) - Mg (mg/L) -
Cl- (mg/L) 3 Mn (µg/L) n.d.
SiO2 (mg/L) < 2 Na (mg/L) < 2
During evapoconcentration, the foam formation was very moderate: foam should thus not contaminate the distillate in future pilot scale trials. Scaling was however observed on the flask surface at the end of the test. Concentrate analysis shows conductivity values lower than expected. Similar results were obtained for alkalinity, calcium and iron (see detailed analysis of concentrates in Annex 12.2), and confirming then the scaling phenomena by precipitation of carbonates species. On the contrary, chloride concentration was very low, slightly above 1 g/L and pH was basic: corrosion risks are thus very low. � In conclusion: Evapoconcentration trials led to very good results: this technique used up to a VCF equal to 11.5 enabled the production of distillate with an excellent quality that respected all PM3 requirements. The corrosion risks were found to be low. Nevertheless, attention should still be paid to scaling risks. Considering that the VCF of the RO step at pilot scale (see Pilot 2 in Figure 57 and details in §3.2.2.2a) in this treatment train was of equal to 1.25 (20% recovery), the global VCF for the combined “RO + evapoconcentration” will thus be of 14.5. The addition of evapoconcentration would thus lead to a final concentrate representing ~7% in volume of the waste water treated by the global treatment line.
However, due to the effluent composition (at lab scale, final [Cl-] ≈ 1.1 g/L for the concentrate), a VCF up to 50 might be targeted: the corrosion risks would be moderate and could be overcome

New technologies or innovative treatment lines for reliable water treatment for P&P and minimization of waste production
VEO,PTS, ENV, UCM, HOL, WED, January 2012
Page | 103
by using thicker or more corrosion-resistant materials for industrial evaporators. The scaling risks would then still have to be considered. The distillate quality could still fulfil PM3 criteria, but this has to be confirmed by experiments. In this case, a final global VCF (RO + evapo) equal to 62.5 would be obtained. The addition of evapoconcentration would thus lead to a final concentrate representing 1.5% in volume of the waste water treated by the global treatment line.
c) Conclusion on evapoconcentration applied to RO concentrates from PM3
Evapoconcentration proved to be an adapted technology to treat membrane concentrates of both tested treatment trains (Anaerobic � Aerobic � 3FM � RO and Anaerobic � MBR � RO). In both cases the produced water has a very good quality respecting all PM3 requirements for re-use as fresh water. Considering the VCF of the RO step, the addition of evapoconcentration would then lead to a final waste to be disposed off representing respectively 2.8% and 7% in volume of the waste water treated by the global treatment line. Attention should be paid to scaling risks at pilot/industrial scale. Moreover, considering the recovery rates obtained on the RO process it seems due to silica content of PM3 effluent it isn’t that appropriate to apply evapoconcentration in such case as volumes to be treated at industrial scale will be very high.
3.2.2.3.2 Application of advanced flocculation to RO concentrates
The objective of these experiments was to define a new treatment combination to reduce recalcitrant COD and remove colloids while maintaining an acceptable level of conductivity or even reduce it as well.
The RO concentrate used in ozone, Fenton, Photo-Fenton and photocatalysis experiments was obtained from the pilot plant 2 (see Figure 57 in §3.2.2.2a). It was characterized by the main parameters reflected in Table 39.
Table 39: Characteristics of concentrate used for ozone, Fenton, Photo-Fenton and photocatalysis experiments
Parameter Units Average Standard deviation
CODt mg/L 530 74
BOD5 mg/L 21 4 TSS mg/L 21 7
N-total mg/L 105 22
P-total mg/L 12 5
Alkalinity mg CaCO3/L 750 0
Temperature ºC 23 2
Conductivity µS/cm 3679 564
NH4+-N mg/L 17 1
NO3- mg/L 45 16
Cl- mg/L 197 30
SO42- mg/L 460 19
SiO2 mg/L 190 11
F- mg/L 0.28 0.11
B mg/L 0.86 0.03 Al mg/L 0.06 0.00
K mg/L 18 0.60

New technologies or innovative treatment lines for reliable water treatment for P&P and minimization of waste production
VEO,PTS, ENV, UCM, HOL, WED, January 2012
Page | 104
Na mg/L 871 97
Mg mg/L 8 0.55
Ca mg/L 97 7
Fe2+ mg/L 1.86 1.18
Fe-total mg/L 1.87 0.08
a) Coagulation trials
The total number of counts per second registered by the FBRM probe versus the added quantity of coagulant determined the optimal dosage of each one (Figure 64). Only FeCl3, PACl1, PACl2 and PNSS produced a significant effect on the treated wastewater. As a greater amount of these coagulants were added, DCM destabilized and began to aggregate, resulting in an increase of the number of counts. The other PACl’s destabilized DCM, but their effect was comparatively minimal.
Doses (mg/L)
0 5000 10000 15000 20000 25000 30000
nº
co
un
ts/s
0
5000
10000
15000
20000
25000
30000
35000
FeCl3 PACl2PACl1PACl5 PACl3PACl4 PNSS
Figure 64: Evolution of the number of counts versus the dosage of coagulant.
Although PACl2 produced a good effect on DCM similarly to PACl1, PACl1 was chosen to perform the next experimental trials, adding lime softening and flocculation steps, because it is a cheaper product. FeCl3 was discarded as an optimal product because it turned the water colour to intense red-orange at optimal dosage, which is not acceptable (NB: colour is not acceptable at any dose in a paper mill). According to results shown in Figure 20, 5000, 10000 and 18500 mg/L of PACl1 were chosen as reference doses to perform the following trials. A higher coagulant dosage produced a higher reduction in recalcitrant COD (rCOD), reaching ≈80% when 18500 mg/L were added; however, it also increased conductivity (Figure 65a) as more Al was added to the medium. On the other hand, better absorbance removals at all the measured wavelengths were achieved when 10000 mg/L of PACl1 were added, while both, lower and higher dosages yielded lower reductions (Figure 65b); denoting a selective removal of refractory organic matter. Particularly, coloured compounds with a high level of resonance (A500) were not removed at all when 18500 mg/L of coagulant were used.
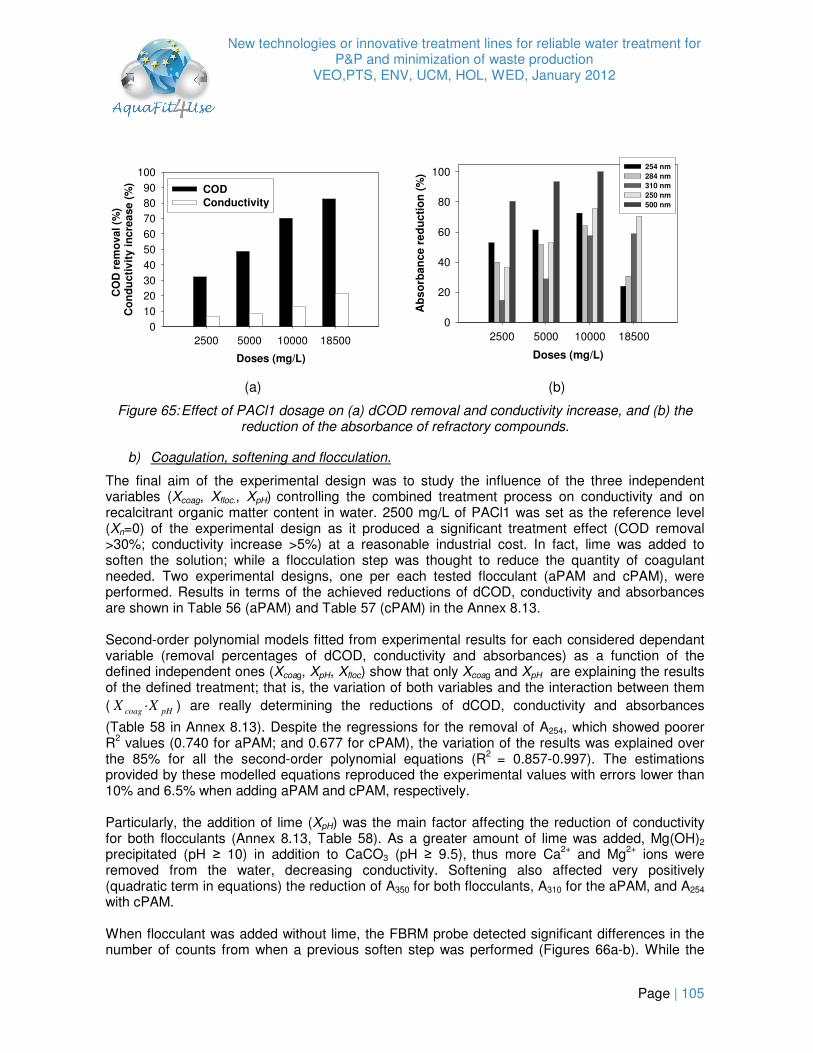
New technologies or innovative treatment lines for reliable water treatment for P&P and minimization of waste production
VEO,PTS, ENV, UCM, HOL, WED, January 2012
Page | 105
Doses (mg/L)
2500 5000 10000 18500
CO
D r
em
ov
al (%
)
Co
nd
uc
tiv
ity
in
cre
as
e (
%)
0
10
2030
40
50
60
70
8090
100
COD
Conductivity
Doses (mg/L)
2500 5000 10000 18500
Ab
so
rba
nc
e r
ed
uc
tio
n (
%)
0
20
40
60
80
100254 nm
284 nm
310 nm
250 nm
500 nm
(a) (b)
Figure 65: Effect of PACl1 dosage on (a) dCOD removal and conductivity increase, and (b) the reduction of the absorbance of refractory compounds.
b) Coagulation, softening and flocculation.
The final aim of the experimental design was to study the influence of the three independent variables (Xcoag, Xfloc., XpH) controlling the combined treatment process on conductivity and on recalcitrant organic matter content in water. 2500 mg/L of PACl1 was set as the reference level (Xn=0) of the experimental design as it produced a significant treatment effect (COD removal >30%; conductivity increase >5%) at a reasonable industrial cost. In fact, lime was added to soften the solution; while a flocculation step was thought to reduce the quantity of coagulant needed. Two experimental designs, one per each tested flocculant (aPAM and cPAM), were performed. Results in terms of the achieved reductions of dCOD, conductivity and absorbances are shown in Table 56 (aPAM) and Table 57 (cPAM) in the Annex 8.13. Second-order polynomial models fitted from experimental results for each considered dependant variable (removal percentages of dCOD, conductivity and absorbances) as a function of the defined independent ones (Xcoag, XpH, Xfloc) show that only Xcoag and XpH are explaining the results of the defined treatment; that is, the variation of both variables and the interaction between them ( pHcoag XX · ) are really determining the reductions of dCOD, conductivity and absorbances
(Table 58 in Annex 8.13). Despite the regressions for the removal of A254, which showed poorer R2 values (0.740 for aPAM; and 0.677 for cPAM), the variation of the results was explained over the 85% for all the second-order polynomial equations (R2 = 0.857-0.997). The estimations provided by these modelled equations reproduced the experimental values with errors lower than 10% and 6.5% when adding aPAM and cPAM, respectively. Particularly, the addition of lime (XpH) was the main factor affecting the reduction of conductivity for both flocculants (Annex 8.13, Table 58). As a greater amount of lime was added, Mg(OH)2 precipitated (pH ≥ 10) in addition to CaCO3 (pH ≥ 9.5), thus more Ca2+ and Mg2+ ions were removed from the water, decreasing conductivity. Softening also affected very positively (quadratic term in equations) the reduction of A350 for both flocculants, A310 for the aPAM, and A254 with cPAM. When flocculant was added without lime, the FBRM probe detected significant differences in the number of counts from when a previous soften step was performed (Figures 66a-b). While the

New technologies or innovative treatment lines for reliable water treatment for P&P and minimization of waste production
VEO,PTS, ENV, UCM, HOL, WED, January 2012
Page | 106
number of particles decreased as aPAM was added; no effect was observed in the distribution of particles when cPAM was used without lime (Figure 66a).
Time (min)
0 1 2 3 4 5 6 7 8 9 10 11
nº c
ou
nts
/s
0
5000
10000
15000
20000
25000
30000 2000-WL-3a
2000-WL-7a3000-WL-3a
3000-WL-7a
2000-WL-3c 2000-WL-7c
3000-WL-3c 3000-WL-7c
Flocculant
WL: Without limea: anionic flocculantb: cationic flocculant
Coagulant
Time (min)
0 1 2 3 4 5 6 7 8 9 10 11
nº c
ou
nts
/s
0
5000
10000
15000
20000
25000
30000
35000
3 mg/L aPAM
7 mg/L aPAM 3 mg/L cPAM
7 mg/L cPAM
Flocculant
Lime
Coagulant
(a) (b)
Figure 66: (a) Evolution of the number of counts in time when PACl1 (2000 and 3000 mg/L) and PAMs (anionic or cationic, 3 and 7 mg/L) are added without lime; (b) Evolution of the number of counts in time when 3000 mg/L PACl1 and PAMs (anionic or cationic, 3 and 7 mg/L) are added
after the lime at pH = 10.5.
When lime was added, more particles were detected in the solution (Figure 66b), as CaCO3 and Mg(OH)2 precipitates were formed. When a constant number of particles was achieved, the flocculent was added. No significant effect on the number of particles was observed after the addition of both flocculants when lime was previously added. Ca2+ and Mg2+ ions are removed from the water with lime, so there are no intermediates in the solution to form bridges between slightly negative particles formed by PACl and DCM, and the aPAM, driving its addition ineffective. Furthermore, although it could be thought that cPAM is able to flocculate the new aggregates, it begins to hydrolyze when pH gets to 8.5, and thus becomes ineffective as well. This hydrolysis process does not only result in the loss of cationic sites, but also in a change in the conformation of the chain structure because the appearance of carboxylic groups reduces the length of the polymer (Bolto, 2007). When 2500 mg/L of PACl1 were combined with 5 mg/L of aPAM without lime addition (0.0-1), COD removal improved a 10% (from 30% up to 40%) in relation to adding only coagulant; However, if the coagulant was combined with the same amount of cPAM, the percentage decreased 10%. If 2500 mg/L of PACl1 were added with lime, independently of the pH (9.5 or 10.5) and the dosage of aPAM, a 60% of COD removal was achieved. The same trend was observed with cPAM addition, whereas 50% of COD removal was obtained.
c) Conclusion
Most important findings derived from the application of coagulation/softening/flocculation treatment to RO concentrates from PM3 are:
• The coagulation treatment with PACl1 efficiently removed refractory COD, particularly coloured compounds with a high level of resonance. In fact, A500 was reduced more than 95% with the addition of 10 g/L of PACl1. The main drawbacks of this treatment were that conductivity increased as more coagulant was added, and that the high doses of coagulant that are required to achieve dCOD reductions higher than 60% would make the process economically unfeasible.

New technologies or innovative treatment lines for reliable water treatment for P&P and minimization of waste production
VEO,PTS, ENV, UCM, HOL, WED, January 2012
Page | 107
• Lime-softening resulted to be a good alternative to reduce conductivity, as Ca2+ and Mg2+ were removed from the water through the precipitation of CaCO3 (pH ≥ 9.5) and Mg(OH)2 (pH ≥ 10.0). As these precipitates are formed, organic matter could be adsorbed on their surface and, thus, additionally removed by the precipitation process.
• aPAM resulted to be the best option to aid coagulation with PACl1 when no lime was added, because Ca2+ and Mg2+ ions that are present in the medium yielding a high water hardness, bridge slightly negative aggregates that PACl1 have formed previously. On the other hand, these cations affected cPAM performance, driving its addition inefficient when no lime was used.
• When flocculants were combined with previous coagulation and lime-softening steps, no additional effect was observed on the reduction of dCOD, conductivity and absorbances at different wave lengths; which is explained by the efficient removal of Ca2+ and Mg2+ from the solution, and the high pH value at which the treatment was performed.
• If 2500 mg/L of PACl1 are added with lime, independently of the pH (9.5 or 10.5) and the dosage of aPAM, a 60% of COD removal can be achieved.
3.2.2.3.3 Application of AOPs to RO concentrates
a) Ozone treatment
COD removal in retentate wastewater obtained with ozonation and ozonation with hydrogen peroxide is showed in Figures 67-68. Figure 67 shows COD removal versus consumed ozone dose during the treatment and Figure 68 shows COD removal versus time of experiment. COD removal achieved was 43% in ozone treatment and 55% in ozonation combined with hydrogen peroxide.
O3 (g/L)
0,0 0,3 0,6 0,9 1,2 1,5 1,8 2,1 2,4 2,7 3,0
% C
OD
rem
oval
0
20
40
60
80
100
O3
O3+H2O2
Time (min)
0 20 40 60 80 100 120 140 160 180
% C
OD
rem
ova
l
0
20
40
60
80
100
O3
O3 + H2O2
Figure 67: COD removal versus consumed ozone dose during ozonation
Figure 68: COD removal versus time of experiment
Efficiency of the process and the reaction time necessary to achieve the required ozone dose in the water depend on controlled laboratory values as the concentration of ozone in the inlet gas and the reaction time employed. Ozone consumption will be modified during the process due to continuous reaction with organic and inorganic compounds. Primarily, more easily oxidized compounds are oxidized and, as result, refractory organic compounds are formed along the reaction (Fontanier, 2005).
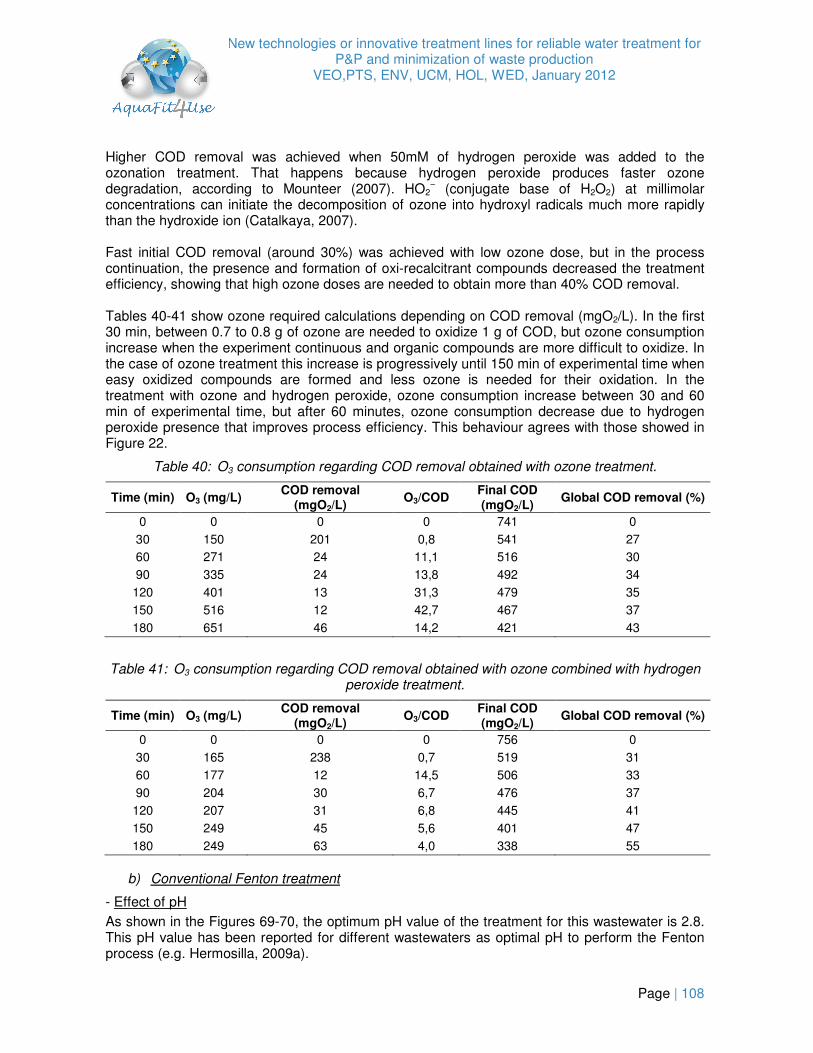
New technologies or innovative treatment lines for reliable water treatment for P&P and minimization of waste production
VEO,PTS, ENV, UCM, HOL, WED, January 2012
Page | 108
Higher COD removal was achieved when 50mM of hydrogen peroxide was added to the ozonation treatment. That happens because hydrogen peroxide produces faster ozone degradation, according to Mounteer (2007). HO2
− (conjugate base of H2O2) at millimolar concentrations can initiate the decomposition of ozone into hydroxyl radicals much more rapidly than the hydroxide ion (Catalkaya, 2007). Fast initial COD removal (around 30%) was achieved with low ozone dose, but in the process continuation, the presence and formation of oxi-recalcitrant compounds decreased the treatment efficiency, showing that high ozone doses are needed to obtain more than 40% COD removal. Tables 40-41 show ozone required calculations depending on COD removal (mgO2/L). In the first 30 min, between 0.7 to 0.8 g of ozone are needed to oxidize 1 g of COD, but ozone consumption increase when the experiment continuous and organic compounds are more difficult to oxidize. In the case of ozone treatment this increase is progressively until 150 min of experimental time when easy oxidized compounds are formed and less ozone is needed for their oxidation. In the treatment with ozone and hydrogen peroxide, ozone consumption increase between 30 and 60 min of experimental time, but after 60 minutes, ozone consumption decrease due to hydrogen peroxide presence that improves process efficiency. This behaviour agrees with those showed in Figure 22.
Table 40: O3 consumption regarding COD removal obtained with ozone treatment.
Time (min) O3 (mg/L) COD removal
(mgO2/L) O3/COD
Final COD (mgO2/L)
Global COD removal (%)
0 0 0 0 741 0
30 150 201 0,8 541 27 60 271 24 11,1 516 30
90 335 24 13,8 492 34
120 401 13 31,3 479 35
150 516 12 42,7 467 37
180 651 46 14,2 421 43
Table 41: O3 consumption regarding COD removal obtained with ozone combined with hydrogen peroxide treatment.
Time (min) O3 (mg/L) COD removal
(mgO2/L) O3/COD
Final COD (mgO2/L)
Global COD removal (%)
0 0 0 0 756 0
30 165 238 0,7 519 31
60 177 12 14,5 506 33
90 204 30 6,7 476 37
120 207 31 6,8 445 41
150 249 45 5,6 401 47
180 249 63 4,0 338 55
b) Conventional Fenton treatment
- Effect of pH
As shown in the Figures 69-70, the optimum pH value of the treatment for this wastewater is 2.8. This pH value has been reported for different wastewaters as optimal pH to perform the Fenton process (e.g. Hermosilla, 2009a).

New technologies or innovative treatment lines for reliable water treatment for P&P and minimization of waste production
VEO,PTS, ENV, UCM, HOL, WED, January 2012
Page | 109
% C
OD
re
mo
va
l
% C
OD
re
mo
va
l
Figure 69: Influence of [H2O2]/COD0 and pH on COD removal
Figure 70: Influence of [H2O2]/[Fe2+
] and [H2O2]/COD0 on COD removal
It is important to consider that working at basic pH could avoid pH control. It usually implies an increase of treatment cost and conductivity, in pulp and paper industries (Catalkaya, 2007). Moreover, it is necessary to conform to the limits of effluent conductivity imposed by the legislation. They may be a limiting step for the treatment of reverse osmosis retentates. The pH of the effluents from recovered newsprint paper mills working with neutral deinking is close to 7. In this particular case, reasonable COD removal (60-70%) could be obtained at initial neutral pH, avoiding the use of chemicals for pH control.
- Effect of chemical reagents
Chemical reagents are major operational cost items for many wastewater treatment facilities; therefore, their optimization is of relevance for industrial treatments. Reagents dosage requirement was assessed in terms of relation between COD and [H2O2] and the molar ratio between [H2O2] and [Fe2+].
Figure 70 shows the effect of the reagents concentration ratio ([H2O2]/[Fe2+]) on COD removal. Results were in good agreement with those reported by other authors for different wastewaters (e.g. Hermosilla, 2009a). A [H2O2]/[Fe2+]=1.5 provided the best operation conditions. The stoichiometric ratio between Fe2+ and H2O2 for the formation of hydroxyl radicals in Fenton process is 1 (equation 3), although some amount of hydrogen peroxide is lost in parallel reactions reducing its efficiency. On the other hand, if the ratio between [H2O2] and [Fe2+] is more than 2, part of the hydrogen peroxide efficiency is lost for the reduction of ferric ion and in parallel reactions.
The optimization of the hydrogen peroxide concentration versus COD is shown in Figure 69. At the stoichiometric ratio with respect to COD proposed by Kim (1997), that is: 1 g COD = 1 g O2 = 0.03125 mol O2 = 0.0625 mol H2O2 = 2.125 g H2O2 �COD (mg/L) x 2.125 = mg H2O2/L, good COD removal efficiencies can be obtained, although better efficiencies are achieved when hydrogen peroxide is more than three times the COD. At more than 4.5 times no additional efficiency is obtained, that is around 90% (Figure 69).

New technologies or innovative treatment lines for reliable water treatment for P&P and minimization of waste production
VEO,PTS, ENV, UCM, HOL, WED, January 2012
Page | 110
c) Photo-irradiation process
- Iron catalyzed The combination of Fenton method with ultraviolet irradiation could remove organic matter recalcitrant to Fenton process, such as acetic acids and other fatty organic acids, and organic-iron complexes (Hermosilla, 2009b). The results obtained show that with the addition of ultraviolet irradiation a 100% of COD removal could be obtained at the optimum conditions, that is [H2O2]/[Fe2+] ≥15, concentration of H2O2 more than three times the COD, and pH of 2.8. In photo-Fenton process pH is a more critical factor than in conventional Fenton (Figures 71-72). The highest efficiency of photo-Fenton is produced for the possibility of treatment of organics that cannot be treated without UV light, and it is associated to lesser iron concentration, which reduces the turbidity. Therefore, the progression of the reaction is permitted by the photo-regeneration of iron and the breakage of the iron complexes (Hermosilla, 2009a). If the reactor is irradiated with UV light, as the [H2O2]/[Fe2+] increases, the turbidity associated to iron decreases, and the UV light transmission increases; therefore the photo-reduction of Fe3+ to Fe2+ that is strongly dependent on the intensity of the radiation and the speciation of ferric iron (Kim, 1997), is favoured. This mechanism reduces the velocity of the reaction, and the continuous total removal of organics avoids the natural pH control of the reaction (Figure 71), lowering the efficiency using the lower amount of iron of photo-Fenton process at higher pH in comparison with conventional Fenton.
% C
OD
re
mo
va
l
% C
OD
re
mo
va
l
Figure 71: Influence of [H2O2]/[Fe2+
] and [H2O2]/COD0 on COD removal at pH = 2.8
Figure 72: Influence of pH and [H2O2]/COD0 on COD removal in photo-Fenton treatment
Furthermore, less concentration of H2O2 is needed for the optimization of the treatment versus conventional Fenton ([H2O2] > 4xCOD) due to the photo-reduction of Fe3+ to Fe2+ that implies a quicker evolution of the Fenton reaction (Hermosilla, 2009b). In conventional Fenton the availability of ferrous iron becomes the main rate-limiting step in the process as the reduction (regeneration) of ferric to ferrous forms is slower than the consumption of ferrous iron (Hermosilla, 2009b; Pignatello, 2006). Therefore, more hydrogen peroxide is necessary in conventional Fenton compared to photo-Fenton for reaching the same concentration of hydroxyl radicals. - TiO2 catalyzed
The efficiency of the process is influenced by the dosage of TiO2, as shown in Figure 73 (Chang, 2004; Tanaka, 1999). The degradation of organics is improved until an excessive catalyst dosage

New technologies or innovative treatment lines for reliable water treatment for P&P and minimization of waste production
VEO,PTS, ENV, UCM, HOL, WED, January 2012
Page | 111
causes a shadow effect, interfering with the transmission of UV light, so that the generation of electron–hole pairs cannot effectively occur (Catalkaya, 2008; Chang, 2004). The results are according to the ones obtained by other authors, e.g. Chang (2004) that found an optimum dosage of 10 g•L-1 TiO2 for the treatment of lignin powder. TiO2 catalyzed Fenton treatment is less oxidative than the Fenton processes tested before, as it can be seen when the redox potentials are measured along the reaction (Figure 74) and in the final values of COD removals obtained. These results are in accordance with the results obtained by Amat (2005) that reported that COD removal in the treatment of effluents from board industry was lower than when applying a solar photo-Fenton treatment and that the degradation of organics was mainly focussed towards pollutants more reluctant to biological degradation. Moreover, different authors like Yeber (2000) found that biodegradability is greatly enhanced and photocatalytic systems may be an interesting pre-oxidation step preceding biological treatment. In fact, Yeber (2000) showed that the relative quantity of HMW compounds decreased considerably (more than 30%) forming more LMW species.
g/L TiO2
1 5 10
% R
em
ova
l
0
10
20
30
40
50
% COD rem
% TOC rem
Photocatalysis, O3 and O3/H2O2 time (min)
0 50 100 150 200
Redox p
ote
ntial (R
mV
)
-100
0
100
200
300
400
500
600
Fenton and photo-Fenton time (min)
0 5 10 15 20
Photocatalysis
Fenton
Photo-Fenton
Ozone
Figure 73: COD and TOC removal at different TiO2 doses
Figure 74: Redox evolution during reaction time of treatments
As the COD and TOC removals of this treatment are really low (Figure 73), the legislation limits for disposing the retentates may be not accomplished. Therefore, this treatment has also been tested in terms of biodegradability improvement. As shown in Figure 75, the biodegradability is improved and the values are closed to ethylene glycol levels if 10 g•L-1 of TiO2 are used. The COD values obtained after the combination of treatments will permit the final disposal.

New technologies or innovative treatment lines for reliable water treatment for P&P and minimization of waste production
VEO,PTS, ENV, UCM, HOL, WED, January 2012
Page | 112
Day
0 5 10 15 20 25 30
% B
iod
eg
rad
ab
ilit
y
0
20
40
60
80
100
Ethylene Glycol
[TiO2]=10g/L
[TiO2]=5g/L
[TiO2]=1g/L
RO Concentrate
Figure 75: Biodegradability test applied to concentrates treated with photocatalysis
d) Conclusion on AOPs
Most important findings derived from the application of AOPs to RO concentrates from PM3 are: • High removals of COD and absorbance at 254 removal were obtained � photo-Fenton at
the best conditions gave the best results followed by Fenton and ozone. • Response surface methodology was used to optimize Fenton and photo-Fenton processes
� low pH and high [H2O2] resulted the optimal conditions for both methods. In Fenton, better results were obtained with average Fe2SO4 concentrations while photo-Fenton shows better efficiencies with low Fe2SO4 concentrations.
• In photocatalysis minor efficiency to remove COD and TOC from RO reject was obtained. 10 g/L of TiO2 gave the highest improvement of biodegradability of the wastewater. Hence, it is possible to recirculate it to the biological systems after oxidation treatment.
• In ozonation the initial tendency suggested first order kinetics, while onward tendency suggested second order kinetics. Compounds present in RO concentrates from PM3 show decomposition by ozonation in two stages due to the generation of intermediates that are more resistant to ozone attack, like carboxylic acids; although they are usually highly biodegradable.
3.2.2.3.4 Electrodialysis followed by re-injection of concentrates
Electrodialysis was finally tested as a salt draining technology for reducing salts accumulation and then re-injection of the desalinated concentrates upstream biological processes. Tests were done on RO concentrates from Pilot plant 2 (Aanerobic � MBR � RO). Results showed that electrodialysis isn’t adapted to separate the salts from organic matter in the RO concentrates (see Annex 8.9). Scaling of the electrodialysis membranes was observed during the desalination test. (Details on experiments can be found in report I3.1.1.4 “Assessment of technologies for the elimination of inorganic compounds for P&P”, Mauchauffée, S., Denieul, M.-P, 2010).
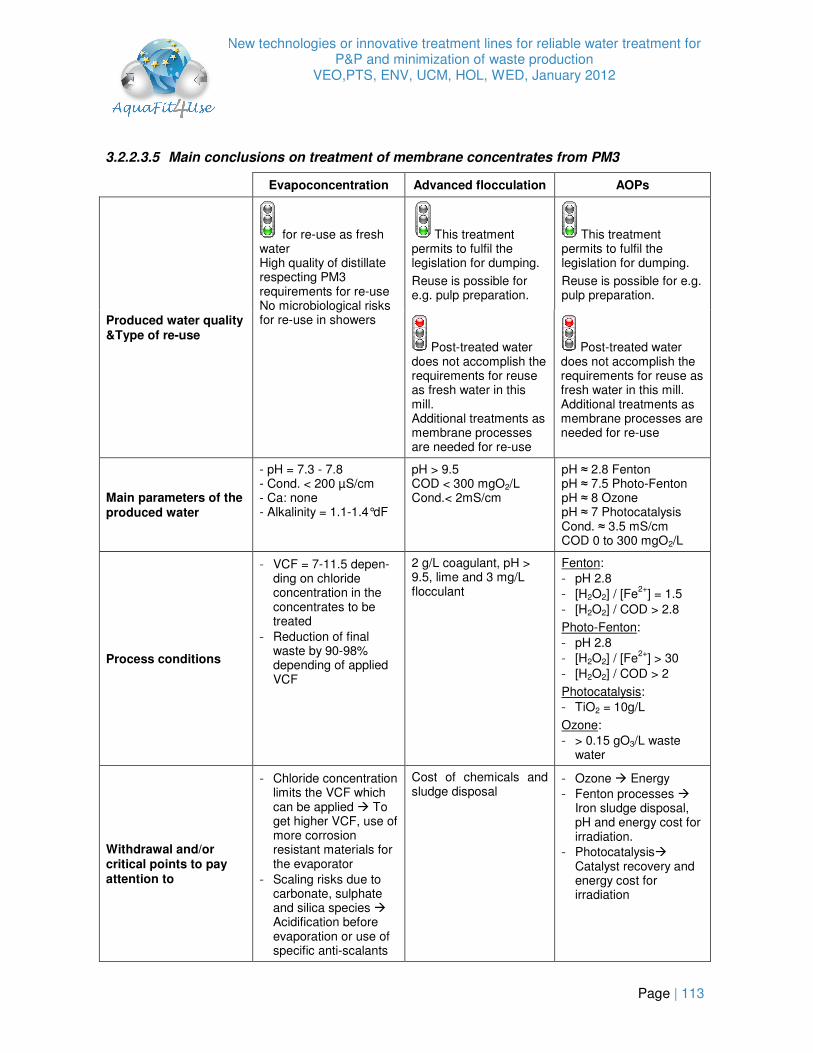
New technologies or innovative treatment lines for reliable water treatment for P&P and minimization of waste production
VEO,PTS, ENV, UCM, HOL, WED, January 2012
Page | 113
3.2.2.3.5 Main conclusions on treatment of membrane concentrates from PM3
Evapoconcentration Advanced flocculation AOPs
Produced water quality &Type of re-use
for re-use as fresh water High quality of distillate respecting PM3 requirements for re-use No microbiological risks for re-use in showers
This treatment permits to fulfil the legislation for dumping.
Reuse is possible for e.g. pulp preparation.
This treatment permits to fulfil the legislation for dumping.
Reuse is possible for e.g. pulp preparation.
Post-treated water does not accomplish the requirements for reuse as fresh water in this mill. Additional treatments as membrane processes are needed for re-use
Post-treated water does not accomplish the requirements for reuse as fresh water in this mill. Additional treatments as membrane processes are needed for re-use
Main parameters of the produced water
- pH = 7.3 - 7.8 - Cond. < 200 µS/cm - Ca: none - Alkalinity = 1.1-1.4°dF
pH > 9.5 COD < 300 mgO2/L Cond.< 2mS/cm
pH ≈ 2.8 Fenton pH ≈ 7.5 Photo-Fenton pH ≈ 8 Ozone pH ≈ 7 Photocatalysis Cond. ≈ 3.5 mS/cm COD 0 to 300 mgO2/L
Process conditions
- VCF = 7-11.5 depen-ding on chloride concentration in the concentrates to be treated
- Reduction of final waste by 90-98% depending of applied VCF
2 g/L coagulant, pH > 9.5, lime and 3 mg/L flocculant
Fenton: - pH 2.8 - [H2O2] / [Fe2+] = 1.5 - [H2O2] / COD > 2.8
Photo-Fenton: - pH 2.8 - [H2O2] / [Fe2+] > 30 - [H2O2] / COD > 2
Photocatalysis: - TiO2 = 10g/L
Ozone: - > 0.15 gO3/L waste
water
Withdrawal and/or critical points to pay attention to
- Chloride concentration limits the VCF which can be applied � To get higher VCF, use of more corrosion resistant materials for the evaporator
- Scaling risks due to carbonate, sulphate and silica species � Acidification before evaporation or use of specific anti-scalants
Cost of chemicals and sludge disposal
- Ozone � Energy - Fenton processes �
Iron sludge disposal, pH and energy cost for irradiation.
- Photocatalysis� Catalyst recovery and energy cost for irradiation

New technologies or innovative treatment lines for reliable water treatment for P&P and minimization of waste production
VEO,PTS, ENV, UCM, HOL, WED, January 2012
Page | 114
Finally, electrodialysis isn’t adapted to separate the salts from organic matter in the RO concentrates.
3.2.2.4 Main conclusions on PM3 treatment trains
Most important findings derived from treatment of PM3 effluent are: • Although AOP treatments are efficient for bio-recalcitrant organics removal, due to the
high amount of volatile fatty acids that are difficult to oxidize and consume high amounts of OH·, in the effluent of PM3 a previous biological treatment could be more reliable. Anyway, during the treatment of PM3 by AOPs colour removal was higher than 95% and COD removals vary between 20 to 40%. In addition, AOPs processes improve biodegradability of the treated effluent.
• Anaerobic pre-treatment showed very good performance treating a low organic load wastewater as the effluent of a 100% recycled NP/LWC paper mill, and assisting the aerobic stage on removing organics and sulphates; besides it produced enough biogas for being considered as cost-effective.
• The biological treatments studied in the two pilot plants achieved a final COD, BOD5 and sulphates removal of 80-85%, 95-99% and 25-35%, respectively. Wastewater quality after biological treatment resulted suitable to further perform a posterior membrane treatment
• Membrane treatment were able to generate permeates of high water quality, fulfilling all the requirements for being used in critical points of the paper machine that require a very high water quality.
• 3FM filtration followed by acidification seemed to have a positive on membrane treatment. A higher recovery rate was obtained and a permeate with a very good quality was obtained. These results would have to be confirmed at pilot scale as the RO process was performed on a membrane test cell.
Most important findings derived from the application of evapoconcentration, coagulation / softening / flocculation and AOPs to the treatment of RO concentrates from PM3 are:
• Evapoconcentration proved to be an adapted technology to treat membrane concentrates of both tested treatment trains (Anaerobic � Aerobic � 3FM � RO and Anaerobic � MBR � RO). In both cases the produced water (final VCF = 11.5-11.7) has a very good quality respecting all PM3 requirements for re-use as fresh water. Considering the VCF of the RO step, the addition of evapoconcentration would then lead to a final waste to be disposed off representing respectively 2.8% and 7% in volume of the waste water treated by the global treatment line.
• Coagulation eliminated more than 95% of coloured compounds with a high level of resonance (A500), however, high coagulant doses were needed, making the process economically unfeasible. Besides, PACl addition by itself increases conductivity.
• Lime-softening was a good alternative to reduce conductivity. Organic matter was adsorbed on Mg(OH)2 and CaCO3 surface and, thus, additionally removed in the precipitation process.
• Coagulating water with 2500 mg/L of PACl1 in the presence of lime and aPAM produces a 60% COD removal, independently of the pH and the dosage.
• Fenton and photo-Fenton processes were optimised by response surface methodology. Low pH and high [H2O2] were optimum conditions for both methods. Low ferrous ion concentration might achieve good COD removals with photo-Fenton process and Fenton process need higher ferrous ion concentrations. More than 50% of COD removal may be obtained at neutral pH.

New technologies or innovative treatment lines for reliable water treatment for P&P and minimization of waste production
VEO,PTS, ENV, UCM, HOL, WED, January 2012
Page | 115
• AOPs led to a high removal of COD. Photo-Fenton obtained the best COD removal (99%) followed by Fenton (90%) and ozone (40%). Photo-Fenton and solar photo-Fenton may be evaluated for an application at industrial scale.
• Photocatalysis did not obtain so high COD and TOC removals from RO reject, but the combination of photocatalysis treatment (10 g/L of TiO2) with biological treatments got a total removal of COD from the wastewater.
Based on these results, following treatment trains have been selected to be tested on site at pilot scale within WP5.1.4 in PM3:
SCREENER LAMELLA
CLARIFIER
PRE-ACIDIFICATION
TANK
ANAEROBIC
REACTOR
AEROBIC
REACTOR
LAMELLA
CLARIFIER
ULTRAFILTRATION REVERSE
OSMOSIS
Sludge
Biogas
Nutrients
Backwash
NaOH/HCl
PermeateWastewater
from DAFs
Figure 76: Pilot plant 1.
Figure 77: Pilot plant 2.
(Note: Due to pilot time schedule for pilot trials, it hasn’t been possible to test evapoconcentration at pilot scale. Moreover, without a solution to reduce the silica content of PM3 effluent which induces low recovery rates on the RO process, it isn’t appropriate to apply evapoconcentration as the volumes of concentrates are then much too high.)
New technologies or innovative treatment lines for reliable water treatment for P&P and minimization of waste production
VEO,PTS, ENV, UCM, HOL, WED, January 2012
Page | 116
4 Conclusions
4.1 Major achievements
4.1.1 Corrugated board paper mills (PM1 and PM2)
Most important findings are:
• Stable MBR operation is not possible at calcium concentrations > 400 mg/l. Softening upstream of the MBR is than absolutely necessary. Trials with a lime softening stage showed a removal of 50 – 80 % of the Ca2+.
• Ozone trials with pre-filtered final effluent of both mills led to a COD reduction by about 20- 25%. Economical viable specific ozone dosages of 0.25 to 0.7 g O3/g COD0 have been used. The increased BOD5 shows that a subsequent biological treatment can be promising for further COD reduction. The water can be reused in the production process, especially because the water after ozone treatment is visibly colour-free. Possible reuses processes are showers at the paper machine were it can be used instead of fresh water. Calcium concentrations may be a limiting factor for reuse.
• NF membranes with high retention capacity for monovalent ions (Dow Filmtec NF 90 and Koch TFC ULP) are able to fulfil quality requirements for white grade paper reclamation water (for PM1 and PM2).
• Intensive pre-treatment or conditioning is needed to obtain steady NF membrane performance and high recovery rates due to the high scaling tendency (membrane blocking) of aerobic effluents of both PMs. Reduction of pH to around pH 6.5 (HCl) and dosing of antiscalant was necessary to achieve recovery rates of 80%. Softening of wastewater allowed higher recovery up to 93% and lower chemical consumption for conditioning (no use of hydrochloric acid). In this view, the MultifloTM softening technology (lime softening) is well adapted to remove calcium carbonate. Long term stability of membrane treatment (plateau formation, high system recovery) needs to be evaluated on pilot scale continuously.
• 3FM technology showed good performances at lab scale regarding TSS removal and turbidity reduction. These have to be confirmed at pilot scale.
Most important findings concerning the treatment of concentrates of PM1 and PM2 are: • Evapoconcentration proved to be an adapted technology to treat NF concentrates in terms
of production of a colourless water with a quality fulfilling the water quality criteria of both paper mills for re-use and to reduce the final volume of concentrates:
o Reduction of wastes as a global volumic concentration factor VCF up to 50 for combined “NF+evapoconcentration” could be obtained at lab scale for PM2 and 25 for PM1. These global VCFs should be increased at industrial scale to 60 without NF membrane pre-treatment and up to 250 with 3FM/softening as pre-treatment provided conversion rate on NF process and pre-treatment processes are the same at pilot scale. Then the addition of evapoconcentration would lead to a final concentrate to be disposed off representing respectively 1.7% to 0.4% in the last case in volume of the waste water treated by the global treatment line.
o Pre-treatments before NF process have a positive impact on the global VCF which could be reached at industrial scale leading to a very substantial reduction of the

New technologies or innovative treatment lines for reliable water treatment for P&P and minimization of waste production
VEO,PTS, ENV, UCM, HOL, WED, January 2012
Page | 117
volume of final waste to be disposed off down to 0.4% in the case of 3FM combined with softening as pre-treatment.
• AOP treatment: High conductivity and chloride concentrations > 4,000 mg/l prevented biological degradation after AOP treatment. To reduce chloride intake to the wastewater, softening before membrane processes is preferable to acidification with HCl.
• Re-injection of NF concentrates has a negative impact on anaerobic degradation rate in pellet sludge reactors.
Based on these results, following treatment trains have been selected to be tested on site at pilot scale within WP5.1.4:
Impact of reinjection???
Water to bere-used ?
Final waste
Water to bere-used ?
Water to bere-used ?
NF
PM2 AnaerobicMultiflo
softening
AOP (O3)
AOP (O3)
Evapo
MBR
Water to bere-used ?
Can berecycled into
Anaerobic ???
Final waste
Water to bere-used ?
NF
PM2 Anaerobic Aerobic
AOP (O3)
AOP (O3)
Evapo
3FM
Multiflosoftening
Water to bere-used ?
Impact of reinjection???
Water to bere-used ?
Final waste
Water to bere-used ?
Water to bere-used ?
NFNFNF
PM2PM2 AnaerobicAnaerobicMultiflo
softeningMultiflo
softening
AOP (O3)AOP (O3)
AOP (O3)AOP (O3)
EvapoEvapo
MBRMBR
Water to bere-used ?
Can berecycled into
Anaerobic ???
Final waste
Water to bere-used ?
NFNF
PM2PM2 AnaerobicAnaerobic AerobicAerobic
AOP (O3)
AOP (O3)AOP (O3)
EvapoEvapo
3FM3FM
MultiflosofteningMultiflo
softening
Water to bere-used ?
4.1.2 Newsprint paper mill (PM3)
Most important findings derived from PM3 effluent treatment are: • AOP treatments are efficient for bio-recalcitrant organics removal. Although, due to the
high amount of volatile fatty acids in the PM3 effluent a previous biological treatment could be more reliable. Colour removal was higher than 95% and COD removals vary between 20 to 40%. AOPs processes improve biodegradability of the treated effluent.
• Anaerobic pre-treatment showed very good performance treating a low organic load wastewater as the effluent of a 100% recycled NP/LWC paper mill, and assisting the aerobic stage on removing organics and sulphates; besides it produced enough biogas for being considered as cost-effective.

New technologies or innovative treatment lines for reliable water treatment for P&P and minimization of waste production
VEO,PTS, ENV, UCM, HOL, WED, January 2012
Page | 118
• The biological treatments studied in the two pilot plants achieved a final COD, BOD5 and sulphates removal of 80-85%, 95-99% and 25-35%, respectively. Wastewater quality after biological treatment resulted suitable to further perform a posterior membrane treatment
• Membrane treatment were able to generate permeates of high water quality, fulfilling all the requirements for being used in critical points of the paper machine that require a very high water quality.
• 3FM filtration followed by acidification seemed to have a positive effect on membrane treatment. A higher recovery rate was obtained and a permeate with a very good quality was obtained. These results would have to be confirmed at pilot scale as the RO process was performed on a membrane test cell.
Most important findings derived from the application of evapoconcentration, coagulation / softening / flocculation treatment and AOPs to the treatment of RO concentrates from PM3 are:
• Evapoconcentration proved to be an adapted technology to treat membrane concentrates of both tested treatment trains (Anaerobic � Aerobic � 3FM � RO and Anaerobic � MBR � RO). In both cases the produced water (final VCF = 11.5-11.7) has a very good quality respecting all PM3 requirements for re-use as fresh water. Considering the VCF of the RO step, the addition of evapoconcentration would then lead to a final waste to be disposed off representing respectively 2.8% and 7% in volume of the waste water treated by the global treatment line.
• Coagulation eliminated more than 95% of coloured compounds with a high level of resonance (A500), however, high coagulant doses were needed, making the process economically unfeasible. Besides, PACl addition by itself increases conductivity.
• Lime-softening was a good alternative to reduce conductivity. Organic matter was adsorbed on Mg(OH)2 and CaCO3 surface and, thus, additionally removed in the precipitation process.
• Coagulating water with 2500 mg/L of PACl1 in the presence of lime and aPAM produces a 60% COD removal, independently of the pH and the dosage.
• Fenton and photo-Fenton processes were optimised by response surface methodology. Low pH and high [H2O2] were optimum conditions for both methods. Low ferrous ion concentration might achieve good COD removals with photo-Fenton process and Fenton process need higher ferrous ion concentrations. More than 50% of COD removal may be obtained at neutral pH.
• AOPs led to a high removal of COD at laboratory scale. Photo-Fenton obtained the best COD removal (99%) followed by Fenton (90%) processes in comparison to the 40% achieved by ozone processes.
• Photocatalysis did not obtain so high COD and TOC removals from RO reject, but the combination of photocatalysis treatment (10 g/L of TiO2) with biological treatments got a total removal of COD from the wastewater.
Based on these results, following treatment trains have been selected to be tested on site at pilot scale within WP5.1.4 in PM3:

New technologies or innovative treatment lines for reliable water treatment for P&P and minimization of waste production
VEO,PTS, ENV, UCM, HOL, WED, January 2012
Page | 119
SCREENER LAMELLA
CLARIFIER
PRE-ACIDIFICATION
TANK
ANAEROBIC
REACTOR
AEROBIC
REACTOR
LAMELLA
CLARIFIER
ULTRAFILTRATION REVERSE
OSMOSIS
Sludge
Biogas
Nutrients
Backwash
NaOH/HCl
PermeateWastewater
from DAFs
Figure 78: Pilot plant 1.
Figure 79: Pilot plant 2.
(Note: Due to pilot time schedule for pilot trials, evapoconcentration and 3FM filtration weren’t selected to be tested at pilot scale. Moreover, without a solution to reduce the silica content of PM3 effluent which induces low recovery rates on the RO process, it isn’t appropriate to apply evapoconcentration as the volumes of concentrates are then much too high.)
4.2 Future work
4.2.1 Within AquaFit4Use
• SP5 trials; • Optimization of softening will be a major issue at pilot scale, especially when it comes
before the MBR process. • Reliability of the treatment trains depending of the variations of the influents quality � can
the quality of the produced water be continuously maintained? • Silica reduction studies as it is a main issue for re-use � reduction of recovery for RO
treatment and scaling in UF treatment. Coagulation led to enough silica removal but it implies a high dosage and thus high costs. Therefore more alternatives have been tested during this project.

New technologies or innovative treatment lines for reliable water treatment for P&P and minimization of waste production
VEO,PTS, ENV, UCM, HOL, WED, January 2012
Page | 120
4.2.2 General recommendations
• The chloride concentration in the wastewater and water circuits have shown to be a bottleneck when NF or RO technologies are used for water reclamation. Sound concepts for reducing the chloride intake in the paper making process should be studied and elaborated in the next years.
• Silica is one of the main problems for newsprints paper mills trying to reuse water by membrane processes. Silica produces irreversible fouling in reverse osmosis membranes. Coagulation obtained enough silica removal but it implies a high dosage and cost. Therefore more alternatives have been tested during this project.
• Hardness components (Calcium, Magnesium) have shown to be a major obstacle in applying sound strategies for membrane treatment and recycling of paper mill effluents. In corrugated board mills Ca2+ is mainly introduced to the production process via raw materials and auxiliary agents (e.g. fillers, coating pigments). In order to reach optimum results in water loop closure, the intake of hardness components and their release to the effluent waters has to be studied in more detail.
• Reduction of energy, chemicals (availability, costs…) consumption in treatment processes � thinking more in terms of process scale up

New technologies or innovative treatment lines for reliable water treatment for P&P and minimization of waste production
VEO,PTS, ENV, UCM, HOL, WED, January 2012
Page | 121
5 Literature Acero J., Von Gunten U. (2001). Characterization of oxidation processes: ozonation and the AOP O3/H2O2, J Am Water Works Assoc., 93, 90-100.
Ahmed,B., Mohamed H., Limem, E. Nasr, B. (2009). Degradation and Mineralization of Organic Pollutants Contained in Actual Pulp and Paper Mill Wastewaters by a UV/H2O2 Process, Ind. Eng. Chem. Res, 48, 3370-3379.
Amat, A. M., Arques, A., and Miranda, M. A. (1999). p-Coumaric acid photodegradation with solar light, using 2,4,6-triphenylpyrylium salt as photosensitizer - A comparison with other oxidation methods, Applied Catalysis B-Environmental, 23(2-3), 205-214.
Amat, A. M., Arques, A., Beneyto, H., Garcia, A., Miranda, M. A., and Segui, S. (2003). Ozonisation coupled with biological degradation for treatment of phenolic pollutants: a mechanistically based study, Chemosphere, 53(1), 79-86.
Amat, A. M., Arques, A., Lopez, F., Segui, S., and Miranda, M. A. (2004). Abatement of industrial sulfonic pollutants by ozone and UV radiation, Environmental Engineering Science, 21(4), 485-492.
Amat, A. M., Arques, A., Miranda, M. A., and Lopez, F. (2005). Use of ozone and/or UV in the treatment of effluents from board paper industry, Chemosphere, 60(8), 1111-1117.
Bailey, P. S., ed. (1982). Ozonation in Organic Chemistry: Nonolefinic Compounds, New York. Academic Press.
Balcioglu, I. A., and Cecen, F. (1999). Treatability of kraft pulp bleaching wastewater by biochemical and photocatalytic oxidation, Water Science and Technology, 40(1), 281-288.
Balcioglu, I. A., Tarlan, E., Kivilcimdan, C., Sacan, M. T. (2007). Merits of ozonation and catalytic ozonation pre-treatment in the algal treatment of pulp and paper mill effluents, Journal of Environmental Management, 85(4), 918-926.
Barbier, E., Briand, A., Robert, J., Logette, S., Coste, M., Beaudet, J.-F. and Banerjee, K. (2009). Impact of reactor design on the high rate softening process, 8th World Congress of Chemical Engineering, Montreal, August 2009.
Barbier, E., Robert, J., Coste, M., Banerjee, K., Beaudet, J-F., Cook, R.J. (2010). Advanced precipitation processes for industrial inorganic wastewaters treatment: impact of reactor design and process parameters, ECCE7, CHISA 2010, Pragues.
Ben Aim, R., Han, K.B., Woo, H.J., Marteil, P., Im, J.H., Kim, C.W., Hwanf, M.H. (2004). An innovative deep bed filter for the tertiary treatment of wastewater. World Filtration Congress, New Orleans, USA.
Bigda, R. J. (1995). Consider Fenton's chemistry for wastewater treatment, Chemical Engineering Progress, 91(12), 62-66.
Bijan, L., and Mohseni, M. (2005). Integrated ozone and biotreatment of pulp mill effluent and changes in biodegradability and molecular weight distribution of organic compounds, Water Research, 39(16), 3763-3772.
Bijan, L., and Mohseni, M. (2008). Novel membrane pretreatment to increase the efficiency of ozonation-Biooxidation, Environmental Engineering Science, 25(2), 229-237.
Blanco A., Fuente E., Negro C., Tijero J. (2002). Flocculation Monitoring: Focused Beam Reflectance Measurement as a Measurement Tool, Can. J. Chem. Eng. 80(8), 1-7.
New technologies or innovative treatment lines for reliable water treatment for P&P and minimization of waste production
VEO,PTS, ENV, UCM, HOL, WED, January 2012
Page | 122
Blanco A., Negro C., Gaspar I. and Tijero J. (1996). Slime problems in the paper and board industry. Applied Microbiology and Biotechnology 46(3), 203-208.
Bolto B., Gregory J. (2007) Organic polyelectrolytes in water treatment, Water Res. 41(11), 2301-2324.
Catalkaya, E. C., and Kargi, F. (2007). Color, TOC and AOX removals from pulp mill effluent by advanced oxidation processes: A comparative study, Journal of Hazardous Materials, 139(2), 244-253.
Catalkaya, E.C. and Kargi, F. (2008) Advanced oxidation treatment of pulp mill effluent for TOC and toxicity removals, Journal of Environmental Management, 87, 396.
Chang, C. N., Ma, Y. S., Fang, G. C., Chao, A. C., Tsai, M. C., and Sung, H. F. (2004). Decolorizing of lignin wastewater using the photochemical UV/TiO2 process, Chemosphere, 56(10), 1011-1017.
Chernicharo, C.A. (ed.) (2007). Biological Wastewater Treatment Series, Volume 4: Anaerobic reactors, London, IWA Publishing.
Cook, R. G. (2003). The Dense Sludge Process, An Advanced Physicochemical Process for the Cost-Effective Treatment of Metals-Bearing Acidic and Alkaline Wastewaters, a VWNA technical introduction and overview.
Cox, M. (2007), A guide book on the treatment of effluents from the mining/metallurgy, paper, plating and textile industries. Projet Européen GIRT-CT-2002-05097. Edited by M. Cox, P. Négré and L. Yurramendi. Inasmet Tecnalia. ISBN 84-95520-14-1.
Cox, S.J., Hanna, J, Antony, A., Negaresh, E, Richardson, D., Leslie, G. (2008). Nanofiltration as Pretreatment to Reverse Osmosis for Paper and Pulp Mill Effluent. IWA Regional Conference Membrane Technologies in Water and Waste Water Treatment; Moscow, Russia; June 2008. SIBICO International Ltd, Moscow, 2008; ISBN:978-5-9900677-8-3
De Laat, J. D., Le, G. T. and Legube, B. (2004) A comparative study of the effects of chloride, sulphate and nitrate ions on the rates of decomposition of H2O2 and organic compounds by Fe(II)/H2O2 and Fe(III)/H2O2, Chemosphere, 55, 715-723.
Demopoulos, G.P. (2009). Aqueous precipitation and crystallization for the production of particulate solids with desired properties. Hydrometallurgy, 96, 199-214.
DWA-Arbeitsgruppe IG-5.1 (2002). Praktische Empfehlungen und Hinweise für Anaerobanlagen. Korrespondenz Abwasser, Abfall, 49(12), 1708- 1714.
DWA-Arbeitsgruppe IG-5.1 (2009). Anaerobe Reaktoren und ihre Einsatzbereiche. KA Korrespondenz Abwasser, Abfall, 56(11), 1147-1152.
Esplugas, S., Gimenez, J., Contreras, S., Pascual, E., and Rodriguez, M. (2002). Comparison of different advanced oxidation processes for phenol degradation. Water Research, 36(4), 1034-1042.
Fontanier, V., Baig, S., Albet, J., and Molinier, J. (2005). Comparison of conventional and catalytic ozonation for the treatment of pulp mill wastewater, Environmental Engineering Science, 22(2), 127-137.
Fontanier, V., Farines, V., Albet, J., Baig, S., and Molinier, J. (2006). Study of catalyzed ozonation for advanced treatment of pulp and paper mill effluents. Water Research, 40(2), 303-310.
García-Ripoll, A., Amat, A.M., Arques, A., Vicente, R., Ballesteros Martín, M.M., Sánchez Pérez, J.A., Oller, I., Malato, S. (2009). Confirming Pseudomonas putida as a reliable bioassay for

New technologies or innovative treatment lines for reliable water treatment for P&P and minimization of waste production
VEO,PTS, ENV, UCM, HOL, WED, January 2012
Page | 123
demonstrating biocompatibility enhancement by solar photo--oxidative processes of a biorecalcitrant effluent, Journal of Hazardous Materials, 162, 1223-1227.
Glaze, W. H., Kang, J. W., and Chapin, D. H. (1987). The Chemistry of Water-Treatment Processes Involving Ozone, Hydrogen-Peroxide and Ultraviolet-Radiation, Ozone-Science & Engineering, 9(4), 335-352.
Gogate, P. R., and Pandit, A. B. (2004a). A review of imperative technologies for wastewater treatment I: oxidation technologies at ambient conditions, Advances in Environmental Research, 8(3-4), 501-551.
Gogate, P. R., and Pandit, A. B. (2004b). A review of imperative technologies for wastewater treatment II: hybrid methods, Advances in Environmental Research, 8(3-4), 553-597.
Gouvêa, C. A. K., Wypych, F., Moraes, S. G., Duran, N., and Peralta-Zamora, P. (2000). Semiconductor-assisted photodegradation of lignin, dye, and kraft effluent by Ag-doped ZnO. Chemosphere, 40(4), 427-432.
Guhl, W., Steber, J. (2006). The value of biodegradation screening test results for predicting the elimination of chemicals’ organic carbon in waste water treatment plants, Chemosphere, 63, 9-16.
Habets, L., Driessen, W. (2007). Anaerobic treatment of pulp and paper mill effluents - status quo and new developments, Wat. Sci. Tech. 55(6), 223-230.
Hamm, U. (2006). Environmental aspects, in Holik, H. (ed.) Handbook of Paper and Board, Weinheim, Wiley-VCH, pp. 208-218.
Harber, F., and Weiss, J. J. (1934). The catalytic decomposition of Hydrogen Peroxide by iron salts, Journal American Chemical Society, 45, 338-351.
Hermosilla, D., Cortijo, M. and Huang, C.P. (2009b). The role of iron on the degradation and mineralization of organic compounds using conventional Fenton and photo-Fenton processes. Chemical Engineering Journal, 155, 637-646.
Hermosilla, D., Cortijo, M., Huang, C.P. (2009a). Optimizing the treatment of landfill leachate by conventional Fenton and Photo-Fenton processes. Science of the Total Environment, 407, 3473-3481.
Hoigne, J., and Bader, H. (1983). Rate constants of reactions of ozone with organic and inorganic-compounds in water.1. Non-dissociating organic-compounds. Water Research, 17(2), 173-183.
Huang, C. P., Dong, C., and Tang, Z. (1993). Advanced chemical oxidation: its present role and potential future in hazardous waste treatment. Waste management, 13, 361-377.
Hynninen , P. (ed.) (2000). Papermaking Science and Technology Book 19 Environmental control, Helsinki, Fapet Oy.
Jeanmaire, J.P., Suty, H., Marteil, P., Breant, P., Pedenaud P. (2007). Application of the 3FM filter to sea water filtration, Wat. Sci. and Tech., 56(10) 157-165.
Judd, S. (2011). The MBR Book: Principles and Applications of Membrane Bioreactors for Water and Wastewater Treatment, Elsevier Science, 2nd edition.
Jung, H., Hentschke, C., Pongratz, J., Götz, B. (2009). Wasser- und Abwassersituation in der deutschen Papier- und Zellstoffindustrie - Ergebnisse der Wasserumfrage 2007. Wochenblatt für Papierfabrikation, 6-7, 280-283.

New technologies or innovative treatment lines for reliable water treatment for P&P and minimization of waste production
VEO,PTS, ENV, UCM, HOL, WED, January 2012
Page | 124
Jung H., Pauly D. (2011). Water in the Pulp and Paper Industry, in P. Wilderer (Editor), Treatise on Water Science, Vol. 1, Oxford, Academic Press, Elsevier, ISBN 978-0-444-53193-3, pp.667-684.
Kaindl, N. (2009) Upgrading an activated sludge waste water treatment plant. Presentation at the 9th IWA Symposium on forest industry wastewaters, Fredericton, Canada, June 2009.
Kavitha, V., Palanivelu, K. (2004). The role of ferrous ion in Fenton and photo-Fenton processes for the degradation of phenol, Chemosphere, 55(9), 1235-1243.
Kim, S, Geissen, S and Vogelpohl, A. (1997). Landfill leachate treatment by a photoassisted Fenton reaction. Water Sci. Technol., 35, 239-248.
Kormann, C., Bahnemann, D. W., Hoffmann, M. R. (1991). Photolysis of Chloroform and Other Organic Molecules in Aqueous TiO2 Suspensions. Environmental Science and Technology, 25, 494.
Kreetachat, T., Damrongsri, M., Punsuwon, V., Vaithanomsat, P., Chiemchaisri, C., and Chomsurin, C. (2007). Effects of ozonation process on lignin-derived compounds in pulp and paper mill effluents. Journal of Hazardous Materials, 142(1-2), 250-257.
Krichevskaya, M., Klauson, D., Portjanskaja, E. and Preis, E. (2011). The cost evaluation of Advanced Oxidation Processes in laboratory and pilot-scale experiments, Ozone: Science & Engineering, 33(3), 211-223
Lee, J.J., Cha, J.H., BenAim, R., Han, K.B., Kim, C.W (2008). Fiber filter as an alternative to the process of flocculation-sedimentation for water treatment, Desalination, 231, 323-331.
Lee, J.J., Johir, M.A.H., Chinu, K.H., Shon, H.K., Vigneswaran, S., Kandasamy, J., Kim, C.W., Shaw, K. (2009). Hybrid filtration method for pre-treatment of seawater reverse osmosis (SWRO), Desalination, 247, 15-24.
Lee, J.J., Johir, M.A.H., Chinu, K.H., Shon, H.K., Vigneswaran, S., Kandasamy, J., Kim, C.W., Shaw, K. (2010). Novel pre-treatment method for seawater reverse osmosis: Fibre media filtration, Desalination, 250, 557-561.
Lien, L., Simonis, D. (1995). Case histories of two large nanofiltration systems reclaiming effluent from pulp and paer mills for reuse. Proc. TAPPI 1995 Int. Environmental Conference. TAPPI Press, Atlanta USA, Book 2, pp. 1023 - 1027
Lin, Y.-P., Singer, P.C. (2005). Effects of seed material and solution composition on calcite precipitation, Geochimica et Cosmochimica Acta, 69(18), 4495-4504.
Mänttäri, M., Viitikko, K., Nyström, M. (2006). Nanofiltration of biologically treated effluents from the pulp and paper industry, Journal of Membrane Science, 272, 152 - 160
Masten, S. J., and Davies, S. H. R. (1994). The use of ozonation to degrade organic contaminants in wastewaters. Environ Sci Technol, 28(4), A180-A185.
Minton, P. E. (1986). Handbook of Evaporation Technology, William Andrew Publishing/Noyes.
Miranda, M. A., Amat, A. M., and Arques, A. (2001). Abatement of the major contaminants present in olive oil industry wastewaters by different oxidation methods: ozone and/or UV radiation versus solar light. Water Science and Technology, 44(5), 325-330.
Möbius, C.H. (2002). Waste water of the pulp and paper industry. 3rd Edn., Revision December 2008. Augsburg: http://www.cm-consult.de

New technologies or innovative treatment lines for reliable water treatment for P&P and minimization of waste production
VEO,PTS, ENV, UCM, HOL, WED, January 2012
Page | 125
Mounteer, A. H., Pereira, R. O., Morais, A. A., Ruas, D. B., Silveira, D. S. A., Viana, D. B., and Medeiros, R. C. (2007). Advanced oxidation of bleached eucalypt kraft pulp mill effluent. Water Science and Technology, 55(6), 109-116.
Nason, J.A. and Lawler, D.F. (2008). Particle size distribution dynamics during precipitative softening: constant solution composition, Water Research, 42(14), 3667- 3676.
Negro, C., Blanco, A., Gaspar, I., Tijero, J. (1995). El Agua en la industria papelera, Ingeneria Químíca, 27(317), 137-147.
Nyström, M., Nuortila-Jokinen, J.M.K., Mänttäri, M.J. (2005). In „Nanofiltration – Principles and Appplications”, Schäfer, a.I., Fane, A.G., Waite, T.D. (eds.), Chapt. 14 – Nanofiltration in the pulp and paper industry. Elsevier Advanced Technology, Oxford. ISBN 1-85617-405-0
OECD guidelines for the testing of chemicals (2010). Activated Sludge, Respiration Inhibition Test (Carbon and Ammonium Oxidation), 209.
Oeller, H. J., Demel, I., and Weinberger, G. (1997). Reduction in residual COD in biologically treated paper mill effluents by means of combined ozone and ozone/UV reactor stages. Water Science and Technology, 35(2-3), 269-276.
Oeller, H.-J. and Bierbaum, S. (2009). Cost savings in the Ozone treatment of paper mill effluents achieved by a closed-loop Ozone control system, Ozone: Science & Engineering, 31(6), 454-460.
Ordóñez, R., Hermosilla, D., Fuente, E., Blanco, A. (2009). Influence of water quality on the efficiency of retention aids systems for the paper industry, Ind. Eng. Chem. Res., 48, 10247–10252.
Ordóñez, R. Hermosilla, D., Merayo, N., Miranda, R., Blanco, A., Pérez, F. (2010). Internal result “I5.1.4.4 Multi-barrier processes in combination with disinfection”, AquaFit4Use project.
Pérez-Estrada, L.A., Malato, S., Agüera, A., Fernández-Alba, A.R (2007). Degradation of dipyrone and its main intermediates by solar AOPs: identification of intermediate products and toxicity assessment, Catal. Today, 129, 207-214.
Pérez-Estrada, L.A., Malato, S., Agüera, A., Fernández-Alba, A.R. (2007). Degradation of dipyrone and its main intermediates by solar AOPs: identification of intermediate products and toxicity assessment, Catal. Today, 129, 207–214.
Pignatello, J. J., Oliveros, E., and MacKay, A. (2006). Advanced oxidation processes for organic contaminant destruction based on the Fenton reaction and related chemistry. Critical Reviews in Environmental Science and Technology, 36(1), 1-84.
Pinnekamp, J. (2007). Das Membranbelebungsverfahren bei der Abwasserbehandlung - Anwendung und Perspektiven. (The membrane-bioreactor technology for wastewater treatment - Utilisation and prospects), presented at the 7th Aachener Tagung Wasser und Membranen, Aachen.
Prokop, D. (2006). Recycle synthetic fluorspar and fluoride release minimization, Achema Frankfort, Germany, 15-19 May.
Ried, A., Mielcke, J. and Kampmann, M. (2005). Ozone and Ozone/H2O2 for the degradation of hardly biodegradable COD – a solution for industrial waste waters in compliance with new limiting values. In: Proceedings VI.1.5, IOA 17th World Ozone Congress, Strasbourg, (2005).
Ried, A., Mielcke, J. and Wieland, A. (2009). The potential use of Ozone in municipal wastewater, Ozone: Science & Engineering, 31(6), 415-421.

New technologies or innovative treatment lines for reliable water treatment for P&P and minimization of waste production
VEO,PTS, ENV, UCM, HOL, WED, January 2012
Page | 126
Rodrigues, A.C., Boroski, M., Shimada, N.S., Garcia, J.C., Nozakim, J., Hioka, N. (2008). Treatment of paper pulp and paper mill wastewater by coagulation-flocculation followed by heterogeneous photocatalysis, Journal of Photochemistry and Photobiology A: Chemistry, 194, 1.
Salokannel, A., Heikkinen, J., Kumpulainen, M., Sillanpaa, M., and Turunen, J. (2007). Tertiary treatment of pulp and paper mill wastewaters by ozonation and O3/H2O2 techniques, Paperi Ja Puu-Paper and Timber, 89(6), 348-351.
Schirm, R., Paulitschek, M., Rösler, H.-W. (2002). Einsatz der Membrantechnologie in der Papierindustrie. in: Wasserkreisläufe in der Papiererzeugung, PTS, München, pp. 09-1 – 09-20
Schmidt, T., Lange, S. (2000). Treatment of paper mill effluents by the use of ozone and biological systems: large scale application at Lang Papier, Ettringen (Germany), presented at the TAPPI 2000 Environmental Conference & Trade Fair, Denver, May 6th to10th 2000.
Schrader, G.A. (2006). Direct Nanofiltration of Wastewater Treatment Plant Effluent. Ph.D. Thesis, University of Twente, The Netherlands, ISBN 90-365-2332-X
Sevimli, M. F. (2005). Post-treatment of pulp and paper industry wastewater by advanced oxidation processes. Ozone-Science & Engineering, 27(1), 37-43.
Sievers, M. (2011). Advanced Oxidation Processes”, Treatise on Water Science, 4, 377-408.
Simstich, B., Öller, H.-J. (2007). Membranprozesse in der Papierindustrie. wwt Special 7-8/2007, pp. 25-28
Simstich, B. (2010). Untersuchungen zum störungsfreien Betrieb biologischer Reinigungsanlagen beim Recycling von Nanofiltrationsretentaten (Study to ensure the reliable operation of a biological effluent treatment plant supplemented by nanofiltration as a tertiary treatment step and recycled concentrates). Online version of project report IGF 15290N “Retentatrecycling“; 01/2010 http://www.ptspaper.de/fileadmin/PTS/Dokumente/Forschung/Forschungsprojekte/AiF_15290.pdf
Simstich, B., Öller, H.-J. (2010). Membrane technology for the future treatment of paper mill effluents - Chances and challenges of further system closure, Water Science and Technology, 62 (9), 2190-2197.
Spanos N. and Koutsoukos P.G. (1998). Kinetics of precipitation of calcium carbonate in alkaline pH at constant supersaturation - Spontaneous and seeded growth, J. Phys. Chem., B 102, 6679-6684.
Sutela, T. (2001). Operating experience with membrane technology used for circuit water treatment in different paper mills. PTS Environmental Technology Symposium, H. Grossmann and I. Demel (eds.), PTS Symposium WU-SY 50 108, pp. 11-1 – 11-17
U. S. EPA. 712-C-98-084 (1998). Fate, Transport and Transformation Test Guidelines OPPTS 835.3200 Zahn-Wellens/EMPA Test.
Tanaka, K., Calanag, R. C. R., and Hisanaga, T. (1999). Photocatalyzed degradation of lignin on TiO2. Journal of Molecular Catalysis a-Chemical, 138(2-3), 287-294.
Tang, W. Z. H. C. P. (1996). 2,4-dichlorophenol oxidation kinetics by Fenton's reagent. Environmental Technology, 17(12), 1371-1378.
Ternes T., Stüber J., Herrmann N., McDowell D., Ried A., Kampmann M., Teiser B. (2003). Ozonation: A tool for removal of pharmaceuticals, contrast media and musk fragrances from wastewater, Water Research 37/8, 1976-1982.
Tuhkanen, T., Haapea, P. and Korhonen, S. (2002). Treatment of industrial landfill leachates by chemical and biological methods: Ozonation, Ozonation + Hydrogen Peroxide, Hydrogen

New technologies or innovative treatment lines for reliable water treatment for P&P and minimization of waste production
VEO,PTS, ENV, UCM, HOL, WED, January 2012
Page | 127
Peroxide and biological post-treatment for ozonated water, Ozone: Science & Engineering, 24(5), 369-378.
U.S.EPA. 712-C-98-084 (1998). Fate, Transport and Transformation Test Guidelines OPPTS 835.3200 Zahn-Wellens/EMPA Test.
Van Lier, J. (1996). Limitations of thermophilic anaerobic wastewater treatment and consequences for process design. Antonie van Leeuwenhoek 69, pp. 1 – 14.
Vedavysan, C.V. (2007). Pre-treatment - an overview, Desalination, 203, 296-299. Wang, R., Chen, C. L., and Gratzl, J. S. (2004). Dechlorination and decolorization of chloro-organics, in pulp bleach plant E-1 effluents, by advanced oxidation processes, Bioresource Technology, 94(3), 267-274.
Yeber, M. C., Rodriguez, J., Freer, J., Duran, N., and Mansilla, H. D. (2000). Photocatalytic degradation of cellulose bleaching effluent by supported TiO2 and ZnO, Chemosphere, 41(8), 1193-1197.

New technologies or innovative treatment lines for reliable water treatment for P&P and minimization of waste production
VEO,PTS, ENV, UCM, HOL, WED, January 2012
Page | 128
6 Annex
6.1 Annex on evapoconcentration
Table 42: Evaporators characteristics
Technical device
Diagrams Improvements Advantages (+) /
Drawbacks(-) USE
Advantages (+) / Drawbacks(-) INVESTMENT
Vacuum evaporator
� of energy requirement
(temperature and vaporization)
(+) No high Temperature (-) Vacuum maintains
(-) Vacuum system (-) Augmentation of facilities size
Multiple-effect evaporators
� of energy requirement
(+) Adaptability (-) Several
concentration levels (-) � of annexes
consumption
(-) Increase in the number of facilities
Mechanical compression evaporators
- � of vapour requirement
- Use of electric energy
(+) Autonomy with regard to vapour
power station (-) Steam quality at
the entrance of compressor
(-) Compressor conduct
(+) Suppression of condensation
system (-) Compressor
Thermo-compression evaporators
� of high pressure vapour requirement
(+) Thermo-compressor conduct
(+) � of condenser size
(-) Thermo-injector

New technologies or innovative treatment lines for reliable water treatment for P&P and minimization of waste production
VEO,PTS, ENV, UCM, HOL, WED, January 2012
Page | 129
6.2 Detailed results on PM1
20-3
0% C
OD
redu
ctio
nBO
D5
incr
ease
dup
to 2
5 m
gO2/L
R
emov
alof
col
our
20-3
0% C
OD
redu
ctio
nBO
D5
incr
ease
dup
to 2
5 m
gO2/L
R
emov
alof
col
our
912
SO42-
(mg/
L)18
.5Tu
rbid
ity(F
AU)
9690
Cl- (
mg/
L)31
Con
d. (m
S/cm
)
-N
a+(m
g/L)
2.7
pH
105
Mg2
+(m
g/L)
30BO
D5
(mgO
2/L)
275
Ca2
+(m
g/L)
427
CO
D (m
gO2/L
)
912
SO42-
(mg/
L)18
.5Tu
rbid
ity(F
AU)
9690
Cl- (
mg/
L)31
Con
d. (m
S/cm
)
-N
a+(m
g/L)
2.7
pH
105
Mg2
+(m
g/L)
30BO
D5
(mgO
2/L)
275
Ca2
+(m
g/L)
427
CO
D (m
gO2/L
)
0Tu
rbid
ity(N
TU)
-Si
(mg/
L)-
Con
d. (m
S/cm
)
-SO
42-(m
g/L)
8.1
pH
82C
l-(m
g/L)
0TS
S (m
g/L)
-N
a+(m
g/L)
25BO
D5
(mgO
2/L)
41M
g2+
(mg/
L)37
8sC
OD
(mgO
2/L)
218
Ca2
+(m
g/L)
378
CO
D (m
gO2/L
)
0Tu
rbid
ity(N
TU)
-Si
(mg/
L)-
Con
d. (m
S/cm
)
-SO
42-(m
g/L)
8.1
pH
82C
l-(m
g/L)
0TS
S (m
g/L)
-N
a+(m
g/L)
25BO
D5
(mgO
2/L)
41M
g2+
(mg/
L)37
8sC
OD
(mgO
2/L)
218
Ca2
+(m
g/L)
378
CO
D (m
gO2/L
)
n.d.
Turb
idity
(FAU
)
n.d.
SiO
2(m
g/L)
4.3
Con
d. (m
S/cm
)
111
-370
SO42-
(mg/
L)6.
5pH
445
-890
Cl-(m
g/L)
500
-100
0TS
S (m
g/L)
n.d.
Na+
(mg/
L)19
40 -
5500
BOD
5(m
gO2/L
)
n.d.
Mg2
+(m
g/L)
2310
-68
50sC
OD
(mgO
2/L)
n.d.
Ca2+
(mg/
L)32
90 -
8370
CO
D (m
gO2/L
)
n.d.
Turb
idity
(FAU
)
n.d.
SiO
2(m
g/L)
4.3
Con
d. (m
S/cm
)
111
-370
SO42-
(mg/
L)6.
5pH
445
-890
Cl-(m
g/L)
500
-100
0TS
S (m
g/L)
n.d.
Na+
(mg/
L)19
40 -
5500
BOD
5(m
gO2/L
)
n.d.
Mg2
+(m
g/L)
2310
-68
50sC
OD
(mgO
2/L)
n.d.
Ca2+
(mg/
L)32
90 -
8370
CO
D (m
gO2/L
)
33.7
Turb
idity
(NTU
)
13Si
(mg/
L)3.
4C
ond.
(mS/
cm)
230
SO42-
(mg/
L)8.
36pH
300
Cl- (
mg/
L)28
TSS
(mg/
L)
790
Na+
(mg/
L)-
BOD
5(m
gO2/L
)
40M
g2+
(mg/
L)23
0sC
OD
(mgO
2/L)
130
Ca2
+(m
g/L)
258
CO
D (m
gO2/L
)
33.7
Turb
idity
(NTU
)
13Si
(mg/
L)3.
4C
ond.
(mS/
cm)
230
SO42-
(mg/
L)8.
36pH
300
Cl- (
mg/
L)28
TSS
(mg/
L)
790
Na+
(mg/
L)-
BOD
5(m
gO2/L
)
40M
g2+
(mg/
L)23
0sC
OD
(mgO
2/L)
130
Ca2
+(m
g/L)
258
CO
D (m
gO2/L
)2
-3
Turb
idity
(FAU
)
-Si
(mg/
L)-
Con
d. (m
S/cm
)
-SO
42-(m
g/L)
8.3
pH
-C
l-(m
g/L)
3 -
5TS
S (m
g/L)
-N
a+(m
g/L)
-BO
D5
(mgO
2/L)
-M
g2+
(mg/
L)23
0sC
OD
(mgO
2/L)
-C
a2+
(mg/
L)23
5C
OD
(mgO
2/L)
2 -
3Tu
rbid
ity(F
AU)
-Si
(mg/
L)-
Con
d. (m
S/cm
)
-SO
42-(m
g/L)
8.3
pH
-C
l-(m
g/L)
3 -
5TS
S (m
g/L)
-N
a+(m
g/L)
-BO
D5
(mgO
2/L)
-M
g2+
(mg/
L)23
0sC
OD
(mgO
2/L)
-C
a2+
(mg/
L)23
5C
OD
(mgO
2/L)
11.2
Cl-
(g/L
)
56.3
C (m
S/cm
)
7.86
pH
4630
CO
D (m
gO2/L
)
11.2
Cl-
(g/L
)
56.3
C (m
S/cm
)
7.86
pH
4630
CO
D (m
gO2/L
)
OK
µorg
anis
ms
-Tu
rbid
ity(F
AU)
-Si
O2
(mg/
L)0.
253
Con
d. (m
S/cm
)
-SO
42-(m
g/L)
9.9
pH
-C
l- (m
g/L)
none
TSS
(mg/
L)
-N
a+(m
g/L)
-BO
D5
(mgO
2/L)
-M
g2+
(mg/
L)48
.5sC
OD
(mgO
2/L)
9.97
Ca2
+(m
g/L)
51.5
CO
D (m
gO2/L
)
OK
µorg
anis
ms
-Tu
rbid
ity(F
AU)
-Si
O2
(mg/
L)0.
253
Con
d. (m
S/cm
)
-SO
42-(m
g/L)
9.9
pH
-C
l- (m
g/L)
none
TSS
(mg/
L)
-N
a+(m
g/L)
-BO
D5
(mgO
2/L)
-M
g2+
(mg/
L)48
.5sC
OD
(mgO
2/L)
9.97
Ca2
+(m
g/L)
51.5
CO
D (m
gO2/L
)
PM
1w
aste
wat
er
An
aero
bic
pro
cess
Aer
ob
icp
roce
ss3F
M
An
aero
bic
lab
reac
tor
AO
P (
O3)
MB
R
NF
NF
Velo
city
= 65
L/h
Eva
po
P =
145
mba
rsT
= 60
°C
MLS
S =
13.9
g/L
Flux
= 6
-10
L/m
2 hF/
M =
0.4
3 kg
CO
D/d
.kgM
LSS
AO
P (
O3)
Bio
deg
.te
sts
Wat
er t
o be
re-u
sed
Feed
pH
= 6.
5An
tisca
lant
3-8
ppm
RR
Sys
tem
≈80
%p
= 15
-20
bar
A =
7.3
-7.6
m²
AO
P
(Fen
ton
)B
iod
eg.
test
s
Fe =
32.
2 m
g/L
H 2O
2(1
00%
) = 4
83 m
g/L
n.d.
Turb
idity
(FAU
)
0.4
SiO
2(m
g/L)
0.44
-0.
87C
ond.
(mS/
cm)
< 5
SO42-
(mg/
L)5.
4 -6
.3pH
80 -
150
Cl-
(mg/
L)0
TSS
(mg/
L)
63 -
112
Na+
(mg/
L)<
3BO
D5
(mgO
2/L)
8 -1
3M
g2+
(mg/
L)<
16sC
OD
(mgO
2/L)
0.1
-0.2
Ca2
+(m
g/L)
< 15
CO
D (m
gO2/L
)
n.d.
Turb
idity
(FAU
)
0.4
SiO
2(m
g/L)
0.44
-0.
87C
ond.
(mS/
cm)
< 5
SO42-
(mg/
L)5.
4 -6
.3pH
80 -
150
Cl-
(mg/
L)0
TSS
(mg/
L)
63 -
112
Na+
(mg/
L)<
3BO
D5
(mgO
2/L)
8 -1
3M
g2+
(mg/
L)<
16sC
OD
(mgO
2/L)
0.1
-0.2
Ca2
+(m
g/L)
< 15
CO
D (m
gO2/L
)
36.4
SiO
2(m
g/L)
5C
ond.
(mS/
cm)
140
SO42-
(mg/
L)6.
81pH
82Cl
-(m
g/L)
1122
TSS
(mg/
L)
690
Na+
(mg/
L)11
04BO
D5
(mgO
2/L)
122
Mg2
+(m
g/L)
5000
-65
00sC
OD
(mgO
2/L)
771
Ca2+
(mg/
L)42
95C
OD
(mgO
2/L)
36.4
SiO
2(m
g/L)
5C
ond.
(mS/
cm)
140
SO42-
(mg/
L)6.
81pH
82Cl
-(m
g/L)
1122
TSS
(mg/
L)
690
Na+
(mg/
L)11
04BO
D5
(mgO
2/L)
122
Mg2
+(m
g/L)
5000
-65
00sC
OD
(mgO
2/L)
771
Ca2+
(mg/
L)42
95C
OD
(mgO
2/L)
n.d.
Turb
idity
(FAU
)
77.6
-13
0Si
O2
(mg/
L)12
.5 -
20.7
Con
d. (m
S/cm
)
693
-106
0SO
42-(m
g/L)
6.5
-7.3
pH
3420
-58
30C
l- (m
g/L)
n.d.
TSS
(mg/
L)
1960
-26
00N
a+(m
g/L)
4 -1
5BO
D5
(mgO
2/L)
173
-217
Mg2
+(m
g/L)
806
-121
0sC
OD
(mgO
2/L)
720
-833
Ca2
+(m
g/L)
806
-121
0C
OD
(mgO
2/L)
n.d.
Turb
idity
(FAU
)
77.6
-13
0Si
O2
(mg/
L)12
.5 -
20.7
Con
d. (m
S/cm
)
693
-106
0SO
42-(m
g/L)
6.5
-7.3
pH
3420
-58
30C
l- (m
g/L)
n.d.
TSS
(mg/
L)
1960
-26
00N
a+(m
g/L)
4 -1
5BO
D5
(mgO
2/L)
173
-217
Mg2
+(m
g/L)
806
-121
0sC
OD
(mgO
2/L)
720
-833
Ca2
+(m
g/L)
806
-121
0C
OD
(mgO
2/L)
n.d.
Turb
idity
(FAU
)
20.6
-26
.5Si
O2
(mg/
L)3.
4 -3
.6C
ond.
(mS/
cm)
118
-193
SO42-
(mg/
L)8.
2 -8
.3pH
351
-586
Cl- (
mg/
L)N
one
TSS
(mg/
L)
487-
834
Na+
(mg/
L)4
-7BO
D5
(mgO
2/L)
38 -
55M
g2+
(mg/
L)19
2 -2
35sC
OD
(mgO
2/L)
115
-168
Ca2
+(m
g/L)
192
-135
CO
D (m
gO2/L
)
n.d.
Turb
idity
(FAU
)
20.6
-26
.5Si
O2
(mg/
L)3.
4 -3
.6C
ond.
(mS/
cm)
118
-193
SO42-
(mg/
L)8.
2 -8
.3pH
351
-586
Cl- (
mg/
L)N
one
TSS
(mg/
L)
487-
834
Na+
(mg/
L)4
-7BO
D5
(mgO
2/L)
38 -
55M
g2+
(mg/
L)19
2 -2
35sC
OD
(mgO
2/L)
115
-168
Ca2
+(m
g/L)
192
-135
CO
D (m
gO2/L
)
VCF
= 8.
3
Lab
scal
e: V
CF
= 3
(�In
d. s
cale
: VC
F max
= 6-
7)
Wat
er to
be
re-u
sed
Fina
l was
te
SOD
= 0.
25 -
0.7
gO3/g
CO
DW
ater
to
bere
-use
d
for
re-i
njec
tion
into
the
aero
bic
pro
cess
(dep
end
s
on
Cl-
conc
entr
atio
n)
for
re-i
njec
tion
into
the
aero
bic
pro
cess
(dep
end
s
on
Cl-
conc
entr
atio
n)
for
dire
ct r
e-in
ject
ion
upst
ream
the
anae
robi
c
pro
cess
for
re-i
njec
tion
into
the
aero
bic
pro
cess
(dep
end
s
on
Cl-
conc
entr
atio
n)
for
re-i
njec
tion
into
the
aero
bic
pro
cess
(dep
end
s
on
Cl-
conc
entr
atio
n)
SOD
= 0
.5 g
O3/g
CO
D
23%
CO
D re
duct
ion
BOD 5
incr
ease
dup
to 7
5 m
gO2/L
R
educ
tion
of c
olou
r
23%
CO
D re
duct
ion
BOD 5
incr
ease
dup
to 7
5 m
gO2/L
R
educ
tion
of c
olou
r

New technologies or innovative treatment lines for reliable water treatment for P&P and minimization of waste production
VEO,PTS, ENV, UCM, HOL, WED, January 2012
Page | 130
6.3 Detailed results on PM2
PM
2w
aste
wat
erA
nae
rob
icp
roce
ssA
ero
bic
pro
cess
Eva
po
An
aero
bic
lab
reac
tor
ED
NF
NF
Feed
pH
= 6
.5An
tisca
lant
3-8
ppm
RR
Sys
tem
≈80
%P
= 15
-20
bar
A =
7.3
-7.6
m²
I = 3
AU
= 1
.1 -
1.4
V
Load
= 10
kgC
OD
/(m³*
d)T
= 35
°CpH
= 6
.7 –
7.3
Wat
er t
o b
ere
-use
d
P =
145
mba
rsT
= 63
°C
n.d.
Turb
idity
(FAU
)
10Si
O2
(mg/
L)3.
1C
ond.
(mS/
cm)
110
SO42-
(mg/
L)6.
1pH
160
Cl-
(mg/
L)32
0TS
S (m
g/L)
190
Na+
(mg/
L)17
90BO
D5
(mgO
2/L)
26M
g2+
(mg/
L)27
10sC
OD
(mgO
2/L)
220
Ca2
+(m
g/L)
3230
CO
D (m
gO2/L
)
n.d.
Turb
idity
(FAU
)
10Si
O2
(mg/
L)3.
1C
ond.
(mS/
cm)
110
SO42-
(mg/
L)6.
1pH
160
Cl-
(mg/
L)32
0TS
S (m
g/L)
190
Na+
(mg/
L)17
90BO
D5
(mgO
2/L)
26M
g2+
(mg/
L)27
10sC
OD
(mgO
2/L)
220
Ca2
+(m
g/L)
3230
CO
D (m
gO2/L
)
n.d.
Turb
idity
(FAU
)
37.7
-47
.3Si
O2
(mg/
L)11
.8 -
13.7
Con
d. (m
S/cm
)
363
-371
SO42-
(mg/
L)6.
3 -7
.2pH
3740
-46
60C
l-(m
g/L)
n.d.
TSS
(mg/
L)
1320
-21
40N
a+(m
g/L)
15BO
D5
(mgO
2/L)
81 -
107
Mg2
+(m
g/L)
345
-632
sCO
D(m
gO2/L
)
795
-912
Ca2
+(m
g/L)
363
-650
CO
D (m
gO2/L
)
n.d.
Turb
idity
(FAU
)
37.7
-47
.3Si
O2
(mg/
L)11
.8 -
13.7
Con
d. (m
S/cm
)
363
-371
SO42-
(mg/
L)6.
3 -7
.2pH
3740
-46
60C
l-(m
g/L)
n.d.
TSS
(mg/
L)
1320
-21
40N
a+(m
g/L)
15BO
D5
(mgO
2/L)
81 -
107
Mg2
+(m
g/L)
345
-632
sCO
D(m
gO2/L
)
795
-912
Ca2
+(m
g/L)
363
-650
CO
D (m
gO2/L
) n.d.
Turb
idity
(FAU
)
0.4
SiO
2(m
g/L)
2.3
-2.5
Con
d. (m
S/cm
)
< 5
SO42-
(mg/
L)7.
9 -8
.1pH
80 -
110
Cl-
(mg/
L)12
-67
TSS
(mg/
L)
44 -
67N
a+(m
g/L)
< 3
BOD
5(m
gO2/L
)
0.2
-1.4
Mg2
+(m
g/L)
< 15
sCO
D(m
gO2/L
)
1.6
-(13
.7)
Ca2
+(m
g/L)
< 15
CO
D (m
gO2/L
)
n.d.
Turb
idity
(FAU
)
0.4
SiO
2(m
g/L)
2.3
-2.5
Con
d. (m
S/cm
)
< 5
SO42-
(mg/
L)7.
9 -8
.1pH
80 -
110
Cl-
(mg/
L)12
-67
TSS
(mg/
L)
44 -
67N
a+(m
g/L)
< 3
BOD
5(m
gO2/L
)
0.2
-1.4
Mg2
+(m
g/L)
< 15
sCO
D(m
gO2/L
)
1.6
-(13
.7)
Ca2
+(m
g/L)
< 15
CO
D (m
gO2/L
)
n.d.
Turb
idity
(FAU
)
9.7-
12.5
SiO
2(m
g/L)
2.3
-2.5
Con
d. (m
S/cm
)
74 -
80SO
42-(m
g/L)
7.9
-8.1
pH
140
-180
Cl-
(mg/
L)12
-67
TSS
(mg/
L)
346
-465
Na+
(mg/
L)<
3BO
D5
(mgO
2/L)
21 -
27M
g2+
(mg/
L)75
-14
1sC
OD
(mgO
2/L)
177
-259
Ca2
+(m
g/L)
83 -
147
CO
D (m
gO2/L
)
n.d.
Turb
idity
(FAU
)
9.7-
12.5
SiO
2(m
g/L)
2.3
-2.5
Con
d. (m
S/cm
)
74 -
80SO
42-(m
g/L)
7.9
-8.1
pH
140
-180
Cl-
(mg/
L)12
-67
TSS
(mg/
L)
346
-465
Na+
(mg/
L)<
3BO
D5
(mgO
2/L)
21 -
27M
g2+
(mg/
L)75
-14
1sC
OD
(mgO
2/L)
177
-259
Ca2
+(m
g/L)
83 -
147
CO
D (m
gO2/L
)
OK
µorg
anis
ms
none
Turb
idity
(FAU
)
< 0.
2SO
42-(m
g/L)
6.43
Con
d. (µ
S/cm
)
1.62
Cl-
(mg/
L)5.
98pH
0.26
Na+
(mg/
L)-
BOD
5(m
gO2/L
)
15.8
Mg2
+(µ
g/L)
19.1
sCO
D(m
gO2/L
)
0.32
Ca2
+(µ
g/L)
19.1
CO
D (m
gO2/L
)
OK
µorg
anis
ms
none
Turb
idity
(FAU
)
< 0.
2SO
42-(m
g/L)
6.43
Con
d. (µ
S/cm
)
1.62
Cl-
(mg/
L)5.
98pH
0.26
Na+
(mg/
L)-
BOD
5(m
gO2/L
)
15.8
Mg2
+(µ
g/L)
19.1
sCO
D(m
gO2/L
)
0.32
Ca2
+(µ
g/L)
19.1
CO
D (m
gO2/L
)
3395
8C
l-(m
g/L)
110.
5C
(mS/
cm)
8.31
pH
6490
CO
D (m
gO2/L
)
3395
8C
l-(m
g/L)
110.
5C
(mS/
cm)
8.31
pH
6490
CO
D (m
gO2/L
)
220
SO42-
(mg/
L)2
Con
d. (m
S/cm
)
290
Cl-
(mg/
L)7.
5pH
370
Na+
(mg/
L)29
TSS
(mg/
L)
13M
g2+
(mg/
L)4
BOD
5(m
gO2/L
)
75C
a2+
(mg/
L)36
1sC
OD
(mgO
2/L)
13Tu
rbid
ity(F
AU)
380
CO
D (m
gO2/L
)
220
SO42-
(mg/
L)2
Con
d. (m
S/cm
)
290
Cl-
(mg/
L)7.
5pH
370
Na+
(mg/
L)29
TSS
(mg/
L)
13M
g2+
(mg/
L)4
BOD
5(m
gO2/L
)
75C
a2+
(mg/
L)36
1sC
OD
(mgO
2/L)
13Tu
rbid
ity(F
AU)
380
CO
D (m
gO2/L
)
< 0.
025
Cl-
(mg/
L)
19.8
Con
d. (m
S/cm
)
8.33
pH
276
CO
D (m
gO2/L
)
< 0.
025
Cl-
(mg/
L)
19.8
Con
d. (m
S/cm
)
8.33
pH
276
CO
D (m
gO2/L
)
PM
2 –
Lin
e 1
5.2
Turb
idity
(FAU
)
340
SO42-
(mg/
L)7.
3pH
4030
Cl-
(mg/
L)<
10TS
S (m
g/L)
1820
Na+
(mg/
L)3
BOD
5(m
gO2/L
)
80M
g2+
(mg/
L)51
1sC
OD
(mgO
2/L)
710
Ca2
+(m
g/L)
534
CO
D (m
gO2/L
)
5.2
Turb
idity
(FAU
)
340
SO42-
(mg/
L)7.
3pH
4030
Cl-
(mg/
L)<
10TS
S (m
g/L)
1820
Na+
(mg/
L)3
BOD
5(m
gO2/L
)
80M
g2+
(mg/
L)51
1sC
OD
(mgO
2/L)
710
Ca2
+(m
g/L)
534
CO
D (m
gO2/L
)
NO
reu
se
Wat
er t
o b
ere
-use
d
Lab
scal
e: V
CF
= 10
(�In
dust
rial s
cale
: VC
F max
= 12
)VC
F =
8.3
Fin
al w
aste
Fin
al w
aste
for
dire
ct r
e-in
ject
ion
upst
ream
the
anae
rob
icpr
oce
ss

New technologies or innovative treatment lines for reliable water treatment for P&P and minimization of waste production
VEO,PTS, ENV, UCM, HOL, WED, January 2012
Page | 131
92M
g2+
(mg/
L)
33.5
Si (
mg/
L)97
.5C
a2+
(mg/
L)
329
SO
42-(m
g/L)
12.3
Con
d. (
mS
/cm
)
2 49
0C
l-(m
g/L)
8.5
pH
1 94
0N
a+(m
g/L)
696
CO
D (
mgO
2/L)
92M
g2+
(mg/
L)
33.5
Si (
mg/
L)97
.5C
a2+
(mg/
L)
329
SO
42-(m
g/L)
12.3
Con
d. (
mS
/cm
)
2 49
0C
l-(m
g/L)
8.5
pH
1 94
0N
a+(m
g/L)
696
CO
D (
mgO
2/L)
409
SO
42-(m
g/L)
12.8
1C
ond.
(m
S/c
m)
4690
Cl-
(mg/
L)6.
8pH
60.9
Mg2
+(m
g/L)
< 3
TS
S (
mg/
L)
1000
Ca2
+(m
g/L)
< 3
BO
D5
(mgO
2/L)
30.4
Tur
bidi
ty(F
AU
)40
8C
OD
(m
gO2/
L)
409
SO
42-(m
g/L)
12.8
1C
ond.
(m
S/c
m)
4690
Cl-
(mg/
L)6.
8pH
60.9
Mg2
+(m
g/L)
< 3
TS
S (
mg/
L)
1000
Ca2
+(m
g/L)
< 3
BO
D5
(mgO
2/L)
30.4
Tur
bidi
ty(F
AU
)40
8C
OD
(m
gO2/
L)6.
1pH
13.5
Con
d. (
mS
/cm
)
13T
urbi
dity
(FA
U)
20B
OD
5(m
gO2/
L)
305
CO
D (
mgO
2/L)
6.1
pH
13.5
Con
d. (
mS
/cm
)
13T
urbi
dity
(FA
U)
20B
OD
5(m
gO2/
L)
305
CO
D (
mgO
2/L)
8pH
7B
OD
5(m
gO2/
L)
70C
OD
(m
gO2/
L)
8pH
7B
OD
5(m
gO2/
L)
70C
OD
(m
gO2/
L)
< 0
.1C
a2+
(mg/
L)
< 5
SO
42-(m
g/L)
0.16
Con
d. (
mS
/cm
)
32C
l-(m
g/L)
< 3
BO
D5
(mgO
2/L)
28N
a+(m
g/L)
< 5
CO
D (
mgO
2/L)
< 0
.1C
a2+
(mg/
L)
< 5
SO
42-(m
g/L)
0.16
Con
d. (
mS
/cm
)
32C
l-(m
g/L)
< 3
BO
D5
(mgO
2/L)
28N
a+(m
g/L)
< 5
CO
D (
mgO
2/L)
OK
µor
gani
sms
0T
urbi
dity
(FA
U)
10.4
Cl-
(mg/
L)4.
92C
ond.
(µ
S/c
m)
6.0
Na+
(mg/
L)5.
72pH
-M
g2+
(mg/
L)0
TS
S (
mg/
L)
-C
a2+
(mg/
L)39
CO
D (
mgO
2/L)
OK
µor
gani
sms
0T
urbi
dity
(FA
U)
10.4
Cl-
(mg/
L)4.
92C
ond.
(µ
S/c
m)
6.0
Na+
(mg/
L)5.
72pH
-M
g2+
(mg/
L)0
TS
S (
mg/
L)
-C
a2+
(mg/
L)39
CO
D (
mgO
2/L)
288
00C
l-(m
g/L)
85.7
Con
d. (
mS
/cm
)
5.72
pH
519
0C
OD
(m
gO2/
L)
288
00C
l-(m
g/L)
85.7
Con
d. (
mS
/cm
)
5.72
pH
519
0C
OD
(m
gO2/
L)
5C
olou
r(m
g P
t/L)
< 0
.2T
urbi
dity
(FA
U)
-S
iO2
(mg/
L)1.
06C
ond.
(m
S/c
m)
< 2
0S
O42-
(mg/
L)5.
9pH
180
Cl-
(mg/
L)<
10
TS
S (
mg/
L)
100
Na+
(mg/
L)2
BO
D5
(mgO
2/L)
< 1
Mg2
+(m
g/L)
-sC
OD
(mgO
2/L)
< 1
Ca2
+(m
g/L)
44C
OD
(m
gO2/
L)
5C
olou
r(m
g P
t/L)
< 0
.2T
urbi
dity
(FA
U)
-S
iO2
(mg/
L)1.
06C
ond.
(m
S/c
m)
< 2
0S
O42-
(mg/
L)5.
9pH
180
Cl-
(mg/
L)<
10
TS
S (
mg/
L)
100
Na+
(mg/
L)2
BO
D5
(mgO
2/L)
< 1
Mg2
+(m
g/L)
-sC
OD
(mgO
2/L)
< 1
Ca2
+(m
g/L)
44C
OD
(m
gO2/
L)
-S
iO2
(mg/
L)19
.21
Con
d. (
mS
/cm
)
558
SO
42-(m
g/L)
6.05
pH
109
0C
a2+
(mg/
L)79
9C
OD
(m
gO2/
L)
-S
iO2
(mg/
L)19
.21
Con
d. (
mS
/cm
)
558
SO
42-(m
g/L)
6.05
pH
109
0C
a2+
(mg/
L)79
9C
OD
(m
gO2/
L)
102
TA
C (
°dF
)1.
1T
urbi
dity
(FA
U)
9.1
SiO
2(m
g/L)
2.1
Con
d. (
mS
/cm
)
51S
O42-
(mg/
L)8.
36pH
160
Cl-
(mg/
L)<
10
TS
S (
mg/
L)
460
Na+
(mg/
L)1
BO
D5
(mgO
2/L)
23M
g2+
(mg/
L)97
sCO
D(m
gO2/
L)
120
Ca2
+(m
g/L)
98C
OD
(m
gO2/
L)
102
TA
C (
°dF
)1.
1T
urbi
dity
(FA
U)
9.1
SiO
2(m
g/L)
2.1
Con
d. (
mS
/cm
)
51S
O42-
(mg/
L)8.
36pH
160
Cl-
(mg/
L)<
10
TS
S (
mg/
L)
460
Na+
(mg/
L)1
BO
D5
(mgO
2/L)
23M
g2+
(mg/
L)97
sCO
D(m
gO2/
L)
120
Ca2
+(m
g/L)
98C
OD
(m
gO2/
L)
21T
urbi
dity
(FA
U)
9.25
SiO
2(m
g/L)
2.68
Con
d. (
mS
/cm
)
60S
O42-
(mg/
L)8.
09pH
180
Cl-
(mg/
L)23
TS
S (
mg/
L)
400
Na+
(mg/
L)52
BO
D5
(mgO
2/L)
20M
g2+
(mg/
L)14
4sC
OD
(mgO
2/L)
140
Ca2
+(m
g/L)
154
CO
D (
mgO
2/L)
21T
urbi
dity
(FA
U)
9.25
SiO
2(m
g/L)
2.68
Con
d. (
mS
/cm
)
60S
O42-
(mg/
L)8.
09pH
180
Cl-
(mg/
L)23
TS
S (
mg/
L)
400
Na+
(mg/
L)52
BO
D5
(mgO
2/L)
20M
g2+
(mg/
L)14
4sC
OD
(mgO
2/L)
140
Ca2
+(m
g/L)
154
CO
D (
mgO
2/L)
36.3
TA
C (
°dF
)30
Tur
bidi
ty(F
AU
)
-S
iO2
(mg/
L)2.
04C
ond.
(m
S/c
m)
50S
O42-
(mg/
L)8.
65pH
430
Cl-
(mg/
L)22
TS
S (
mg/
L)
369
Na+
(mg/
L)-
BO
D5
(mgO
2/L)
17M
g2+
(mg/
L)90
sCO
D(m
gO2/
L)
40C
a2+
(mg/
L)90
CO
D (
mgO
2/L)
36.3
TA
C (
°dF
)30
Tur
bidi
ty(F
AU
)
-S
iO2
(mg/
L)2.
04C
ond.
(m
S/c
m)
50S
O42-
(mg/
L)8.
65pH
430
Cl-
(mg/
L)22
TS
S (
mg/
L)
369
Na+
(mg/
L)-
BO
D5
(mgO
2/L)
17M
g2+
(mg/
L)90
sCO
D(m
gO2/
L)
40C
a2+
(mg/
L)90
CO
D (
mgO
2/L)
409
SO
42-(m
g/L)
12.9
9C
ond.
(m
S/c
m)
4740
Cl-
(mg/
L)6.
6pH
108
Mg2
+(m
g/L)
74T
SS
(m
g/L)
942
Ca2
+(m
g/L)
40B
OD
5(m
gO2/
L)
185
Tur
bidi
ty(F
AU
)24
3C
OD
(m
gO2/
L)
409
SO
42-(m
g/L)
12.9
9C
ond.
(m
S/c
m)
4740
Cl-
(mg/
L)6.
6pH
108
Mg2
+(m
g/L)
74T
SS
(m
g/L)
942
Ca2
+(m
g/L)
40B
OD
5(m
gO2/
L)
185
Tur
bidi
ty(F
AU
)24
3C
OD
(m
gO2/
L)
PM
2
waste
wate
r
NF
NF
An
aero
bic
pro
ce
ss
Ae
rob
ic
pro
cess
O3
O3
Bio
deg
.te
sts
Bio
de
g.
tests
Fe
nto
n
Ev
ap
o
3F
M
Ev
ap
o
So
ften
ing
NF
sc
reen
ing
0.7
g O
3/ g
DC
Oin
i
CaC
l 2, C
a(O
H) 2
pH =
9R
ecirc
ulat
ion
= 1
0:1
Ant
isca
lant
RR
sys
tem
= 9
3%
P =
15-
20 b
arW
ate
r to
be
re-u
sed
P =
145
mba
rsT
= 6
3°C
0.8
g O
3 /
g C
OD
Fe
= 5
6 m
g/L
H2O
2(1
00%
) =
133
mg/
L
Fee
d: p
H =
6P
ma
x=
25
bars
RR
sy
ste
m =
90
%A
= 1
40 c
m2
Vel
ocity
= 6
5 L/
h
8pH
43C
OD
(m
gO2/
L)
8pH
43C
OD
(m
gO2/
L)O
3/ H
2O
2
0.9
g O
3/ g
DC
Oin
i0.
45 g
H2O
2 /
g D
CO
ini
Wate
r to
be
re-u
sed
VC
F =
10
Lab
scal
e: V
CF
= 5
(�In
dust
rial s
cale
: VC
Fm
ax
= 8
)W
ate
r to
be
re-u
se
d
Fin
al w
aste
VC
F =
14
for
re-i
nje
cti
on
into
the
aero
bic
pro
cess
(dep
en
ds
on
Cl-
co
nce
ntr
ati
on
)
for
re-i
nje
cti
on
into
the
aero
bic
pro
cess
(dep
en
ds
on
Cl-
co
nce
ntr
ati
on
)
for
re-i
nje
cti
on
into
the
aero
bic
pro
cess
(dep
en
ds
on
Cl-
co
nce
ntr
ati
on
)
for
re-i
nje
cti
on
into
the
aero
bic
pro
cess
(dep
en
ds
on
Cl-
co
nce
ntr
ati
on
)
Wate
r to
be
re-u
sed
Wate
r to
be
re-u
sed
Fin
al w
aste
The
oriti
calV
CF
max
= 1
8
PM
2 –
Lin
e 2

New technologies or innovative treatment lines for reliable water treatment for P&P and minimization of waste production
VEO,PTS, ENV, UCM, HOL, WED, January 2012
Page | 132
6.4 Detailed results on PM3
128.
3D
MC
105
(g/L
)
1180
00C
(µS
/cm
)
5.65
pH
2310
0C
OD
(mgO
2/L)
128.
3D
MC
105
(g/L
)
1180
00C
(µS
/cm
)
5.65
pH
2310
0C
OD
(mgO
2/L)
2.6
Alk
alin
ity(°
dF)
< 0.
1Tu
rbid
ity(N
TU
)
< 2
SiO
2(m
g/L)
1.07
C (m
S/c
m)
< 20
SO
42-(m
g/L)
-pH
33C
l-(m
g/L)
< 10
TSS
(mg/
L)
-N
a+(m
g/L)
< 1
BO
D5
(mgO
2/L)
< 1
Mg2
+(m
g/L)
< 30
sCO
D(m
gO2/L
)
< 1
Ca2
+(m
g/L)
< 30
CO
D (m
gO2/
L)
2.6
Alk
alin
ity(°
dF)
< 0.
1Tu
rbid
ity(N
TU
)
< 2
SiO
2(m
g/L)
1.07
C (m
S/c
m)
< 20
SO
42-(m
g/L)
-pH
33C
l-(m
g/L)
< 10
TSS
(mg/
L)
-N
a+(m
g/L)
< 1
BO
D5
(mgO
2/L)
< 1
Mg2
+(m
g/L)
< 30
sCO
D(m
gO2/L
)
< 1
Ca2
+(m
g/L)
< 30
CO
D (m
gO2/
L)34M
g2+
(mg/
L)
1120
0D
MC
105
(mg/
L)37
0C
a2+
(mg/
L)
145
SiO
2(m
g/L)
15C
ond.
(m
S/c
m)
1900
SO
42-(m
g/L)
5.8
pH
3400
Cl-
(mg/
L)-
TSS
(mg/
L)
2900
Na+
(mg/
L)22
00C
OD
(mgO
2/L)
34M
g2+
(mg/
L)
1120
0D
MC
105
(mg/
L)37
0C
a2+
(mg/
L)
145
SiO
2(m
g/L)
15C
ond.
(m
S/c
m)
1900
SO
42-(m
g/L)
5.8
pH
3400
Cl-
(mg/
L)-
TSS
(mg/
L)
2900
Na+
(mg/
L)22
00C
OD
(mgO
2/L)
PM
3w
as
tew
ate
rA
na
ero
bic
pro
ce
ss
Ae
rob
icp
roc
ess
3F
MN
F /
RO
sc
ree
nin
g
Eva
po
P =
170
mba
rsT
= 65
°C
Wate
r to
be
re-u
se
d
pH =
5.5
P =
20
bars
Mem
bran
e ar
ea =
140
cm
2
O3
So
lar
ph
oto
ca
taly
sis
wit
hT
iO2
UV
/TiO
2
pH =
7
pH =
7[T
iO2]
= 5
g/L
pH =
7[T
iO2]
= 5
g/L
92C
olor
(mg/
L)
350
VF
A (m
g/L)
14Tu
rbid
ity(N
TU
)
8.3
pH
1587
sCO
D(m
gO2/
L)
92C
olor
(mg/
L)
350
VF
A (m
g/L)
14Tu
rbid
ity(N
TU
)
8.3
pH
1587
sCO
D(m
gO2/
L)
496
SO
42-(m
g/L)
7.2
pH
640
TS
S (m
g/L)
1250
BO
D5
(mgO
2/L)
2088
sCO
D(m
gO2/L
)
496
SO
42-(m
g/L)
7.2
pH
640
TS
S (m
g/L)
1250
BO
D5
(mgO
2/L)
2088
sCO
D(m
gO2/L
)
-C
olor
(mg/
L)
580
VFA
(mg/
L)
24T
urbi
dity
(NT
U)
8.1
pH
1787
sCO
D(m
gO2/L
)
-C
olor
(mg/
L)
580
VFA
(mg/
L)
24T
urbi
dity
(NT
U)
8.1
pH
1787
sCO
D(m
gO2/L
)
246
Col
or(m
g/L)
430
VFA
(mg/
L)
438
Tur
bidi
ty(N
TU
)
9pH
1378
sCO
D(m
gO2/L
)
246
Col
or(m
g/L)
430
VFA
(mg/
L)
438
Tur
bidi
ty(N
TU
)
9pH
1378
sCO
D(m
gO2/L
)
35Tu
rbid
ity(F
AU
)
383
SO
42-(m
g/L)
3.8
Con
d. (
mS
/cm
)
150
Cl-
(mg/
L)8.
2pH
680
Na+
(mg/
L)70
TSS
(m
g/L)
6M
g2+
(mg/
L)53
BO
D5
(mgO
2/L)
71C
a2+
(mg/
L)45
0sC
OD
(mgO
2/L)
35Tu
rbid
ity(F
AU
)
383
SO
42-(m
g/L)
3.8
Con
d. (
mS
/cm
)
150
Cl-
(mg/
L)8.
2pH
680
Na+
(mg/
L)70
TSS
(m
g/L)
6M
g2+
(mg/
L)53
BO
D5
(mgO
2/L)
71C
a2+
(mg/
L)45
0sC
OD
(mgO
2/L)
95S
O42-
(mg/
L)
7.3
pH
132
TS
S (m
g/L)
340
BO
D5
(mgO
2/L)
928
sCO
D(m
gO2/L
)
95S
O42-
(mg/
L)
7.3
pH
132
TS
S (m
g/L)
340
BO
D5
(mgO
2/L)
928
sCO
D(m
gO2/L
)
-S
iO2
(mg/
L)8.
5T
urbi
dity
(NTU
)
426
SO
42-(m
g/L)
3.6
C (
mS
/cm
)
127
Cl-
(mg/
L)7.
92pH
-N
a+(m
g/L)
6T
SS
(mg/
L)
5.44
Mg2
+(m
g/L)
494
sCO
D(m
gO2/L
)
84.5
Ca2
+(m
g/L)
497
CO
D (m
gO2/
L)
-S
iO2
(mg/
L)8.
5T
urbi
dity
(NTU
)
426
SO
42-(m
g/L)
3.6
C (
mS
/cm
)
127
Cl-
(mg/
L)7.
92pH
-N
a+(m
g/L)
6T
SS
(mg/
L)
5.44
Mg2
+(m
g/L)
494
sCO
D(m
gO2/L
)
84.5
Ca2
+(m
g/L)
497
CO
D (m
gO2/
L)
OK
µorg
anis
ms
< 2
Ca2
+(m
g/L)
< 16
SiO
2(m
g/L)
< 0.
5T
urbi
dity
(NT
U)
< 30
SO
42-(m
g/L)
270
C (
µS
/cm
)
2.4
Cl-
(mg/
L)7.
8 -8
.2pH
< 1
Na+
(mg/
L)no
neT
SS
(mg/
L)
0.5
Mg2
+(m
g/L)
< 30
CO
D (m
gO2/
L)
OK
µorg
anis
ms
< 2
Ca2
+(m
g/L)
< 16
SiO
2(m
g/L)
< 0.
5T
urbi
dity
(NT
U)
< 30
SO
42-(m
g/L)
270
C (
µS
/cm
)
2.4
Cl-
(mg/
L)7.
8 -8
.2pH
< 1
Na+
(mg/
L)no
neT
SS
(mg/
L)
0.5
Mg2
+(m
g/L)
< 30
CO
D (m
gO2/
L)
MLT
SS
= 2
-3 g
/LV
eloc
ity=
65 L
/h7-
15 k
gCO
D/m
3 .d
pH =
6.5
for
reu
se
, e
.g. p
ulp
pre
pa
rati
on
as
fre
sh
wa
ter
in t
he
mill
for
reu
se
, e
.g. p
ulp
pre
pa
rati
on
as
fre
sh
wa
ter
in t
he
mill
Fin
al
was
te
for
reu
se
, e
.g. p
ulp
pre
pa
rati
on
as
fre
sh
wa
ter
in t
he
mill
for
reu
se
, e
.g. p
ulp
pre
pa
rati
on
as
fre
sh
wa
ter
in t
he
mill
for
reu
se
, e
.g. p
ulp
pre
pa
rati
on
as
fre
sh
wa
ter
in t
he
mill
for
reu
se
, e
.g. p
ulp
pre
pa
rati
on
as
fre
sh
wa
ter
in t
he
mill
VC
F =
5
VC
F =
7
Wa
ter
to b
ere
-use
d

New technologies or innovative treatment lines for reliable water treatment for P&P and minimization of waste production
VEO,PTS, ENV, UCM, HOL, WED, January 2012
Page | 133
6.5 3FM filtration tests on PM1 and PM2 anaerobic effluent
Table 43: Characteristics of effluent from PM1 and PM2 clarifiers
Parameter PM1 PM2 Parameter PM1 PM2
pH 8.4 8.1 P-PO4 (mg P/l) < 10 < 0.6
T (°C) 13.5 24.3 P total (mg P/l) 0.6 0.6
Cond. (mS/cm) 3.4 2.68 SO4 (mg /l) 230 60
Turbidity (NTU) 33.7 21 TA (°dF) 0.0 0
COD (mg O2/L) 258 154 TAC (°dF) 119 115
COD soluble (mg O2/L) 230 144 Ca (mg/l) 130 140
TSS (mg/l) 28 23 Mg (mg/l) 40 20
Dry matters at 105°C (mg/L) 2686 1 700 K (mg/l) 24 9
N-NH4 (mg N/l) 2.2 1 Cl- (mg/l) 300 180
N-NO2 (mg N/l) < 2 0.52 F- (mg/l) < 4 < 0.2
N-NO3 (mg N/l) < 2 0.22
0
5
10
15
20
25
30
35
40
0 20 40 60 80 100 120 140
Filtration time (min)
Tu
rbid
ity
(m
g/L
) a
nd
TS
S (
mg
/L)
Turbidity effluent PM1 TSS effluent PM1Turbidity effluent PM2 TSS effluent PM2
Figure 80: 3FM filtration applied to PM1 and PM2 clarifier effluent
Detailed analysis of the 3FM filtrate of PM2 is reported in the table below:
Table 44: Detailed analysis of 3FM filtrates from PM2
PM2 PM2
TSS (mg/L) < 10 Al (mg/L) 0.15
TS at 105°C (mg/L) 1600 B (mg/L) 2.5
Turb (FAU) 1.1 Ba (mg/L) 0.059
TA (°dF) 0 Ca (mg/L) 120
TAC (°dF) 102 tFe (mg/L) 0.21
BOD5 (mgO2/L) 1 K (mg/L) 10
tCOD (mgO2/L) 98 Mg (mg/L) 23

New technologies or innovative treatment lines for reliable water treatment for P&P and minimization of waste production
VEO,PTS, ENV, UCM, HOL, WED, January 2012
Page | 134
PM2 PM2
sCOD (mgO2/L) 97 Mn (mg/L) < 0.01
DOC (mgC/L) 30 Na (mg/L) 460
TOC (mgC/L) 30 Sr (mg/L) 0.46
SO4 (mg/L) 51 Cl- (mg/L) 160
N-NH4 (mgN/L) < 1 F- (mg/L) < 1
N-NO2 (mgN/L) < 0.3 Si (mg/L) 5
N-NO3 (mgN/L) < 0.5 Total silica (mgSiO2/L) 9.1
P total (mgP/L) < 0.5 Colour (mg Pt /L) 200
P-PO4 (mgP/L) < 3 C (mS/cm) 2.1
pH 8.36 T (°C) 15.4

New technologies or innovative treatment lines for reliable water treatment for P&P and minimization of waste production
VEO,PTS, ENV, UCM, HOL, WED, January 2012
Page | 135
6.6 NF90 applied to 3FM filtrate of PM2 (Osmonic filtration cell)
The major scaling risk identified with a JChess simulation at the initial pH (pH= 8.4) of the 3FM filtrate was calcite (Figure 83). However, this risks was shown to disappear at pH = 6 (Figure 84), the risk becoming then quartz scaling but in a very minor proportion. The NF filtration tests was then performed at pH = 6 to prevent scaling on the membrane, but no anti-scalant was used.
Concentration factor �
Concentration factor �
Figure 81: Scaling risks at free pH Figure 82: Scaling risks at pH =6
A target VCF = 10, i.e. a permeate recovery of 90% (determined), was fixed by a modeling of NF filtration at pH = 6 based on complete analysis of the 3FM filtrate. The permeability of the NF90 went down from 5.5 L/(h.m2.bar) to 1.9 L/(h.m2.bar) at a recovery rate of 90%.The conductivity retention stayed constant (95%) during the whole experiment with a good permeate conductivity (Figure 86); however a loss of quality was observed at the end of the effluent with an increase of the conductivity up to 1000 µS/cm (PM2 limit for re-use = 500 µS/cm) due to the breakthrough of the membrane and the consecutive re-concentration step (Figure 54), inducing as well a decrease of conductivity retention to 90%.
0,0
1,0
2,0
3,0
4,0
5,0
6,0
0 20 40 60 80 100
Recovery (%)
Flo
w c
orr
ec
ted
at
25
°C (
L/(
h.m
².b
ar)
1st concentration stepReconcentration step
0
5000
10000
15000
20000
25000
0 20 40 60 80 100Recovery (%)
Co
nd
uc
tiv
ity
(µ
S/c
m)
Permeate ConcentratePermeate reconcentration Concentrate reconcentration
500 µS/cm
Figure 83: Evolution of permeate recovery Figure 84: Evolution of conductivity

New technologies or innovative treatment lines for reliable water treatment for P&P and minimization of waste production
VEO,PTS, ENV, UCM, HOL, WED, January 2012
Page | 136
Following table shows the quality of permeate (and concentrate) at maximum recovery rate 90% of the system:
Table 45: Quality of permeate and filtrate at 90% recovery of the system
Concentrate Permeate Concentrate Permeate
pH 6.05 5.9 N-NO3 (mgN/L) 6.25 < 0.5
T (°C) 20.2 Ptotal (mgP/L) 12.10 < 0.5
C (mS/cm) 19.21 1.02 P-PO4 (mgP/L) 11.60 < 3
TSS (mg/L) < 10 Al (mg/L) < 0.025
TS at 105°C (mg/L) 300 B (mg/L) < 0.05
Turb (FAU) < 0.2 Ba (mg/L) < 0.05
TA (°dF) 0 0 Ca (mg/L) 1090 < 1
TAC (°dF) 4.1 0.2 tFe (mg/L) 2.25 < 0.05
BOD5 (mgO2/L) 2 K (mg/L) 5
tCOD (mgO2/L) 799 44 Mg (mg/L) 220 < 1
sCOD (mgO2/L) 849 Mn (mg/L) < 0.01
TOC (mgC/L) < 2 Na (mg/L) 100
SO4 (mg/L) 558 < 20 Sr (mg/L) < 0.05
N-NH4 (mgN/L) 0.7 < 1 Cl- (mg/L) 5880 180
N-NO2 (mgN/L) n. d. < 0.3

New technologies or innovative treatment lines for reliable water treatment for P&P and minimization of waste production
VEO,PTS, ENV, UCM, HOL, WED, January 2012
Page | 137
6.7 Softening tests on PM2 waste water
6.7.1 Softening on Aerobic effluent
Influencing factors on precipitation of CaCO3 were assessed in laboratory beaker tests: • Influence of pH and seeding crystals (CaCO3) on softening result:
At first, the impact of the pH value on the precipitation using lime milk (5 % w/w CaOH2) was investigated in batch tests (T = 23°C, mixing time 30 min). Increasing dosing rates of lime milk to PM2 aerobic effluent (initial pH 8.1), starting from 6.1 ml/l at pH 8.5 to 17.2 ml/l at pH 10.5 resulted in decreasing residual calcium concentrations of 18.5 Ca2+/l (pH 8.5) down to 10.7 mg Ca2+/l (pH 10.5) in filtered supernatant. This is a result of the lime adjustment of the carbonic acid equilibrium. The dosage of 20 g/l seeding crystals leads to a concentration of less than 15 mg/l calcium in less than 2 minutes after addition of seeds. Without seeding reaction rate is slower and final residual concentration of Ca2+ is higher (around 20 mg Ca2+/l). Higher concentration of seeding crystals (40 g/L) did not have any further positive effects compared to seeding with 20 g/l.
• Influence of lime milk and caustic soda on conductivity and pH value: Lime milk is superior to caustic soda in terms of induction of precipitation reactions. In order to start precipitation of CaCO3, it was necessary to dose almost double the amount of caustic soda than lime milk; resulting in following mol masses of hydroxide; 4.3 mmol OH- instead of 2.02 mmol OH- respectively. Since no monovalent ions are dosed to the wastewater using lime milk also final conductivity after precipitation is reduced.
• Effects of heterogeneous seeds and temperature Results showed that almost twice as much caustic soda was needed to induce carbonate precipitation in a 0.45 µm filtrated sample of PM2 aerobic effluent as in a non filtrated sample. This can be explained by the reduced amount of heterogeneous seeds (activated sludge flocs, other suspended particles) in the solution. Increase of temperature led to an even faster precipitation of calcium carbonate. This is the consequence of the minimized solubility of carbon dioxide and the reduced solubility product of calcium carbonate.
The comparison of the softening results demonstrates that the ion exchange column does not provide superior softening results than the lime softening plus calcite filter bed. As indicated by the concentration of TOC, the ion exchange resin seems to adsorb some organic constituents of the wastewater. Because of the exchange of calcium and magnesium against sodium the ion exchanger produces an effluent which is higher in monovalent sodium (and therefore higher in conductivity, 3 mS/cm vs 2 mS/cm) but also higher in total carbon because decarbonisation does not take place to the same extent. Most of the inorganic carbon remains as temporary hardness. The residual concentrations of calcium and magnesium are on a low level in both cases, but elimination of magnesium is slightly less pronounced in the lime softening, probably because maximum pH was kept at pH 9. Except for lower magnesium concentrations and TOC, use of lime softened aerobic effluent seems favourable for following nanofiltration. TOC removal will be almost complete in NF treatment anyway, as demonstrated. Compare following analysis results summarized in Table 46.

New technologies or innovative treatment lines for reliable water treatment for P&P and minimization of waste production
VEO,PTS, ENV, UCM, HOL, WED, January 2012
Page | 138
Table 46: Major deviations of ion exchanger and calcite filter effluents
Parameter Unit Effluent 1
Ion Exchange Effluent 2
Calcite Filter TC mg/l 370 210
TOC mg/l 44 56
DOC mg/l 42 54
TN mg/l 4 10
TP mg/l 2.5 2.3
Sulphur mg/l 29 35
Aluminium mg/l 0.3 0.2
Barium mg/l 0.03 < 0.02
Boron mg/l 2.5 3.0
Calcium mg/l 8,3 2,5
Iron mg/l 0.5 0.2
Magnesium mg/l 1,66 10,6
Manganese mg/l 0.02 0.01
Potassium mg/l 33 46
Sodium mg/l 712 459
Chloride mg/l 205 248
Sulphate mg/l 80 95
6.7.2 MultifloTM Softening on 3FM filtrate
Table 47: Complete analyses of effluent before and after softening
3FM filtrate Softened effluent
3FM filtrate Softened effluent
TSS (mg/L) < 10 22 Al (µg/L) 0.15 < 0.025
TS at 105°C ( mg/L) 1600 1200 B (mg/L) 2.5 1.8
Turbidity (FAU) 1.1 30 Ba ( mg/L) 0.059 < 0.05
TAC (°dF) 102 36.3 Ca (mg/L) 120 40
BOD5 (mg/L) 1 tFe (mg/L) 0.21 < 0.05
tCOD (mgO2/L) 98 90 K (mg/L) 10 11
sCOD (mgO2/L) 105 90 Mg (mg/L) 23 17
DOC (mgO2/L) 30 Mn (mg/L) < 0.01 < 0.01
TOC (mgC/L) 30 21 Na (mg/L) 460 369
SO4 (mg/L) 51 50 Sr (mg/L) 0.46 < 0.05
N-NH4 (mgN/L) < 1 < 1 Si (mg/L) 5
N-NO2 (mgN/L) < 0.3 < 0.3 Color (mg Pt/L) 200 100
N-NO3 (mgN/L) < 0.5 < 0.5 pH 8 8.65
Ptotal (mg/L) < 0.5 < 0.5 T (°C) 25 14.2
P-PO4 (mg/L) < 3 < 3 Cond. (mS/cm) 2.68 2.04
Cl- (mg/L) 160 430

New technologies or innovative treatment lines for reliable water treatment for P&P and minimization of waste production
VEO,PTS, ENV, UCM, HOL, WED, January 2012
Page | 139
6.8 Evapoconcentration applied to NF concentrates from PM1 and PM2
Table 48: Detailed analysis of NF concentrates from PM1 and PM2 (feed)
PM1 PM2
Concentrates Ana./MBR/NF Ana./Aer./NF Ana./Aer./3FM/NF Ana./Aer./3FM/ Softening/NF
pH 7.2 6.9 6.05 8.5
T (°C) 25 29 20 25
Cond. (mS/cm) 20.56 13.3 19.2 12.3
TSS (mg/L) 22 < 10
DM at 105°C ( mg/L) 14 000 8 500
Alkalinity (mg CaCO3/L) 381 220 41
BOD5 (mg/L) 9 15
tCOD (mgO2/L) 1309 522 799 696
sCOD (mgO2/L) 1283 509 849
TOC (mgC/L) 440 170
SO4 (mg/L) 841 367 558 329
Cl- (mg/L) 6 660 4 660 5 880 2 490
N-NH4 (mgN/L) 68 0.3 0.7 1
N-NO2 (mgN/L) 14 0.2 0.075
N-NO3 (mgN/L) 100.2 6.8 6.3 < 1.2
Ptotal (mg/L) 19.9 12.1 1.75
Al (µg/L) 520 330 300
Ca (mg/L) 930 912 1092 97.5
tFe (µg/L) 680 1.2 2250 0.63
K (mg/L) 201.7 39.7 50
Mg (mg/L) 281.7 107 220 92
Mn (µg/L) 250 400 0.008
Na (mg/L) 2 768 2 140 1 940
Table 49: Analyses of final waste (concentrates) produced by evapoconcentration
PM1 PM2
Final waste Ana./MBR/NF Ana./Aer./NF Ana./Aer./3FM/NF Ana./Aer./3FM/ Softening/NF
pH 7.86 8.31 5.72
No experiment carried out
Cond. (mS/cm) 56.3 101 85.7 tCOD (mgO2/L) 23 540 6 490 5 190 SO4 (mg/L) 3 860 5 800 5 480 N-NO3 (mg/L) 400 Cl
- (mg/L) 11 200 33 958 28 832
Ca (mg/L) 4 420 7 180 5 694 Mg (mg/L) 708 1 435 1 256 Na (mg/L) 20 094 16 530

New technologies or innovative treatment lines for reliable water treatment for P&P and minimization of waste production
VEO,PTS, ENV, UCM, HOL, WED, January 2012
Page | 140
6.9 Electrodialysis on RO concentrates from PM2 and PM3
Wate
r to
be
re-u
sed
PM
2
was
tew
ate
r
An
aero
bic
pro
ce
ss
Ae
rob
ic
pro
ce
ss
ED
NF
NF
Feed
pH
= 6
.5A
ntis
cala
nt3-
8 pp
mR
RS
yste
m≈
80 %
P =
15
-20
bar
A =
7.3
-7.
6 m
²
I = 3
AU
= 1
.1 -
1.4
V
n.d.
Turb
idity
(FA
U)
37.7
-47
.3S
iO2
(mg/
L)11
.8 -
13.7
C (m
S/c
m)
363
-371
SO
42-(m
g/L)
6.3
-7.2
pH
3740
-46
60C
l-(m
g/L)
n.d.
TSS
(mg/
L)
1320
-21
40N
a+(m
g/L)
15B
OD
5(m
gO2/L
)
81 -
107
Mg2
+(m
g/L)
345
-632
sCO
D(m
gO2/L
)
795
-912
Ca2
+(m
g/L)
363
-650
CO
D (m
gO2/
L)
n.d.
Turb
idity
(FA
U)
37.7
-47
.3S
iO2
(mg/
L)11
.8 -
13.7
C (m
S/c
m)
363
-371
SO
42-(m
g/L)
6.3
-7.2
pH
3740
-46
60C
l-(m
g/L)
n.d.
TSS
(mg/
L)
1320
-21
40N
a+(m
g/L)
15B
OD
5(m
gO2/L
)
81 -
107
Mg2
+(m
g/L)
345
-632
sCO
D(m
gO2/L
)
795
-912
Ca2
+(m
g/L)
363
-650
CO
D (m
gO2/
L)
n.d.
Turb
idity
(FA
U)
0.4
SiO
2(m
g/L)
2.3
-2.5
C (m
S/c
m)
< 5
SO
42-(m
g/L)
7.9
-8.1
pH
80 -
110
Cl-
(mg/
L)12
-67
TSS
(mg/
L)
44 -
67N
a+(m
g/L)
< 3
BO
D5
(mgO
2/L)
0.2
-1.4
Mg2
+(m
g/L)
< 15
sCO
D(m
gO2/L
)
1.6
-(1
3.7)
Ca2
+(m
g/L)
< 15
CO
D (m
gO2/
L)
n.d.
Turb
idity
(FA
U)
0.4
SiO
2(m
g/L)
2.3
-2.5
C (m
S/c
m)
< 5
SO
42-(m
g/L)
7.9
-8.1
pH
80 -
110
Cl-
(mg/
L)12
-67
TSS
(mg/
L)
44 -
67N
a+(m
g/L)
< 3
BO
D5
(mgO
2/L)
0.2
-1.4
Mg2
+(m
g/L)
< 15
sCO
D(m
gO2/L
)
1.6
-(1
3.7)
Ca2
+(m
g/L)
< 15
CO
D (m
gO2/
L)
n.d.
Turb
idity
(FA
U)
9.7-
12.5
SiO
2(m
g/L)
2.3
-2.5
C (m
S/c
m)
74 -
80S
O42-
(mg/
L)7.
9 -8
.1pH
140
-180
Cl-
(mg/
L)12
-67
TSS
(mg/
L)
346
-465
Na+
(mg/
L)<
3B
OD
5(m
gO2/L
)
21 -
27M
g2+
(mg/
L)75
-14
1sC
OD
(mgO
2/L)
177
-259
Ca2
+(m
g/L)
83 -
147
CO
D (m
gO2/
L)
n.d.
Turb
idity
(FA
U)
9.7-
12.5
SiO
2(m
g/L)
2.3
-2.5
C (m
S/c
m)
74 -
80S
O42-
(mg/
L)7.
9 -8
.1pH
140
-180
Cl-
(mg/
L)12
-67
TSS
(mg/
L)
346
-465
Na+
(mg/
L)<
3B
OD
5(m
gO2/L
)
21 -
27M
g2+
(mg/
L)75
-14
1sC
OD
(mgO
2/L)
177
-259
Ca2
+(m
g/L)
83 -
147
CO
D (m
gO2/
L)
220
SO
42-(m
g/L)
2C
(mS
/cm
)
290
Cl-
(mg/
L)7.
5pH
370
Na+
(mg/
L)29
TSS
(mg/
L)
13M
g2+
(mg/
L)4
BO
D5
(mgO
2/L)
75C
a2+
(mg/
L)36
1sC
OD
(mgO
2/L)
13Tu
rbid
ity(F
AU
)38
0C
OD
(mgO
2/L)
220
SO
42-(m
g/L)
2C
(mS
/cm
)
290
Cl-
(mg/
L)7.
5pH
370
Na+
(mg/
L)29
TSS
(mg/
L)
13M
g2+
(mg/
L)4
BO
D5
(mgO
2/L)
75C
a2+
(mg/
L)36
1sC
OD
(mgO
2/L)
13Tu
rbid
ity(F
AU
)38
0C
OD
(mgO
2/L)
< 0.
025
Cl-
(mg/
L)
19.8
C (m
S/c
m)
8.33
pH
276
CO
D (m
gO2/L
)
< 0.
025
Cl-
(mg/
L)
19.8
C (m
S/c
m)
8.33
pH
276
CO
D (m
gO2/L
)
NO
rein
jecti
on
up
str
eam
an
aero
bic
pro
ce
ss
PM
3
wa
ste
wa
ter
An
ae
rob
ic
pro
ce
ss
MB
RR
OR
O
Wa
ter
to b
ere
-used
Spi
ral w
ound
mem
bran
es1
pass
/ 2st
eps
Mem
bran
e su
rface
= 2
6 m
2
MLT
S =
10
g/L
Flux
= 1
2 LM
HF:
M =
0.1
5 kg
CO
D/d
.kg
MLT
S
13N
-NH
4 (m
g/L)
Turb
idity
(FA
U)
140
SiO
2(m
g/L)
2914
C (µ
S/c
m)
335
SO
42-(m
g/L)
7.8
pH
0.1
Al2+
(mg/
L)12
TSS
(mg/
L)
-N
a+(m
g/L)
17B
OD
5(m
gO2/
L)
6.0
Mg2
+(m
g/L)
375
sCO
D(m
gO2/L
)
76C
a2+
(mg/
L)C
OD
(mgO
2/L)
13N
-NH
4 (m
g/L)
Turb
idity
(FA
U)
140
SiO
2(m
g/L)
2914
C (µ
S/c
m)
335
SO
42-(m
g/L)
7.8
pH
0.1
Al2+
(mg/
L)12
TSS
(mg/
L)
-N
a+(m
g/L)
17B
OD
5(m
gO2/
L)
6.0
Mg2
+(m
g/L)
375
sCO
D(m
gO2/L
)
76C
a2+
(mg/
L)C
OD
(mgO
2/L)
50N
-NH
4 (m
g/L)
Turb
idity
(FA
U)
170
SiO
2(m
g/L)
-C
(mS
/cm
)
90S
O42-
(mg/
L)7.
5pH
Cl-
(mg/
L)36
5TS
S (m
g/L)
-N
a+(m
g/L)
385
BO
D5
(mgO
2/L)
-M
g2+
(mg/
L)10
15sC
OD
(mgO
2/L)
-C
a2+
(mg/
L)C
OD
(mgO
2/L)
50N
-NH
4 (m
g/L)
Turb
idity
(FA
U)
170
SiO
2(m
g/L)
-C
(mS
/cm
)
90S
O42-
(mg/
L)7.
5pH
Cl-
(mg/
L)36
5TS
S (m
g/L)
-N
a+(m
g/L)
385
BO
D5
(mgO
2/L)
-M
g2+
(mg/
L)10
15sC
OD
(mgO
2/L)
-C
a2+
(mg/
L)C
OD
(mgO
2/L)
1.3
N-N
H4
(mg/
L)Tu
rbid
ity(F
AU
)
1.3
SiO
2(m
g/L)
36C
(µS
/cm
)
6.0
SO
42-(m
g/L)
-pH
< 0.
03A
l2+(m
g/L)
0.0
TSS
(mg/
L)
-N
a+(m
g/L)
< 5
BO
D5
(mgO
2/L)
0.14
Mg2
+(m
g/L)
< 25
sCO
D(m
gO2/L
)
10C
a2+
(mg/
L)C
OD
(mgO
2/L)
1.3
N-N
H4
(mg/
L)Tu
rbid
ity(F
AU
)
1.3
SiO
2(m
g/L)
36C
(µS
/cm
)
6.0
SO
42-(m
g/L)
-pH
< 0.
03A
l2+(m
g/L)
0.0
TSS
(mg/
L)
-N
a+(m
g/L)
< 5
BO
D5
(mgO
2/L)
0.14
Mg2
+(m
g/L)
< 25
sCO
D(m
gO2/L
)
10C
a2+
(mg/
L)C
OD
(mgO
2/L)
17N
-NH
4 (m
g/L)
Turb
idity
(FA
U)
182
SiO
2(m
g/L)
3280
C (µ
S/c
m)
446
SO
42-(m
g/L)
-pH
0.1
Al2+
(mg/
L)16
TSS
(mg/
L)
-N
a+(m
g/L)
18B
OD
5(m
gO2/
L)
7.6
Mg2
+(m
g/L)
sCO
D(m
gO2/L
)
102
Ca2
+(m
g/L)
477
CO
D (m
gO2/L
)
17N
-NH
4 (m
g/L)
Turb
idity
(FA
U)
182
SiO
2(m
g/L)
3280
C (µ
S/c
m)
446
SO
42-(m
g/L)
-pH
0.1
Al2+
(mg/
L)16
TSS
(mg/
L)
-N
a+(m
g/L)
18B
OD
5(m
gO2/
L)
7.6
Mg2
+(m
g/L)
sCO
D(m
gO2/L
)
102
Ca2
+(m
g/L)
477
CO
D (m
gO2/L
)
NO
re-u
se
455
Cl-
(mg/
L)
3280
C (µ
S/c
m)
8.7
pH
9C
OD
(mgO
2/L)
455
Cl-
(mg/
L)
3280
C (µ
S/c
m)
8.7
pH
9C
OD
(mgO
2/L)
1.5
Fe (m
g/l)
-Tu
rbid
ity(N
TU
)
-S
iO2
(mg/
L)640
C (µ
S/c
m)
197
SO
42-(m
g/L)
5.3
pH
6C
l-(m
g/L)
-TS
S (m
g/L)
132
Na+
(mg/
L)-
BO
D5
(mgO
2/L)
0M
g2+
(mg/
L)-
sCO
D(m
gO2/L
)
2C
a2+
(mg/
L)37
7C
OD
(mgO
2/L)
1.5
Fe (m
g/l)
-Tu
rbid
ity(N
TU
)
-S
iO2
(mg/
L)640
C (µ
S/c
m)
197
SO
42-(m
g/L)
5.3
pH
6C
l-(m
g/L)
-TS
S (m
g/L)
132
Na+
(mg/
L)-
BO
D5
(mgO
2/L)
0M
g2+
(mg/
L)-
sCO
D(m
gO2/L
)
2C
a2+
(mg/
L)37
7C
OD
(mgO
2/L)
ED
I = x
x A
Fara
dic
yiel
d=
PM
3
PM
2

New technologies or innovative treatment lines for reliable water treatment for P&P and minimization of waste production
VEO,PTS, ENV, UCM, HOL, WED, January 2012
Page | 141
6.10 3FM filtration applied to PM3 anaerobic/aerobic effluent
Table 50: Effluent from PM3 anaerobic/aerobic pilot before 3FM filtration (with white particles)
Parameter Clarifier Parameter Clarifier
pH 7.9 P-PO4 (mg P/L) 16
Cond. (mS/cm) 3.8 SO4 (mg /L) 470
Turbidity (NTU) 35 TA (°dF) 0
COD (mg O2/L) 791 TAC (°dF) 111
COD soluble (mg O2/L) 584 Ca (mg/L) 71
TOC (mg/L) 180 K (mg/L) 10
BOD5 (mg O2/L) 140 Mg (mg/L) 6
TSS (mg/l) 89 Na (mg/L) 680
Dry matters (105°C – mg/L) 2 700 tFe (mg/L) 0.41
N-NH4 (mg N/L) 91 Mn (mg/L) 0.7
N-NO2 (mg N/L) 61 F- (mg/L) < 1
N-NO3 (mg N/L) 20 Cl- (mg/L) 150
Ptotal (mg P/L) 18 SiO2 (mg Si/L) 4.7
The Figure 87 shows the evolution of TSS and turbidity in time for the raw effluent (with white particles) and for the pre-filtered one:
0
10
20
30
40
50
60
70
80
90
100
0 10 20 30 40 50 60 70 80 90
Filtration time (min)
Turb
idit
y (m
g/L
) and T
SS
(m
g/L
)
Turbidity raw effluent TSS raw effluentTurbidity effluent pre-filtered TSS effluent pre-filtered
Figure 85: Impact of 3FM filtration on TSS and turbidity in time

New technologies or innovative treatment lines for reliable water treatment for P&P and minimization of waste production
VEO,PTS, ENV, UCM, HOL, WED, January 2012
Page | 142
6.11 NF/RO screening on 3FM filtrate from PM3 (Osmonic filtration cell)
Concentration factor �
pH ����pH ����
Figure 86: Scaling risks at free pH Figure 87: Scaling risks at pH = 6
Analyses were done on average permeates and are thus not representative of the quality of permeate which was obtained either at the highest conversion rate or at the conversion rate which would give the best quality:
Table 51: Quality of average permeates
NF200
NF200 at pH = 5.5
NF90 acid at pH = 5.5
BW30(*
)
at pH = 5.5 SW30 acid at pH = 5.5
Quality criteria PM3
COD (mgO2/L) 62.6 94 43.5 < 30 22.1
COD sol (mgO2/L) 75.6 98.6 44.1 < 30 16.7
Ptotal (mg/L) 0.336 2.54 0.46 < 0.5 0.011
P-PO4 (mg/L) 0.31 2.37 0.21 < 3 0.01
N-NH4 (mg/L) 22.8 62.2 35.9 13 5.29
N-NO3 (mg/L) 11.6 10 10 2.4 2.28
SO4 (mg/L) 80.5 78.2 71.8 < 20 not detected < 200
Cl- (mg/L) 71.4 701 93.5 33 7.47 < 200
Ca (mg/L) 10.6 35 7.83 < 1 0.25 < 60
Mg (mg/L) not detected not detected not detected < 1 not detected < 15
°dH 1.49 4.91 1.1 0.035
Total alkalinity (°F) 2.6
Turbidity (NTU) 0.59 0.42 0.1 < 0.2 < 5
Fetotal (mg/L) < 0.05 0.014
pH 9.4 6.05 6.08
T (°C) 19.2 19 18.9
C (mS/cm) 1.409 3.18 0.578 1.07 0.39 < 0.5 (
*) All analyses were performed with standard methods, while for the other permeates kits tests were used to perform the analyses.
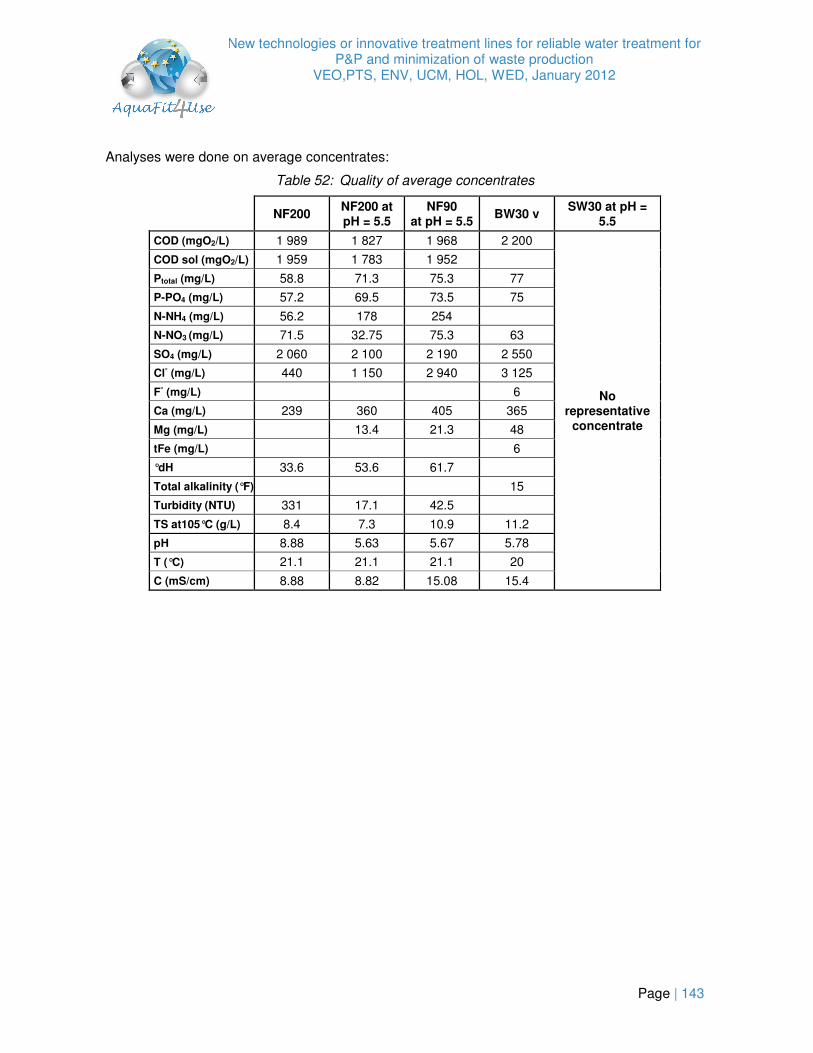
New technologies or innovative treatment lines for reliable water treatment for P&P and minimization of waste production
VEO,PTS, ENV, UCM, HOL, WED, January 2012
Page | 143
Analyses were done on average concentrates:
Table 52: Quality of average concentrates
NF200
NF200 at pH = 5.5
NF90 at pH = 5.5
BW30 v SW30 at pH =
5.5
COD (mgO2/L) 1 989 1 827 1 968 2 200
No representative
concentrate
COD sol (mgO2/L) 1 959 1 783 1 952
Ptotal (mg/L) 58.8 71.3 75.3 77
P-PO4 (mg/L) 57.2 69.5 73.5 75
N-NH4 (mg/L) 56.2 178 254
N-NO3 (mg/L) 71.5 32.75 75.3 63
SO4 (mg/L) 2 060 2 100 2 190 2 550
Cl- (mg/L) 440 1 150 2 940 3 125
F- (mg/L) 6
Ca (mg/L) 239 360 405 365
Mg (mg/L) 13.4 21.3 48
tFe (mg/L) 6
°dH 33.6 53.6 61.7
Total alkalinity (°F) 15
Turbidity (NTU) 331 17.1 42.5
TS at105°C (g/L) 8.4 7.3 10.9 11.2
pH 8.88 5.63 5.67 5.78
T (°C) 21.1 21.1 21.1 20
C (mS/cm) 8.88 8.82 15.08 15.4

New technologies or innovative treatment lines for reliable water treatment for P&P and minimization of waste production
VEO,PTS, ENV, UCM, HOL, WED, January 2012
Page | 144
6.12 Evapoconcentration on RO concentrates from PM3
6.12.1RO concentrates from “PM3 waste water ���� Anaerobic ���� Aerobic ���� 3FM ���� RO”
Figure 88: Precipitation risks obtained with a JChess simulation
Table 53: Distillate quality for VCF equal to 5, 7 and 11.5 (= final VCF)
VCF = 5 VCF = 7 VCF = 11.5
VCF = 5 VCF = 7 VCF = 11.5
pH 8.22 7.75 3.8 N-NH4 (mg/L) 14.2 19.3 19.3
Cond. (mS/cm) 0.13 0.16 0.3 N-NO2 (mg/L) 7.96 2.9 2.9
DM at 105°C ( mg/L) 0.07 0.07 0.06 N-NO3 (mg/L) - - -
Alkalinity (°dF) 2.6 1.4 0 P-PO4 (mg/L) < 0.4 < 0.4 < 0.4
tCOD (mgO2/L) 20 41 66 Ca (mg/L) 0 0 0
SO4 (mg/L) - - - tFe (mg/L) < 0.08 < 0.08 < 0.1
Cl- (mg/L) 2.4 2.41 2.3 K (mg/L) - - -
Si (mg/L) - - - Mg (mg/L) 0.4 - 0.53
SiO2 (mg/L) < 16 < 16 < 16 Na (mg/L) 0 0.91 0
All measured parameters for final distillate obtained at VCF= 11.5 were below PM3 water quality requirements for reuse. Nevertheless, a deterioration of the distillate quality with growing VCF could be observed regarding, for example, tCOD and conductivity results. tCOD increased from 20 to 66 mg O2/L and the conductivity from 127 to 272 µS/cm with the applied VCF. Distillate at VCF = 11.5 differed from the two previous ones by a high conductivity due to H+. Differences could come from the deterioration of organic matter at high VCF. Note that presence of Cl, Ca and Mg is probably due to interferences since they are usually not found in the distillate in evapoconcentration trials.

New technologies or innovative treatment lines for reliable water treatment for P&P and minimization of waste production
VEO,PTS, ENV, UCM, HOL, WED, January 2012
Page | 145
Table 54: Evapoconcentration concentrates analyses
Concentrate Calc. CF Concentrate Calc. CF
pH 5.65 N-NH4 (mg/L) 2 822 9.7
Cond. (mS/cm) 118 7.7 N-NO2 (mg/L) 1 350 7.0
DM (105°C - mg/L) 128 11.5 N-NO3 (mg/L) 451 11.3
Alkalinity (mg CaCO3/L) 2 040 13.6 P-PO4 (mg/L) 835 11.1
tCOD (mgO2/L) 23 100 10.5 Ca (mg/L) 3 300 8.8
SO4 (mg/L) 21 395 11.4 tFe (mg/L) 71 11.8
Cl- (mg/L) 38 093 11.3 K (mg/L) 501 11.4
Si (mg/L) 325 1.4 Mg (mg/L) 376 11.1
SiO2 (mg/L) 310 2.1 Na (mg/L) 29 380 10.2
The calculated VCF for conductivity was lower than expected, which shows that precipitation occurred during concentration (Figure 53). This result was confirmed by calculated VCF on calcium and silica which are also lower than expected.
6.12.2RO concentrates from “PM3 waste water ���� Anaerobic ���� MBR ���� RO”
Table 55: Detailed analyses of concentrate produced by evapoconcentration
Concentrate Calc. CF Concentrate Calc. CF
pH 997 N-NH4 (mg/L) 40.0 9.1
Cond. (mS/cm) 243 8.3 N-NO2 (mg/L) 102.0 9.5
DM (105°C - mg/L) 26 800 12.2 N-NO3 (mg/L) 62.0 9.7
Alkalinity (mg CaCO3/L) 11 000 9.6 P-PO4 (mg/L) 440 6.0
tCOD (mgO2/L) 5 100 12.8 Ca (mg/L) -
SO4 (mg/L) 3 573 11.5 tFe (mg/L) 122.0 10.2
Cl- (mg/L) 1 035 10.4 K (mg/L) -
Si (mg/L) 1 400 15.2 Mg (mg/L) -
SiO2 (mg/L) 1 550 12.9 Na (mg/L) 7501 10.7
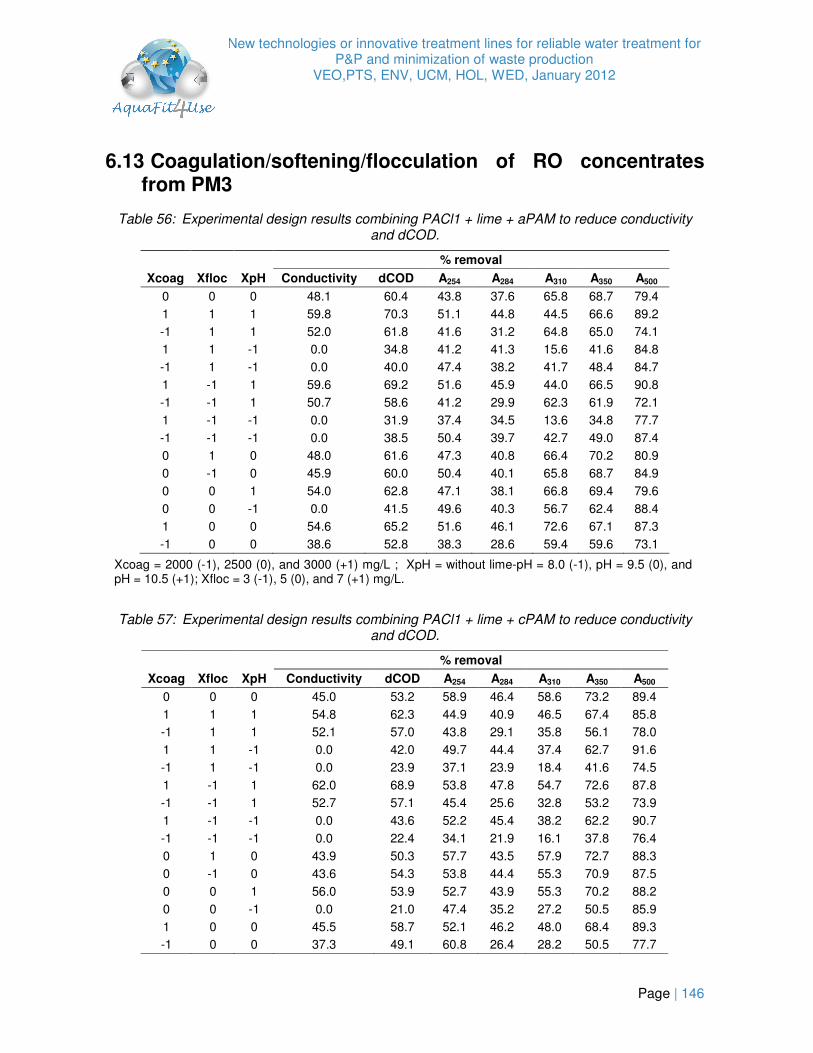
New technologies or innovative treatment lines for reliable water treatment for P&P and minimization of waste production
VEO,PTS, ENV, UCM, HOL, WED, January 2012
Page | 146
6.13 Coagulation/softening/flocculation of RO concentrates from PM3
Table 56: Experimental design results combining PACl1 + lime + aPAM to reduce conductivity and dCOD.
% removal
Xcoag Xfloc XpH Conductivity dCOD A254 A284 A310 A350 A500
0 0 0 48.1 60.4 43.8 37.6 65.8 68.7 79.4
1 1 1 59.8 70.3 51.1 44.8 44.5 66.6 89.2
-1 1 1 52.0 61.8 41.6 31.2 64.8 65.0 74.1 1 1 -1 0.0 34.8 41.2 41.3 15.6 41.6 84.8
-1 1 -1 0.0 40.0 47.4 38.2 41.7 48.4 84.7
1 -1 1 59.6 69.2 51.6 45.9 44.0 66.5 90.8
-1 -1 1 50.7 58.6 41.2 29.9 62.3 61.9 72.1
1 -1 -1 0.0 31.9 37.4 34.5 13.6 34.8 77.7
-1 -1 -1 0.0 38.5 50.4 39.7 42.7 49.0 87.4
0 1 0 48.0 61.6 47.3 40.8 66.4 70.2 80.9
0 -1 0 45.9 60.0 50.4 40.1 65.8 68.7 84.9
0 0 1 54.0 62.8 47.1 38.1 66.8 69.4 79.6
0 0 -1 0.0 41.5 49.6 40.3 56.7 62.4 88.4
1 0 0 54.6 65.2 51.6 46.1 72.6 67.1 87.3
-1 0 0 38.6 52.8 38.3 28.6 59.4 59.6 73.1
Xcoag = 2000 (-1), 2500 (0), and 3000 (+1) mg/L ; XpH = without lime-pH = 8.0 (-1), pH = 9.5 (0), and pH = 10.5 (+1); Xfloc = 3 (-1), 5 (0), and 7 (+1) mg/L.
Table 57: Experimental design results combining PACl1 + lime + cPAM to reduce conductivity and dCOD.
% removal
Xcoag Xfloc XpH Conductivity dCOD A254 A284 A310 A350 A500
0 0 0 45.0 53.2 58.9 46.4 58.6 73.2 89.4
1 1 1 54.8 62.3 44.9 40.9 46.5 67.4 85.8 -1 1 1 52.1 57.0 43.8 29.1 35.8 56.1 78.0
1 1 -1 0.0 42.0 49.7 44.4 37.4 62.7 91.6
-1 1 -1 0.0 23.9 37.1 23.9 18.4 41.6 74.5
1 -1 1 62.0 68.9 53.8 47.8 54.7 72.6 87.8
-1 -1 1 52.7 57.1 45.4 25.6 32.8 53.2 73.9
1 -1 -1 0.0 43.6 52.2 45.4 38.2 62.2 90.7
-1 -1 -1 0.0 22.4 34.1 21.9 16.1 37.8 76.4
0 1 0 43.9 50.3 57.7 43.5 57.9 72.7 88.3
0 -1 0 43.6 54.3 53.8 44.4 55.3 70.9 87.5
0 0 1 56.0 53.9 52.7 43.9 55.3 70.2 88.2
0 0 -1 0.0 21.0 47.4 35.2 27.2 50.5 85.9
1 0 0 45.5 58.7 52.1 46.2 48.0 68.4 89.3 -1 0 0 37.3 49.1 60.8 26.4 28.2 50.5 77.7

New technologies or innovative treatment lines for reliable water treatment for P&P and minimization of waste production
VEO,PTS, ENV, UCM, HOL, WED, January 2012
Page | 147
Xcoag = 2000 (-1), 2500 (0), and 3000 (+1) mg/L ; XpH = without lime-pH = 8.0 (-1), pH = 9.5 (0), and pH = 10.5 (+1); Xfloc = 3 (-1), 5 (0), and 7 (+1) mg/L.
Table 58: Models resulting from the resolution of the experimental design. Reduction percentages of conductivity, dCOD and absorbances are expressed as functions of the defined independent
variables.
PACl1+LIME+aPAM
Equations R2 Error (%)
04.47·61.27·27.3··09.2·43.19% 2 ++++−= pHCoagpHCoagpH XXXXXtyConductivi
0.997 2.5
96.53X·60.13dCOD% pH += 0.884 6.3
00.46··89.4% 254 += pHCoag XXA
0.740 3.5
47.38··96.3·50.4% 284 ++= pHCoagCoag XXXA
0.889 2.7
71.70·21.11·06.8·02.16·77.11% 22310 ++−−−= pHCoagpHCoag XXXXA
0.891 9.8
53.70·32.9··40.3·63.6·18.9% 22350 +++−−= pHpHCoagpHCoag XXXXXA
0.943 4.4
29.82·84.3··42.5% 500 ++= CoagpHCoag XXXA
0.857 3.4
PACl1+LIME+cPAM
Equations R2 Error (%)
06.43·76.27·2.2·30.15% 2 +++−= pHCoagpH XXXtyConductivi 0.996 2.4
85.47X·63.14X·60.6dCOD% pHCoag ++= 0.919 6.3
66.56·55.10% 2254 += pHXA
0.677 5.8
68.42·78.9·52.7% 2284 ++−= CoagCoag XXA
0.947 3.3
67.37·78.9% 310 += CoagXA
0.866 4.9
17.70·47.6·41.9·68.6·58.7% 22350 +++−−= pHCoagpHCoag XXXXA
0.962 3.8
86.87··21.1·47.6·29.5% 2500 +−+= pHCoagCoagCoag XXXXA
0.973 1.6