New Reverberation Mapping Results from the Lick AGN Monitoring ...
24
New Reverberation Mapping Results from the Lick AGN Monitoring Project Aaron Barth University of California, Irvine
Transcript of New Reverberation Mapping Results from the Lick AGN Monitoring ...

New Reverberation Mapping Results from the Lick AGN Monitoring Project
Aaron BarthUniversity of California, Irvine

The Team
UC IrvineAaron BarthMisty BentzJonelle WalshCarol Thornton
UC Santa BarbaraTommaso TreuJong-Hak Woo
UC RiversideGabriela CanalizoNicola BennertKyle Hiner
UCLA Matt Malkan
UC BerkeleyAlex FilippenkoWeidong LiMohan GaneshalingamNicholas LeeFrank SerdukeJoshua ShiodeJeffrey SilvermanThea SteeleXiaofeng Wang
JPLDaniel Stern
PrincetonJenny Greene
Lick ObservatoryElinor Gates
Las Cumbres ObservatoryTim BrownNairn BaliberMarton HidasRachel Street
University of TokyoTakeo MinezakiYu SakataYuzuru Yoshii

ContinuumFlux
Emission-LineFlux
Time →
Broad-line reverberation
Background: Bahcall et al. 1972, Blandford & McKee 1982, Peterson 1993

Black hole masses from reverberation
• If the broad-line kinematics are dominated by gravity, we can derive a virial estimate the central mass using the lag time Δt and the broad-line width:
• Hβ reverberation data available for ~35 low-redshift Seyferts & quasars (Kaspi et al. 2000; Peterson et al. 2004)
• Mass estimates from this technique are claimed to be accurate to typically a factor of ~3 (Onken et al 2004, Nelson et al 2004, Peterson et al 2004, Vestergaard et al 2006)
(Nelson et al 2004)
MBH = f(c!t)[FWHM(H!)]2
G
MBH = frv2
G

The broad line region radius-luminosity relationship
• The broad-line region size is correlated with AGN continuum luminosity:
(Bentz et al 2006)
5100 Å Luminosity
Rad
ius
of B
road
-Lin
e R
egio
n (li
ght-
days
)
(e.g., Laor 1998; Wandel et al. 1999; McLure & Dunlop 2001; Vestergaard 2002; Woo & Urry 2002; Shields et al. 2003; Netzer 2003, many others.... )
• This provides a quick way to estimate black hole masses in AGNs
• From a single spectrum, can measure both linewidth and continuum luminosity
• Use L to estimate r(BLR), then apply the virial relation to estimate M

Project Goals
Overall goal: to improve the calibration of the AGN radius-luminosity relation and M-σ relation at low masses and low luminosities by measuring reverberation lags for more AGNs
(Bentz et al. 2006)(Onken et al. 2004,Nelson et al 2004)

The Project
• Sample: 12 Seyfert galaxies having expected BH mass of 106 - 3×10⁷ M⊙, and expected Hβ lag times of 3-10 days
• plus one additional well-studied “control” object (NGC 5548)
• Need a continuous spectroscopic monitoring campaign to detect night-to-night variability
• every object observed on every clear night
• 64 mostly consecutive nights on the Lick 3-m telescope allocated during March-May 2008
• Nightly photometric monitoring from 4 smaller telescopes: KAIT 0.8m, Tenagra 0.8m, Palomar 60-inch, and MAGNUM 2m
The data: one night’s work at Lick

Light curves from imaging data
Spectroscopic monitoring started here

Arp 151 results (Bentz, Walsh, Barth, et al, ApJL 2008)
Hβ lags the continuum by 4.3±0.7 days

Velocity-resolved reverberation
• The variability of the emission-line flux in response to the driving continuum variability is given by
• C(t) is the continuum light curve
• L(Vr, t) is the emission-line light curve as a function of line-of-sight velocity and time
• Ψ(Vr, t) is the transfer function
• it depends on the detailed geometry, kinematics, and emissivity distribution of the broad-line region
L(Vr, t) =! !
"!!(Vr, !)C(t! !)d!

Velocity-resolved reverberation
Rotating Keplerian disk
(figures from Welsh & Horne 1991)
Velocity (km/s)
Tim
e de
lay
(day
s)
blueshifted redshifted

Velocity-resolved reverberation
Outflow
(figures from Welsh & Horne 1991)
Velocity (km/s)
Tim
e de
lay
(day
s)
blueshifted redshifted

Velocity-resolved reverberation
Infall
(figures from Welsh & Horne 1991)
Velocity (km/s)Ti
me
dela
y (d
ays)
blueshifted redshifted

Velocity-resolved reverberationin Arp 151
• Hβ lag measured as a function of velocity across the broad emission line
• Blue/red asymmetry indicates inflowing motions in the BLR
(Bentz, Walsh, Barth, et al, ApJL, 2008)

Black hole masses (Bentz et al, in prep.)
• Reverberation lags measured successfully for 9 out of 13 objects (including NGC 5548)
• Typical measurement uncertainty on the Hβ lag is ~20-25%

Characteristic variability timescales
• For discretely-sampled time series, the variability can be characterized by a structure function (e.g., Cid Fernandes et al. 2000; Collier & Peterson 2001):
SF (!) =1
N(!)
![f(ti)! f(tj)]2
! = tj ! tiwhere

Characteristic variability timescales
No. 2, 2001 AGN UV/OPTICAL TIMESCALES 777
match d to about the median temporal sampling of individ-ual light curves. This resolution de!nes, approximately, theshortest timescale to which the data are sensitive. Further-more, we only determine the structure function for bins withgreater than six data pairs. The statistical uncertainties inour structure functions are de!ned by withp
i/(N
i/2)1@2, p
ithe root mean square (rms) deviations about the meanstructure function value in bin i and the number of pairsN
iof data points in bin i. Our ad hoc, but reasonable, errorestimates reÑect the fact that not all pairs of measurementsin a given bin are independent. This appears acceptable,since the observed structure functions are much smootherthan their p values would suggest and not notably inconsis-tent with their error bars de!ned by the standard deviationof the mean value for each bin. Finally, for cases where alinear trend clearly contributes to the UV/optical timeseries, biasing the structure function analysis, we detrendthe data by subtracting a linear least-squares !t. This pre-vents statistical Ñuctuations in the poorly de!ned low-frequency power from biasing our high-frequency powerestimates, discussed in detail by Welsh (1999).
3.1. UV Structure FunctionsThe UV light curves may be roughly described by aperio-
dic fractional Ñux variations, de!ned by a rms divided bymean Ñux of D15% on timescales of 1 month, with tempo-ral resolutions of D0.2È4 days for D2È14 months. The lightcurves are all IUE observations, except for the HST 1993campaign on NGC 5548.
Figure 1 presents our binned structure functions for !vesources. Typically, they all exhibit the characteristic shape
outlined in ° 2. We note, by attempting to remove the e†ectsof measurement uncertainties we suppress and/or removethe expected Ñat plateau on the shortest timescales. Forcases where the structure function still notably Ñattens o†,e.g., NGC 5548, this is most likely due to a slight underesti-mation of the true measurement uncertainties. A power-lawsection, delineating the variability correlation length onintermediate timescales, is obvious for all sources, exceptperhaps NGC 3783. In this case there is suggestion of apower-law section on q ! 10 days, but it remains ill de!ned,primarily due to lack of temporal resolution. On longertimescales, the structure functions Ñatten on timescales ofD6È40 days before exhibiting oscillations.
Oscillations in S(q) occur on timescales for which themean-squared amplitude variations are of order 2 p2. Onthese longer timescales our structure functions are compa-ratively ill-de!ned on account of the reduced number ofdata pairs available. This complicates any detailed analysis.The diversity in character of these oscillations reÑects,mostly, the unique character of the individual source varia-tions. The oscillations result from light curves being domi-nated by one or two large outbursts, !nite duration, andnonstationary e†ects, e.g., disparate Ñux levels at the startand end of monitoring and/or quasi-periodic oscillations(not well suited to a structure function analysis). Indeed, onevisually notes a quasi-periodic variation of D16 days in theUV/optical light curves of NGC 7469. This periodicity iscon!rmed with a classic periodogram analysis, but is only 3times the length of the monitoring experiment and therebyviewed with caution. Its reality or otherwise should betested with independent data sustained over many months.
FIG. 1.ÈUV structure functions for !ve active galaxies, as labeled. NGC 5548 appears twice since it has been the target of two intensive monitoringcampaigns in 1989 and 1993. The structure functions are normalized by their light-curve variance, and the e†ects of measurement uncertainties have beenremoved (° 3). A full discussion is given in ° 3.1.
(Data fromCollier & Peterson 2001)
• SF is typically normalized by dividing by the light curve variance σ2
Power-law section:
Shows the range of timescales over which variations are correlated
Flat section:
For an infinite, stationary process, the light curve flattens out when variations are no longer correlated
In the flat section, the structure function typically oscillates strongly due to the finite duration of the observed time series

LAMP Structure functions (Walsh et al., in prep)

NGC 4395;Desroches et al. 2006
Dependence of variability timescale on black hole mass (Walsh et al., in prep)
Cid Fernandes et al. 2000
Collier & Peterson
2001
NGC 5548
LAMP sample
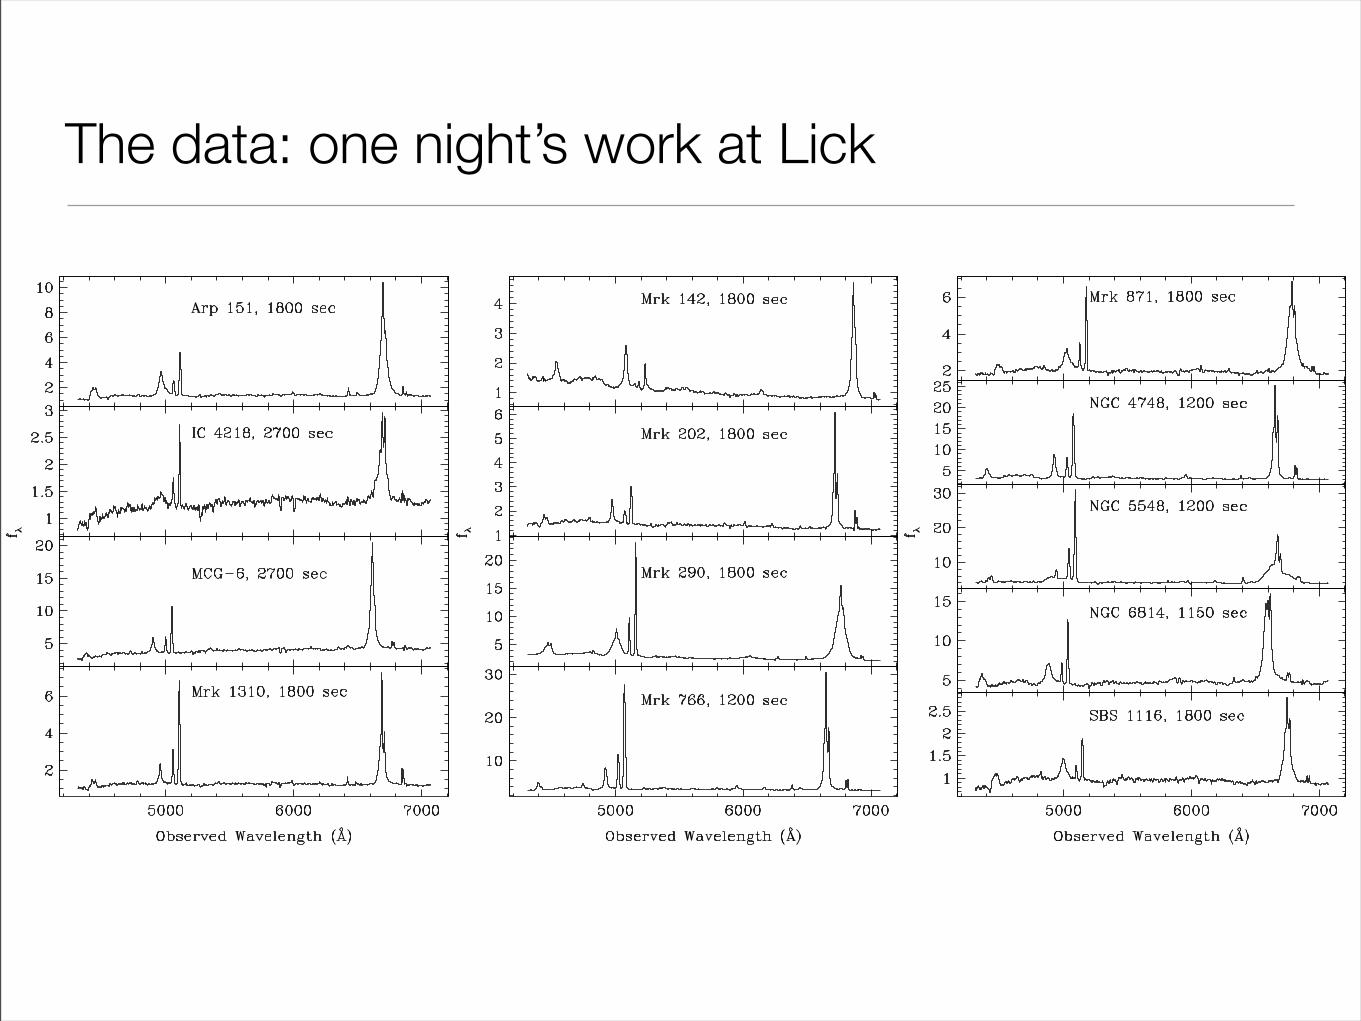
Variability timescale: relationship with MBH and L (Walsh et al., in prep)
• Determine the combination of log(MBH) and log(Lbol) that best predicts the characteristic timescale by minimizing the scatter
• Relationship holds over ~4 orders of magnitude in MBH, including the dwarf AGN NGC 4395
• See also Kelly et al (2009) for related results from light-curve fitting
Collier & Peterson
2001NGC 5548
LAMP sample
NGC 4395;Desroches et al. 2006
log[τchar/days] = A log[MBH/M⊙] + B log[Lbol/(erg s-1)] + C
Cid Fernandes et al. 2000

Future work
• Reverberation lags for other lines: Hα, Hγ, He II
• Stellar velocity dispersions and the MBH-σ relation for the AGNs
• Cycle 17 Hubble project approved to image the entire sample
• GALFIT modeling of HST images gives a clean measurement of the bulge starlight contamination of the AGN- use this to determine the BLR radius-luminosity relationship
• MBH - Lbulge relationship
• Modeling the velocity-resolved variability to constrain the BLR kinematics
• MAGNUM near-infrared light curves: K-band reverberation
• Test which single-epoch recipes best reproduce the MBH determined from reverberation data

Summary
• Reverberation mapping is fundamental for understanding the cosmic evolution of black hole masses
• LAMP has obtained 8 new reverberation lag measurements for local AGNs at low masses & luminosities
• Velocity-resolved variability shows a variety of kinematic states in BLRs
• Characteristic optical variability timescales in AGNs are well correlated with black hole mass and luminosity
• With large multi-color variability surveys, these relationships can provide new clues to accretion disk structure
• Reverberation mapping remains an important niche for small to medium-sized telescopes


![arXiv:1505.04805v1 [astro-ph.GA] 18 May 20152 Reverberation Mapping Primer Many independent studies have led to the general picture of AGN structure that we understand today (e.g.,](https://static.fdocuments.net/doc/165x107/5fa032b2d7d46471f6360345/arxiv150504805v1-astro-phga-18-may-2015-2-reverberation-mapping-primer-many.jpg)