New Multi-Product Pipeline Project - Transnet Home presentations/NMPP Media... · Media...
28
Media Presentation 8 December 2010 New Multi-Product Pipeline Project 1
Transcript of New Multi-Product Pipeline Project - Transnet Home presentations/NMPP Media... · Media...
Media Presentation8 December 2010
New Multi-Product Pipeline Project
1
Index Speaker
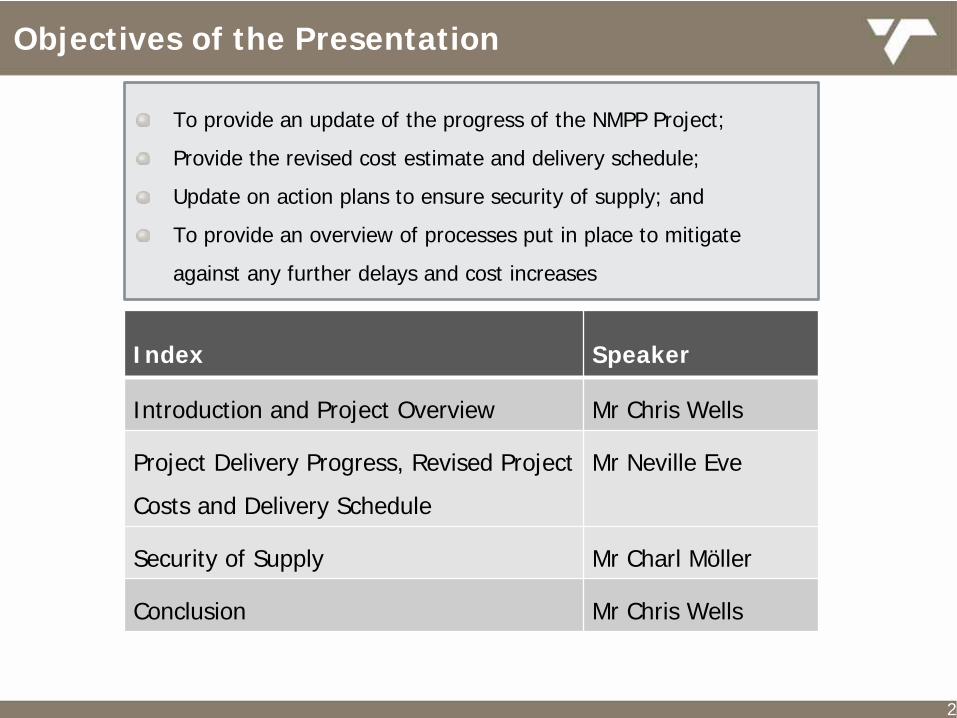
Introduction and Project Overview Mr Chris Wells
Project Delivery Progress, Revised Project
Costs and Delivery Schedule
Mr Neville Eve
Security of Supply Mr Charl Möller
Conclusion Mr Chris Wells
To provide an update of the progress of the NMPP Project;
Provide the revised cost estimate and delivery schedule;
Update on action plans to ensure security of supply; and
To provide an overview of processes put in place to mitigate
against any further delays and cost increases
2
Objectives of the Presentation
NMPP GOVERNANCE STEERING COMMITTEE(Dry Run for the Board on 26 November 2010)17 November 2010
New Multi-Product Pipeline ProjectIntroduction and Project Overview
3
Mr Chris Wells
Background and Context: NMPP Project
4
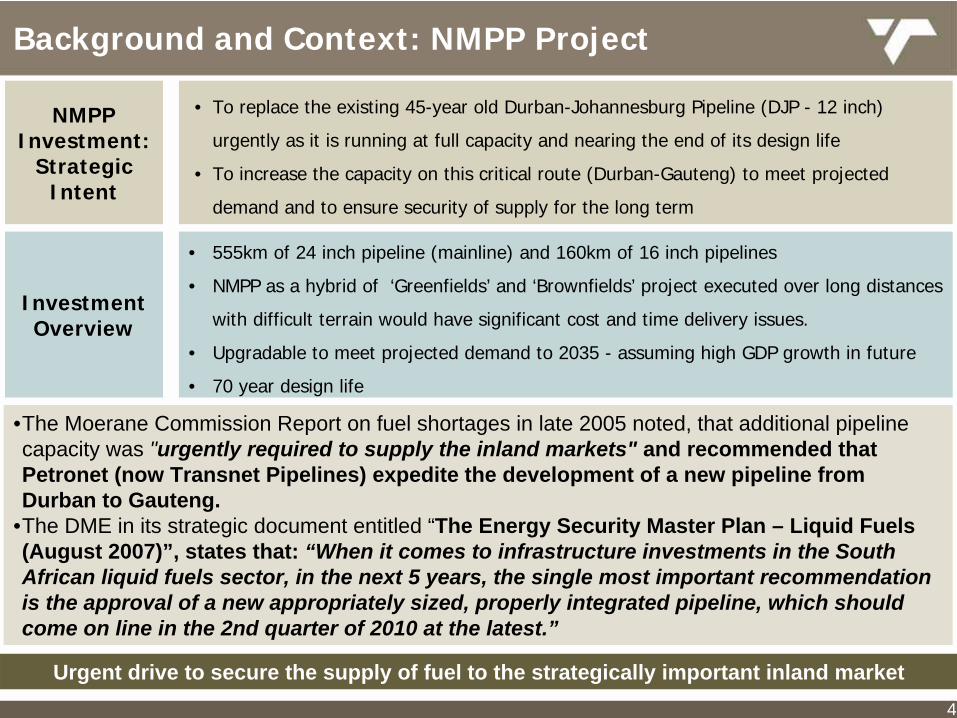
•The Moerane Commission Report on fuel shortages in late 2005 noted, that additional pipeline capacity was "urgently required to supply the inland markets" and recommended that Petronet (now Transnet Pipelines) expedite the development of a new pipeline from Durban to Gauteng.
•The DME in its strategic document entitled “The Energy Security Master Plan – Liquid Fuels (August 2007)”, states that: “When it comes to infrastructure investments in the South African liquid fuels sector, in the next 5 years, the single most important recommendation is the approval of a new appropriately sized, properly integrated pipeline, which should come on line in the 2nd quarter of 2010 at the latest.”
NMPP Investment:
Strategic Intent
• To replace the existing 45-year old Durban-Johannesburg Pipeline (DJP - 12 inch)
urgently as it is running at full capacity and nearing the end of its design life
• To increase the capacity on this critical route (Durban-Gauteng) to meet projected
demand and to ensure security of supply for the long term
Investment Overview
• 555km of 24 inch pipeline (mainline) and 160km of 16 inch pipelines
• NMPP as a hybrid of ‘Greenfields’ and ‘Brownfields’ project executed over long distances
with difficult terrain would have significant cost and time delivery issues.
• Upgradable to meet projected demand to 2035 - assuming high GDP growth in future
• 70 year design life
Urgent drive to secure the supply of fuel to the strategically important inland market
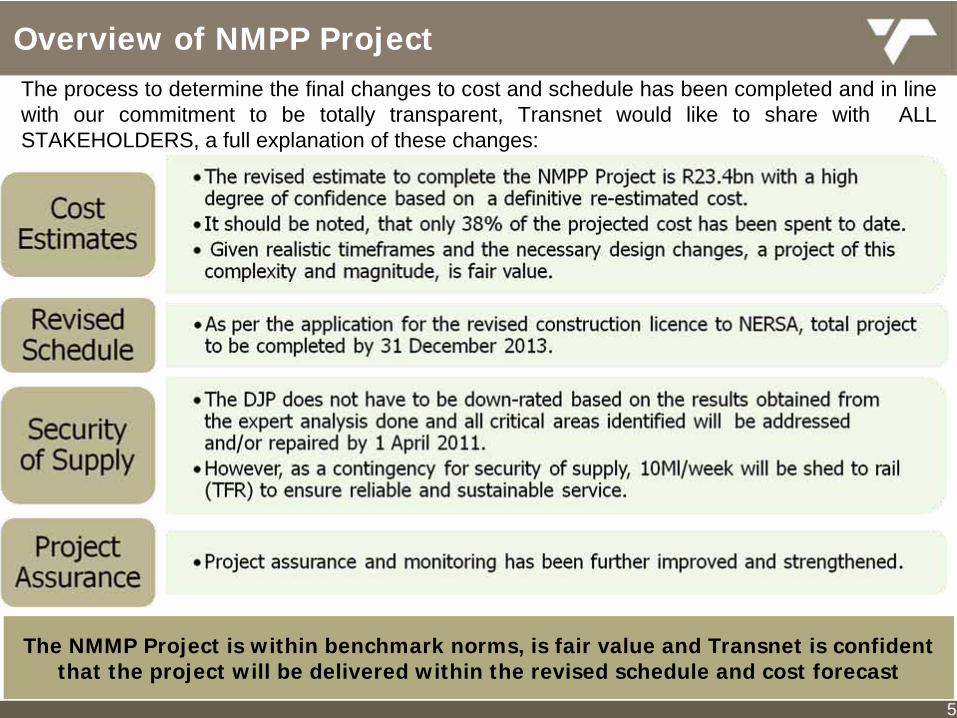
Overview of NMPP ProjectThe process to determine the final changes to cost and schedule has been completed and in line with our commitment to be totally transparent, Transnet would like to share with ALL STAKEHOLDERS, a full explanation of these changes:
5
The NMMP Project is within benchmark norms, is fair value and Transnet is confident that the project will be delivered within the revised schedule and cost forecast
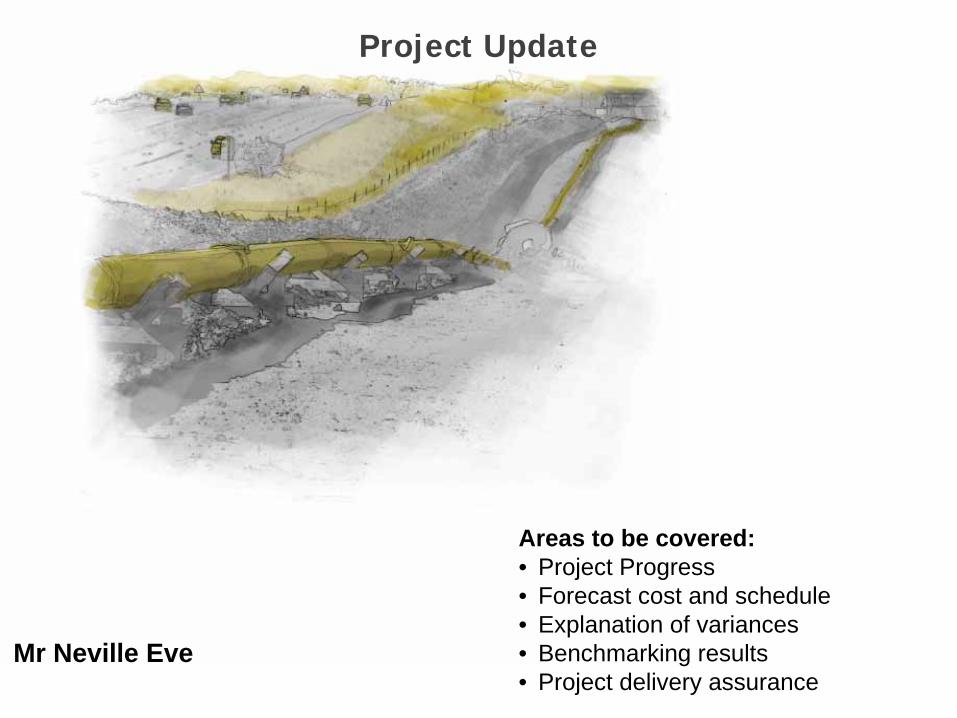
New Multi-Product Pipeline ProjectProject Update
6
Mr Neville Eve
Areas to be covered:• Project Progress• Forecast cost and schedule• Explanation of variances• Benchmarking results• Project delivery assurance
In lan d te rm in a l an d p u m p s ta tio n
C o as ta l t e rm in a l a n d p u m p s ta tio n
K w a Z u lu ‐N a ta l
L e s o th o
F re eS ta te
M p u m a la n g a
N o r th ‐W e s t
V a n R e e n e n
L a d ys m ith
V re d e
M o o irive r
H ow ic k
D U R B A N
I n d ia n O c e a n
P S 1P S 2
P S 3
P S 4
P S 5
P S 6
P S 7
P S 8
L a n g la a g te
K en d a l
W a ltloo
S a s o lbu rg
K ro o ns ta d
K le rk s d orp
P o tc he fs tro om
C o a lb r oo k
S e c u nd a
T a rlto n
O R T IAR u s te nb u rg
P re to ria W e s t
V o lk s ru s tW ilg e
J A M E S O N P A R K
B e th le he m
W itba nk
K e y
P rop o s e d N M P P T ru nk lin e
E x is ting p ip e line (D J P )
C itie s a n d to w ns
P um p s ta tion s
N MP P In la nd l in e s
E x is ting in la n d n e tw ork
N o rth e rn c o rrid o r a lte rn a tiv e
A lro d e
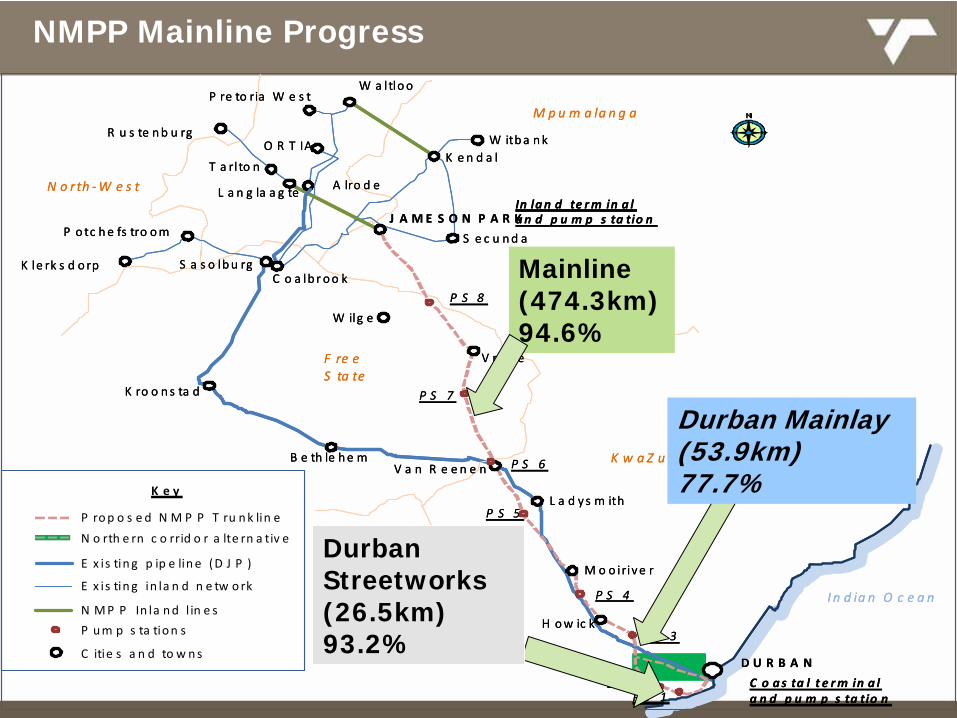
Durban Streetworks (26.5km) 93.2%
Durban Mainlay(53.9km)77.7%
Mainline (474.3km) 94.6%
NMPP Mainline Progress
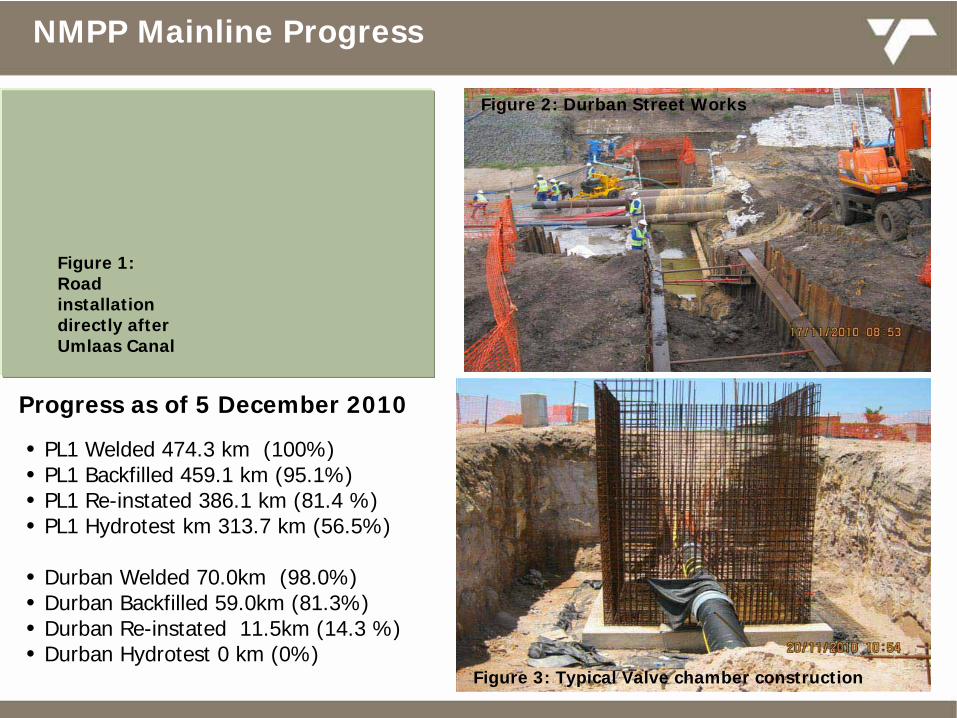
Progress as of 5 December 2010
• PL1 Welded 474.3 km (100%)• PL1 Backfilled 459.1 km (95.1%)• PL1 Re-instated 386.1 km (81.4 %)• PL1 Hydrotest km 313.7 km (56.5%)
• Durban Welded 70.0km (98.0%)• Durban Backfilled 59.0km (81.3%)• Durban Re-instated 11.5km (14.3 %) • Durban Hydrotest 0 km (0%)
Figure 1: Road installation directly after Umlaas Canal
Figure 2: Durban Street Works
Figure 3: Typical Valve chamber construction
NMPP Mainline Progress
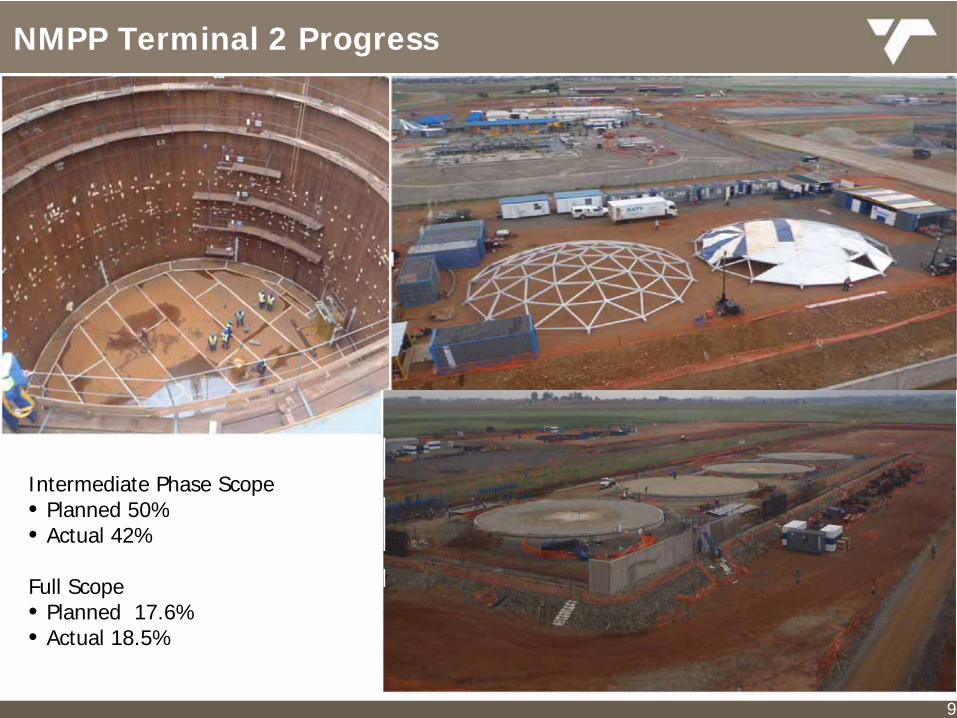
NMPP Terminal 2 Progress
9
Intermediate Phase Scope• Planned 50%• Actual 42%
Full Scope• Planned 17.6%• Actual 18.5%
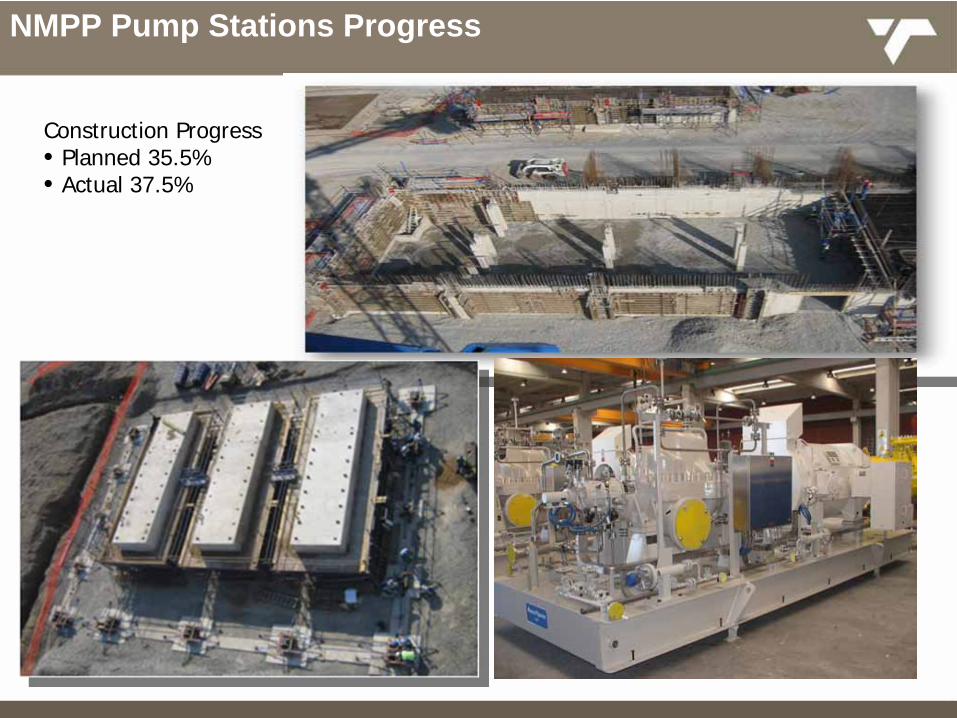
NMPP Pump Stations Progress
Construction Progress • Planned 35.5%• Actual 37.5%

NMPP Project Progress Achievements
Inland PipelinesConstruction completed
PL4 – ready for operations by the end of December PL2 & PL3 – RFC by mid December
MainlineMain River crossings complete (49)
Major Wetland crossings complete (481) (95km)
Land Acquisitions complete (1148 properties)
All Environmental Approvals in place
550 km in the ground
Pump StationsMajor equipment procured
On schedule
Excellent safety record
Terminals TM2 on schedule
TM1 re-setup complete
Excellent safety record
11This important strategic project is on track to meet the revised schedule

Revised Dates: Ready for Hot Commissioning / Operation (RFC / RFO)
12
Component RFC RFO
PL4 Inland Pipeline 1 Dec 2010 31 Dec 2010
PL2 & 3 Inland Pipelines 18 Dec 2010 mid Jan 2011
PL1 24 inch Trunk Line and Inland Pump Stations (PS1, PS3, PS5)
30 Sept 2011 31 Dec 2011
Inland Terminal (TM2) 30 Sept 2012 31 Dec 2012
Coastal Terminal (TM1) 30 Sept 2013 31 Dec 2013
NMPP Project Scheduled Completion
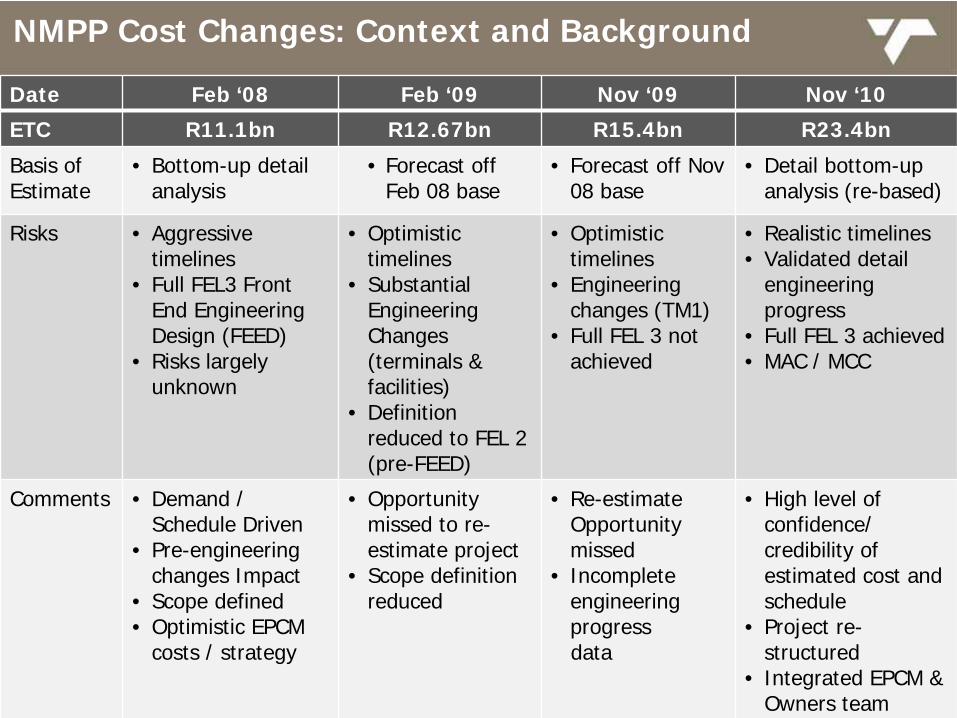
NMPP Cost Changes: Context and Background
13
Date Feb ‘08 Feb ‘09 Nov ‘09 Nov ‘10
ETC R11.1bn R12.67bn R15.4bn R23.4bn
Basis of Estimate
• Bottom-up detail analysis
• Forecast off Feb 08 base
• Forecast off Nov 08 base
• Detail bottom-up analysis (re-based)
Risks • Aggressive timelines
• Full FEL3 Front End Engineering Design (FEED)
• Risks largely unknown
• Optimistic timelines
• Substantial Engineering Changes (terminals & facilities)
• Definition reduced to FEL 2 (pre-FEED)
• Optimistic timelines
• Engineering changes (TM1)
• Full FEL 3 not achieved
• Realistic timelines• Validated detail
engineering progress
• Full FEL 3 achieved• MAC / MCC
Comments • Demand / Schedule Driven
• Pre-engineering changes Impact
• Scope defined• Optimistic EPCM
costs / strategy
• Opportunity missed to re- estimate project
• Scope definition reduced
• Re-estimate Opportunity missed
• Incomplete engineering progressdata
• High level of confidence/ credibility of estimated cost and schedule
• Project re- structured
• Integrated EPCM & Owners team
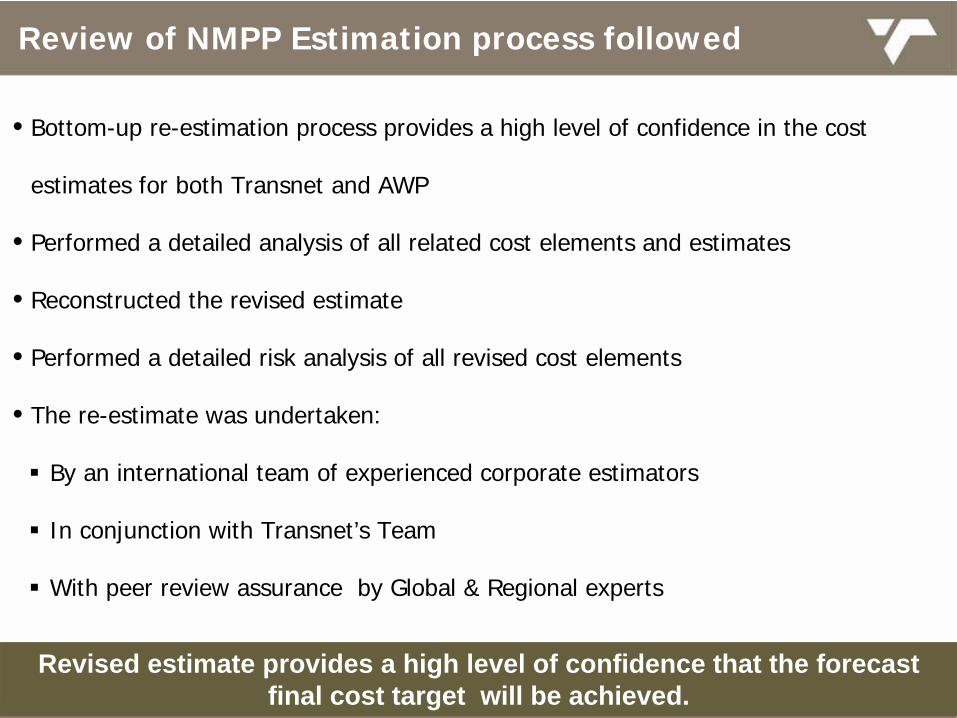
Review of NMPP Estimation process followed
• Bottom-up re-estimation process provides a high level of confidence in the cost
estimates for both Transnet and AWP
• Performed a detailed analysis of all related cost elements and estimates
• Reconstructed the revised estimate
• Performed a detailed risk analysis of all revised cost elements
• The re-estimate was undertaken:
By an international team of experienced corporate estimators
In conjunction with Transnet’s Team
With peer review assurance by Global & Regional experts
14
Revised estimate provides a high level of confidence that the forecast final cost target will be achieved.

Reconciliation of Latest Estimated Total Cost (ETC)
15
Analysis of Increase in ETC(R billion)
0.7
15.4
4.3
11.1
10.8
Final ETC (All
risks)�(P
70)
23.4
EPCM Risk
0.5
Risk Adjustment
to P70
0.3
Transnet ETC
(P50)
22.6
Risk Adjustment
Revised AWP ETC
(P50)
21.9
Cost increase
6.5
ETC�Nov 2009�(P
50)
Cost increase
ETC Feb 2009
Revised ETC (P70) a fair reflection of cost based on detail reviews and benchmarks

Summary of Cost and Schedule Movements Movement in Schedule & Budget from February 2008 Board (R11,137bn) to November 2010 Board (R23,4bn)
16
R15.4bn
*
* Driven by regulatory and engineering design requirements
+ R10,844bn appears reasonable and conservative when compared to the validation of the AWP re- estimate+
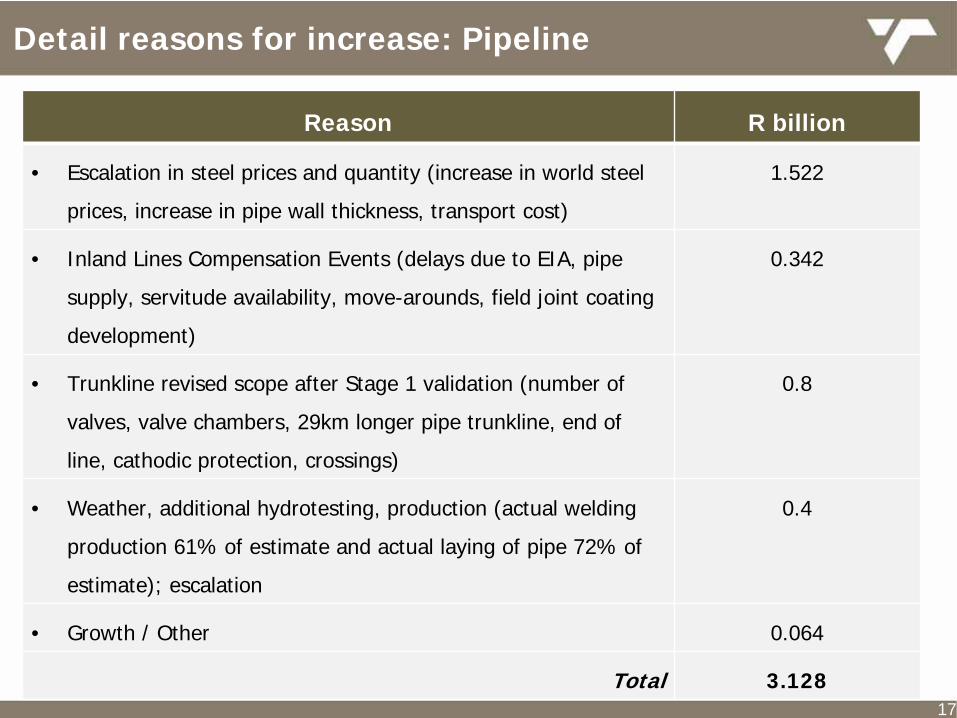
Detail reasons for increase: Pipeline
Reason Value1 Escalation in steel prices ZAR 1.519 B
2 Pipeline construction ZAR 0.535 B
3 Negotiated final account ZAR 1.059 B
4 Increased wall thickness
5 Increase in crossings
6 Increase in pipe length (re-location of TM 1)
Total
Reason R billion
• Escalation in steel prices and quantity (increase in world steel
prices, increase in pipe wall thickness, transport cost)
1.522
• Inland Lines Compensation Events (delays due to EIA, pipe
supply, servitude availability, move-arounds, field joint coating
development)
0.342
• Trunkline revised scope after Stage 1 validation (number of
valves, valve chambers, 29km longer pipe trunkline, end of
line, cathodic protection, crossings)
0.8
• Weather, additional hydrotesting, production (actual welding
production 61% of estimate and actual laying of pipe 72% of
estimate); escalation
0.4
• Growth / Other 0.064
Total 3.12817

Reason R billion
• Additional Pump Station PS3 0.133
• Addition of 2 metering stations PS7 & PS8 0.059
• HV Electrical Supply and Sub Stations 0.081
• Spill basin; acoustic pump housing; blast proofing
buildings incl. doors; building growth; paving
embankments; bulk earthworks; internal surfacing;
piping class change; additional diesel storage tanks;
fence specification; extended construction period;
additional isolation valves
0.083
• Power Generators 0.177
• Growth / Other 0.017
Total 0.550
18
Detail reasons for increase: Pump Stations
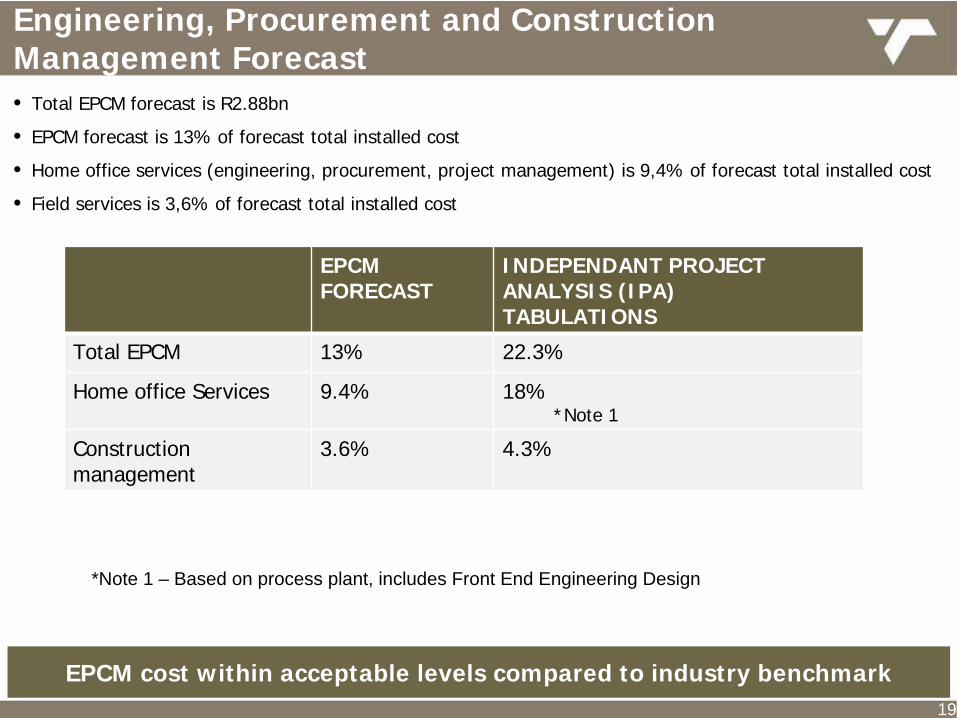
Engineering, Procurement and Construction Management Forecast• Total EPCM forecast is R2.88bn
• EPCM forecast is 13% of forecast total installed cost
• Home office services (engineering, procurement, project management) is 9,4% of forecast total installed cost
• Field services is 3,6% of forecast total installed cost
EPCM FORECAST
INDEPENDANT PROJECT ANALYSIS (IPA)TABULATIONS
Total EPCM 13% 22.3%
Home office Services 9.4% 18% *Note 1
Construction management
3.6% 4.3%
*Note 1 – Based on process plant, includes Front End Engineering Design
19
EPCM cost within acceptable levels compared to industry benchmark
20
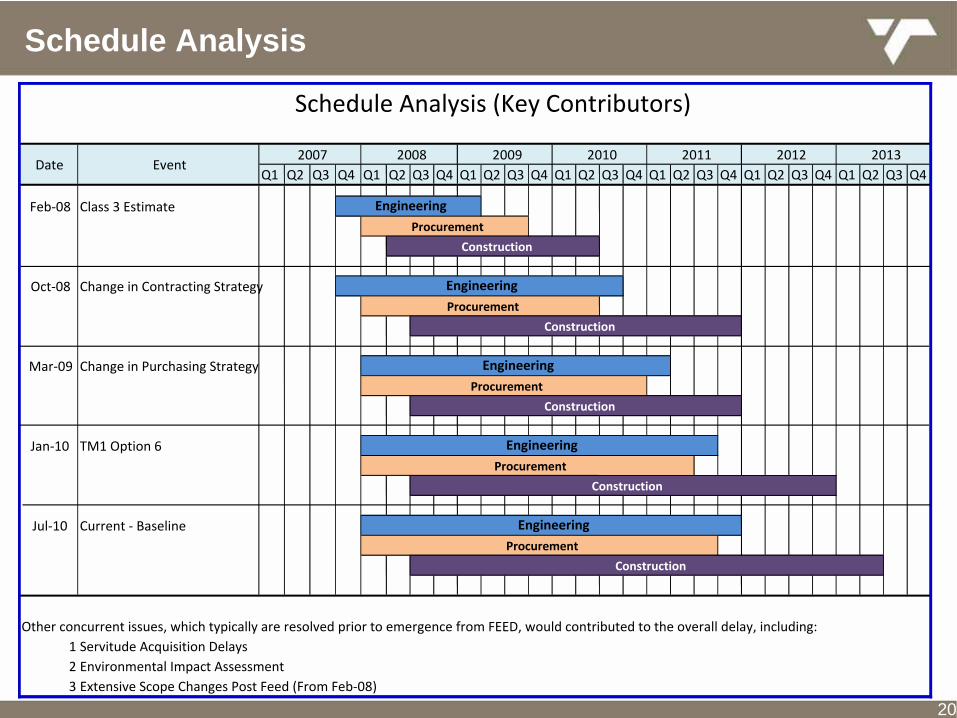
Q1 Q2 Q3 Q4 Q1 Q2 Q3 Q4 Q1 Q2 Q3 Q4 Q1 Q2 Q3 Q4 Q1 Q2 Q3 Q4 Q1 Q2 Q3 Q4 Q1 Q2 Q3 Q4
Feb‐08 Class 3 Estimate
Oct‐08 Change in Contracting Strategy
Mar‐09 Change in Purchasing Strategy
Jan‐10 TM1 Option 6
Jul‐10 Current ‐
Baseline
Other concurrent issues, which typically are resolved prior to emergence from FEED, would contributed to the overall delay, including:1 Servitude Acquisition Delays2 Environmental Impact Assessment3 Extensive Scope Changes Post Feed (From Feb‐08)
Procurement
Procurement
Construction
Engineering
Construction
Procurement
Construction
EngineeringProcurement
Construction
Date Event
Schedule Analysis (Key Contributors)
Engineering
2008 2009 2010 2011 2012 2013
EngineeringProcurement
Construction
2007
Engineering
Schedule Analysis
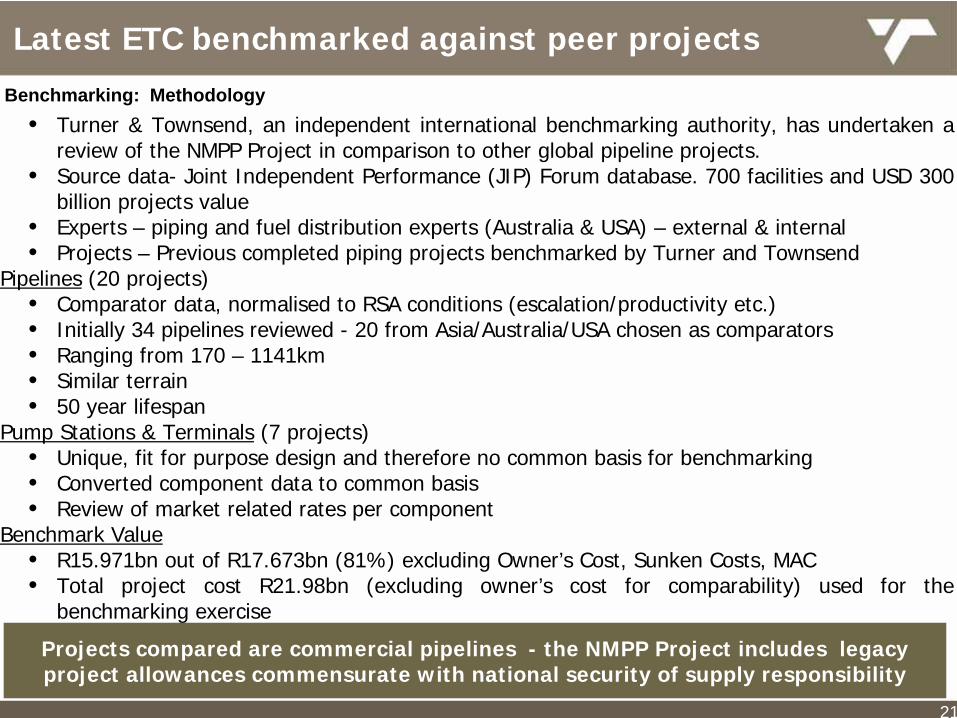
Latest ETC benchmarked against peer projects
Benchmarking: Methodology • Turner & Townsend, an independent international benchmarking authority, has undertaken a
review of the NMPP Project in comparison to other global pipeline projects.• Source data- Joint Independent Performance (JIP) Forum database. 700 facilities and USD 300
billion projects value• Experts – piping and fuel distribution experts (Australia & USA) – external & internal • Projects – Previous completed piping projects benchmarked by Turner and Townsend
Pipelines (20 projects)• Comparator data, normalised to RSA conditions (escalation/productivity etc.)• Initially 34 pipelines reviewed - 20 from Asia/Australia/USA chosen as comparators• Ranging from 170 – 1141km• Similar terrain• 50 year lifespan
Pump Stations & Terminals (7 projects)• Unique, fit for purpose design and therefore no common basis for benchmarking• Converted component data to common basis• Review of market related rates per component
Benchmark Value• R15.971bn out of R17.673bn (81%) excluding Owner’s Cost, Sunken Costs, MAC• Total project cost R21.98bn (excluding owner’s cost for comparability) used for the
benchmarking exercise
21
Projects compared are commercial pipelines -
the NMPP Project includes legacy project allowances commensurate with national security of supply
responsibility

Benchmarking: Pipeline
• Review included 550km of 24” and 160km of 16”
• Percentage below indicates how the NMPP
pipeline compares to the comparator norm
• Construction -9%
• Materials +14%
• Overall -13.4%
22
67
22
110
5069
Transport Field Coating
LocationSteel price
Pipeline Coating
Increases - R million
Variances

Benchmarking: Pump Stations (on the basis of KW/R)
Pump stations (7 projects)• Review of market conditions, favourable 75% of rates reviewed (earthwork, excavation,
concrete, formwork, steel , rebar and pumps)• Normalised rates from both Gauteng & KwaZulu Natal• Comparison of pump station components against norms
Result• Tendered rates compare very favourably to prevailing market conditions at the time:
• Costs are above norm (Based on KW/R comparison)• Reasons for variances: (legacy allowances & time related costs)
• Security, explosion resistant control room and electrical substations (R80million)• NKP (R70 million)• Generators/Diesel storage (R180 million)• Additional standby pumps (R147 million)• Escalation (R75 million)• Sound proofing (R28 million)• 50 year flood basin (75mpa concrete) (R10million)
Item NMPP Comparator %
Clearing and grubbing m² R 2.10 R 7.80 72%
Excavation m³ R 19.30 R35.40 45%
Concrete 30mpa m³ R 989 R1055 6.1%
Rebar ton R7941 R9190 13%
23
Benchmarking: Pump Stations

Project Management Summary
24
• Detailed and thorough re-baselining exercise is complete with full involvement of
the EPCM service provider and Transnet teams
• The delivery team has been substantially strengthened, together with greater
collaboration, integration and alignment and a new leadership team is in place
• Reporting is accurate and reflects current performance
• Enhanced governance and controls along with updated project processes,
systems and tools implemented
• Rigorous change management control has been implemented
• Engineering production management process enhanced, engineering review
completed and peer reviews undertaken
Transnet is confident that the NMPP Project has been structured for success and will be delivered to meet the revised cost and schedule commitments

.
• Stream 8: Stakeholder Engagement and Reputation Management
• NERSA• DOE• DPE
• Recommendations
Security of Supply
25
Mr Charl Möller
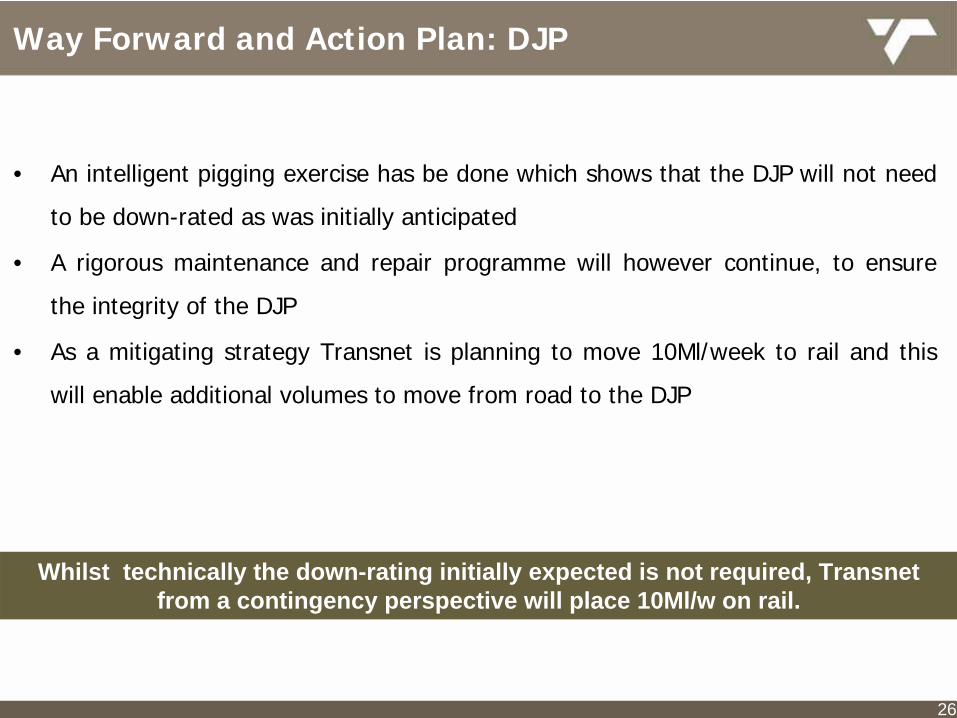
• An intelligent pigging exercise has be done which shows that the DJP will not need
to be down-rated as was initially anticipated
• A rigorous maintenance and repair programme will however continue, to ensure
the integrity of the DJP
• As a mitigating strategy Transnet is planning to move 10Ml/week to rail and this
will enable additional volumes to move from road to the DJP
Way Forward and Action Plan: DJP
26
Whilst technically the down-rating initially expected is not required, Transnet from a contingency perspective will place 10Ml/w on rail.
NMPP GOVERNANCE STEERING COMMITTEE(Dry Run for the Board on 26 November 2010)17 November 2010
New Multi-Product Pipeline ProjectConclusion and Way Forward
27
Mr Chris Wells
In Closing
28
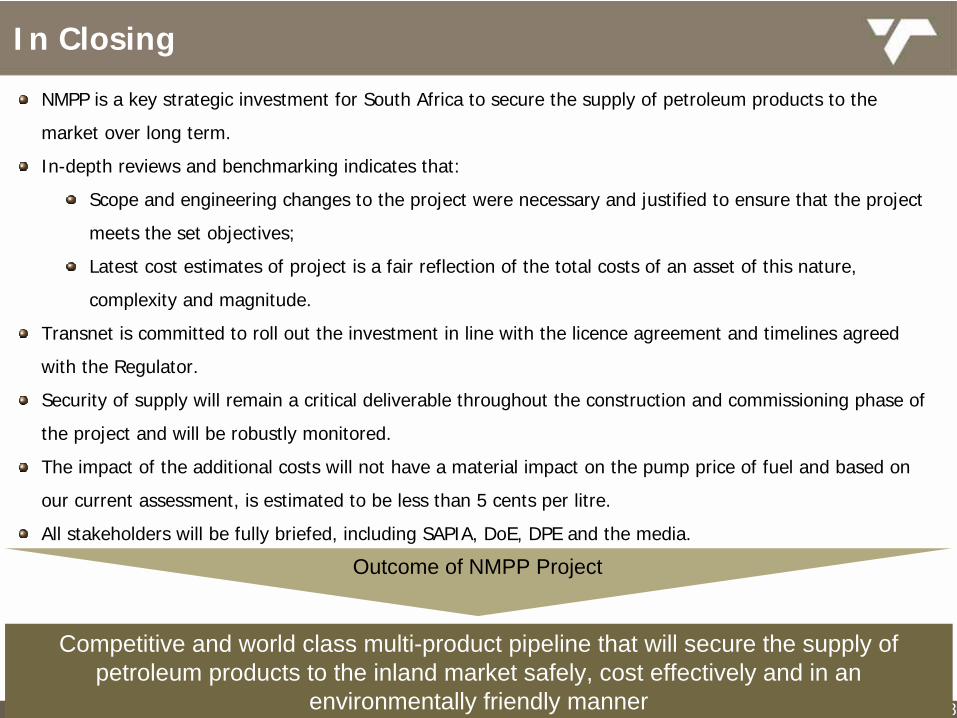
NMPP is a key strategic investment for South Africa to secure the supply of petroleum products to the
market over long term.
In-depth reviews and benchmarking indicates that:
Scope and engineering changes to the project were necessary and justified to ensure that the project
meets the set objectives;
Latest cost estimates of project is a fair reflection of the total costs of an asset of this nature,
complexity and magnitude.
Transnet is committed to roll out the investment in line with the licence agreement and timelines agreed
with the Regulator.
Security of supply will remain a critical deliverable throughout the construction and commissioning phase of
the project and will be robustly monitored.
The impact of the additional costs will not have a material impact on the pump price of fuel and based on
our current assessment, is estimated to be less than 5 cents per litre.
All stakeholders will be fully briefed, including SAPIA, DoE, DPE and the media.
Competitive and world class multi-product pipeline that will secure the supply of petroleum products to the inland market safely, cost effectively and in an
environmentally friendly manner
Outcome of NMPP Project