New Mexico Safety Corridors Identification and Creation Processes Sandra Martinez Annaliese Mayette.
17
New Mexico Safety Corridors Identification and Creation Processes Sandra Martinez Annaliese Mayette
-
Upload
bridget-richardson -
Category
Documents
-
view
215 -
download
0
description
Demographics Demographics 5 th Largest State 2002 Population= 1,884,617 MVM= 2002 MVM/ 100k Pop= 2002 Licenses Drivers= 1,240,000 Licensed Drivers/Pop >15yo= 84.6% Road Miles=State Roadways about10,000 miles
Transcript of New Mexico Safety Corridors Identification and Creation Processes Sandra Martinez Annaliese Mayette.

New Mexico Safety Corridors Identification and Creation
Processes
Sandra MartinezAnnaliese Mayette
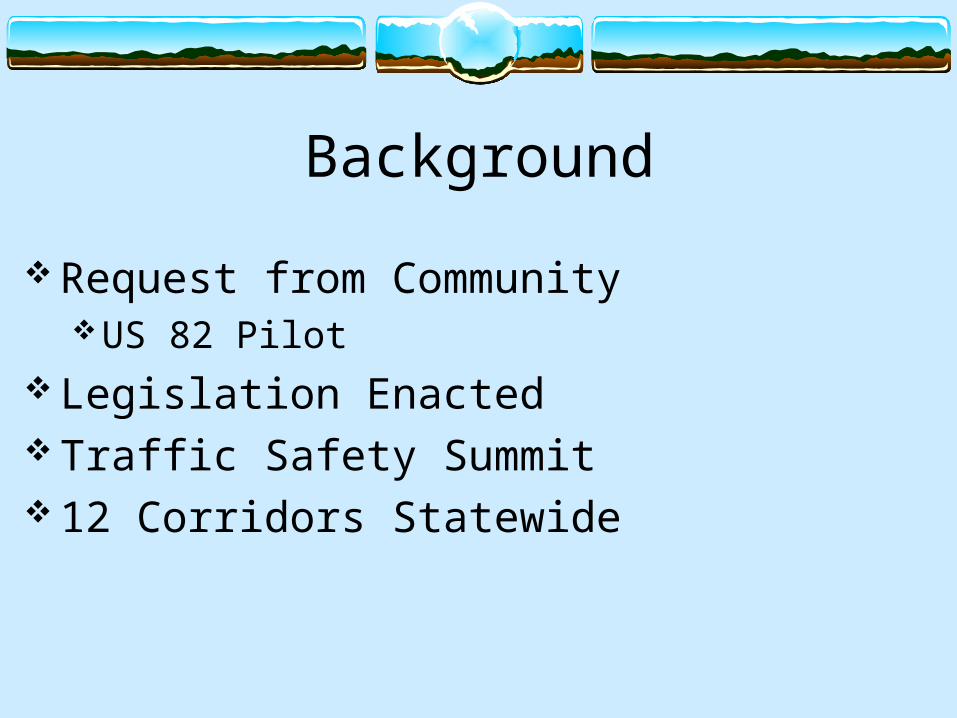
Background
Request from CommunityUS 82 Pilot
Legislation Enacted Traffic Safety Summit 12 Corridors Statewide
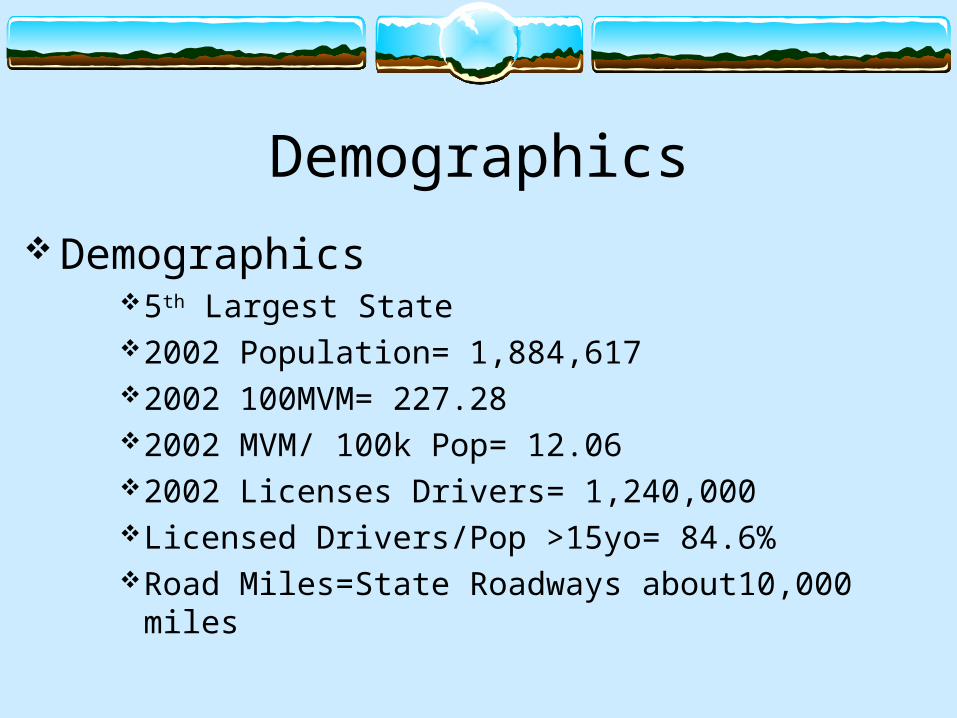
Demographics Demographics
5th Largest State2002 Population= 1,884,6172002 100MVM= 227.282002 MVM/ 100k Pop= 12.062002 Licenses Drivers= 1,240,000Licensed Drivers/Pop >15yo= 84.6%Road Miles=State Roadways about10,000 miles

US 82 Pilot

Participation Community Law Enforcement District Engineer FHWA Political Entities Advocacy groups Media Emergency Responders (Fire & EMS)

Criteria 3 to 5 Year History on serious injury and fatality
crashes. Crash Investigation Unit Review of existing initiatives Review by NMDOT District Engineer Media Campaign Equipment and signage review
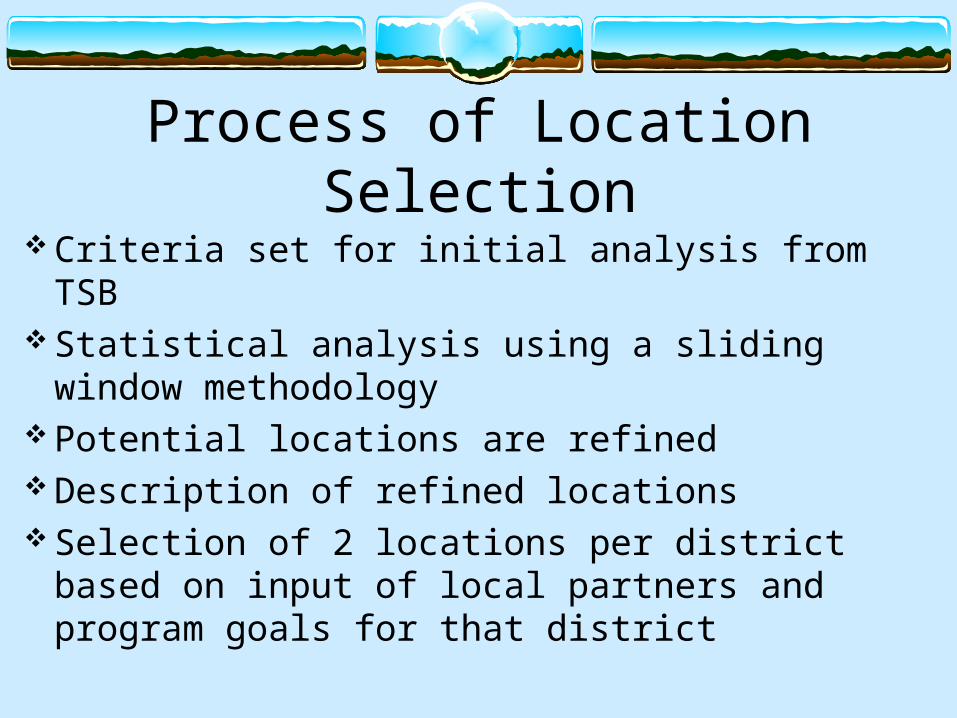
Process of Location Selection Criteria set for initial analysis from TSB Statistical analysis using a sliding window
methodology Potential locations are refined Description of refined locations Selection of 2 locations per district based on input
of local partners and program goals for that district

This is an iterative process which begins and ends with program goals for each district.
Process is based on Program Goals
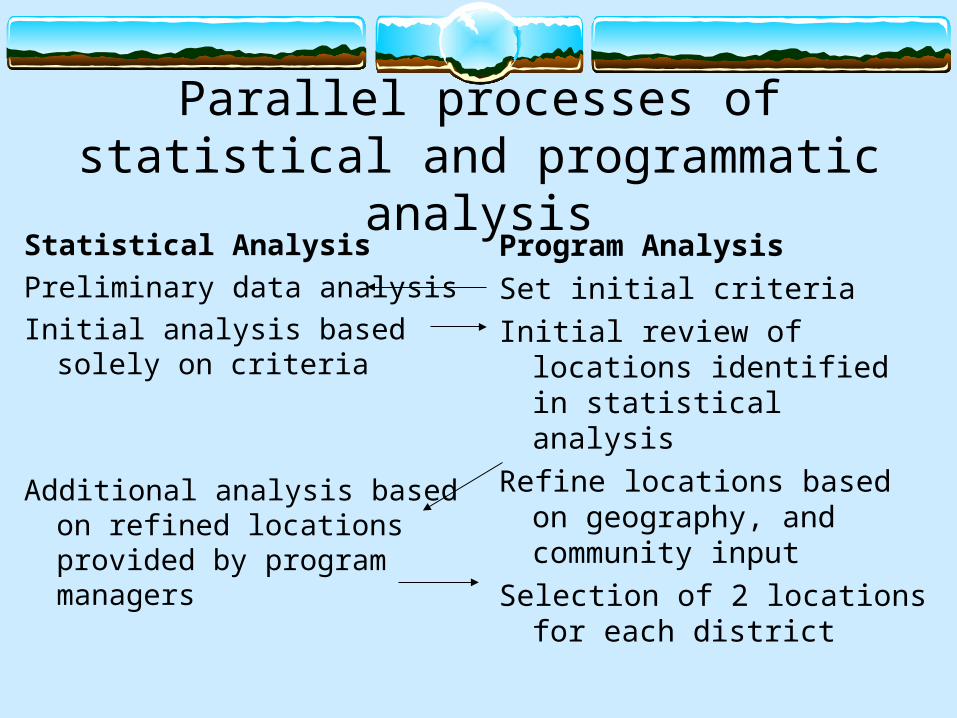
Parallel processes of statistical and programmatic analysis
Statistical AnalysisPreliminary data analysisInitial analysis based solely on
criteria
Additional analysis based on refined locations provided by program managers
Program AnalysisSet initial criteriaInitial review of locations
identified in statistical analysisRefine locations based on
geography, and community input
Selection of 2 locations for each district

Statistical Analysis Based on criteria Sliding window methodology finds segments Segments can be longer than 5 miles if criteria
continue to be met over a longer stretch of road
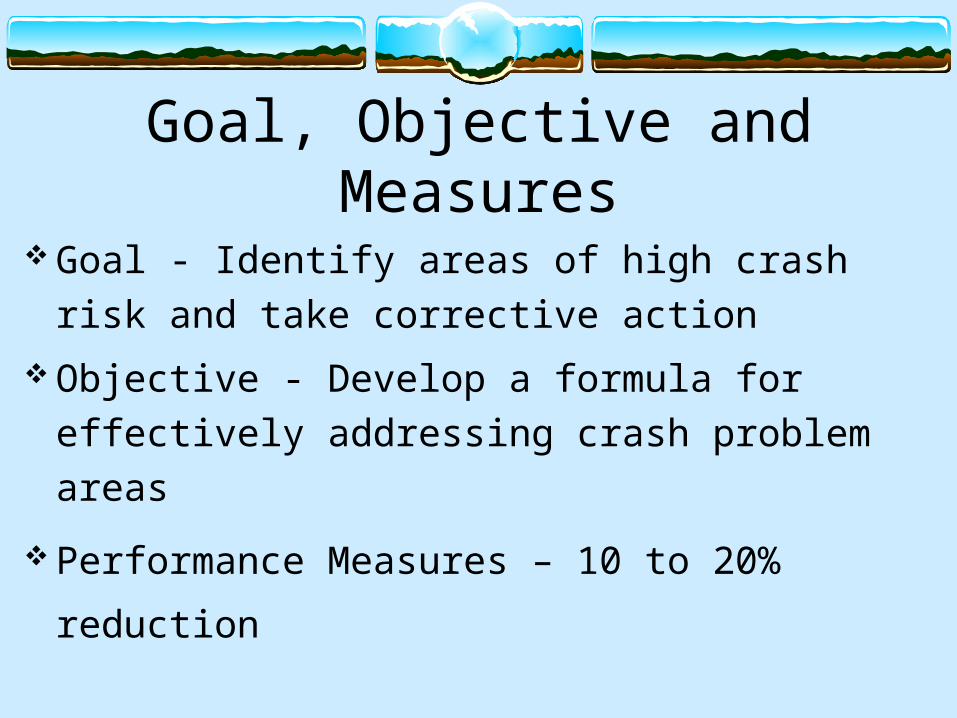
Goal, Objective and Measures Goal - Identify areas of high crash risk and take
corrective action Objective - Develop a formula for effectively
addressing crash problem areas
Performance Measures – 10 to 20% reduction
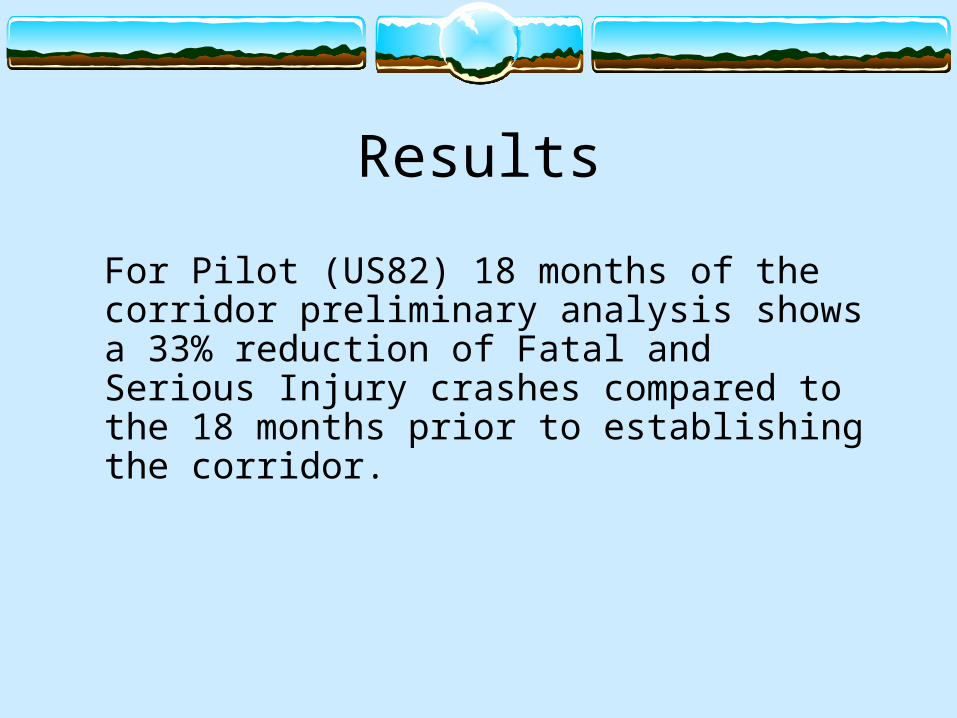
Results
For Pilot (US82) 18 months of the corridor preliminary analysis shows a 33% reduction of Fatal and Serious Injury crashes compared to the 18 months prior to establishing the corridor.

Planned Analysis The performance measure is percent change in
crashes. This percent change can be compared to the
statewide change and to the district-wide change. This percent change can also be compared to the
system-wide change,and to the system change for that district.
Re-Evaluation After 3 years of data collection, corridor is re-
evaluated to determine if an impact was made.

Challenges Lack of Resources
FundingEquipmentEnforcement
Political Issues Geography

Contact Information Sandra Martinez
Traffic Safety BureauTransportation Programs DivisionDepartment of TransportationState of New MexicoP.O. Box 1149Santa Fe, New Mexico 87504-1149
Annaliese MayetteDivision of Government Research1920 Lomas NE University of New MexicoAlbuquerque, New Mexico 87131