New Mexico Human Services Department Adverse Childhood Experiences (ACE) and Prevention Planning...
68
New Mexico Human Services Department Adverse Childhood Experiences (ACE) and Prevention Planning August 13, 2013 Southwest Resource Team SAMHSA’s Center for the Application of Prevention Technologies (CAPT) Presenter: Laura Porter, CAPT Associate
-
Upload
wilfrid-merritt -
Category
Documents
-
view
215 -
download
1
Transcript of New Mexico Human Services Department Adverse Childhood Experiences (ACE) and Prevention Planning...

New Mexico Human Services Department
Adverse Childhood Experiences (ACE)
and Prevention PlanningAugust 13, 2013
Southwest Resource Team
SAMHSA’s Center for the Application of Prevention Technologies (CAPT)
Presenter:
Laura Porter, CAPT Associate

2
This training was developed under the Substance Abuse and Mental Health
Services Administration’s (SAMHSA) Center for the Application of Prevention
Technologies contract. Reference # HHSS277200800004C.
For training use only.

3
Audience
• Substance Abuse Prevention and Treatment (SAPT) Block Grant and Partnership for Success (PFS) II sub-recipients
• State-level staff• Other prevention stakeholders from New
Mexico

4
Presenter
Laura Porter is co-founder of ACE-Interface and also serves as the Director of ACE Partnerships for Washington State’s largest agency: the Department of social and Health Services. She works with state managers and community leaders to embed ACE study findings and related neuroscience and resilience findings into policy, practice and community norms.

5
Learning Objectives
• Understand the links between ACE data and substance abuse prevention
• Describe examples of how to use state-specific ACE data to inform substance abuse prevention strategy implementation at state and local levels

Think, Pair, Share
1. What is your name?
2. What did you leave behind to be here today?
3. If you could paint a picture of stunning prevention success, what would your painting look like (e.g., colors, shapes, light)?

Building A Common Platform for Transformative Action
• Developmental neurobiology• Adverse Childhood Experience• Resilience

Terms We’ll Use Today
• Toxic stress• Adverse Childhood Experiences (ACE)• Complex trauma

Neuroscience and the Effects of Toxic Stress

Brain Development for Safe World
Brain Development for Dangerous World
BRAINPrepares for anticipated
world
OUTCOMEIndividual &
species survive the worst conditions
INDIVIDUAL
“Brawn over Brains”
Focused: Fight, Flight or Freeze
TOXIC STRESS
OUTCOMEIndividual & species survive in good times; vulnerable in poor conditions
INDIVIDUAL
”Process over Power”
Multi-focused: Relational
HARDWIRED FOR ANTICIPATED WORLD
Dissonance between biological expectations
& social reality fuels problems
Adapted from the research of Martin Teicher, MD, Ph.DBy Washington Family Policy Council
NEUTRAL START

Each Person: A Unique Experience of the World

Reflection
How do our major social, health, education, and justice systems respond to people with “brawn over brain” responses to stress?

Adverse Childhood Experience Study
The Adverse Childhood Experiences Study, http://acestudy.org/

ACE Categories are Interrelated
Abuse: • Child physical abuse • Child sexual abuse• Child emotional abuse
Neglect: • Physical neglect• Emotional neglect
15
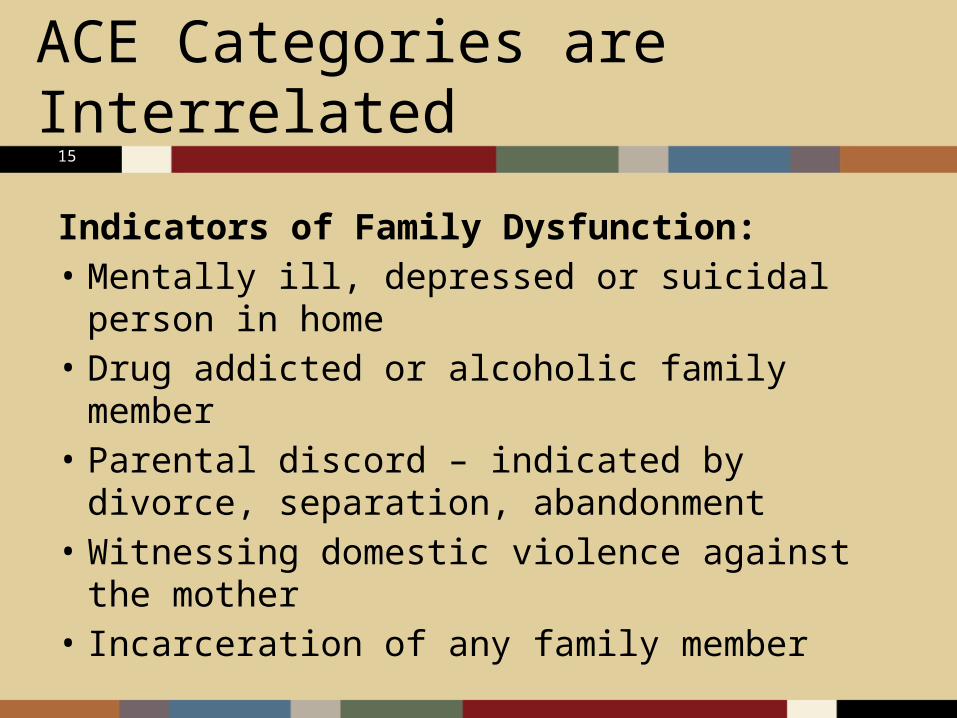
ACE Categories are Interrelated
Indicators of Family Dysfunction:• Mentally ill, depressed or suicidal person in
home• Drug addicted or alcoholic family member• Parental discord – indicated by divorce,
separation, abandonment• Witnessing domestic violence against the
mother• Incarceration of any family member

Data Collection Methods – New Mexico
• ACE module of the Behavioral Risk Factor Surveillance System (BRFSS) collected in 2009
• Telephone survey of randomly selected adults aged 18 years and older
• 5,271 New Mexicans surveyed
• Eleven questions yielding eight categories of ACE referring to the time before they were aged 18 years
Adverse Childhood Experiences Report by Adults --- Five States, MMWR, December 17, 2010 / 59(49);1609-1613.

39%
22%
13%
10%
7%
10%
0 ACEs1 ACEs2 ACEs3 ACEs4 ACEs≥5 ACEs
*n=5,271Adverse Childhood Experiences Report by Adults --- Five States, MMWR, December 17, 2010 / 59(49);1609-1613.
Percent of New Mexico adults* aged >18 years reporting an ACE, by number of ACE reported

Laura Tomedi, New Mexico Behavioral Risk Factor Surveillance System, 2009. New Mexico Department of Health. Prepared June 7, 2012.
New Mexico Adults 4+ ACE
Compared to persons with 0 ACE, New Mexico residents with >4 ACE were more likely to report:• Fair/Poor Health (21.6% vs. 15.4%)• Smoking (33.6% vs. 12.6%)• Injury (50.3% vs. 26.6%)

New Mexico adults with 4+ ACE are more likely to have problems:
• Poor mental health• Asthma• Binge drinking• Heavy drinking • No health insurance
Laura Tomedi, New Mexico Behavioral Risk Factor Surveillance System, 2009. New Mexico Department of Health. Prepared June 7, 2012.
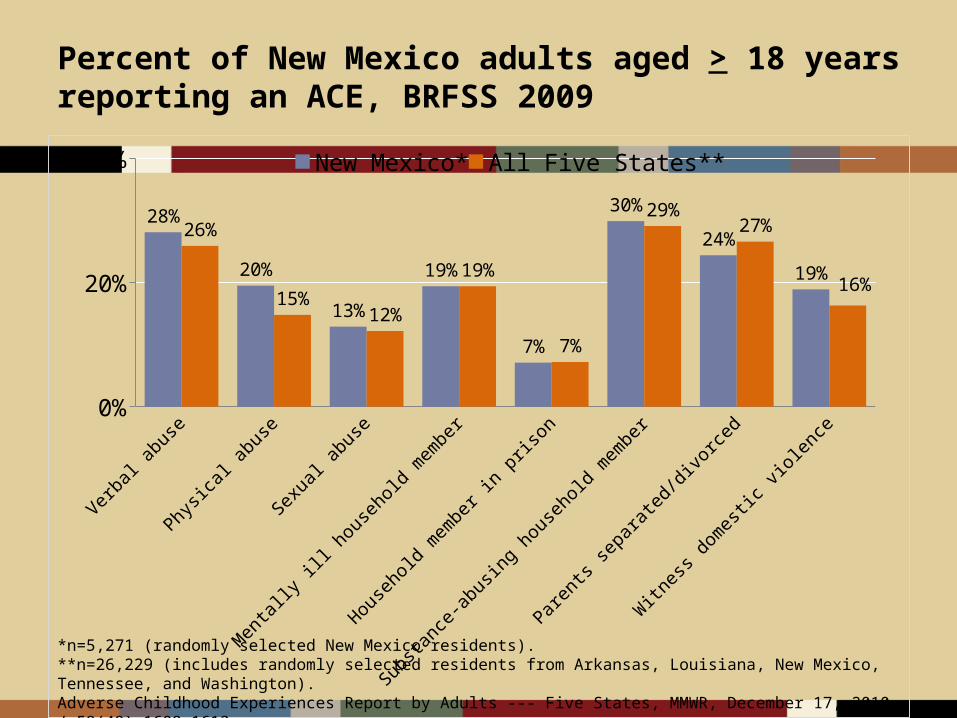
Percent of New Mexico adults aged > 18 years reporting an ACE, BRFSS 2009
Verbal abuse
Physica
l abuse
Sexu
al abuse
Mentally ill
household m
ember
Household m
ember in pris
on
Substa
nce-abusin
g house
hold member
Parents se
parated/divo
rced
Witn
ess domesti
c violence
0%
20%
40%
28%
20%
13%
19%
7%
30%
24%
19%
26%
15%12%
19%
7%
29%27%
16%
New Mexico* All Five States**
*n=5,271 (randomly selected New Mexico residents).**n=26,229 (includes randomly selected residents from Arkansas, Louisiana, New Mexico, Tennessee, and Washington).Adverse Childhood Experiences Report by Adults --- Five States, MMWR, December 17, 2010 / 59(49);1609-1613.

Dose - Response
Dose-response is a direct measure of cause & effect.
The “response”—in this case the occurrence of the health condition—is caused directly by the size of the “dose”—in this case, the number of ACE.
A Classic Causal RelationshipMore ACE = More Health Problems

Current Smokers and History of Adverse Childhood Experience, New Mexico Residents
Laura Tomedi. (June 7, 2012) New Mexico Behavioral Risk Factor Surveillance System, 2009. New Mexico Department of Health..
0 ACE 1 ACE 2 ACE 3 ACE ≥4 ACE0%
10%
20%
30%
40%
13% 13%
18%20%
34%
Laura
Cite changed - moved date

Ever Had a Drug Problem
0 1 2 3 4 ≥50
2
4
6
8
10
12
14
1.3
3
3.9
5
7.5
12
Number of ACE Categories
Perc
ent o
f Pop
ulati
on w
ith P
robl
em
Dube, S. R., Felitti, V. J., Dong, M., Chapman, D. P., Giles, W. H., & Anda, R. F. (2003). Childhood abuse, neglect and household dysfunction and the risk of illicit drug use: The Averse Childhood Experience Study. Pediatrics , 111(3), 564–572.

Alcohol: Age at First Use
0
5
10
15
20
25
30
35
40
45
50
< 14 14-17
4.2
25.7
6.1
28.5
8.5
33.4
12.1
36.2
16.9
33
%
0 1 2 3 4+ACE Score
Dube, S. R., Miller, J. W., Brown, D. W., Giles, W. H., Felitti, V. J., Dong, M., & Anda, R. F. (2006). Adverse childhood experiences and the association with ever using alcohol and initiating alcohol use during adolescence. Journal of Adolescent Health, 38(4), 444.

Smoking: Age at First Use
0
5
10
15
20
25
Early Initiation (before 18 yrs)
5.5
8.7
11.512.8
15.4
21.1
%
0 1 2 3 4 5+ACE Score
Anda, R. F., Croft, J. B., Felitti, V. J., Nordenberg, D., Giles, W. H., Williamson, D. F., & Giovino, G. A. (1999). Adverse childhood experiences and smoking during adolescence and adulthood. Journal of the American Medical Association, 282, 1652–1658.

Illicit Drug Use: Age at First Use
0
5
10
15
20
25
< 14 14-18
0.7
3.81.5
6.5
3.1
9.3
4.7
10.6
4.1
13.4
9.9
14.3
%
0 1 2 3 4 5+ACE Score
Dube, S. R., Felitti, V. J., Dong, M., Chapman, D. P., Giles, W. H., & Anda, R. F. (2003). Childhood abuse, neglect and household dysfunction and the risk of illicit drug use: The Averse Childhood Experience Study. Pediatrics , 111(3), 564–572.

0 1 2 3 4 ≥50
2
4
6
8
10
12
14
1.3
3
3.9
5
7.5
12
Asthma
ACE Score
% o
f Pop
ulati
on w
ith
Ast
hma
Anda, R., & Brown, D. (2010, July 2). Adverse Childhood Experience & Population Health in Washington. Family Policy Council-Community Networks. Retrieved August 9, 2012, from www.fpc.wa.gov/publications/ACEs%20in%20Wa

0 1 2 3 4 or 5 6,7, or 80
2
4
6
8
10
12
14
16
1.9
2.8
5
7
8.8
15
Anxiety
Number of ACE Categories
Perc
ent o
f Pop
ulati
on
Anda, R., & Brown, D. (2010, July 2). Adverse Childhood Experience & Population Health in Washington. Family Policy Council-Community Networks. Retrieved August 9, 2012, from www.fpc.wa.gov/publications/ACEs%20in%20Wa

Suicide Attempts
0
5
10
15
20
25
0 1 2 3 4 5 6 7+
0.2 0.31.3
1.92.9
3.8
8.1
13.8
0.81.8
2.4 2.83.3
9.3
11.4
23
%
ACE Score
Child/Adolescent Adult
Dube, S. R., Anda, R. F., Felitti, V. J., Chapman, D., Williamson, D. F., & Giles, W. H. (2001). Childhood abuse, household dysfunction and the risk of attempted suicide throughout the life span: Findings from Adverse Childhood Experiences Study. Journal of the American Medical Association, 286, 3089–3096.

Outcomes Associated with High ACE Scores - Washington
• Prevalent disease• Risk factors for common diseases/poor
health (including substance abuse)• Poor mental health• General health and social problems• Risk for intergenerational transmission of
ACE

Data from: ACE & Population Health in Washington; Anda & Brown; 2009

“What’s predictable is preventable.”
Dr. Robert Anda
How do we move from prediction to
prevention?

Concepts of Resiliency

CAPABILITY
Capabilities can be impacted by trauma.

CAPABILITY ATTACHMENT
& BELONGING

CAPABILITY ATTACHMENT & BELONGING
COMMUNITY, CULTURE,
SPIRITUALITY

Compassion Exercise

1. Review list of populations – choose one
2. Review the list of enduring effects
3. Pick three “effects” that you think are particularly relevant to your selected population. How would these effects make success more difficult? How might environment or relationships help or hinder the effects?
4. Write on a sticky: Population, Three Effects.
Think & Write on Your Own…

39
Share in your small group
1. Which population with which effects did you select?
2. How might those effects “show up” in an individual?
3. What actions, if you took them, might help the individuals or groups address the effects?

40
Post
• As you go to lunch, post your sticky note with population and three effects.

Lunch Break

Cholera Death is Caused by Miasmas
• New Way of Thinking
• Shoe Leather Epidemiology
• Lives Saved
Dr. John Snow - 1854

Life Course Approach
The Adverse Childhood Experiences Study, http://acestudy.org/

High-Leverage Solutions
Moderate ACE Effects Among Parenting Adults:
Build on Strengths; Improve Functioning &
Coping
2
Prevent ACE Accumulation in Next Gen.
Virtuous Cycle
8 7

• Historic Trauma
• Adverse Childhood Experiences
• Adverse Peer/School Experience
• Adverse Adult Experience
Multiple Mental, Physical,
Relational, and/or
Productivity Problems

ACE and Adult History of Homelessness
0 1 2 3 4-5 6-8
-5.00%
0.00%
5.00%
10.00%
15.00%
20.00%
25.00%
30.00%
2.20% 2.20%
5.50%
11.10%
18.90%
29.80%
25-54 yr Old Adult Population
# of ACE
% H
omel
essn
ess
Longhi, D., Silveanu, A., & Porter, L. (2012, February 1). Stress, Strength, Work, Hope. Family Policy Council - Community Networks. Retrieved August 9, 2013, from www.fpc.wa.gov/publications/StressStrengthWorkHope.VR-Data-Report.pdf

ACE and Ability to Engage in Work/Life Activities
0 ≥ 3 ≥ 60
5
10
15
20
25
4
9
20
Missed Work
Number of ACE Categories
% M
issi
ng ≥
10
Wor
k D
ays/
Mon
th
Longhi, D., Silveanu, A., & Porter, L. (2012, February 1). Stress, Strength, Work, Hope. Family Policy Council - Community Networks. Retrieved August 9, 2013, from www.fpc.wa.gov/publications/StressStrengthWorkHope.VR-Data-Report.pdf

Disability-Related Days When Can’t Do Usual Activities
0 1 2 3 4,5 6,7,80
5
10
15
20
25
30
35
40
45
59 10 10
16 192
47 9
12
20
1-14 Days 15-30 Days
ACE Score
Perc
ent w
ith D
isabi
lity-
Rela
ted
Inte
rrup
ted
Days
Longhi, D., Silveanu, A., & Porter, L. (2012, February 1). Stress, Strength, Work, Hope. Family Policy Council - Community Networks. Retrieved August 9, 2013, from www.fpc.wa.gov/publications/StressStrengthWorkHope.VR-Data-Report.pdf

Cascade Effect: Difficulty with Daily Functioning
Major Stress Categories:
1. Homelessness
2. Incarceration
3. Chronic illness
4. Separation/divorce
5. Severe depression
6. Work-related injury/illness Longhi, D., Silveanu, A., & Porter, L. (2012, February 1). Stress, Strength, Work, Hope. Family Policy Council - Community Networks. Retrieved August 9, 2013, from www.fpc.wa.gov/publications/StressStrengthWorkHope.VR-Data-Report.pdf

0 1 2 30
10
20
30
40
50
60
Number of Major Stress Categories During Adulthood
Added to ACE Score of ≥3
% w
ith 1
5-3
0 D
isa
bili
ty-I
nte
r-
rup
ted
Da
ys a
Mo
nth
Longhi, D., Silveanu, A., & Porter, L. (2012, February 1). Stress, Strength, Work, Hope. Family Policy Council - Community Networks. Retrieved August 9, 2013, from www.fpc.wa.gov/publications/StressStrengthWorkHope.VR-Data-Report.pdf

Elementary Children
• Greatest single predictor for health, attendance, behavior
• Second strongest predictor for academic failure
Christopher Blodgett, WSU AHEC Spokane, WA; Personal Communication with Laura Porter; 2012

Among youth with ≥4 ACE:
• 33% of court involved youth re-offend in two years (vs. 13% 0-1 ACE)
• 51% in special Ed. (vs. 33% 0-1 ACE)• 74% below 2.0 GPA (vs. 58% 0-1 ACE)• 64% 4+ suspensions • 85% suspended by 2nd grade
Grevstad, J. & Anda, R.; Adverse Childhood Experience in Adjudicated Youth in Washington; 2010; Report to Washington Family Policy Council

Adult Adversity:
• Incarceration• Victim of interpersonal
violence• Drug/alcohol Problems• Mental illness• Divorce
• Work injury- illness• Homelessness• Disability• Poverty• Health limits activity• Unemployment
Longhi, Porter & Silveanu; Stress, Strength, Work, Hope; 2012

Parenting Adults:
Parents with ≥5 ACE are 14 X more likely to have 2 or more conditions that make ACE for kids
Simmons, K. & Porter, L.; Analysis of 2010-2011 Washington BRFSS data; unpublished

• Response inhibition 7
• Working memory7• Emotional control8• Flexibility11• Sustained attention9• Task Initiation7
• Planning and prioritizing12
• Organization5• Time management9• Goal-directed
persistence1• Metacognition18
Elements of Executive Function
Guare and Dawson 2013, pp. 42-43

How Neurobiology Informs Change
• Perception of threat: safe harbor
• Verbal memory: corrections officer training

• Massage• Mindfulness, reflection• Pleasure• Biofeedback• Movement and music• Exercise and play• Activities that integrate visual information with fine-
and gross-motor movements • Physical activities for exploration of environment.• Practicing connection
What Helps Individuals Self-regulate?

©2013
Identifying Emotional States

How ACE Information Informs Change
• Transitions from preschool to kindergarten• Better treatment fit for adjudicated youth• ACE are common; work in universal
systems• High ACE parents become powerful leaders
of next generation ACE reduction

Individual
Family & Friends
National, Global, Ecosystem
Resilience Occurs at All Levels
Community

General
Community Capacity
Development
Public Education
& Health Education Campaigns
Direct Services to People
with Risk
Emergence & Collective Impact: Attend to Heath of System as a Whole

Efficacious Community
What Helps?1. Opportunities for everyone to help/co-
lead 2. Coming together to understand
matters of importance3. Learning together; reciprocity4. Results-based decisions; acting from
desired future


The Power of Community Capacityon Depression and Serious Persistent Mental
Illness Ages 18-34
Serious Mental Illness Mentally Ill Depressed 0.00%
5.00%
10.00%
15.00%
20.00%
25.00%
30.00%
35.00%
40.00%
45.00%
50.00%
16.10%
22.70%
43.00%
4.40%
8.20%
28.50%
Significant differences after controlling for age, education, income, race/ethnicity, and ACE score.
High Capacity
High Capacity
High Capacity
Longhi, D., Silveanu, A., & Porter, L. (2012, February 1). Stress, Strength, Work, Hope. Family Policy Council - Community Networks. Retrieved August 9, 2013, from www.fpc.wa.gov/publications/StressStrengthWorkHope.VR-Data-Report.pdf
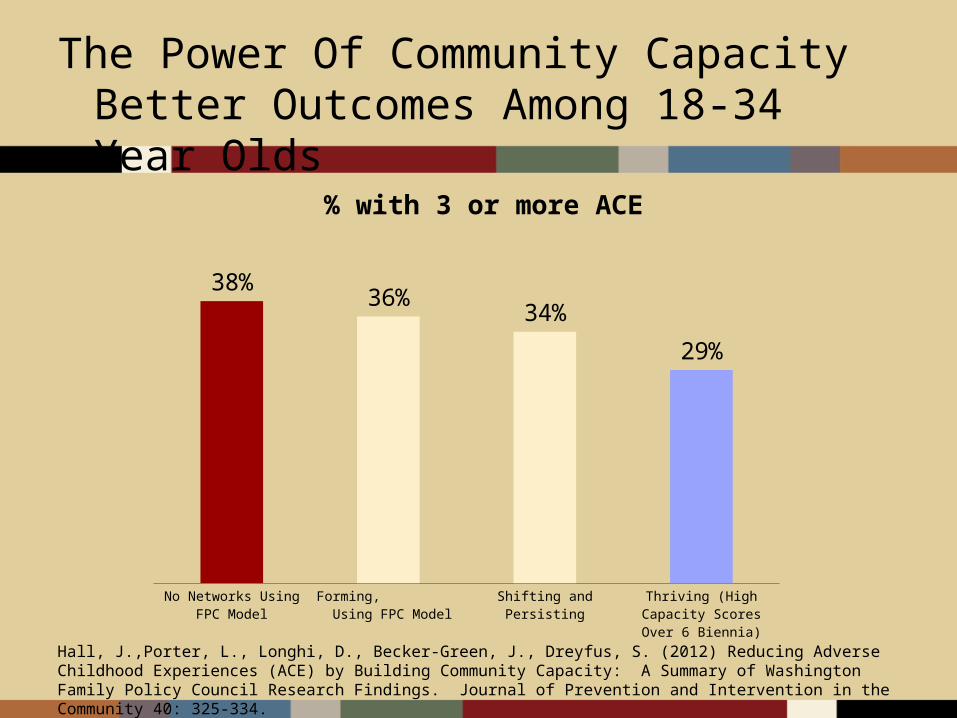
The Power Of Community Capacity Better Outcomes Among 18-34 Year Olds
No Networks Using FPC Model
Forming, Using FPC Model
Shifting and Persisting Thriving (High Capacity Scores Over 6 Biennia)
38%36%
34%
29%
% with 3 or more ACE
Hall, J.,Porter, L., Longhi, D., Becker-Green, J., Dreyfus, S. (2012) Reducing Adverse Childhood Experiences (ACE) by Building Community Capacity: A Summary of Washington Family Policy Council Research Findings. Journal of Prevention and Intervention in the Community 40: 325-334.

We Increase Probability of
Lasting Change
When We Notice and Act Below
the Waterline
Unseen
Values/Principles
Mental Models
Structures
Patterns
Events
Risk is Usually
Measured Here

1. Tell everyone 2. Adopt trauma-informed services and
supports3. Shift to dual generation strategies4. Invest in community capacity5. Generate feedback 6. Hold a fundamental respect for the wisdom
of every person—their culture, experience, capabilities, and aspirations
What We Can Do ?

68
Thank you!
For follow-up please contact:
Marie Cox
Coordinator, CAPT Southwest RT
405-255-2351