
Performance Considerations in Adopting Zero-ODP and Low-GWP Refrigerants
Master of Science Thesis
KTH School of Industrial Engineering and Management
Energy Technology EGI-2012-028MSC
Division of Division of Applied Thermodynamics and Refrigeration
SE-100 44 STOCKHOLM
New Low GWP Synthetic Refrigerants
Mariam Jarahnejad
-2-
Master of Science Thesis EGI-2012-028MSC
Low GWP Synthetic Refrigerants
Mariam Jarahnejad
Approved
2012-05-27
Examiner
Professor Björn E Palm
Supervisor
Professor Björn E Palm
Commissioner
Contact person
Abstract
In this project, two newly developed refrigerants, R1234yf and R1234ze have been studied as promising
drop-in replacements for the common high global warming potential refrigerants. In view of that,
thermodynamic and transport properties of new refrigerants were obtained by RefProp version 7.01 to
study and compare their cycle performances with current refrigerants. Furthermore, their environmental
and safety aspects have been studied in order to predict probable risks and suitable preparations in
different applications. Basic cycle data of both new refrigerants have been calculated for most commonly
used condensing and evaporating temperatures. According to evaluation of these tables, both refrigerants
generally have comparable COP and volumetric cooling capacity with R134a for an isentropic
compression.
As the final phase of the project, drop-in experiment was carried out in a refrigeration cycle consists of
two plate heat exchangers and one electrical heater which was placed in the brine loop. Experimentation
was operated first by R134a and continued by R1234yf with 10 different brine heat loads at two
condensing temperatures of 30°C and 40°C. Subsequently, cycle performance and heat transfer
coefficients of R134a and R1234yf were evaluated. Experimental results in heat exchangers were
compared with those concluded from theoretical correlations. Outcomes of measurements demonstrate
R134a has respectively 2-9.2% and 4.4-15 % higher COP as well as 0-3% and 0-3.8 % higher volumetric
cooling capacity than R1234yf at condensing temperatures of 30°C and 40°C.
For calculating heat transfer coefficients of the refrigerants two approaches have been considered. At first
approach, modified Wilson plot method has been applied and at the other method, heat transfer
coefficient of the secondary refrigerant was evaluated by Talik et al. correlation and subsequently heat
transfer coefficients of the refrigerants were computed. Results from the measured data indicate R134a
has higher heat transfer coefficients than R1234yf by 4-12% and 9-36% at condenser temperature of 30ºC
and 40ºC respectively.
At the condenser, observations were in agreement with the theoretical correlation and R1234yf had
roughly 25% lower overall heat transfer coefficients than R134a.
-3-
Table of Contents
Abstract ........................................................................................................................................................................... 2
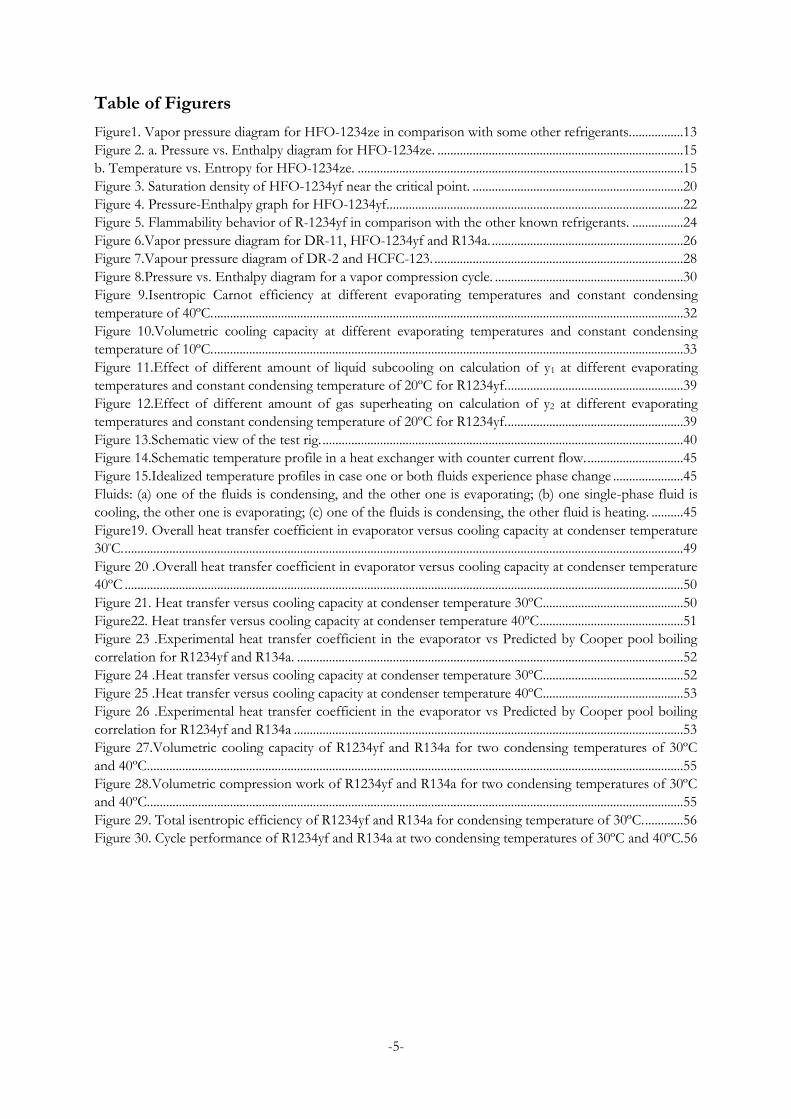
Table of Figurers ........................................................................................................................................................... 5
Nomenclature ................................................................................................................................................................ 6
1 Introduction .......................................................................................................................................................... 8
1.1 Fluid Selection ............................................................................................................................................. 8
1.1.1 Chemical and thermophysical properties............................................................................................ 8
1.1.2 Environmental impact and safety aspects .......................................................................................... 8
2 Objective ................................................................................................................................................................ 9
3 Scope ...................................................................................................................................................................... 9
4 Low GWP potential Refrigerant ........................................................................................................................ 9
4.1 Natural Refrigerants..................................................................................................................................10
4.1.1 Ammonia (R-717) .................................................................................................................................10
4.1.2 CO2 (R-744) ..........................................................................................................................................10
4.1.3 Hydrocarbons........................................................................................................................................11
4.1.4 Hydrocarbon blends ............................................................................................................................11
4.2 R-152a (HFC Refrigerant) .......................................................................................................................12
4.3 New refrigerants ........................................................................................................................................12
4.3.1 HFO-1234ze..........................................................................................................................................12
4.3.2 Thermodynamic properties: ................................................................................................................13
4.3.3 Cycle performance ................................................................................................................................15
4.3.4 Safety aspects:........................................................................................................................................18
4.3.5 HFO-1234yf ..........................................................................................................................................19
4.3.6 Cycle Performance ...............................................................................................................................22
4.3.7 HDRs......................................................................................................................................................25
4.3.8 DR-11 .....................................................................................................................................................25
4.3.9 DR-2 .......................................................................................................................................................27
4.4 Summary of the candidates refrigerants ................................................................................................29
5 Cycle performance calculations........................................................................................................................ 29
5.1 Fundamental concepts of the vapor compression cycle .....................................................................29
5.2 Evaporator Energy balance .....................................................................................................................29
5.3 Compressor Energy balance....................................................................................................................30
5.4 Condenser Energy balance ......................................................................................................................31
6 Basic cycle data ................................................................................................................................................... 31
7 Experimental part ............................................................................................................................................... 39
7.1 Experimental set up ..................................................................................................................................40
7.2 Test procedure ...........................................................................................................................................41
-4-
8 Heat transfer in a plate heat exchanger ........................................................................................................... 42
8.1 Single phase flow inside the evaporator ................................................................................................43
8.1.1 Wanniarachchi et al. correlation (1995) ............................................................................................43
8.1.2 Talik et al. correlation ..........................................................................................................................43
8.1.3 Coulson and Richardson .....................................................................................................................43
8.2 Flow boiling inside the evaporator .........................................................................................................44
8.2.1 Ayub (2003) ...........................................................................................................................................44
8.2.2 Cooper pool boiling correlation .........................................................................................................44
8.3 Heat transfer calculation of the refrigerant ...........................................................................................45
8.3.1 Heat transfer coefficient calculation by means of Wilson plot method ......................................46
8.3.2 Heat transfer coefficient calculation by means of correlations .....................................................48
9 Results and discussion ....................................................................................................................................... 49
9.1 Heat transfer in the evaporator ...............................................................................................................49
9.1.1 Using modified Wilson plot method for calculation of heat transfer coefficient ......................50
9.1.2 Using Talik et al. correlation for calculation of Heat transfer coefficient ...................................52
9.2 Heat transfer during condensation .........................................................................................................53
9.3 Volumetric behavior .................................................................................................................................54
9.4 Total isentropic efficiency........................................................................................................................56
9.5 Cycle performance ....................................................................................................................................56
10 Conclusion ........................................................................................................................................................... 57
Bibliography ................................................................................................................................................................. 58
Appendix A .................................................................................................................................................................. 63
Appendix B................................................................................................................................................................... 75
Appendix C .................................................................................................................................................................. 78
Appendix D .................................................................................................................................................................. 80
Appendix E .................................................................................................................................................................. 81
-5-
Table of Figurers
Figure1. Vapor pressure diagram for HFO-1234ze in comparison with some other refrigerants. ................13 Figure 2. a. Pressure vs. Enthalpy diagram for HFO-1234ze. .............................................................................15 b. Temperature vs. Entropy for HFO-1234ze. ......................................................................................................15 Figure 3. Saturation density of HFO-1234yf near the critical point. ..................................................................20 Figure 4. Pressure-Enthalpy graph for HFO-1234yf. ............................................................................................22 Figure 5. Flammability behavior of R-1234yf in comparison with the other known refrigerants. ................24 Figure 6.Vapor pressure diagram for DR-11, HFO-1234yf and R134a. ............................................................26 Figure 7.Vapour pressure diagram of DR-2 and HCFC-123. ..............................................................................28 Figure 8.Pressure vs. Enthalpy diagram for a vapor compression cycle. ...........................................................30 Figure 9.Isentropic Carnot efficiency at different evaporating temperatures and constant condensing
temperature of 40ºC. ...................................................................................................................................................32 Figure 10.Volumetric cooling capacity at different evaporating temperatures and constant condensing
temperature of 10ºC. ...................................................................................................................................................33 Figure 11.Effect of different amount of liquid subcooling on calculation of y1 at different evaporating
temperatures and constant condensing temperature of 20ºC for R1234yf. .......................................................39 Figure 12.Effect of different amount of gas superheating on calculation of y2 at different evaporating
temperatures and constant condensing temperature of 20ºC for R1234yf. .......................................................39 Figure 13.Schematic view of the test rig. .................................................................................................................40 Figure 14.Schematic temperature profile in a heat exchanger with counter current flow. ..............................45 Figure 15.Idealized temperature profiles in case one or both fluids experience phase change ......................45 Fluids: (a) one of the fluids is condensing, and the other one is evaporating; (b) one single-phase fluid is
cooling, the other one is evaporating; (c) one of the fluids is condensing, the other fluid is heating. ..........45 Figure19. Overall heat transfer coefficient in evaporator versus cooling capacity at condenser temperature
30ºC. ...............................................................................................................................................................................49 Figure 20 .Overall heat transfer coefficient in evaporator versus cooling capacity at condenser temperature
40ºC ...............................................................................................................................................................................50 Figure 21. Heat transfer versus cooling capacity at condenser temperature 30ºC ............................................50 Figure22. Heat transfer versus cooling capacity at condenser temperature 40ºC .............................................51 Figure 23 .Experimental heat transfer coefficient in the evaporator vs Predicted by Cooper pool boiling
correlation for R1234yf and R134a. .........................................................................................................................52 Figure 24 .Heat transfer versus cooling capacity at condenser temperature 30ºC ............................................52 Figure 25 .Heat transfer versus cooling capacity at condenser temperature 40ºC ............................................53 Figure 26 .Experimental heat transfer coefficient in the evaporator vs Predicted by Cooper pool boiling
correlation for R1234yf and R134a ..........................................................................................................................53 Figure 27.Volumetric cooling capacity of R1234yf and R134a for two condensing temperatures of 30ºC
and 40ºC. .......................................................................................................................................................................55 Figure 28.Volumetric compression work of R1234yf and R134a for two condensing temperatures of 30ºC
and 40ºC. .......................................................................................................................................................................55 Figure 29. Total isentropic efficiency of R1234yf and R134a for condensing temperature of 30ºC. ............56 Figure 30. Cycle performance of R1234yf and R134a at two condensing temperatures of 30ºC and 40ºC.56
-6-
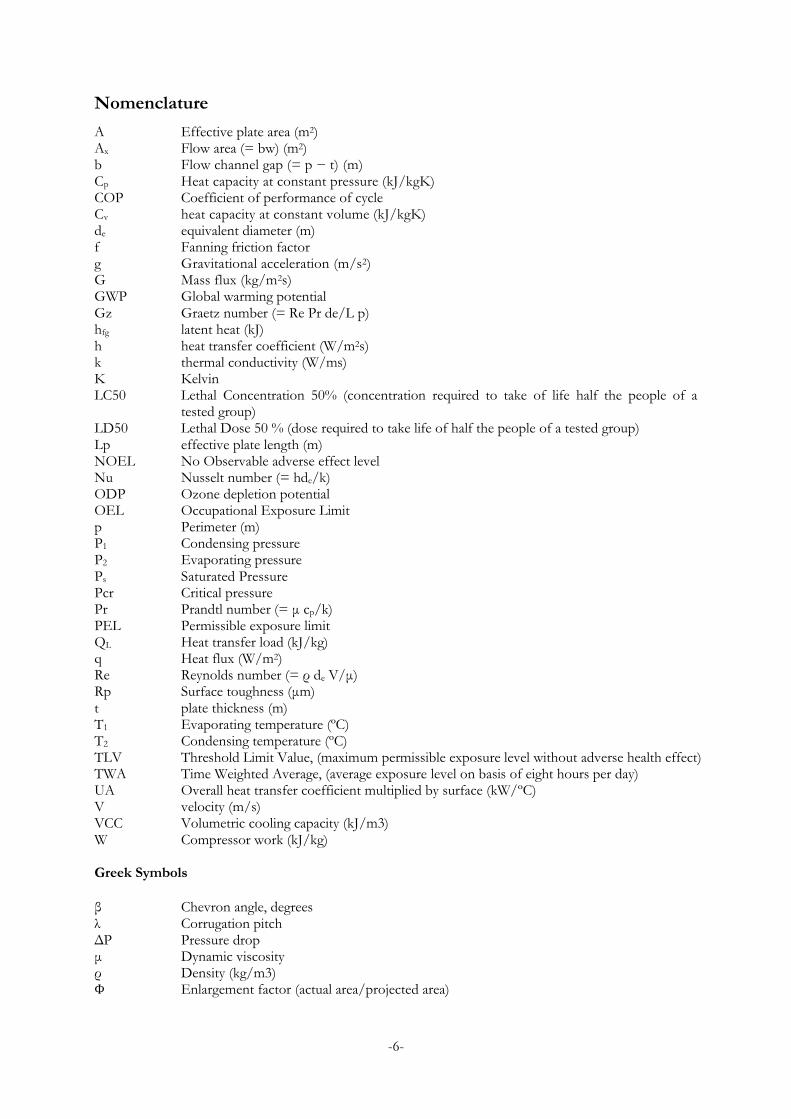
Nomenclature
A Effective plate area (m2) Ax Flow area (= bw) (m2) b Flow channel gap (= p − t) (m) Cp Heat capacity at constant pressure (kJ/kgK) COP Coefficient of performance of cycle Cv heat capacity at constant volume (kJ/kgK) de equivalent diameter (m) f Fanning friction factor g Gravitational acceleration (m/s2) G Mass flux (kg/m2s) GWP Global warming potential Gz Graetz number (= Re Pr de/L p) hfg latent heat (kJ) h heat transfer coefficient (W/m2s) k thermal conductivity (W/ms) K Kelvin LC50 Lethal Concentration 50% (concentration required to take of life half the people of a
tested group) LD50 Lethal Dose 50 % (dose required to take life of half the people of a tested group) Lp effective plate length (m) NOEL No Observable adverse effect level Nu Nusselt number (= hde/k) ODP Ozone depletion potential OEL Occupational Exposure Limit p Perimeter (m) P1 Condensing pressure P2 Evaporating pressure Ps Saturated Pressure Pcr Critical pressure Pr Prandtl number (= μ cp/k) PEL Permissible exposure limit QL Heat transfer load (kJ/kg) q Heat flux (W/m2) Re Reynolds number (= ρ de V/μ) Rp Surface toughness (μm) t plate thickness (m) T1 Evaporating temperature (ºC) T2 Condensing temperature (ºC) TLV Threshold Limit Value, (maximum permissible exposure level without adverse health effect) TWA Time Weighted Average, (average exposure level on basis of eight hours per day) UA Overall heat transfer coefficient multiplied by surface (kW/ºC) V velocity (m/s) VCC Volumetric cooling capacity (kJ/m3) W Compressor work (kJ/kg) Greek Symbols
β Chevron angle, degrees λ Corrugation pitch ΔP Pressure drop μ Dynamic viscosity ρ Density (kg/m3) Enlargement factor (actual area/projected area)

-7-
Subscripts c Carnot cond. Condensing comp. Compressor dis. Discharge evap. Evaporation l liquid or laminar t Turbulent w Wall
-8-
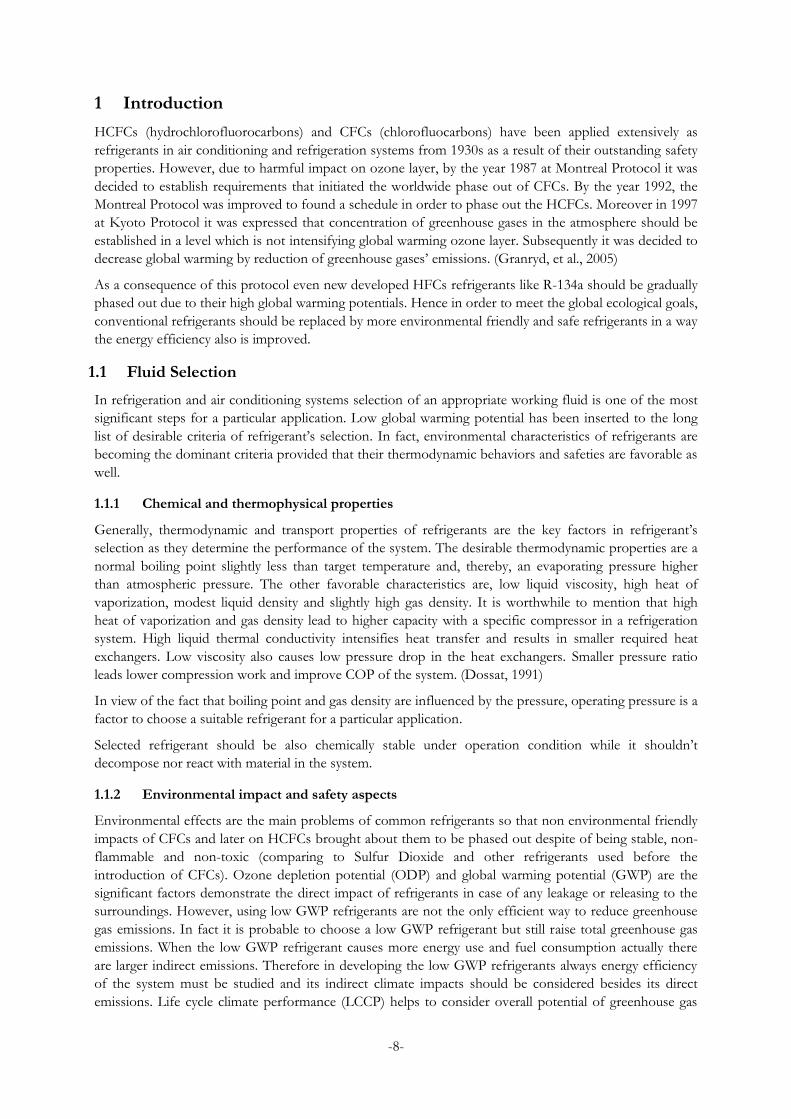
1 Introduction
HCFCs (hydrochlorofluorocarbons) and CFCs (chlorofluocarbons) have been applied extensively as
refrigerants in air conditioning and refrigeration systems from 1930s as a result of their outstanding safety
properties. However, due to harmful impact on ozone layer, by the year 1987 at Montreal Protocol it was
decided to establish requirements that initiated the worldwide phase out of CFCs. By the year 1992, the
Montreal Protocol was improved to found a schedule in order to phase out the HCFCs. Moreover in 1997
at Kyoto Protocol it was expressed that concentration of greenhouse gases in the atmosphere should be
established in a level which is not intensifying global warming ozone layer. Subsequently it was decided to
decrease global warming by reduction of greenhouse gases’ emissions. (Granryd, et al., 2005)
As a consequence of this protocol even new developed HFCs refrigerants like R-134a should be gradually
phased out due to their high global warming potentials. Hence in order to meet the global ecological goals,
conventional refrigerants should be replaced by more environmental friendly and safe refrigerants in a way
the energy efficiency also is improved.
1.1 Fluid Selection
In refrigeration and air conditioning systems selection of an appropriate working fluid is one of the most
significant steps for a particular application. Low global warming potential has been inserted to the long
list of desirable criteria of refrigerant’s selection. In fact, environmental characteristics of refrigerants are
becoming the dominant criteria provided that their thermodynamic behaviors and safeties are favorable as
well.
1.1.1 Chemical and thermophysical properties
Generally, thermodynamic and transport properties of refrigerants are the key factors in refrigerant’s
selection as they determine the performance of the system. The desirable thermodynamic properties are a
normal boiling point slightly less than target temperature and, thereby, an evaporating pressure higher
than atmospheric pressure. The other favorable characteristics are, low liquid viscosity, high heat of
vaporization, modest liquid density and slightly high gas density. It is worthwhile to mention that high
heat of vaporization and gas density lead to higher capacity with a specific compressor in a refrigeration
system. High liquid thermal conductivity intensifies heat transfer and results in smaller required heat
exchangers. Low viscosity also causes low pressure drop in the heat exchangers. Smaller pressure ratio
leads lower compression work and improve COP of the system. (Dossat, 1991)
In view of the fact that boiling point and gas density are influenced by the pressure, operating pressure is a
factor to choose a suitable refrigerant for a particular application.
Selected refrigerant should be also chemically stable under operation condition while it shouldn’t
decompose nor react with material in the system.
1.1.2 Environmental impact and safety aspects
Environmental effects are the main problems of common refrigerants so that non environmental friendly
impacts of CFCs and later on HCFCs brought about them to be phased out despite of being stable, non-
flammable and non-toxic (comparing to Sulfur Dioxide and other refrigerants used before the
introduction of CFCs). Ozone depletion potential (ODP) and global warming potential (GWP) are the
significant factors demonstrate the direct impact of refrigerants in case of any leakage or releasing to the
surroundings. However, using low GWP refrigerants are not the only efficient way to reduce greenhouse
gas emissions. In fact it is probable to choose a low GWP refrigerant but still raise total greenhouse gas
emissions. When the low GWP refrigerant causes more energy use and fuel consumption actually there
are larger indirect emissions. Therefore in developing the low GWP refrigerants always energy efficiency
of the system must be studied and its indirect climate impacts should be considered besides its direct
emissions. Life cycle climate performance (LCCP) helps to consider overall potential of greenhouse gas
-9-
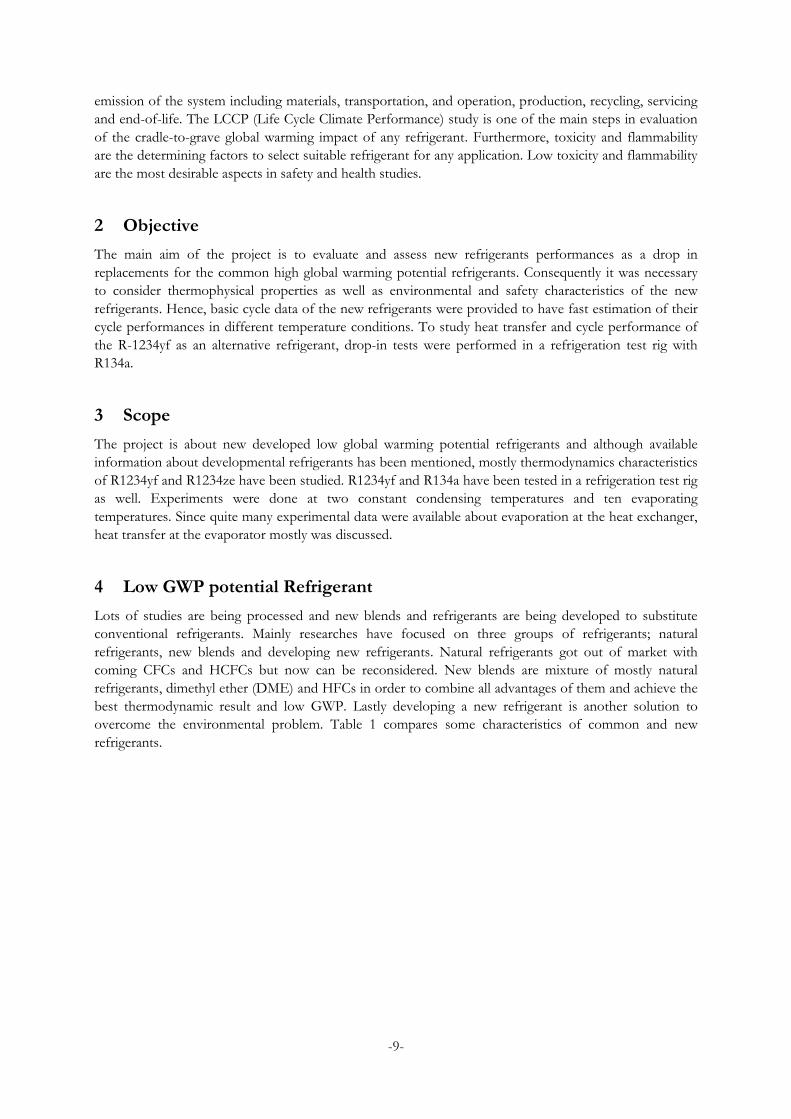
emission of the system including materials, transportation, and operation, production, recycling, servicing
and end-of-life. The LCCP (Life Cycle Climate Performance) study is one of the main steps in evaluation
of the cradle-to-grave global warming impact of any refrigerant. Furthermore, toxicity and flammability
are the determining factors to select suitable refrigerant for any application. Low toxicity and flammability
are the most desirable aspects in safety and health studies.
2 Objective
The main aim of the project is to evaluate and assess new refrigerants performances as a drop in
replacements for the common high global warming potential refrigerants. Consequently it was necessary
to consider thermophysical properties as well as environmental and safety characteristics of the new
refrigerants. Hence, basic cycle data of the new refrigerants were provided to have fast estimation of their
cycle performances in different temperature conditions. To study heat transfer and cycle performance of
the R-1234yf as an alternative refrigerant, drop-in tests were performed in a refrigeration test rig with
R134a.
3 Scope
The project is about new developed low global warming potential refrigerants and although available
information about developmental refrigerants has been mentioned, mostly thermodynamics characteristics
of R1234yf and R1234ze have been studied. R1234yf and R134a have been tested in a refrigeration test rig
as well. Experiments were done at two constant condensing temperatures and ten evaporating
temperatures. Since quite many experimental data were available about evaporation at the heat exchanger,
heat transfer at the evaporator mostly was discussed.
4 Low GWP potential Refrigerant
Lots of studies are being processed and new blends and refrigerants are being developed to substitute
conventional refrigerants. Mainly researches have focused on three groups of refrigerants; natural
refrigerants, new blends and developing new refrigerants. Natural refrigerants got out of market with
coming CFCs and HCFCs but now can be reconsidered. New blends are mixture of mostly natural
refrigerants, dimethyl ether (DME) and HFCs in order to combine all advantages of them and achieve the
best thermodynamic result and low GWP. Lastly developing a new refrigerant is another solution to
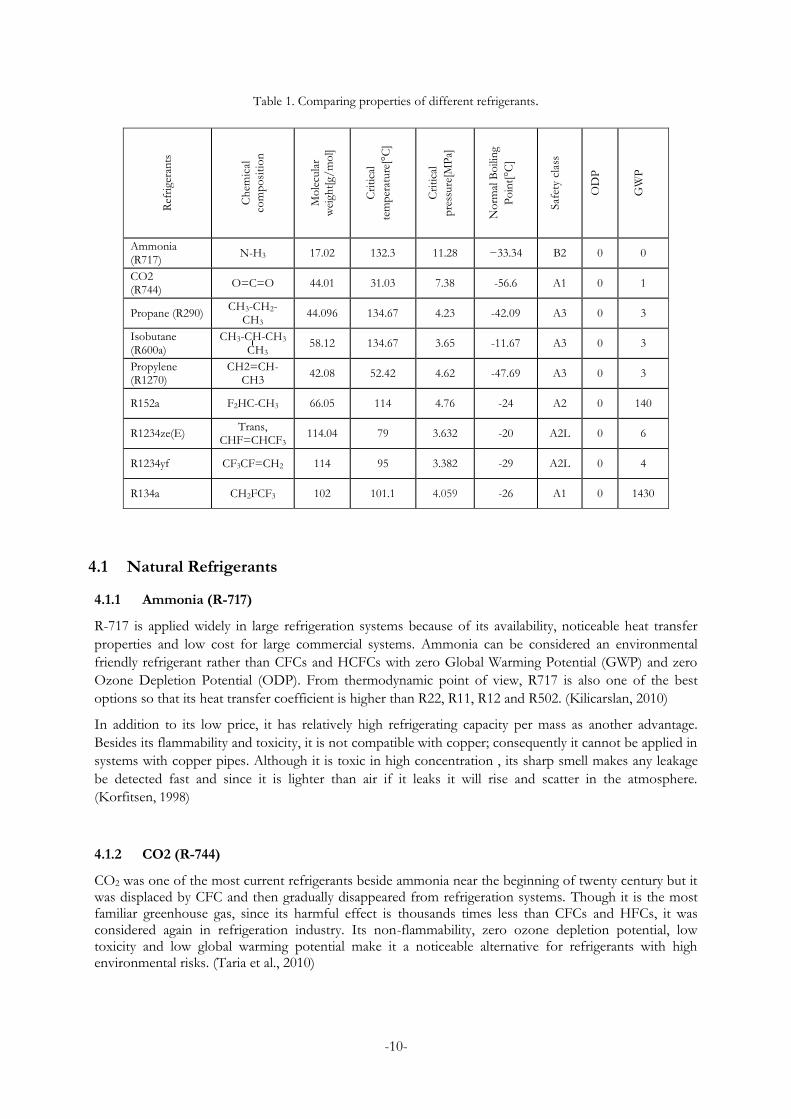
overcome the environmental problem. Table 1 compares some characteristics of common and new
refrigerants.
-10-
Table 1. Comparing properties of different refrigerants.
Ref
rige
ran
ts
Ch
emic
al
com
po
siti
on
Mo
lecu
lar
wei
ght[
g/m
ol]
Cri
tica
l
tem
per
ature
[°C
]
Cri
tica
l
pre
ssure
[MP
a]
No
rmal
Bo
ilin
g
Po
int[
°C]
Saf
ety
clas
s
OD
P
GW
P
Ammonia (R717)
N-H3 17.02 132.3 11.28 −33.34 B2 0 0
CO2 (R744)
O=C=O 44.01 31.03 7.38 -56.6 A1 0 1
Propane (R290) CH3-CH2-
CH3 44.096 134.67 4.23 -42.09 A3 0 3
Isobutane (R600a)
CH3-CH-CH3 CH3
58.12 134.67 3.65 -11.67 A3 0 3
Propylene (R1270)
CH2=CH-CH3
42.08 52.42 4.62 -47.69 A3 0 3
R152a F2HC-CH3 66.05 114 4.76 -24 A2 0 140
R1234ze(E) Trans,
CHF=CHCF3 114.04 79 3.632 -20 A2L 0 6
R1234yf CF3CF=CH2 114 95 3.382 -29 A2L 0 4
R134a CH2FCF3 102 101.1 4.059 -26 A1 0 1430
4.1 Natural Refrigerants
4.1.1 Ammonia (R-717)
R-717 is applied widely in large refrigeration systems because of its availability, noticeable heat transfer
properties and low cost for large commercial systems. Ammonia can be considered an environmental
friendly refrigerant rather than CFCs and HCFCs with zero Global Warming Potential (GWP) and zero
Ozone Depletion Potential (ODP). From thermodynamic point of view, R717 is also one of the best
options so that its heat transfer coefficient is higher than R22, R11, R12 and R502. (Kilicarslan, 2010)
In addition to its low price, it has relatively high refrigerating capacity per mass as another advantage.
Besides its flammability and toxicity, it is not compatible with copper; consequently it cannot be applied in
systems with copper pipes. Although it is toxic in high concentration , its sharp smell makes any leakage
be detected fast and since it is lighter than air if it leaks it will rise and scatter in the atmosphere.
(Korfitsen, 1998)
4.1.2 CO2 (R-744)
CO2 was one of the most current refrigerants beside ammonia near the beginning of twenty century but it was displaced by CFC and then gradually disappeared from refrigeration systems. Though it is the most familiar greenhouse gas, since its harmful effect is thousands times less than CFCs and HFCs, it was considered again in refrigeration industry. Its non-flammability, zero ozone depletion potential, low toxicity and low global warming potential make it a noticeable alternative for refrigerants with high environmental risks. (Taria et al., 2010)
-11-
CO2 is naturally a substance that can be applied as a working fluid in different heating and cooling applications, due to its excellent heat transfer properties and high volumetric cooling capacity. (Sawalha, 2009)
Its pressure is noticeably higher than R-404a or R-717 which causes to need special design. High pressure
leads to high gas density and consequently, higher refrigeration capacity from a given compressor. At low
temperatures (-30 to -50 °C) R-744 has a considerable action; for a specified pressure drop, there is a small
decrease in saturation temperature, so higher mass flux can be applied in suction pipes and evaporator
without any efficiency penalty. (Hrnjak, et al., 2001)
4.1.3 Hydrocarbons
Hydrocarbons were used widely during early years of twenty century as refrigerants but different technical
and safety issues lead them to get out of market when CFCs were introduced. Nowadays with the
problems resulting from non-environmental friendly refrigerants, they have been considered again as
alternative options. Propane (R290), Isobutane (R600a) and Propylene (R1270) are most common sort of
HCs used in refrigeration systems. R-1270 and R-290 are applied for heat pumping applications in Europe
but R-600a was used in refrigerators and freezers in Europe in the last decade and now it is also applied in
Korea and Japan.(Lee, 2005)
Although each of these HCs has different chemical and thermodynamic characteristics, they have
common environmental traits; zero ODP and GWP less than 3.
HCs are flammable and classified in range of low toxic, highly flammable refrigerants (A3). They are
compatible with almost all of lubricants (except those containing silicone and silicate) which are applied in
air conditioning and refrigeration systems. They can be used either in systems designed for specific
applications directly or as replacement to other refrigerants along with some modifications. Compatibility
with lubricant and safety factors are issues which should be noticed in case of replacements. Currently
there are lots of domestic refrigerators and small air conditioning systems which are run by hydrocarbons
as refrigerants. HCs also extensively are used in refrigeration process systems in the gas and oil industries.
(Arcakliog, 2005)
4.1.4 Hydrocarbon blends
Numbers of low GWP single –component refrigerants which have high critical temperature are limited
and most of mixtures that meet these characteristics are zeotropic with large temperature glide. Thus it
was decided to evaluate azeotropic blends with thermodynamic properties near to common refrigerants.
ASHRAE published a list of ecofriendly refrigerants which are blends of different natural refrigerants.
Mostly they are mixture of hydrocarbons and dimethyl ether (DME, RE170) in which both of them have
low GWPs. These new blends are good alternatives for conventional refrigerants with high GWPs .They
are drop-in replacements that means with small changes in the system can be replaced with the current
high GWP refrigerants. (Davis, 2008)
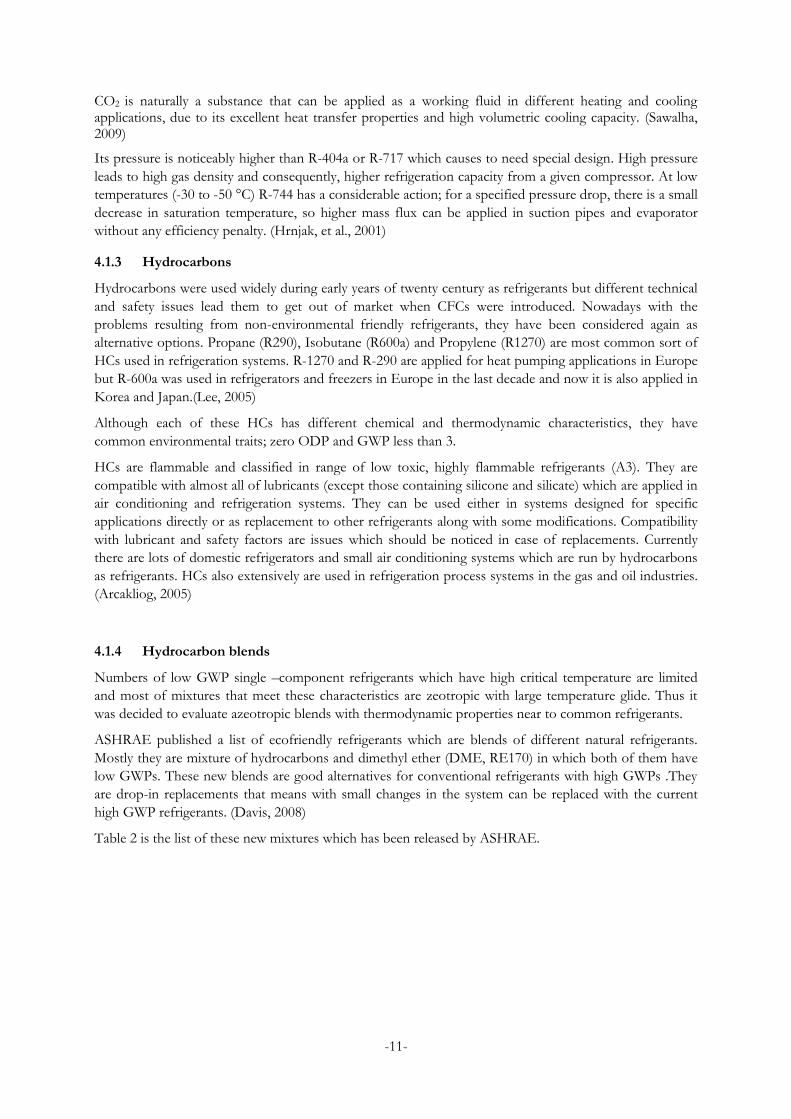
Table 2 is the list of these new mixtures which has been released by ASHRAE.
-12-
Table 2. List of new natural blends as environmental friendly refrigerants (Jung, 2008)
Refrigerants Composition (% mass) NBP(°C) Temperature glide( at 1 atm)
GWP ODP Safety class
OEL
(ppm)
R-429A R-E170/R-152a/R-
600a(60/10/30) -25.9 0.5 14
0 A3 1000
R-430A R-152a/R-600a(76/24) -27.6 0.2 107 0 A3 1000
R-431A R-290/R-152a(71/29) -43.2 0.0 43 0 A3 1000
R-432A R-1270/R-E170(80/20) -46.4 1.2 < 3 0 A3 710
R-433A R-1270/R-290(30/70) -44.5 0.4 < 3 0 A3 880
R-435A R-E170/R-152a(80/20) -26.0 0.2 30 0 A3 1000
R-436A R-290/R-600a(56/44) -34.3 8.2 < 3 0 A3 1000
R-436B R-290/R-600a(52/48) -33.3 8.3 < 3 0 A3 1000
R-433B R-1270/R-290(5/95) -42.6 0.1 < 3 0 N/A N/A
R-433C R-1270/R-290(25/75) -44.2 0.4 < 3 0 N/A N/A
R-510A R-E170/R-600a(88/12) -25.1 0.0 < 3 0 A3 1000
4.2 R-152a (HFC Refrigerant)
R-152a is the only HFC refrigerant that still can be considered as an alternative for R-134a in air
conditioning systems. While its GWP is about 130, its chemical properties are like those for R-134a, thus
it could be used in existing production system with just some small changes.
R152a has 10% of GWP for R-134a with smaller refrigerant charge than R134a, in the other words at
systems with R-152a as working fluid; refrigerant charge is about 35% lower than that for R-134a. Due to
its larger molecules in comparison with R-134a, R152a has less refrigerant leakage. It has been proposed as
a “drop-in “replacement for R-134a. (Mathur, 2003)
R-152a is mildly flammable. One way to decrease the flammability risk is to reduce the refrigerant charge
in the system. Hence R152a can be detained in a compact refrigeration system in order to decrease its risk
to ignite. Also using a compact heat exchanger with mini/micro channels reduces internal system volume
and therefore the charge inside the refrigeration system can be reduced. (Hamdar, 2010)
4.3 New refrigerants
4.3.1 HFO-1234ze
HFO-1234ze can be considered a near drop-in replacement of R 134a. Its thermodynamic behavior is
similar to the R-134a. It is non-flammable which make it safe in refrigeration application. It has very low
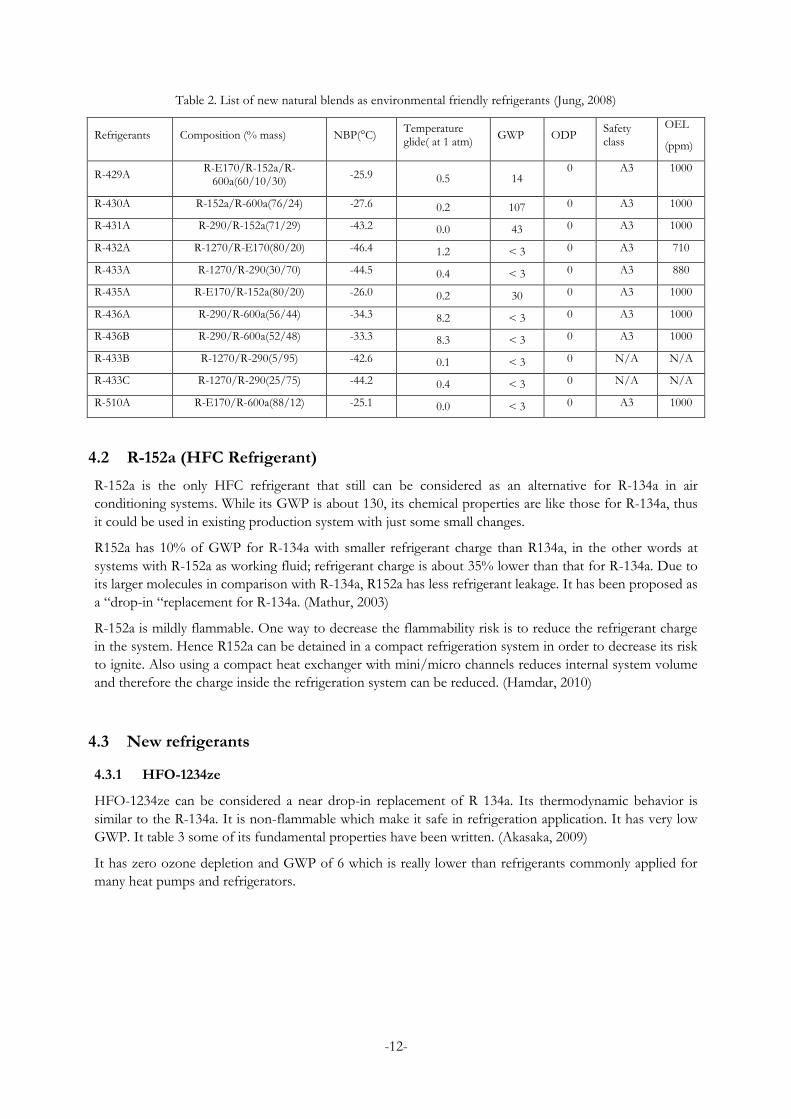
GWP. It table 3 some of its fundamental properties have been written. (Akasaka, 2009)
It has zero ozone depletion and GWP of 6 which is really lower than refrigerants commonly applied for
many heat pumps and refrigerators.
-13-
Table 3. Thermodynamic properties For HFO-1234ze (E). (Akasaka, 2009)
Chemical formula Trans, CHF=CHCF3
Molecular weight (kg/kmol) 114.04
GWP 6
ODP 0
Vapor Pressure at 25°C[Mpa] 0.49
Atmospheric Life Time [day] 18
Vapor Pressure at 50°C[MPa] 1.080
Critical Temperature[°C] 79
Critical Pressure[MPa] 3.632
Critical density[kg/m3] 486
Normal Boiling Point[°C] -20
Flame limit None to 30°C
Lower Flammability Limit[vol.% in air] -
Upper Flammability limit[vol.% in air] -
Ignition Temperature[°C] 288 - 293
Minimum Ignition Energy[mJ] No Ignition at 20°C, 61,000-64,000 at 54°C
Liquid Density at 25°C[kg/m3] 1180
Acentric Factor 0.296
4.3.2 Thermodynamic properties:
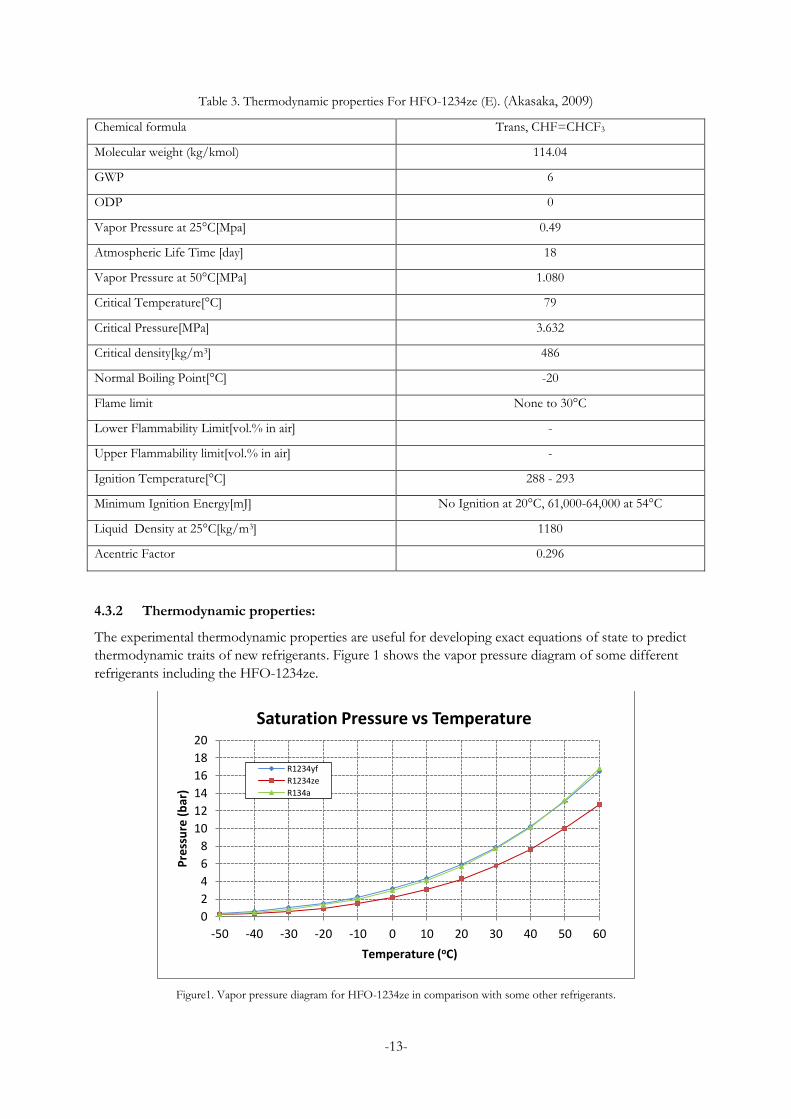
The experimental thermodynamic properties are useful for developing exact equations of state to predict
thermodynamic traits of new refrigerants. Figure 1 shows the vapor pressure diagram of some different
refrigerants including the HFO-1234ze.
Figure1. Vapor pressure diagram for HFO-1234ze in comparison with some other refrigerants.
0
2
4
6
8
10
12
14
16
18
20
-50 -40 -30 -20 -10 0 10 20 30 40 50 60
Pre
ssu
re (
bar
)
Temperature (oC)
Saturation Pressure vs Temperature
R1234yf
R1234ze
R134a
-14-
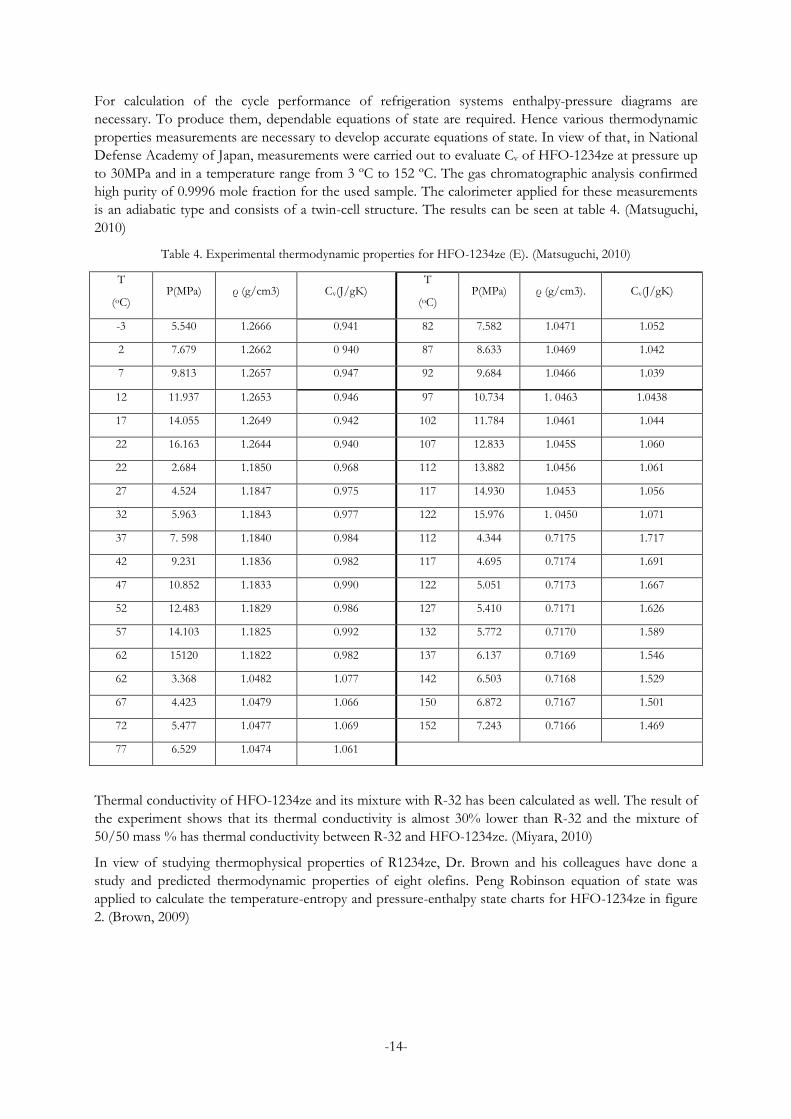
For calculation of the cycle performance of refrigeration systems enthalpy-pressure diagrams are
necessary. To produce them, dependable equations of state are required. Hence various thermodynamic
properties measurements are necessary to develop accurate equations of state. In view of that, in National
Defense Academy of Japan, measurements were carried out to evaluate Cv of HFO-1234ze at pressure up
to 30MPa and in a temperature range from 3 ºC to 152 ºC. The gas chromatographic analysis confirmed
high purity of 0.9996 mole fraction for the used sample. The calorimeter applied for these measurements
is an adiabatic type and consists of a twin-cell structure. The results can be seen at table 4. (Matsuguchi,
2010)
Table 4. Experimental thermodynamic properties for HFO-1234ze (E). (Matsuguchi, 2010)
T
(oC) P(MPa) ρ (g/cm3) Cv(J/gK)
T
(oC) P(MPa) ρ (g/cm3). Cv(J/gK)
-3 5.540 1.2666 0.941 82 7.582 1.0471 1.052
2 7.679 1.2662 0 940 87 8.633 1.0469 1.042
7 9.813 1.2657 0.947 92 9.684 1.0466 1.039
12 11.937 1.2653 0.946 97 10.734 1. 0463 1.0438
17 14.055 1.2649 0.942 102 11.784 1.0461 1.044
22 16.163 1.2644 0.940 107 12.833 1.045S 1.060
22 2.684 1.1850 0.968 112 13.882 1.0456 1.061
27 4.524 1.1847 0.975 117 14.930 1.0453 1.056
32 5.963 1.1843 0.977 122 15.976 1. 0450 1.071
37 7. 598 1.1840 0.984 112 4.344 0.7175 1.717
42 9.231 1.1836 0.982 117 4.695 0.7174 1.691
47 10.852 1.1833 0.990 122 5.051 0.7173 1.667
52 12.483 1.1829 0.986 127 5.410 0.7171 1.626
57 14.103 1.1825 0.992 132 5.772 0.7170 1.589
62 15120 1.1822 0.982 137 6.137 0.7169 1.546
62 3.368 1.0482 1.077 142 6.503 0.7168 1.529
67 4.423 1.0479 1.066 150 6.872 0.7167 1.501
72 5.477 1.0477 1.069 152 7.243 0.7166 1.469
77 6.529 1.0474 1.061
Thermal conductivity of HFO-1234ze and its mixture with R-32 has been calculated as well. The result of
the experiment shows that its thermal conductivity is almost 30% lower than R-32 and the mixture of
50/50 mass % has thermal conductivity between R-32 and HFO-1234ze. (Miyara, 2010)
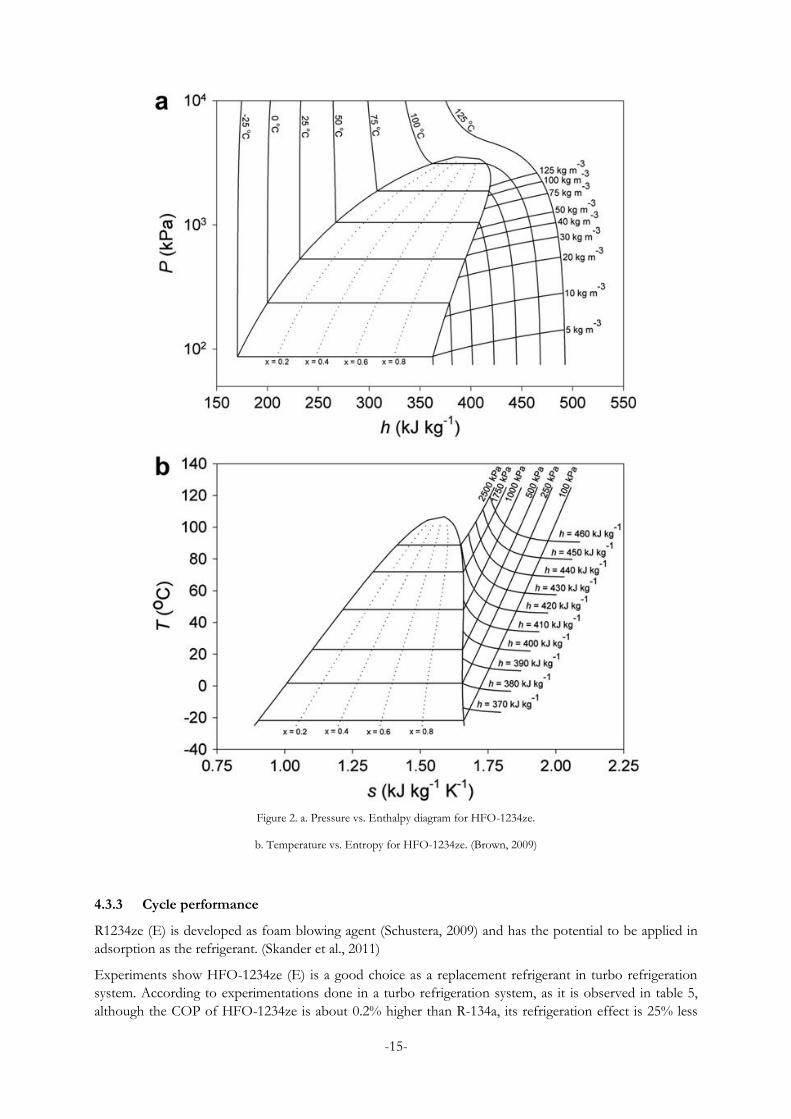
In view of studying thermophysical properties of R1234ze, Dr. Brown and his colleagues have done a
study and predicted thermodynamic properties of eight olefins. Peng Robinson equation of state was
applied to calculate the temperature-entropy and pressure-enthalpy state charts for HFO-1234ze in figure
2. (Brown, 2009)
-15-
Figure 2. a. Pressure vs. Enthalpy diagram for HFO-1234ze.
b. Temperature vs. Entropy for HFO-1234ze. (Brown, 2009)
4.3.3 Cycle performance
R1234ze (E) is developed as foam blowing agent (Schustera, 2009) and has the potential to be applied in
adsorption as the refrigerant. (Skander et al., 2011)
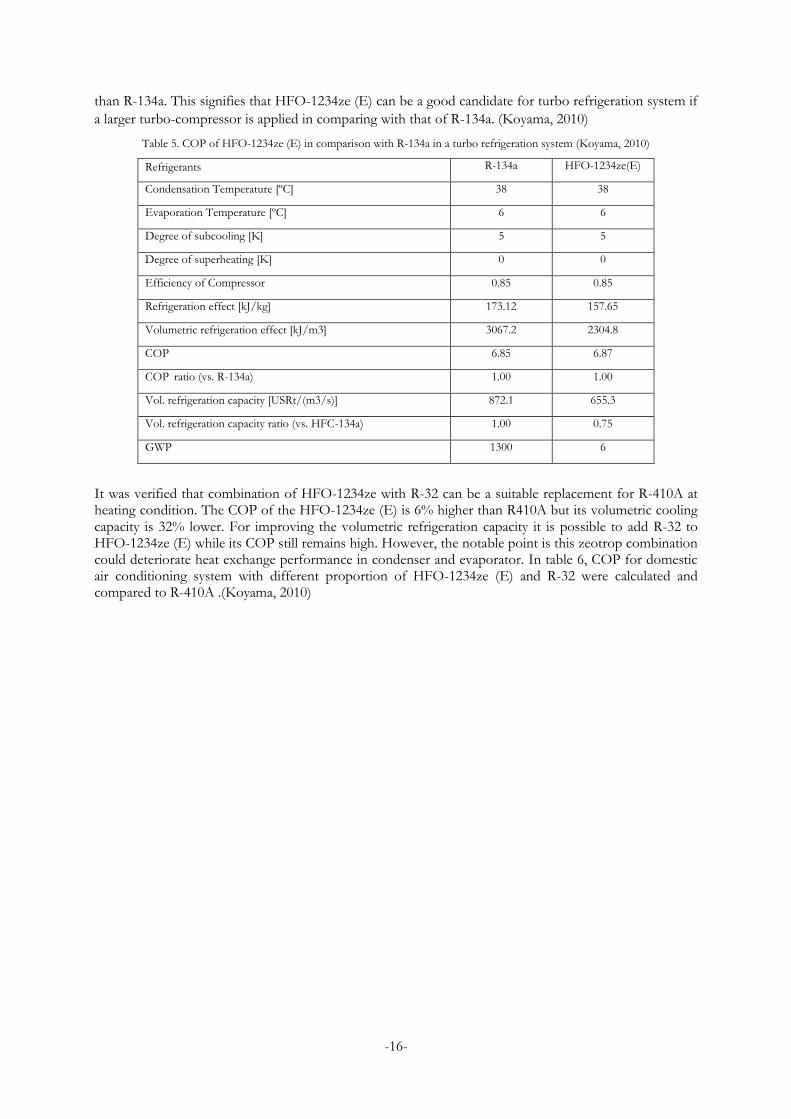
Experiments show HFO-1234ze (E) is a good choice as a replacement refrigerant in turbo refrigeration
system. According to experimentations done in a turbo refrigeration system, as it is observed in table 5,
although the COP of HFO-1234ze is about 0.2% higher than R-134a, its refrigeration effect is 25% less
-16-
than R-134a. This signifies that HFO-1234ze (E) can be a good candidate for turbo refrigeration system if
a larger turbo-compressor is applied in comparing with that of R-134a. (Koyama, 2010)
Table 5. COP of HFO-1234ze (E) in comparison with R-134a in a turbo refrigeration system (Koyama, 2010)
Refrigerants R-134a HFO-1234ze(E)
Condensation Temperature [ºC] 38 38
Evaporation Temperature [ºC] 6 6
Degree of subcooling [K] 5 5
Degree of superheating [K] 0 0
Efficiency of Compressor 0.85 0.85
Refrigeration effect [kJ/kg] 173.12 157.65
Volumetric refrigeration effect [kJ/m3] 3067.2 2304.8
COP 6.85 6.87
COP ratio (vs. R-134a) 1.00 1.00
Vol. refrigeration capacity [USRt/(m3/s)] 872.1 655.3
Vol. refrigeration capacity ratio (vs. HFC-134a) 1.00 0.75
GWP 1300 6
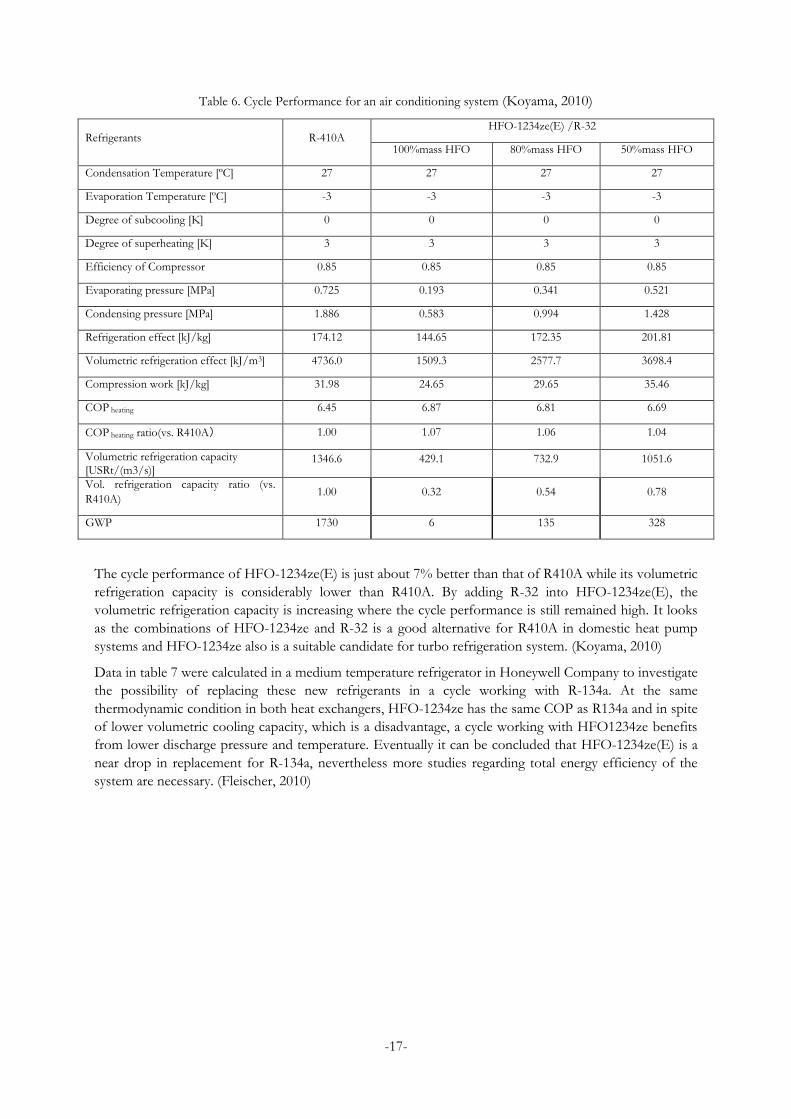
It was verified that combination of HFO-1234ze with R-32 can be a suitable replacement for R-410A at heating condition. The COP of the HFO-1234ze (E) is 6% higher than R410A but its volumetric cooling capacity is 32% lower. For improving the volumetric refrigeration capacity it is possible to add R-32 to HFO-1234ze (E) while its COP still remains high. However, the notable point is this zeotrop combination could deteriorate heat exchange performance in condenser and evaporator. In table 6, COP for domestic air conditioning system with different proportion of HFO-1234ze (E) and R-32 were calculated and compared to R-410A .(Koyama, 2010)
-17-
Table 6. Cycle Performance for an air conditioning system (Koyama, 2010)
Refrigerants R-410A HFO-1234ze(E) /R-32
100%mass HFO 80%mass HFO 50%mass HFO
Condensation Temperature [ºC] 27 27 27 27
Evaporation Temperature [ºC] -3 -3 -3 -3
Degree of subcooling [K] 0 0 0 0
Degree of superheating [K] 3 3 3 3
Efficiency of Compressor 0.85 0.85 0.85 0.85
Evaporating pressure [MPa] 0.725 0.193 0.341 0.521
Condensing pressure [MPa] 1.886 0.583 0.994 1.428
Refrigeration effect [kJ/kg] 174.12 144.65 172.35 201.81
Volumetric refrigeration effect [kJ/m3] 4736.0 1509.3 2577.7 3698.4
Compression work [kJ/kg] 31.98 24.65 29.65 35.46
COP heating 6.45 6.87 6.81 6.69
COP heating ratio(vs. R410A) 1.00 1.07 1.06 1.04
Volumetric refrigeration capacity [USRt/(m3/s)]
1346.6 429.1 732.9 1051.6
Vol. refrigeration capacity ratio (vs.
R410A) 1.00 0.32 0.54 0.78
GWP 1730 6 135 328
The cycle performance of HFO-1234ze(E) is just about 7% better than that of R410A while its volumetric
refrigeration capacity is considerably lower than R410A. By adding R-32 into HFO-1234ze(E), the
volumetric refrigeration capacity is increasing where the cycle performance is still remained high. It looks
as the combinations of HFO-1234ze and R-32 is a good alternative for R410A in domestic heat pump
systems and HFO-1234ze also is a suitable candidate for turbo refrigeration system. (Koyama, 2010)
Data in table 7 were calculated in a medium temperature refrigerator in Honeywell Company to investigate
the possibility of replacing these new refrigerants in a cycle working with R-134a. At the same
thermodynamic condition in both heat exchangers, HFO-1234ze has the same COP as R134a and in spite
of lower volumetric cooling capacity, which is a disadvantage, a cycle working with HFO1234ze benefits
from lower discharge pressure and temperature. Eventually it can be concluded that HFO-1234ze(E) is a
near drop in replacement for R-134a, nevertheless more studies regarding total energy efficiency of the
system are necessary. (Fleischer, 2010)
-18-
Table.7 Thermodynamic cycle, comparison of R1234yf and R-1234ze to R-134a (Fleischer, 2010)
Parameter R134a R1234ze R1234yf
Evap Temperature. [°C] -6.50 -6.50 -6.50
Degree of superheating [K] 5.55 5.55 5.55
Cycle Initial Information Cond. Temperature [°C] 45.00 45.00 45.00
Degree of subcooling [K] 5.55 5.55 5.55
Compressor efficiency 0.60 0.60 0.60
P evap. [kPa] 229.8 164.3 249.5
P cond. [kPa] 1159.9 864.2 1134.1
Thermodynamic Analysis Discharge Temperature [°C] 77.5 72.3 64.3
COPc 2.5 2.5 2.4
Density of gas phase [kg/m3] 11.1 8.8 13.7
Compression Ratio 5.0 5.3 4.5
Capacity 100% 73% 94%
COP 100% 100% 96%
Relative Properties to R-134A
R R-134a
Suction Pressure 100%. 71% 109%
Discharge Pressure 100%. 75% 98%.
Discharge Temperature 0.00 -5.20 -13.27
GWP 1410 6 4
Other Flammability 1 None to 30°C 2L
Toxicity A A A
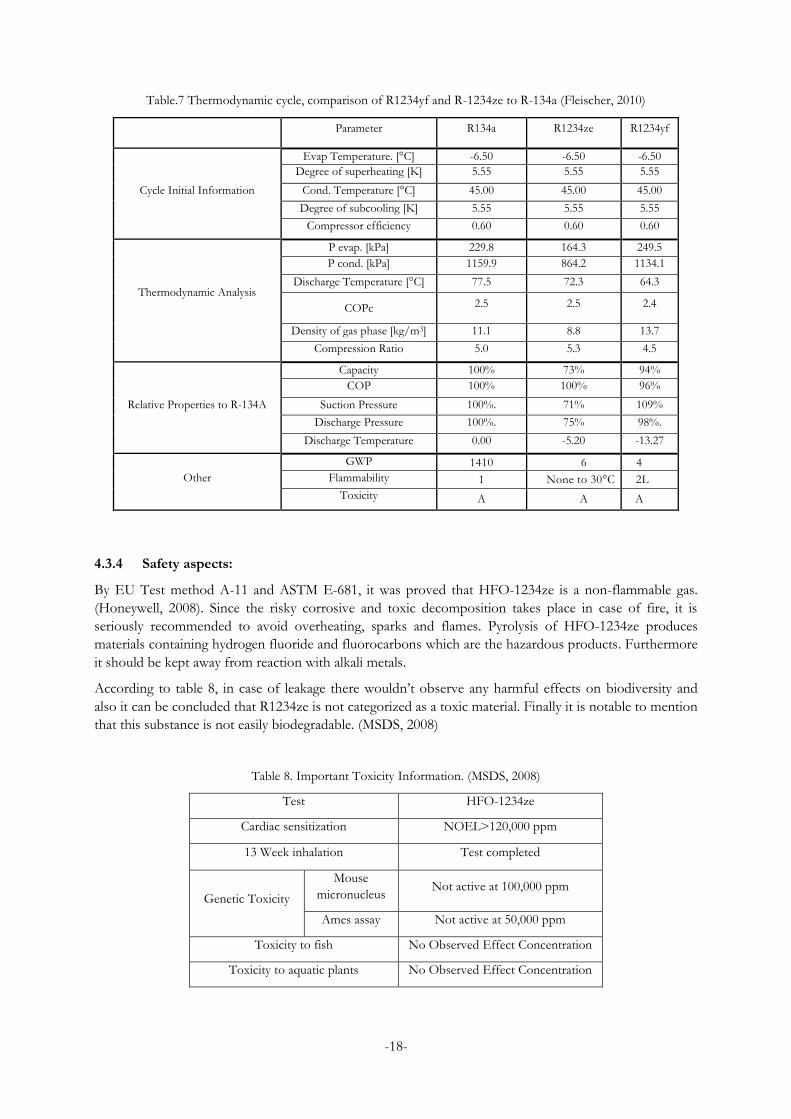
4.3.4 Safety aspects:
By EU Test method A-11 and ASTM E-681, it was proved that HFO-1234ze is a non-flammable gas.
(Honeywell, 2008). Since the risky corrosive and toxic decomposition takes place in case of fire, it is
seriously recommended to avoid overheating, sparks and flames. Pyrolysis of HFO-1234ze produces
materials containing hydrogen fluoride and fluorocarbons which are the hazardous products. Furthermore
it should be kept away from reaction with alkali metals.
According to table 8, in case of leakage there wouldn’t observe any harmful effects on biodiversity and
also it can be concluded that R1234ze is not categorized as a toxic material. Finally it is notable to mention
that this substance is not easily biodegradable. (MSDS, 2008)
Table 8. Important Toxicity Information. (MSDS, 2008)
Test HFO-1234ze
Cardiac sensitization NOEL>120,000 ppm
13 Week inhalation Test completed
Genetic Toxicity
Mouse
micronucleus Not active at 100,000 ppm
Ames assay Not active at 50,000 ppm
Toxicity to fish No Observed Effect Concentration
Toxicity to aquatic plants No Observed Effect Concentration
-19-
4.3.5 HFO-1234yf
HFO-1234yf has been developed as a replacement for HFC-134a in automobile air conditioning as well.
Because of its low GWP, favorable LCCP and zero Ozone Depletion Potential (ODP), this new
refrigerant has got considered largely by automobile manufactures .It has a good compatibility with
existing technology that leads to fast global adoption. Its system performance is similar to R-134a and has
comparable COP and cooling capacity to those of R134a. Being thermally stable is another notable
property of this new refrigerant which makes it a promising candidate to substitute R-134a. (Tanaka, 2010)
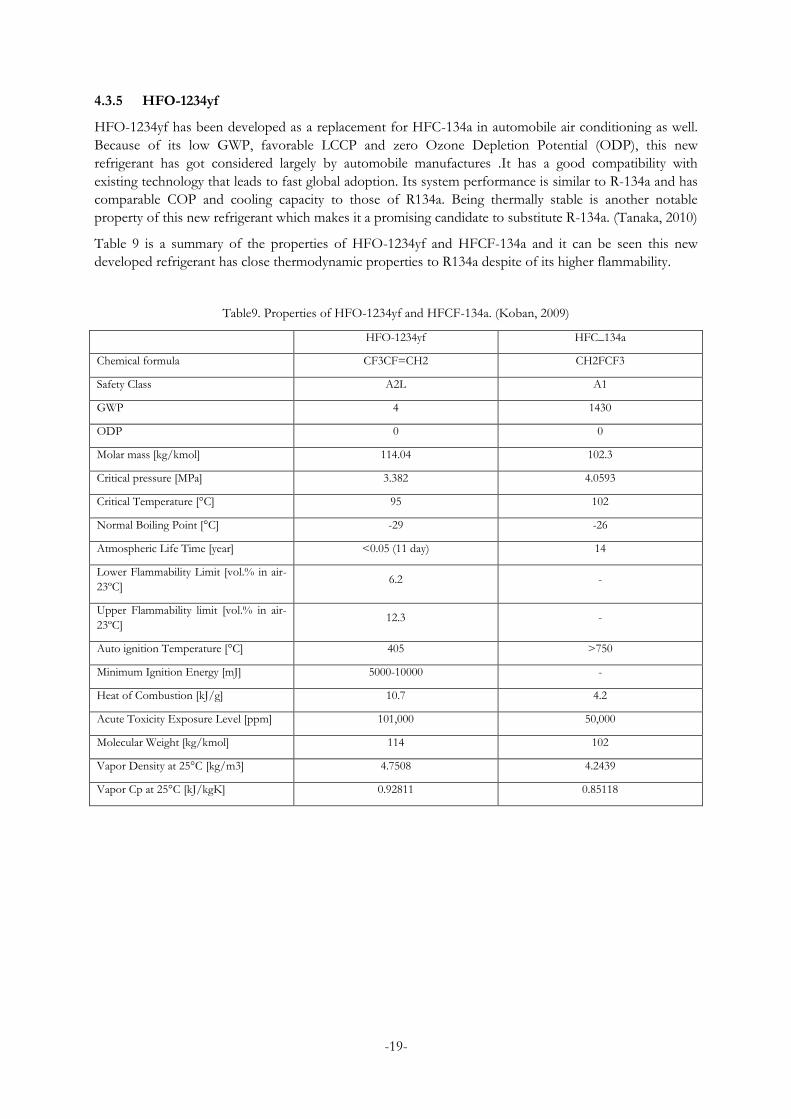
Table 9 is a summary of the properties of HFO-1234yf and HFCF-134a and it can be seen this new
developed refrigerant has close thermodynamic properties to R134a despite of its higher flammability.
Table9. Properties of HFO-1234yf and HFCF-134a. (Koban, 2009)
HFO-1234yf HFC_134a
Chemical formula CF3CF=CH2 CH2FCF3
Safety Class A2L A1
GWP 4 1430
ODP 0 0
Molar mass [kg/kmol] 114.04 102.3
Critical pressure [MPa] 3.382 4.0593
Critical Temperature [°C] 95 102
Normal Boiling Point [°C] -29 -26
Atmospheric Life Time [year] <0.05 (11 day) 14
Lower Flammability Limit [vol.% in air-
23ºC] 6.2 -
Upper Flammability limit [vol.% in air-
23ºC] 12.3 -
Auto ignition Temperature [°C] 405 >750
Minimum Ignition Energy [mJ] 5000-10000 -
Heat of Combustion [kJ/g] 10.7 4.2
Acute Toxicity Exposure Level [ppm] 101,000 50,000
Molecular Weight [kg/kmol] 114 102
Vapor Density at 25°C [kg/m3] 4.7508 4.2439
Vapor Cp at 25°C [kJ/kgK] 0.92811 0.85118
-20-
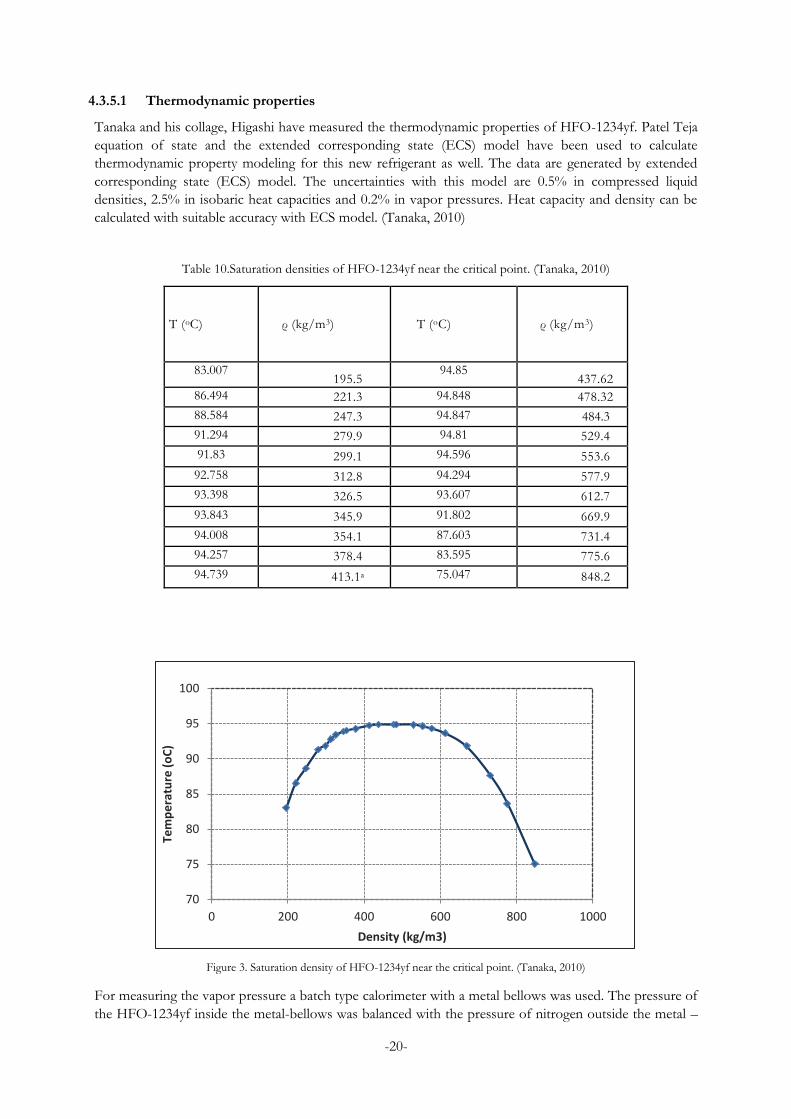
4.3.5.1 Thermodynamic properties
Tanaka and his collage, Higashi have measured the thermodynamic properties of HFO-1234yf. Patel Teja
equation of state and the extended corresponding state (ECS) model have been used to calculate
thermodynamic property modeling for this new refrigerant as well. The data are generated by extended
corresponding state (ECS) model. The uncertainties with this model are 0.5% in compressed liquid
densities, 2.5% in isobaric heat capacities and 0.2% in vapor pressures. Heat capacity and density can be
calculated with suitable accuracy with ECS model. (Tanaka, 2010)
Table 10.Saturation densities of HFO-1234yf near the critical point. (Tanaka, 2010)
T (oC) ρ (kg/m3) T (oC) ρ (kg/m3)
83.007 195.5
94.85 437.62
86.494 221.3 94.848 478.32
88.584 247.3 94.847 484.3
91.294 279.9 94.81 529.4
91.83 299.1 94.596 553.6
92.758 312.8 94.294 577.9
93.398 326.5 93.607 612.7
93.843 345.9 91.802 669.9
94.008 354.1 87.603 731.4
94.257 378.4 83.595 775.6
94.739 413.1a 75.047 848.2
Figure 3. Saturation density of HFO-1234yf near the critical point. (Tanaka, 2010)
For measuring the vapor pressure a batch type calorimeter with a metal bellows was used. The pressure of
the HFO-1234yf inside the metal-bellows was balanced with the pressure of nitrogen outside the metal –
70
75
80
85
90
95
100
0 200 400 600 800 1000
Tem
pe
ratu
re (
oC
)
Density (kg/m3)
-21-
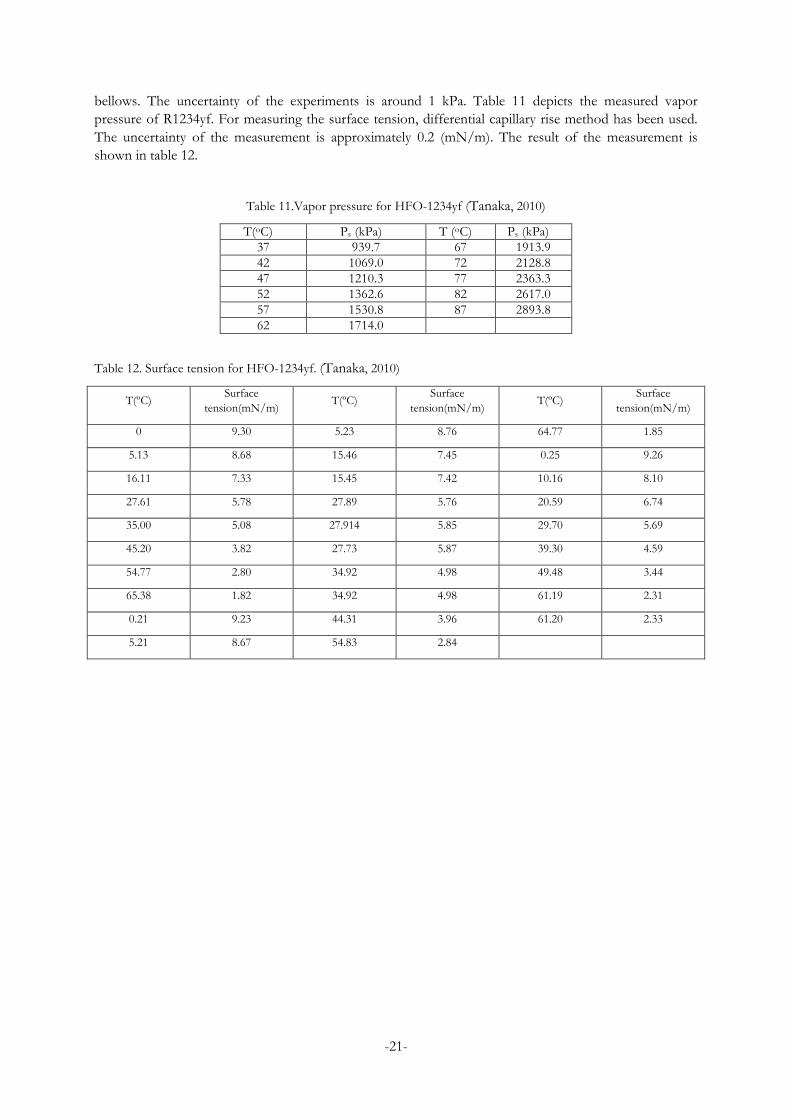
bellows. The uncertainty of the experiments is around 1 kPa. Table 11 depicts the measured vapor
pressure of R1234yf. For measuring the surface tension, differential capillary rise method has been used.
The uncertainty of the measurement is approximately 0.2 (mN/m). The result of the measurement is
shown in table 12.
Table 11.Vapor pressure for HFO-1234yf (Tanaka, 2010)
T(oC) Ps (kPa) T (oC) Ps (kPa)
37 939.7 67 1913.9
42 1069.0 72 2128.8
47 1210.3 77 2363.3
52 1362.6 82 2617.0
57 1530.8 87 2893.8
62 1714.0
Table 12. Surface tension for HFO-1234yf. (Tanaka, 2010)
T(ºC) Surface
tension(mN/m) T(ºC)
Surface
tension(mN/m) T(ºC)
Surface
tension(mN/m)
0 9.30 5.23 8.76 64.77 1.85
5.13 8.68 15.46 7.45 0.25 9.26
16.11 7.33 15.45 7.42 10.16 8.10
27.61 5.78 27.89 5.76 20.59 6.74
35.00 5.08 27.914 5.85 29.70 5.69
45.20 3.82 27.73 5.87 39.30 4.59
54.77 2.80 34.92 4.98 49.48 3.44
65.38 1.82 34.92 4.98 61.19 2.31
0.21 9.23 44.31 3.96 61.20 2.33
5.21 8.67 54.83 2.84
-22-
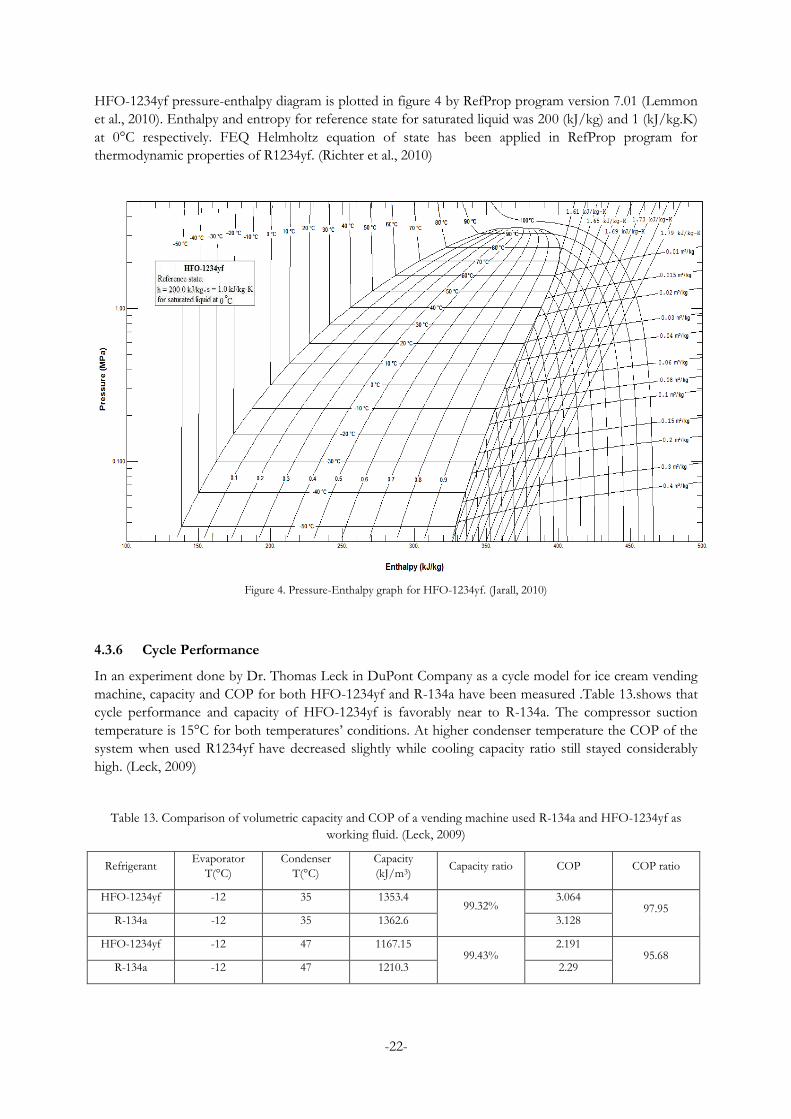
HFO-1234yf pressure-enthalpy diagram is plotted in figure 4 by RefProp program version 7.01 (Lemmon
et al., 2010). Enthalpy and entropy for reference state for saturated liquid was 200 (kJ/kg) and 1 (kJ/kg.K)
at 0°C respectively. FEQ Helmholtz equation of state has been applied in RefProp program for
thermodynamic properties of R1234yf. (Richter et al., 2010)
Figure 4. Pressure-Enthalpy graph for HFO-1234yf. (Jarall, 2010)
4.3.6 Cycle Performance
In an experiment done by Dr. Thomas Leck in DuPont Company as a cycle model for ice cream vending
machine, capacity and COP for both HFO-1234yf and R-134a have been measured .Table 13.shows that
cycle performance and capacity of HFO-1234yf is favorably near to R-134a. The compressor suction
temperature is 15°C for both temperatures’ conditions. At higher condenser temperature the COP of the
system when used R1234yf have decreased slightly while cooling capacity ratio still stayed considerably
high. (Leck, 2009)
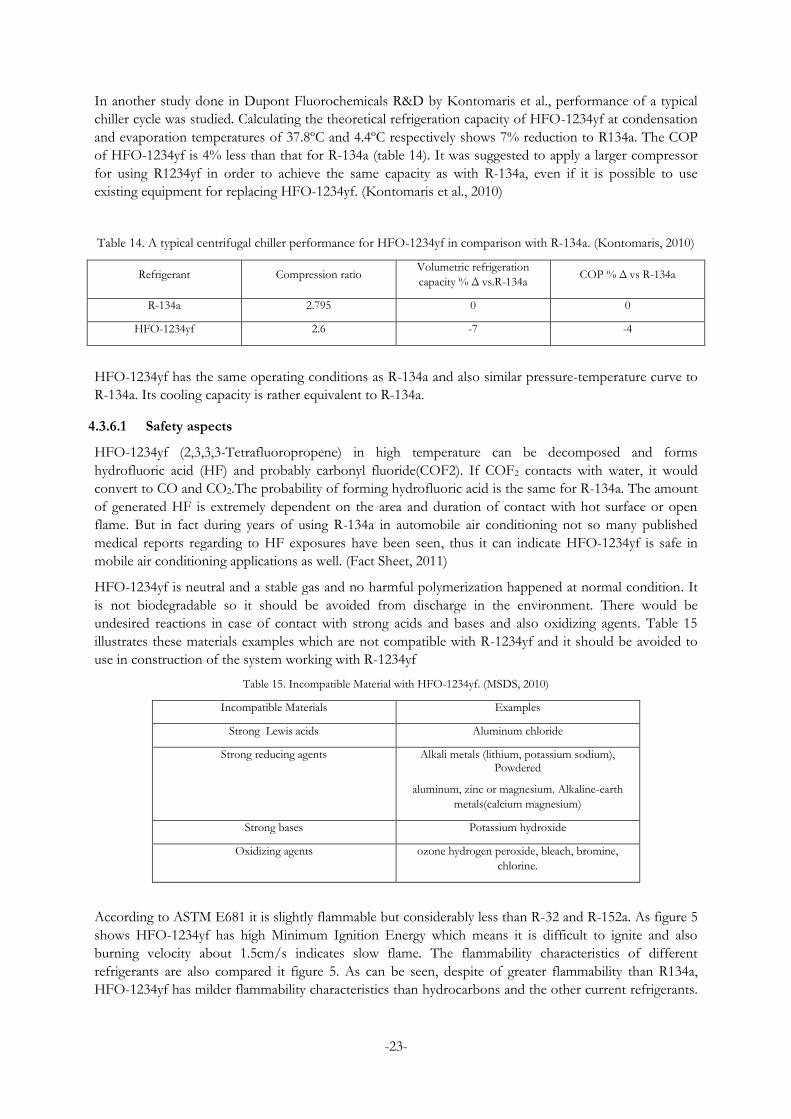
Table 13. Comparison of volumetric capacity and COP of a vending machine used R-134a and HFO-1234yf as
working fluid. (Leck, 2009)
Refrigerant Evaporator
T(°C)
Condenser
T(°C)
Capacity
(kJ/m3) Capacity ratio COP COP ratio
HFO-1234yf -12 35 1353.4 99.32%
3.064 97.95
R-134a -12 35 1362.6 3.128
HFO-1234yf -12 47 1167.15 99.43%
2.191 95.68
R-134a -12 47 1210.3 2.29
-23-
In another study done in Dupont Fluorochemicals R&D by Kontomaris et al., performance of a typical
chiller cycle was studied. Calculating the theoretical refrigeration capacity of HFO-1234yf at condensation
and evaporation temperatures of 37.8ºC and 4.4ºC respectively shows 7% reduction to R134a. The COP
of HFO-1234yf is 4% less than that for R-134a (table 14). It was suggested to apply a larger compressor
for using R1234yf in order to achieve the same capacity as with R-134a, even if it is possible to use
existing equipment for replacing HFO-1234yf. (Kontomaris et al., 2010)
Table 14. A typical centrifugal chiller performance for HFO-1234yf in comparison with R-134a. (Kontomaris, 2010)
Refrigerant Compression ratio Volumetric refrigeration
capacity % Δ vs.R-134a COP % Δ vs R-134a
R-134a 2.795 0 0
HFO-1234yf 2.6 -7 -4
HFO-1234yf has the same operating conditions as R-134a and also similar pressure-temperature curve to
R-134a. Its cooling capacity is rather equivalent to R-134a.
4.3.6.1 Safety aspects
HFO-1234yf (2,3,3,3-Tetrafluoropropene) in high temperature can be decomposed and forms
hydrofluoric acid (HF) and probably carbonyl fluoride(COF2). If COF2 contacts with water, it would
convert to CO and CO2.The probability of forming hydrofluoric acid is the same for R-134a. The amount
of generated HF is extremely dependent on the area and duration of contact with hot surface or open
flame. But in fact during years of using R-134a in automobile air conditioning not so many published
medical reports regarding to HF exposures have been seen, thus it can indicate HFO-1234yf is safe in
mobile air conditioning applications as well. (Fact Sheet, 2011)
HFO-1234yf is neutral and a stable gas and no harmful polymerization happened at normal condition. It
is not biodegradable so it should be avoided from discharge in the environment. There would be
undesired reactions in case of contact with strong acids and bases and also oxidizing agents. Table 15
illustrates these materials examples which are not compatible with R-1234yf and it should be avoided to
use in construction of the system working with R-1234yf
Table 15. Incompatible Material with HFO-1234yf. (MSDS, 2010)
Incompatible Materials Examples
Strong Lewis acids Aluminum chloride
Strong reducing agents Alkali metals (lithium, potassium sodium), Powdered
aluminum, zinc or magnesium. Alkaline-earth
metals(calcium magnesium)
Strong bases Potassium hydroxide
Oxidizing agents ozone hydrogen peroxide, bleach, bromine,
chlorine.
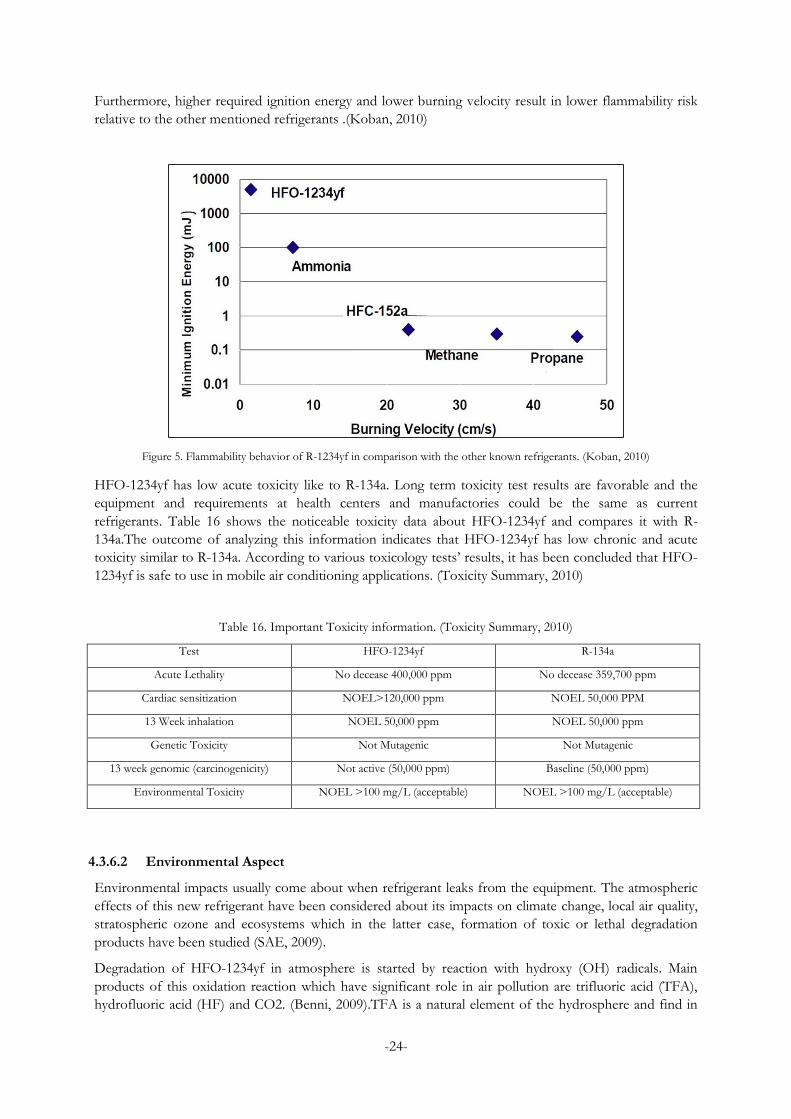
According to ASTM E681 it is slightly flammable but considerably less than R-32 and R-152a. As figure 5
shows HFO-1234yf has high Minimum Ignition Energy which means it is difficult to ignite and also
burning velocity about 1.5cm/s indicates slow flame. The flammability characteristics of different
refrigerants are also compared it figure 5. As can be seen, despite of greater flammability than R134a,
HFO-1234yf has milder flammability characteristics than hydrocarbons and the other current refrigerants.
-24-
Furthermore, higher required ignition energy and lower burning velocity result in lower flammability risk
relative to the other mentioned refrigerants .(Koban, 2010)
Figure 5. Flammability behavior of R-1234yf in comparison with the other known refrigerants. (Koban, 2010)
HFO-1234yf has low acute toxicity like to R-134a. Long term toxicity test results are favorable and the
equipment and requirements at health centers and manufactories could be the same as current
refrigerants. Table 16 shows the noticeable toxicity data about HFO-1234yf and compares it with R-
134a.The outcome of analyzing this information indicates that HFO-1234yf has low chronic and acute
toxicity similar to R-134a. According to various toxicology tests’ results, it has been concluded that HFO-
1234yf is safe to use in mobile air conditioning applications. (Toxicity Summary, 2010)
Table 16. Important Toxicity information. (Toxicity Summary, 2010)
Test HFO-1234yf R-134a
Acute Lethality No decease 400,000 ppm No decease 359,700 ppm
Cardiac sensitization NOEL>120,000 ppm NOEL 50,000 PPM
13 Week inhalation NOEL 50,000 ppm NOEL 50,000 ppm
Genetic Toxicity Not Mutagenic Not Mutagenic
13 week genomic (carcinogenicity) Not active (50,000 ppm) Baseline (50,000 ppm)
Environmental Toxicity NOEL >100 mg/L (acceptable) NOEL >100 mg/L (acceptable)
4.3.6.2 Environmental Aspect
Environmental impacts usually come about when refrigerant leaks from the equipment. The atmospheric
effects of this new refrigerant have been considered about its impacts on climate change, local air quality,
stratospheric ozone and ecosystems which in the latter case, formation of toxic or lethal degradation
products have been studied (SAE, 2009).
Degradation of HFO-1234yf in atmosphere is started by reaction with hydroxy (OH) radicals. Main
products of this oxidation reaction which have significant role in air pollution are trifluoric acid (TFA),
hydrofluoric acid (HF) and CO2. (Benni, 2009).TFA is a natural element of the hydrosphere and find in
-25-
the ocean in huge quantities .It is biodegradable and stable under normal condition and doesn’t
accumulate in organisms’ bodies. The amount of TFA which is produced from degradation of HFO-
1234yf is considerably below predicted No Observed Effect Concentration (NOEC) thresholds and will
not affect ecosystems. (Atkinson, 2008)
Another product is CO2 which enhances greenhouse impact but has formed in small quantities and
degrades by photosynthesis. HF would rain out of the atmosphere and reacts with calcium sulfate and
produces sulphuric acid and calcium fluoride. (Kajihara, 2010)
Its GWP and atmospheric life time are well acceptable and there is no main contribution to radiative
forcing of climate changing. HFO-1234yf doesn’t have bromine or chlorine (Nielsen, 2007), so it doesn’t
contribute to catalytic ozone destruction cycle and no significant stratospheric impacts have been seen.
Finally results show no significant atmospheric concerns and impacts. (Hill, 2010)
Several LCCP evaluations show HFO-1234yf provided remarkable decreases (17-20%) to overall CO2-
equivalent emissions compared to HFC-134a.It seemed this new developed refrigerants is a noticeable
alternative at least for R-134a. (Koban, 2009)
4.3.7 HDRs
In some applications higher volumetric capacity are desired. These include most air conditioning and
some larger refrigeration systems. Evaluation of blends which provide both greater capacity and low GWP
are favorable. However, it is significant that these working fluids have high energy efficiency and
reasonable cost. In Honeywell Company new lower GWP blends named HDR, are processing so that
there would be no major change in safety and energy efficiency of the existing systems. HDR-01 and
HDR-07 are mixtures while having close operating characteristics to R-407C, their GWP are less than 150.
Other Honeywell developmental refrigerants are HDR-06 and HDR-11 which have similar vapor pressure
to R-410A. Their GWP are slightly less than 500 but they also have lower volumetric capacity than given
refrigerants like R-410C.
In a presentation from Honeywell, it is mentioned that all the studied blends are mildly flammable. Even if
they have noteworthy properties, more data and experimental evaluations are necessary to discuss them
comprehensively. (Samuel, 2010)
4.3.8 DR-11
DR-11 has recently been developed by Dupont. It is a new blend based on HFO-1234yf with close
thermodynamic properties and cycle performance to R-134a. It is commercially named Opteon XP10. It is
non-flammable with GWP near to 600 and temperature glide less than 0.01ºC. It is worthwhile to mention
that its composition is undisclosed. Experiments show it is an appropriate and cost effective candidate for
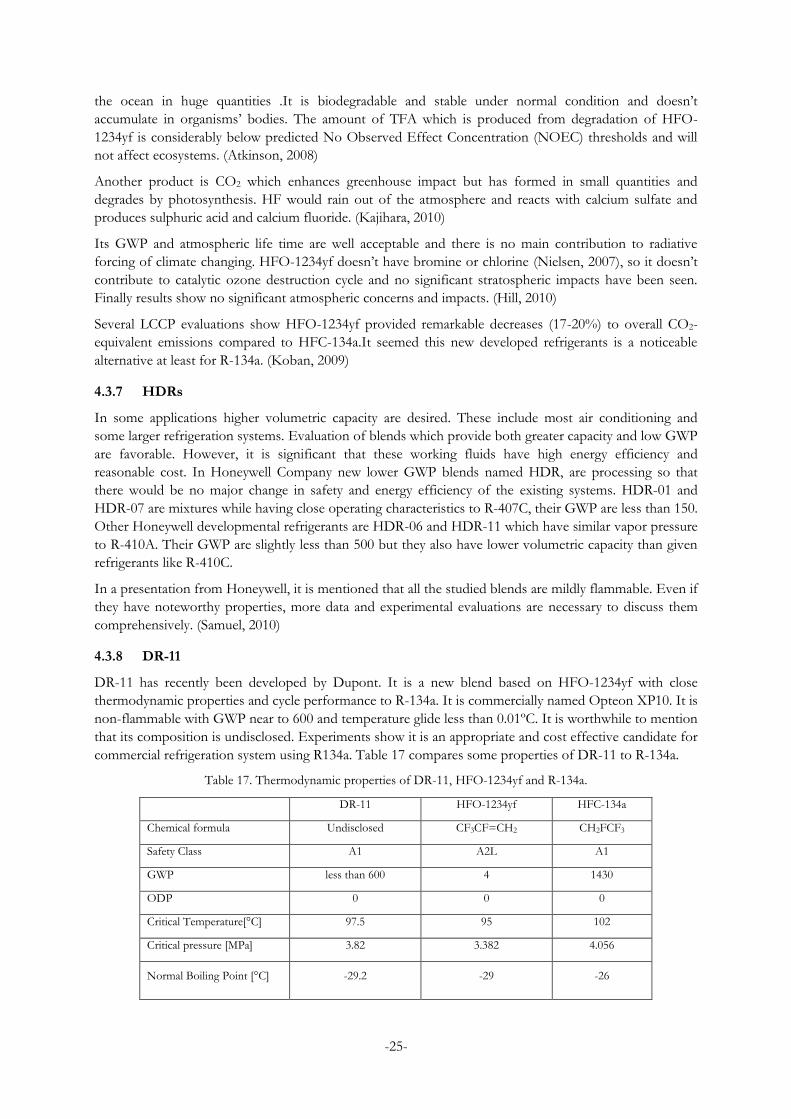
commercial refrigeration system using R134a. Table 17 compares some properties of DR-11 to R-134a.
Table 17. Thermodynamic properties of DR-11, HFO-1234yf and R-134a.
DR-11 HFO-1234yf HFC-134a
Chemical formula Undisclosed CF3CF=CH2 CH2FCF3
Safety Class A1 A2L A1
GWP less than 600 4 1430
ODP 0 0 0
Critical Temperature[°C] 97.5 95 102
Critical pressure [MPa] 3.82 3.382 4.056
Normal Boiling Point [°C] -29.2 -29 -26
-26-
Lower Flammability Limit
[vol.% in air] - 6.5 -
Upper Flammability limit
[vol.% in air] - 12.3 -
Auto ignition Temperature
[°C] - 405 >750
More studies and experiments revealed this new refrigerant can be used as medium temperature working
fluid beside CO2 at the low temperature side in hybrid systems. It is also concluded that in such a system
there would be 90% reduction in direct carbon emission and 50% in entire carbon emission compared to
the current food retailer’s refrigeration system using R404A in a direct expansion system. Different
laboratory tests are still under way to determine its performance in water chillers, medium temperature
refrigeration and commercial air conditioning.
Dupont Company has decided to market it in the EU during 2012 and 2013 in a limited quantity and then
access the market interest to decide the best time to commercialize it. (Reimer, 2010)
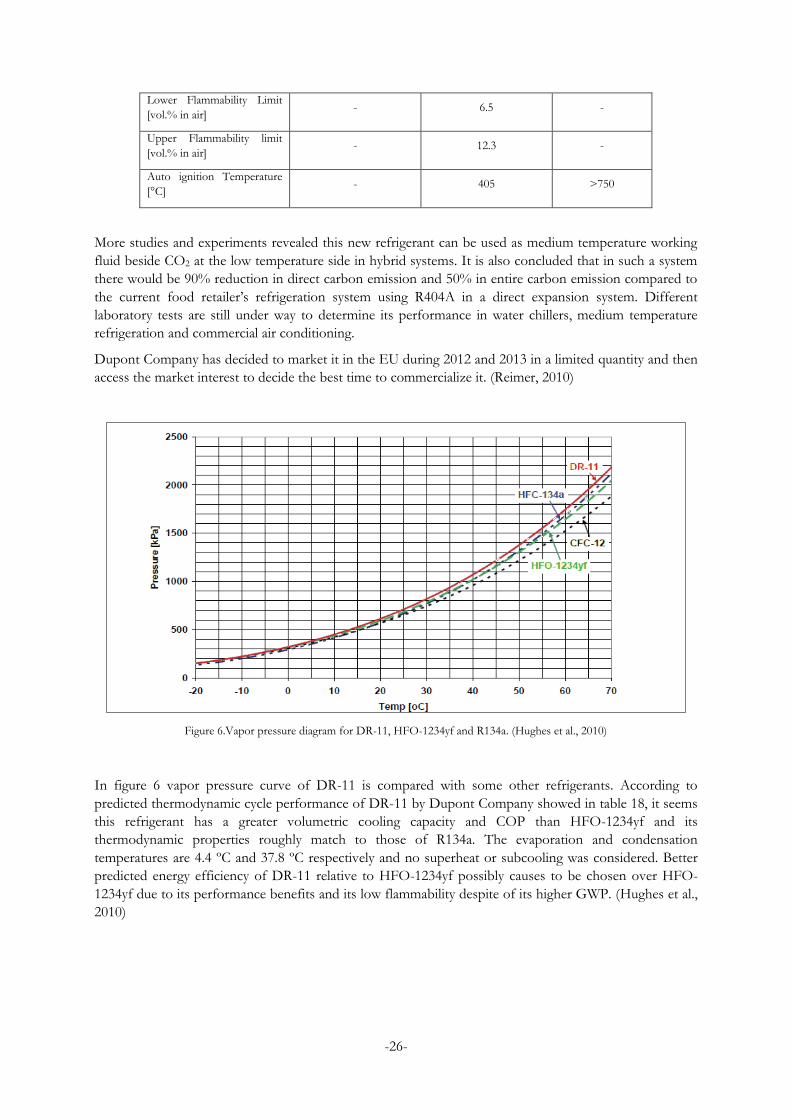
Figure 6.Vapor pressure diagram for DR-11, HFO-1234yf and R134a. (Hughes et al., 2010)
In figure 6 vapor pressure curve of DR-11 is compared with some other refrigerants. According to
predicted thermodynamic cycle performance of DR-11 by Dupont Company showed in table 18, it seems
this refrigerant has a greater volumetric cooling capacity and COP than HFO-1234yf and its
thermodynamic properties roughly match to those of R134a. The evaporation and condensation
temperatures are 4.4 ºC and 37.8 ºC respectively and no superheat or subcooling was considered. Better
predicted energy efficiency of DR-11 relative to HFO-1234yf possibly causes to be chosen over HFO-
1234yf due to its performance benefits and its low flammability despite of its higher GWP. (Hughes et al.,
2010)
-27-
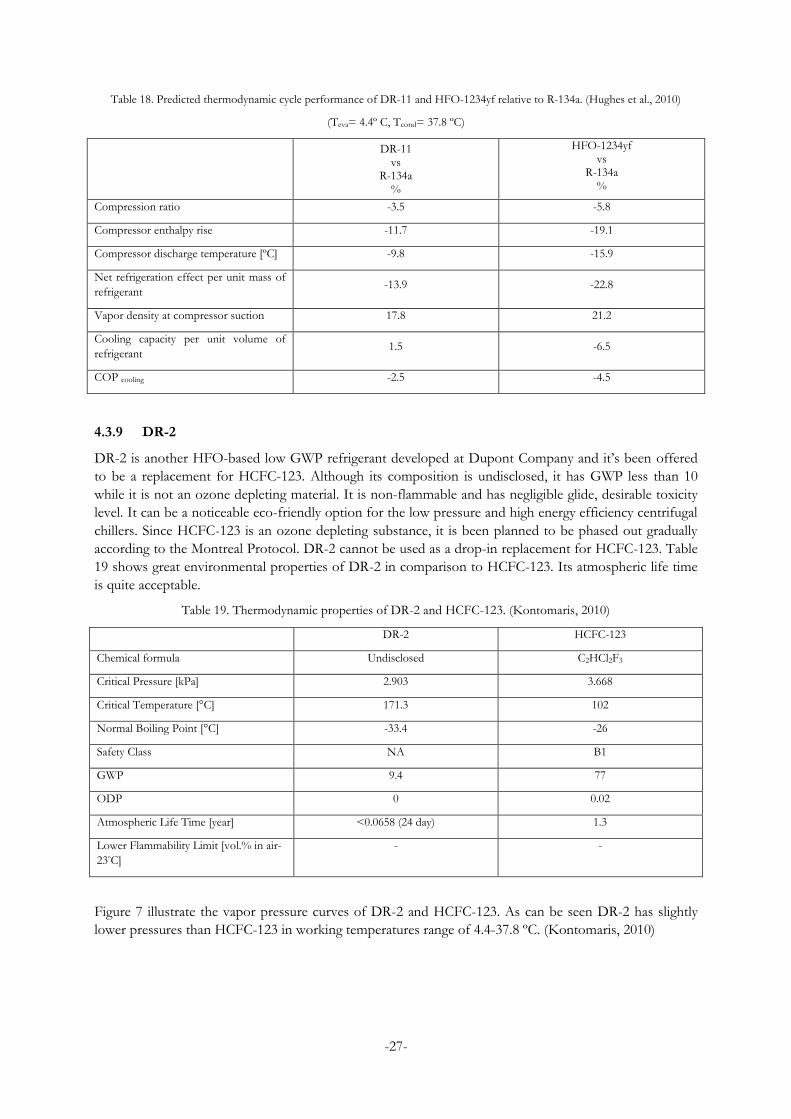
Table 18. Predicted thermodynamic cycle performance of DR-11 and HFO-1234yf relative to R-134a. (Hughes et al., 2010)
(Teva= 4.4º C, Tcond= 37.8 ºC)
DR-11 vs
R-134a %
HFO-1234yf vs
R-134a %
Compression ratio -3.5 -5.8
Compressor enthalpy rise -11.7 -19.1
Compressor discharge temperature [ºC] -9.8 -15.9
Net refrigeration effect per unit mass of
refrigerant -13.9 -22.8
Vapor density at compressor suction 17.8 21.2
Cooling capacity per unit volume of
refrigerant 1.5 -6.5
COP cooling -2.5 -4.5
4.3.9 DR-2
DR-2 is another HFO-based low GWP refrigerant developed at Dupont Company and it’s been offered
to be a replacement for HCFC-123. Although its composition is undisclosed, it has GWP less than 10
while it is not an ozone depleting material. It is non-flammable and has negligible glide, desirable toxicity
level. It can be a noticeable eco-friendly option for the low pressure and high energy efficiency centrifugal
chillers. Since HCFC-123 is an ozone depleting substance, it is been planned to be phased out gradually
according to the Montreal Protocol. DR-2 cannot be used as a drop-in replacement for HCFC-123. Table
19 shows great environmental properties of DR-2 in comparison to HCFC-123. Its atmospheric life time
is quite acceptable.
Table 19. Thermodynamic properties of DR-2 and HCFC-123. (Kontomaris, 2010)
DR-2 HCFC-123
Chemical formula Undisclosed C2HCl2F3
Critical Pressure [kPa] 2.903 3.668
Critical Temperature [°C] 171.3 102
Normal Boiling Point [°C] -33.4 -26
Safety Class NA B1
GWP 9.4 77
ODP 0 0.02
Atmospheric Life Time [year] <0.0658 (24 day) 1.3
Lower Flammability Limit [vol.% in air-
23ºC]
- -
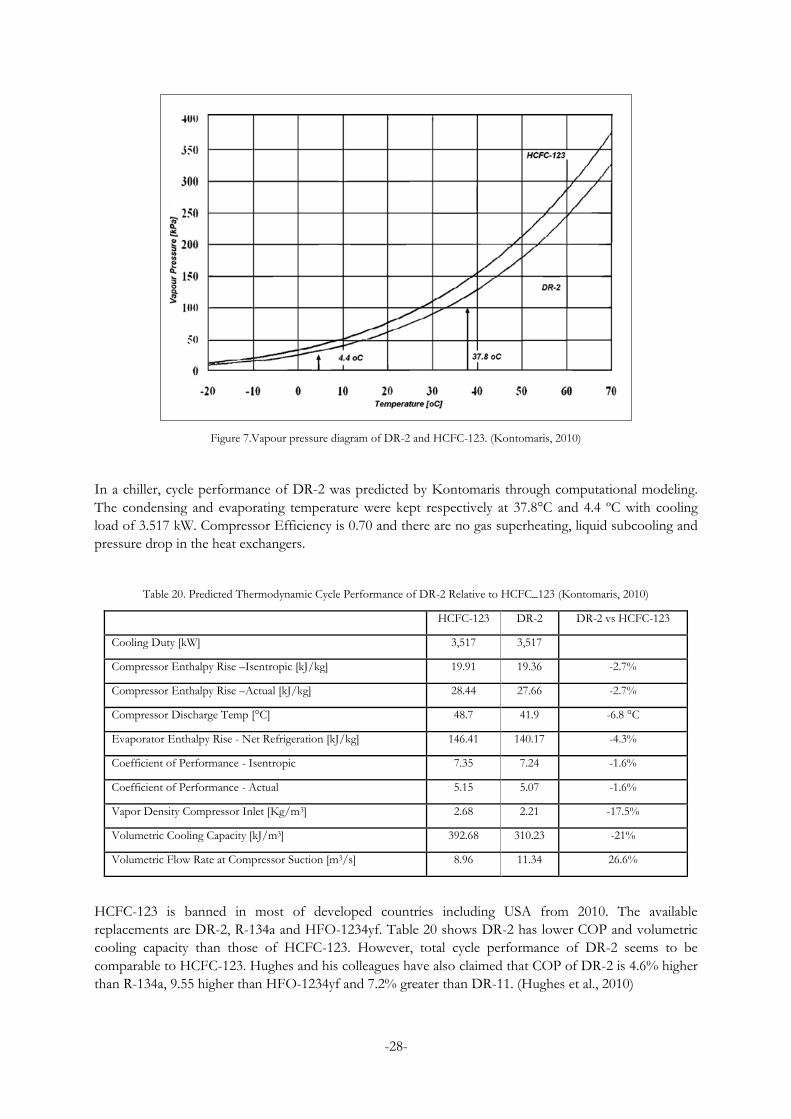
Figure 7 illustrate the vapor pressure curves of DR-2 and HCFC-123. As can be seen DR-2 has slightly
lower pressures than HCFC-123 in working temperatures range of 4.4-37.8 ºC. (Kontomaris, 2010)
-28-
Figure 7.Vapour pressure diagram of DR-2 and HCFC-123. (Kontomaris, 2010)
In a chiller, cycle performance of DR-2 was predicted by Kontomaris through computational modeling.
The condensing and evaporating temperature were kept respectively at 37.8°C and 4.4 ºC with cooling
load of 3.517 kW. Compressor Efficiency is 0.70 and there are no gas superheating, liquid subcooling and
pressure drop in the heat exchangers.
Table 20. Predicted Thermodynamic Cycle Performance of DR-2 Relative to HCFC_123 (Kontomaris, 2010)
HCFC-123 DR-2 DR-2 vs HCFC-123
Cooling Duty [kW] 3,517 3,517
Compressor Enthalpy Rise –Isentropic [kJ/kg] 19.91 19.36 -2.7%
Compressor Enthalpy Rise –Actual [kJ/kg] 28.44 27.66 -2.7%
Compressor Discharge Temp [°C] 48.7 41.9 -6.8 °C
Evaporator Enthalpy Rise - Net Refrigeration [kJ/kg] 146.41 140.17 -4.3%
Coefficient of Performance - Isentropic 7.35 7.24 -1.6%
Coefficient of Performance - Actual 5.15 5.07 -1.6%
Vapor Density Compressor Inlet [Kg/m3] 2.68 2.21 -17.5%
Volumetric Cooling Capacity [kJ/m3] 392.68 310.23 -21%
Volumetric Flow Rate at Compressor Suction [m3/s] 8.96 11.34 26.6%
HCFC-123 is banned in most of developed countries including USA from 2010. The available
replacements are DR-2, R-134a and HFO-1234yf. Table 20 shows DR-2 has lower COP and volumetric
cooling capacity than those of HCFC-123. However, total cycle performance of DR-2 seems to be
comparable to HCFC-123. Hughes and his colleagues have also claimed that COP of DR-2 is 4.6% higher
than R-134a, 9.55 higher than HFO-1234yf and 7.2% greater than DR-11. (Hughes et al., 2010)
-29-
Its lower vapor pressure and higher energy efficiency relative to R-134a, in company with desirable
environmental and safety characteristics make it a promising option in the near future in refrigeration
industry. (Kontomaris, 2010)
4.4 Summary of the candidates refrigerants
Ecological concerns resulted by HFCs refrigerants have led to many international studies to decrease the harmful environmental impacts of exiting refrigerants. Researchers and companies are working towards developing new materials with less environmental effects. The refrigeration industry work hard to meet the requirements for the new environmental regulations. There are refrigerants which have low GWP and acceptable potential to substitute the common refrigerants. Natural refrigerants such as: carbon dioxide, ammonia and hydrocarbons, new refrigerants like HFO-1234yf and HFO-1234ze and blends of new refrigerants like DR-2 and DR-11 are candidates in this filed.
Flammability is the matter of discussion on new refrigerants. Thus more studies are being done to develop new blends so that they can overcome this problem as well.
5 Cycle performance calculations
This study continued by theoretical calculation of cycle performance of two new refrigerants R1234yf and
R1234ze. Moreover, an experiment has been done in a vapor compression cycle test rig to compare the
experimental cycle performance of R1234yf as the new refrigerant and R134a as the common one. To
accomplish these, we have to use thermodynamic laws.
5.1 Fundamental concepts of the vapor compression cycle
Equation 1 expresses the heat balance over a vapor compression system. Q1 is rejected heat from the cycle
at higher temperature and Q2 is the extracted heat at the lower temperature and E is the required work to
lift the heat Q2 from lower temperature to higher temperature. According to the first law of
thermodynamic, the cycle work, transferred and rejected heat to the cycle are parameters that can be
calculated by heat balance of the system.
The ratio of the refrigerating capacity to the power input to the compressor called coefficient of
performance of the refrigeration cycle, COP, is one of the parameters in analyzing cycle performance.
For a Carnot cycle the coefficient of performance for refrigeration is,
In which t1 is condensing temperature and t2 is evaporating temperature in Kelvin. The isentropic Carnot
efficiency also is,
In which
5.2 Evaporator Energy balance
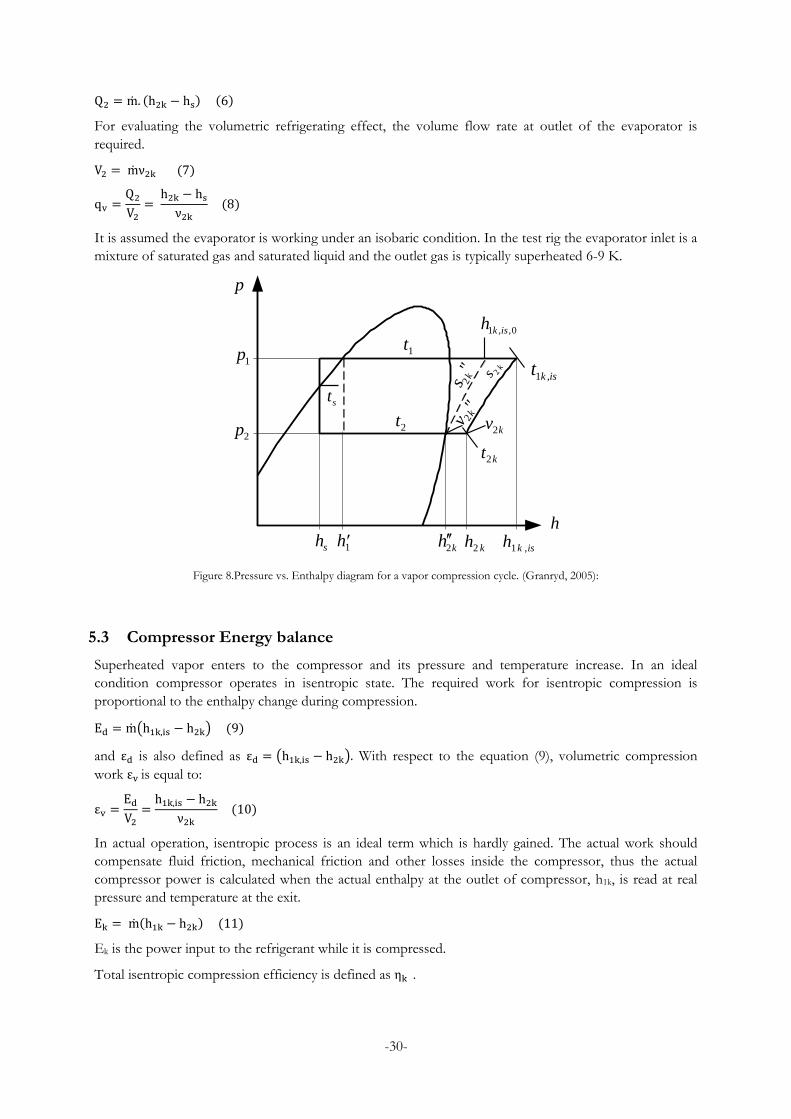
Figure 8 shows the enthalpy-pressure diagram for a vapor compression cycle. Refrigeration effect and
capacity of the cycle will be gained by heat balance over the evaporator. The refrigeration capacity is
calculated by the enthalpy difference over the refrigerant side of the evaporator.
-30-
For evaluating the volumetric refrigerating effect, the volume flow rate at outlet of the evaporator is
required.
It is assumed the evaporator is working under an isobaric condition. In the test rig the evaporator inlet is a
mixture of saturated gas and saturated liquid and the outlet gas is typically superheated 6-9 K.
Figure 8.Pressure vs. Enthalpy diagram for a vapor compression cycle. (Granryd, 2005):
5.3 Compressor Energy balance
Superheated vapor enters to the compressor and its pressure and temperature increase. In an ideal
condition compressor operates in isentropic state. The required work for isentropic compression is
proportional to the enthalpy change during compression.
( )
and is also defined as ( ) With respect to the equation (9), volumetric compression
work is equal to:
In actual operation, isentropic process is an ideal term which is hardly gained. The actual work should
compensate fluid friction, mechanical friction and other losses inside the compressor, thus the actual
compressor power is calculated when the actual enthalpy at the outlet of compressor, h1k, is read at real
pressure and temperature at the exit.
Ek is the power input to the refrigerant while it is compressed.
Total isentropic compression efficiency is defined as .
h1 kh2
iskh ,1h k2
h
s"
k2
v"
k2
0,,1 iskh
t k2
kv2
p
p1
p2
t2
t1
st
hs
sk
2 iskt ,1
-31-
For a positive displacement compressor the volume flow rate at the inlet is always smaller than the
theoretical swept volume flow. Swept flow, Vs, can be defined as the possible inlet vapor volume flow to
the compressor. Volumetric efficiency is used to explain this,
5.4 Condenser Energy balance
Hot high pressure gas enters to the condenser and is changed to the liquid in an isobaric condition. The
amount of rejected heat is calculated by enthalpy rate changes in refrigerant side of the condenser.
The refrigerant at exit of the condenser is about typically 4-8 K subcooled.
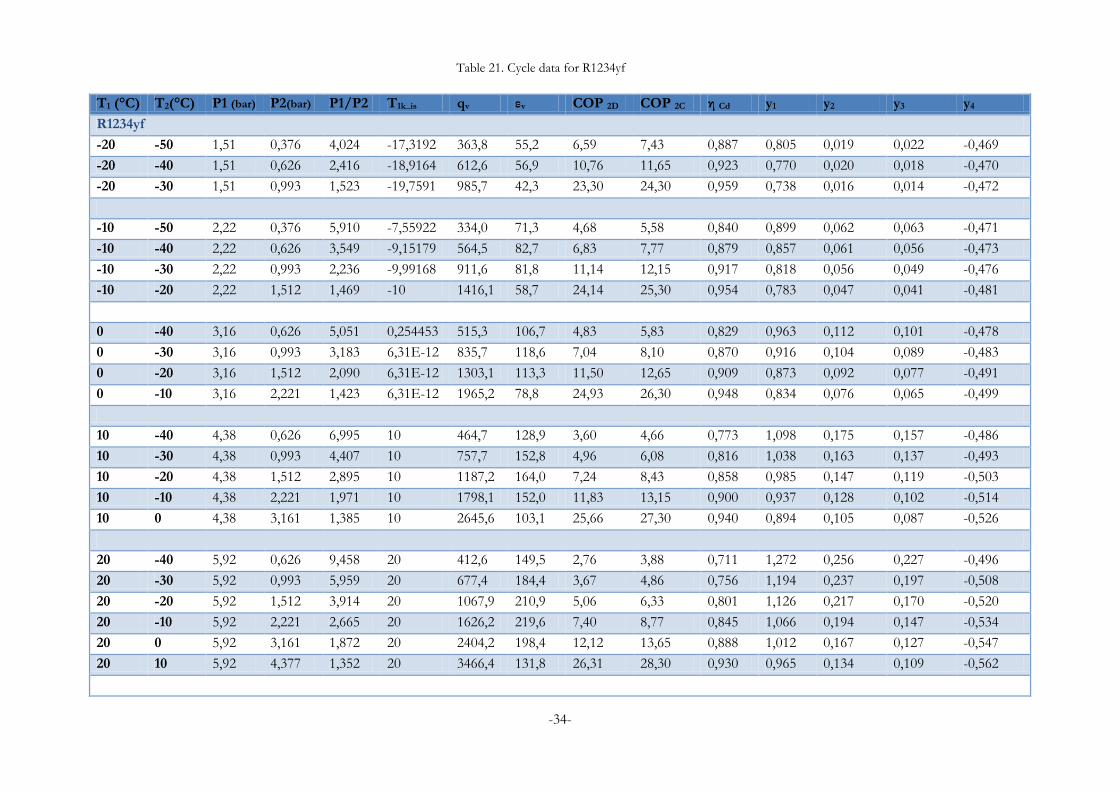
6 Basic cycle data
Basic cycle data for the new refrigerants R1234yf and R1234ze have been calculated by means of RefProp
7.01 for the cycle shown by its P-h diagram in figure 8. Different characteristics of basic vapor
compression cycles such as volumetric cooling capacity, isentropic compression work, COP and cycle
Carnot efficiency have been evaluated for systems with no liquid sub cooling or gas superheating at
various condensing and evaporating temperatures.
Influence of superheating and subcooling of the working fluid on the calculated COP and volumetric
cooling capacity can be determined by y-factors. The y-factors illustrate the relative change of COP and
cooling capacity per degree of superheating and subcooling compared to the basic cycle data with no
superheating and subcooling of the refrigerant. They can be defined as follows (Granryd, 2005):
y1 indicates relative change in COP2d and volumetric cooling capacity due to liquid sub cooling formed at
condenser :
sk
s2k )(tthh
hhy
112
1100
1 (15)
In which ts is temperature of the refrigerant when it goes out from the condenser and is the corresponding
enthalpy at this point. Furthermore, is enthalpy of saturated gas at evaporating temperature and
is
enthalpy of saturated liquid at condensing temperature. Increasing the subcooling of refrigerant in the
condenser influences the refrigerating effect. As figure 8 shows, when the amount of subcooling increases,
enthalpy of refrigerant at condenser outlet ( ) decreases. Consequently refrigerating effect which is
proportional to , increases. This growth in refrigerating effect doesn’t affect compression work.
However, increasing the refrigerating effect leads to increase COP2d of the cycle as well.
y2 illustrates relative change in volumetric cooling capacity caused by internal gas superheating, formed at
evaporator:
21
12
1001
tthh
v
v
hhy
2k2k
2k
2k
2k )( (16)
In which is enthalpy of refrigerant when it goes out from the evaporator, is specific volume of
saturated liquid at evaporating temperature and is the specific volume at the evaporator outlet and
.is temperature of the refrigerant at evaporator outlet. Increasing the superheating of the refrigerant at
-32-
evaporator actually enhances the value of , so which is proportional to refrigerating effect
increases. However, specific volume develops from to . Thus y2 can be negative or positive.
Moreover y3 evaluates effect of internal superheating in COP2d:
21
13
1001
tthh
hh
hh
hhy
2k2k
2kis,01k,
2kis1k,
2k )( (17)
is the enthalpy at compressor outlet for an isentropic compression and .is the enthalpy at
compressor outlet for an isentropic compression and no superheating in the evaporator. Increasing
internal superheating enhances both refrigerating effect and compression work. Since the volumetric
compression work can be defined as
, so increase in volumetric compression work is about
y2-y3.
y4 indicates relative change in COP2d caused by external gas superheating (due to outside refrigerated
space impacts) :
2
4100
1tthh
hhy
2k2kis1k,
2kis,01k,)(
(18)
y4 is always negative and it has small value. Since the volumetric refrigeration effect can be rewritten as
, the increase in qv compared to the basic cycle can be obtained by y2-y3+y4.
Tables 21 and 22 demonstrate the basic cycle data for R1234yf and R1234ze. Evaluation of the tables
indicate that R1234ze has higher pressure ratio and lower compressor discharge temperature than those of
R134a and also its COP and isentropic Carnot efficiency are less in many points. Higher pressure ratio
means higher compressing energy consumption which leads to decrease in the COP of the system.
R1234yf has lower pressure ratio and discharge pressure than R134a but it has lower COP and isentropic
Carnot efficiency. From table 20 and 21 it can be concluded that systems working with R1234ze as
refrigerant need larger compressors for a given cooling capacity to be obtained. On the other hand lower
condensing energy is produced by using R1234yz in the systems with the same condensing and
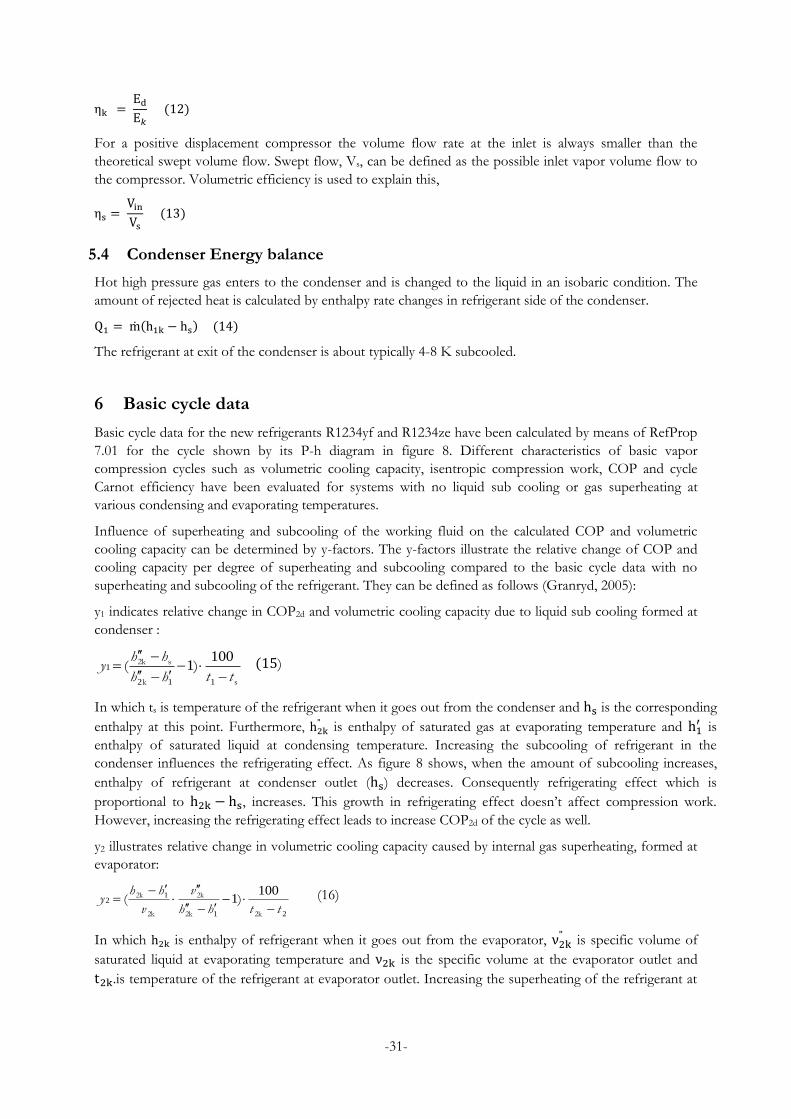
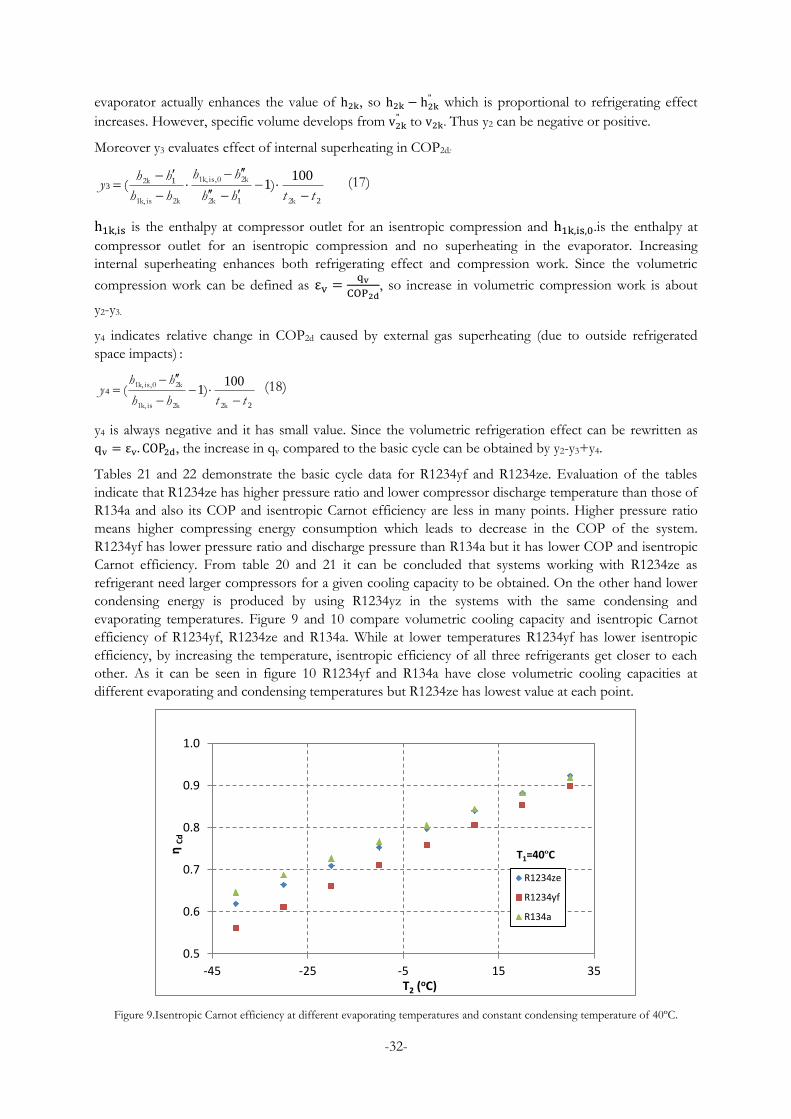
evaporating temperatures. Figure 9 and 10 compare volumetric cooling capacity and isentropic Carnot
efficiency of R1234yf, R1234ze and R134a. While at lower temperatures R1234yf has lower isentropic
efficiency, by increasing the temperature, isentropic efficiency of all three refrigerants get closer to each
other. As it can be seen in figure 10 R1234yf and R134a have close volumetric cooling capacities at
different evaporating and condensing temperatures but R1234ze has lowest value at each point.
Figure 9.Isentropic Carnot efficiency at different evaporating temperatures and constant condensing temperature of 40ºC.
0.5
0.6
0.7
0.8
0.9
1.0
-45 -25 -5 15 35
ƞ C
d
T2 (oC)
T1=40ºC
R1234ze
R1234yf
R134a
-33-
Figure 10.Volumetric cooling capacity at different evaporating temperatures and constant condensing temperature of 10ºC.
0
500
1000
1500
2000
2500
3000
-45 -35 -25 -15 -5 5
qv
(kJ
/m3 )
T2 (oC)
T1=10ºC
R1234 ze
R1234yf
R134a
-34-
T1 (°C) T2(°C) P1 (bar) P2(bar) P1/P2 T1k_is qv εv COP 2D COP 2C η Cd y1 y2 y3 y4
R1234yf
-20 -50 1,51 0,376 4,024 -17,3192 363,8 55,2 6,59 7,43 0,887 0,805 0,019 0,022 -0,469
-20 -40 1,51 0,626 2,416 -18,9164 612,6 56,9 10,76 11,65 0,923 0,770 0,020 0,018 -0,470
-20 -30 1,51 0,993 1,523 -19,7591 985,7 42,3 23,30 24,30 0,959 0,738 0,016 0,014 -0,472
-10 -50 2,22 0,376 5,910 -7,55922 334,0 71,3 4,68 5,58 0,840 0,899 0,062 0,063 -0,471
-10 -40 2,22 0,626 3,549 -9,15179 564,5 82,7 6,83 7,77 0,879 0,857 0,061 0,056 -0,473
-10 -30 2,22 0,993 2,236 -9,99168 911,6 81,8 11,14 12,15 0,917 0,818 0,056 0,049 -0,476
-10 -20 2,22 1,512 1,469 -10 1416,1 58,7 24,14 25,30 0,954 0,783 0,047 0,041 -0,481
0 -40 3,16 0,626 5,051 0,254453 515,3 106,7 4,83 5,83 0,829 0,963 0,112 0,101 -0,478
0 -30 3,16 0,993 3,183 6,31E-12 835,7 118,6 7,04 8,10 0,870 0,916 0,104 0,089 -0,483
0 -20 3,16 1,512 2,090 6,31E-12 1303,1 113,3 11,50 12,65 0,909 0,873 0,092 0,077 -0,491
0 -10 3,16 2,221 1,423 6,31E-12 1965,2 78,8 24,93 26,30 0,948 0,834 0,076 0,065 -0,499
10 -40 4,38 0,626 6,995 10 464,7 128,9 3,60 4,66 0,773 1,098 0,175 0,157 -0,486
10 -30 4,38 0,993 4,407 10 757,7 152,8 4,96 6,08 0,816 1,038 0,163 0,137 -0,493
10 -20 4,38 1,512 2,895 10 1187,2 164,0 7,24 8,43 0,858 0,985 0,147 0,119 -0,503
10 -10 4,38 2,221 1,971 10 1798,1 152,0 11,83 13,15 0,900 0,937 0,128 0,102 -0,514
10 0 4,38 3,161 1,385 10 2645,6 103,1 25,66 27,30 0,940 0,894 0,105 0,087 -0,526
20 -40 5,92 0,626 9,458 20 412,6 149,5 2,76 3,88 0,711 1,272 0,256 0,227 -0,496
20 -30 5,92 0,993 5,959 20 677,4 184,4 3,67 4,86 0,756 1,194 0,237 0,197 -0,508
20 -20 5,92 1,512 3,914 20 1067,9 210,9 5,06 6,33 0,801 1,126 0,217 0,170 -0,520
20 -10 5,92 2,221 2,665 20 1626,2 219,6 7,40 8,77 0,845 1,066 0,194 0,147 -0,534
20 0 5,92 3,161 1,872 20 2404,2 198,4 12,12 13,65 0,888 1,012 0,167 0,127 -0,547
20 10 5,92 4,377 1,352 20 3466,4 131,8 26,31 28,30 0,930 0,965 0,134 0,109 -0,562
Table 21. Cycle data for R1234yf
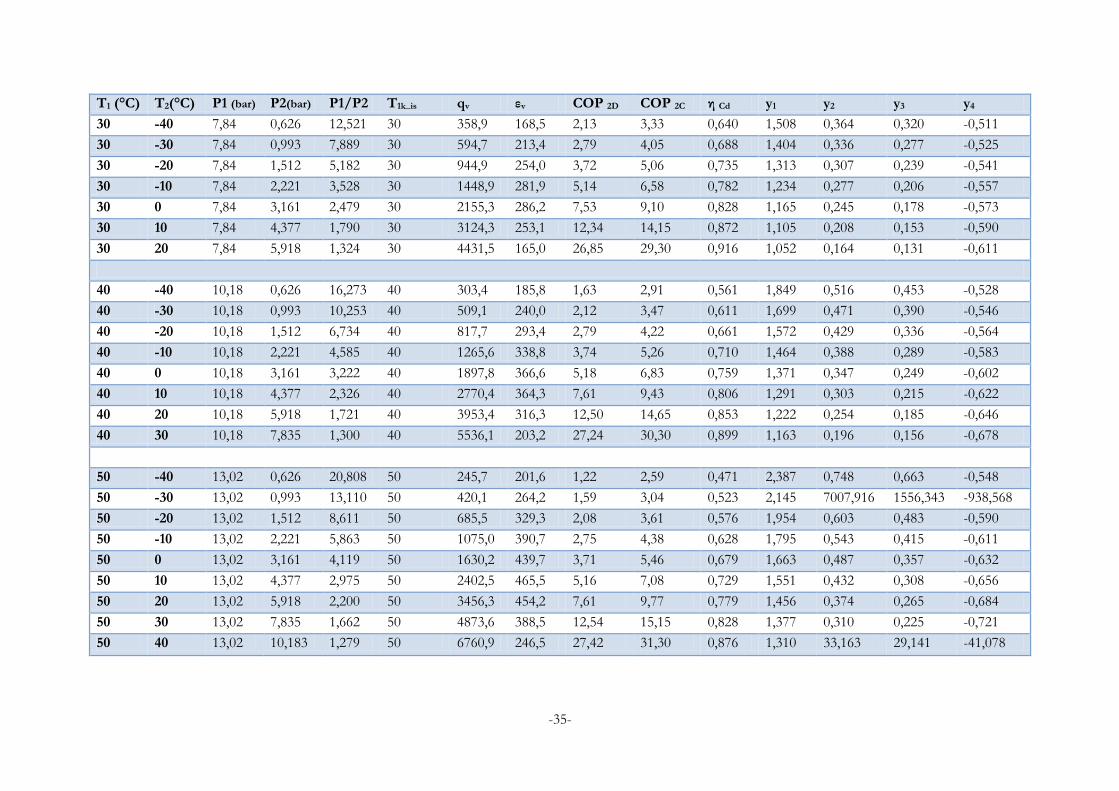
-35-
T1 (°C) T2(°C) P1 (bar) P2(bar) P1/P2 T1k_is qv εv COP 2D COP 2C η Cd y1 y2 y3 y4
30 -40 7,84 0,626 12,521 30 358,9 168,5 2,13 3,33 0,640 1,508 0,364 0,320 -0,511
30 -30 7,84 0,993 7,889 30 594,7 213,4 2,79 4,05 0,688 1,404 0,336 0,277 -0,525
30 -20 7,84 1,512 5,182 30 944,9 254,0 3,72 5,06 0,735 1,313 0,307 0,239 -0,541
30 -10 7,84 2,221 3,528 30 1448,9 281,9 5,14 6,58 0,782 1,234 0,277 0,206 -0,557
30 0 7,84 3,161 2,479 30 2155,3 286,2 7,53 9,10 0,828 1,165 0,245 0,178 -0,573
30 10 7,84 4,377 1,790 30 3124,3 253,1 12,34 14,15 0,872 1,105 0,208 0,153 -0,590
30 20 7,84 5,918 1,324 30 4431,5 165,0 26,85 29,30 0,916 1,052 0,164 0,131 -0,611
40 -40 10,18 0,626 16,273 40 303,4 185,8 1,63 2,91 0,561 1,849 0,516 0,453 -0,528
40 -30 10,18 0,993 10,253 40 509,1 240,0 2,12 3,47 0,611 1,699 0,471 0,390 -0,546
40 -20 10,18 1,512 6,734 40 817,7 293,4 2,79 4,22 0,661 1,572 0,429 0,336 -0,564
40 -10 10,18 2,221 4,585 40 1265,6 338,8 3,74 5,26 0,710 1,464 0,388 0,289 -0,583
40 0 10,18 3,161 3,222 40 1897,8 366,6 5,18 6,83 0,759 1,371 0,347 0,249 -0,602
40 10 10,18 4,377 2,326 40 2770,4 364,3 7,61 9,43 0,806 1,291 0,303 0,215 -0,622
40 20 10,18 5,918 1,721 40 3953,4 316,3 12,50 14,65 0,853 1,222 0,254 0,185 -0,646
40 30 10,18 7,835 1,300 40 5536,1 203,2 27,24 30,30 0,899 1,163 0,196 0,156 -0,678
50 -40 13,02 0,626 20,808 50 245,7 201,6 1,22 2,59 0,471 2,387 0,748 0,663 -0,548
50 -30 13,02 0,993 13,110 50 420,1 264,2 1,59 3,04 0,523 2,145 7007,916 1556,343 -938,568
50 -20 13,02 1,512 8,611 50 685,5 329,3 2,08 3,61 0,576 1,954 0,603 0,483 -0,590
50 -10 13,02 2,221 5,863 50 1075,0 390,7 2,75 4,38 0,628 1,795 0,543 0,415 -0,611
50 0 13,02 3,161 4,119 50 1630,2 439,7 3,71 5,46 0,679 1,663 0,487 0,357 -0,632
50 10 13,02 4,377 2,975 50 2402,5 465,5 5,16 7,08 0,729 1,551 0,432 0,308 -0,656
50 20 13,02 5,918 2,200 50 3456,3 454,2 7,61 9,77 0,779 1,456 0,374 0,265 -0,684
50 30 13,02 7,835 1,662 50 4873,6 388,5 12,54 15,15 0,828 1,377 0,310 0,225 -0,721
50 40 13,02 10,183 1,279 50 6760,9 246,5 27,42 31,30 0,876 1,310 33,163 29,141 -41,078
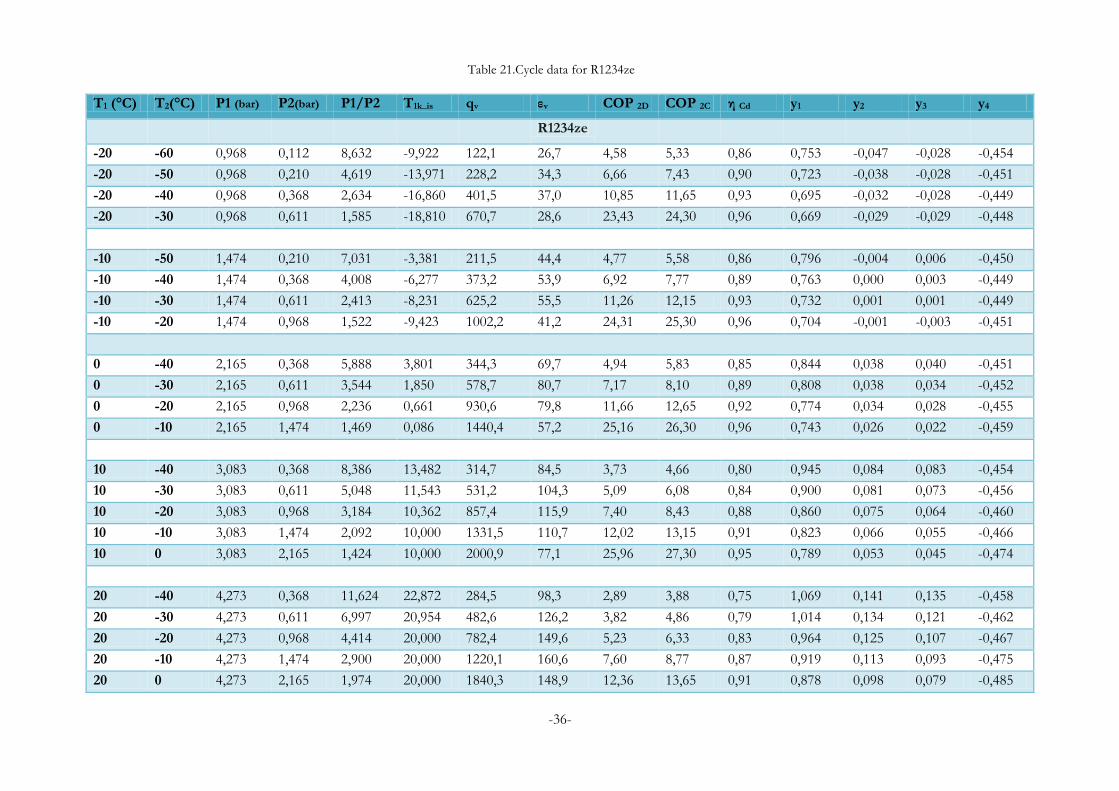
-36-
T1 (°C) T2(°C) P1 (bar) P2(bar) P1/P2 T1k_is qv εv COP 2D COP 2C η Cd y1 y2 y3 y4
R1234ze
-20 -60 0,968 0,112 8,632 -9,922 122,1 26,7 4,58 5,33 0,86 0,753 -0,047 -0,028 -0,454
-20 -50 0,968 0,210 4,619 -13,971 228,2 34,3 6,66 7,43 0,90 0,723 -0,038 -0,028 -0,451
-20 -40 0,968 0,368 2,634 -16,860 401,5 37,0 10,85 11,65 0,93 0,695 -0,032 -0,028 -0,449
-20 -30 0,968 0,611 1,585 -18,810 670,7 28,6 23,43 24,30 0,96 0,669 -0,029 -0,029 -0,448
-10 -50 1,474 0,210 7,031 -3,381 211,5 44,4 4,77 5,58 0,86 0,796 -0,004 0,006 -0,450
-10 -40 1,474 0,368 4,008 -6,277 373,2 53,9 6,92 7,77 0,89 0,763 0,000 0,003 -0,449
-10 -30 1,474 0,611 2,413 -8,231 625,2 55,5 11,26 12,15 0,93 0,732 0,001 0,001 -0,449
-10 -20 1,474 0,968 1,522 -9,423 1002,2 41,2 24,31 25,30 0,96 0,704 -0,001 -0,003 -0,451
0 -40 2,165 0,368 5,888 3,801 344,3 69,7 4,94 5,83 0,85 0,844 0,038 0,040 -0,451
0 -30 2,165 0,611 3,544 1,850 578,7 80,7 7,17 8,10 0,89 0,808 0,038 0,034 -0,452
0 -20 2,165 0,968 2,236 0,661 930,6 79,8 11,66 12,65 0,92 0,774 0,034 0,028 -0,455
0 -10 2,165 1,474 1,469 0,086 1440,4 57,2 25,16 26,30 0,96 0,743 0,026 0,022 -0,459
10 -40 3,083 0,368 8,386 13,482 314,7 84,5 3,73 4,66 0,80 0,945 0,084 0,083 -0,454
10 -30 3,083 0,611 5,048 11,543 531,2 104,3 5,09 6,08 0,84 0,900 0,081 0,073 -0,456
10 -20 3,083 0,968 3,184 10,362 857,4 115,9 7,40 8,43 0,88 0,860 0,075 0,064 -0,460
10 -10 3,083 1,474 2,092 10,000 1331,5 110,7 12,02 13,15 0,91 0,823 0,066 0,055 -0,466
10 0 3,083 2,165 1,424 10,000 2000,9 77,1 25,96 27,30 0,95 0,789 0,053 0,045 -0,474
20 -40 4,273 0,368 11,624 22,872 284,5 98,3 2,89 3,88 0,75 1,069 0,141 0,135 -0,458
20 -30 4,273 0,611 6,997 20,954 482,6 126,2 3,82 4,86 0,79 1,014 0,134 0,121 -0,462
20 -20 4,273 0,968 4,414 20,000 782,4 149,6 5,23 6,33 0,83 0,964 0,125 0,107 -0,467
20 -10 4,273 1,474 2,900 20,000 1220,1 160,6 7,60 8,77 0,87 0,919 0,113 0,093 -0,475
20 0 4,273 2,165 1,974 20,000 1840,3 148,9 12,36 13,65 0,91 0,878 0,098 0,079 -0,485
Table 21.Cycle data for R1234ze
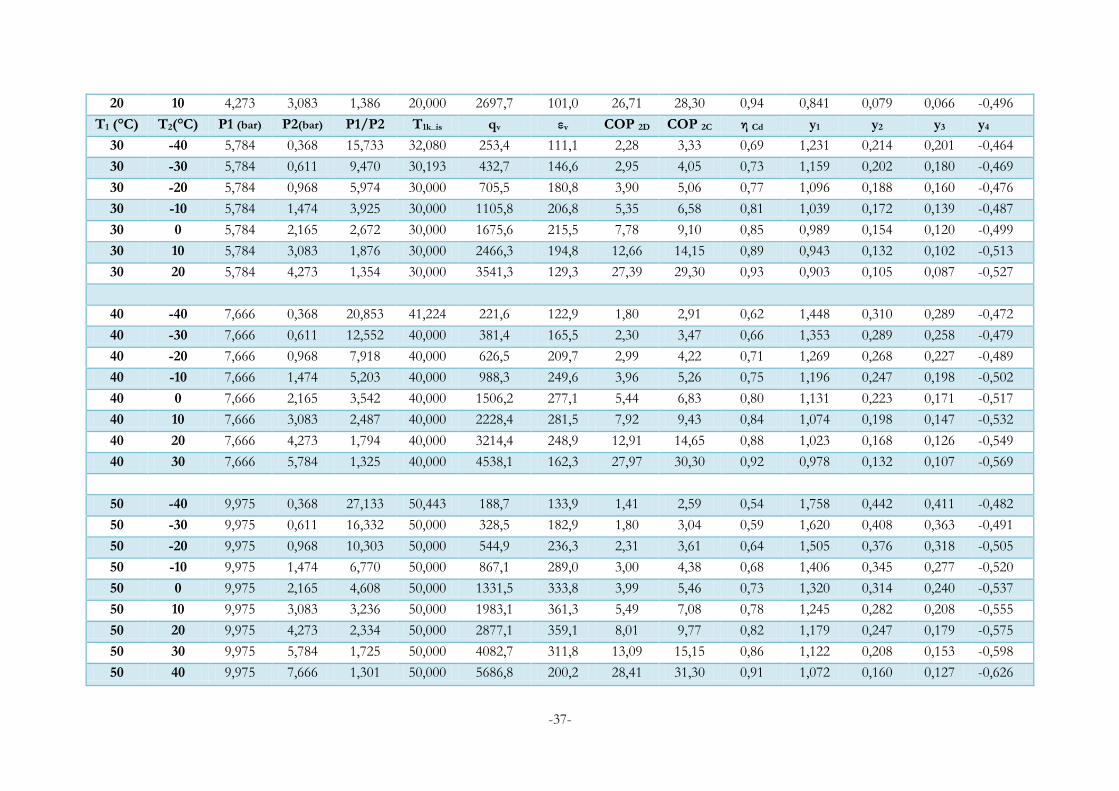
-37-
20 10 4,273 3,083 1,386 20,000 2697,7 101,0 26,71 28,30 0,94 0,841 0,079 0,066 -0,496
T1 (°C) T2(°C) P1 (bar) P2(bar) P1/P2 T1k_is qv εv COP 2D COP 2C η Cd y1 y2 y3 y4
30 -40 5,784 0,368 15,733 32,080 253,4 111,1 2,28 3,33 0,69 1,231 0,214 0,201 -0,464
30 -30 5,784 0,611 9,470 30,193 432,7 146,6 2,95 4,05 0,73 1,159 0,202 0,180 -0,469
30 -20 5,784 0,968 5,974 30,000 705,5 180,8 3,90 5,06 0,77 1,096 0,188 0,160 -0,476
30 -10 5,784 1,474 3,925 30,000 1105,8 206,8 5,35 6,58 0,81 1,039 0,172 0,139 -0,487
30 0 5,784 2,165 2,672 30,000 1675,6 215,5 7,78 9,10 0,85 0,989 0,154 0,120 -0,499
30 10 5,784 3,083 1,876 30,000 2466,3 194,8 12,66 14,15 0,89 0,943 0,132 0,102 -0,513
30 20 5,784 4,273 1,354 30,000 3541,3 129,3 27,39 29,30 0,93 0,903 0,105 0,087 -0,527
40 -40 7,666 0,368 20,853 41,224 221,6 122,9 1,80 2,91 0,62 1,448 0,310 0,289 -0,472
40 -30 7,666 0,611 12,552 40,000 381,4 165,5 2,30 3,47 0,66 1,353 0,289 0,258 -0,479
40 -20 7,666 0,968 7,918 40,000 626,5 209,7 2,99 4,22 0,71 1,269 0,268 0,227 -0,489
40 -10 7,666 1,474 5,203 40,000 988,3 249,6 3,96 5,26 0,75 1,196 0,247 0,198 -0,502
40 0 7,666 2,165 3,542 40,000 1506,2 277,1 5,44 6,83 0,80 1,131 0,223 0,171 -0,517
40 10 7,666 3,083 2,487 40,000 2228,4 281,5 7,92 9,43 0,84 1,074 0,198 0,147 -0,532
40 20 7,666 4,273 1,794 40,000 3214,4 248,9 12,91 14,65 0,88 1,023 0,168 0,126 -0,549
40 30 7,666 5,784 1,325 40,000 4538,1 162,3 27,97 30,30 0,92 0,978 0,132 0,107 -0,569
50 -40 9,975 0,368 27,133 50,443 188,7 133,9 1,41 2,59 0,54 1,758 0,442 0,411 -0,482
50 -30 9,975 0,611 16,332 50,000 328,5 182,9 1,80 3,04 0,59 1,620 0,408 0,363 -0,491
50 -20 9,975 0,968 10,303 50,000 544,9 236,3 2,31 3,61 0,64 1,505 0,376 0,318 -0,505
50 -10 9,975 1,474 6,770 50,000 867,1 289,0 3,00 4,38 0,68 1,406 0,345 0,277 -0,520
50 0 9,975 2,165 4,608 50,000 1331,5 333,8 3,99 5,46 0,73 1,320 0,314 0,240 -0,537
50 10 9,975 3,083 3,236 50,000 1983,1 361,3 5,49 7,08 0,78 1,245 0,282 0,208 -0,555
50 20 9,975 4,273 2,334 50,000 2877,1 359,1 8,01 9,77 0,82 1,179 0,247 0,179 -0,575
50 30 9,975 5,784 1,725 50,000 4082,7 311,8 13,09 15,15 0,86 1,122 0,208 0,153 -0,598
50 40 9,975 7,666 1,301 50,000 5686,8 200,2 28,41 31,30 0,91 1,072 0,160 0,127 -0,626
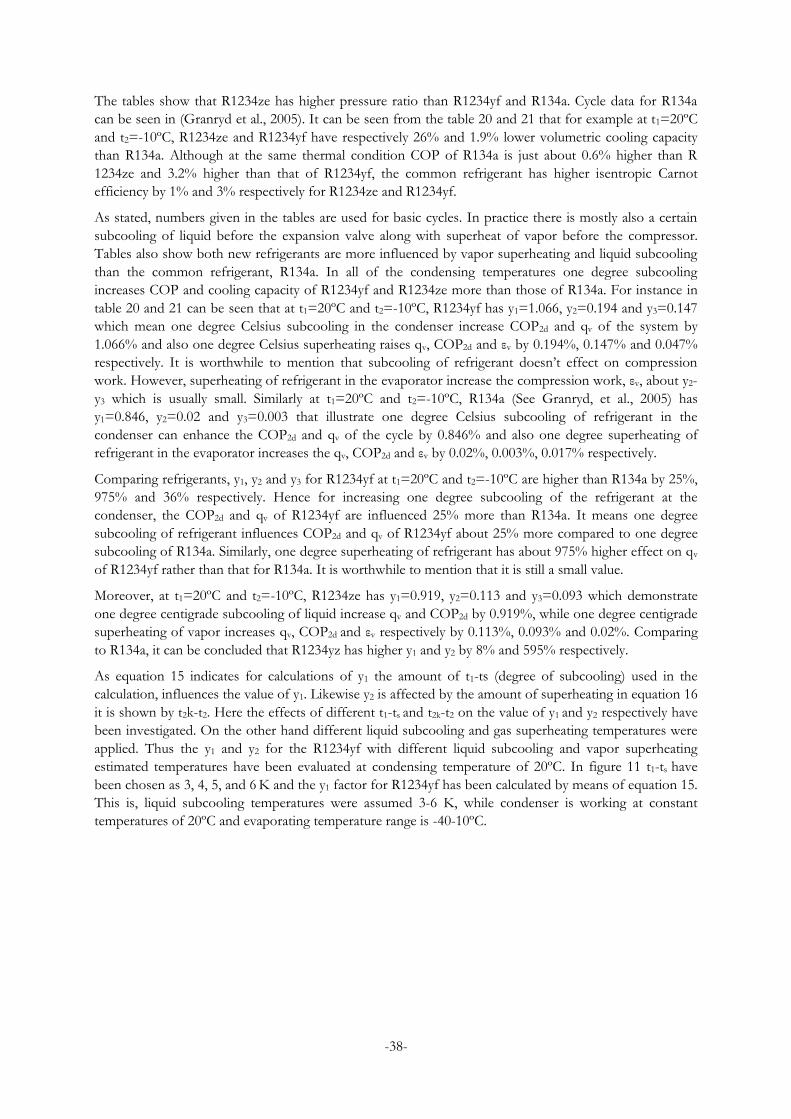
-38-
The tables show that R1234ze has higher pressure ratio than R1234yf and R134a. Cycle data for R134a
can be seen in (Granryd et al., 2005). It can be seen from the table 20 and 21 that for example at t1=20ºC
and t2=-10ºC, R1234ze and R1234yf have respectively 26% and 1.9% lower volumetric cooling capacity
than R134a. Although at the same thermal condition COP of R134a is just about 0.6% higher than R
1234ze and 3.2% higher than that of R1234yf, the common refrigerant has higher isentropic Carnot
efficiency by 1% and 3% respectively for R1234ze and R1234yf.
As stated, numbers given in the tables are used for basic cycles. In practice there is mostly also a certain
subcooling of liquid before the expansion valve along with superheat of vapor before the compressor.
Tables also show both new refrigerants are more influenced by vapor superheating and liquid subcooling
than the common refrigerant, R134a. In all of the condensing temperatures one degree subcooling
increases COP and cooling capacity of R1234yf and R1234ze more than those of R134a. For instance in
table 20 and 21 can be seen that at t1=20ºC and t2=-10ºC, R1234yf has y1=1.066, y2=0.194 and y3=0.147
which mean one degree Celsius subcooling in the condenser increase COP2d and qv of the system by
1.066% and also one degree Celsius superheating raises qv, COP2d and εv by 0.194%, 0.147% and 0.047%
respectively. It is worthwhile to mention that subcooling of refrigerant doesn’t effect on compression
work. However, superheating of refrigerant in the evaporator increase the compression work, εv, about y2-
y3 which is usually small. Similarly at t1=20ºC and t2=-10ºC, R134a (See Granryd, et al., 2005) has
y1=0.846, y2=0.02 and y3=0.003 that illustrate one degree Celsius subcooling of refrigerant in the
condenser can enhance the COP2d and qv of the cycle by 0.846% and also one degree superheating of
refrigerant in the evaporator increases the qv, COP2d and εv by 0.02%, 0.003%, 0.017% respectively.
Comparing refrigerants, y1, y2 and y3 for R1234yf at t1=20ºC and t2=-10ºC are higher than R134a by 25%,
975% and 36% respectively. Hence for increasing one degree subcooling of the refrigerant at the
condenser, the COP2d and qv of R1234yf are influenced 25% more than R134a. It means one degree
subcooling of refrigerant influences COP2d and qv of R1234yf about 25% more compared to one degree
subcooling of R134a. Similarly, one degree superheating of refrigerant has about 975% higher effect on qv
of R1234yf rather than that for R134a. It is worthwhile to mention that it is still a small value.
Moreover, at t1=20ºC and t2=-10ºC, R1234ze has y1=0.919, y2=0.113 and y3=0.093 which demonstrate
one degree centigrade subcooling of liquid increase qv and COP2d by 0.919%, while one degree centigrade
superheating of vapor increases qv, COP2d and εv respectively by 0.113%, 0.093% and 0.02%. Comparing
to R134a, it can be concluded that R1234yz has higher y1 and y2 by 8% and 595% respectively.
As equation 15 indicates for calculations of y1 the amount of t1-ts (degree of subcooling) used in the
calculation, influences the value of y1. Likewise y2 is affected by the amount of superheating in equation 16
it is shown by t2k-t2. Here the effects of different t1-ts and t2k-t2 on the value of y1 and y2 respectively have
been investigated. On the other hand different liquid subcooling and gas superheating temperatures were
applied. Thus the y1 and y2 for the R1234yf with different liquid subcooling and vapor superheating
estimated temperatures have been evaluated at condensing temperature of 20ºC. In figure 11 t1-ts have
been chosen as 3, 4, 5, and 6 K and the y1 factor for R1234yf has been calculated by means of equation 15.
This is, liquid subcooling temperatures were assumed 3-6 K, while condenser is working at constant
temperatures of 20ºC and evaporating temperature range is -40-10ºC.
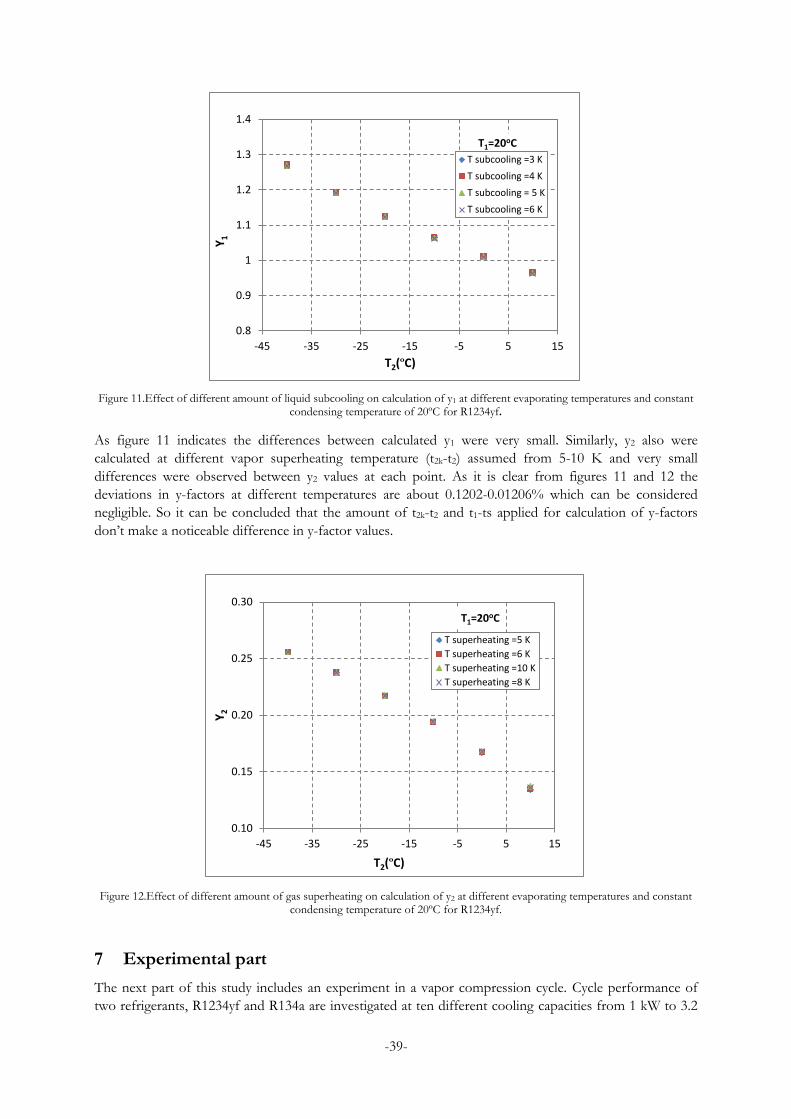
-39-
Figure 11.Effect of different amount of liquid subcooling on calculation of y1 at different evaporating temperatures and constant condensing temperature of 20ºC for R1234yf.
As figure 11 indicates the differences between calculated y1 were very small. Similarly, y2 also were
calculated at different vapor superheating temperature (t2k-t2) assumed from 5-10 K and very small
differences were observed between y2 values at each point. As it is clear from figures 11 and 12 the
deviations in y-factors at different temperatures are about 0.1202-0.01206% which can be considered
negligible. So it can be concluded that the amount of t2k-t2 and t1-ts applied for calculation of y-factors
don’t make a noticeable difference in y-factor values.
Figure 12.Effect of different amount of gas superheating on calculation of y2 at different evaporating temperatures and constant condensing temperature of 20ºC for R1234yf.
7 Experimental part
The next part of this study includes an experiment in a vapor compression cycle. Cycle performance of
two refrigerants, R1234yf and R134a are investigated at ten different cooling capacities from 1 kW to 3.2
0.8
0.9
1
1.1
1.2
1.3
1.4
-45 -35 -25 -15 -5 5 15
Y1
T2(ºC)
T1=20oC
T subcooling =3 K
T subcooling =4 K
T subcooling = 5 K
T subcooling =6 K
0.10
0.15
0.20
0.25
0.30
-45 -35 -25 -15 -5 5 15
Y2
T2(ºC)
T1=20oC
T superheating =5 K
T superheating =6 K
T superheating =10 K
T superheating =8 K
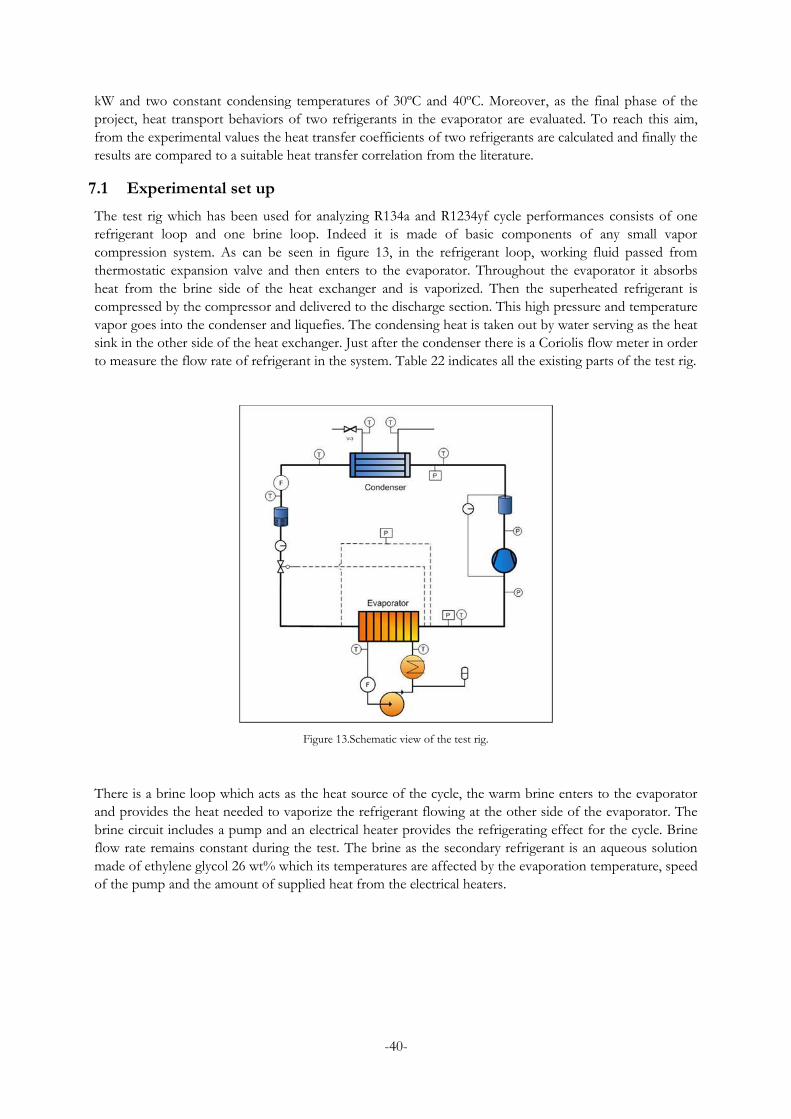
-40-
kW and two constant condensing temperatures of 30ºC and 40ºC. Moreover, as the final phase of the
project, heat transport behaviors of two refrigerants in the evaporator are evaluated. To reach this aim,
from the experimental values the heat transfer coefficients of two refrigerants are calculated and finally the
results are compared to a suitable heat transfer correlation from the literature.
7.1 Experimental set up
The test rig which has been used for analyzing R134a and R1234yf cycle performances consists of one
refrigerant loop and one brine loop. Indeed it is made of basic components of any small vapor
compression system. As can be seen in figure 13, in the refrigerant loop, working fluid passed from
thermostatic expansion valve and then enters to the evaporator. Throughout the evaporator it absorbs
heat from the brine side of the heat exchanger and is vaporized. Then the superheated refrigerant is
compressed by the compressor and delivered to the discharge section. This high pressure and temperature
vapor goes into the condenser and liquefies. The condensing heat is taken out by water serving as the heat
sink in the other side of the heat exchanger. Just after the condenser there is a Coriolis flow meter in order
to measure the flow rate of refrigerant in the system. Table 22 indicates all the existing parts of the test rig.
Figure 13.Schematic view of the test rig.
There is a brine loop which acts as the heat source of the cycle, the warm brine enters to the evaporator
and provides the heat needed to vaporize the refrigerant flowing at the other side of the evaporator. The
brine circuit includes a pump and an electrical heater provides the refrigerating effect for the cycle. Brine
flow rate remains constant during the test. The brine as the secondary refrigerant is an aqueous solution
made of ethylene glycol 26 wt% which its temperatures are affected by the evaporation temperature, speed
of the pump and the amount of supplied heat from the electrical heaters.
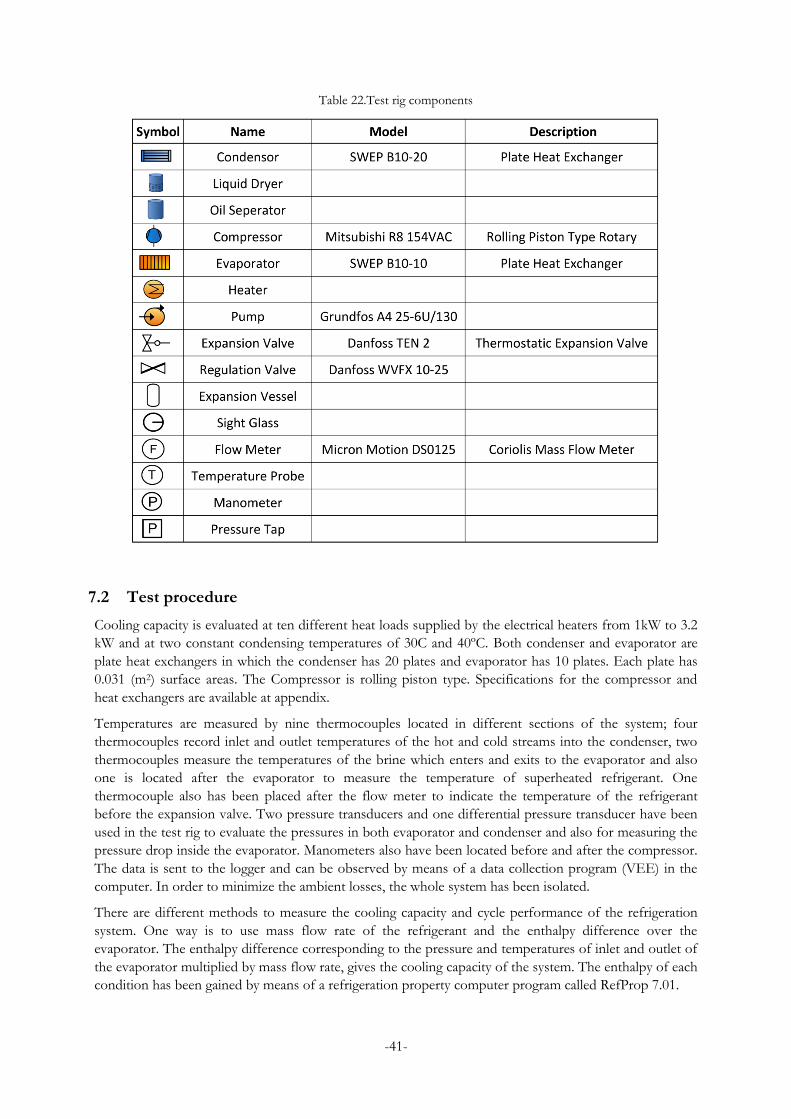
-41-
Table 22.Test rig components
7.2 Test procedure
Cooling capacity is evaluated at ten different heat loads supplied by the electrical heaters from 1kW to 3.2
kW and at two constant condensing temperatures of 30C and 40ºC. Both condenser and evaporator are
plate heat exchangers in which the condenser has 20 plates and evaporator has 10 plates. Each plate has
0.031 (m2) surface areas. The Compressor is rolling piston type. Specifications for the compressor and
heat exchangers are available at appendix.
Temperatures are measured by nine thermocouples located in different sections of the system; four
thermocouples record inlet and outlet temperatures of the hot and cold streams into the condenser, two
thermocouples measure the temperatures of the brine which enters and exits to the evaporator and also
one is located after the evaporator to measure the temperature of superheated refrigerant. One
thermocouple also has been placed after the flow meter to indicate the temperature of the refrigerant
before the expansion valve. Two pressure transducers and one differential pressure transducer have been
used in the test rig to evaluate the pressures in both evaporator and condenser and also for measuring the
pressure drop inside the evaporator. Manometers also have been located before and after the compressor.
The data is sent to the logger and can be observed by means of a data collection program (VEE) in the
computer. In order to minimize the ambient losses, the whole system has been isolated.
There are different methods to measure the cooling capacity and cycle performance of the refrigeration
system. One way is to use mass flow rate of the refrigerant and the enthalpy difference over the
evaporator. The enthalpy difference corresponding to the pressure and temperatures of inlet and outlet of
the evaporator multiplied by mass flow rate, gives the cooling capacity of the system. The enthalpy of each
condition has been gained by means of a refrigeration property computer program called RefProp 7.01.
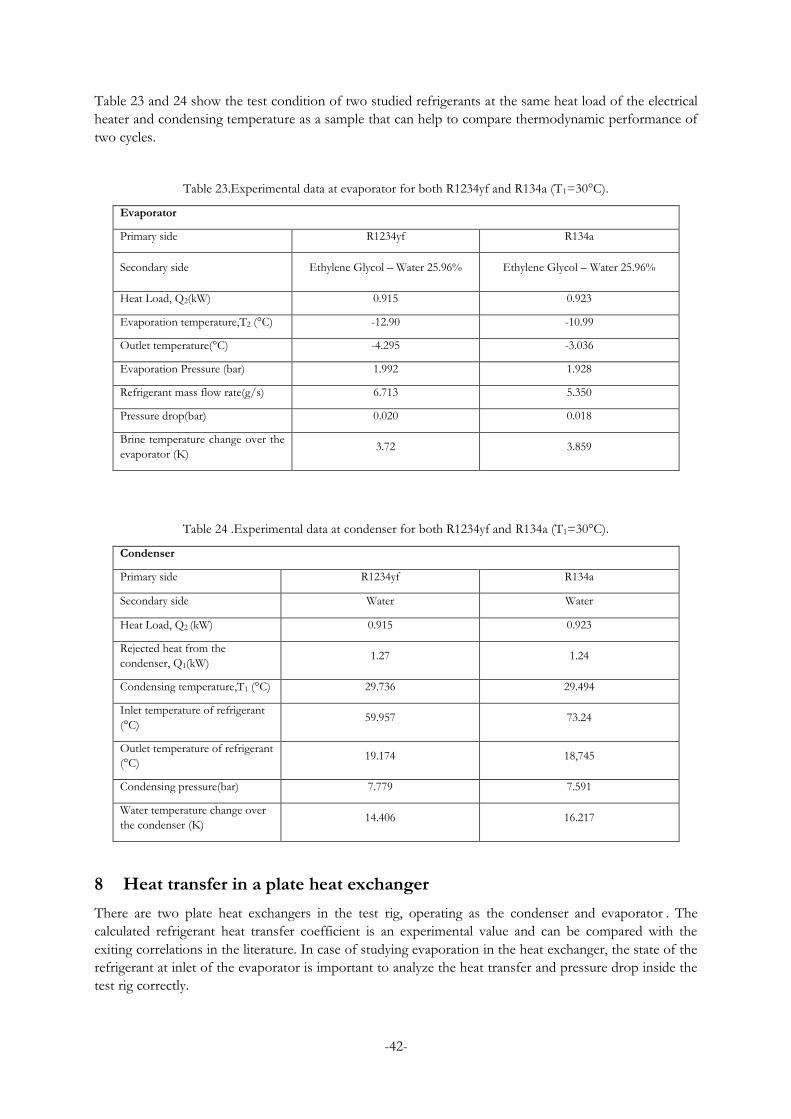
-42-
Table 23 and 24 show the test condition of two studied refrigerants at the same heat load of the electrical
heater and condensing temperature as a sample that can help to compare thermodynamic performance of
two cycles.
Table 23.Experimental data at evaporator for both R1234yf and R134a (T1=30°C).
Evaporator
Primary side R1234yf R134a
Secondary side Ethylene Glycol – Water 25.96% Ethylene Glycol – Water 25.96%
Heat Load, Q2(kW) 0.915 0.923
Evaporation temperature,T2 (°C) -12.90 -10.99
Outlet temperature(°C) -4.295 -3.036
Evaporation Pressure (bar) 1.992 1.928
Refrigerant mass flow rate(g/s) 6.713 5.350
Pressure drop(bar) 0.020 0.018
Brine temperature change over the
evaporator (K) 3.72 3.859
Table 24 .Experimental data at condenser for both R1234yf and R134a (T1=30°C).
Condenser
Primary side R1234yf R134a
Secondary side Water Water
Heat Load, Q2 (kW) 0.915 0.923
Rejected heat from the
condenser, Q1(kW) 1.27 1.24
Condensing temperature,T1 (°C) 29.736 29.494
Inlet temperature of refrigerant
(°C) 59.957 73.24
Outlet temperature of refrigerant
(°C) 19.174 18,745
Condensing pressure(bar) 7.779 7.591
Water temperature change over
the condenser (K) 14.406 16.217
8 Heat transfer in a plate heat exchanger
There are two plate heat exchangers in the test rig, operating as the condenser and evaporator . The
calculated refrigerant heat transfer coefficient is an experimental value and can be compared with the
exiting correlations in the literature. In case of studying evaporation in the heat exchanger, the state of the
refrigerant at inlet of the evaporator is important to analyze the heat transfer and pressure drop inside the
test rig correctly.
-43-
8.1 Single phase flow inside the evaporator
The film heat transfer coefficient in a plate heat exchanger has been considered by many researchers. Most
of them used a modified Dittus-Boelter type of equation with different exponents and constants. In most
of the correlations geometry of plates are specific but some of the correlations like Coulson and
Richardson and Wanniarachchi et al. can be used when geometry of the plates are unknown or limited
information is available. (Ayub, 2003)
8.1.1 Wanniarachchi et al. correlation (1995)
It is a correlation developed by the year 1995 for laminar single phase flow. Chevron angle is necessary for
calculation of the heat transfer and friction factor.
⁄
⁄
{
⁄
In which β is chevron angle, Ф is enlargement factor, f is friction factor, p is a constant related to chevron
angle for calculating friction factor. The Wanniarachchi correlation is highly depended to the geometry of
the plate and is applicable when the plate characteristics are known and Reynolds number is not more
than 104. It is worthwhile to mention that here in the experiment Reynolds number was 120- 600.
8.1.2 Talik et al. correlation
Talik et al. have derived a correlation to predict heat transfer coefficient and friction factor for water
solution in a plate heat exchanger with following characteristics and condition. (Ayub, 2003)
Nu=0.2 Re0.75 Pr0.4, 10 < Re < 720, water/glycol (70 < Pr < 450) (27)
Nu=0.248 Re0.75 Pr0.4 1450 < Re < 11460, water (2.5 < Pr < 5.0)…
f =12.065 Re 10 < Re < 80, water/glycol (29)
f =0.3323 Re 1450 < Re < 11460, water…
º, φ A 2,
de =4.65 mm
Lp =0.946 m, λ=3.61 mm, t =0.61 mm,
w =0.346 m
8.1.3 Coulson and Richardson
A correlation has been presented for turbulent single phase flow at Coulson and Richardson's book in
which heat transfer coefficient and friction factor is gained as below: (Sinnott, 2005)
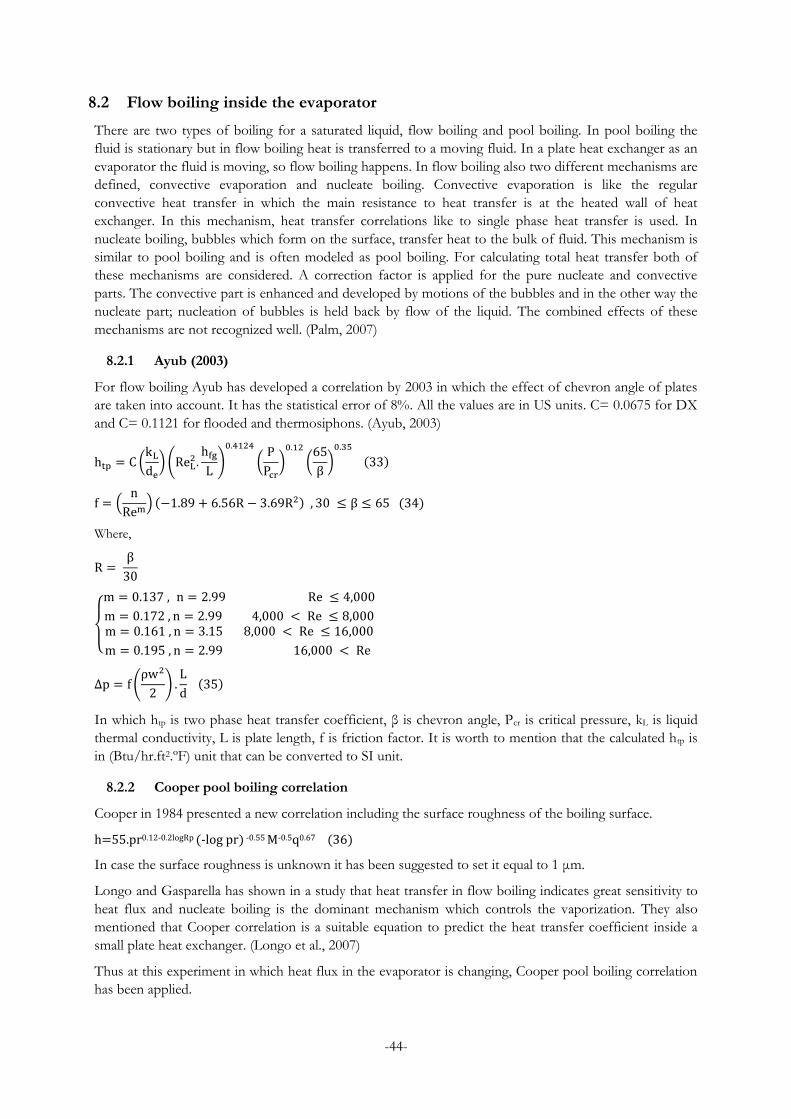
-44-
8.2 Flow boiling inside the evaporator
There are two types of boiling for a saturated liquid, flow boiling and pool boiling. In pool boiling the
fluid is stationary but in flow boiling heat is transferred to a moving fluid. In a plate heat exchanger as an
evaporator the fluid is moving, so flow boiling happens. In flow boiling also two different mechanisms are
defined, convective evaporation and nucleate boiling. Convective evaporation is like the regular
convective heat transfer in which the main resistance to heat transfer is at the heated wall of heat
exchanger. In this mechanism, heat transfer correlations like to single phase heat transfer is used. In
nucleate boiling, bubbles which form on the surface, transfer heat to the bulk of fluid. This mechanism is
similar to pool boiling and is often modeled as pool boiling. For calculating total heat transfer both of
these mechanisms are considered. A correction factor is applied for the pure nucleate and convective
parts. The convective part is enhanced and developed by motions of the bubbles and in the other way the
nucleate part; nucleation of bubbles is held back by flow of the liquid. The combined effects of these
mechanisms are not recognized well. (Palm, 2007)
8.2.1 Ayub (2003)
For flow boiling Ayub has developed a correlation by 2003 in which the effect of chevron angle of plates
are taken into account. It has the statistical error of 8%. All the values are in US units. C= 0.0675 for DX
and C= 0.1121 for flooded and thermosiphons. (Ayub, 2003)
( ) (
)
(
)
(
)
(
)
Where,
{
(
)
In which htp is two phase heat transfer coefficient, β is chevron angle, Pcr is critical pressure, kL is liquid
thermal conductivity, L is plate length, f is friction factor. It is worth to mention that the calculated htp is
in (Btu/hr.ft2.ºF) unit that can be converted to SI unit.
8.2.2 Cooper pool boiling correlation
Cooper in 1984 presented a new correlation including the surface roughness of the boiling surface.
h=55.pr0.12-0.2logRp (-log pr) -0.55 M-0.5q0.67 (36)
In case the surface roughness is unknown it has been suggested to set it equal to 1 μm.
Longo and Gasparella has shown in a study that heat transfer in flow boiling indicates great sensitivity to
heat flux and nucleate boiling is the dominant mechanism which controls the vaporization. They also
mentioned that Cooper correlation is a suitable equation to predict the heat transfer coefficient inside a
small plate heat exchanger. (Longo et al., 2007)
Thus at this experiment in which heat flux in the evaporator is changing, Cooper pool boiling correlation
has been applied.
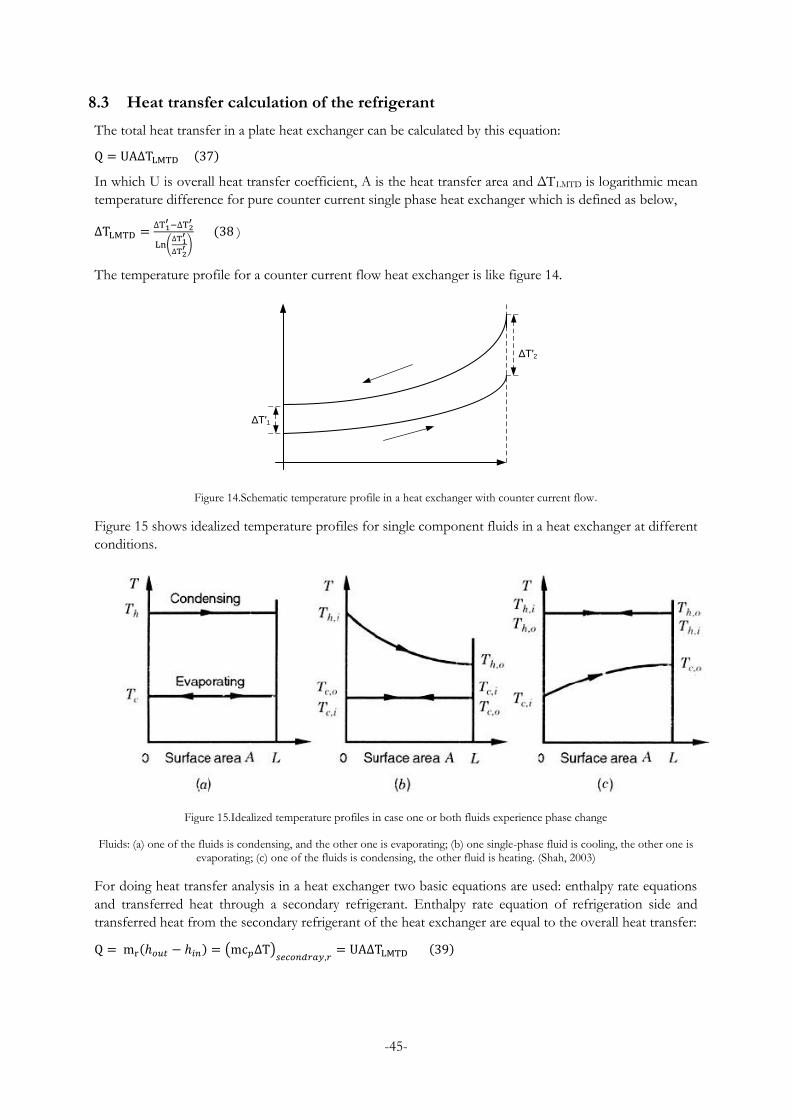
-45-
8.3 Heat transfer calculation of the refrigerant
The total heat transfer in a plate heat exchanger can be calculated by this equation:
A
In which U is overall heat transfer coefficient, A is the heat transfer area and ΔTLMTD is logarithmic mean
temperature difference for pure counter current single phase heat exchanger which is defined as below,
(
)
)
The temperature profile for a counter current flow heat exchanger is like figure 14.
ΔT′2
ΔT′1
Figure 14.Schematic temperature profile in a heat exchanger with counter current flow.
Figure 15 shows idealized temperature profiles for single component fluids in a heat exchanger at different
conditions.
Figure 15.Idealized temperature profiles in case one or both fluids experience phase change
Fluids: (a) one of the fluids is condensing, and the other one is evaporating; (b) one single-phase fluid is cooling, the other one is evaporating; (c) one of the fluids is condensing, the other fluid is heating. (Shah, 2003)
For doing heat transfer analysis in a heat exchanger two basic equations are used: enthalpy rate equations
and transferred heat through a secondary refrigerant. Enthalpy rate equation of refrigeration side and
transferred heat from the secondary refrigerant of the heat exchanger are equal to the overall heat transfer:
( ) A
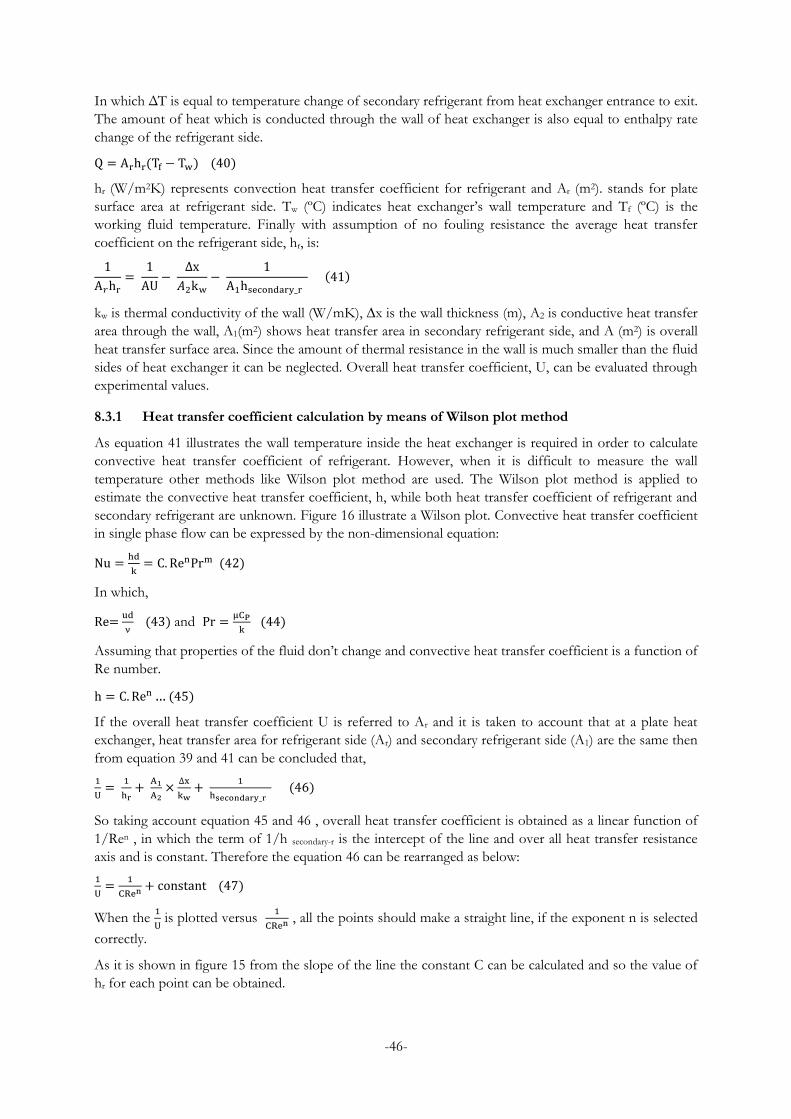
-46-
In which ΔT is equal to temperature change of secondary refrigerant from heat exchanger entrance to exit.
The amount of heat which is conducted through the wall of heat exchanger is also equal to enthalpy rate
change of the refrigerant side.
A
hr (W/m2K) represents convection heat transfer coefficient for refrigerant and Ar (m2). stands for plate
surface area at refrigerant side. Tw (ºC) indicates heat exchanger’s wall temperature and Tf (ºC) is the
working fluid temperature. Finally with assumption of no fouling resistance the average heat transfer
coefficient on the refrigerant side, hr, is:
A
A
A
kw is thermal conductivity of the wall (W/mK), ∆x is the wall thickness (m), A2 is conductive heat transfer
area through the wall, A1(m2) shows heat transfer area in secondary refrigerant side, and A (m2) is overall
heat transfer surface area. Since the amount of thermal resistance in the wall is much smaller than the fluid
sides of heat exchanger it can be neglected. Overall heat transfer coefficient, U, can be evaluated through
experimental values.
8.3.1 Heat transfer coefficient calculation by means of Wilson plot method
As equation 41 illustrates the wall temperature inside the heat exchanger is required in order to calculate
convective heat transfer coefficient of refrigerant. However, when it is difficult to measure the wall
temperature other methods like Wilson plot method are used. The Wilson plot method is applied to
estimate the convective heat transfer coefficient, h, while both heat transfer coefficient of refrigerant and
secondary refrigerant are unknown. Figure 16 illustrate a Wilson plot. Convective heat transfer coefficient
in single phase flow can be expressed by the non-dimensional equation:
(42)
In which,
Re=
(43) and
(44)
Assuming that properties of the fluid don’t change and convective heat transfer coefficient is a function of
Re number.
… (45)
If the overall heat transfer coefficient U is referred to Ar and it is taken to account that at a plate heat
exchanger, heat transfer area for refrigerant side (Ar) and secondary refrigerant side (A1) are the same then
from equation 39 and 41 can be concluded that,
(46)
So taking account equation 45 and 46 , overall heat transfer coefficient is obtained as a linear function of
1/Ren , in which the term of 1/h secondary-r is the intercept of the line and over all heat transfer resistance
axis and is constant. Therefore the equation 46 can be rearranged as below:
(47)
When the
is plotted versus
, all the points should make a straight line, if the exponent n is selected
correctly.
As it is shown in figure 15 from the slope of the line the constant C can be calculated and so the value of
hr for each point can be obtained.
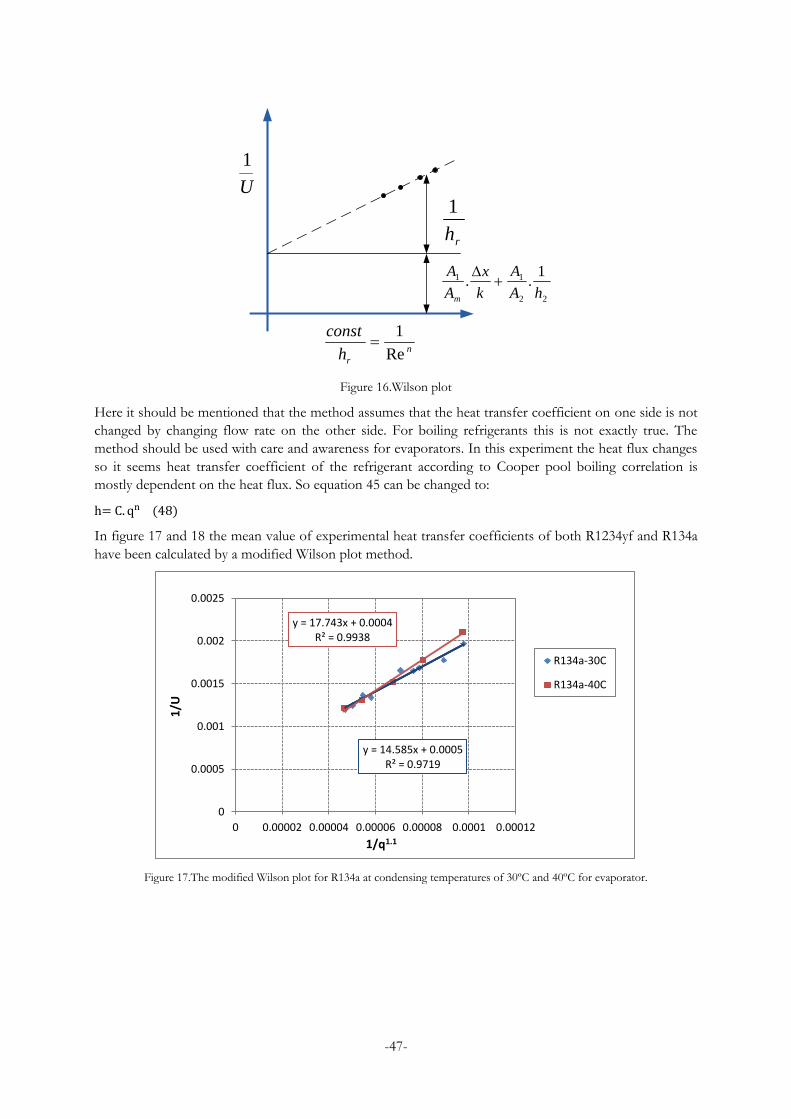
-47-
rh
1
22
11 1..hA
A
k
x
A
A
m
n
rh
const
Re
1
U
1
Figure 16.Wilson plot
Here it should be mentioned that the method assumes that the heat transfer coefficient on one side is not
changed by changing flow rate on the other side. For boiling refrigerants this is not exactly true. The
method should be used with care and awareness for evaporators. In this experiment the heat flux changes
so it seems heat transfer coefficient of the refrigerant according to Cooper pool boiling correlation is
mostly dependent on the heat flux. So equation 45 can be changed to:
h= (48)
In figure 17 and 18 the mean value of experimental heat transfer coefficients of both R1234yf and R134a
have been calculated by a modified Wilson plot method.
Figure 17.The modified Wilson plot for R134a at condensing temperatures of 30ºC and 40ºC for evaporator.
y = 14.585x + 0.0005 R² = 0.9719
y = 17.743x + 0.0004 R² = 0.9938
0
0.0005
0.001
0.0015
0.002
0.0025
0 0.00002 0.00004 0.00006 0.00008 0.0001 0.00012
1/U
1/q1.1
R134a-30C
R134a-40C
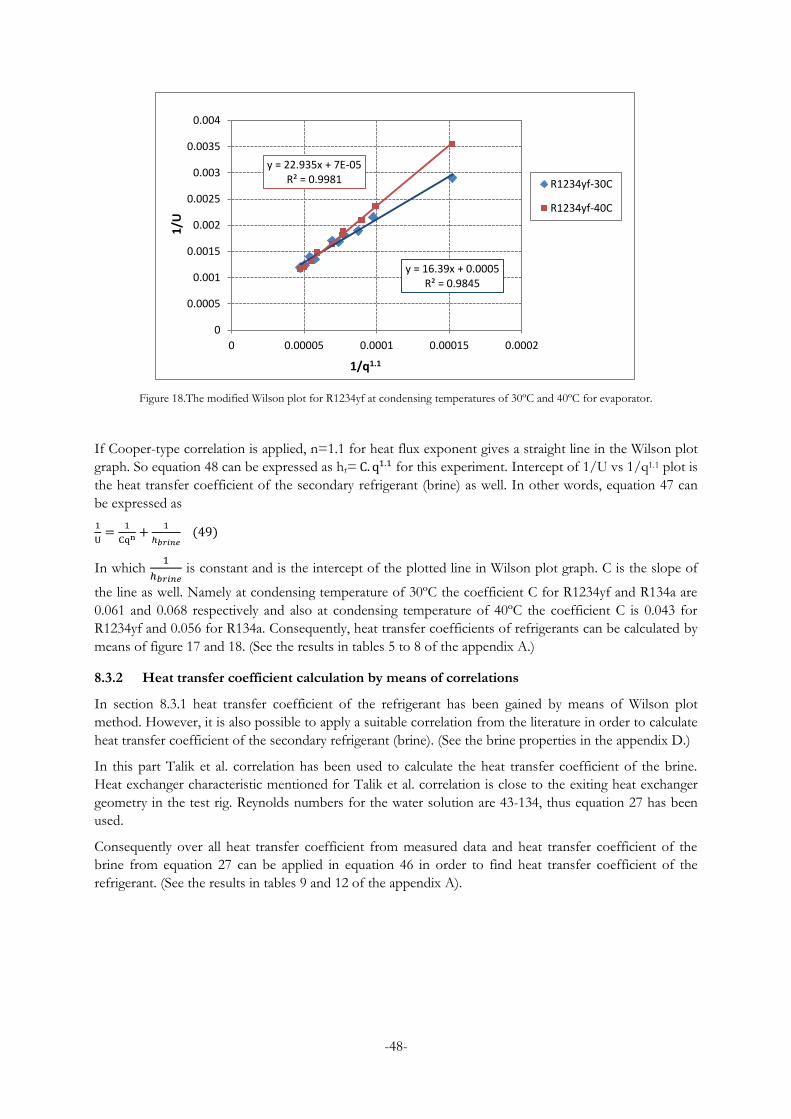
-48-
Figure 18.The modified Wilson plot for R1234yf at condensing temperatures of 30ºC and 40ºC for evaporator.
If Cooper-type correlation is applied, n=1.1 for heat flux exponent gives a straight line in the Wilson plot
graph. So equation 48 can be expressed as hr= for this experiment. Intercept of 1/U vs 1/q1.1 plot is
the heat transfer coefficient of the secondary refrigerant (brine) as well. In other words, equation 47 can
be expressed as
(49)
In which
is constant and is the intercept of the plotted line in Wilson plot graph. C is the slope of
the line as well. Namely at condensing temperature of 30ºC the coefficient C for R1234yf and R134a are
0.061 and 0.068 respectively and also at condensing temperature of 40ºC the coefficient C is 0.043 for
R1234yf and 0.056 for R134a. Consequently, heat transfer coefficients of refrigerants can be calculated by
means of figure 17 and 18. (See the results in tables 5 to 8 of the appendix A.)
8.3.2 Heat transfer coefficient calculation by means of correlations
In section 8.3.1 heat transfer coefficient of the refrigerant has been gained by means of Wilson plot
method. However, it is also possible to apply a suitable correlation from the literature in order to calculate
heat transfer coefficient of the secondary refrigerant (brine). (See the brine properties in the appendix D.)
In this part Talik et al. correlation has been used to calculate the heat transfer coefficient of the brine.
Heat exchanger characteristic mentioned for Talik et al. correlation is close to the exiting heat exchanger
geometry in the test rig. Reynolds numbers for the water solution are 43-134, thus equation 27 has been
used.
Consequently over all heat transfer coefficient from measured data and heat transfer coefficient of the
brine from equation 27 can be applied in equation 46 in order to find heat transfer coefficient of the
refrigerant. (See the results in tables 9 and 12 of the appendix A).
y = 16.39x + 0.0005 R² = 0.9845
y = 22.935x + 7E-05 R² = 0.9981
0
0.0005
0.001
0.0015
0.002
0.0025
0.003
0.0035
0.004
0 0.00005 0.0001 0.00015 0.0002
1/U
1/q1.1
R1234yf-30C
R1234yf-40C
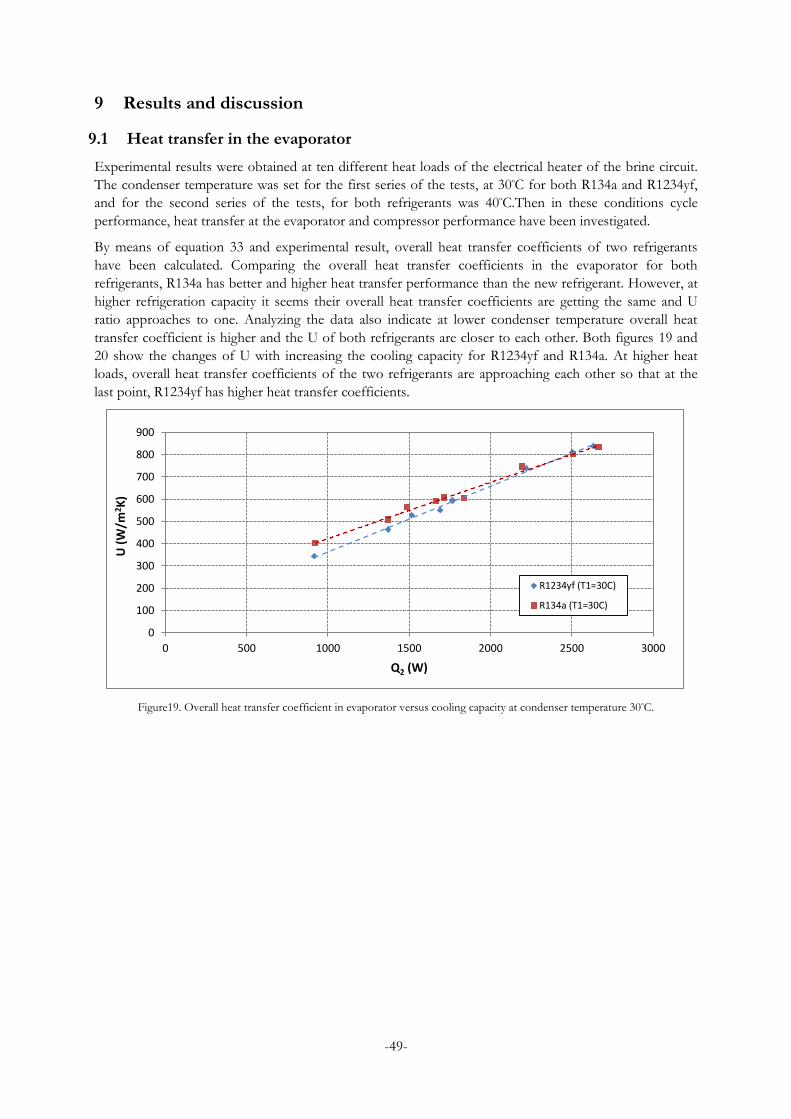
-49-
9 Results and discussion
9.1 Heat transfer in the evaporator
Experimental results were obtained at ten different heat loads of the electrical heater of the brine circuit.
The condenser temperature was set for the first series of the tests, at 30ºC for both R134a and R1234yf,
and for the second series of the tests, for both refrigerants was 40ºC.Then in these conditions cycle
performance, heat transfer at the evaporator and compressor performance have been investigated.
By means of equation 33 and experimental result, overall heat transfer coefficients of two refrigerants
have been calculated. Comparing the overall heat transfer coefficients in the evaporator for both
refrigerants, R134a has better and higher heat transfer performance than the new refrigerant. However, at
higher refrigeration capacity it seems their overall heat transfer coefficients are getting the same and U
ratio approaches to one. Analyzing the data also indicate at lower condenser temperature overall heat
transfer coefficient is higher and the U of both refrigerants are closer to each other. Both figures 19 and
20 show the changes of U with increasing the cooling capacity for R1234yf and R134a. At higher heat
loads, overall heat transfer coefficients of the two refrigerants are approaching each other so that at the
last point, R1234yf has higher heat transfer coefficients.
Figure19. Overall heat transfer coefficient in evaporator versus cooling capacity at condenser temperature 30ºC.
0
100
200
300
400
500
600
700
800
900
0 500 1000 1500 2000 2500 3000
U (
W/m
2 K)
Q2 (W)
R1234yf (T1=30C)
R134a (T1=30C)
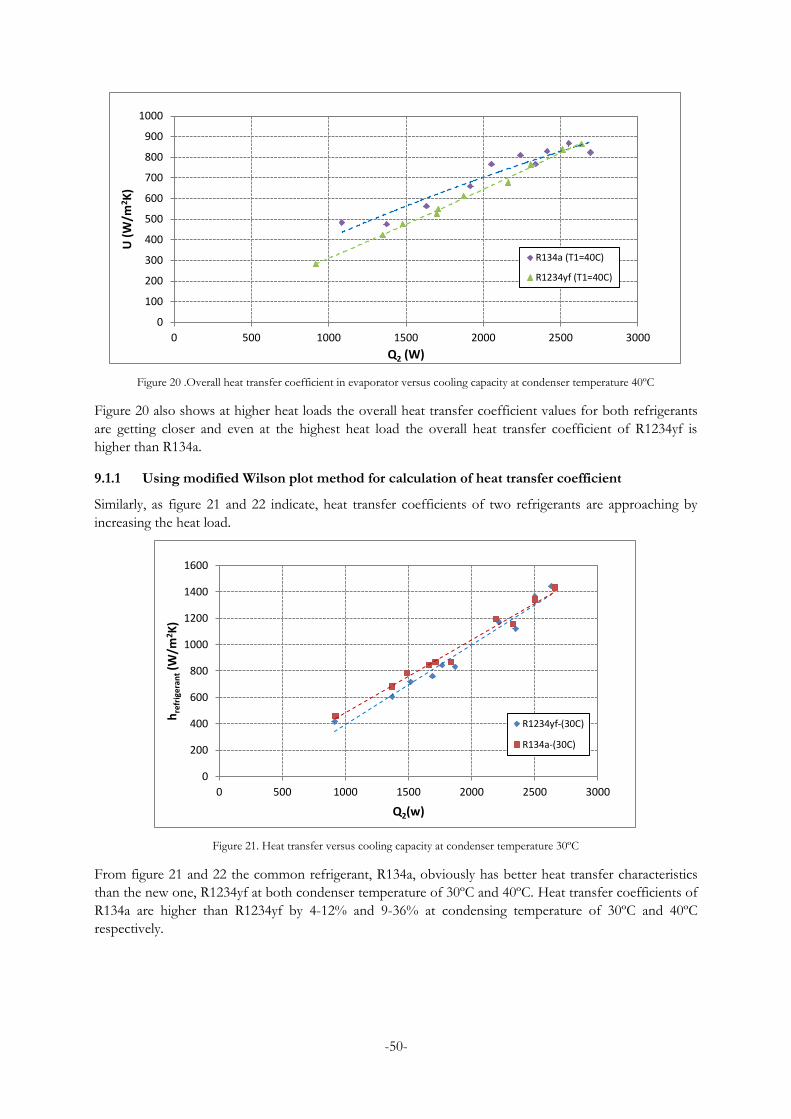
-50-
Figure 20 .Overall heat transfer coefficient in evaporator versus cooling capacity at condenser temperature 40ºC
Figure 20 also shows at higher heat loads the overall heat transfer coefficient values for both refrigerants
are getting closer and even at the highest heat load the overall heat transfer coefficient of R1234yf is
higher than R134a.
9.1.1 Using modified Wilson plot method for calculation of heat transfer coefficient
Similarly, as figure 21 and 22 indicate, heat transfer coefficients of two refrigerants are approaching by
increasing the heat load.
Figure 21. Heat transfer versus cooling capacity at condenser temperature 30ºC
From figure 21 and 22 the common refrigerant, R134a, obviously has better heat transfer characteristics
than the new one, R1234yf at both condenser temperature of 30ºC and 40ºC. Heat transfer coefficients of
R134a are higher than R1234yf by 4-12% and 9-36% at condensing temperature of 30ºC and 40ºC
respectively.
0
100
200
300
400
500
600
700
800
900
1000
0 500 1000 1500 2000 2500 3000
U (
W/m
2 K)
Q2 (W)
R134a (T1=40C)
R1234yf (T1=40C)
0
200
400
600
800
1000
1200
1400
1600
0 500 1000 1500 2000 2500 3000
hre
frig
era
nt (
W/m
2K
)
Q2(w)
R1234yf-(30C)
R134a-(30C)
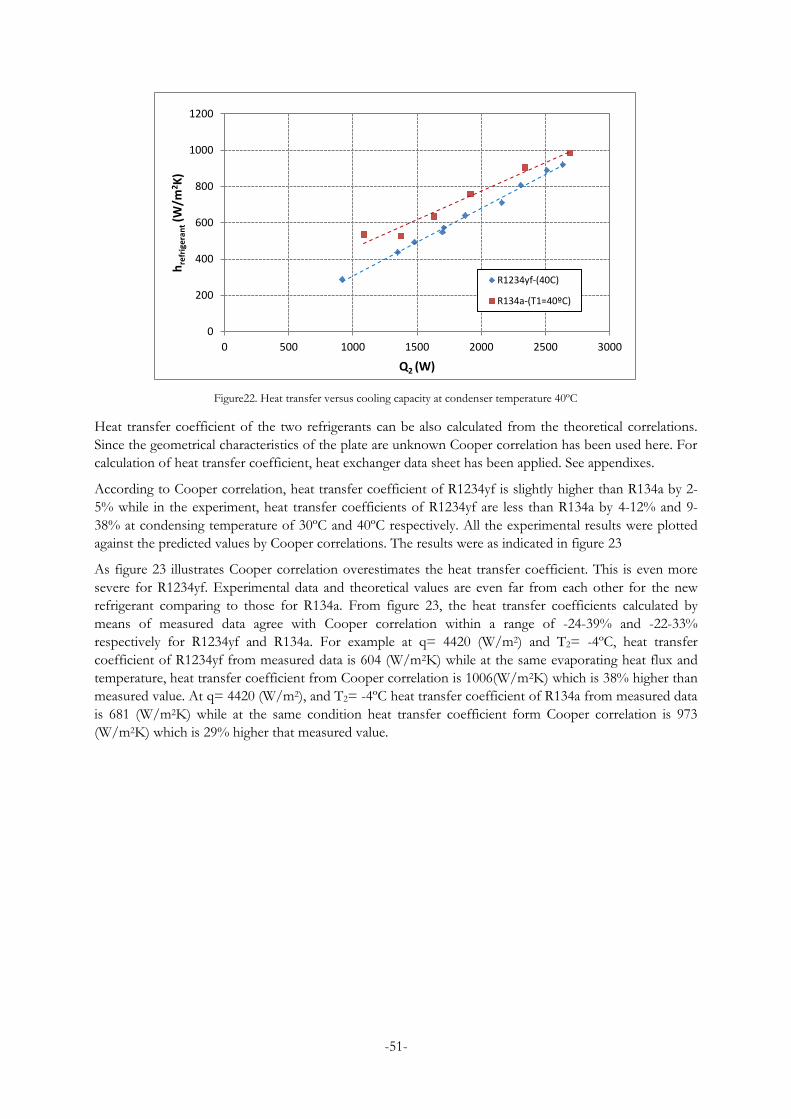
-51-
Figure22. Heat transfer versus cooling capacity at condenser temperature 40ºC
Heat transfer coefficient of the two refrigerants can be also calculated from the theoretical correlations.
Since the geometrical characteristics of the plate are unknown Cooper correlation has been used here. For
calculation of heat transfer coefficient, heat exchanger data sheet has been applied. See appendixes.
According to Cooper correlation, heat transfer coefficient of R1234yf is slightly higher than R134a by 2-
5% while in the experiment, heat transfer coefficients of R1234yf are less than R134a by 4-12% and 9-
38% at condensing temperature of 30ºC and 40ºC respectively. All the experimental results were plotted
against the predicted values by Cooper correlations. The results were as indicated in figure 23
As figure 23 illustrates Cooper correlation overestimates the heat transfer coefficient. This is even more
severe for R1234yf. Experimental data and theoretical values are even far from each other for the new
refrigerant comparing to those for R134a. From figure 23, the heat transfer coefficients calculated by
means of measured data agree with Cooper correlation within a range of -24-39% and -22-33%
respectively for R1234yf and R134a. For example at q= 4420 (W/m2) and T2= -4ºC, heat transfer
coefficient of R1234yf from measured data is 604 (W/m2K) while at the same evaporating heat flux and
temperature, heat transfer coefficient from Cooper correlation is 1006(W/m2K) which is 38% higher than
measured value. At q= 4420 (W/m2), and T2= -4ºC heat transfer coefficient of R134a from measured data
is 681 (W/m2K) while at the same condition heat transfer coefficient form Cooper correlation is 973
(W/m2K) which is 29% higher that measured value.
0
200
400
600
800
1000
1200
0 500 1000 1500 2000 2500 3000
hre
frig
era
nt (
W/m
2K
)
Q2 (W)
R1234yf-(40C)
R134a-(T1=40ºC)
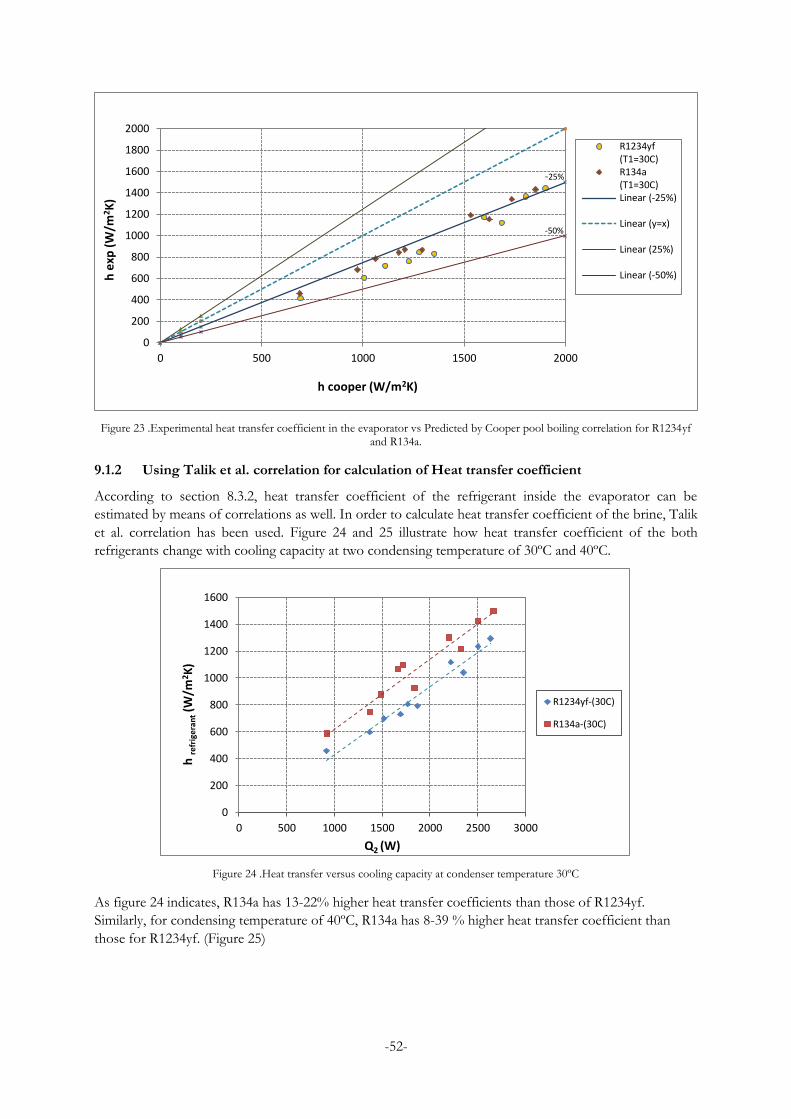
-52-
Figure 23 .Experimental heat transfer coefficient in the evaporator vs Predicted by Cooper pool boiling correlation for R1234yf and R134a.
9.1.2 Using Talik et al. correlation for calculation of Heat transfer coefficient
According to section 8.3.2, heat transfer coefficient of the refrigerant inside the evaporator can be
estimated by means of correlations as well. In order to calculate heat transfer coefficient of the brine, Talik
et al. correlation has been used. Figure 24 and 25 illustrate how heat transfer coefficient of the both
refrigerants change with cooling capacity at two condensing temperature of 30ºC and 40ºC.
Figure 24 .Heat transfer versus cooling capacity at condenser temperature 30ºC
As figure 24 indicates, R134a has 13-22% higher heat transfer coefficients than those of R1234yf.
Similarly, for condensing temperature of 40ºC, R134a has 8-39 % higher heat transfer coefficient than
those for R1234yf. (Figure 25)
0
200
400
600
800
1000
1200
1400
1600
1800
2000
0 500 1000 1500 2000
h e
xp (
W/m
2 K)
h cooper (W/m2K)
R1234yf(T1=30C)R134a(T1=30C)Linear (-25%)
Linear (y=x)
Linear (25%)
Linear (-50%)
-50%
-25%
0
200
400
600
800
1000
1200
1400
1600
0 500 1000 1500 2000 2500 3000
h re
frig
era
nt (
W/m
2 K)
Q2 (W)
R1234yf-(30C)
R134a-(30C)
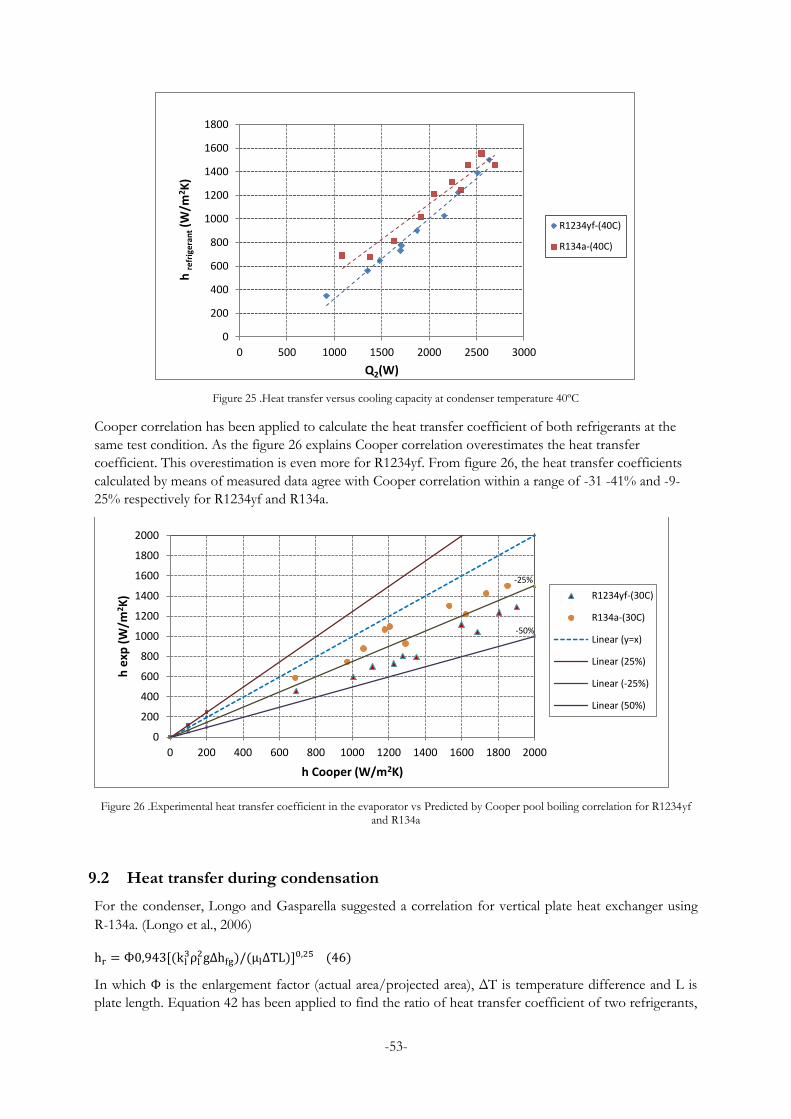
-53-
Figure 25 .Heat transfer versus cooling capacity at condenser temperature 40ºC
Cooper correlation has been applied to calculate the heat transfer coefficient of both refrigerants at the
same test condition. As the figure 26 explains Cooper correlation overestimates the heat transfer
coefficient. This overestimation is even more for R1234yf. From figure 26, the heat transfer coefficients
calculated by means of measured data agree with Cooper correlation within a range of -31 -41% and -9-
25% respectively for R1234yf and R134a.
Figure 26 .Experimental heat transfer coefficient in the evaporator vs Predicted by Cooper pool boiling correlation for R1234yf and R134a
9.2 Heat transfer during condensation
For the condenser, Longo and Gasparella suggested a correlation for vertical plate heat exchanger using
R-134a. (Longo et al., 2006)
In which is the enlargement factor (actual area/projected area), ΔT is temperature difference and L is
plate length. Equation 42 has been applied to find the ratio of heat transfer coefficient of two refrigerants,
0
200
400
600
800
1000
1200
1400
1600
1800
0 500 1000 1500 2000 2500 3000
h re
frig
era
nt (
W/m
2 K)
Q2(W)
R1234yf-(40C)
R134a-(40C)
0
200
400
600
800
1000
1200
1400
1600
1800
2000
0 200 400 600 800 1000 1200 1400 1600 1800 2000
h e
xp (
W/m
2K
)
h Cooper (W/m2K)
R1234yf-(30C)
R134a-(30C)
Linear (y=x)
Linear (25%)
Linear (-25%)
Linear (50%)
-25%
-50%
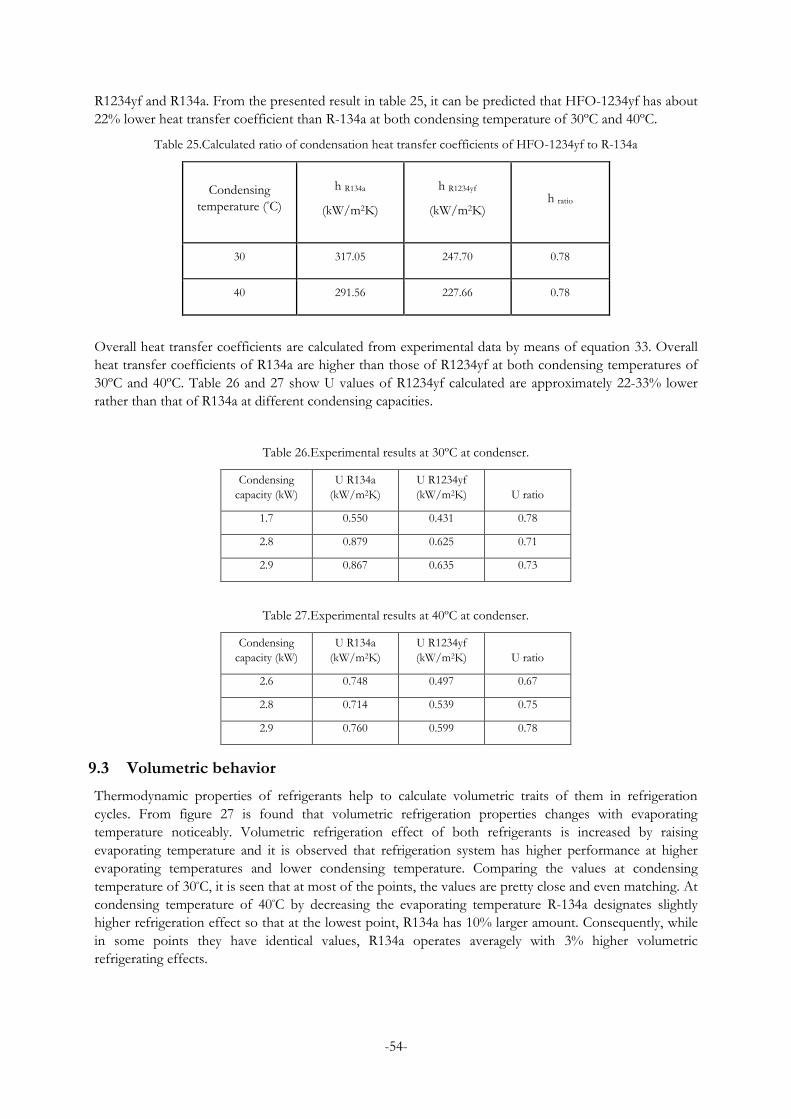
-54-
R1234yf and R134a. From the presented result in table 25, it can be predicted that HFO-1234yf has about
22% lower heat transfer coefficient than R-134a at both condensing temperature of 30ºC and 40ºC.
Table 25.Calculated ratio of condensation heat transfer coefficients of HFO-1234yf to R-134a
Condensing
temperature (ºC)
h R134a
(kW/m2K)
h R1234yf
(kW/m2K) h ratio
30 317.05 247.70 0.78
40 291.56 227.66 0.78
Overall heat transfer coefficients are calculated from experimental data by means of equation 33. Overall
heat transfer coefficients of R134a are higher than those of R1234yf at both condensing temperatures of
30ºC and 40ºC. Table 26 and 27 show U values of R1234yf calculated are approximately 22-33% lower
rather than that of R134a at different condensing capacities.
Table 26.Experimental results at 30ºC at condenser.
Condensing
capacity (kW)
U R134a
(kW/m2K)
U R1234yf
(kW/m2K) U ratio
1.7 0.550 0.431 0.78
2.8 0.879 0.625 0.71
2.9 0.867 0.635 0.73
Table 27.Experimental results at 40ºC at condenser.
Condensing
capacity (kW)
U R134a
(kW/m2K)
U R1234yf
(kW/m2K) U ratio
2.6 0.748 0.497 0.67
2.8 0.714 0.539 0.75
2.9 0.760 0.599 0.78
9.3 Volumetric behavior
Thermodynamic properties of refrigerants help to calculate volumetric traits of them in refrigeration
cycles. From figure 27 is found that volumetric refrigeration properties changes with evaporating
temperature noticeably. Volumetric refrigeration effect of both refrigerants is increased by raising
evaporating temperature and it is observed that refrigeration system has higher performance at higher
evaporating temperatures and lower condensing temperature. Comparing the values at condensing
temperature of 30ºC, it is seen that at most of the points, the values are pretty close and even matching. At
condensing temperature of 40ºC by decreasing the evaporating temperature R-134a designates slightly
higher refrigeration effect so that at the lowest point, R134a has 10% larger amount. Consequently, while
in some points they have identical values, R134a operates averagely with 3% higher volumetric
refrigerating effects.
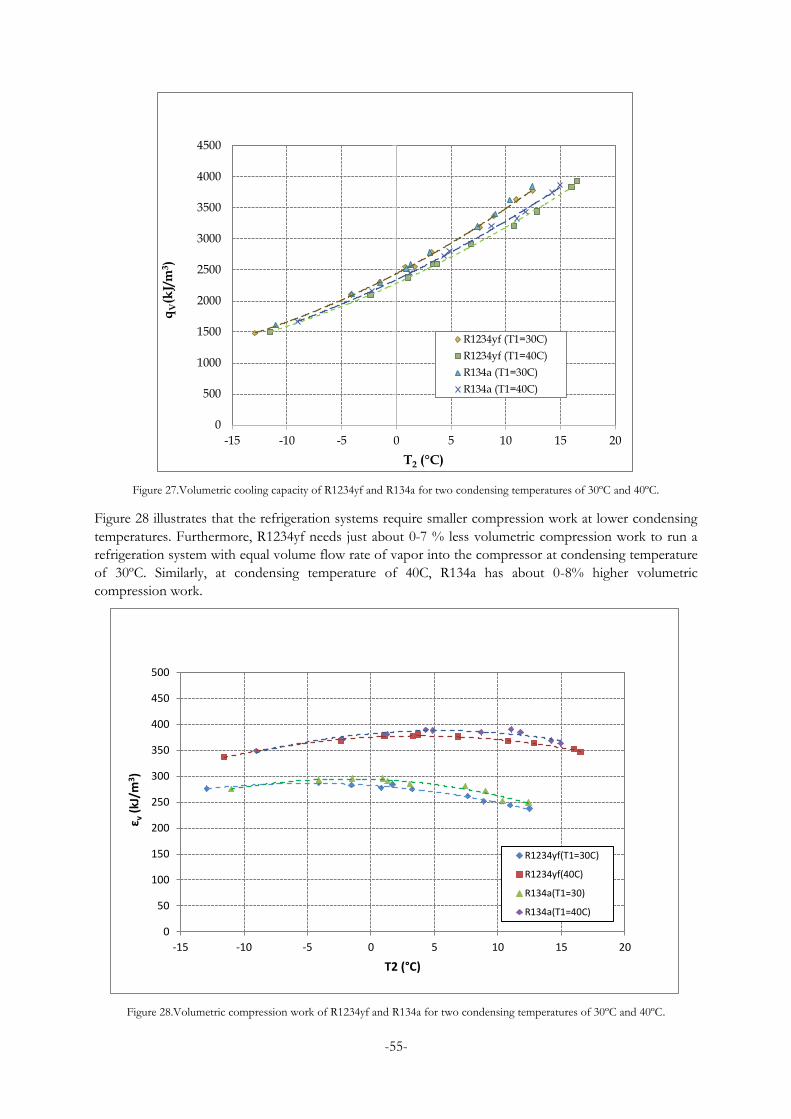
-55-
Figure 27.Volumetric cooling capacity of R1234yf and R134a for two condensing temperatures of 30ºC and 40ºC.
Figure 28 illustrates that the refrigeration systems require smaller compression work at lower condensing
temperatures. Furthermore, R1234yf needs just about 0-7 % less volumetric compression work to run a
refrigeration system with equal volume flow rate of vapor into the compressor at condensing temperature
of 30ºC. Similarly, at condensing temperature of 40C, R134a has about 0-8% higher volumetric
compression work.
Figure 28.Volumetric compression work of R1234yf and R134a for two condensing temperatures of 30ºC and 40ºC.
0
500
1000
1500
2000
2500
3000
3500
4000
4500
-15 -10 -5 0 5 10 15 20
qV
(kJ/
m3)
T2 (°C)
R1234yf (T1=30C)
R1234yf (T1=40C)
R134a (T1=30C)
R134a (T1=40C)
0
50
100
150
200
250
300
350
400
450
500
-15 -10 -5 0 5 10 15 20
ε v (
kJ/m
3 )
T2 (°C)
R1234yf(T1=30C)
R1234yf(40C)
R134a(T1=30)
R134a(T1=40C)
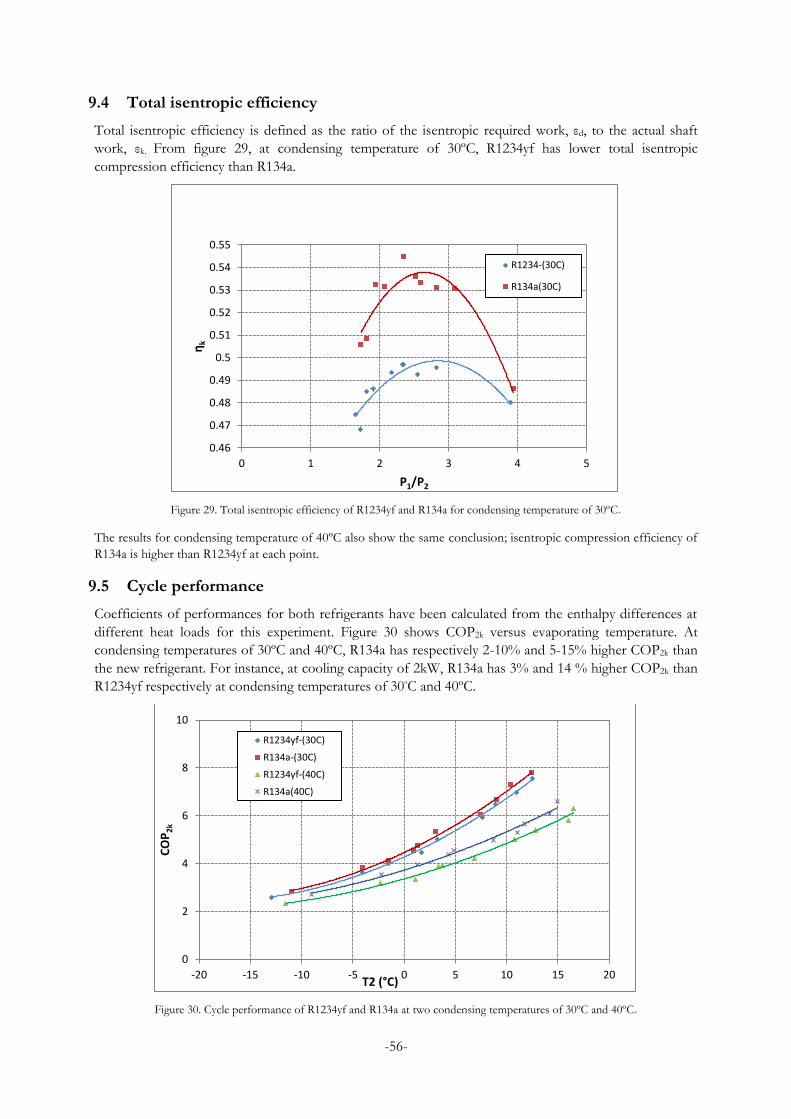
-56-
9.4 Total isentropic efficiency
Total isentropic efficiency is defined as the ratio of the isentropic required work, εd, to the actual shaft
work, εk. From figure 29, at condensing temperature of 30ºC, R1234yf has lower total isentropic
compression efficiency than R134a.
Figure 29. Total isentropic efficiency of R1234yf and R134a for condensing temperature of 30ºC.
The results for condensing temperature of 40ºC also show the same conclusion; isentropic compression efficiency of
R134a is higher than R1234yf at each point.
9.5 Cycle performance
Coefficients of performances for both refrigerants have been calculated from the enthalpy differences at
different heat loads for this experiment. Figure 30 shows COP2k versus evaporating temperature. At
condensing temperatures of 30ºC and 40ºC, R134a has respectively 2-10% and 5-15% higher COP2k than
the new refrigerant. For instance, at cooling capacity of 2kW, R134a has 3% and 14 % higher COP2k than
R1234yf respectively at condensing temperatures of 30ºC and 40ºC.
Figure 30. Cycle performance of R1234yf and R134a at two condensing temperatures of 30ºC and 40ºC.
0.46
0.47
0.48
0.49
0.5
0.51
0.52
0.53
0.54
0.55
0 1 2 3 4 5
ƞk
P1/P2
R1234-(30C)
R134a(30C)
0
2
4
6
8
10
-20 -15 -10 -5 0 5 10 15 20
CO
P2
k
T2 (°C)
R1234yf-(30C)
R134a-(30C)
R1234yf-(40C)
R134a(40C)
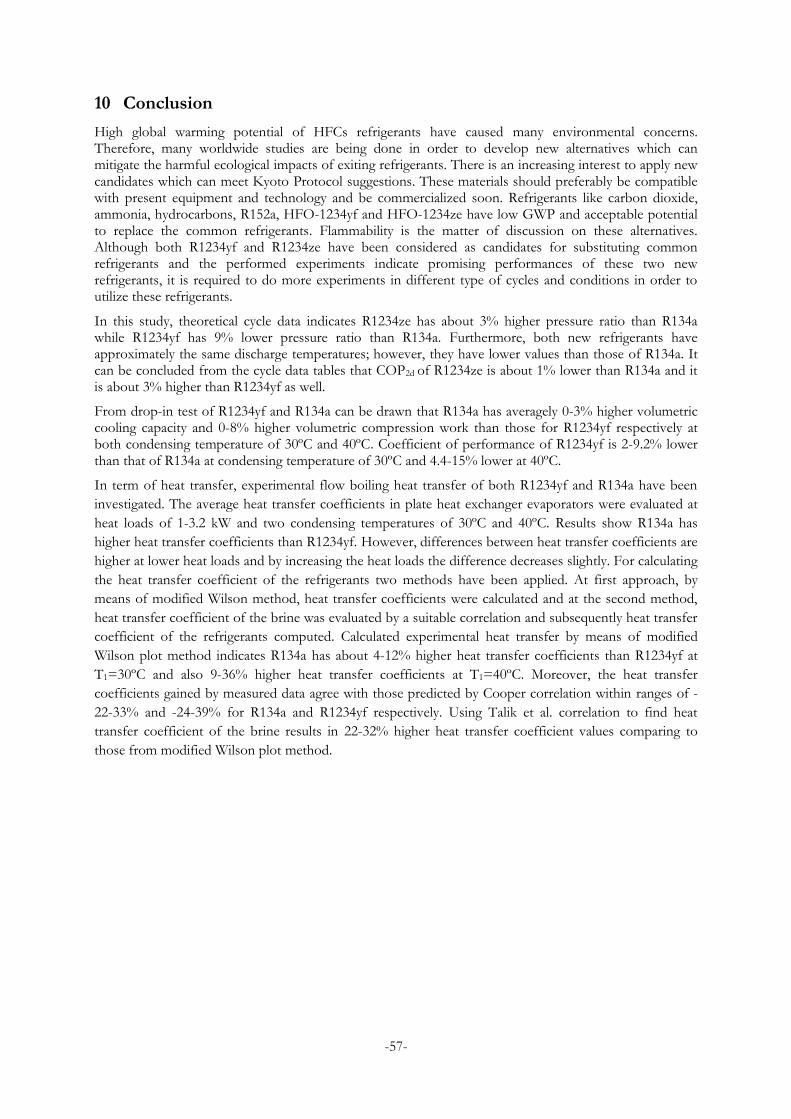
-57-
10 Conclusion
High global warming potential of HFCs refrigerants have caused many environmental concerns. Therefore, many worldwide studies are being done in order to develop new alternatives which can mitigate the harmful ecological impacts of exiting refrigerants. There is an increasing interest to apply new candidates which can meet Kyoto Protocol suggestions. These materials should preferably be compatible with present equipment and technology and be commercialized soon. Refrigerants like carbon dioxide, ammonia, hydrocarbons, R152a, HFO-1234yf and HFO-1234ze have low GWP and acceptable potential to replace the common refrigerants. Flammability is the matter of discussion on these alternatives. Although both R1234yf and R1234ze have been considered as candidates for substituting common refrigerants and the performed experiments indicate promising performances of these two new refrigerants, it is required to do more experiments in different type of cycles and conditions in order to utilize these refrigerants.
In this study, theoretical cycle data indicates R1234ze has about 3% higher pressure ratio than R134a while R1234yf has 9% lower pressure ratio than R134a. Furthermore, both new refrigerants have approximately the same discharge temperatures; however, they have lower values than those of R134a. It can be concluded from the cycle data tables that COP2d of R1234ze is about 1% lower than R134a and it is about 3% higher than R1234yf as well.
From drop-in test of R1234yf and R134a can be drawn that R134a has averagely 0-3% higher volumetric cooling capacity and 0-8% higher volumetric compression work than those for R1234yf respectively at both condensing temperature of 30ºC and 40ºC. Coefficient of performance of R1234yf is 2-9.2% lower than that of R134a at condensing temperature of 30ºC and 4.4-15% lower at 40ºC.
In term of heat transfer, experimental flow boiling heat transfer of both R1234yf and R134a have been
investigated. The average heat transfer coefficients in plate heat exchanger evaporators were evaluated at
heat loads of 1-3.2 kW and two condensing temperatures of 30ºC and 40ºC. Results show R134a has
higher heat transfer coefficients than R1234yf. However, differences between heat transfer coefficients are
higher at lower heat loads and by increasing the heat loads the difference decreases slightly. For calculating
the heat transfer coefficient of the refrigerants two methods have been applied. At first approach, by
means of modified Wilson method, heat transfer coefficients were calculated and at the second method,
heat transfer coefficient of the brine was evaluated by a suitable correlation and subsequently heat transfer
coefficient of the refrigerants computed. Calculated experimental heat transfer by means of modified
Wilson plot method indicates R134a has about 4-12% higher heat transfer coefficients than R1234yf at
T1=30ºC and also 9-36% higher heat transfer coefficients at T1=40ºC. Moreover, the heat transfer
coefficients gained by measured data agree with those predicted by Cooper correlation within ranges of -
22-33% and -24-39% for R134a and R1234yf respectively. Using Talik et al. correlation to find heat
transfer coefficient of the brine results in 22-32% higher heat transfer coefficient values comparing to
those from modified Wilson plot method.
-58-
Bibliography
Akasaka R., 2010 “An application of the extended corresponding states model to thermodynamic property calculations for trans-1,3,3,3-tetrafluoropropene (HFO-1234ze(E))”, International Journal of Refrigeration, 33(2010)907 e9 1 4 ,Elsevier Ltd and IIR, March 2010. Available at < www. Scincedirect.com> Akasaka R. , Tanaka K, Higashi Y., 2009, Thermodynamic property modeling for 2,3,3,3-tetraflouropropene(HFO-1234yf), International Journal of Refrigeration, 33(2010)52-60 ,Elsevier Ltd and IIR, September 2009 ,Available at < www. Scincedirect.com>
Arcakliog˘lu E., Avusog˘lu A. C, Erisen A.,” Thermodynamic analysis of refrigerant mixtures for possible replacements for CFCs by an algorithm compiling property data”, Applied Thermal Engineering ,26 (2006) 430–439, Elsevier LTD, August 2005.
Available at < www. Scincedirect.com>
Ashrae Standard, 2010, Designation and Safety Classification of Refrigerants, American Society of Heating, Refrigerating and Air-Conditioning Engineers, Inc. ISSN 1041-2336.
Atkinson R., Baulch D. L., Cox R. A., Crowley J. N., Hampson R. F., Hynes R. G., Jenkin M. E., Rossi M. J., Troe J., and Wallington T. J., 2008, Evaluated kinetic and photochemical data for atmospheric chemistry: Volume IV – gas phase reactions of organic halogen species, Atmospheric Chemistry and Physics Journal, Atmos. Chem. Phys., 8, 4141–4496, 2008
Ayub, Z.H. 2003, Plate Heat Exchanger Literature Survey and New Heat Transfer and Pressure Drop Correlations for Refrigerant Evaporators, Heat transfers Engineering 24(5):3-16.
Benni Du, Changjun Feng, Weichao Zhang, 2009, Theoretical studies on the reaction mechanisms and rate constants for OH radicals with CF3CF@CH2, Chemical Physics Letters 479 (2009) 37–42, Elsevier B.V. Available at < www. Scincedirect.com>
Brown J.S., Zilio C., Cavallini A. Thermodynamic properties of eight fluorinated olefins , International Journal of Refrigeration, 33(2010)235-241 ,Elsevier Ltd and IIR, May 2009.
Available at < www. Scincedirect.com>
Dossat, Roy J. 1991. Principles of Refrigeration, 3rd Edition, New Jersey, Prentice Hall, Inc., 1991. ISBN: 0-13-717687-2.
Davis, 2008, Uniform Mechanical Code, Chapter 11, Table 11-1 – Refrigerant Groups, Properties and Allowable Quantities, ASHRAE Standards. Available at: <http://www.iapmo.org/Tentative%20Interim%20Amendments/UMC%20Extracts/2008%20UMC%20Extracts%20Table%2011-1%20Issued.pdf >
Fact Sheet, 2011, Occupational health and safety, Honeywell Company.
Available at < http://www.1234facts.com/pdf/FactSheet_E_HSE_110307.pdf>
-59-
Fleischer R., 2010, Latest Developments in Refrigerants, Combi Cool Winterdays 17.-18.2.2010, Honeywell Fluorine Products, Available at: <http://www.combicool.fi/sivut/assets/files/Talvipaivat_2010/CC2010_Honeywell.pdf >
Granryd, Eric ,2005 ,Refrigerant Cycle Data, Thermophysical properties of refrigerants for applications in
vapor compression systems, Department of Energy Technology, KTH, Stockholm.
Granryd, Eric, et al. 2005. Refrigeration Engineering, 5th Edition, Stockholm: Royal Institute of Technology, KTH, 2005, Vol. I.
Hamdar M., Zoughaib A., Clodic D.,2010 ,”Flow boiling heat transfer and pressure drop of pure HFC-152a in a horizontal mini-channel”, International Journal of Refrigeration, Volume 33, Issue 3,
Pages 566-577, Elsevier Ltd and IIR, May 2010.
Available at < www. Scincedirect.com>
Hill William, 2010, Industry 3 year evaluation of low global warming potential refrigerant HFO-1234yf, Dupont Company.
Availableat:
<http://www2.dupont.com/Refrigerants/en_US/assets/downloads/SmartAutoAC/20100121_MACS_Hill_summary.pdf >
Hrnjak. P. S., Richter. M. R, Bullard. C. W., Comparison of R744and R410A for Residential Heating and Cooling Applications”, ACRC ,CR-39, University of Illinois, June 2001.
Honeywell, HFO-1234ze Blowing Agent,” trans – 1,3,3,3-tetrafluoropropene”, Honeywell International Inc,2008,The Netherlands Available at < http://www51.honeywell.com/sm/lgwp-uk/common/documents/FP_LGWP_UK_Honeywell-HFO-1234ze_Literature_document.pdf
Hughes J, Kontomaris K., Leck T.J., 2010, A Non-Flammable, Reduced GWP, HFC-134a Replacement in Centrifugal Chillers: DR-11, 1DuPont Fluorochemicals R&D, International Refrigeration and Air Conditioning Conference at Purdue Available at < http://www2.dupont.com/Refrigerants/en_US/assets/downloads/20100612-IRAC-Kontomaris-Leck-Hughes-paper.pdf >
Jarall S., 2010,”Properties of new GWP refrigerants”, ETT, Energiteknik, KTH, Stockholm.
Jung D., “Energy and environmental crisis: let's solve it naturally in refrigeration and air conditioning “, American Society of Heating, Refrigerating, and Air-Conditioning Engineers, Inc. September 2008. Available at: <http://www.thefreelibrary.com/Energy+and+environmental+crisis%3A+let%27s+solve+it+naturally+in...-a0186399834 >
Kajihara Hideo, Inoue Kazuya, Yoshida Kikuo, Ryuichi Nagaosa, 2010, Estimation of environmental concentrations and deposition fluxes of R-1234-YF and its decomposition products emitted from air conditioning equipment

-60-
to atmosphere, International Symposium on Next-generation Air Conditioning and Refrigeration Technology Conference, 17 – 19 February 2010, Tokyo, Japan. Saga University Japan.
Kilicarslan A., Hosoz M.,” Energy and irreversibility analysis of a cascade refrigeration system for various refrigerant couples”, Energy conversion and management, 51 (2010) 2947-2954, Elsevier LTD, ,July 2010.
Available at <www. Scincedirect.com.>
Koban Mary, 2009, HFO-1234yf Low GWP Refrigerant, LCCP Analysis, SAE 2009 World Congress.
Available at http://www2.dupont.com/Refrigerants/en_US/assets/downloads/SmartAutoAC/MAC_HFO_1234yf_SAE_04202009.pdf
Koban Mary, 2010, HFO-1234yf Low GWP Refrigerant, Information for manufacturing and service facilities, Dupont Company.
Available at:
<http://www2.dupont.com/Refrigerants/en_US/assets/downloads/SmartAutoAC/2010_AutomotiveSummit_HFO-1234yf_LowGWP.pdf>
Kontomaris K., Leck T.J., Hughes J., 2010, Low GWP refrigerants for air condoning of large buildings, Dupont Flurochemicals R&D. Available at : http://www2.dupont.com/Refrigerants/en_US/assets/downloads/20100309-CLIMA-Kontomaris-Leck-Hughes-paper.pdf >
Korfitsen V, Kristensen A.P.R., “Ammonia high pressure heat pumps in food refrigeration applications” ,Elsevier Science Ltd and IIR,PII:S0140-7007(98)00012-7,January 1998.
Kontomaris K. (Kostas), 2010, A low GWP replacement for HCFC-123 in centrifugal chillers: DR-2, Dupont Company. Available at : http://www2.dupont.com/Refrigerants/en_US/assets/downloads/20101001_UNEP_Kontomaris_paper.pdf
Koyama S., Takada N., Matsuo Y., Yoshitake D., Fukuda S., ”Possibility to introduce HFO-1234ze(E) and its mixture with HFC-32 as low-GWP alternatives for heat pump/refrigeration systems”, Internationals Symposium on Next-generation Air Conditioning and Refrigeration Technology Conference, 17 - 19 February 2010, Tokyo, Japan
Lee H.S., Yoon J.I., Kim J.D., Bansal P.,” Evaporating heat transfer and pressure drop of hydrocarbon refrigerants in 9.52 and 12.70 mm smooth tube” , International Journal of Heat and Mass Transfer ,48 (2005) 2351–2359 , Elsevier LTD, Available at Science Direct ,March 2005. Available at <www. Scincedirect.com.>
Leck T.J, 2009, Evaluation of HFO-1234yf as a potential replacement for R-134ain refrigeration applications, 3rd IIR Conference on thermophysical properties and transfer processes of refrigerants, Boulder, CO, US.
-61-
Lemmon, E.W., Huber, M.L., McLinden, M.O., 2010, NIST Standard Reference Database 23:, Reference Fluid Thermodynamic and Transport Properties-REFPROP, Version 9.0, National Institute of Standards and Technology, Standard Reference Data Program, Gaithersburg, 2010.
Longo G.A., Gasparella A., 2007, Heat transfer and pressure drop during HFC-134a condensation inside a brazed plate heat exchanger, in: International Congress of Refrigeration, Beijing, 2007.
Longo G.A., Gasparella A., 2006, Heat transfer and pressure drop during HFC refrigerant saturated vapor condensation inside a brazed plate heat exchanger, International journal of heat transfer 53(2010) 1079-1087, Elsevier Ltd. Available at <www. Scincedirect.com.>
Material Safety Data Sheet,” HFO-1234ze, HBA-1”, Version 1.6, Honeywell Fluorine Products Europe B.V Honeywell Fluorine Products Europe B.V., September 2008, The Netherlands.
Available at < http://www51.honeywell.com/sm/lgwp-uk/common/documents/msds-documents/FP_LGWP_UK_HFO-1234ze_uk_MSDS.pdf >
Mathur G.D., Heat transfer coefficient and pressure gradients for refrigerant R-152a, Alternate Refrigerant System Symposium, Phoenix, AZ, July 16, 2003
Available at:< http://www.sae.org/altrefrigerant/presentations/presw-mathur.pdf>
Matsuguchi A., Kagawa N., Koyama S., Study on Isochoric Specific Heat Capacity of Liquid OF-1234ze(E), International Symposium on Next-generation Air Conditioning and Refrigeration Technology Conference, 17 – 19 February 2010, Tokyo, Japan. National Defense Academy, Yokosuka, Japan
Melinder Å., 2010, Properties of secondary working fluids for indirect systems, International Institute of Refrigeration, IIR., Paris, France.
Miyara A., Tsubaki K., Sato N., Thermal conductivity of HFO-1234ze(E)+HFC-32 Mixture, International Symposium on Next-generation Air Conditioning and Refrigeration Technology Conference, 17 – 19 February 2010, Tokyo, Japan. Saga University Japan.
MSDS, Material Safety Data Sheet,” HFO-1234yf (2,3,3,3-Tetrafluoro-1-propene)” , DuPont Chemical Solutions Enterprise, 05574925,September 2010, USA.
Available at < http://msds.dupont.com/msds/pdfs/EN/PEN_09004a2f806513e4.pdf
Nielsen O.J. , Javadi M.S., Sulbaek M.P., Andersen A., Hurley M.D., Wallington T.J. , Singh R. ,2007,Atmospheric chemistry of CF3CF@CH2: Kinetics and mechanisms of gas-phase reactions with Cl atoms, OH radicals, and O3 ,Chemical Physics Letters 439 (2007) 18–22, Elsevier B.V.
Available at < www. Scincedirect.com>
Palm B., Claesson J., 2005, Plate Heat Exchangers: Calculation Methods for Single and Two-Phase Flow, Heat Transfer Engineering, 27(4):88-98,2006
Reimer Horst-Ulrich, 2010, DuPont™ Opteon™ XP10: A new option for more environmentally sustainable commercial refrigeration, DuPont Chemicals & Fluoroproducts.
-62-
Available at :< http://www2.dupont.com/Refrigerants/en_US/assets/downloads/article20101014.pdf >
Richter M., McLinden M.O., and Lemmon E.W., 2010,"Thermodynamic Properties of 2,3,3,3-Tetrafluoroprop-1-ene (R1234yf): p-rho-T, Measurements and an Equation of State," Journal of Chemical and Engineering Data, (to be submitted) 2010.
SAE International, 2009, Industry evaluation of low global warming potential refrigerant HFO-1234yf, SAE CRP1234. Available at :< http://www.sae.org/standardsdev/tsb/cooperative/crp1234-3.pdf >
Samuel F. Yana Motta, Elizabet D. Vera Becerra, Mark W. Spatz, 2010, Low global warming alternatives refrigerants for stationary AC&R applications, Honeywell International, Buffalo Research Laboratory, International Refrigeration and Air Conditioning Conference at Purdue.
Sawalha S., 2009, Using CO2 in Supermarket Refrigeration, ASHRAE Journal, Vol.47, No.8, 26-30, Aug-2005.
Sinnott R.K, 2005, Coulson and Richardson's Chemical Engineering Volume 6 - Chemical Engineering Design (4th Edition), Elsevier, pp.759-763
Shah R. K., Sekulić Dušan P.,2003 ,Fundamental of heat exchanger design, John Wiley & Sons,pp.231-239
Schustera P., Bertermannb R., Ruschc G., Dekant W., 2009, Biotransformation of trans-1,1,1,3-tetrafluoropropene (HFO-1234ze), Toxicology and Applied Pharmacology, Volume 239, Issue 3, 15 September 2009, Pages 215–223.
Skander Jribia, Bidyut Baran Sahab, Shigeru Koyamaa, Anutosh Chakrabortyc, Kim Choon Ng, 2011, Study on activated carbon/HFO-1234ze(E) based adsorption cooling cycle, Applied Thermal Engineering, Elsevier LTD.
Available at < www. Scincedirect.com>
Tanaka K., Higashia Y., 2010 , Thermodynamic properties of HFO-1234yf (2,3,3,3-tetrafluoropropene) Propriétés thermodynamiques du HFO-1234yf (2,3,3,3-tétrafluoropropène) , Refrigeration, Volume, Pages 474-479.
Available at < www. Scincedirect.com>
Taria S., Nakai A., Piao. C., Examination regarding Air Conditioning and Heat Pump Water Heater System using Post New alternative Refrigerant, International Symposium on Next-generation Air Conditioning and Refrigeration Technology Conference, 17 – 19 February 2010, Tokyo, Japan .DAIKIN Industries. Ltd , 2010,Japan.
Toxicity Summery, 2010, Significant Toxicity Information Available, DuPont Chemical Solutions Enterprise Available at: <http://www2.dupont.com/Refrigerants/en_US/assets/downloads/SmartAutoAC/toxicity_summary.pdf>
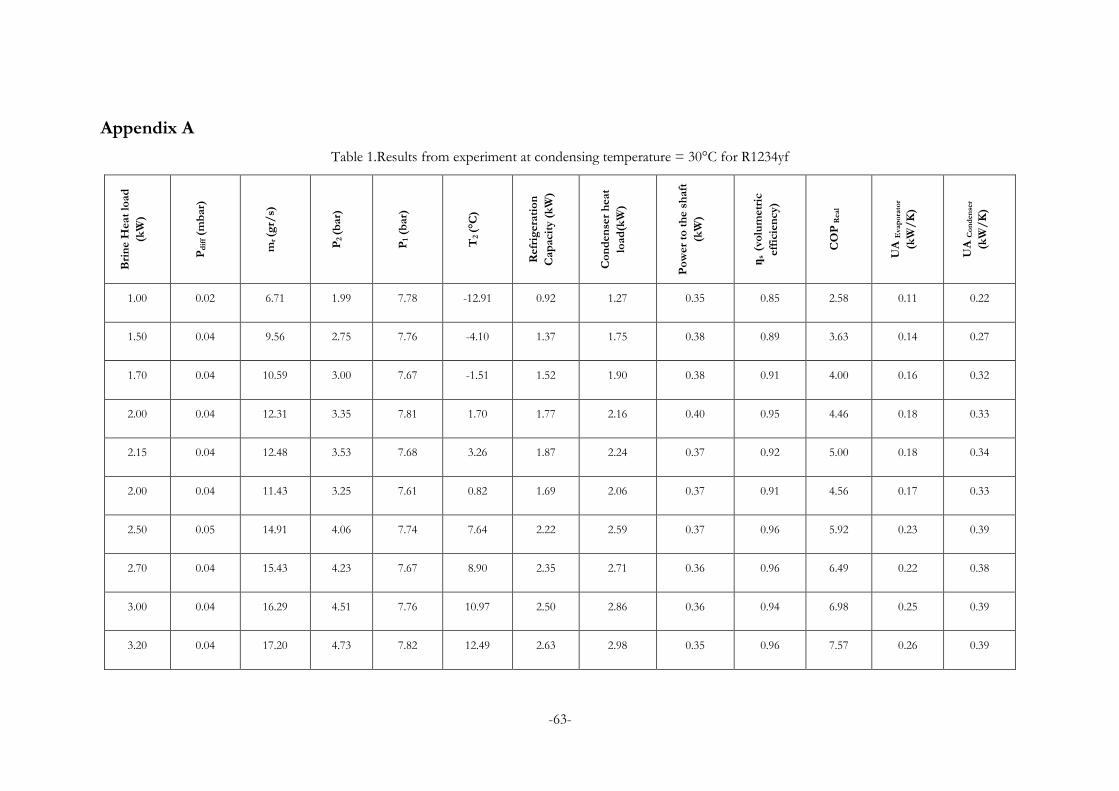
-63-
Appendix A
Table 1.Results from experiment at condensing temperature = 30°C for R1234yf
Bri
ne H
eat
load
(kW
)
Pd
iff (
mb
ar)
mr (g
r/s)
P2 (
bar)
P1
(bar)
T2 (
°C)
Refr
igera
tio
n
Cap
acit
y (
kW
)
Co
nd
en
ser
heat
load
(kW
)
Po
wer
to t
he s
haft
(kW
)
ƞs
(vo
lum
etr
ic
eff
icie
ncy)
CO
P R
eal
UA
Eva
po
rato
r
(kW
/K
)
UA
Co
nd
en
ser
(kW
/K
)
1.00 0.02 6.71 1.99 7.78 -12.91 0.92 1.27 0.35 0.85 2.58 0.11 0.22
1.50 0.04 9.56 2.75 7.76 -4.10 1.37 1.75 0.38 0.89 3.63 0.14 0.27
1.70 0.04 10.59 3.00 7.67 -1.51 1.52 1.90 0.38 0.91 4.00 0.16 0.32
2.00 0.04 12.31 3.35 7.81 1.70 1.77 2.16 0.40 0.95 4.46 0.18 0.33
2.15 0.04 12.48 3.53 7.68 3.26 1.87 2.24 0.37 0.92 5.00 0.18 0.34
2.00 0.04 11.43 3.25 7.61 0.82 1.69 2.06 0.37 0.91 4.56 0.17 0.33
2.50 0.05 14.91 4.06 7.74 7.64 2.22 2.59 0.37 0.96 5.92 0.23 0.39
2.70 0.04 15.43 4.23 7.67 8.90 2.35 2.71 0.36 0.96 6.49 0.22 0.38
3.00 0.04 16.29 4.51 7.76 10.97 2.50 2.86 0.36 0.94 6.98 0.25 0.39
3.20 0.04 17.20 4.73 7.82 12.49 2.63 2.98 0.35 0.96 7.57 0.26 0.39
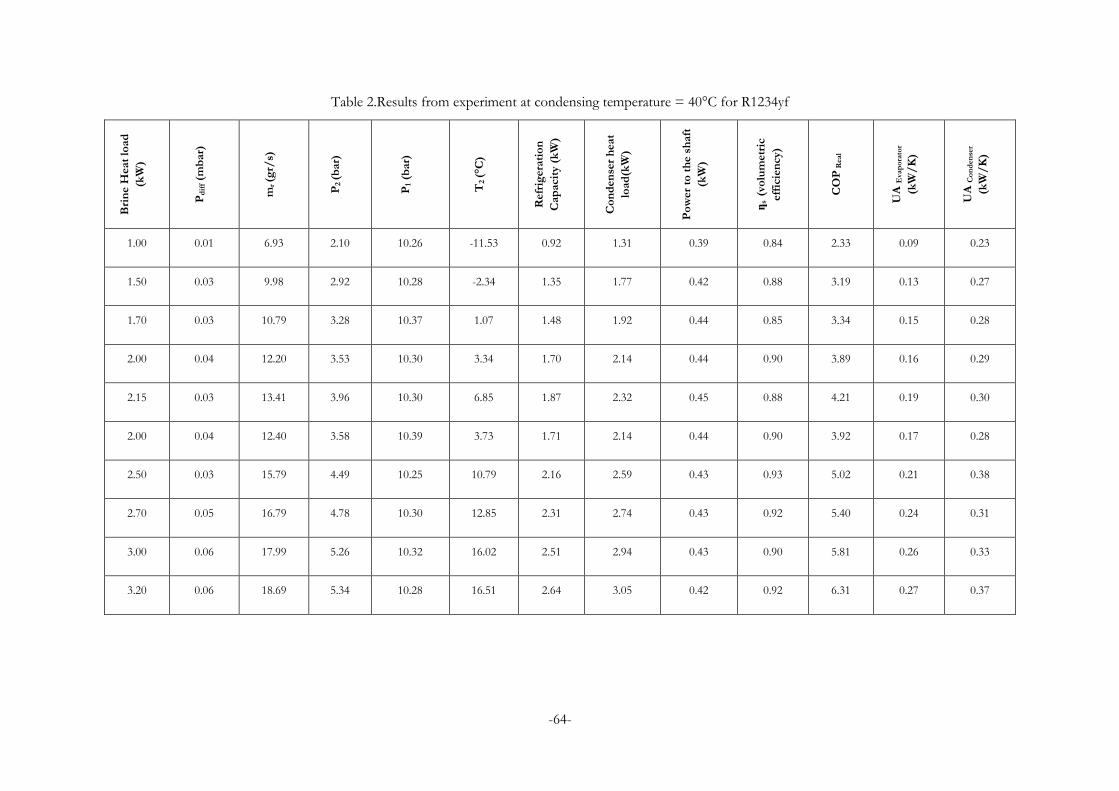
-64-
Table 2.Results from experiment at condensing temperature = 40°C for R1234yf
Bri
ne H
eat
load
(kW
)
Pd
iff (
mb
ar)
mr (g
r/s)
P2 (
bar)
P1
(bar)
T2 (
°C)
Refr
igera
tio
n
Cap
acit
y (
kW
)
Co
nd
en
ser
heat
load
(kW
)
Po
wer
to t
he s
haft
(kW
)
ƞs
(vo
lum
etr
ic
eff
icie
ncy)
CO
P R
eal
UA
Eva
po
rato
r
(kW
/K
)
UA
Co
nd
en
ser
(kW
/K
)
1.00 0.01 6.93 2.10 10.26 -11.53 0.92 1.31 0.39 0.84 2.33 0.09 0.23
1.50 0.03 9.98 2.92 10.28 -2.34 1.35 1.77 0.42 0.88 3.19 0.13 0.27
1.70 0.03 10.79 3.28 10.37 1.07 1.48 1.92 0.44 0.85 3.34 0.15 0.28
2.00 0.04 12.20 3.53 10.30 3.34 1.70 2.14 0.44 0.90 3.89 0.16 0.29
2.15 0.03 13.41 3.96 10.30 6.85 1.87 2.32 0.45 0.88 4.21 0.19 0.30
2.00 0.04 12.40 3.58 10.39 3.73 1.71 2.14 0.44 0.90 3.92 0.17 0.28
2.50 0.03 15.79 4.49 10.25 10.79 2.16 2.59 0.43 0.93 5.02 0.21 0.38
2.70 0.05 16.79 4.78 10.30 12.85 2.31 2.74 0.43 0.92 5.40 0.24 0.31
3.00 0.06 17.99 5.26 10.32 16.02 2.51 2.94 0.43 0.90 5.81 0.26 0.33
3.20 0.06 18.69 5.34 10.28 16.51 2.64 3.05 0.42 0.92 6.31 0.27 0.37
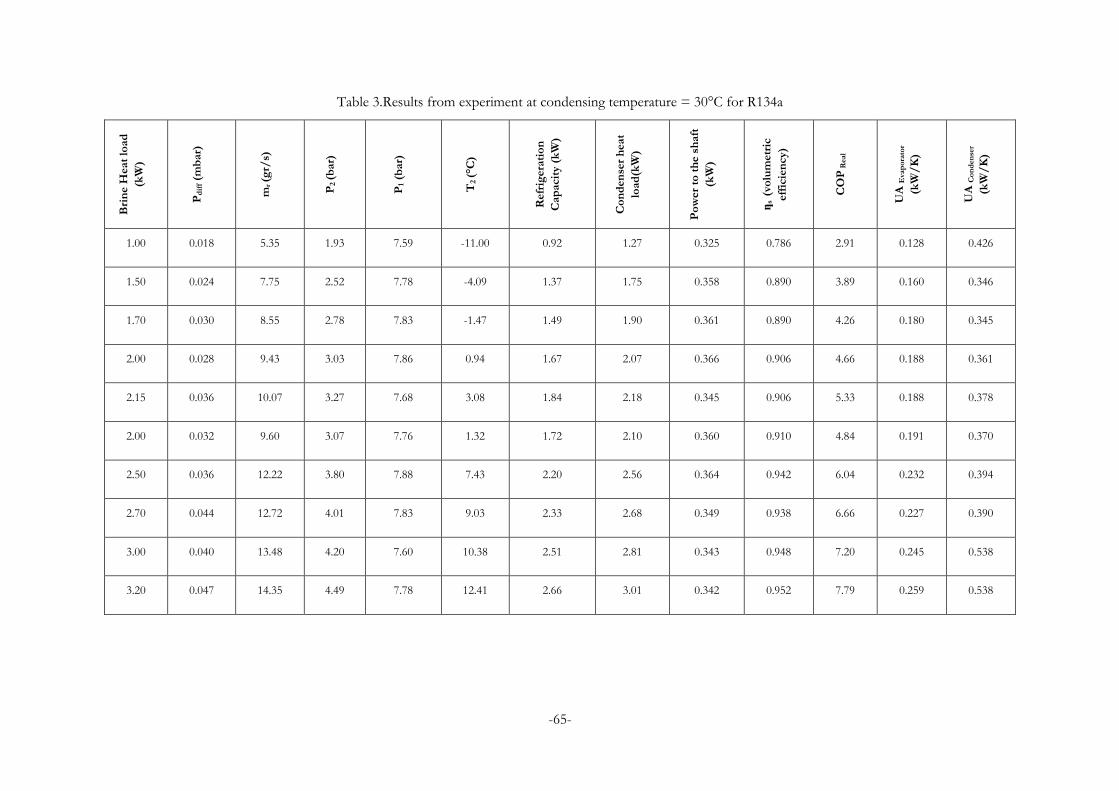
-65-
Table 3.Results from experiment at condensing temperature = 30°C for R134a
Bri
ne H
eat
load
(kW
)
Pd
iff (
mb
ar)
mr (g
r/s)
P2 (
bar)
P1
(bar)
T2 (
°C)
Refr
igera
tio
n
Cap
acit
y (
kW
)
Co
nd
en
ser
heat
load
(kW
)
Po
wer
to t
he s
haft
(kW
)
ƞs
(vo
lum
etr
ic
eff
icie
ncy)
CO
P R
eal
UA
Eva
po
rato
r
(kW
/K
)
UA
Co
nd
en
ser
(kW
/K
)
1.00 0.018 5.35 1.93 7.59 -11.00 0.92 1.27 0.325 0.786 2.91 0.128 0.426
1.50 0.024 7.75 2.52 7.78 -4.09 1.37 1.75 0.358 0.890 3.89 0.160 0.346
1.70 0.030 8.55 2.78 7.83 -1.47 1.49 1.90 0.361 0.890 4.26 0.180 0.345
2.00 0.028 9.43 3.03 7.86 0.94 1.67 2.07 0.366 0.906 4.66 0.188 0.361
2.15 0.036 10.07 3.27 7.68 3.08 1.84 2.18 0.345 0.906 5.33 0.188 0.378
2.00 0.032 9.60 3.07 7.76 1.32 1.72 2.10 0.360 0.910 4.84 0.191 0.370
2.50 0.036 12.22 3.80 7.88 7.43 2.20 2.56 0.364 0.942 6.04 0.232 0.394
2.70 0.044 12.72 4.01 7.83 9.03 2.33 2.68 0.349 0.938 6.66 0.227 0.390
3.00 0.040 13.48 4.20 7.60 10.38 2.51 2.81 0.343 0.948 7.20 0.245 0.538
3.20 0.047 14.35 4.49 7.78 12.41 2.66 3.01 0.342 0.952 7.79 0.259 0.538
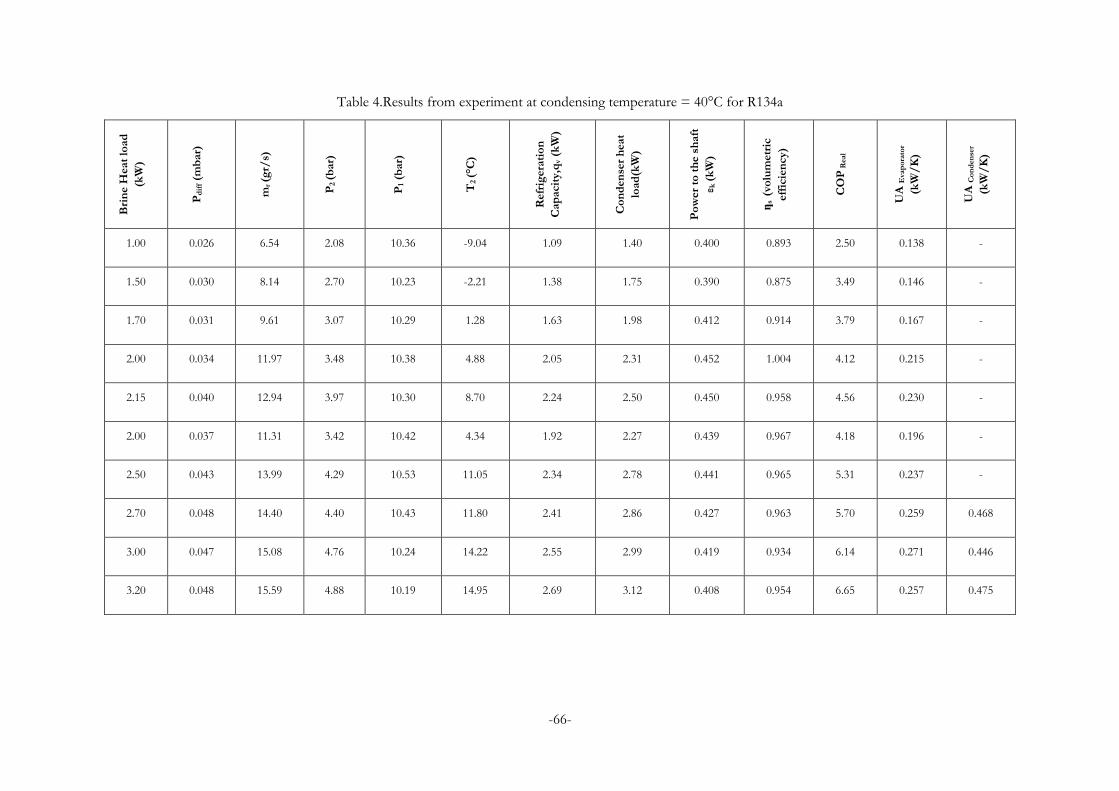
-66-
Table 4.Results from experiment at condensing temperature = 40°C for R134a
Bri
ne H
eat
load
(kW
)
Pd
iff (
mb
ar)
mr (g
r/s)
P2 (
bar)
P1
(bar)
T2 (
°C)
Refr
igera
tio
n
Cap
acit
y,q
v (
kW
)
Co
nd
en
ser
heat
load
(kW
)
Po
wer
to t
he s
haft
ε k (
kW
)
ƞs
(vo
lum
etr
ic
eff
icie
ncy)
CO
P R
eal
UA
Eva
po
rato
r
(kW
/K
)
UA
Co
nd
en
ser
(kW
/K
)
1.00 0.026 6.54 2.08 10.36 -9.04 1.09 1.40 0.400 0.893 2.50 0.138 -
1.50 0.030 8.14 2.70 10.23 -2.21 1.38 1.75 0.390 0.875 3.49 0.146 -
1.70 0.031 9.61 3.07 10.29 1.28 1.63 1.98 0.412 0.914 3.79 0.167 -
2.00 0.034 11.97 3.48 10.38 4.88 2.05 2.31 0.452 1.004 4.12 0.215 -
2.15 0.040 12.94 3.97 10.30 8.70 2.24 2.50 0.450 0.958 4.56 0.230 -
2.00 0.037 11.31 3.42 10.42 4.34 1.92 2.27 0.439 0.967 4.18 0.196 -
2.50 0.043 13.99 4.29 10.53 11.05 2.34 2.78 0.441 0.965 5.31 0.237 -
2.70 0.048 14.40 4.40 10.43 11.80 2.41 2.86 0.427 0.963 5.70 0.259 0.468
3.00 0.047 15.08 4.76 10.24 14.22 2.55 2.99 0.419 0.934 6.14 0.271 0.446
3.20 0.048 15.59 4.88 10.19 14.95 2.69 3.12 0.408 0.954 6.65 0.257 0.475
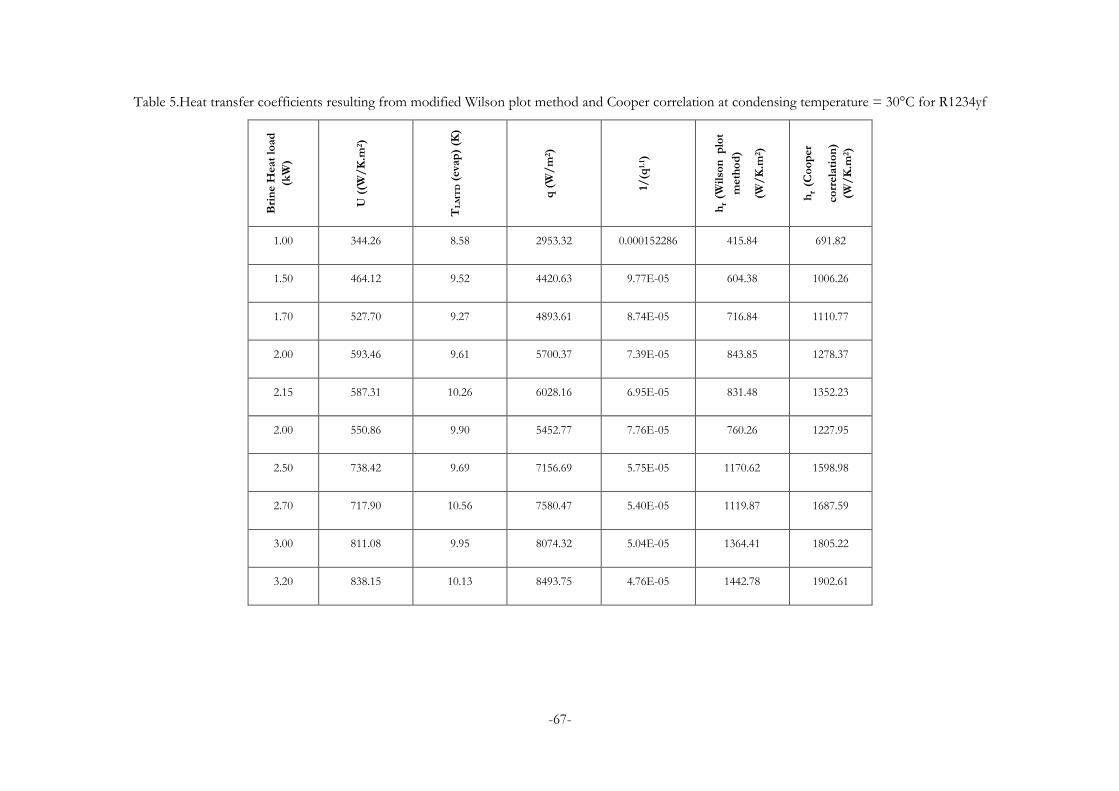
-67-
Table 5.Heat transfer coefficients resulting from modified Wilson plot method and Cooper correlation at condensing temperature = 30°C for R1234yf
Bri
ne H
eat
load
(kW
)
U (
(W/
K.m
2)
TL
MT
D (
eva
p)
(K)
q (
W/
m2)
1/(q
1.1 )
hr
(Wil
son
p
lot
meth
od
)
(W/
K.m
2)
hr (
Co
op
er
co
rrela
tio
n)
(W/
K.m
2)
1.00 344.26 8.58 2953.32 0.000152286 415.84 691.82
1.50 464.12 9.52 4420.63 9.77E-05 604.38 1006.26
1.70 527.70 9.27 4893.61 8.74E-05 716.84 1110.77
2.00 593.46 9.61 5700.37 7.39E-05 843.85 1278.37
2.15 587.31 10.26 6028.16 6.95E-05 831.48 1352.23
2.00 550.86 9.90 5452.77 7.76E-05 760.26 1227.95
2.50 738.42 9.69 7156.69 5.75E-05 1170.62 1598.98
2.70 717.90 10.56 7580.47 5.40E-05 1119.87 1687.59
3.00 811.08 9.95 8074.32 5.04E-05 1364.41 1805.22
3.20 838.15 10.13 8493.75 4.76E-05 1442.78 1902.61
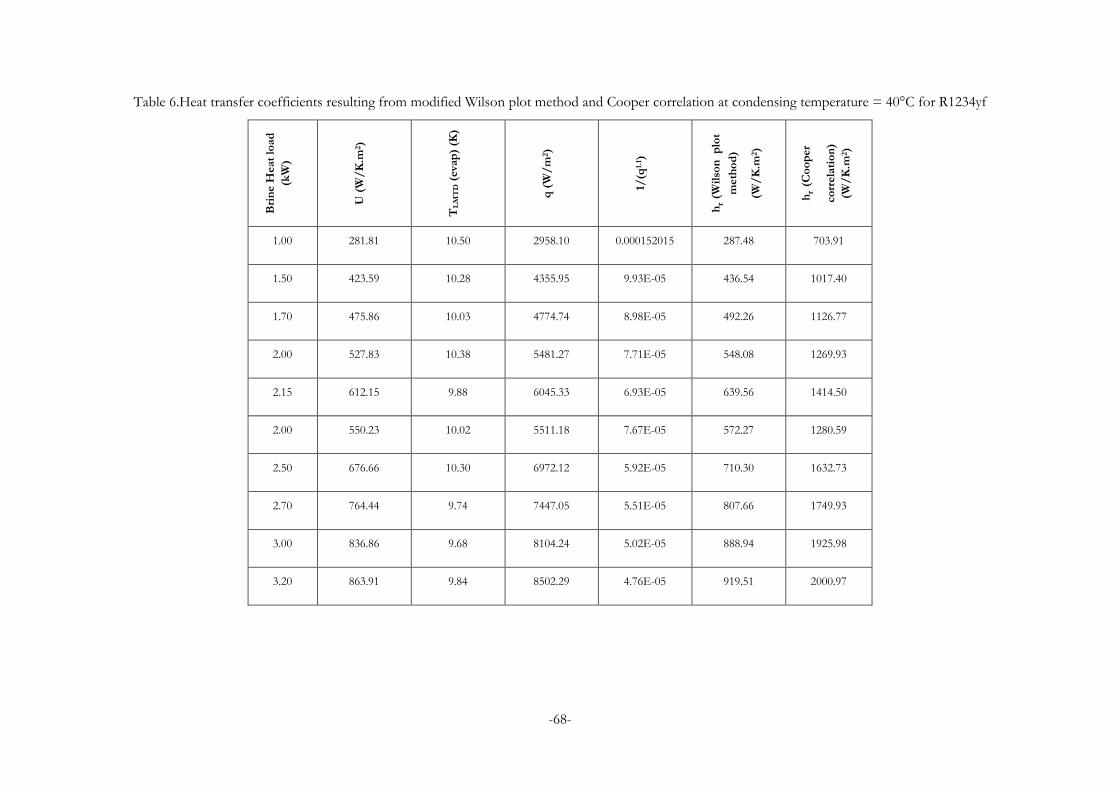
-68-
Table 6.Heat transfer coefficients resulting from modified Wilson plot method and Cooper correlation at condensing temperature = 40°C for R1234yf
Bri
ne H
eat
load
(kW
)
U (
W/
K.m
2)
TL
MT
D (
eva
p)
(K)
q (
W/
m2)
1/(q
1.1 )
hr
(Wil
son
p
lot
meth
od
)
(W/
K.m
2)
hr (
Co
op
er
co
rrela
tio
n)
(W/
K.m
2)
1.00 281.81 10.50 2958.10 0.000152015 287.48 703.91
1.50 423.59 10.28 4355.95 9.93E-05 436.54 1017.40
1.70 475.86 10.03 4774.74 8.98E-05 492.26 1126.77
2.00 527.83 10.38 5481.27 7.71E-05 548.08 1269.93
2.15 612.15 9.88 6045.33 6.93E-05 639.56 1414.50
2.00 550.23 10.02 5511.18 7.67E-05 572.27 1280.59
2.50 676.66 10.30 6972.12 5.92E-05 710.30 1632.73
2.70 764.44 9.74 7447.05 5.51E-05 807.66 1749.93
3.00 836.86 9.68 8104.24 5.02E-05 888.94 1925.98
3.20 863.91 9.84 8502.29 4.76E-05 919.51 2000.97
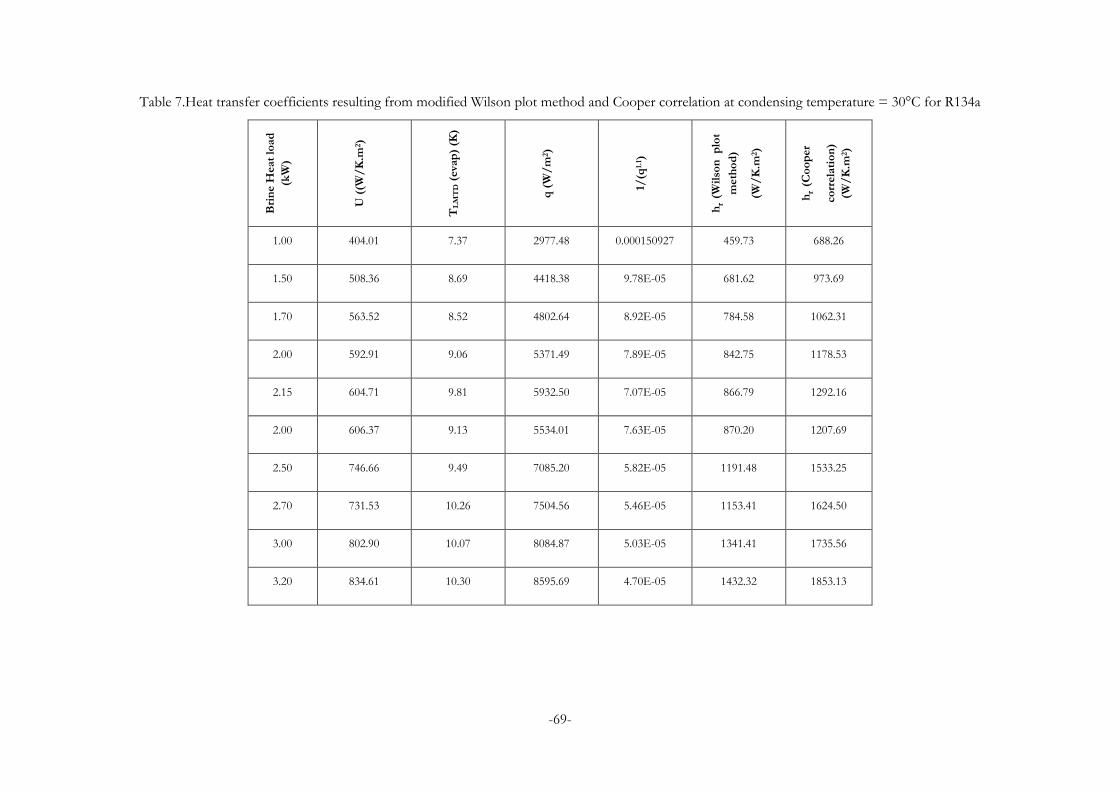
-69-
Table 7.Heat transfer coefficients resulting from modified Wilson plot method and Cooper correlation at condensing temperature = 30°C for R134a
Bri
ne H
eat
load
(kW
)
U (
(W/
K.m
2)
TL
MT
D (
eva
p)
(K)
q (
W/
m2)
1/(q
1.1 )
hr (W
ilso
n
plo
t
meth
od
)
(W/
K.m
2)
hr (
Co
op
er
co
rrela
tio
n)
(W/
K.m
2)
1.00 404.01 7.37 2977.48 0.000150927 459.73 688.26
1.50 508.36 8.69 4418.38 9.78E-05 681.62 973.69
1.70 563.52 8.52 4802.64 8.92E-05 784.58 1062.31
2.00 592.91 9.06 5371.49 7.89E-05 842.75 1178.53
2.15 604.71 9.81 5932.50 7.07E-05 866.79 1292.16
2.00 606.37 9.13 5534.01 7.63E-05 870.20 1207.69
2.50 746.66 9.49 7085.20 5.82E-05 1191.48 1533.25
2.70 731.53 10.26 7504.56 5.46E-05 1153.41 1624.50
3.00 802.90 10.07 8084.87 5.03E-05 1341.41 1735.56
3.20 834.61 10.30 8595.69 4.70E-05 1432.32 1853.13
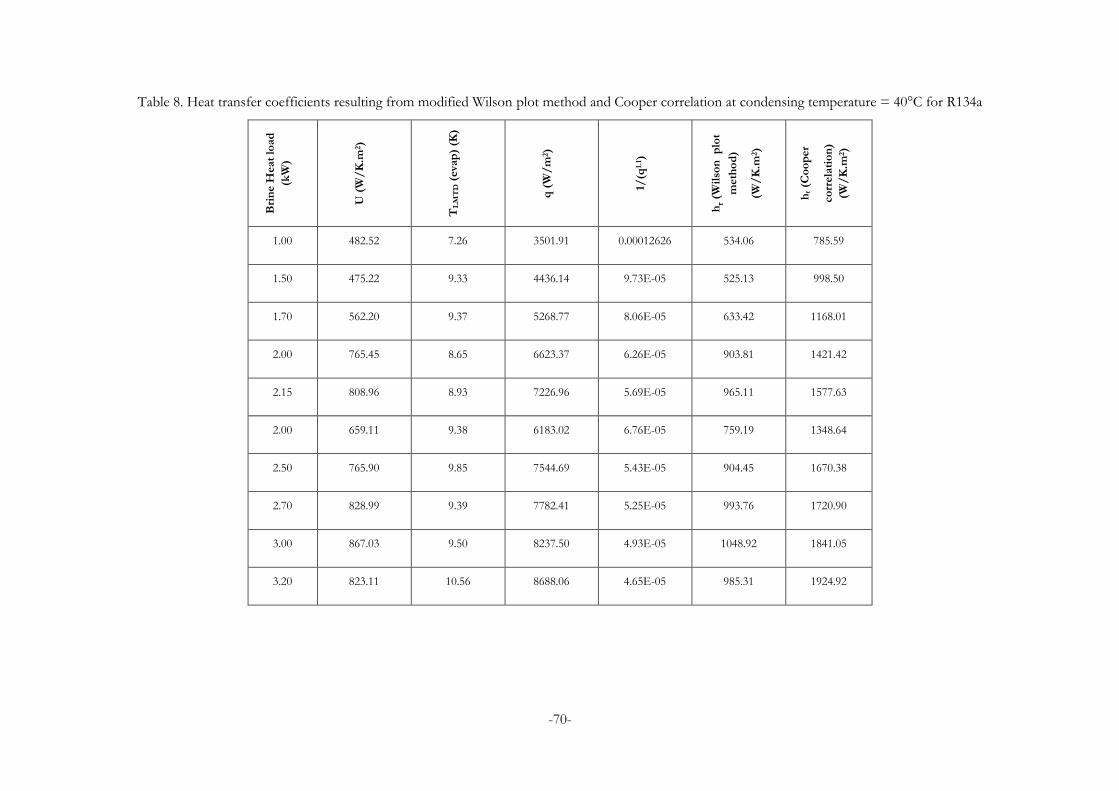
-70-
Table 8. Heat transfer coefficients resulting from modified Wilson plot method and Cooper correlation at condensing temperature = 40°C for R134a
Bri
ne H
eat
load
(kW
)
U (
W/
K.m
2)
TL
MT
D (
eva
p)
(K)
q (
W/
m2)
1/(q
1.1 )
hr
(Wil
son
p
lot
meth
od
)
(W/
K.m
2)
hr (C
oo
per
co
rrela
tio
n)
(W/
K.m
2)
1.00 482.52 7.26 3501.91 0.00012626 534.06 785.59
1.50 475.22 9.33 4436.14 9.73E-05 525.13 998.50
1.70 562.20 9.37 5268.77 8.06E-05 633.42 1168.01
2.00 765.45 8.65 6623.37 6.26E-05 903.81 1421.42
2.15 808.96 8.93 7226.96 5.69E-05 965.11 1577.63
2.00 659.11 9.38 6183.02 6.76E-05 759.19 1348.64
2.50 765.90 9.85 7544.69 5.43E-05 904.45 1670.38
2.70 828.99 9.39 7782.41 5.25E-05 993.76 1720.90
3.00 867.03 9.50 8237.50 4.93E-05 1048.92 1841.05
3.20 823.11 10.56 8688.06 4.65E-05 985.31 1924.92
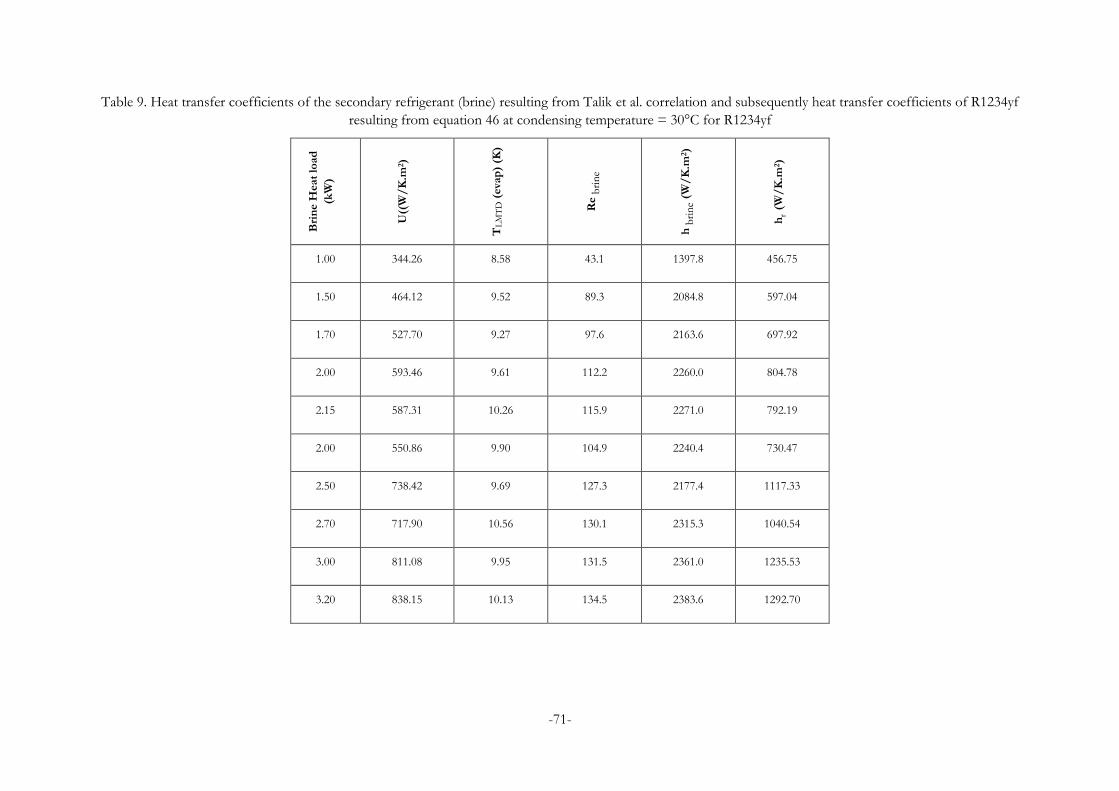
-71-
Table 9. Heat transfer coefficients of the secondary refrigerant (brine) resulting from Talik et al. correlation and subsequently heat transfer coefficients of R1234yf
resulting from equation 46 at condensing temperature = 30°C for R1234yf
Bri
ne H
eat
load
(kW
)
U((
W/
K.m
2)
TL
MT
D (
eva
p)
(K)
Re b
rin
e
h b
rin
e (W
/K
.m2)
hr (
W/
K.m
2)
1.00 344.26 8.58 43.1 1397.8 456.75
1.50 464.12 9.52 89.3 2084.8 597.04
1.70 527.70 9.27 97.6 2163.6 697.92
2.00 593.46 9.61 112.2 2260.0 804.78
2.15 587.31 10.26 115.9 2271.0 792.19
2.00 550.86 9.90 104.9 2240.4 730.47
2.50 738.42 9.69 127.3 2177.4 1117.33
2.70 717.90 10.56 130.1 2315.3 1040.54
3.00 811.08 9.95 131.5 2361.0 1235.53
3.20 838.15 10.13 134.5 2383.6 1292.70
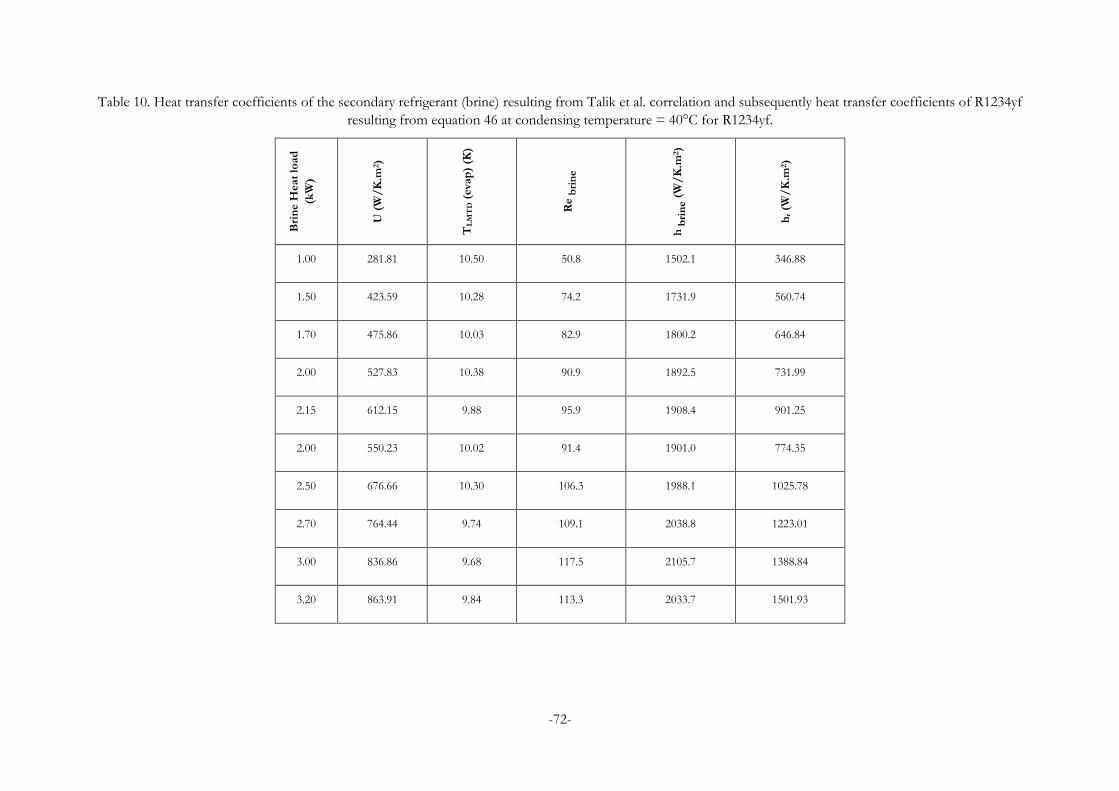
-72-
Table 10. Heat transfer coefficients of the secondary refrigerant (brine) resulting from Talik et al. correlation and subsequently heat transfer coefficients of R1234yf
resulting from equation 46 at condensing temperature = 40°C for R1234yf.
Bri
ne H
eat
load
(kW
)
U (
W/
K.m
2)
TL
MT
D (
eva
p)
(K)
Re b
rin
e
h b
rin
e (
W/
K.m
2)
hr (W
/K
.m2)
1.00 281.81 10.50 50.8 1502.1 346.88
1.50 423.59 10.28 74.2 1731.9 560.74
1.70 475.86 10.03 82.9 1800.2 646.84
2.00 527.83 10.38 90.9 1892.5 731.99
2.15 612.15 9.88 95.9 1908.4 901.25
2.00 550.23 10.02 91.4 1901.0 774.35
2.50 676.66 10.30 106.3 1988.1 1025.78
2.70 764.44 9.74 109.1 2038.8 1223.01
3.00 836.86 9.68 117.5 2105.7 1388.84
3.20 863.91 9.84 113.3 2033.7 1501.93
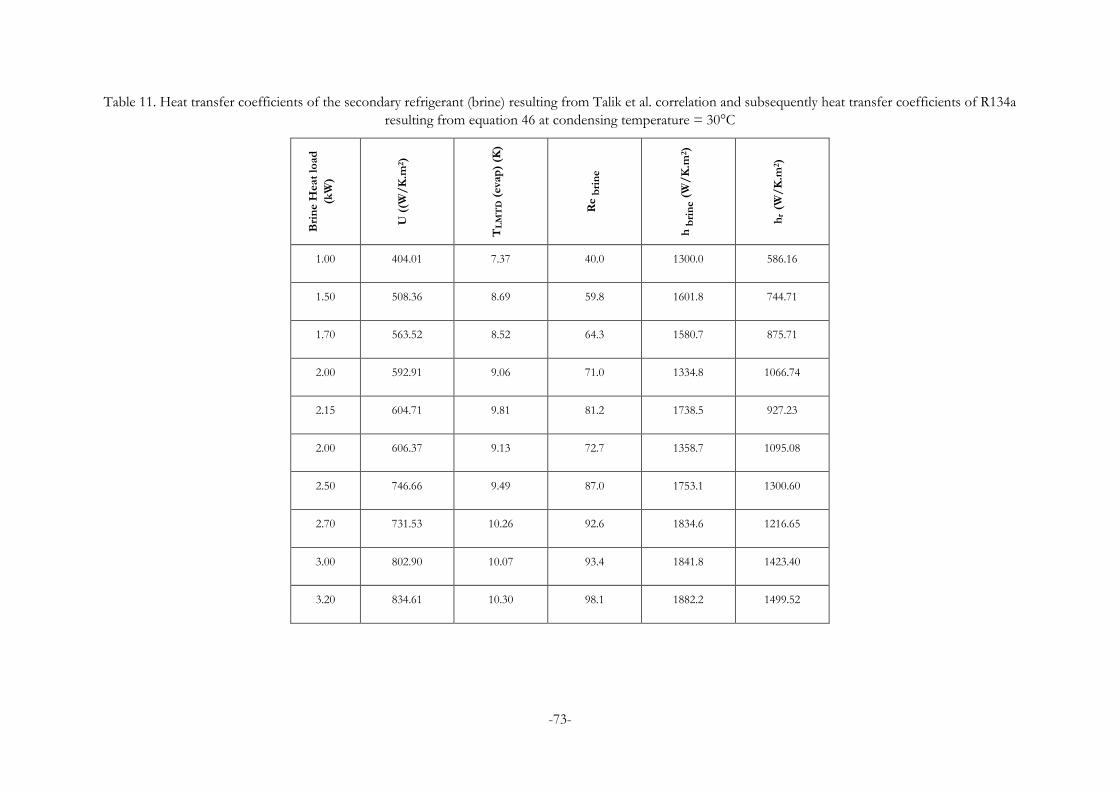
-73-
Table 11. Heat transfer coefficients of the secondary refrigerant (brine) resulting from Talik et al. correlation and subsequently heat transfer coefficients of R134a
resulting from equation 46 at condensing temperature = 30°C
Bri
ne H
eat
load
(kW
)
U (
(W/
K.m
2)
TL
MT
D (
eva
p)
(K)
Re b
rin
e
h b
rin
e (
W/
K.m
2)
hr (
W/
K.m
2)
1.00 404.01 7.37 40.0 1300.0 586.16
1.50 508.36 8.69 59.8 1601.8 744.71
1.70 563.52 8.52 64.3 1580.7 875.71
2.00 592.91 9.06 71.0 1334.8 1066.74
2.15 604.71 9.81 81.2 1738.5 927.23
2.00 606.37 9.13 72.7 1358.7 1095.08
2.50 746.66 9.49 87.0 1753.1 1300.60
2.70 731.53 10.26 92.6 1834.6 1216.65
3.00 802.90 10.07 93.4 1841.8 1423.40
3.20 834.61 10.30 98.1 1882.2 1499.52
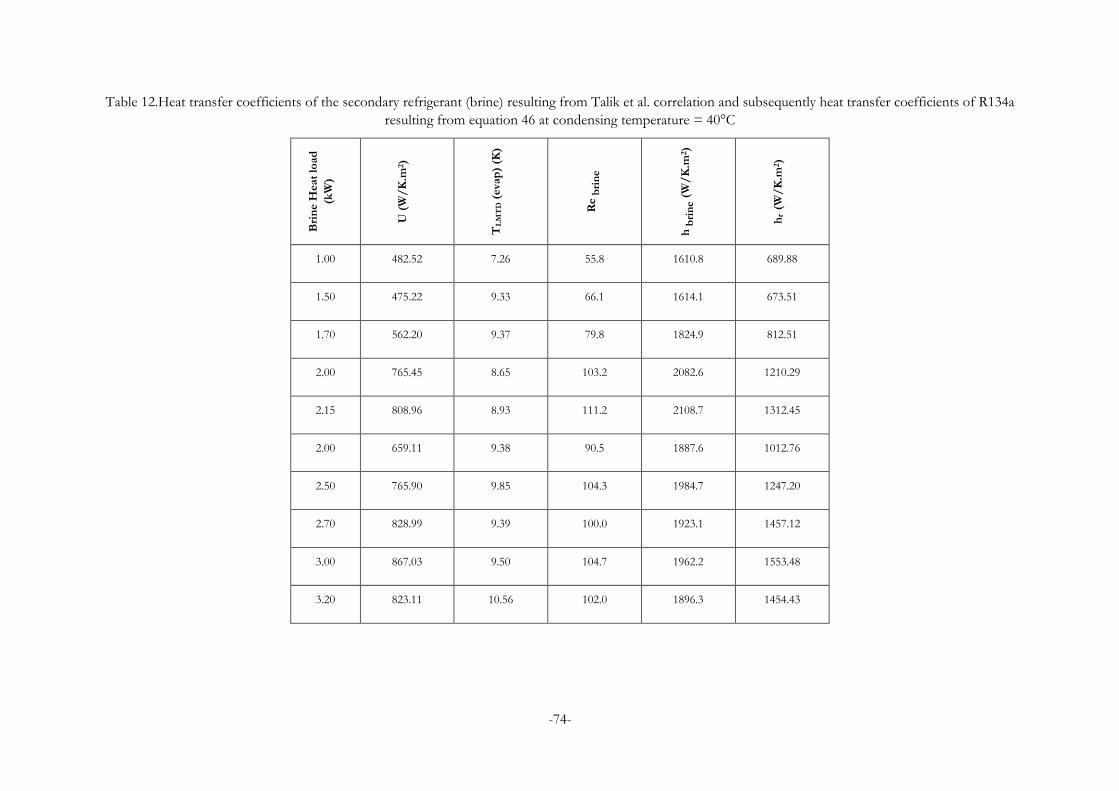
-74-
Table 12.Heat transfer coefficients of the secondary refrigerant (brine) resulting from Talik et al. correlation and subsequently heat transfer coefficients of R134a
resulting from equation 46 at condensing temperature = 40°C
Bri
ne H
eat
load
(kW
)
U (
W/
K.m
2)
TL
MT
D (
eva
p)
(K)
Re b
rin
e
h b
rin
e (
W/
K.m
2)
hr (
W/
K.m
2)
1.00 482.52 7.26 55.8 1610.8 689.88
1.50 475.22 9.33 66.1 1614.1 673.51
1.70 562.20 9.37 79.8 1824.9 812.51
2.00 765.45 8.65 103.2 2082.6 1210.29
2.15 808.96 8.93 111.2 2108.7 1312.45
2.00 659.11 9.38 90.5 1887.6 1012.76
2.50 765.90 9.85 104.3 1984.7 1247.20
2.70 828.99 9.39 100.0 1923.1 1457.12
3.00 867.03 9.50 104.7 1962.2 1553.48
3.20 823.11 10.56 102.0 1896.3 1454.43
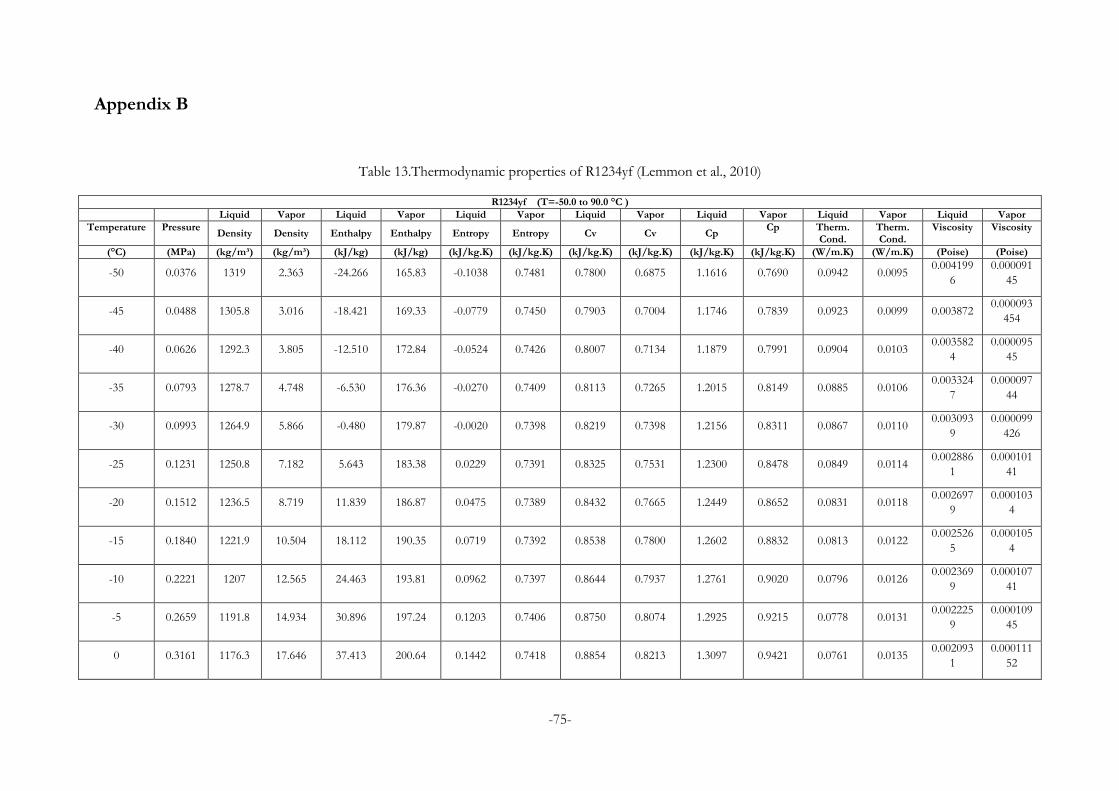
-75-
Appendix B
Table 13.Thermodynamic properties of R1234yf (Lemmon et al., 2010)
R1234yf (T=-50.0 to 90.0 °C )
Liquid Vapor Liquid Vapor Liquid Vapor Liquid Vapor Liquid Vapor Liquid Vapor Liquid Vapor
Temperature Pressure Density Density Enthalpy Enthalpy Entropy Entropy Cv Cv Cp
Cp Therm. Cond.
Therm. Cond.
Viscosity Viscosity
(°C) (MPa) (kg/m³) (kg/m³) (kJ/kg) (kJ/kg) (kJ/kg.K) (kJ/kg.K) (kJ/kg.K) (kJ/kg.K) (kJ/kg.K) (kJ/kg.K) (W/m.K) (W/m.K) (Poise) (Poise)
-50 0.0376 1319 2.363 -24.266 165.83 -0.1038 0.7481 0.7800 0.6875 1.1616 0.7690 0.0942 0.0095 0.004199
6
0.000091
45
-45 0.0488 1305.8 3.016 -18.421 169.33 -0.0779 0.7450 0.7903 0.7004 1.1746 0.7839 0.0923 0.0099 0.003872 0.000093
454
-40 0.0626 1292.3 3.805 -12.510 172.84 -0.0524 0.7426 0.8007 0.7134 1.1879 0.7991 0.0904 0.0103 0.003582
4
0.000095
45
-35 0.0793 1278.7 4.748 -6.530 176.36 -0.0270 0.7409 0.8113 0.7265 1.2015 0.8149 0.0885 0.0106 0.003324
7
0.000097
44
-30 0.0993 1264.9 5.866 -0.480 179.87 -0.0020 0.7398 0.8219 0.7398 1.2156 0.8311 0.0867 0.0110 0.003093
9
0.000099
426
-25 0.1231 1250.8 7.182 5.643 183.38 0.0229 0.7391 0.8325 0.7531 1.2300 0.8478 0.0849 0.0114 0.002886
1
0.000101
41
-20 0.1512 1236.5 8.719 11.839 186.87 0.0475 0.7389 0.8432 0.7665 1.2449 0.8652 0.0831 0.0118 0.002697
9
0.000103
4
-15 0.1840 1221.9 10.504 18.112 190.35 0.0719 0.7392 0.8538 0.7800 1.2602 0.8832 0.0813 0.0122 0.002526
5
0.000105
4
-10 0.2221 1207 12.565 24.463 193.81 0.0962 0.7397 0.8644 0.7937 1.2761 0.9020 0.0796 0.0126 0.002369
9
0.000107
41
-5 0.2659 1191.8 14.934 30.896 197.24 0.1203 0.7406 0.8750 0.8074 1.2925 0.9215 0.0778 0.0131 0.002225
9
0.000109
45
0 0.3161 1176.3 17.646 37.413 200.64 0.1442 0.7418 0.8854 0.8213 1.3097 0.9421 0.0761 0.0135 0.002093
1
0.000111
52
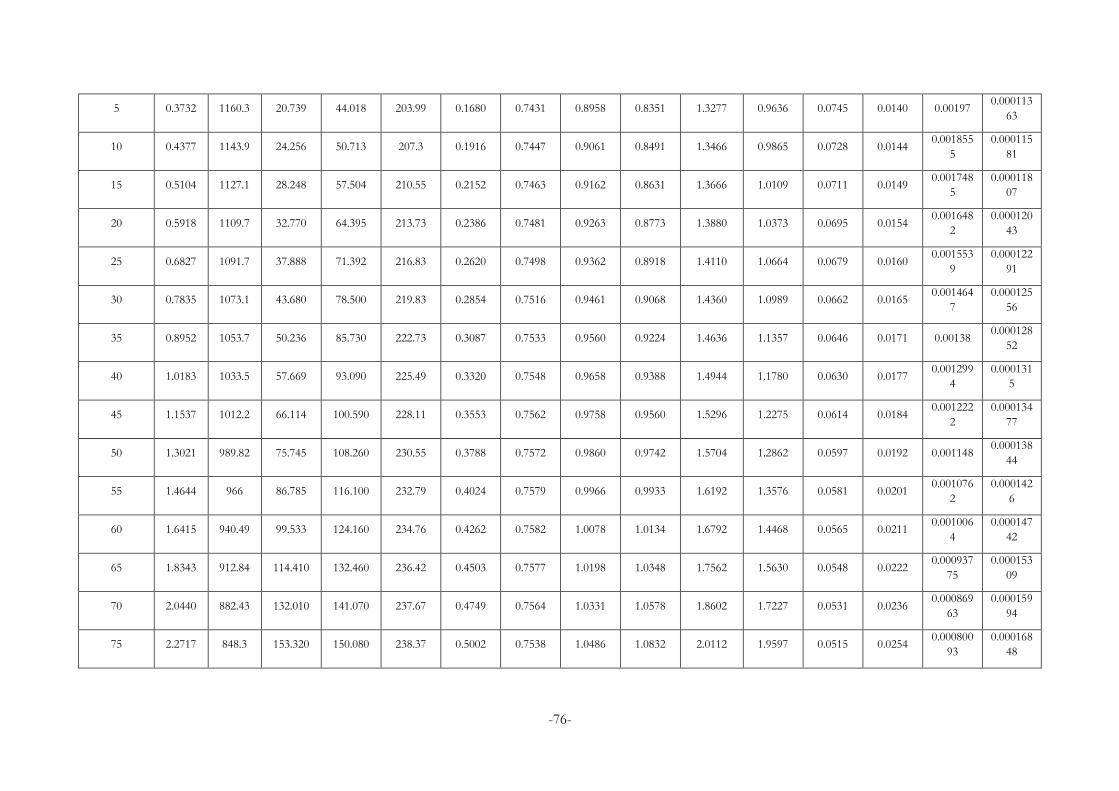
-76-
5 0.3732 1160.3 20.739 44.018 203.99 0.1680 0.7431 0.8958 0.8351 1.3277 0.9636 0.0745 0.0140 0.00197 0.000113
63
10 0.4377 1143.9 24.256 50.713 207.3 0.1916 0.7447 0.9061 0.8491 1.3466 0.9865 0.0728 0.0144 0.001855
5
0.000115
81
15 0.5104 1127.1 28.248 57.504 210.55 0.2152 0.7463 0.9162 0.8631 1.3666 1.0109 0.0711 0.0149 0.001748
5
0.000118
07
20 0.5918 1109.7 32.770 64.395 213.73 0.2386 0.7481 0.9263 0.8773 1.3880 1.0373 0.0695 0.0154 0.001648
2
0.000120
43
25 0.6827 1091.7 37.888 71.392 216.83 0.2620 0.7498 0.9362 0.8918 1.4110 1.0664 0.0679 0.0160 0.001553
9
0.000122
91
30 0.7835 1073.1 43.680 78.500 219.83 0.2854 0.7516 0.9461 0.9068 1.4360 1.0989 0.0662 0.0165 0.001464
7
0.000125
56
35 0.8952 1053.7 50.236 85.730 222.73 0.3087 0.7533 0.9560 0.9224 1.4636 1.1357 0.0646 0.0171 0.00138 0.000128
52
40 1.0183 1033.5 57.669 93.090 225.49 0.3320 0.7548 0.9658 0.9388 1.4944 1.1780 0.0630 0.0177 0.001299
4
0.000131
5
45 1.1537 1012.2 66.114 100.590 228.11 0.3553 0.7562 0.9758 0.9560 1.5296 1.2275 0.0614 0.0184 0.001222
2
0.000134
77
50 1.3021 989.82 75.745 108.260 230.55 0.3788 0.7572 0.9860 0.9742 1.5704 1.2862 0.0597 0.0192 0.001148 0.000138
44
55 1.4644 966 86.785 116.100 232.79 0.4024 0.7579 0.9966 0.9933 1.6192 1.3576 0.0581 0.0201 0.001076
2
0.000142
6
60 1.6415 940.49 99.533 124.160 234.76 0.4262 0.7582 1.0078 1.0134 1.6792 1.4468 0.0565 0.0211 0.001006
4
0.000147
42
65 1.8343 912.84 114.410 132.460 236.42 0.4503 0.7577 1.0198 1.0348 1.7562 1.5630 0.0548 0.0222 0.000937
75
0.000153
09
70 2.0440 882.43 132.010 141.070 237.67 0.4749 0.7564 1.0331 1.0578 1.8602 1.7227 0.0531 0.0236 0.000869
63
0.000159
94
75 2.2717 848.3 153.320 150.080 238.37 0.5002 0.7538 1.0486 1.0832 2.0112 1.9597 0.0515 0.0254 0.000800
93
0.000168
48
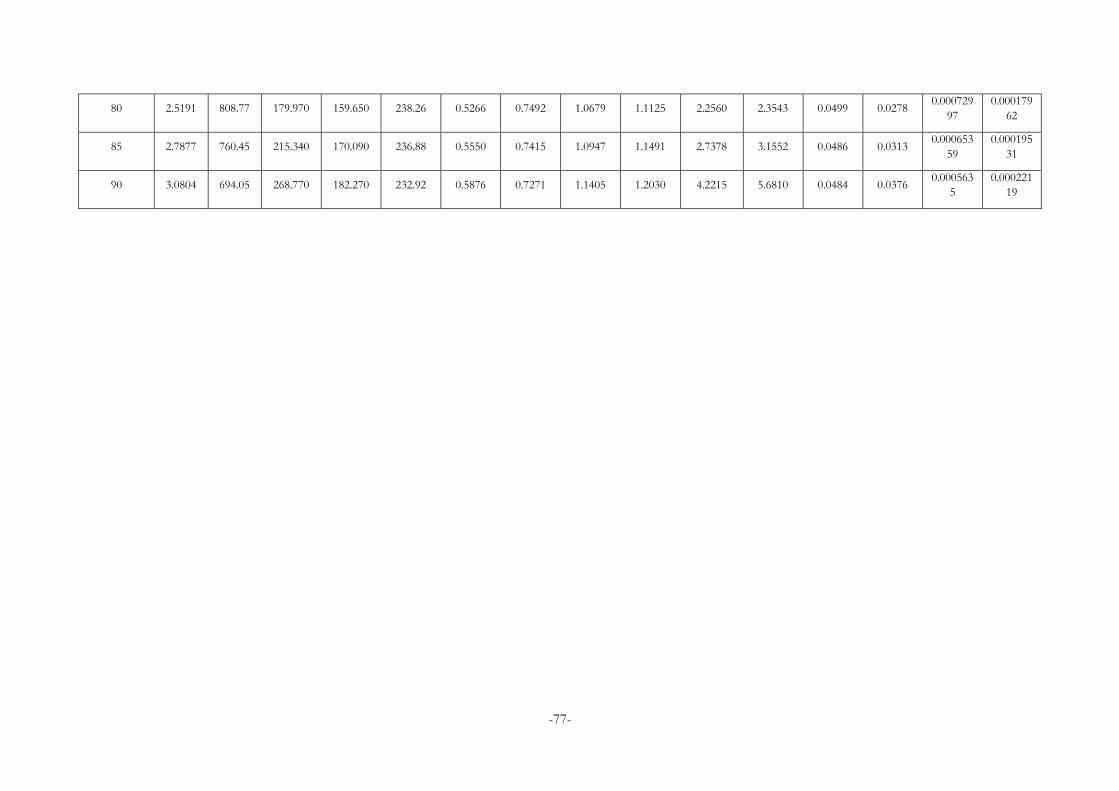
-77-
80 2.5191 808.77 179.970 159.650 238.26 0.5266 0.7492 1.0679 1.1125 2.2560 2.3543 0.0499 0.0278 0.000729
97
0.000179
62
85 2.7877 760.45 215.340 170.090 236.88 0.5550 0.7415 1.0947 1.1491 2.7378 3.1552 0.0486 0.0313 0.000653
59
0.000195
31
90 3.0804 694.05 268.770 182.270 232.92 0.5876 0.7271 1.1405 1.2030 4.2215 5.6810 0.0484 0.0376 0.000563
5
0.000221
19
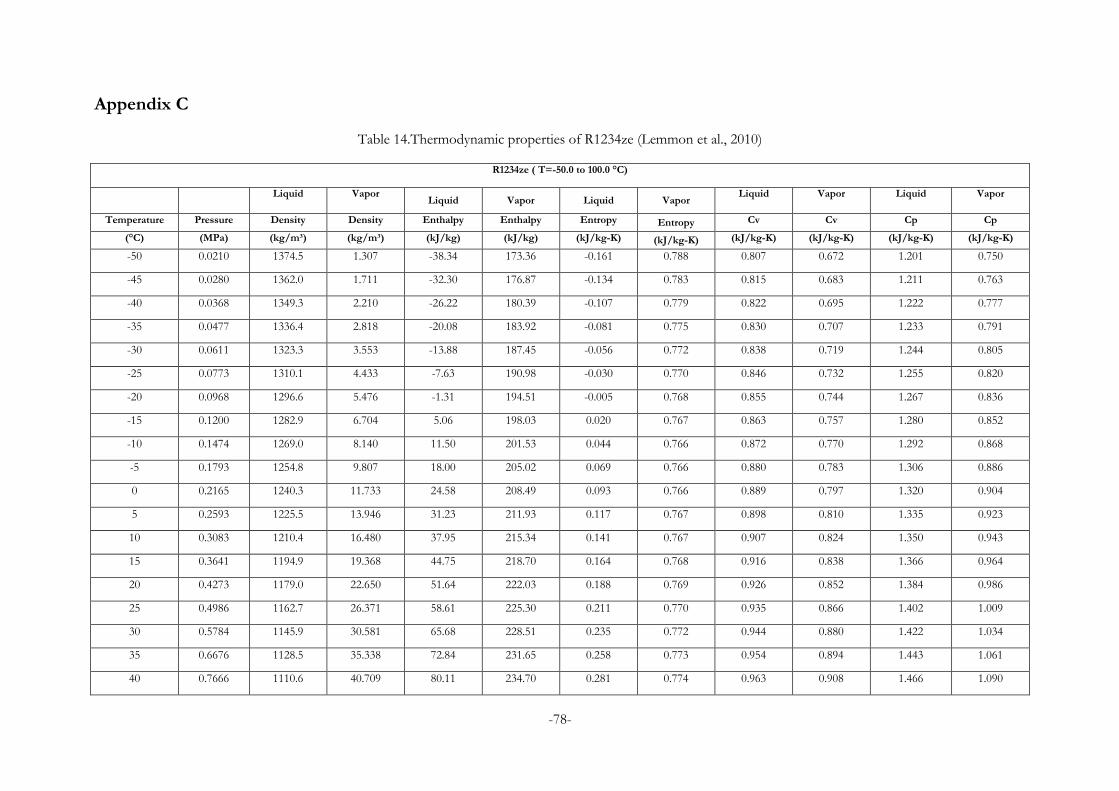
-78-
Appendix C
Table 14.Thermodynamic properties of R1234ze (Lemmon et al., 2010)
R1234ze ( T=-50.0 to 100.0 °C)
Liquid Vapor Liquid Vapor Liquid Vapor
Liquid Vapor Liquid Vapor
Temperature Pressure Density Density Enthalpy Enthalpy Entropy Entropy Cv Cv Cp Cp
(°C) (MPa) (kg/m³) (kg/m³) (kJ/kg) (kJ/kg) (kJ/kg-K) (kJ/kg-K) (kJ/kg-K) (kJ/kg-K) (kJ/kg-K) (kJ/kg-K)
-50 0.0210 1374.5 1.307 -38.34 173.36 -0.161 0.788 0.807 0.672 1.201 0.750
-45 0.0280 1362.0 1.711 -32.30 176.87 -0.134 0.783 0.815 0.683 1.211 0.763
-40 0.0368 1349.3 2.210 -26.22 180.39 -0.107 0.779 0.822 0.695 1.222 0.777
-35 0.0477 1336.4 2.818 -20.08 183.92 -0.081 0.775 0.830 0.707 1.233 0.791
-30 0.0611 1323.3 3.553 -13.88 187.45 -0.056 0.772 0.838 0.719 1.244 0.805
-25 0.0773 1310.1 4.433 -7.63 190.98 -0.030 0.770 0.846 0.732 1.255 0.820
-20 0.0968 1296.6 5.476 -1.31 194.51 -0.005 0.768 0.855 0.744 1.267 0.836
-15 0.1200 1282.9 6.704 5.06 198.03 0.020 0.767 0.863 0.757 1.280 0.852
-10 0.1474 1269.0 8.140 11.50 201.53 0.044 0.766 0.872 0.770 1.292 0.868
-5 0.1793 1254.8 9.807 18.00 205.02 0.069 0.766 0.880 0.783 1.306 0.886
0 0.2165 1240.3 11.733 24.58 208.49 0.093 0.766 0.889 0.797 1.320 0.904
5 0.2593 1225.5 13.946 31.23 211.93 0.117 0.767 0.898 0.810 1.335 0.923
10 0.3083 1210.4 16.480 37.95 215.34 0.141 0.767 0.907 0.824 1.350 0.943
15 0.3641 1194.9 19.368 44.75 218.70 0.164 0.768 0.916 0.838 1.366 0.964
20 0.4273 1179.0 22.650 51.64 222.03 0.188 0.769 0.926 0.852 1.384 0.986
25 0.4986 1162.7 26.371 58.61 225.30 0.211 0.770 0.935 0.866 1.402 1.009
30 0.5784 1145.9 30.581 65.68 228.51 0.235 0.772 0.944 0.880 1.422 1.034
35 0.6676 1128.5 35.338 72.84 231.65 0.258 0.773 0.954 0.894 1.443 1.061
40 0.7666 1110.6 40.709 80.11 234.70 0.281 0.774 0.963 0.908 1.466 1.090
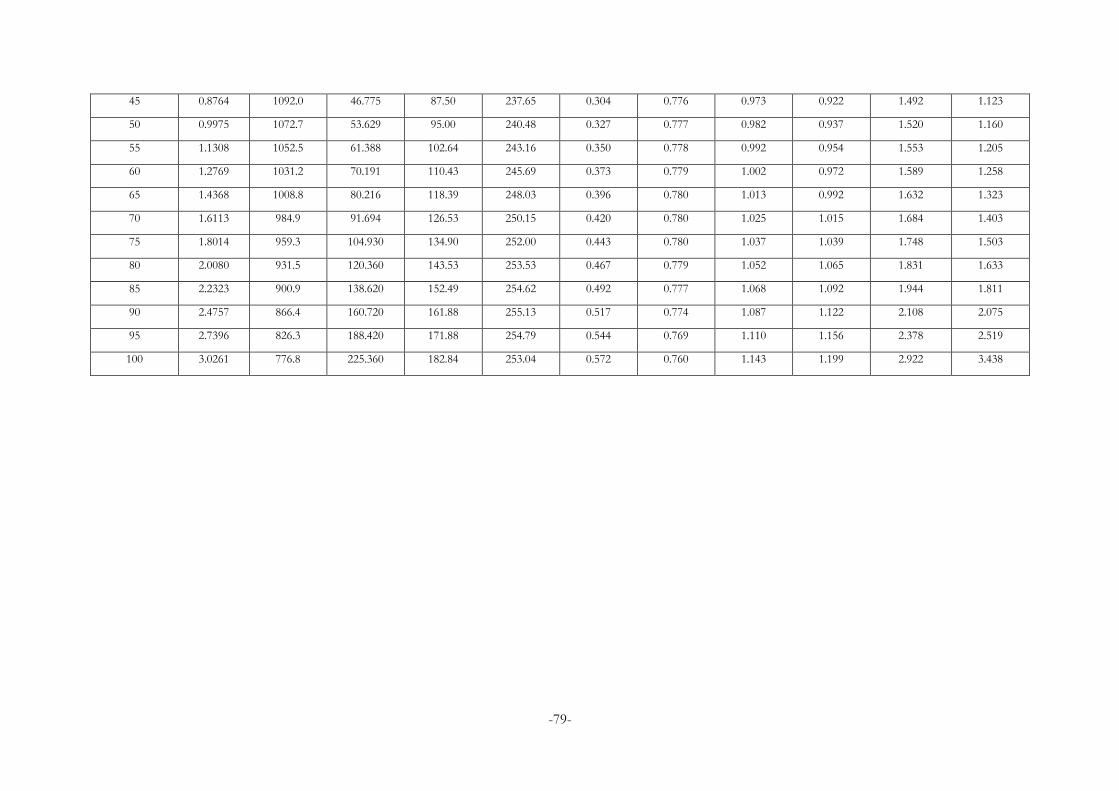
-79-
45 0.8764 1092.0 46.775 87.50 237.65 0.304 0.776 0.973 0.922 1.492 1.123
50 0.9975 1072.7 53.629 95.00 240.48 0.327 0.777 0.982 0.937 1.520 1.160
55 1.1308 1052.5 61.388 102.64 243.16 0.350 0.778 0.992 0.954 1.553 1.205
60 1.2769 1031.2 70.191 110.43 245.69 0.373 0.779 1.002 0.972 1.589 1.258
65 1.4368 1008.8 80.216 118.39 248.03 0.396 0.780 1.013 0.992 1.632 1.323
70 1.6113 984.9 91.694 126.53 250.15 0.420 0.780 1.025 1.015 1.684 1.403
75 1.8014 959.3 104.930 134.90 252.00 0.443 0.780 1.037 1.039 1.748 1.503
80 2.0080 931.5 120.360 143.53 253.53 0.467 0.779 1.052 1.065 1.831 1.633
85 2.2323 900.9 138.620 152.49 254.62 0.492 0.777 1.068 1.092 1.944 1.811
90 2.4757 866.4 160.720 161.88 255.13 0.517 0.774 1.087 1.122 2.108 2.075
95 2.7396 826.3 188.420 171.88 254.79 0.544 0.769 1.110 1.156 2.378 2.519
100 3.0261 776.8 225.360 182.84 253.04 0.572 0.760 1.143 1.199 2.922 3.438
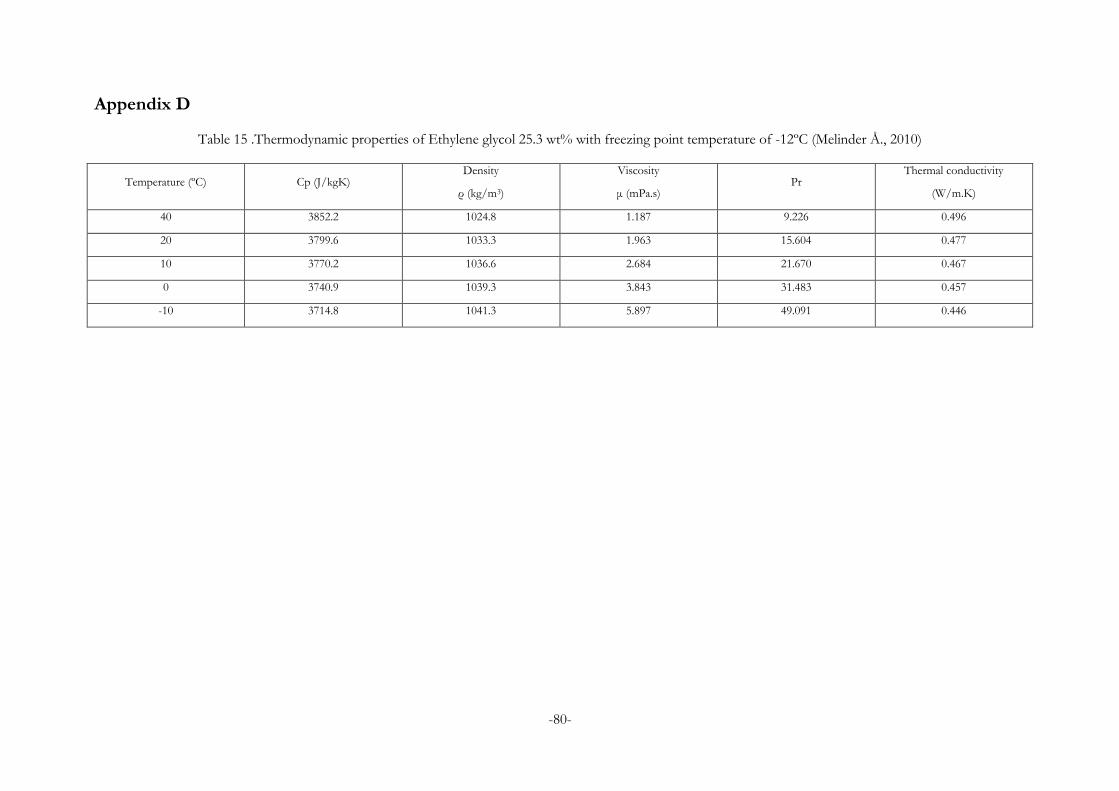
-80-
Appendix D
Table 15 .Thermodynamic properties of Ethylene glycol 25.3 wt% with freezing point temperature of -12ºC (Melinder Å., 2010)
Temperature (ºC) Cp (J/kgK) Density
ρ (kg/m3)
Viscosity
μ (mPa.s) Pr
Thermal conductivity
(W/m.K)
40 3852.2 1024.8 1.187 9.226 0.496
20 3799.6 1033.3 1.963 15.604 0.477
10 3770.2 1036.6 2.684 21.670 0.467
0 3740.9 1039.3 3.843 31.483 0.457
-10 3714.8 1041.3 5.897 49.091 0.446
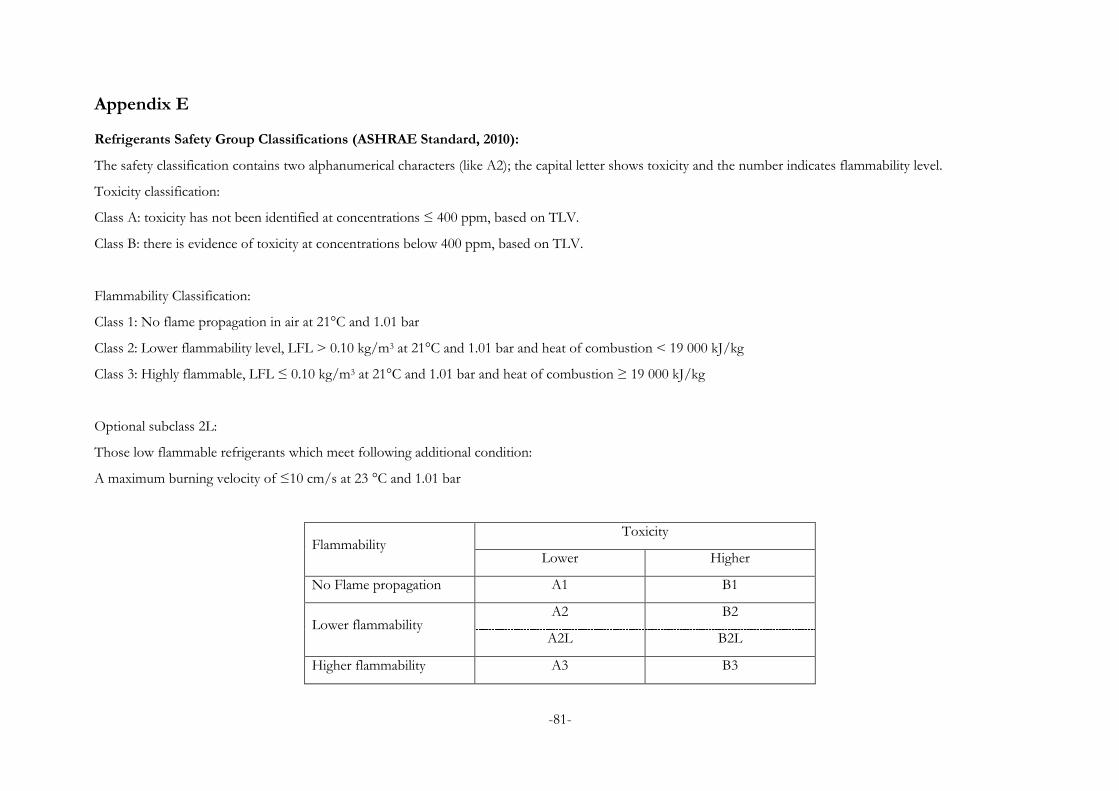
-81-
Appendix E
Refrigerants Safety Group Classifications (ASHRAE Standard, 2010):
The safety classification contains two alphanumerical characters (like A2); the capital letter shows toxicity and the number indicates flammability level.
Toxicity classification:
Class A: toxicity has not been identified at concentrations ≤ 400 ppm, based on TLV.
Class B: there is evidence of toxicity at concentrations below 400 ppm, based on TLV.
Flammability Classification:
Class 1: No flame propagation in air at 21°C and 1.01 bar
Class 2: Lower flammability level, LFL > 0.10 kg/m3 at 21°C and 1.01 bar and heat of combustion < 19 000 kJ/kg
Class 3: Highly flammable, LFL ≤ 0.10 kg/m3 at 21°C and 1.01 bar and heat of combustion ≥ 19 000 kJ/kg
Optional subclass 2L:
Those low flammable refrigerants which meet following additional condition:
A maximum burning velocity of ≤10 cm/s at 23 °C and 1.01 bar
Flammability Toxicity
Lower Higher
No Flame propagation A1 B1
Lower flammability A2 B2
A2L B2L
Higher flammability A3 B3

-82-