NEW LIMITATION CHANGE TO - Defense Technical ... AD NUMBER AD820688 NEW LIMITATION CHANGE TO...
108
UNCLASSIFIED AD NUMBER AD820688 NEW LIMITATION CHANGE TO Approved for public release, distribution unlimited FROM Distribution authorized to U.S. Gov't. agencies and their contractors; Administrative/Operational Use; Sep 1967. Other requests shall be referred to Director, Air Force Aero Propulsion Lab., Wright-Patterson AFB, OH 45433. AUTHORITY AFAPL ltr, 12 Apr 1972 THIS PAGE IS UNCLASSIFIED
Transcript of NEW LIMITATION CHANGE TO - Defense Technical ... AD NUMBER AD820688 NEW LIMITATION CHANGE TO...

UNCLASSIFIED
AD NUMBER
AD820688
NEW LIMITATION CHANGE
TOApproved for public release, distributionunlimited
FROMDistribution authorized to U.S. Gov't.agencies and their contractors;Administrative/Operational Use; Sep 1967.Other requests shall be referred toDirector, Air Force Aero Propulsion Lab.,Wright-Patterson AFB, OH 45433.
AUTHORITY
AFAPL ltr, 12 Apr 1972
THIS PAGE IS UNCLASSIFIED
AFAPL-TR-67-116
HIGH TEMPL,.,ATURE HYDROCARBON FUELS RESEARCH
- IN AN ADVANCED AIRCRAiFT FUEL SYSTEM SIMJLATOR
_ u) ON FUEL AFFB-8-67
Harold GoodmanRoyce BradleyTheodore Sickles
NORTH .WMR.,,AN AVIATION, INC./LOS ANGELES DIVISION
TECHNICAL REPORT Al'APL-TR-67-116
SEPTEMBER 1967
2.i
AIR FORCE AERO PROPULSION LABORATORYRESEARCH AN4D TECHNOLOGY DIVISION
AIR FORCE SYSTEM COkiMANDWRIGHT-PATTERSON AIR FO)RCE BASE, OHIO

iREPRODUCTION QUALITY NOTICE
This document is the best quality available. The copy furnishedto DTiC contained pages that may have the following qualityproblems:
o Pages smaller or larger than normal.
o Pages with background color or light colored printing.
o Pages with small type or poor printing; and or
e Pages with continuous tone material or colorphotographs.
Due to various output media available these conditions may ormay not cause poor legibility in the microfiche or hardcopy outputyou receive.
• lf this block is checked, the copy furnished to DTICcontained pages with color printing, that when reproduced inBlack and White, may change detail of the original copy.
This document contains
blank pages that were
not filmed
NOTICE
When Oommunt dr'awings, speoitoations, or 7*hor data are uted for any purposeother than In oonneotlon with a definitely related Government procurement operation.the United States Government thereby incurs no responsibility nor any obligationwhatsoever; and the faot that the Government may have tormulated, furnished, or Inany way supplied the aaid drawings, speolfications, or other data, is not to be regardedby Implication or otherwise as in any manner licensing the holder or any other personor cor.ratlon, or conveying any riohta or permisslo to manufacture. use, or sell anypatented Invention that may in any way be related thereto.
Copies of this reourt should not be returued unless return is~ required by securityooalderationa, oontrmtial obligations, or notloe on a speoifio dooument.

HIGH TE•DPRATURE RYDROCARBON FUELS RESARCH
IN AN ADVACWD AICRAIT FUEL SYSTEM SIMULATOR
ON FUEL AFFB-8-67
Harold GoodmnRoyce BradleyTheodore Sictles
__

FOREWORJ0
This report was prepared by North American Aviation, Inc./Los Angeles Division under Contract No. AF33(615)-3228 whichbears the Budget Program Sequence Numbers 6(63 304801 62405214)and 5(68 0100 61430014). This contract is monitored by the AirForce Aero Propulsion Laboratory with Mr. Alan E. Zengel asAir Force ProJect Engineer. The North American Aviation ProgramIanager is Mr. Harold Goodman; Project Engineer is Mr. Royce
P. Bradley; and assisting Mr. Brad~ey is Mr. T. G. Sickles.
This report covers the first fuel series of Pha3e II whichwas conducted from 3 January 1967 to 3 May 1967. This reportwas submitted by the author on 14 August 1967.
Publication of this report does not constitute Air Forceapproval of the report's findings or conclusions. It is pub-lished only for the exchange and stimulation of ideas.
ARTHUR V. CHURCHILL, Chief
Fuels, Lubrication and Hazards Br.Support Technology Division
ii
|j
_ _i- - ,-~-

ABSTRACT
At elevated teperatures hydrecsrbon jet fuels tend to form depositswhich decresei beat xe-banger efficiency and Plug screws and filter
elsments . A small-scale device is required which As been demonstreted tobe applicable to all qualities of hydrocarbon Jet fuels and will quantifythis tendency in terms meaningful to fuel system designers. In this report,the thkano' ;, ility of a fuel (AFFB-8-67) is quantified in terms ofameount of deposit in an airframe and engine fuel syst unm simulator. The dataobtained fro th,: first fuel series indicate that an expression, derivedherein, in terms of time and temperature may predict the amount of dr-ýitaformed in any engine system using fuel AMFP--847.
Presently, the fuel's tendency to form deposits is determined byvisual ratings of color. Two methods for determining the amount of depositsforked in a tube are diacussed and a very favormble comparison results. Arelationship in shown herein between these calculated values and tVv colorof t-1• deposits. It .s shown that at certain levrei of deposit thicknessa color scale 4# insensitive to the amount of deposits. In addition to fueltesting in the si 'lator, fual AFPB-"-67 wva testrt in tha Standard, Oan,Research, Modified and Micro Cokers, Minex, Thermal Precipitation Apparatus,5 ml bomb, and ar•' s Standard Screening Unit.
ComparL.ons cmde to data obtained in sm.-l-scýle tests and theFAA-SST Dita Corre1ition Study indicate that a static system (i.e., ana "empty"wing tank) does not rank fuels the rma As a dynamic system (i.e., enginesystem). Therefore, - dual type (static and dyamic) thermal stat'lity devicemay be indicat.ý.. It mae also indicated that the comparison criteria usedin many of the small-scale tests yield breakpuints (initial depositiontemperatures) 100 to 200&F below that indicated in the fue! system simulator.
This effor+ ir continuVI4 g 4ith the testir, of additional xiu4s and aFuel keries heport vilh c released two months after completion of each fueltested. The applicability of the above findingn to these fuels will bereported therein.
iii

TABLE or COwNwTs
SECTION PAGE
I IJRODb'~C
II FUEL TEMTED 2
III SIMULATOR TEST CYCLFS 4
Su4A•Y 0 To T PROCEDURE AND REULTS 4TEi! PROCEDURE AND RESULTS 11
Wing Tank 11Fuselage Tank 22Altitude and Inerting P4Vent Bating 24fuel Condensate 25Boostr Pump 25Airframe Filter 25Airframe Beat Exchanger 26Enginn Puam S'xbsy? .eu 31f-ine Filter 33
aigine Vhi-Tvbe Heat f&cbangers 33Manifold 45Nozzle Subsystem 56Additional iAborstory Analyses 59
IV SIMULATOR STEADY STATE MAYFOLD TPM 69
v SMALL-SCALB TESTS 73
VT COMPARISON BENEZ SIkVUATOR & SMLL-SCA•I TMTS 84
VII FUTURE WORK PLANNZ 89
VIII REFUMU ES 90

ILLMTRATIONS
1 Advanced Aircraft Fuel Systen Simulltor 5
2 Fuel 71ir Alate Sekenae 6
3 Task Pressure Sekedule 7
1. Dry T4*k Skin Temperature 8
5 Cowmpent Fuel Temperature 9
6 Time-Toiperature Nistory of Vapor in Wing Teask 12
T Wing Tank Deposits 15
8 Wing Teak Probes 16
9 Wing Task Disk end Disk 17
10 Wing Tank DeroeItr 18
11 Wý-Ag TMAk DOpositS (boost PMup Area) 21
12 Time-Teierature History of Fuel sad Vapor in FuselageTeak 23
13 Press~Are Drop Across Airframe Filter 27
114 AiLrfr,&w. rilter Kiemeat 28
15 Oversa.l XUe~t 1It~asfer Coefficient of AL31rfrwe HeatINCUwe~r29
16 Prvesure Drop Across Airfrr~se Beat Ixcb~sser 30)
17 Thajine Pump Fitting 32
18 Pressure Drop Across IgAze ?tl.ter 31.
19 Reg ine Root N~ckwangr Calibratiom Test Results 39
20 !Ni-1Tube 2eat Uc~eager Calibratics Test Results 4.0
21 9wera.U gloat Transfer Coe'a Ic iept of Naigiz. goat ftckmger 411
22 Fuel. 8ide Meat Transfer Co*Mc~ient of UMi-Tab. lest
Mhcheager 4

(i
ILUSTRATIES5
23 Pressure Drop Across Ragimt Heat Exchanger 43
24 Engine Heat Excbanger
25 Nanifold Deposit Thlckness - First Test Series 50
26 Mhaifold Deposit Thickness - Second Test Serie-i 51
27 Pressure Drop Across Engine XmifoldAs 52
28 First Test Series Mmaifold 53
29 Second Teat Series Newrifold 54
30 Comparison of Color Versus Deposit Thickness 55
31 Nozzle Pressure Drop 57
32 Engine Nozzles 58
33 i2J.ipore Filtrations - Test Cycle 1.040 6].
34 First Steady-state Manifold Deposit Buildup 67
35 Secont Steady-state MPaifold Deposit Buildup 68
36 ActiumI Plot of Deposit Builaup 69
"37 Manifold Deposit Thickness - Steady-state Tests 70
SManifold Deposit Build&p 74
39 Comparison Between Steady-istate and Cyclic Data 72
4W Standard, Oks, and Modified Coker Test Results 78
41 Micro Coker Test. Results 79
42 Research Coker Test Results 80
43 Mines Test Results - First Run 8i,
44 Kinex Test Results - Second R&m 832
45 Therial Precipitation Test Filters 83
vii
SUCTION X
In an Qffort to investigate advanced hydrocarbon fuel performance withrespect to therval stability under simulated high )kch number flight con-ditions, this program was initiated to furnish an aircraft airframe andengine fuel syatem simulator and subsequently conduct a fuels researchprogram. The simulator is to provide generalized perforwance data on variousadvanced fuels that vill be used to correlate small-scale therml stabilitylaborntory tests and provide inforution on design criteria for futuresupersonic aircraft.
Phase I of this program consisted of the design, installation, andcheckout of an advanced aircraft fuel syseAm simulator. A detailed reporton this phase can be found in Reference 2. The FA-SST Fuel System Test Rig,discussed in Reference 4 vs modified dftring this phise to increase the fuelsystem simulation capability to the speed regime of interest. Upun ccopletionof this task, performance tests vere conducted, and the simulator was foundto fu.fill the design profile requirements set fortb by the Air Force.
Phase I1, reported herein, then comsnced with the first fuel seriesof testing on fuel A77B43-67. This consisted of two test series each con-sisting of 100 simulated mission profiles or test cycles. The results of thetesting performed indicate the presence of deposits in the ving tank,engine manifold, and engine nozzle. Concurrently, the fuel was tested invarious smil-scale tbermal stability test devces. The results of thesimiultor and small-scale devices were compared. Additionally, the dataobtained on the FAA-SST Fuel System Test Rig vas analyzed with respect tothat obtained on fuel AFfM-8-67 so tLat the cowparibon to maUl-scale testswould be more inclusive.

SECTION II
MCL TETKD
Apiroxilatoly 96,000 gallons of the first test fuel arrived at W-PAFBon 20 Docauber 1966 and wre loaded into four 25,000 gallon undergroundstorage tLnks. Tfuse tanks bad been cleaned and lined with a protectivecoating couforming to MIL-C-4556B prior to receipt of the fuel. bhe transferpunmp are copper-free and the transfer tubing in stainless steel and aluminum.The test fuel is designated as AIFB-8-67 and is a blend of 30% Ashland regularJP-5 jet fuel mad 70% Ashland thermlly stable jet fuel. The fuel was purchasedto pass the Starlard Coker (Bsferenee 1) at 375,1475 and fail at 425/525. Thefuel had been amlyzed by the Gupplitr prior tr, shipment and by& W-PAFB laboratoryafter storage. The results are shown in Table I.
As fuel wa required, it was delivered to the test site in a 4000 gallontrailer. Approximately 92,500 gallons of the fuel, ranging in temperature from12 to 74*F were used for simulator and ali-scale testing. Thia fuel vas usedbetwetn 1 December 1966 and 3 Mby 1967. A total of fifty 55-allon, epoxy-pboenlic coated drum were then filled with AFFB-8-67 directly from the under-ground storage tanks. On 27 April 1967 these drums of fuel were shipped to theAir Force Fuel Bank for future use.
2
__________ ________________________________________________________

TAZ i - Atm-8-67 rmFUL AiMAsis
Ashlan Tests SpecIflOtion W-PAFB Tegts
API Gravity 46.8 39-51 46.6Distillatiou, OF - IBP 330 - 330
10% 3"6 0mx. 35120% 352 35650% 369 450 max. 37490% 4145 - 450VIP 497 550 mx. 5M
Uscovery, 5 908 -98
Residue, % 1 1.5 max. 1Loss% 1 1. 5max. 1
kisteat o-M', mg/lo) ml 0.6 7 mx. .4Total Potential OUR, .g/100 AI 1.9 14 mx. -Sulfur., Weight 5 '.019 0.3 Mx. -MaI, % <o0.001 0.003 max. 0.0Freeze Point, *F .66 -54 mSx. -70Aniline Poirc., -F 150 - 146Anil1ne-v .vity Constant 7020 - 6803
iat of CO&VAtion, BTU/L-. 18,655 18, 4oo mu. -Viscosit:r - -30*F, cs 5.65 15 Box. 6.07AromtLcs volume % 6.9 20 max. 11.5Olefizn, volume 5 1.5 -±.sturtwas, volums 5 89.6 - -
booke .oint, m 29 25 mi. 26FlasPh, e2, PH 32110-150 115Corrosi,= at 212'?, 2 hours lb 1 neptiveVSIM 74 -
0 Trlerence 1 *.
Therml StabiA.It,
(Btsndard Cokc.t.) 14o/50U/6 4.25/525/6 450/550/6AP, In. 1]. at 300 min. 0.2 0.4 3.14Preheater Cods . 3 5
3

SECTION III
SIMULATOR TEST CYCLES
SUIM4R OF TEST PROCEDURE AND RESULTS
Two test series, each consisting of 100 54 tAulated en\'irofmertal testcycles, were conducted on fuel AFFM-8-57 .n the Advanced Aircraft Fuel SystemSimulator shown in Figure 1. The fuel flow rate, tank pressure, and drytank skin temperature profiles vere the same for each test series and areshorwn in Figures 0, 3, and 4, respectively. The ccap•ent fuel-out tewn 'raturesfor the two test h*ý ries ar* shown in Figure 5. The only difference ", teenthese two test series envirobmn s were the fuel +emperatures out of themanifold and nozzle. The nozzle temperature xhorly coincides with the manifoldtemperature. The manifold and nozzle were replaced between the first and secondtest series so that these components were suv.octed to the above environmentsfor 100 test cycles each. All other componen% were tested for 200 test cycle s.
The following is a brief synopsis of the operational procedure and results.Prior to each test cycle, the fuselage tank and the wing tank were filt ad withfresh fuel to 95 percent capacity. Altitude simulation and inerting of thefuel tanks were automatically controlled through the Unk vent system. A vacuumpump was utilized in this system to reduce the inte-/il pressure of each tank,and a nitrogen supply was provided to inert the vapor space during simJlateddescent. The fuel in the ruselage ink wim W 4"wad fLfm .Zp--j-ri-tely 907 atthe start of the test cycle to 2207 at the end of the test cycle by radiationheaters to siul=]e aerodynamic heating. Simultaneously, the upper and lowerwing tank skin was L-ated to a temperature of 500"? also seLulatizK aerodynamicheating. Vibration simulation was provided by utilizing a vibrator on ewchtank. The fuel was pumped from the tanks through a 74 micron airframe filter andan airframe heat exchanger.
The airframe heat exchanger system rejected heat to the fuel at a apeci-fied rate. This resultod in an average increase in temperature k" 25"F and69*F for the acceleration and cruise conditio'rs, respectiv~ly. The fuelentering the -ngine fuel system was pressurtxed and heated by the enfinepusp and bypsas system. The average increase in temperature across the pumpwas 5, 10, and 10*F during acceleration, cruise, and deceleration conditions,respectively. The high rressure ftel flow was then regulated by a manualflow control valve au& filterer by a 2 micron engine filter. The fuel wasfurther heated by the engine beat Nxchanw r syoten so that an average incr~asein temperature of 25"F and 607F was obtained during the acceleration andcruise conditions, respectively. 7he fuel then passed through a heatedmanifold where average temperature incrg.ses of 42 F and 857 . produced

FROM VOLUME METER ,DEP~THSTORAGE -FILTER
TANK.
MANIFOLtJ HEATER FUSEREMIOTE CONTROL POWER SUPPLIES ~UNIT
ENGINE[OILGPUM
I ______ __

-~. SURGE TANK
R
FUSELAGE TANK
FROMFUSELAGE TANK NTOE
COOLING LIENNITROGE
AIRFRAME~WIN SUTAUMNKMTN
TAN
)ALVRATN VALVEM
TE! LT UM UPSUPTN
FIGURE IADVANCED AIRCRAFT FUEL SYSTE~M SIMULAYOR

w co
-44
2EiJJTNIW lHd SNOrT1VD-HLV1 MUMT T'13M

0
0____________ �J4
0____________ ________ 0
V.
___ ____ ____ ___ ii� P4
N.oCo
- .- -I C
______ ________ 0
�- -0 0 0
- w4
VISd - �HflSS3�Id )LN Vt7
�

co
00
->
_ _ __ __
____ __ _ __ -CD1
I o

000
_ _4 0. _ _
500
0 - f~fX1J~1N T~f~I A

for the accolewrition and crduie conditions of the fi~rst test series,respectively. 111ea average temperatvre increases for the second test serikswere 25 and 51"Y. At the beginning of descent caiditions,, the engine andairframe heat exchanger heatiag systems were dc-energized. Also at dencent,throee-quarters of the fuel passing th2rougb, the engine exchanger voas returnedto the fuselage tank.* The remaining fuel pussed through the heated manifoldwhere the fuel-out temperature rapidly increased to 600OF for the first testseries and 50U*F for the se'iond test series.* The beat input was then slowlydecreased simulating descent cooline of the manifold line. The fuel exitingthe manifold line,, passed through the nozzle where temperature increases of2 and 8*F were attained for the cr!uise and dep--ent conditions,, respeCtively.hiuring and at the completion of each test splexes, the simulator was inspectedand the data, ma analyzed. The componentis which shoved evidence of decreasedperformance were the first and second +.*at series engine filter and eagine-manifold and the first test series -;gine nozzle.
A summary of the significant results of the 200 test cycles is asfollows: Visual inspection of the simulator sh@ ~ed that a portion of the
f~wselagn internal surfaces lad a very slight dirscoloration. The vent areabad a fainter discoloration. The entire wing tank use discolored, and depositswere preominantly on the bottom of the tanký These deposits were as thick as1/16 inch. Deposits were also evident in the vent area.* The airframe filterwas slightly discolored; hotrever, no increase in pressure drop was evident.Mhe airframe heat exchanger use unchazuged in color, pressure drop, and heattransfer efficiency. The engine pump internal parts were in. excellent condition,and a very light tan,, powdery deposit vas observed an the inlet fitting. Theengine filter element, vas replaced 18 times in the 200 test cycles. Taisfrequent replacement use attributed to debris. The engine beat exchangerpressure drop and heat transfer efficiency did not significantly change.The fuel side of the tubes vaa discolored at the inlet and contained de-positat the outlet.
The manifolds used in eachA test series coctaiuod measurable deposits.The calculsatd t~hicknesh range4 from o04 to .36 mile and .02 to .17 milsfor the, first and second teit series, respectively. This mas further evi-denced by a measured decrease in !wet trjansfer efficiency during the testseries. Mhe engine nozzles used in each test series contained deposits;however, an increase in presiqure ch-p was measured only during the firsttest s2iles.
10

TWT PROCM AMD MR S
The following i a detailed discussion of the test cycle procedureand results. The results are expressed in terms of component performancedegradation, calculated deposit thickness, and color scale ratings. Itis considered that the use of a color scale for quantifying the fueldegrmdation in the simulator is far inferior to measurements of performancedegradation and deposit. However, the CRC Lacquer hating Scale, Reference 3,was used so that comparison can be made to previous fuel testing resultson the SST Fuel System Test fig, Reference 4. This scale in not the amuscale used in Coker tests.
0 rttoal Procedure - Prior to each test cycle, the wiz tank vas filledwith fresh fel ranF4 in temperature from 12 to 74"7, through atotalizing flowseter to 95% of its capacity based on the fuel density at atemperature of 700F. This quantity, 636 pounds, was used for each test cyclewithin a repeatability tolerance of less than 1%. After the tank was filled,the test cycle commenced by energizing the boost pump, establishing a fuelflov of approximately 5.8 gallons per minute out of the wing tank andautomatically reducing the internal pressure of the wing tank in accordancewith the required pressure schedule, Figure 3. At 14 uinutes after start-up,tLe wing tank and probe beaters were energized in accordance with the heatingschedule ascertained during the initial test cycles. one of the probeswas controlled to produce the aie temperature profile as the dry wing tankskin (500*7). The second probe was controlled to a mximum temperatureof 4250F simulating the sides of the wing tank, and the third probe vsalloyed to slowly increase in temperatuxe (to 350'?) duplicating the lovesttemperature in the wing tank. In order to duplicate the environment andfuel puddle conditions of the bottom of the wing tank, a dish and diskwere fixed to the bottom of the tank. At 15.0 * 0.3 minutes after teststart-up, the airframe fuel pressure d*in.ished, indicatiug that the fuildepth in the wing tank vas approximtely 1 inch and the pump was cavitating.TLis condition was immediately followed by a decrease in fuel flow.
At this ties the fuselage piusp was energized, the ving pump de-energized, and the wing tank fuel dump valve opened. Most of the re, iningftel in the wing tank then drained through the valve into a 321 stainlesssteel sump tank, and the fLwl dump valve was closed _8 minutes later. Thewins tank attitude was calibratad to cause 1200 al of fuel to retin In thetank after it was dained. During the cruise condition, which coienced 22minutes after test st, rt-up, the tampersture of the Cry heated portion,vingtank skin, was increas'•. and stabilized at a tespermture of 490 t 10'F.Though 500'? was the profile temowrature, a mean control value of 490OFwas us -d so that 500*F would not be exceeded. A temperstar-tiue hietowyof the wing tank vapor for a typical test cycle is seown in Figure 6.
11

-4
rjor
0-1 d
liii
C,,
m c
z H12

At 126 minute* after test start-up, simulated aerodynmic coolingand vibration were cowmenmed. The vibra'cor (input frequency of 7000 cpmand input force of 2.7 g's) was shut off at 136 minutes and cooling con-tinued through the end of the test cycle.
Results - The wing tank ws opened after selected test cycls to visuallyxm"G; the deposits in the wing tank and on the probes. The probes were
rated with a Tuberator (Reference 1). flwever, it became evident that theTuberator rating wea misleading with respect to these speclmens. One ofthe probes having deposits which were so thick that they were flaking offthe tube, rated lover with the Tuberator than a tube wi.tb a much thinnerdeposit. Tabulated below are the visual ratings under sunlight made withoutthe Tuberntor and using' the CDC Lacquer Hating Scale, Reference 3.
Rating After Unheated Probe
Test C.cle (3140F Max'x. 400F Probe 500*F. robe
1.021 2 2 2
1.r48 2-3 2 2
1.072 Light brown with Light atain Stainblack spots
1.390 7 3-4 6
2.010 7-8 3-4 7
2.035 7-8 3-4 6
2.o69 8-9 5-6 7-8
2.100 9 5-6 7-8
The deposits on the 400F and 500OF probes were always observed as a stainwith the 500F probe darker than the 400'F probe. Starting at test cycle2.lO or after 110 test cycles, the 340eF probe wmo obseried to have athick coating of deposits rather than being stained in appenrance. After2.036 the deposits w•kre noted to be rough in appearance; after 2.070 thedeposi s were starting to flke off, and after 2.100 the de sits wereflaking off quite easily. An unheated titanium (Ti-6Ai-'•Va)probe wasmounted in the tank after test cycle 2.036. It could not be rated with theCRC Lacquer Rating Scale since the stain, though slight, mv different incolor from the scale. Boveer, tbhoe appesred to be no significant differencebetween the amount of depos. rs oru the aluminum and titanium probea on thebasis of equal number of test cycles.
13

the entire wing tank vas ratd Live timas during the two test seriesby aking a sketch cf the tenk showing the location, area., and rating. ofthe deposits. These visual exminmtions are sbmm-rized as follows:
hating After Tube Bottom - Bottom -
Test Asiae Sides Vent Area Trusses DrZ Areas Puddle Areas
1.oW 3-4 7-8(9) - 5-6(3.04) 9 (7-8)
1.100 3-4(5-6) 7-8(9) 3-6 7-8(5-6) 9 to 1/32"thick
2.035 3-4 7-8(9) "-6 7-8(5-6)
2.069 3-4 7-8(9) 4-6 9
2.100 5-6(7-8) 8-9 4-6 9 (7-8) Up to 1/16"thick (9)
21e ratings given are first the rating of the greatest area followed bythe rating of a smaller area in parenthesis. The sketch wade of the wingtank after test cycle 2.100 is shown on Figure 7. The discolorations ofthe top and sides of the tank were rainbow in appearance and very thin.The entire ti*p o the tank ws rated as 6-7 on the CRC lacquer hkting Scalaand very clonely watched the stain of the 500*7 probe. The stain of lhe400'F probe closely watched the sides of the tank. The discolorationthe struts varied from the saw color as the top and bottom of the tsin the areas adjacent to the top and bottom of the tank, to the same -ras the sides of the tank at the aiddle of the struts. The center supportbar us very &rk, almost am dark as the dry portions of the tank bottom.The discoloration of the support bar indicates that fuel condensed on thebar and dripped from the bottom of the bar. The phenomenon of condensationaccelerating deposition was also found in othe wing tank deposit program(eferences 4 and 5). The deposits on the 300OF probe were more brown inappearance than any specific area of the tank. A pbutograph of the probesis shown In Figure 0. The ing tank disk vas the same color as the dryportions of the wing tunh bottom. be dish we the same color as the fuelpuddle areas, but thers was only a slight Indication of dieposit blisteringIn the dish. A pbotoraph of the dish and disk is ashn in Figure 9.
The puddle areas of the tank were cvwered with brown-black depositthat uas very row"- and appeared blistered, as shown ir Figure 10. Novever,the deposit ms *rey hard and very adherent to the teak. ueseraturemeasrumets of %* arms that had rough and blistery deposit 1-41m.atethat thoese were puaMLe areas. Mb tnperature increased mre slowly thanthe dry skin tempersture profile, and at 300'? the te eatu remainedconstant for aMpvximately 10 mluttes (apjaremtly until the fuel above ttsthoermcoupie ha.d vporea- ) and tbs mare mpidly increased to 5000?.

U 0
0Urnn
CDO
CU
15

-3
CR CQUER, rING SC
I he k -,ior r ale, below will guides for rit ing to g .1 y
,c clu .. 01.. A raitvd I. r (, tran lacqulr I cclor fa d lh..-k
acywyc loI' -o
Sutimmati rea c•re,-d \ colorI A.. ]uL'r de ing I10I
\ I-11 r.11I11 --dIem rit rating
DEPOSIT SCALE COLC DEPOSIT
9
8
'7
UNHEATED (340 0 F) UNUSED T
6
5
43
2
Figure 8. Wing Tank Probes
16

CRC LACQUER RATING SCALE
c\ 1()1 ra l :t 1'
A- ,-( L -'V dCI t 'IIj I a
71

....... 11Al0
ol-
1-4
bD

The coior of the puddle area deposits under the boost pump (see Fligurm 11)vag a rust-brown. The difference I- or of these deposits Compared tootbftr areas my be attributed to the condensing of fuel vw..pr on the outerhousing of the boost pump coollig coil and the dripping of the condensateon thb bottom of the tank. Dspuuit analysis resultm showed the amount ofiron to be .o1% indicating that the oaterial was not rust. The area aroundthe vent vas blawk and bad a powdery apmarance. The horizontal portion ofthe vmnt line contained a loose gritty mterial.
Prior to cleaning ths ving tank in preparation for the third testseries, plaster casts werc made of the deposits at three locations on thebottom of the tank; thew.* locations are shown In Figure 7. The materialused was Puritan Potter's Plaster. Plaster casts were made aain of theselocations after the wing tank vs cleaned. A di&.:. indicator wa then u6adto measure the difference in the casts for each location on a asmurementgrid consisting of 3/3 inch lines. The oaximum deposit thickness ieasuredat the three locations is as follows:
.A.•tion Ugisa, Deojpoit Thickness, Inches
AA-A .048 (peaks as high as .062")
BE-B
CC-C .027
A sample of the puddle area deposits and vapor was taken after test cycles1.048, 1.100, and 2.100. The results of these analysis are included inReferences 6, 7, and 8. The deposit analysis' resUlts' are shown in Table II.Comparing these results to those obtained on ving tank deposits in thepast, 4"ference 4 indicates that tbese deposits with the exception of thosefrom the booster pump area have a much higher quantity of sodium and silicor.Assuming so errors were made in the Analyshs these msterials w7 beattributed to insufficient flushing of the ving tank after the tank waecleoaed for the first test series. The tank we first "sand-hlawted" withsalt and then soda lime glass. If the flushing operation vhich followedwas not effective, then hIgh values of sodium, silicon, and calcium areunderatasudble. Assuming that the cleaning operation was the source of thismaterial, the total carbon and hydrogen in the actual fuel deposit can becorrected from 17.6 to 44% Further agreement to previous deposit analysisis evident from the larger ratio of carbon to hyftocarbon in the sample.
19

ITAB1IE II - IEC TANK DOSIT .AXALYSIS*
TEST CYCLE i.O48** 1.100*** 2.100S-'-'"P~mr!• -Dow=BIACK PRm GRAY ARIA PUG AM
Sodium 30% 2.0% 1.o% 1o-24 2.0% <0.1Silicon 20 0.5 5.0 8 0.3 O.O4Calcism 10 0.1 0.2 0.8 0.8 2.0Alminum 1.0 0.2 0.1 0.6 0.15 0.01Magn0sum 0.8 0.04 n.! 1.0 0.3 0.02Iran 0.5 0.3 0.2 5.0 1.0 0.01Copper 0,2 0.0e - - 0.1 0.005lAd 0.1 0.02 - - 0.25 0.005Chrm-ium 0.05 0.03 - - 0.2 <.01Nickel 0.03 0.01 - - 0.1 < .005TI'dusm 0.03 0.01 O.2 2.0 0.02 <.01MIb4 else 0.01 AR MR IR 0.03 <0.001Zirconium <0.01 ER MR NR 3R MRiMolybdenum 0.001 ND AR NB MRSilver <0.001 AR MR IR 0.0A4 0.005Cobalt ER - 0-O03 MR MR
Boron ]MR - .1 0.8 0.01 <0.005
*Nstimted percent dtermined by Aissias SpectrographiL Analysis**Combustion of this sample followed by go cbwtogrsphic analysis
ind1icated 16. k$ carbon,, 1.2-drogen.
"* •Oserition undr microscope rwsaLed three types of memples:Black-brittle or chszrd mteria1, Bov - dark material under brownishspODOg, Gry - allable dark mterial
ER - Not hoported
20

U2S
'1
I ________________________

Fuselag Tank
petioml Procedure - Prior to each test cycle, except for the firsttest cycle of the first test series, the fuselage tank initially coataiued,en average fuel reserve of 66 gllons remaining from the previous testcycle. Fresh fuel ranging in temperature from 12 to 75"F was pumped intothe tank through a totalizing flowmeter and the fuselage tank level controlvalve until the level control valve closed. The level control valve wasmounted at a height of approximately 33 inches in the fuselage tank, whichpermitted it to shut off the fuel flow when the fuel quantity was 38.4 *1 1gllons. This qutaytity ip 95 percent of the fuselage tank capacity. Theweight ratio of residual fuel to fresh fuel at the start of a test cyclewas 0.19.
After the tank vas filled and pressurized vith nitrogen to 2 psig,the test cycle commenced, and the internal pressure of the fuselage tankwas automstic•lly reduced in accordance with the pressure schedule. At 14minutes after start-up, the fuselage tank beaters were energized inaccordance with the beating schedule ascertained during the initial testcycles. This heating schedule was established to produce the requiredfuselage fuel-out temperature and was used for all test cycles, with theexception of thtiee test cycles wherein the fuel temperature at the beginningof the cycles was greater than 85'F. For these test cycles, the beat inputto the wevted areas of the fuselage tank vas discontinued for a oaximum of20 minutes in order to duplicate the temperature profile.
At 15.0 1 0.3 minutes after start-up, when the wing tank fueldiminished, thz fuselage pump was energized. As a given section of theheated fuselage tank skin became unvetted, the temperature of that sectionapproached 500"F. The heating schedule provided for beating of the fueltank until 100 m'inutes after test start-up. De-energization of the heatersat 100 minutes instead of 126 minutes, the start of descent, was necessaryto minimize the fuselage fuel-out tsuperat•re during descent in order toapproximate the overall design profile requiremnts, Reference 2. Duringthe time from 100 to 126 minutes, the unvetted fuselage tank skin decreasedfrom 500 to 400"7. Based on past testing, Reference 4, this deviation fromthe fuselage tank temperature profile requirements Is considered to havelittle or no effect on the results. At 126 minutes after test start-up,the vibration (input frequency 7000 cpu at 2.5 g s) was actuated and tankcooling commeneed.
The vibration excitation period wva 10 minutes, the tank coolingcontinued for one hour after test completion, and then the fuselage tankwas refueled.
A time-temperature history of the fuel and vapor in the fuselagtank ir shown in Figure 12.
2?

TOTAL SKIN AREA = 99.5 SQ FT HEATED AREA = 34.2 SQ FT
260
SOURCE OF DATA - TEST CYCLE 1.074
240f-
220
VAPOR WITHINT 6 IN. OF HEATED SKIN
200 __ _-L
BULK FUEL
i ~ ~BULK VAPOR ./X
160
140
120_____ _ _
100
.•~~~~A O -III II I I I IN. FRO
UNFEATED TOP O3KIN
80
0 20 40 ""0 80 100 120 140TEST CYCLE TIME - MINUTES
Figure 12. Time-Termp)erature History of Fuel and Vapor in Fmselage Tank
23

R0salts - The fuselage tank masl opened adiaspected upon completion oftest cycle 1.04 &a~d ýae first and second test eer1.es * It mas noted th~atthe entire tank asa clean after the test cycle 1 .O18 and the first testseries.* At the second test series inspection it Vat f~ound that the top foursections at each end of the tank bottom curved surface bad a very slightdiscoloration. The vent area had a fainter discoloration. The reaInder ofthe tank vasn clean.
A sample of the reserve fuel remaining in~ the fuselage tark afterthe skcond tast series w~s tested on the Vas drive coker. The fuel passedthe 1450/550 conditions and failed at 475/575 and 50/600. Fresh fuel hadpassed the 1425/525 conditions, failed one out of three tests at 1450/550, andfailed all tests at 1475/575 and 500/600. These results indicate that thereserve fuel vas not adversely affected by the heating and replenishing cycles.
Altitude and Inertina
Ojerational Procedure mnd Results...- Prior to test cycle start-up, theautomeatic MliUMe con-trol sole-nodvav and the vacuum pumps were energizedand fuselage and wing tank& pressurized to 16.8 t 0.3 puia, with gaseousnitrogen. At test cycle start-up the altitude programmer was energized audautomeatically controlled the tank pressure as shown in Figure 3, to within1 0.14 pei. The maximium rate of pressure reduction during simulated climbwai, 1.6 psi per minute. At 16 minutes after test start, the pressure of thetanks reached 3.6 t 0.2 psi and this pressure vas maintained. At 126 minutesafter test cycle start-up,, the pressure of the tanks vas automatically in-creased by addition of gaseous nitrogen to 17.2 ± 0.2 psi at a ,maximumrate of 0.8 psi per minute.
Vent heating
Operational Yrocedure and Results - At 16 minutes after test cyclestart-up, the resistance heater tapes on the fuselage and wing tank ventlines were energized to simulate aerodynamic iieating. An individual power-stat and tempeirature controller was used to attain a metal temperature of1495 1 5oP at 147 * 2 uinutes after test start-up, and to maintain thictopperature throughout~ cruise corditions. At 126 minutes after test start-up,the beater tapes were de-energized. The temperature of the vent lines thendecreased at a linear rate to 310 t 10'? at 159 minutes.
Upon completion of the two test series, the vent lines were inspectedfor deposits. The fuselage tank, vent line was given a zating of 2 to 3 ontha CRC Lacquer Rating Bcale, Reference 3, for the first seven inches abovethe tank, The coating, which vas very t~hia, decreased to a rating of -,at the connection to the surge tank. The wing tank vent line rated 6 to 7from the wing tank to the surge tank, arid It vas noted that the depositvas very thin.

Fuel Condensate
.etional Procedure and Results - Upon completion oZ each test cyclethe condensate resulting from tank fuel boil-off wes drained from the.vacuum system condenser tank and measured. During the first 31 test cyclesof the first test series, the amount of condensate ranged from 5 to 685milliliters per cycle. From test cycle 1.009 to 1.031 the amount of con-dmnsate use greater than 270 milliliters. Based on previous testing, thisamount of condensate is not unusual for the vent system design previouslyused. However, after test cycle 1.031, it is found that the wing tankreference pressure valve to the wing tank sump was closed. It is believed
that this valve was closed from test cycle 1.009 to 1.031. When this valveis closed, the sump tank is not referenced, or vented to the wing tank, andtne unpumpable fuel, five to six gallons, drains much more slowly into thesump tank. This leaves a greater amount of puddle fuel in the wing tank,and therefore results in a different temperature envio'onment. After testcycle 1.031, the valve was lockwired in the open pousition to prevent in-advertent closure. From test cycle 1.032 through 2.100 (the remaining 169test cycles) the amount of condensate exceeded 100 milliliters during seventest cycles (range 230 to 495 milliliter per cycle) and during the rest ofthe test cycles the avevnge amount of condensate was 32 milliliters percycle.
Booster Pump
Operational Procedure - Prior to the start of each test cycle both boosterpumps were started under a no-flow condition and checked for proper operation.The fuselage boost pump was de-energized, and the wing boost pump was usedto supply fuel during the first portion of the test cycle. At 'i3.0 t A)3minutes after test start-up, the airframe system pressure rapidly decreaseddue to the low level of the fuel in the wing tank. The pressure decrease wasimediately followed by a decrease in flow rate at which time the fuselageboost pump was energized and wing boost pump de-energized.
Results - The fuselage boost ptanp was replaced prior to test cycle 1.036due to an impending bearing failure. The fuselage boost pump and mountingflange v.-ere not visibly discolored after the two test series. Deposits wereevident on the wing tank boost pump and flange.
Airframe Filter
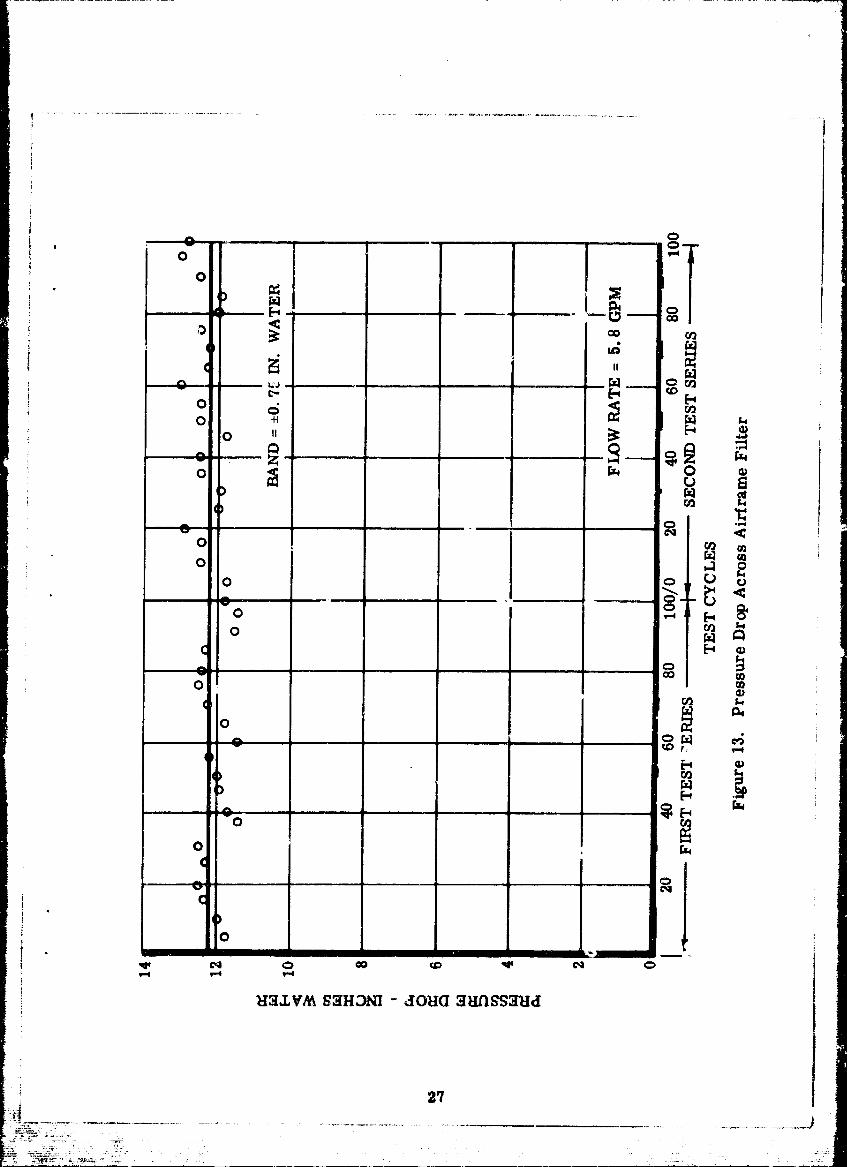
Omrrtional Proce d ure and Results - Approximately 101,0M0 gallons of fuelranging in temperature from &9 to 220"F passed through the 74 micron filterduring the two test series. The pressure drop across the filter during eachtest cycle is shown in Figurel3 for the climb condition. Based onthe data obtained, there was no measurable increase in pressure drop.
25

I
This would indicate that the flow equivalent time base is at least 250 hours(ten times the minimum). The airframe filter we removed after the two series.Numerous particles were noted between the folds of the filter element.Particles were sl found in the filter bowl and were filtered. ikto amillipore. Visual observation indicates these are teflon, metal slivers,small black particles which may have been wing tank deposits and othermiscellaneous debris. The overall color of tLe filter element was slightlydarker than a new element and is shown in Figure I4. The weights of thefilter element prior to and at the end of the test viere 335.8 and 336.5grams, respectively.
Airfrwe hat 1kchanger
=Opratiotal Procedure - A nmpthenic mineral oil was circulated throughthe shell lid* of the ht exchangr at a flow rate of 3-0 gpm. This oilws heatexi by an electrical heater, having a variable heat con .ol, tosimulate the heat rejected to the fuel by tne various airframe subsystems.For each test cycle, the heat input to the oil vwi set according to aschedule established during the initial test cycl.es. The heater vsenergined at test cycle start-up and do-energized 126 minutes thereafter.The heat input to the fnel durlng this period reached a maximum of 640 BTU/minute. The average fuel temperature rise across the airframe heat exchangerduring cruise conditions was 69*7, and a maximum fuel-out temperature of 270Fwas reached during the test cycle.
Results - There ve no apparent change in overall heat transfercoefi~c=ent and pressure drop of the airframe heat exchanger as shown inFigures 15 and 16. The heat exchanger units were removed after the twotest series and inspected. The inlets were clean, and the outlets werea 2 to 3 on the CRC Lacquer Rating Scale, which is believed to be no darkerthan when they were installed.
20;
L. co
ocC;C
oz
Cq
0.ENEIE oJENNE"
o MO1101o C q
27 U

EBRIS FIROM HOUSING
28

44'-
.:-o00
~OCIS
-~ E-'~ E-4
00
0 c0
E-4
291

or
co*m
cla co

k Sub!syetern
%Mtioal Prcedur The pump speed eind two throttling valves (mainengne nd ypas) ereregulated during the test cycle tý: produce thie
specified temperature increase acroius the pump subsystem and the requiredfuel flow rate.* The through-put flow rate vas 5.8, 2.7, and 2.7 gymu duringclimb, cruise, and descent, respectively. The pump bypass flow rate van0, 3.6, WAn 3.4 gym during climb c:ý-ise, anA.. descent, respectively. Theincrease in temperature across tho subsystem man maintained at 5, 10, and1C*F during these conditions, respectively. The temperature of the fuelmeasured imiediately downstream of tb* pump reached a maximum of' 280*Fduring the test cycle.
Duirin~g test cycles 1.006 anad 1-317 fuel samples were taken downstrea:, ofthe engine pump in order to analyze the engine pump wear products, if any.This wes performed because the pamp can greatly affect the results obtainedin the engine system, see Reference 4. Also, the pump contained someobjactionable materials (copper, sil.ver., and cadmium) and though these arelocated wbere they are not subject to wear, It vas advisable to make thisanalysis.
fleav~ts - The analyses, Reference 9, indicate that the amount of cop~perend -iron is normal.* The amount of silver and cadmium indicates that the p..lveror cadmium bearing msaterials In the pump are nc-.! releasing wear products intothe fuel.* The amounts reported for silver and cadmium are at the lover limitsof detectability for them~e tests.
Upon completion of the first test series the engine pump outlet wesinspected and found to be, clean. The engine pump wen removed from thesystem after the second test seri-1 and inspected. The inside of the inletfitting (Figure 17) was coated ,-: ..u a very light tan, powdery deposit tkatcould be wiped off easily r here use no deposit or discoloration evidenton the outlet fitting. 1l) spline wear was evident.* This phenomenon of theinlet containing msore deposit than the outlet occurred L.A.ng the first teatserims of Reftiveno 4 and is not unusual. It. is hypothesized that thisi'henomenon is caused by a iapid duecrease in Reyvnolds limber causingp.'.rtlc.ulate matter to delosit from the bulk fuel. The deposition does notoccur at the Ligher Reynolds Number. The pump vae shipped to the manu-facturer for disassembly and vipual tuspection. It wan reported, Reference10, that all pump components were in exoellant condition. A very slightscoring was observed on the cylind~er barrel outer stabilizing lands and ontUe corresponding surface of the port block face.* This was reported as anormal condition resulting from the effects of the cylinder batrel pressureover-lalance. * o overhaul or parts replacement wan necessary.
31

co ~ ~ (J A Q
32

* agine Filter
A 2 micron filter element was used for the engine filter in lieu of the* ~more simulative 40 micron size. Based c.!i past experience, Reference 4,, It bad
been found that the filter reflected engine pump degradation rather than fuel* ~coking. Therefore, in order to preclude possiblo pump contamina tion in the
3minder of the ena~ue system, a decision we uado to use a 2 micron nominal(15 micron abso, jte) filter. As testing progressed, it was found that the2 micron f..1wIter element perforwance was reflecting incoming contaminationand not pump contaminants.* It we decidoA to continue using this size sothat the incomning contaminants would also not affect engine component pe.--formance.
Approximately 101,,000 gallons of fuel ranging in temperature from 70 to~280*7 passed through the filter assembly &*.ring the two test series. 7 he2 micron nominal (15 micron &.solute) filter element was replaced 18 timesduring the '~.,Yo test series. The pressure drop, measured during climb condi-tions is shown in Figure 18. Replacement of the filter element due to ex-cessive pressure drop varied from 2 to 27 cycles. The solids on the filterelements were analyzed and found to be inorganic material (Reference 11).Additionally., the engine filter element l&Lsteu. longer after the fuel feeddepth filtor (2 mnicron nominal - 10 micron absolute) was changed. It wstherafore,, conaclwled that the engine filter eleients reflected depth f il-terefficiency and system debris rather than fuel tLierml degradation. Thisphenomenon was noted with respect to the airframe filter Curing the fourthtvat :*eries of Reference 4.
h~ch engine filter element removed from the system wes ultrasonically cleanedand reused. A tot~al of three elements were used for the two test series.
ftgine and Ubi-Tube Hoat &,cbangrer
Calibratlou Test Procedure - Prior to the first test series and after thesecoRdtest *tries, teG engine and Uni-Tube best exchangers were calibratedubder fluid flow and thermal conditions that pro~duced beat transfer coeffi-cients approximately twice those encountered during the normal test cycles.The purpose of these tents is to:1. * 1term~ne more accurately the heat transfer efficiency loss by using
highei- heating capacity and flowraeee.2. Determinu If a caiibration shift has occurred.
The fuel was preheated in the fuselage tank to 186 t 6*F and vas recirculatedthrough the bet exchanger*. The oil was preheated to 470 t 20?F while flow-ing through the engine and tkii-Tube beat exclwtigers at 5.46 t 0.04 gpo and0.5 gy, respectively.
The fuel flow rate was then adjusted to 1-1.65 t 0.05 gpm (71.1 lbs/sin) throughthe engine heat exchanger; this produco& a thi-Tube fuel flow rute of 0.33 gpm.The Wk-Tube oi.± flow rate was then adjus~ted (0.54 t 0.01 gam) to produce afuel-out temperature identical to that of the engine heat exchanger. After thiefluid outlet tempeamtures had stabilized, the test was repeated wiith fuel flowrates of 8.73 t 0.03 5.85 * 0.10, and 2.91 1 0.01 0m, and 0.24 t 0.01,oi16 t 0.01, and o.8A 1 0.01 ~mthrough the engine and UbliTube heatezcha^ngerw, respectively.
33

__ _ _ _ __
00Lo
C40
IE--
C0
oo
Ci)
w N n
_ _ _ _ __ _E-4
34-

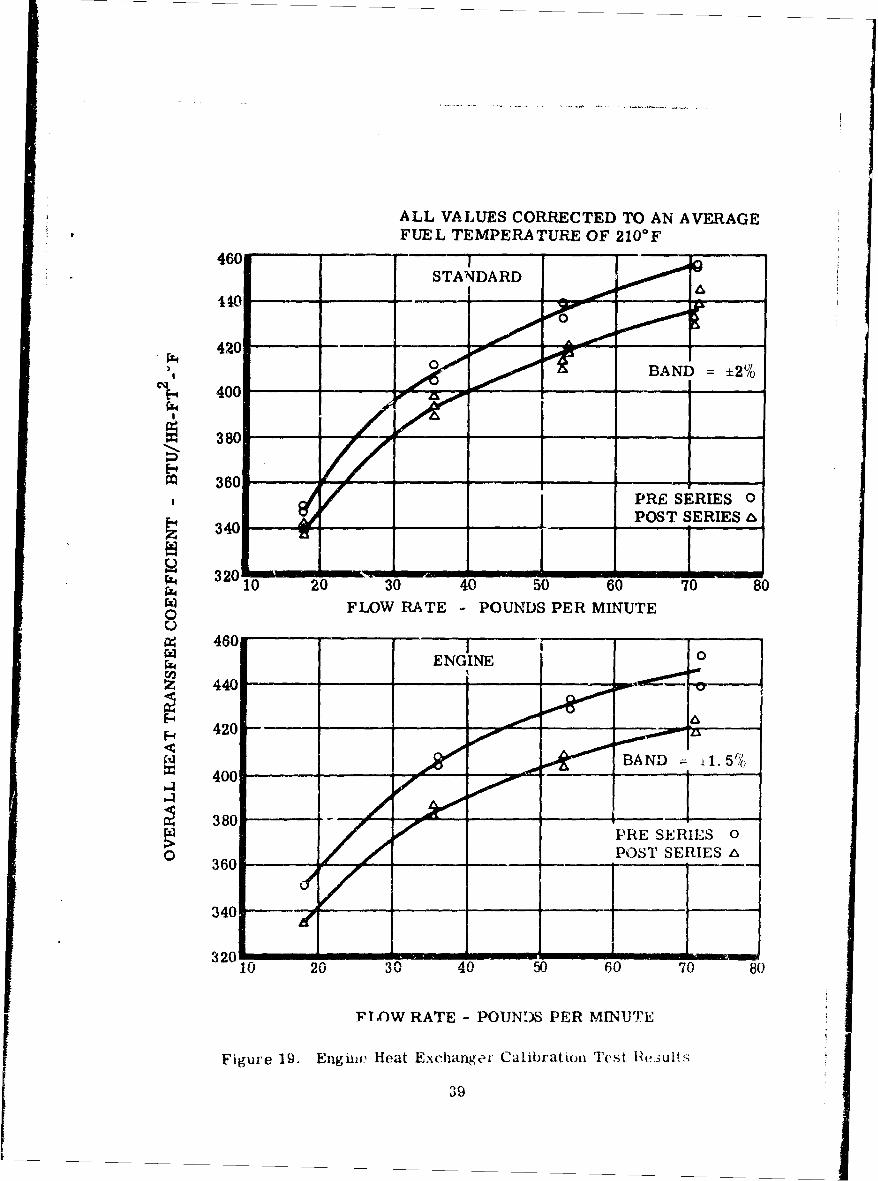
The Uni-Tube and engine heat exchanger oil flow rates were the same forall tests. The heat input for the 11.7, 8.7, and 5.9 gpm tests wasA670 BTU/Min. and for the 2.9 gpm test the heat input was 13 4 0 BTU/min.The overall heat transfer coefficient of the engine heat exd anger andthe fuel side heat transfer coefficients (outlet and average) of theUni-Tube heat exchanger were computed from measurements of fuel flow rateand fuel, oil and tube wall temperature measurements. The overall heattransfer coefficient was corrected to an average fuel temperature in theheat exchanger of 210*F.
Normal Oeratins Procedure - The shell side fluid, a napthenic mineral oil,was circulat; through the engine heat exchanger at a rate of 2.7 gpm andthrough the Uni-Tube heat exchanger at 0.3 gpm. This oil was heated by anelectrical heater to simulate the heat rejected to the fuel by the enginelubrication and hydraulic systems. During each test cycle, the averageheat input vas controlled to 540 BTU/min. as established during the initialtest cycles. This heat input resulted in an average fuel temperature in-crease across the heat exchanger of 25 and 60"F during the climb and cruiseconditions, respectively.
At beginning of descent the heater was de-energited and the temperature riseduring descent wan that resulting from the residual heat in the oil system."fte maximum temperature of the fuel out of the engine exchangers occurred¢t the start of descent and ves 340'?. fte measured emximus tube vall tempers-twue on the Uni-Tube beat exchanger was 385*F.
teAZ State Cruise TestCycle Procedure - During the perforunce of thetest cycles of the two test series, 20 "steady state cruise test cycles"were conducted approximtely every 10 test cycles. The "steady statecruise tst cycle" ccnsisted of a normal test profile except that thefuselagt tank boaters were de-energezed to permit the temperature of the fuelentering the engine and thl-Tube beat exchanger to stabilize (188 t 5?F).During this stabili-ation period, the fuel, oil, and tube wall t4mperatureswere measured with the more sensitie( lower scale) of a dual range recorder.These temperatures were then used to determine the overall heat translercoefficient of the engine beat exchanger and the fuel side heat vvzrsfercoefficients of the Uni-Tube heat exchanger. Upon completion of thisstabilized portion of the test cycle, the fuselage tank heaters were re-energized to simulate the profile during the rminder of the test cycle.
35

Uni-Tube Beat Excbanger Discussion - The purpose of the Uni-Tube beatexchanger is to obtain fuel side heat transfer information which can beused to determine the fuel side heat transfer efficiency loss of the engineheat exchanger. The design of the Uhi-Tube heat exchanger is delineated inReference 2. The two configurations (1 and 2) discussed therein weretested during the pre-test series calibration tests, and it was found thatthe tube wall thermocouples of configuration 2 were the most sensitive totube wall temperatures and, therefore, more sensitive to fuel degradation.However, these thermocouples were not as sturdy as those of configuration 1,and four of the ten thermocouples were inoperative at the end of the cali-bration tests. The remaining six thermocouples produced temperature measure-ments which were internally consistent ind agreed with measurements madeduring previous testing, Reference 4. lurthermore, the oil side heattransfer coefficient was calculated based on these temperature measurementsand compared to the theoretical heat transfer coefficient for an annulartube in the laminar flow range. These values were within 5.3% of eachother. Therefore, it is considered that the Uhi-Tube instrumentation isreliable as a source of data for fuel degradation.
The flow rate in the Uni-Tube is not exactly the same as the averageflow rate per tube of the engine heat exchanger. However, this deviationis such that the effect on the difference in tube vwll temperature betweenthe Uti-Tube and engine heat exchanger is calculated to be 5*F during thetest cý-le. Therefore, when the maximum measured tube mail temperature inthe Unh-Tube is 385"F, the maximum tube wall temperature in the engine heatexchanger should be 3W0F. Therefore, it is regarded that the Uhi-Tubesimulates the temperature environment of an Average tube in the engine heatexchanger, and the engine heat exchauger fuel side heat transfer coefficientcan be calculated from the fuel side heat transfer coefficient of theUni-Tube heat exchanger.
Results - The calculated heat transfer coefficients for the engine andstandard heat exchangers, obtained during the calibration tests, are shownin Figure 19. As evidenced by the decrease in the heat transfer co-efficients of the standard heat exchngr, a calibratioa shift occurredbetween the tests. The engine heat exchanger calibration test resultsindicate the same decrease within the repeatability of the test results;3% tand. Therefore, it is concluded from the calibration tests that theoverall beat transver efficiency was not measurably affected by the fuelthermal stability.
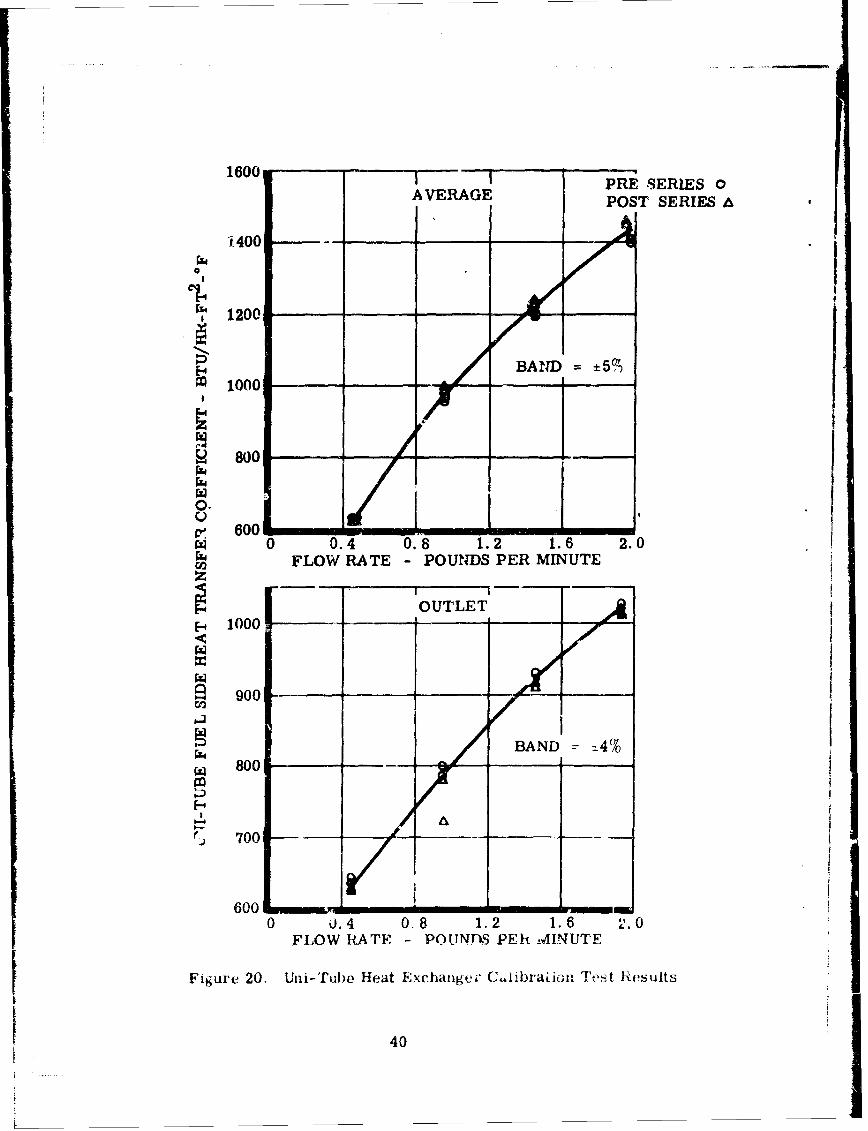
The results of the Uni-Tube calibration tests are shown in Yigure 20.These resul,.s indicate that the fuel side heat transfer efficiency was notmeasurably affected. Since this fuel side heat transfer efficiency on theUni-Tube did not change and the overall heat transfer efficiency of theengine and standard heat exchangers decreased, it can be concluded thatthe oil side heat transfer oefficient decreased. Based on the results
36

shown in Figures 20 and 21, it has been calculated that the average oilside heat transfer coefficient measured during the calibration tests haddecreased from 660 to 622 BTU/hr-ft 2 -*F (average for all fuel flow ratessine oil flofrate mas the sea). This decrease in oil side heat transfercoefficient caused the decrease in the standard and engine overall heattransfer coefficients. This is further evidenced by the results obtainedduring the test series, Figure 21.
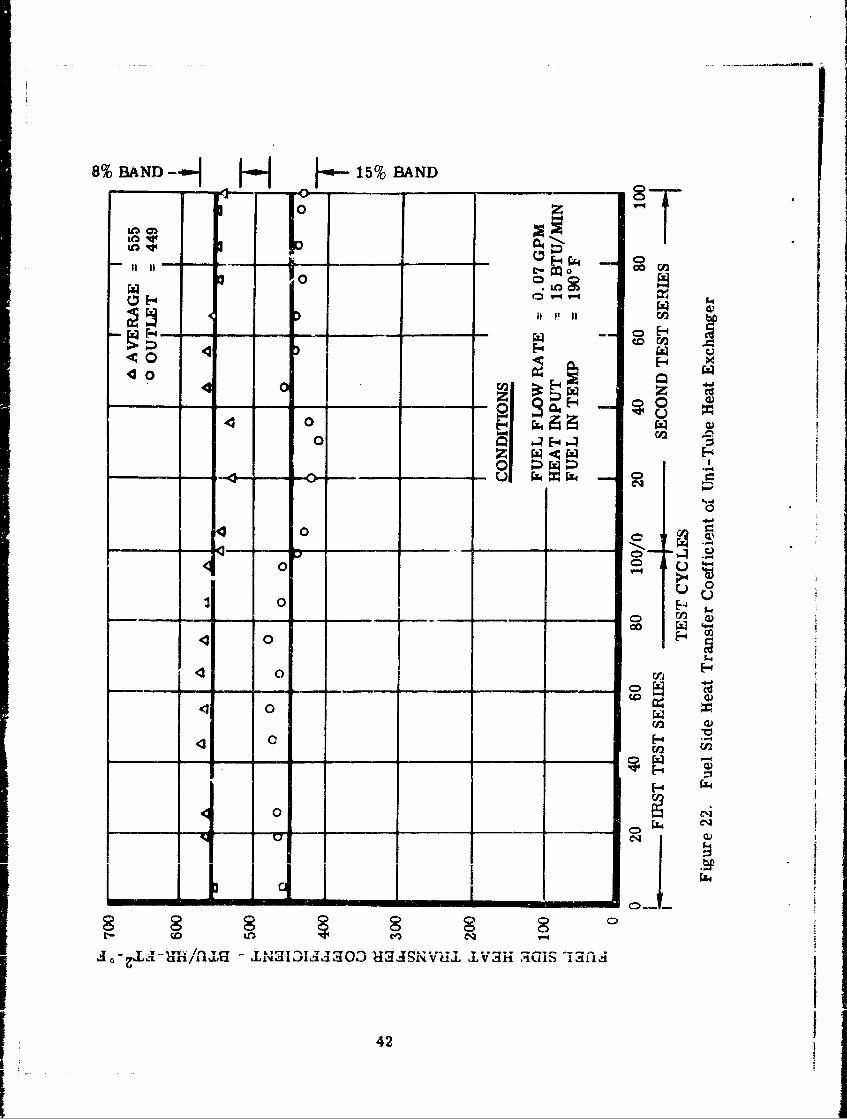
As shown in Kgwre 21 the overall heat tran fer coefficient for Phefirst 75 test cycles of the first test series vas 231 +3,-5 BTU/hr-ft -OF,and for the ze ining 125 test cycles of the first and second test series,the coefficientias *5 * 5 13TU/hr-ft 2 -*f. Using the absolute values of oilside heat transfer coefficie.nt obtained during the calibration tests, itwas found that the ratio of the oil side heat transfer coefficient beforeand after the two test series was 1.05. It can be. shown that this ratiois equal to that of the noral test cycles. Using the Uhi-Tube fuel sideheat transfer coefficient obtained during the test cycles, Figure 22, andcorrecting this value for the higher fuel flow rate in the engine heatexchanger, it was founf that if the Initial overall heat transfer coeffi-cient is 231 BTU/hr-ft -*F, as was measured, and the ratio of initial andfinal oil side heat transfer coefficient is 1.05, then the overall heattransfer coefficient at the end of the test series will be 224 BTU/hir-ft 2 -'F.This is within one unit of the actual average measurement. It is thereforeconcluded from the test series engine heat exchanger data Lhat the overallheat transfer efficiency was not measurably affected by the fuel thermalstability. This is affirmed, by jressure drop measurements shown inFigure 23 and visual inspection of the engine heat exchanger, Figure 24.
The fuel side heat transfer coefficient of the Uni-Tube measured duringthe test series is shown in Figure 22. The average and outlet valueswere 555 and 449, respectively. There appears to be a trend indicating thatthe outlet fuel side heat transfer coefficient decreased. This coefficientis measured at the location wherein tube wall temperature is the highestand, therefore, wherein deposition should be the greatest. It is ccusideredthat the outlet fuel side heat transfer actually decreased; ho,7ever, thisdecrease is not sighificant with respeot to overall heat exchanger per-formance.
Inspection of the engine heat exchanger after the series and beforeit was bisected indicated that the CRC color scale rating of the inlet andoutlet was 0 and 2-3, respectively. The inlet and outlet mating fittingsratei 2 and 8-9, respectively. Here aguln, as pointeA out in the engineplmtp section, areas of low %ynolds numbers have greater deposits eventhough the temperaturew are the same. The heat exchanger was then bisectedand the outer shell removed. Three tubes from different locations Ln theheat excbhaLer were cut open and it was found that they were consistent incolor. A photograph of hslf the exchengar and one bisected tube is shownin Figure 24. Inspection revealed that the oil side contained no deposits.The fuel inlet was discolored, rating less than 2 on the CRC Lacqu0-r Rating
37

Scale. The deposits became more prominent toaerd the fuel outlet vbere thetube ws rated a 3 on the CRC Lacquer Ratirn Scale. It Is noted, forfuture inspection purposes, that this beat excbanger appeared to have afuel side depoeit brovn in color vbose IntoAty lay approxclately uid.wvbetween the second end third test series beat excasers reported inJaference 4. These heat. abhaagers, Reference 4, were reported tDbave hadno measurable loce in beat transfer elTiciencyi
38
ALL VALUES CORRECTED TO AN AVERAGEFUEL TEMPERATURE OF 210°F
460STANDARD
420 pop4 BAND = ±2%
E4 400
380
360, •PRE SERIES 0
__ _ _ _ _POST SERIESz 340
I •~rr 32010"""20 30 40 50 60 70 80
w FLOW RATE - POUNDS PER MINUTE
9 460
z 440
420-
400
380 PRESRIES _
0 360 .... •OST SERIES A
360
320 .. . .10 20 ., 40 50 60 70 80
FLf)W RATE - POUNr)S PER MINUTE
Figure 19. Enghm, Heat Exchanger Calibration Test P1:keults
39
1600 PRE SERIES o
AVERAGE POST SERIES
1.400 A
___ ___ ___ /00S1200
BAND ±5%)m 1000
~800
0.
•. 6000. ,.0 0.4 0,8 1.2 1.6 2.0
FLOW RATE - POUNDS PER MINUTE
'OUTLET,
1000
BA _ _ _ _4
900
• -/ ~BAND= 4
N 800- t
'1• 700
600 ,it,0 o.4 0-8 1.2 1.6 2'.0
FLOW RATE - POTINfkq PElh M4INUTE
Figure 20. Uni-Tube Heat Exchanger Clibrailn Test Results
40

a ~I F'~6% BAND
_ _ _ L- 0j0b
to V-4
Nl ~ oc
r34rz 4
00
00 U 44 0~
00 4
0E-4
Q)
___ ---I_ _ _M
___I __ ___ _D
41
8% BAND--] 15% BAND
SIIu zjII z 0-
o W0
UM 4CI Vz14 V-4
oI
to
0
4 w
- oz
4 0 W
<30 0..
C1
0H
00~o-&~1ih .4-f 0L-3I~O UUlNL 443 mmIS 44f
42-
co
.N44 0 cri
oC8 8 8 8 8 CO
3, •T.I .. . h, 0-•n/ • N.ID~IISID •IgV}II.,LV'q •GS i~ilV
04

00
it
CM,
rza
~zI $4
Cto
Ch
0 0>
0- -
Isd -ou aOmnUfSS3ud
43

A COtIO rFACg
E-44
' -C d
:4.4
Af
7Aq
v4C

Ibnifold
Normal Operatin Procedure - The manifolds used in both test series were0.3125" 0.D. x 0.02" wall 321 stainless steel tubing. Electrical connectortabs were welded to the center and ends of the manifold to permit terminalresistance 1-eating. The manifold tubing adjacent to the tabs at the endsand center are relatively unheated. The heating power supply was energizedat test start-up and the power output controlled to produce the fueltemperatures indicated below. This heat input is used for both climb andcruise conit.lons.
Beated Heat Input** Fuel Temp.** Maximum FuelTest Series Iength, In.* ATU/Iin. Increase, *F Out Temp. *F
First 115 846 85 ± 2 600Second 94 495 51 ± 1 500
*Distance between outer electrical connectors**Fuel-in temperature & 290*F, cruise conditions, steady state test cycles
During des.±ent when the fuel flovrate was decreased from 2.7 gpm to0.68 &pm, the fuel outlet temperature increased to 600'F during the firsttest series and 500*F duiing the second test series. This maximum tempera-ture is obtained within one minute and then is slowly decreased inaccordance with the profile requirements by decreasing the power supplyoutput.
Temperature Measurement Discussion
Six thermocouples were located -n the outer vall spaced down thelength of the manifold tube to provide a measurement of heat transfercoefficient which in turn would permit a determination of fuel depositson the Inner tube walls. The method of thermocouple attachment vasinvestigated since it was evident that attaching the thermocouple directlyto the tube wall would produce erroneous measurements. This error iscaused by the t•.....couple, and hence the temperature recorder, beingsubjected to a portion of d-c heating voltage applied to the tube. It wasdecided to use a method of thermocouple attachment reported, Reference 12,to be successful under these conditions. This consisted of electricallyisolating the thermocouple from the tube with a thin sheet of mica. A narrowstrip of glass tape was then wrapped around the tube over the thermocouplefollowed by a layer of asbestos, and a circular retaining clhmp was usedto hold the assembly on the tube. This method proved unsuccessful due tofracturing of the mica when the thermocouples were flexed during insulationof the manifold. Tt was decided tome one layer of glae• tape instead of
45

the mica. *his method vas used in the first test stries ani proved to beunsuccessful. The temperatures meassured were below the anticipated values;I .e.,, during cruise conditions there was a diBcrep!ncy of 20 to 40*F. Theanticipated values had been calculated using the following equation:
tv t + Q]/A (1/0-027 k-.. N~e0. N~rl/ (,"/,U) o4+ Xw/l,.j)0.8 1pr/3 )0.1+
where: tw - outer wall temperature at a given distance from thein] et, 'F
tf bulk fuel temperature at the same distance, F
Q/A fuel heat input flux, )"TU/hr-Mt 2
k z therval conductivity of the bulk fuel, BTU/h-ft2 -F/ft.
D inner diameter of the tube, ft.
N Prp= nolds and Prandtl numbers, respectively, of the
bulk fuel, dimensionless
ratio of the viscosity of the bulk fuel to the fuelfilm, dimensionless
x. = manifold wall thickness, ft.
kw = theral conductivity of 321 stainless steel,BTU/hr-ft 2 -'i/ft.
At the beginning of the second test series, other methods of thermo-couple attachment were tried because of the discrepancy found in (,he firsttest series. The most accurate method found was the tack-welding of astainless steel sheathed thermocouple directly to the tube and isolatingthe temperature recorder from ground. However, these thermocouples are aspecial order item (delivery in six weeks) and therefore, were not availablefor use in the second test series. The next best method was to tack-welda constantan wire of an iron-constantan thermocouple around half the cir-cumference of the tube and then tack-weld the 4'ron wire on top of theconstantan wire. A test cycls was then cunducted ar% the difference hetveenthe nnticipsted (as calculated from the above equation) and measuredtemperatures were 0 to 9"F for the cruise conditions. This was consideredacceptable sInce the discrepancy was within the 1btional Bureau of Standardslimit of err-or fr the thermocouples.
4+6

Results - The deposit thermal resistance (xd/kd), which is discussed inSection IV, was calculated for each thermocouple location on the first r•d
seeond test series manifolds. The values obtained for the leposit therni-11r",.istance at each location are as follows:
Maximum Fuel Film Deposit Thermal ResistanceThermocouple Temp., *F, for (xd/kd), Mil-hr-fte-*F/BTU-ft,Position Test Series No. for Test Series No.
1* 2*W lW-" 29M
2 495 510 0.7 0.83 545 510 1.7 1.04 585 520 1.8 1.25 625 555 2.8 2.06 6-10 575 4.3 2.4
*lTemperatures determined from metal temperatures measured during first
steady state manifold test discussed in Section IV.
**Temperatures determined from metal temperature measurements duringsecond test series.
***Determined from increase in metal temperatures during first test series.
****Determined from equation shown In Section IV.
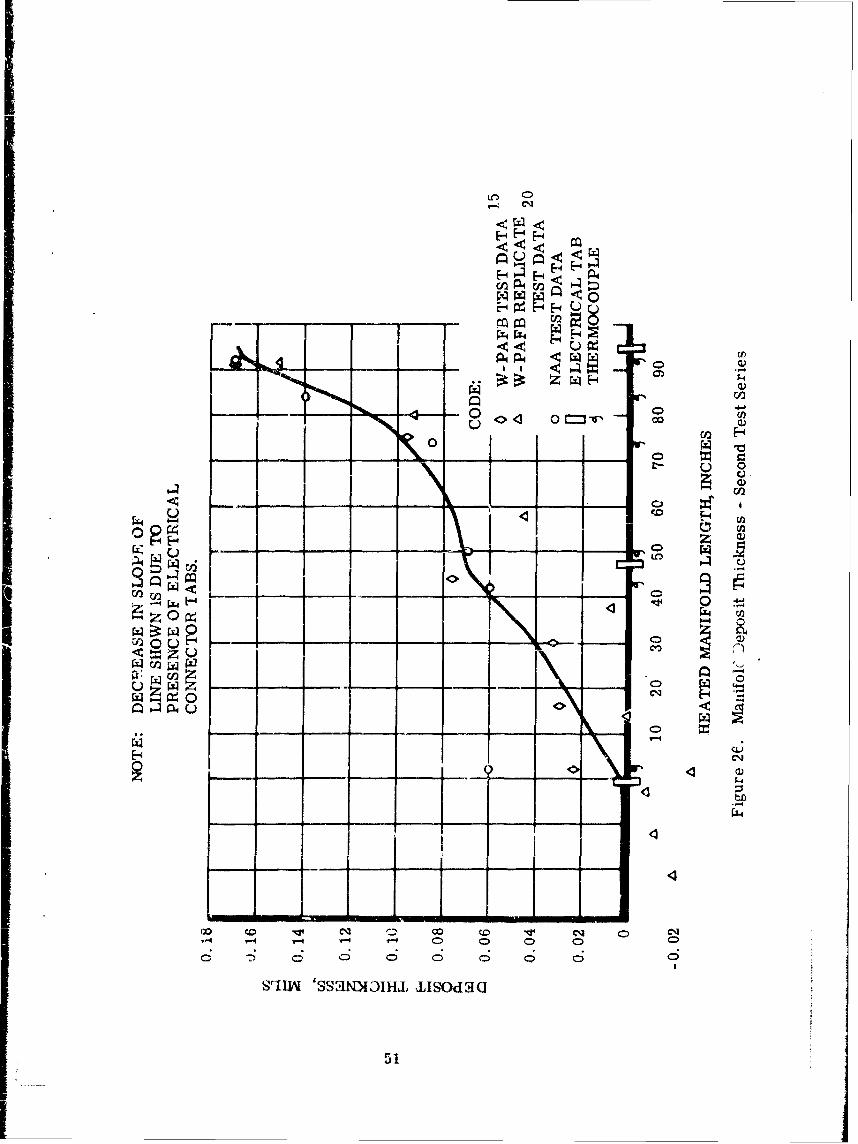
The above values of deposit thermal resistance were conve-ted todeposit thickness, in mile, by multiplying each value by a deposit thermalconducti'rity of 0.07 BTU/hr-ft 2 -*F/ft. This choice of 0.07 is tie averageof 0.09 (the thermal conductivity of deposit-like materials) and 0.05(the deposit thermal conductivity reported in Reference 13). Thesecalculated deposit thicknesses for the first and second test series manifoldsare shown in Figure& 25 and 26, respectively.
Also shown in Figures 25 and 26 are calculated deposit thicknesses basedon carbon analyses performed by NASA (Reference 14) and W-FAFB (Reference 15)laboratories on samples of the manifolds. The analyses conducted by W-PAFBwere performed on a laboratory Equipment Corporation (LECO) Model No. (34-200Low Carbor Analyzer. The range of the instrument is 0.5 to 5000 ppm carbonfor one gram samples. The sensitivity at the lower end of the range inderroper conditiona is 0.5 ppm carbon. The deposited wanifold tubing sampleseight for each manifold) ranged in carbon content from 772 to 1515 ppm
carbon for the first test series and 530 to 962 ppm carbon for the secondtest series. The deposits were removed from a sample of each of themanifolds and the stainless steel was anlyzed for carbon content. Thecarbuon content of these blanks (stainless steel alome) was found to be 717
47

and 547 ppm for the first and second test series manifolds, respectively.The carbon content on the deposit in each sample ue calculated as 'hedifference between the carbon content of the sample and the blank. Theamount of deposit on each cample (micro-grams deposit per gram of sample)was reported as this value multiplied by 1.50 (assumes that deposit is67 pernent carbon). The analyses performed by 4ASA were conducted in muchthe sawe manner except that the carbon in the stainless steel did not haveto be ascertained because their tests were conducted to give the carbon contentonly in the deo sits on the samples. The reported deposit contents of themanifold tube (the first test series manifold was analyzed by NASA and W-PAFBand the second test series manifold by W-PAFB) were converted to depositthickness by using 0.9 as the specific gravity of deposits. These calculateddeposit thicknesses are shown in Figures 25 and 26. Also shown in these Figuresare the results of a replicate analysis by W-RA(Reference 20).
Independent of this determination, AFAPL (Reference 16) calculated theincrease in metal temperature Lhat should result from the amount of depositsamlyzed on the first test ser es manifold.
Tbh calculated values were within 10 percent of those actuallymeasured during the test series. The assumptions made in the calculationswere as follows:
1. The change in temperature is caused by conduction only; therefcre, thechange in metal temperature is equal to the heat flux multipliedby the deposit thermal rpsitance.
2. The specific gravity is 0.9 based on the coaposition of depositsin tubes given in Reference 17 and a survey of organic compounds,Reference 18, relating to the deposit analysis.
3. The thermal conductivity is 0.1 BTU/hr-ft 2 -*F/ft based on comparablematerials to fuel deposiLs (i.e. powdered coke and paraffin vax).
The agreement between the calculated deposit thicknesses as determinedby deposit tbernml resitance and carbon analyses indicates that these maybe reliable methods of dete'nining the thermal stability of the fuel withrespect to the manifold.
The pressure drop of the manifolds used in first and second test seriesis shown in Figure 27. There was insufficient amount of fuel deposit tocause a measurable increase in pressure drop. A photograph of each of thetwo bisected manifolds is shown in Figures 28 and 29.
In addition to the above performance parameters, the color of the depositson the manifolds were rated with the CRC lacquer Rating Scale. Since it isregarded that color is inferior to performance changes in quantifying deposits,the results of these reatings are not reported. Brwiver, an interestingrelationship between the deposit thickness and the color'atings is shown inFigure 30. This plot was made by comparing the CRC Color Rating for each ofthi mnifolds against tte deposit thickness an determined in Figures 25

iI
and 26 When the deposit thickness was 0.1 ,ail or greater, the manifold wasrated a , or 10. In other words, above 0.1. mil the CRC Lacquer scale isInsensitive to deposit th.•ckness. Below 0.1. il.. V4 senuitivity of thecolor scale, i.e., the relative change In i1%ting for a given change indeposit thickness, increases with decreasisng deposits. It is most noteworthythat the relationship between the deposit thickness and color is 0ot linear.This indicates that performance in terms of color can not be Indiscriminatelyextrapolated or interpolated on a linear basis. It is intended, during, thenext test series to make up a scale consisting of innifold tube sepientswhose deposit thickness can be determined and rating this scale with theCRC lacquer Scale and thle Tuberator, Heference 1. Thereby, a more detailedanalysis can be made of the relationship of color and deposit thickness.
i49

rn
P.44 *, 4 N
C=-V M
0 0
PU
in IR-4-
05
LO 0
co m
rzri
_____ 0 n~Z a)
CD ,
0f- 0
00
~z C
_ _4 0
___i Is a.'1 'lo s
51-

F-4Y
cCc,
cccII)
521

'4H
0
Iw
(12
H(12
�L4
Ii
�, .i

CCOO
aini
54-

0.32-
0.28
0.24 -
FRS'T &SECOND TEST SERIESMANIFOLD ~
0.20 -_ _ _
0.12
0.16-08- ___
~0.04 - -t_--,_
AMA
0 1 2 3 4 5 6 7 8 9 10CRC LAQUER RATING SCALE
Figuie 30. Comparison of Color Versus Deposit Thickness
55
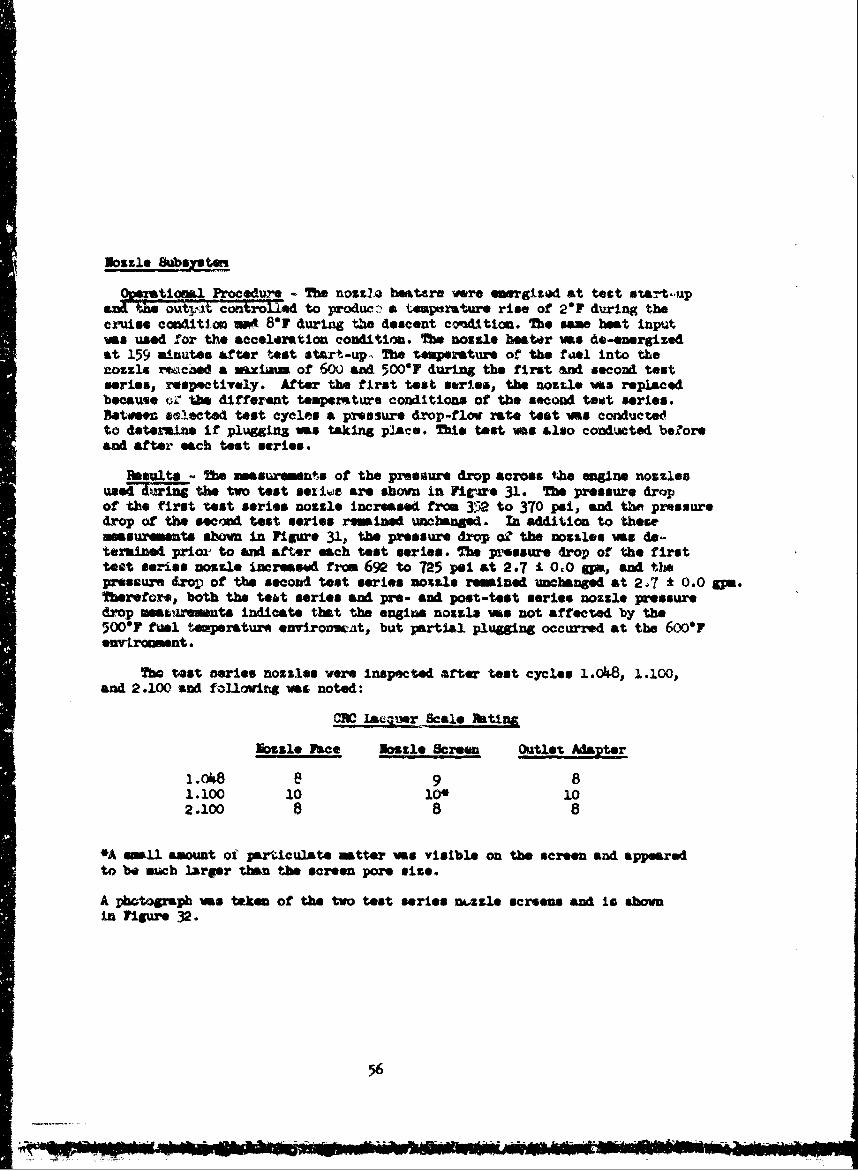
Nozzle ubaystm
gndrstiorAl Procedure - Me nozzlo heaters were essrgized at tect start..upa Woui7 con Tro ed to produc.Ž a tmpesrature rise of 2F during thecz'uiss condition sI 8"F during the descent condition. The same heat inputws used for the acceleration condition. fte nozzle heater ws de-energiz*dat 159 minutes after test start-up, The temperature of the fael into thenozzle rwchWd a mximum of 6W and 500*F during the first and second test"series, respectively. After the first test series, the nozzle vaa replacedbeause o the different temperature conditions of the second test "eries.Retwem selected test cycles a pressure drop-flov rate test vas conductedto determine if plugging vs taking place. This test was ilso conducted beWoreand after each test series.
aeults - The masurelnts of the pressure drop acrost the egine nozzlesuse !n the two test sezrie are shown in ?irne 31. Mw Pressure dropof the first test series nozzle increased from 352 to 370 Psi, and the pressuredrop of the second test series rainmed unchened. In addition to thesemeasurments shown in Figure 31., the pressure drop oZ the nozzles mes de-termined prior to ant after each test series. no pressure drop of the firsttest series nozzle incre•ad from 692 to 725 pai at 2.7 1 0o0 pan, and thepressure drop of the second test series noxzle relined, unchanged at 2.7 t 0.0 sya.Therefore, both the teot series and pre- and post-test series nozzle pressuredrop msawumeuents indicate that the engine nozzla ws not affected by the500*F fuel temperature environveat, but partial plugging occurred at the 600"Fenvironment.
The test -eries nozzles were inspected after test cycles 1.08, 1.100,
and 2.100 and folloving ws noted:
CD iacwnr Scale atimn
Nozzle Face Nozzle Screen Outlet Adapter
e 9 81.100 10 10 102.100 8 8 8
*A mll amount of particulate imtter us visible on the screen and appearedto be much larger than the screen pore size.
A photograph ms taken of the two test series nuzzle screns and in shownin Figure 32.
56

- - .0
0 rill
to F-
SC.) P
_ _ 00
LO,
bi,
co
oo 0
l 0ol 1arsal57N

NNN
rz
z0
rJ2A
4 4-
t 140 1 4NV jV
I~~ ~~~ zIIIIII I I Ii .iIIw
58f

Additional laboratory Analysts
In addition to the laboratory analyses described above in Lheappropriate sections, samples were taken for hydroperoxide number, oxygencontent, and fuel. tbresh~ld fai.Lure tempamture determination.
#ydrcperoxide lumber - Fuel samples were taken of the fresh feed and theeuselage tank outlet, engine beat exchanger outlet, and minifold outlet atthe beginning and the end of the cruxise condition of test cycle 1.006. Thehyd~roperoxide numbers were all the samt (<0.05 milliquivalent of' activeoxygen per liter of sample), &Reference 9.* This value is reported as thelov~er limit of detectability. No further analyses were made because thedata appeared to be of little value relative to its use.
Threshold Failure~ rature - The resmlts are shown in Section V withother small scale therml stability tests.
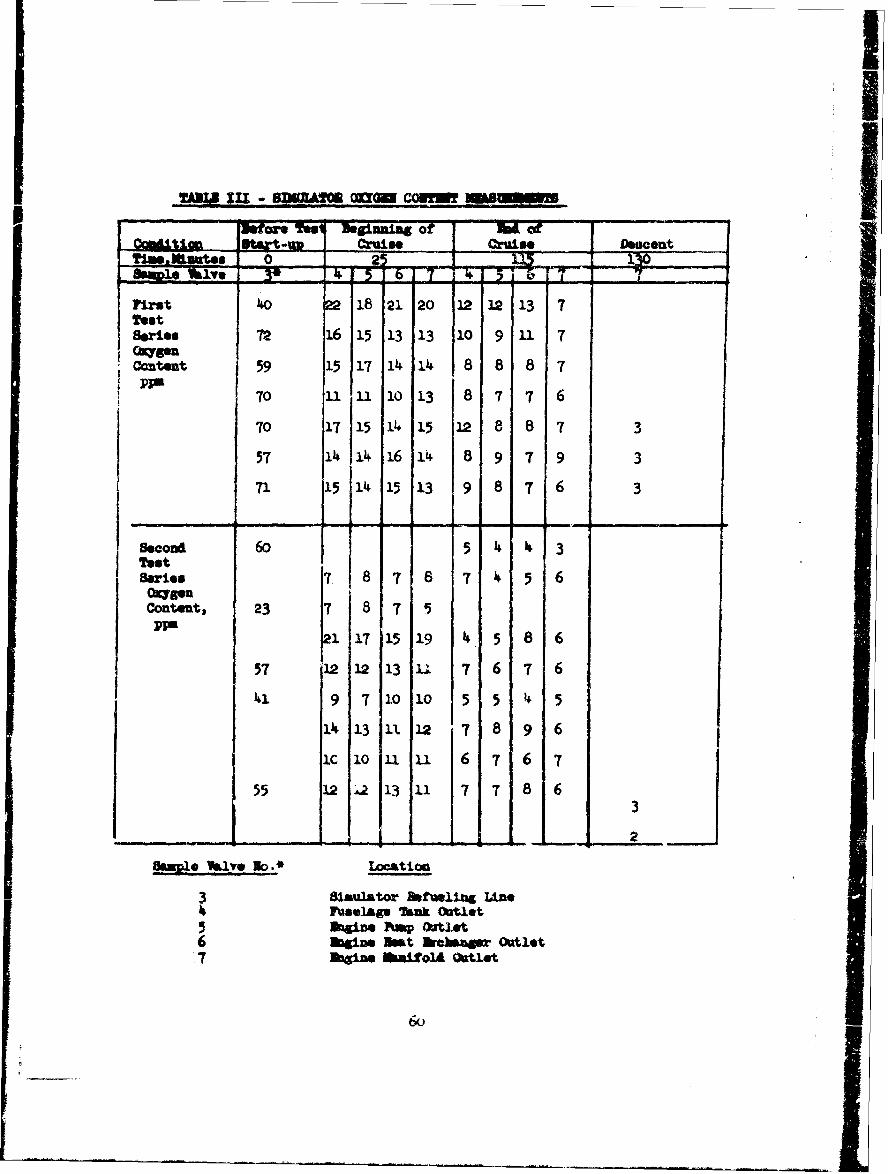
Maygn Content -The dissolved oxygen in the fuel was measured during thefirst and second test series, Reference 19. Therein is a disconssion anddescription of the equipment employed and the results obtained.* The basicitem of equipaent. used in these analyses is a Perkin Elmer 154~D VaporFractometer. The results obtained are shown in Table III with each line ofdata representing one test cycle.
The levels of oxygen reported for the iacoming fuel are typical for airsaturated fuel.* The drop from the saturated level to 10-15 ppm. duringcruise is probably the result of two mechanisms. Oxygen is evolved underreduced pressure in the fuselage tank and also oxygen is consumed by thefuel as temperature is increased. It haa been shown in other testing,Referenc~e 21, that dissolved oxygen does not begin reacting noticeably vitha fuel until 35007, Consequently, it ts hypothesized that the drop in oxygenat the beginning of the cruise is due primarily to the evblution of gas wbenthe tank is evacuated and the change from cruise level oxygen c-ntent to3 ppm during descent is .aused by the high temperature (500 to 600*F) reachedby the bulk fuel.
j1illi2ore Filtration
During test cycle 1 .0440, fuel samp~les were taken from the simulator andfiltered tbrougb 0.145 rrdcron Willipore filterz. A photograph of these filtersis shown in Figure .33. At a fuel temperatulre between 390 and 4I20OF adefinite darkening of the filter it evident indicating particuLate generation
emr the 0.45 micron.
59
TANSZ3 U - gel&%O cxCIU COWUT3
ams Cruisie Lmscent,0 25
First 0 2218 21 20 12 12 13 7TestSeries 72 16 15 13 13 10 9 11 7
I~ s
1 Ocmtet J59 15 17 14 14 8 8 8 770 111 1013 8 7 7 6
70 17 15 14 15 12 8 8 7 3
57 14 14 16 14 8 9 7 9 3
71 15 14 15 13 9 8 7 6 3
Secon 60 5 4 - 3
Stries 7 8 7 8 7 4 5 6OxygenContent, 23 7 8 7 5PPI
21 17 15 19 I4 5 8 6
57 12 12 13 11 7 6 7 6
I1 9 7 10 10 5 5 4 5
A• 13 IN 12 7 8 9 6
ic 10 11 11 6 7 6 7
55 12 ý 13 11 7 7 8 63
Smmmle vlave No. ~ Location
3 81au1-tor feft1ling Line?4 FU~w1ig* Tank Outlet
5 mabine Ftp Ocalet6 2bgine Neat kcm.amme outlet7 Baal=n walmto1d outlet
6o

0 0O
cqq
44:9
CO0
1I4 W,
o yo
C)~ U-3
coo
F-44
:D -ý
0'
44)PQ:
1-41-

SECTION IV
SIMUIATOR STEADY STATE MAJFMOID TESTS
The purpose of the steady state manifold tests is to determine therate of deposit formation of fuel AFFB-8-67 under constant temperatureconditions. This data is compared to the data obtained during the cyclictests and vill be used to provide a basis or correlation to the smll-scsaletests which are operated in a steady state manuer. The manifold was testedmnder steady state cinditions because it was the only engine component whichyielded quantitative deposit data during the cyclic tests. Two steady statetests were performed to cover the range of teapsraterm experienced in thefirst and second test series at the same heat flux. The more accuratesheathed thermocouples were used in the second steady state mnifolA test,and therefore, these data are analyzed more thoroughly in this section.
STEADY STATE OPEPATIONAL PROMC
Upon completion of the second test series, two steady state tests wereconducted. The wing tank, engine nozzle, and Uni-Tube heat exchanger werenot used in the system, and a new manifold substituted ftr the second testseries manifold. The heated length of the manifold was 115 inches, as inthe first test series, and 10 thermocouples were attached by the method usedin the second test series. The steady state test consisted of running thesimulator for 13.5 hours at the peak descent conaitions of the first series.The fuselage tank vms continuously refueled to replenish the 0,68 MMu flowrate out of the system. The fueltemperature into and out of the manifoldwas 340 and 600oF, respectively for the entire 13.5 hours.
The scend steady state test was conducted using a nw manifold and10 sheathed thermocouples attached to the tube wall. The test was conductedexactly as above for 43.5 hours except the manifold fuel inlot was con-"irolied to Ž.O0: and the fuel outlet to 4607F. This trst r%--Pied i•iTidegradation rates for lower metal or fuel film temperatures.
RESULTS
The fuel can be quantified with respect to its therml stability in themanifold by a descriptor more useful than fuel side heat transfer coefficient.This is the deposit thermal resistance or the thickness of the depositdivided by the thermal conductivity of the deposit. It can be shown thatthe deposit ths:aal resiatance for the manifolds used i= def i ned 1- thefollowing cq~ation:
24 7 12 D 7 -; .
7-boQ 0.027 k 4 4 k
62

where" xd = thicknavs of deposit, inches
kd = thermal couaductivity of the deposit, BTU/hr-ft 2 -"F/ft.
H
All other terms are defined in Section III.
The results obtained are shown in Figures 34 and 35. Figure 36 shownau actual computerized plot of the calculated values of xd/kd. Ths use ofthe deposit therm]. resistance offers three &dvantages over the fuel sideheat transfer coefficient. One, it can be directly comared to the depositthickness measured at the end of the torts; two, it can be added to theinverse of the initial fuel side heat transfer coefficient, at whateverlevel it my be and determine the +inal heat trau fer efficiency; andthree, constant errors due to thermocouple ard recording equipment errorare minimized.
The equaimon given above is derived by assuming that the fuel side
best transfer coefficient does not change as the deposit builds up. Theoverall heat transfer efficiency dncreases due to the thermal resistanceof the deposit. This approach was ised in Reference 13 and many textbookson heat transfer. It is noted that this assumption would not be true ifthe ratio of deposit thickness to tube diameter increases to the point wherethe Reynalds Number in significantly increased. Using this assumption, atemperature profile of a radially cut tube would appear as follows fox thesame flow and heat input:
INCREASE DUE DE PO)SITSFUEL FILM
FFUEL
FILM TEMPINCREASE WWALL WALL
NO DEPOSIT'S DEPOSITS
63

It Is seen that the fuel fila temperature is the same regardless ofthe amount of deposit. Therefore, it woald be reasonble to assume that therate of deposition, which should be depedent only on temperature, wouldbe constant. However, the results obtained indicate that the deposit ratedoes not become constant until the deposit thickness reaches a certainlavel. This initial non-linearity my be attributed to a surface conditionmechanism. As deposit builds up on a bae metri vall, the cbaracter andextent of the surface on which the depAit is forming is changing. Itappears that deposition is occurring blowly on the stainless steel wall,and the rate increases as the m1ll adJacent to the film becomes deposited.At some finite deposit thickness, the entire wall vll be coated with aporous deposit whose characteristics are not substantially changing and thedeposition .ate, thereafter, should be linear.
It appam from the res"'ts, shown ia Ftares 34, 35, and 36 that thistheory of deposition maybe valid and the thermal stability of fuels testedin the simulator may be quantified by th:t mothod.
The amount of carbon in the steady state manifold tubes yas &anlyzed(Rsferences 15 and 20) by W-PAFB laboratories in the same manner describedin Section III. These values were converte" to deposit thicknesses usingthe now conversion constants and are show in Figure 37. Also shown inFigure 37 are the calculated deposit thicknesses determined by MAM fromtVe deposittmemal resistance as described in Section ill. The original datafrom W-FM on carbon content of approxisately half the deposited tubeswere lower than the blanks (stainless steel alo&e); tbherefore many of thedata points plotted in Figure 37 are neiptive. It is not known at this timewhy the carbon analysis results of the steady-state manifolds are not In asgood agement with the thicknesses determiaed from deposit thermal re-sistanee as those of the test series manifold. It &ppeas from the visualobservations of the tubes and the od1ious fact that dtnoit thicknessescannot be negative that the thicknesses calculated from deposit theralresistances are more valid. It is ncted that the deposit thickness ofthe first rteady state manifold does not increase after the secondelectrical tab. This is attributoc in part toerroneous temperature masiure-mente causid by the less acceptable method of thermocouple attachment usedon this manifold. Therefore, in the correlation which follows the data ob-tairied on the secon steady state manifold (instrumented with sheathedthormocouples) are used.

CORRELATION OF STEAM-STATE TO TEST CYCLES
The data obtained from the steady-state tests and the test series werea-alyzed with respect to each other. This was accomplished first for the3econd test series manifoll (whose temperatures were more accuratelymeasured) by determining from Figure 35 the slope of the deposit thermalresistance, Xd/kd versus time, 9, for each temperature location on thesecond steady seta e mapifold. This was determined for an j.d/&kd change of2 Mils/BTU-ft/hr-F*-ft'because the second test series manifold experienceda change of this magitude. The xd/kd 0 was then plctted against the filmtemperature and in shown in Figure 38. A filM. temperature versus timo plotwas then made for each thermocouple location on the second tct seriesmanifold from the original test cycle data (metal temperature -15*F whichallows for the .Lemperature chauge across the metal wall). Based on thisfilm temperature profile for each thermocouple and the xd/kd 0 versus filmtwTamture, a plot of xd/kd 0 versus test cycle time wa drawn for eachthermocouple location. The area under each curve is the deposit thermalresistance accrued for one test cycle. The area below 375"F vas neglectedbecause it was demonstrated that the deposition is negligible below thisfilm temgerature. The values of xd/k • ere multipliad by 90 test cjclas and athermal conductivity of 0.07 BTU/hr-ftN /ft (see Section III) to obtainthe deposit thickntoges _redicted on the basis of t he Gteady state data(xd/kd 0 = 15,600 e-6500/T). These deposit thicknesses were then plottedagainst the average deposit thicknesses obtainel from Figure 26. A plot ofthhis comparison is shown in Figure 39. The above procedure was repeatedfor the first test series mnifold, and the coaparison is also shown inFigoire 39.
The comparison obtained on the second tast series is better than thatof the first test series. It is considered that this is due to the moreacceptable temparature measurement method used and the more applicable useof the denosit thickness predi~tion equaticn, i.e., within a xd/kd rangeof 0 to 2 i1ls/BTU-ft/hr- F-ft (or deposit thickness of 0 to 0.14 mil). Asstated. above, the equation derived from Figure 38 is applicable in the0 to 0.14 mil region. Other eqwations have been derived for deposit Levelsin excess of 0.14 mil; however, they are not discussed herein, since thereiw little or nt, data to make a correlation. Also shown in Figure 38 is a changein slope at approximately 475"F. It is hypothesized that either the flushingrate (removal of deposit by its solution into the flowing fuel) is significantuith respect to the deposition rate at the lover temperatures or the mechanismof deposit folution is changing at 475"7. The flushing rate plays ariImportant role in comparing steady state to cycle tests because during theacceleration condition the fuel flowis eight times hlbhe, ' than the steady statetests. This my account for the deposit formation rate of the test cyclesbeing more linear than the steady state tests.
65

CC•IAIM
Eased on these data there appears to be an excellent correlation withwith this fuel betuean the steady state nA cyclic conditions on the basisof eqAil fuel film teAMpetreate The data idWiate tbat the depozitit rateof this fuel up to a deposit 1%xve of 0.14 mile be quantified in the engineSysteu as x"k 4 - 15,6000-6 5001T for film temperature. in ecess of 37507.Below 375F, the deposition•a s been denestzteu, to be noeg)gible. It isalso inlicated that the deposit thickness in tubes can be quntitfied duringa test by outer vital temperaturve•easnurmts and also after a test bycarbon amalsis.
66
!
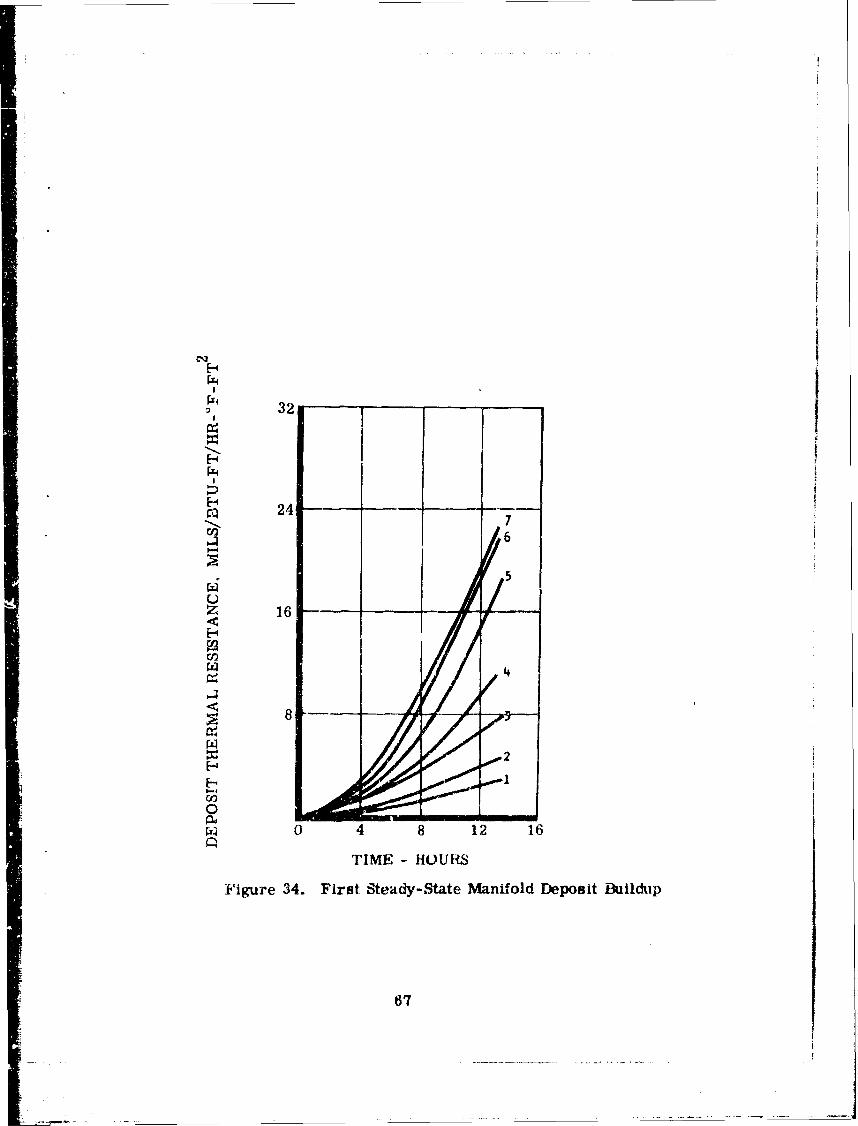
2 32
H _ _
24 T- HOURS7
Cl, 6
z ~16--
C4,
H8
CI
TIME -HOURS
Figure 34. First Steady-State Manifold Deposit Buiildup
67

48--I
0~32 10
W. 4
H _ _ _ _ __ __ _
241
rf 0 1-010
0 4 8 12 16 20 24 2E 32 36 'q0
TIME - HOUR~S 6 NOT O2ERATri1,G PyiOiEutLY
Figure 35. Second s--teady-State Manifold Deposit Buildup
68
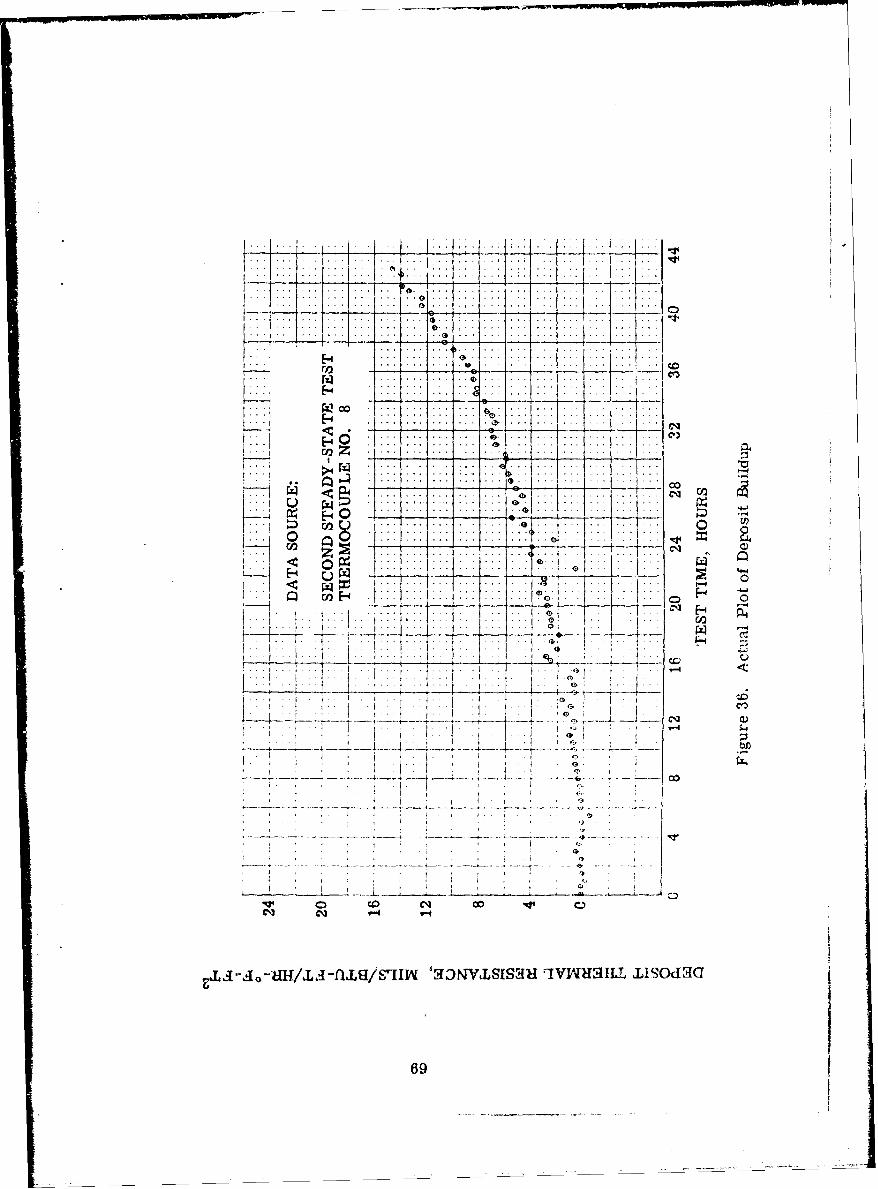
* __ .. .......- 4 ±
H ....
012 . e . n
- - . . . .. . . - . ,l Q )
0 --4
0 _2
Ci2.
H•- • -- . .. ...------ - ,., "-
• I i : i . <i
7~TC%3 coC.
69

FMIRSTADTT E TES
2
• 1
0,oo
miohm
SECOND STEADY-STATE TEST
CODE:0 NAA TEST DATA 0OW-PAFB TEST DATA15
2 &W-PAFB[ EPLICATE TEST DATA20THERMOCOUPLE
fE LECTRICAL TAB
1 -- ----- I----.-.----
o Io 20 30 40 50 60 70 80 90 100 110
MANIFOLD HEATED LENGTH, INCHES
Figure 37. M&anifold .)eposit Thickness Steaay-State Tests
70

H .~43
I .2
--K 15, 600 e- 1 3 , U00/RT
KdeT FILM TEMPERATTJRE f..
__1___R 1. 987 CAL/MOLE, OK
.09 -- .... _ ,,
S08 --
.07
.06 *
S.05
HC4
.04
03
0
600 550 500 450 400 3 350VF.0 Lin--L - In I -V
1.6 1.'t 1.8 1.9 2.0 2.1 2.2
1000/T (OK)
F'gure 38. Manifold Deposit BuiLd-up
71

0.5
FIRST TEST SERIES0,4
C.3 _ _ _ _ _
0.2
0.1
O. 05 M.I.1
0:ý0 0.1 0.2 0.3 0.4 0.5
CALCULATED DEPOSIT THICKNESS- MILS(BASED ON FIGURE 25)
__T1 ISECOND TEST SERIES 0
0.15 -
L- 0.100
I. -CALCULATED DEPOSIT THICKNESS - MILS
(BASED ON FIGURE 26)
Figure 39 Comparison Between Steady-state~ and Cyclic Data
72

SaCTIOX V
SALL-SCALE TSTS
The purpose of the small-scale tests is to obtain data to determineif any of these devices ranks the fuels the same as ":he simula tor and, further,if therei a quantitative relationship between the small-scale tests and theslulator. The data presented on fuel AFF-8-67 in this section vereobtained from the AF Aero Propulsion IAboraxory which directed theme testsconducted by the AF Mbteri&ls laboratory, University of Dayton ResearchInstitute •a f--= P---=--ah and aiBn in& Cor!oratior. Also shown in thissection are the smll-scale test results of the four fuels tested in theSST Fuel System Test Rig reported in Reference 22. These data are includedin this section so that the comnprison to the simulator data which id mae InSection VI my be more inclusive.
Saiples of fuel AFnB-6-.7 were taken from the storage tanks andtested in the following small-scale themal stability devices:
CokersStandard
ResearchModifiedMicro
Minex
Thermal Precipitation Apparatus
5 al Bomb
Reso's Standard Screening Unit
"The results of these tests are chown in Table IV.
COnM
The traditiol methods and results of determining coker breakpointare shown in Teble IV. The definition of these bases of coarison isdelineated in Reference 22. The data obtained on fuel AFF/•-36 vith respectto pzeheater tube temperature versus Tuberator deposit code is presented inFigures 40, 41, and 42. Thie cosdpt of data prmsentein•on is discussed inftferencor 13- In all these cases but one, the cckerui gve large quantitiesof depoeAt at the 550"F tube wall temperature. The research coker gave a
73j _I

lover breakpoint when a 30C**F reservoir vas used. *it was reported in thiseffort that the fuel darkened in apparance under the 300F7 conditio.It vas also observed that the results of the standard,, =ified, and gasdrive cokern were generally the esme.* This would indicate that pump weardoes not significant;ly affect the coker results. Pump wear is considered t~obe a function of fuel lubricity which has been reported, Reference 23, tobe dependent upon the aromtic content of the fuel.
The procedure for operuting the standard coker may be foiwd inReference 1 and the modified and gas drive cokers in R~eference 2~4.
Two runs, mhown in Figures 43 and '4, were sied with this I~ue1;the first run started at 350*F and vent up to 6o00F In 20O? increments. Du~ringthe first test, difficulty vas encountered 'when steady flow control wasattempted. The trouble vas traced to the flow acntrol orifice which appear-edto be catching particulate contamination froa che Minex rig. There uas nodefinite breakpoint reac~hed during this test. It is considered that evenwith the large asmout of scatter., a definite buildup or de~oits wouldhave been detected by a large valz consistact 4=sc*se in hiand a simul-taneous increase in, pressure drop through the test section. The first testuas stopped at 6M0F because the three pretesters used to rsise the tempera-tux-e of the fuel flowing into the test section to the desired level wereoperating a full power, and therefore would not further increase thatemperature. The points with a cross indicate that the temperatures changed
-- mre tb&D 11/2*F during the readings; these points should be disregarded.
A second run on this fuel was made after the IMinex was thoroughlycleaned., a new jewel orifice was adede, and one additi onal preheater uasadded. With the additional heasting capability, it was possible to increasethe temperature into the test section and consequently achieve 6200f fuel -out temperature. For the testing at 62O*F the prssure in the test sectionuas raised from 150 peig to 230 pw.ig to prevent boiling in the test section.As the graph indicates, there is evidence of change in h; at 600*? and adeff¶.nite deposit buildup at 6200'? These tvo r-ns would indicate tbat theMinax breakpoint is 62,10. The data at 600OF are not conclusive enough toassign the breakpoint at this level.
The tubes used in these runs were analyzed for carbon content(see Section III for method) and trausAItted by AFAPL, Reference 25,together with the conversion factor to deposit thickness for the )Einextube. The calculated deposit thick~nesses were 0.011, 0.0099, and 0.011mils for the inlet, middle, and outlet of the tube used in the first runand 0.037, 0.037, and 0.0141 mile for the tube used in the second :*un.Use foliorltng in a comwarison of theme data comae to that obtaiui4 fý-oFigures 4~3 and 4;4.
714

First Second
Deposit Thickness (Bared onCarben AnAlysis), Mile 0.01 0.04
Deposit Thickness (ased cnWss in hf), is -o-o.68)*o5
Pressurni Wop Increase, In.Ng. 4 1.5
*Dazerained by asimuing that hf has not decreased but has shifted for
each temperatutr-kii change.
**Determined by subtzacting the inverse cof the final hf from the inverse
of the initial hf.
it can be seen from the above that the carbon analysis data is not con-suitent with the data .btained from Figures 43 and k4. These data arecompared to the simulator data and discussed in Soction VI.
THMWEL PROCIPIATION TEST
The procedure used for the thermal precipitation test is delineatedin Reference 26 with the exception that weight measur•ents are deleted.The test vas performed twice and a photograph of the filter papers are shownin 7igure 45. Since this method has not been widely published, a sumaryof the procedure is giveau below.
Test filter papers (. 4 5u pore siLe, 47 - diameter) are precleanedwith nphtbt by use of a vacuum fiLtArtion unit. Thr filter papers arethan placed in an 180*1 oven for 30 minutes and stcred in a Petri dish.Two gallons of test fuell Gre then filtered with a filter paper and uha fuelrefiltered with another filter- paper wtbic is retained as the control filterpaper. The fuel is then placred in a preclanied fuel reservoir and heatedto 300 * 5*F in 90 to 105 minutes and maintained at this temperaturs for120 minutes. The fuel is then cooled to 80 * 5*F in 30 to 45 minutes.One gallon of th.is test fuel is than filtered through the precleanfdtest filter. The o*lor of the sample and control filter papers is thencompared.
Fuel samples from the simulator were tested in th,' Philli ps 5 mlbomb. The procedure for this test Is given in Reference 27 and the resultsare sbown in Uble IV. An oxygen sensitivity, test of the fuel toed wes alsoconducted using the 5 ml bo"1,m. The procedure and results of this test aregiven in Reference 28. This oxygen sensitivity test is conducted in thesamw inner as the 5 m.1 bomb test except the tast fuel is deaezr ted firstwith taitrogan. The fuel is da"ratcd by bubbling prepuriried ni..rogen with
75

a syringe through the fueil. The bomb apparatus t.o also purged with acontinuous flow of prepurified nitrogen. The deaerated fuel is tTansferredto the bomb which is then purged for an additional 5 minutes. The resultsof this test are shown in Table IV.
F1O STANDM SCREEWIG UNIT
A saple of fuel ws teted in the Rsso's laboratory uuit which isbeing used to study "vapor phase' leposits.This information sppears in anIsso rcntbly letter, Ueference 29. It was reported therein that the sesultsindicate that fuel AFFB--67 is a poorer performer than anticipated fromcoker results. These testp are conducted in Esso's Screening Unit. Themain section of the unit consistm of a tubular mctor surrounded by fivesewarate, eindpendently :ontrolled reactor heatero. The reactor is maintainedon a slight incline, dnd li uid fuel flows down the reactor in the presenceof flowing air tor nitrogen). The reactor heaters are controlled so that thefuel 3ncounters a rising temperature sequence as it ftows down the reactor.Weighed metal strips are placed if the center section of each heater zoneand a thermocouple positioned in each zone. The test is conducted for fourhours ir~th a fuel flow rate of 125 cc/hour.. The wetal strips are againweighed after the test and the deposit weight versus l j•rsture aawia~ined.The equation of these data is used to determine the relative activity of thefuel.
[Y

t'BLE IV - RESULTS OF SMALL SCALE TESTS
TEST BASIS OF COMPARISON CRITICAL TEMPERATURE# FDEVICE ICRITICAL CONDITION)
RAF-- RAF- FA- FA- AFFV-176- 176- s- 5- a-64 63 _ L ._67
_....MINEX INITIAL CHANGE IN HF. FUEL TEMP. 390 rL355 EL35D EL300 600MInEX INITIAL CHANGE IN HF, METAL TEMP. 470 EL385 EL380 EL330 318MINEX ONE PERCENT LO :i IN HF/HR.. FUI TEMP. 479 440 437 392 620"NINEX ONE PERCENT LO HF IN r.L 9 METAL TEMPo A _7A _.(.8 4.....MINEX INITIAL DECREASE IN HiFt FUEL TEMP. 39C EL3S5 405 7!,300 1.00MINEX INITIAL DECREASE IH HF, METAL TEMP. 420 EL385 435 EL330 638MINEX RAPID DECREASE IN HF. FUEL TEMP. 500 480 445 450 620NINEý' RAPID OECRFASE IN HF. METAL TEMP. 530 510 475 480 658
BOMe TWENTY-FIVE PCT. LOSS _LiGHT TRAN,_ 384 368__40 348 494BOMB SAME BUT OXYGEN PURGED 487
COKER 3 IN. HGt MAX., FUEL TEMP. 375 0375 375-400 375 G450COKER 12 IN. HG. MAX., FUEL TEMP* G400 G375 G425 G375 G450COKER 13 IN. HMG MAX., FUEL TEMP. G400 G375 425 375 G450_OKER ._2_O .L EL TEMP. 375 _119 422 ___ ICOKER CODE 2 AND 3 IN. HG. MAX.* FUEL TEMP. 375 350 375-400 325 400
COKER CODE 2 AND 12 IN. HG. MAX.* FUEL TEMP. 375 350 425 325 '40G_;lKER CODE 2 SURVEY, METAL TeMP. 462 513 f34 475 542COKER CODE 3 SURVEY, METAL TEMP. 331 382 512 382 545COKER VRANSIT9 METAL TEMP. 467 406 517 398 516
R COKER AMN.o 3 IN. HG. MAX.* FUEL TEMP. 375 375 450 G350 6450R COKER AMS.. 13 IN. HG. MAY.* FUEL TEMP. 375 G400 450 G350 G450N COKER AMB.e CODE 2 MAX.. FUEL TEMP. 350 350 450 325 175R COKER AMS,. CODE 2 AND 3 IN. HG. MAX., FULL TEMP. 350 350 450 325 375R COKER AMB1. CODE 2 SURVEY. METAL TEMP. 467 481 571 463 5000 -DKER_ AMO.. CODE Q_._.RVEY. METAy JEMP * 452 _83 57 2 _ _9_ I
R COKER AMBe. TRANSIT* METAL TEMP. 443 462 557 362 469R COKER 200 F. 3 IN. HG. MAX., FUEL TEMP. 375 6350 L471 G350 375R COKER 200 F. 13 IN. HG. MAX.. FUEL TE;po. 375 G375 L475 G350 315R COKER 200 F. CODE 2 AND 3 IN. HGO MAX., FUEL TEMP. 350 3Z5 L475 300 375R COKER 200 F, CODE 2 MAX,, FUEL TEMP. 350 325 475 300 375R COKER 200 Fe CODE 2 SURVEY. METAL TEMP. 462 443 696 428 so0It COKER 200 F. CODE 3 SURVEY, METAL TEMP. 486 455 598 392 3,,R COKER 200 F9 TRANSIT* METAL TEMP. 443 443 627 376 521R f_0_.•_ &X_ LUiH. ... . l00_27. oo C.....3037 p. .R COKER 300 F. 13 IN. HG. MAX., FUEL TEMP. 325 350 L275 L200 L375R COKER 300 Ft CODE 2 MAX.. FUEL TEMP. 425 325 2T5 325 EL375
l. COKER 300 F. CODE 2 AND 3 IN. HG. MAX., FUEL TEMP. 300 L300 L275 L20D L375f C3KER 300 F. CODE 2 3 URVEY, METAL TEMP. 542 428 4,30 443 405R COKER 300 Ft CODE 3 SURVEY. METAL TEMP. 54'. 443 305 455 430
GAS COKER 3 IN. MG. MAX.* FUEL TEMP. 400GAS COKER 12 IN. MG. MAX.* FUEL TEMP. 400GAS COKER 13 IN. HG. MAX.. iUEL TEMP. 400GAS COKER CODE 2 MAX.# FUEL TEMP. 425GAS COK:ER CODELANE )_IN. HG. MAX., ! EMP. _____E_ P...GAS COKER CODE 2 AND 12 IN. HG. MAX.* FUEL TEMP. 400GAS COKER CODE 2 SURVEY. METAL TEMP. 491GAS COKER CODE 3 SURVEY. METAL TEMP. 518GAS COKER TRANSIT. METAL TEMP. NA
MOD COKER 12 IN, HG. MAX.. FUEL TEMP. G475MOO COKER 13 IN. HG. MAX.. FUEL TEMP. G475MOD COKER CODE 2 AND 3 IN. HG. MAX.. FUEL TEMP. 400MOD COKER CODE 2 AND 12 IN. MG. MAX., FUEL TEMP. 400MOD COKER CODE 2 MAX.. FUEL TEMP. 400MOD COKER CODE .S1URVE.Y. MEAL TE_.+ ..... ____...........
MOD COMEN CODE 3 SURVEY. METAL TEMP. 491MOO CUtEER TRANSIT, METAL TEMP. 497
MIC COKER CODE I MAX., FUEL TEMP. 513MiC COKER CODE 2 SURVEY. METAL TEMP. 525
ESSO UNIT RELATIVE ACTIVITY AT 37SF 1.0 0.50 1.3
* FUEL TESTED WAS ACTuALLY FA-S-'B
ElLLgLLAl~O LEss TH" A.Sf.-ij L1 1I- iMs"~
77

Ct) W
00
00 0
C%3
- Tn -V-
£ V '-4
PIO.nSJc
78

0o
-00
100
ILSOXI

Q C4 4I
0 C)I:
F4 0
R..
-14 0 i
o C4
44I
J8~
_____ 0LS Cq
_ _ _ _-- _ _ _ _ 80
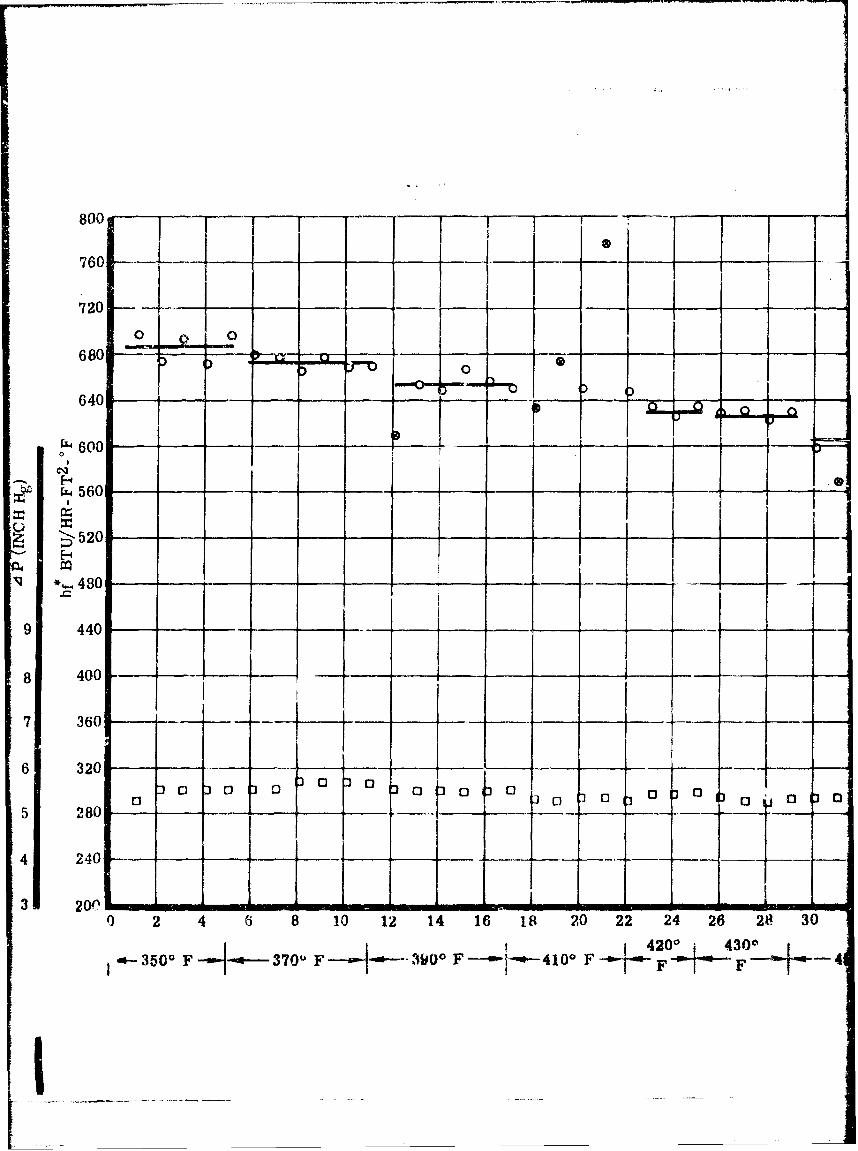
800o
760 f.-.1.1j
72o0
680 0 -1 tu-
640 - - --
~600 I,560
"• 520
*•480
9 440 -
8 400 -
7 360 - -16 320 . ....... ..-.
S28 0 1. 0 1 C0 13 0 C 1
4-240
320f0," ... .m, wwmw ý
2 4 8 10 12 14 16 1A 20 22 24 26 2$ 301 1 '420°' 4300 I
-a- 3500 F 4.-- 3700 F -- "" 3900 F --'e--!"- 4100 F - F-F 4

IT]
l--- b' 1o 0 11 0 11
I I I -£
130 0 13 (3 13 0 o b 0o1
- --
36 38 40 42 44 46 48 5G 52 54 56 58 60 62 64 66 68TEST 'FIME - HOURS v

_ . __ .................. ... ....
__;_ r___I ... . ...
SII___
0
0l _0 __ _I _ _0- F
70 72 74 76 78 80 82 84 86 88 9 0ý 92" 4 96 98 100 102 10 4
5900 F- - 6000 F
Figure 43. Minex Test FResults - First Run
3 - 81

1 DAY I 1 DAY 1DA
720
680
6400
600•"l
560
o 520 -
S480M~4
S•"9 440 -1
"~ '8 .400
7 360
6 320 n
5 280 __L_ 0 0 0 0
4 240 -- [I
3 260 i0 2 1 6 8 10 12 14 16 18 20 2
TEST TIME-FHO580'F -- ad 600 F
Figure

I1 DAY 1 DAY 1 DAY
0 " --- __i o_ __ _00
0
- --
o 0 03 C0 1
- - -
8 10 12 14 16 18 20 22 24 26 28 30 32 34 36 38 40 42
- 6__F TEST TIME- HOU60" -
~~- . ... . 1
Figure 44. Minex Test Results Second Run
82

oi4o
V4L1
C12$4
834

SAION V1
COCPARISON BETWEN SIMATOR API) 8MM -SCAI TESTS
The purpose of this section is to compre the simulator data to thesmall-scale test data. This will be a continuing effort in this program andadditional fuels are to be tested; therefore, it -s intended at this timeto aerely show correlation trends. (kly one fuel (AMFE-8-67) bas beentested to date in the simoltor, and therefore, a compa•aion based on thesedata vuld not be !adicative. Since , fuels bcve been tooted in thesmall-scale devices and in the FAA-MT Fuel System Test Rig, which acmodified into the simulator, these &%at are included in the analysis. A"t•t correlation study carried out or the fuels tested in taw FAA-SST FuelSystem Tast Rig Is reported in Bsferbmic 22. Contalned therein is therankilng of the fuels tested Miovn in Table V is the ranking of thesifu's ame AFFB-8-67 obtained by the sam ivthod. ftis table, along withMable IV, form the basis of the discussion herein.
WIN TASK
According to Beference 22, the ranking of ths fuels tested in theFAA-SST Fuel System Test Rig in the order of increasing deposits we:
FA-S-2ArAF-176-64
mr-176-63FA-S-1
The data used in obtaining this ranking vs basically a comparison of theartist conception drawings of the deposits on the bottom of the wing tank.These fuels can be compared directly to the performance of AFFB-8-67 in thesimulator because essentially the same enviroment and equipment were used.As addAitionl fuels are tested in the simulator, the bases of comparisonwill be more quantitative than the use of drawings; i£e., the use of the]probes, dish, disk, and thickness measurevents. Applying the same approach(comarison of artist conception drawings) with fuel AFFB-8-67 the order ofincreasing deposits is considered to be:
FA-S-2ARAY-l76-6RAF-176-63AyrF-8-67VA-S -i

heaed on this ranking or the fuels in the wing tank, none of the smallscale test devices that tested all five fuels ranked all five fuels in thisorder (2, 3, 1; 4, and 5). The Zsno Unit Vapor Pse Deposit ScreeningUnit) has ranked only three of the fuels (RA?-176-63, FA-S-2B, and AFF.8-67).If it is assumed that FA-S-2B ws the same fuel as FA-S-2A, then the EssoUnit ranking is the same as the wing tank ranking for the fuels.
This conclusion is to be anticipated since the Esso Unit is -the onlydevice which imposes environmental coaditions (low pressure, presence ofvapor, condensation, etc.) similar to the wing tank. The Mmcx and thecokers impose conditions (high pressure, Ull liquid phase, high flow, etc.)similar to tLe engine system.
It is to be noted that the above coufarison is made on the basis ofvisual observations of the wing tank. As additional fuels are tested andquantitative data is obtained, the compariedn will be made on a quantitativebasis of the amount of deposit formed.
AIRFRAME SYSTN4
The wing tank discussed above was analyzed separately from the airframesystem because the wing tank simulates a static system while the remainingairframe system, like the engine system, is dynamic. The fuselage tank isnot discussed because no deposits were evident therein. Mhe airframesyvtem (excluding tankage) did not show any evidence of deposits. It isnoteworthy that the SOT Test Rig airframe heat exchanger did rot exhibitPerformance change with any other of fuels after 290 test cycles at CRC Mach 3conditions. This corresponds to a peak fuel temperature of 280"F and a peakmetal temperature of 315"F. This is in agreement with the inlet of theengine and Uhi-Tube heat exchanger where the maximum fuel and metal tempera-tures vere 275 and 320F, respectively. Therefore, it appears that thedeposition of all the fuels tested in both program is negligible with peakmetal temperatures of 320"F. The results of the small-scale tests shown inUble IV are In general agreement with this finding.
M~INE 5!8TI4
The simulator results on AFFB-8-67 indic ited that the fuel does notbreak (show visual s4 .gns of deposits in the order of a code 3 on the CWClacquer Plting Scale) until ti. peak film temperature was approximately30e55" in engine heat exchanger. The datt obtained on the engine manifolds(both test cycles and the second steady state teut) indicate that the rateof deposit formation can be quantified by xd/O. 15,600 kd e-6500/T (see
85

page 65) where the deposit formtion below a 375"F film temperature isnegligible. As shown in Table IV, the critical metal temperature of 4'neMinex is in the order of 200*F greater than this breakpoint, and thecritical metal temperature of the cokers is in the order of 100"F greaterthan the simulator breakpoint. This apparent discrepancy in criticaltemperatures may be caused by a relative insensitivity of these tests todeposits. The only device which yields a critical temperature within 50"Fof the simulator breakpoint is the Research Coker. This ia on the basis of300"F Code 2 Survey, 300"F Code 3 Survey, and 300F Transit.
The Minex is the only small-scale device, similar in environmentalconditions to the engine system, which rields quantitative data comparableto the simulator. Such eata is shown on Page 75. Using the deposition rateequation of fuel A7B-fJ-67 determined from simulator tests and the Minexmetal temperature profile (methl temperature in Minex is within 2*F of thefilm temperature) determined from Runs 1 and 2 shown in Figures 43 and 4,the predici~d deposit thicknesses in the Minex tubes are 0.8 and 0.75 milsfor the first and second runs,, respectively. It can be seer, from a cu-prison of these deposit thicknesses, based on simulawr prediction data, tothat data on page 75 that the data are in general agreement exceptfor that based on carbon analysis. It was found that the carbon analysi s testcan give unrealistic values, i.e., in the steady state manifolds, page 64.Discunting the carbon aalysis data, it appears that the simulator de-position rate equation ,my be valid for the Minex heat exchanger, and acorrelation mthood i indicated.
In coAparing fuei. AVFB-8-67 to the fuels in the FAA-SST Fuel SystemTestRig extrews caution was uaed because of the differeace in engine filterpore size and the perfo'macs of the engine pump. it was Indicated inReference 22 the data obtained dowaistreas of the engine pump is in doubtbecause of the failures of this pump; such failures di1 not occur on thesimulator engine pump. It vas pointed out in Faference 4 that the effectof the pumps on the engine system components is considered to have decreasedwith each successive downatream component due to the filtering action ofthe components. Therefore, a comparison to the manifold and noszle eay bevalid while the engina heat exchanger Is questionable cnd the engine filternot worth discussing. The C.poeition eqvAtion, xd/O - 15,600 ktde -6500T.was applied to the film temperatures of the MAA-SST Test Rig - CRC - lkcb 3envirowet for the engine heat exchanger and manifold. This ws done topreftct how much deposits wou.ld have formed in the FAA-SBT Test if fuel
86

Am8-67 bad been tested therein. The re'ults indicte that the engiutexehbanger overall heat transfer coefficient lows vould not b measurablein 100 test cycles, ati the manifold deposit thickness would bt .001 to .002mils per test cycle. Comjaring tbese resau+te to Page 3V of Reference 4 itappears that AFFD-&-67 would ramnk higher than any of the tuels tested in theSST Test Rig. This would indicate that AFl-P-67 is a better fuel in theengine system. This ic not contradicted by a coiarison of the engine r -%zleperformance.
Assuming that AFB-8M67 is tbh better fuel, then it is evident that thefuels do not rwak the sawe in the wing tank and the engine system. Thisphenoienon is to be anticipated since the environment and probably thedeposit formation mechanism are different. In gene-sl, (i.e., by summationof ranking in Table V, the Minex, Standard Coker, and Research Cokerindicate that AFFB-8-67 is the best fuel, and the Esso tLit indicates that Itis probably the third best fuel. This is in agreement with the above conclusionthat the wing tank (similar to the Ebso Unit) does not rank fuels the sameas the engine system (similar to the Standard Coker, Research Coker, andMintx).-
Therefore, based on these data, it appears that none of the smell-scaledevices singuliarly will predict the extent of deposition in both tle staticand dynamic system (i.e., "empty" wing tank and engine system). This suggestsa need for using more than one of the above test devices or developing newsmall scale device. The success of the manifold data correlation obtained onthe simulator to predict the thickness deposits in the manifold suggests asmall scale device eimilarly designed to the manifold downstream of a devicesimulative of a wing tank.
87

...... ..... ........ TA . A ING OF FUELS
_TET BASIS OF COMPARI._f -I;f -_ _
DEVICE ICRITICAL CONDITION)RAFU- RAF- FA- FA- AFFS-
J _,176- $- 5- 0-64 43 2A 1 67
R COKER 300 Fe CODE 3 SURVEY._MEAL T9.P 1 3 5 .j 4NC-TR 300 Fe TRANSIT* METAL TEMP. 1 3 S 2 4
.R COKER 300 F* CODE 2 MAX.o FUEL TEMPe . ........... 1 3.4 5 . 3.5 .2
.R COKER 300 F. CODE 2 SURVEY. METAL TEMP. 1 1 2 3 5
A' raKER 300 F. 3 IN. . MAx., " -FUEL • TE-. 2 3 4 s 1Rt COKER 300 F. CODE 2 AND 3 IN. MG. MAX., FUEL TEMP 2 3 4 3 1
NINEX RAPID DECREASE IN MF, FUEL TEMP* 2 3 4.3 4.5 1MINEX RAPID DECREASE IN HF. METAL TEMP. 2 3 4.5 4.s 1
"MINEK INITIAL CHANGE IN HF. FUEL TEMP. 2 3.3 3.3 5 1"MNNEX INITIAL CHANGE IN HF. METAL TEMP. 2 3..! 3.S S 1MINEX __ OFIE PERCENT LOSS IN HF/HR.. FUEL TEMP. 2 3.s 3.3 5 1MINEX ONE PERCENT LOSS IN HF/HR.. METAL TEMP. 2 3.3 3.3 5 1
LC21L100.F 3 N H. Lx T4EMkEP, 2.3 Z~. 1 2,*3 2a*5____
ft COKER 300 Fe 13 IN. HG. MAX.. FUEL TEMP. 3 7 4 5 1
COKER CODE-2 MAX., FUEL TEMP". 3 4 1 5 2CORER CODE 2 AND 3 IN. HG. MAX*# FUEL TEMP. 3 4 1 5 2
.CKER ACOI.JE 2 AND_.2_2,EJ4 _fI ?_•_ 3 * .____._f COIER 200 F. COUE 2 AND 3 IN. HG. MAX., FUEL TEMP 3 4 1 3 2ft CORER 200 Fs CODE 2 MAX., FUEL TEMP. 3 4 1 5 2
. .. RCOKRR _200 Fi, CODE 2 SURVEY, METAL TEMP. 3 4 1 .
CORER TRANSIT# METAL TEMP. 3 4 1.3 5 1.5
COKER 13 IN* HG. MAX.. FUEL TEMP. 3 4 2 3 1MINEX INITIAL DECREASE IN HF, FUEL TEW.P 3 4 2 5 104 1If'k NITIAL DERES
CORER. 12 IN. MGo MAX.. FUIE. TEMP* 3 4.5 Z 4.5 1
ft COKER 200 F' -13 t. HG. MAX., FUEL TEMP. " 3. 2 1 3.•3 . 3.3
-. .. 1 ... _T XE •('_T._•i _I _P_€I_._• $ l ~ :TIB . ..... A4r'''rrr''' _ .... __--- ._-R CORER AMIeo CODE ? MAX.. F'IEL TFMP. 3.3 3.5 1 5 2R COKER AMS., CODE Z AND 3 IN* 1a•. MAX.; FUEL VEMP.3.3 3.5 x 5 2R CORER 200'Fs CODE 3 SURVEY'v METAL TEMP. 3*5 3.3 1 5 2* CORER 200 F. TRANSIT* METAL TEMP. 3.5 3.3 1 5 2
R CORER AMl.t. TRANS!Tt METAL TEMP. 4 2.5 1 3 2.3
a CORER AA8.9 CODE 3 SURVEY. METAL T•MP- 4 3 1 5 3
CORER J 1. H4* MAXE* FUEL YEMP. 4.3 2 3 4.3 1
A COKER AMR.* CODE 2 SURVEY. METAL TEMP. 4.3 3 1 4.% 2
COKER CODE 3 SURVEY. METAL TEMP. 5 3.S 2 3.5 1
1SSO UNIT RELATIVE ACTIVITY AT 37SF 2 1 L
88____ ___ ___I ______
SUDCTION ?JIfl
FUTEM Wow PLEOD
It is intended to continite testing fuels and analyzing the data inorder to investigate the performance of hydrocarbon fuels under high Machuumber flight conditions. As the quality of each ruel in quantified in thesimulator, these values will be compared to emll-scale test results. Thiswill provide a basis for calibrating these devices for determining fuelsuitability for advanced aircraft. Additionally., design criteria will bedetermined on the basis of the fuel performance and Air Force supplieddesign requirements for Advanced Aircraft.
The next fuel to be tested in the simulator will be of a poorerquality than AFFB-8-67. The environment will be the 60?*F profile shownin Figure 5. This will permit the acquisition of a greater amount of per-formance degradation in a fewer number of test cycles. It is anticipatedthat the following fuel will be of the highest thermal stability qualityattainable. Th.s will permit a determination of the limit of use ofavailable hydrocarbon fuels.
SEMION VIII
1. AS'M D 1660-64 "Standard MHthod of Test for Thermal Stability ofAviation Turbine Fuels," adopted by ARDM, 31 August 1964
2. FA Report IA-66-1380, "Advanced Aircraft Fuel System Bimulator
Mloifiction and Performnce Report, dated 27 December 1966
3. CRC Manuel No. 5, "CRC DLesel Ugine Rating fbnual," page 36
4. N"A Report I&-65-247, "Performace of Current Quality Comercial JetFuel in the Supersonic Transport Airframe and Aircraft og•ine FuelSystem Test RIg," Final Report, Fedeml Aviation Agency ContractFA-so-65-3, dated 14 Nby 1965
5 o. hso Research and Rzgineering Cbmpau Quarterly Progress Report No. 2,AP33(615)-3375, 16 August - 16 Novembor 1966
6. Monsanto Research Corporation Nwo dated 15 robruary 1967, Job 2551-2
7. W-FPll Air Force Miterial laboratory Aalysie Test Report on Wing TankDeposits, dated 20 April 1967
8. W-PAPS Air Force Uaterial Iaborstory, Analysis 71ýt Report =n Wing TenkDeposits, dated 22 fty 1967
9. Monsanto Resarch Corporation, Memo, dated 6 March 1967, Job 2531-2
10. latter dated 17 M%7' 1967 from R. T. Bmurgess of PFco Pr.ducts toR. P. Bradley of North Amaercan Aviat-ion, Inc.
11. Monsanto Reserch Corporstion, Memo, dAted 15 fNbruery 1967, Job 2551-2
12. ftcketdy"e Report lN 1084/362 "study of an aothernic Fuel for theAtlas Rocket Motor" dated 17 beptember 1967
13. Air Force Technical Report AFAPL-TR-64-154, NA Comparison of the(Opabl1itios of a Fuel Cok"r -nd the MLx Most fct.ngr forDetermining yd~rocarbon Fute TMweral Stability," dated Jkrch 1965
14. LAtter dated 11 Way 1967 from R. R. tibbard of Lhe Reticnal Aeroauticand Space Adainistttion to A. X. Zeagol of Yright-atterson Air ForceBase
15. Is ter dated 20 June 1967 from A. 2. Zenol of Wright-Ftttereoc AirForce Base to N. Goodn of North Amrioan Arlation, Inc.
16. Telephoe call on 14 June 1967 betwom A. N. Zeftel of Wright-ftttersonAir Fwrce he and 9. Goodman of North Amwca.'i Aviation, Inc.
90

17. Perry, R. 71., et al; Chemical Skigineering Bhdbook, Mcrawv Hill Book Co.New York, 4th Mitioa
18. Alberts, L., et. al. Handbook Chemistry and Physics; Chemical RubberPublihing Copany 46th mitior
19. tkiv"•-ity of Dayten Research Institute, Memo, dated 9 March 1967,rL67-9
20. Telephone call on 31 July 1967 between A, E. Zengel of Wright-PattersonAir Force Base and H. Goodhun of North American Aviation, Inc.
21. L. Bagnetta, "Therial Stability of lydrocarbon Fuels," TechnicalDocumentary Report APL TDR 65-89, Part II, Phillips Petroleum Co.,June 15, 1965
2&. NMAA Report NA-65-753, "Da~a Correlation Study of Small-Scale FuelThermal StAbility Test Devices and the FAA-SST Fuel System Test Rig,"Final Report, Federal Aviation Agency Contract No. FA-SS-65-28,da+ed 30 November 1965
23. Esso Research and Xmgineering Compay Quarterly Progress REport No. 5,"Lubricity of Jet Fuels," AF33(615)-2A28, 15 Sky - 15 August 1966
24. "Evaluation of Modified Fuel Coker for Masuring High TemperatureStability nf Fuels for High Performnce Aircraft," Nbreh 1966 (CIcProject No. CA-17-59)
25. Telephone call on 2 August 1967 between To' Waddick of Wright-PattersonAir Force Base and H. Goodman of North American Aviation, Inc.
26. Pratt & Whltney Aircraft Division, Mbterials Control Laboratory Manlul,Section Q.67, issued 3-31-66
27. "Thermal Stability of Hydrocarbon Fuels," APL TDR 64-89, Fart II,Prepared by Phillip3 Petrolen Company under Contract No. AF33(657)-i0639,August 1965
28. Monsanto RPsenrch Corporation, Memo, dated 26 April 1967, Job 2551-1
29. Sso Rosea-ch and Egineering Company, Monthly Letter Report, dated21 March 1967, "The Study of ldrocarbon Fuel Vapor Phase Deposits,"Contract No. AF33(615)-3375
91

DOCIU4EMT CONTROL D~ATA - R & D(Seheart £beeedfftatie., of titl. b.edr of abstract end Ieniabid ann.Ietioew ..ts bo .a,.eroE When Mhe *Ve~eJI reportf I. tI&4480~
0. 0I98ATI411 C IITY(Cerotat SOW)as. REPORT SECURITY CLA65IFICA-OI0'
interra~tionalI Airport&bCRULosAnele, alfornia 29 I
R-kgh Towperature Hydroearbon Fuels Herearch in an Adv~ancedAircraft Fuel System Simulator on Fuel AFFB-8-7
4. OSSCftUprTI Vt oTg (I1m vi.1 rsp~ mod Inclusive deft&)
Firat Fuel Series Rleport: 3 January 1967 to 3 Jeby 1967S. AUTH51111111(pketaas,' mid initial. last neaw)
Harold GoodmanBoyce P. BradleyTheodore 0. Sickles
41. MIRPOSI DA~re 7& TOTAL NO. OF PAZW 05 7. NO0O 579
114. August 1967 vii +91 I 2"5.-CON TMAC T Ott CANT NO. S&. OXMIO;ATGPU11 REPORT NuUSM111111
AF33(615 )-3228 NA-67-6355. 11011.01 EC NO.
BPSN 6 (63 304&01 62403214) OTHENR REPORT MOIS? (Any POWi uawbo.. diet ~ra be asdigned
ABPSN 5 (68 omoo 61430014) AFAPL..TR..67...160c. DISTRIUUUYION STATEMENT This document is subject to spacial export controls and eachtransmittal wo foreign governments or foreign national may b~e rmd only with priorapproval of the Fuels, Lubrication, and Hazards Branch, Support Techinolopy DivisionAir Force Aero Propulsior. laboratory. A.i SP :PONS`RN MI~R 49AC9VTY
It SUPPLEENTHARY NOTEIISOSMw I
Air Force Aero Propulsion ItiboratoryWright -Ftterson AIM', Ohio
Li.A631TRACt
At elevated temperatures hydirocarbon jet fuels tend to form depoeit* decreaesbest exchanger efficiency arnd plug screena and filter elements.~ A small-scaledevice is required which has been demonstrated to be applicable to all qualities ofhydrocarbon jet fuels and will quantify this tendency in terms meaningful to fuelsystem des1'.gners. In this report, the thermral stability of a fuel CAmF-8-67) isquantified in terms of amount of deposit in an airframe and engine fuel systemsimulator. The data obtained fram this first fuel series indicate tha* an exprerseio,derived herein, in terms of time and temperature my predict the amount of depositsfc'ied in any engine syitem usirg fuel AFFB4-67.
Presently, the fuel's tendency to form deposits is determined by visual ratings ofcolor. Two methods for determining tI1-e amount of dep.osits formed in a tube are dirs-Cussed 4-A a very favorable compa*rison results. A relationnhip is shown hereinbetween those calculated values and the colar of the deposits. It is shown 6hat at.certain levels of deposit thickness a color scale Is insensitive to the amount ofdeposits. It is shown that at certain levels of depouit thickness a color scale toinsensitive to thoi amount of deposits. In addition to fuel testing in the simu-lator, fuel AFFB-&67 itm tested in the Standard, (as, Research, Modified and MicroCokers, Minex, Th~Zul Precipitation Apparatus, 5 &1 Bomb, and Faso'~s ftandard
Screening Uhit.
DD7A8ItT I O .47 rqD=

Cc•.,lty CMoakf'ication14. LINK A LINK U LINK C
Kr.V WORtOgROLE WT ROLE Wy NOLE WT
Advanced Aircraft ktl System Simulator
Small-scafe tests
Therml. stability
Fuel "B-8-67
Standard fuel coker
Modified fuel colter
Gas-driven coker
Research coker
Wcre coker
Iinex
Thermal precipitation apparatus
W l Bomb
Vapor phase screening urit
.11i . ... .. . . . .... ....
ABSTRACT (continued)
Comparisons made to data obtained in small scale tests and the FMA-SST DataCorrelation Study indicate that a static systv& (i.e.., an "empty" vin tank)does not rank fuels the same as a dynamic system (i.e., engine system).Therefore,. a dual type (static and dynamic) thermal stability device may beindicated. It was also indicated that the comparison criteria used in manyof the small-scale tests yield breakpoints (initial deposition temperatures)100 to 200*F below that indicated in the fuel system simulator.
This effort is continuing with the testing of additional fuel and Fuel SeriesReport will be released two mouths aft er completion of each fuel tested. Theapplicability of the above findings to these fuels will be reported therein.
V .
i II