NEW JERSEY TURNPIKE AUTHORITY · 2016. 8. 2. · Schedule of Toll Transactions by Vehicle Type and...
205
NEW JERSEY TURNPIKE AUTHORITY (A Component Unit of the State of New Jersey) Comprehensive Annual Financial Report For The Year Ended December 31, 2015
Transcript of NEW JERSEY TURNPIKE AUTHORITY · 2016. 8. 2. · Schedule of Toll Transactions by Vehicle Type and...
NEW JERSEY TURNPIKE AUTHORITY (A Component Unit of the State of New Jersey)
Comprehensive Annual Financial Report
For The Year Ended December 31, 2015

(This Page Intentionally Left Blank)
NEW JERSEY TURNPIKE AUTHORITY (A Component Unit of the State of New Jersey)
Comprehensive Annual Financial Report
For The Year Ended December 31, 2015
Prepared by:
Finance and Budgets Department Donna Manuelli, Chief Financial Officer
Pamela Varga, Deputy Chief Financial Officer Katherine Johnstone, Assistant Director of Finance
NEW JERSEY TURNPIKE AUTHORITY (A Component Unit of the State of New Jersey)
Comprehensive Annual Financial Report
Year ended December 31, 2015
Table of Contents
Page
Introductory Section (Unaudited)
Letter of Transmittal i
Vision, Mission Statement and Core Values vi
Organizational Chart vii
Board of Commissioners and Senior Staff viii–ix
Overview of Organization, Background and Functions x–xii
$7 billion Capital Improvement Program xiii–xix
Report of Management Under Executive Order No. 37 (Corzine, 2006) xx
Financial Section
Independent Auditors’ Report 1
Management’s Discussion and Analysis (Unaudited) 3
Basic Financial Statements:
Statements of Net Position as of December 31, 2015 and 2014 39
Statements of Revenues, Expenses, and Changes in Net Position for the years ended December 31, 2015 and 2014 40
Statements of Cash Flows for the years ended December 31, 2015 and 2014 41
Notes to the Financial Statements 42
Schedules
1 Required Supplementary Information (Unaudited) – Schedule of Funding Progress – Other Postemployment Benefits Plan as of December 31, 2015 91
2 Required Supplementary Information (Unaudited) – Schedule of Proportionate Share, Employer Contributions and Notes as of December 31, 2015 92
NEW JERSEY TURNPIKE AUTHORITY (A Component Unit of the State of New Jersey)
Comprehensive Annual Financial Report
Year ended December 31, 2015
Table of Contents
Page
3 Schedule of Net Position – Reconciliation of Bond Resolution to GAAP as of December 31, 2015 93
4 Schedule of Revenues, Expenses and Changes in Net Position – Reconciliation of Bond Resolution to GAAP as of December 31, 2015 94
5 Schedule of Cash Flows – Reconciliation of Bond Resolution to GAAP as of December 31, 2015 95
6 Schedule of Net Revenue Requirement for the years ended December 31, 2015 and 2014 96
7A Schedule of Investments as of December 31, 2015 97
7B Schedule of Investments as of December 31, 2014 98
8 Schedule of Depositories as of December 31, 2015 and 2014 99
9 Schedule of Cost of Investment in Facilities as of December 31, 2015 100
10A Schedule of Bond Indebtedness as of December 31, 2015 101
10B Schedule of Refunded Bond and Note Indebtedness as of December 31, 2015 and 2014 102
11A Schedule of Toll Revenue (Unaudited) New Jersey Turnpike for the years ended December 31, 2015 and 2014 103
11B Schedule of Toll Revenue (Unaudited) Garden State Parkway for the years ended December 31, 2015 and 2014 104
Statistical Section (Unaudited)
Schedule of Net Position (GAAP Basis) – Last Ten Fiscal Years 105
Schedule of Revenues, Expenses and Changes Net Position (GAAP Basis) – Last Ten Fiscal Years 106
Schedule of Capital Assets – Last Ten Fiscal Years 107
Schedule of Toll Transactions by Vehicle Type and Roadway – Last Ten Fiscal Years 108
Schedule of Toll Transactions by Class and Roadway – Last Ten Fiscal Years 109
NEW JERSEY TURNPIKE AUTHORITY (A Component Unit of the State of New Jersey)
Comprehensive Annual Financial Report
Year ended December 31, 2015
Table of Contents
Page
Schedule of Toll Transactions by Interchange – New Jersey Turnpike – Last Ten Fiscal Years 110
Schedule of Toll Transactions by Interchange – Garden State Parkway – Last Ten Fiscal Years 111
Schedule of Toll Revenue by Vehicle Type and Roadway – Last Ten Fiscal Years 112
Schedule of Toll Revenue by Class and Roadway – Last Ten Fiscal Years 113
Schedule of Toll Revenue by Interchange – New Jersey Turnpike – Last Ten Fiscal Years 114
Schedule of Toll Revenue by Interchange – Garden State Parkway – Last Ten Fiscal Years 115
Schedule of Toll Rates per Mile by Toll Type and Vehicle Class – New Jersey Turnpike – Last Ten Fiscal Years 116
Schedule of Toll Rates per Mile by Toll Type and Vehicle Class – Garden State Parkway – Last Ten Fiscal Years 117
Schedule of Vehicle Miles Traveled – Last Ten Fiscal Years 118
Schedule of Vehicle Miles Traveled by Vehicle Class – New Jersey Turnpike – Last Ten Fiscal Years 119
Schedule of Traffic Accident Statistics – New Jersey Turnpike – Last Ten Fiscal Years 120
Schedule of Traffic Accident Statistics – Garden State Parkway – Last Ten Fiscal Years 121
Schedule of Average Toll per Transaction – Last Ten Fiscal Years 122
Schedule of Ten Largest Customers – Last Ten Fiscal Years 123
Schedule of Outstanding Debt per Toll Transaction and Lane Mile – Last Ten Fiscal Years 126
Schedule of Net Revenue Requirement – Last Ten Fiscal Years 127
Schedule of Aggregate Debt Service – as of December 31, 2015 128
Schedule of Full Time Employees (Authorized Positions) – Last Ten Fiscal Years 129
Schedule of State Population and Employment – Last Ten Fiscal Years 130
Schedule of Total Personal Income and Per Capita Income – Last Ten Fiscal Years 131
NEW JERSEY TURNPIKE AUTHORITY (A Component Unit of the State of New Jersey)
Comprehensive Annual Financial Report
Year ended December 31, 2015
Table of Contents
Page
Schedule of Ten Largest Employers – Last Ten Fiscal Years 132
Schedule of Insurance Coverage – as of December 31, 2015 137
Schedules of Toll Rates – as of December 31, 2015 142
Schedule of Contracts Entered into over $100,000 for the year ended December 31, 2015 164

INTRODUCTORY SECTION (UNAUDITED)

(This Page Intentionally Left Blank)
Letter of Transmittal
iii
New Jersey Turnpike Authority ADMINISTRATION BUILDING - 581 MAIN STREET
P.O. BOX 5042 - WOODBRIDGE, NEW JERSEY 07095
TELEPHONE (732) 750-5300
June 28, 2016
Board of Commissioners
New Jersey Turnpike Authority
581 Main Street
Woodbridge, New Jersey 07095
Commissioners:
The New Jersey Turnpike Authority Act of 1948, as amended, restated and supplemented, the Turnpike
Revenue Bond Resolution of 1991, as amended, restated and supplemented, as well as Executive Orders
122 (McGreevy, 2004) and 37 (Corzine, 2006), require an annual audit of the New Jersey Turnpike
Authority’s (Authority) financial statements by a firm of independent auditors. Executive Order 37
(Corzine, 2006) (EO37) additionally requires the Authority, on an annual basis, to prepare a
comprehensive report concerning the Authority’s operations. Under EO37, the comprehensive report
shall include, among other things, the Authority’s audited financial statements. Accordingly, the
Comprehensive Annual Financial Report (CAFR) of the Authority for the year ended December 31, 2015
is hereby submitted.
AUTHORITY’S PROFILE AND OPERATION
The Authority owns and operates two well-established major toll roads (the New Jersey Turnpike and the
Garden State Parkway) in a densely populated and wealthy region of the Nation. They act as the “supply
chain spine” and the “distribution platform” for the entire Northeast region.
The Authority has owned and operated the New Jersey Turnpike (the Turnpike) since the time the
Turnpike opened for traffic in 1951. The Turnpike consists of a 122-mile mainline and two extensions.
The mainline runs from Deepwater, Salem County to Fort Lee, Bargen County.
The Garden State Parkway (the Parkway) was owned and operated by the Authority since July 2003, after
abolition of the New Jersey Highway Authority. The Parkway is a 173-mile limited access toll road from
Cape May, New Jersey to Spring Valley, New York.
The Authority is committed to providing safe, reliable and efficient movement of people and goods over
the two busiest toll roads in the United States.
CHRIS CHRISTIE GOVERNOR
KIM GUADAGNO
LIEUTENANT GOVERNOR
RICHARD T. HAMMER, Chairman RONALD GRAVINO, Vice Chairman MICHAEL R. DuPONT, Treasurer RAYMOND M. POCINO, Commissioner ULISES E. DIAZ, Commissioner DANIEL F. BECHT, Commissioner JOHN D. MINELLA, Commissioner JOSEPH W. MROZEK, Executive Director
Website address http://www.state.nj.us/turnpike
i
Letter of Transmittal
ii
ECONOMIC CONDITIONS AND OUTLOOK
The Turnpike and Parkway are two of New Jersey’s great avenues of commerce. Every day, tens of
thousands of commercial and passenger vehicles flow over the roadways, carrying goods between
producer and consumer, and carrying commuters between home and work. From the day they opened to
traffic, the toll roads have represented a key competitive advantage for New Jersey in the regional,
national and global economies.
In addition to making New Jersey more competitive and reducing opportunity costs, infrastructure
spending also creates and sustains jobs. The President’s Council of Economic Advisors estimated that
every $1 billion in spending on transportation infrastructure sustains 13,000 jobs for one year. Those
include jobs in engineering and construction directly supported by infrastructure spending, jobs indirectly
supported at facilities and companies supplying materials and equipment for the projects being built, and
jobs supported in other parts of the economy as a result of the increased income and spending by
companies and individuals who benefit from the direct and indirect jobs. The Authority anticipates
spending $605.4 million on its $7 Billion Capital Improvement Program in 2016. That level of spending
will sustain 7,870 jobs for the year.
As per the Bureau of Economic Analysis Report, the State’s Per Capita Personal Income has increased
from $48,058 in 2006 to $59,782 in 2015. There is a significant decrease in the State’s unemployment
rate from a high of 9.1% in 2009 to 5.6% in 2015. As the local economy continues to grow more residents
are being employed. The State’s aggregate resident employment has increased from 4.2 million in 2006 to
4.3 million in 2015. Based on this population growth, the Authority expects increases in the demand for
its roadways in the coming years.
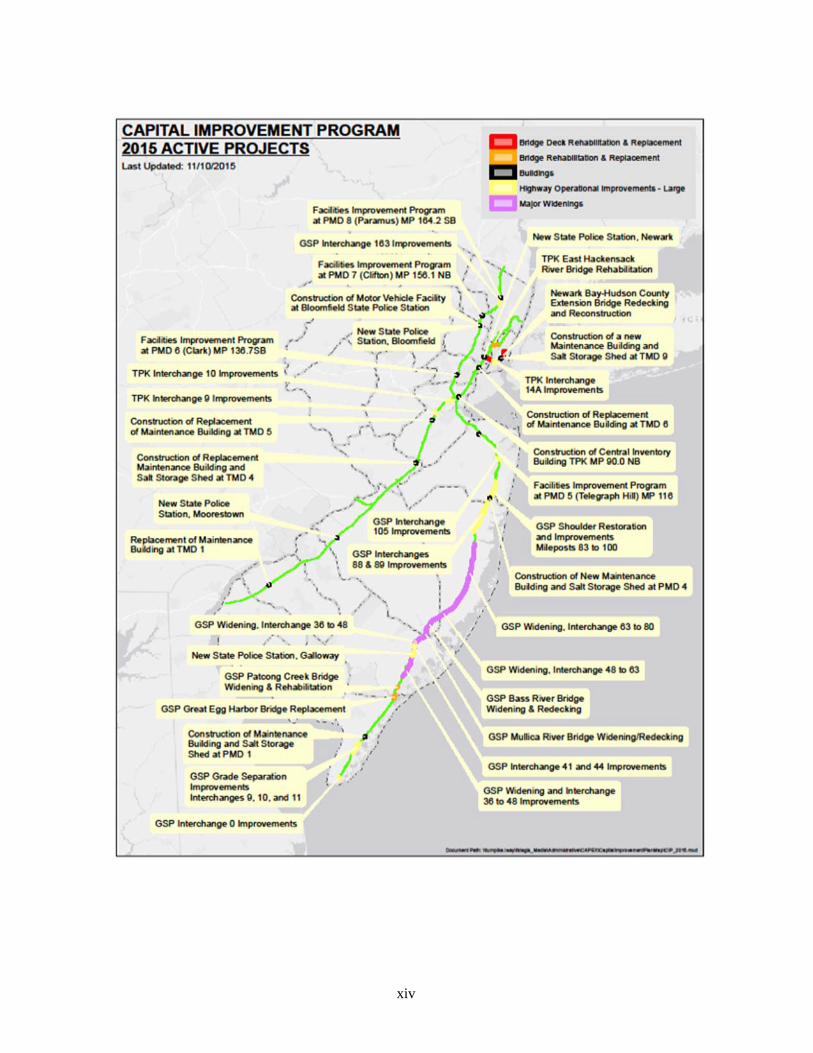
CAPITAL IMPROVEMENT PROGRAM
The Authority is in the midst of a $7 billion ten-year Capital Improvement Program (the CIP) originally
approved by the Board of Commissioners in October 2008. At the same time, a two-step toll increase was
approved that is expected to fully fund the debt service incurred from the financing of the $7 billion CIP.
The $7 billion CIP includes large-scale projects, including widening stretches of both the Turnpike and
Parkway, as well as projects that improve interchanges, rehabilitate bridges and facilities and deploy new
technologies. Due to strict project management and favorable construction pricing, the Authority has been
able to expand the scope of the program without increasing the overall $7 billion budget. The program is
divided between capacity, state of good repair and safety projects. Seven years into the program, the
Authority has spent or committed 89% of its $7 billion budget resulting in improved operational and
maintenance performance to provide for the increased demand for capacity in the future. A summary of
the projects in the $7 billion CIP, along with the current budget and amount spent and/or committed can
be found in the introductory section of this report and in the Management Discussion and Analysis in the
financial section.
INTERNAL CONTROL
Management of the Authority is responsible for the comparative financial statements included in this
Annual Report for the years ended December 31, 2015 and 2014. Management is responsible for both the
accuracy of the financial information presented, the completeness of the report, and the fairness of the
presentation, including all disclosures. The financial statements have been prepared in accordance with
Generally Accepted Accounting Principles (GAAP) in the United States and consequently, they reflect
certain amounts based upon the best estimates and judgment of management.
Letter of Transmittal
iii
Management of the Authority is also responsible for establishing and maintaining a system of internal
control designed to provide reasonable assurance that the assets of the Authority are protected from loss,
theft or misuse, and that adequate accounting records are maintained to allow for the preparation of
financial statements in conformity with GAAP. The internal controls are designed to provide reasonable,
but not absolute, assurance that these objectives are met. The concept of reasonable assurance recognizes
that: (1) the cost of a control should not exceed the resulting benefits; and (2) the analysis of costs and
benefits requires estimates and judgments by management. As a recipient of federal funds for certain
capital projects, the Authority is required to ensure that adequate internal controls are in place which
reasonably ensure compliance with applicable laws and regulations relating to the federal funding. The
system of internal control of the Authority is subject to ongoing evaluation by management.
To the best of our knowledge and belief, the information provided to the external auditors in connection
with the annual audit and contained in this annual report is accurate in all material respects and is reported
in a manner designed to present fairly the financial position and results of operations of the Authority. All
disclosures necessary to enable the reader to gain an understanding of the Authority’s financial activities
have been included. The Authority’s external auditors, KPMG LLP, have completed their examination
and have concluded that in their opinion, the comparative financial statements for the years ended
December 31, 2015 and 2014 present fairly, in all material aspects, the financial position of the Authority
as of December 31, 2015 and 2014, and the changes in its financial position and its cash flows for the
years then ended in conformity with GAAP.
AWARDS AND ACKNOWLEDGEMENT
The Government Finance Officers Association (GFOA) awarded a Certificate of Achievement for
Excellence in Financial Reporting to the Authority, for the submission of its first ever CAFR for the year
ended December 31, 2014. A Certificate of Achievement is valid for a period of one year only. We
believe that our current CAFR continues to meet the Certificate of Achievement Program’s requirements,
and we are submitting it to the GFOA to determine its eligibility for another certificate.
In addition to the Excellence in Financial Reporting Award, the Authority was a first time recipient of the
GFOA’s Distinguished Budget Presentation Award for its 2015 Annual Budget. The 2016 Annual Budget
has been submitted as well.
We give grateful acknowledgement to the Finance and Budgets Department for timely completion of this
report. We also give special acknowledgement to our external auditors, KPMG LLP for their timely audit
opinion on this report.
Joseph Mrozek Donna Manuelli
Executive Director Chief Financial Officer

iv
The Government Finance Officers Association of the United States and Canada (GFOA) awarded a Certificate of Achievement for Excellence in Financial Reporting to the New Jersey Turnpike Authority for its first time submission of a Comprehensive Annual Financial Report for the year ended December 31, 2014. In order to be awarded a Certificate of Achievement, a government must publish an easily readable and efficiently organized comprehensive annual financial report. This report must satisfy both generally accepted accounting principles and applicable legal requirements.
A Certificate of Achievement is valid for a period of one year. Management believes that the Comprehensive Annual Financial Report for the year ended December 31, 2015 continues to meet the Certificate of Achievement Program’s requirements and is submitting it to the GFOA to determine its eligibility for another certificate.
v
The Government Finance Officers Association of the United States and Canada (GFOA) presented a Distinguished Budget Presentation Award to the New Jersey Turnpike Authority, New Jersey for its annual budget for the fiscal year beginning January 1, 2015. In order to receive the award, a governmental unit must publish a budget document that meets program criteria as a policy document, as an operations guide, as a financial plan, and as a communications device.
This award is valid for a period of one year only. Management believes that annual budget for the fiscal year beginning January 1, 2016 continues to conform to program requirements, and have submitted it to GFOA to determine its eligibility for another award.
vi
Vision Statement
To provide a safe, reliable and modern toll road system that offers a top-quality travel experience for customers and to be regarded as a premier public agency in the operation and management of that system.
Mission Statement
The New Jersey Turnpike Authority is dedicated to the safe and efficient movement of people and goods over two of the busiest toll roads in the United States – the New Jersey Turnpike and the Garden State Parkway.
Core Values
The Authority’s core values are a commitment to:
safety
customer service
agency and roadway system integrity
innovation
sustainability
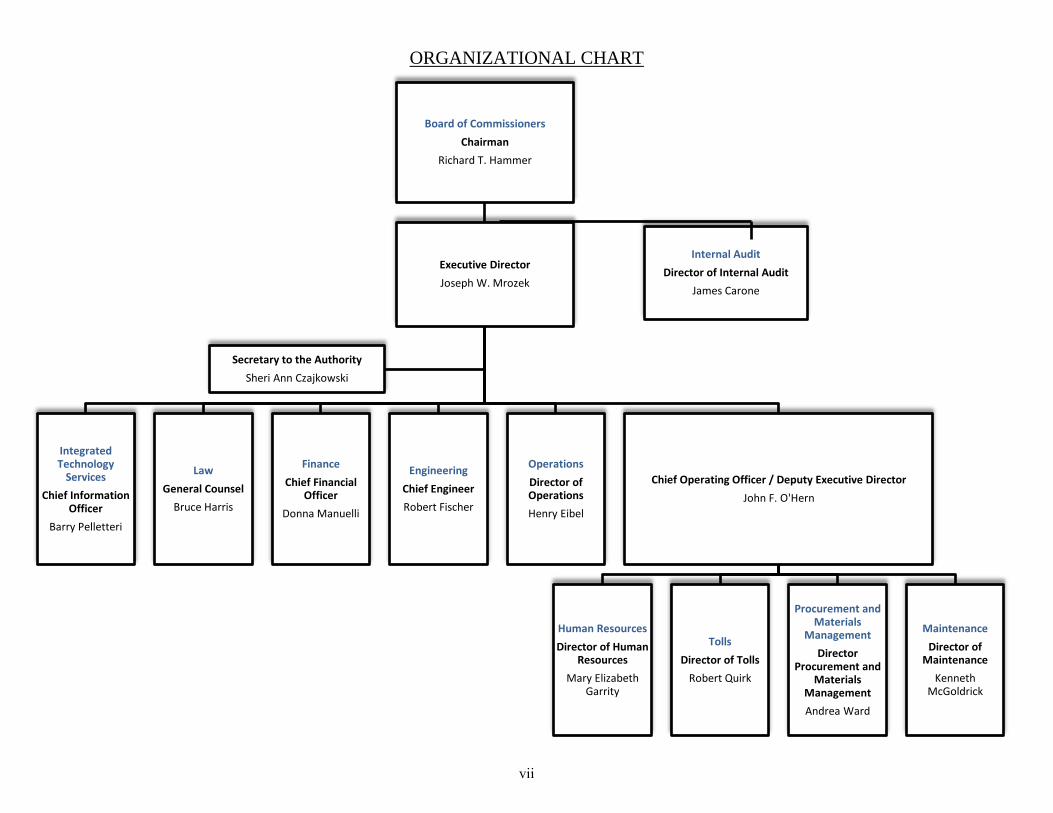
ORGANIZATIONAL CHART
Board of Commissioners
Chairman
Richard T. Hammer
Executive Director
Joseph W. Mrozek
Integrated Technology
Services
Chief Information Officer
Barry Pelletteri
Law
General Counsel
Bruce Harris
Finance
Chief Financial Officer
Donna Manuelli
Engineering
Chief Engineer
Robert Fischer
Operations
Director of Operations
Henry Eibel
Chief Operating Officer / Deputy Executive Director
John F. O'Hern
Human Resources
Director of Human Resources
Mary Elizabeth Garrity
Tolls
Director of Tolls
Robert Quirk
Procurement and Materials
Management
Director Procurement and
Materials Management
Andrea Ward
Maintenance
Director of Maintenance
Kenneth McGoldrick
Secretary to the Authority
Sheri Ann Czajkowski
Internal Audit
Director of Internal Audit
James Carone
vii
viii
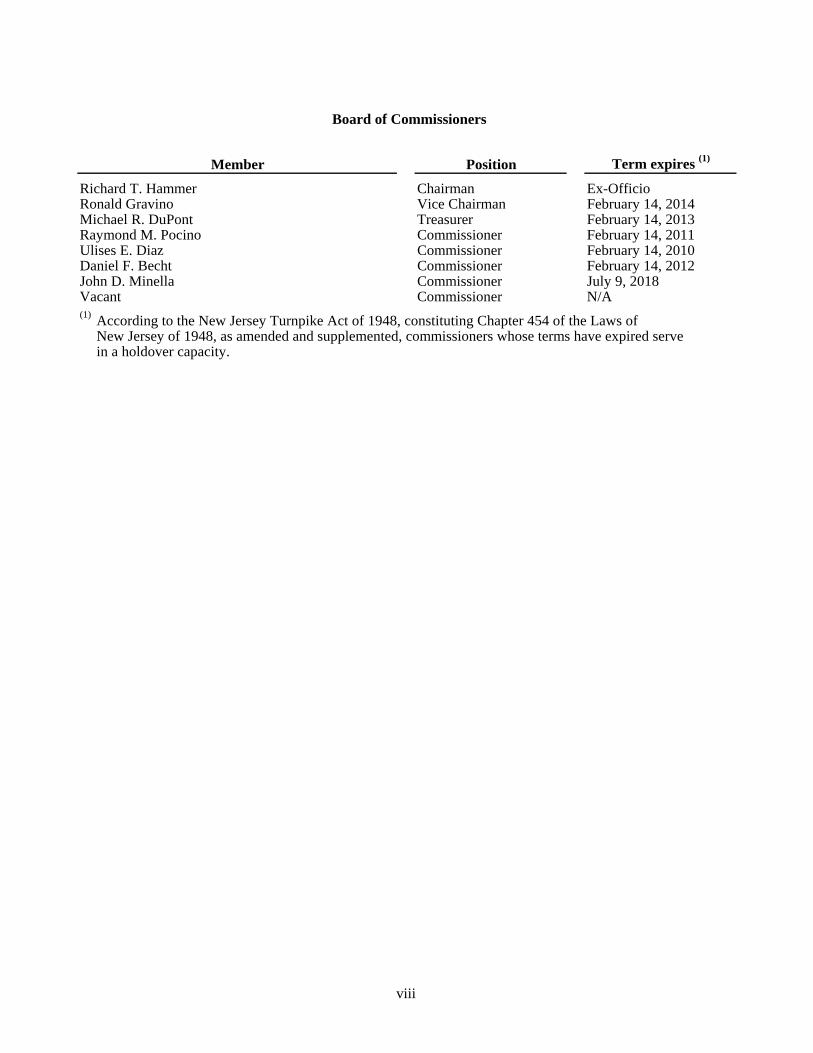
Board of Commissioners
Member Position Term expires (1)
Richard T. Hammer Chairman Ex-OfficioRonald Gravino Vice Chairman February 14, 2014Michael R. DuPont Treasurer February 14, 2013Raymond M. Pocino Commissioner February 14, 2011Ulises E. Diaz Commissioner February 14, 2010Daniel F. Becht Commissioner February 14, 2012John D. Minella Commissioner July 9, 2018Vacant Commissioner N/A(1) According to the New Jersey Turnpike Act of 1948, constituting Chapter 454 of the Laws of
New Jersey of 1948, as amended and supplemented, commissioners whose terms have expired servein a holdover capacity.
ix
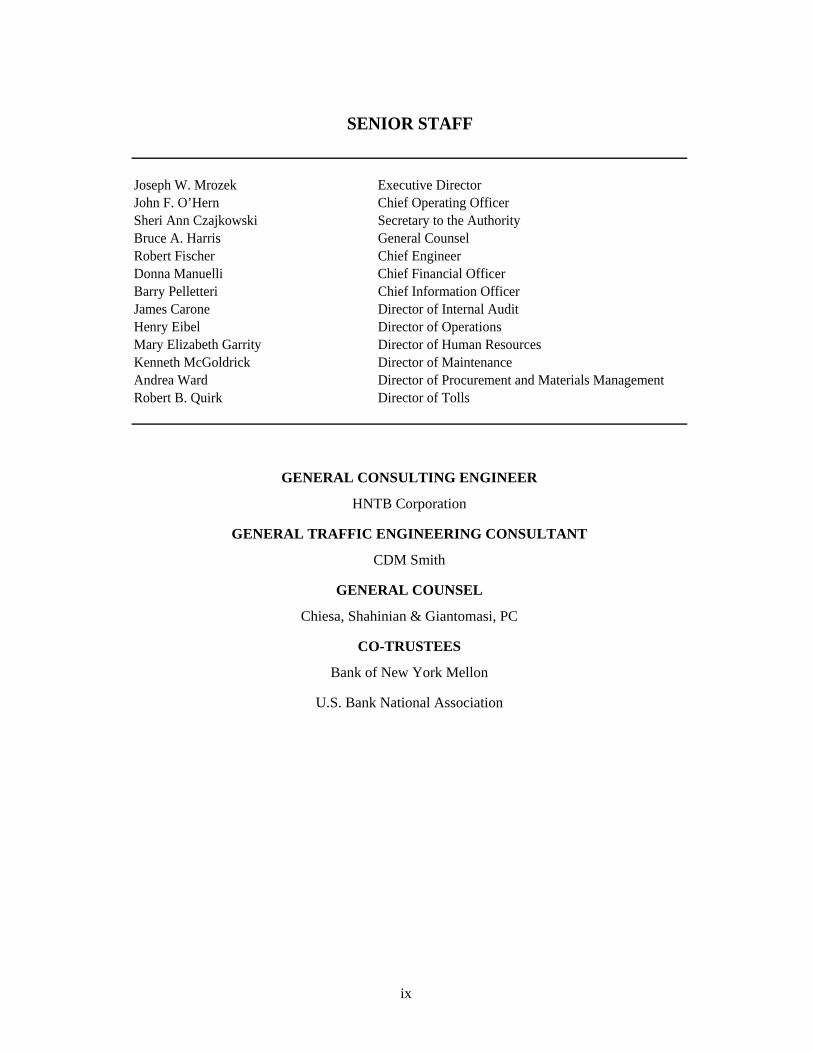
SENIOR STAFF
Joseph W. Mrozek Executive DirectorJohn F. O’Hern Chief Operating OfficerSheri Ann Czajkowski Secretary to the AuthorityBruce A. Harris General CounselRobert Fischer Chief EngineerDonna Manuelli Chief Financial OfficerBarry Pelletteri Chief Information OfficerJames Carone Director of Internal AuditHenry Eibel Director of OperationsMary Elizabeth Garrity Director of Human ResourcesKenneth McGoldrick Director of MaintenanceAndrea Ward Director of Procurement and Materials ManagementRobert B. Quirk Director of Tolls
GENERAL CONSULTING ENGINEER
HNTB Corporation
GENERAL TRAFFIC ENGINEERING CONSULTANT
CDM Smith
GENERAL COUNSEL
Chiesa, Shahinian & Giantomasi, PC
CO-TRUSTEES
Bank of New York Mellon
U.S. Bank National Association
x
OVERVIEW OF ORGANIZATION, BACKGROUND AND FUNCTIONS
Background
The New Jersey Turnpike Authority (the Authority) is a body corporate and politic of the State of New Jersey (the State) organized and existing by virtue of the New Jersey Turnpike Act of 1948, constituting Chapter 454 of the Laws of New Jersey of 1948, as amended and supplemented (the Act). Pursuant to the Act, the Authority has owned and operated the New Jersey Turnpike (the Turnpike) since the time the Turnpike opened for traffic in 1951. In July 2003, the New Jersey Highway Authority (the Highway Authority) was abolished and the Authority assumed all of the powers, rights, obligations, assets, debts, liabilities and statutory responsibilities and duties of the Highway Authority, including the ownership and operation of the Garden State Parkway (the Parkway and, together with the Turnpike, the Turnpike System). As a result, the assets and liabilities of the Authority and the Highway Authority and the ongoing operations, expenses and revenues of the Turnpike and the Parkway are now combined under the ownership and operation of the Authority.
The Turnpike
The Turnpike is a limited access toll road that serves as part of the I-95 corridor linking the major economic centers of the East Coast. Its connections to in Newark and Elizabeth and a major airport in Newark make it an important route for both commercial and passenger vehicles. It also serves New Jersey commuters traveling to and from the major metropolitan areas surrounding Philadelphia and New York City and other employment centers in the State.
The Turnpike consists of a 122-mile mainline and two extensions. Originally, the mainline ran from Deepwater, Salem County, to US Route 46 in Ridgefield Park, Bergen County, a distance of approximately 117.5 miles. In 1992, the Authority acquired the 4.4-mile section of Interstate 95 extending from the northern terminus of the Turnpike mainline to Fort Lee, Bergen County, at the crossing of Route 9W (Fletcher Avenue), a short distance west of the George Washington Bridge toll plaza (the I-95 Extension). Approximately three miles west of this location lies a full directional interchange with Interstate 80, a significant traffic generator for the Turnpike. At the southern terminus, the Turnpike connects, via a short section of US Route 40, with the Delaware Memorial Bridge.
The Newark Bay-Hudson County extension, which opened in 1956, is a four-lane, 8.3-mile spur that extends from Interchange 14 on the mainline Turnpike to the Holland Tunnel plaza in Jersey City, Hudson County. It includes a high-level bridge over Newark Bay. There are three interchanges on the extension: Interchange 14A (Bayonne), Interchange 14B (Jersey City) and Interchange 14C (Holland Tunnel).
The Pearl Harbor Memorial Turnpike extension, which opened in 1956, is a 6.6-mile, six-lane spur that connects the Turnpike to the Pennsylvania Turnpike. The extension begins at a junction with the mainline Turnpike at Interchange 6 (Mansfield) and ends at the Delaware River. The bridge across the Delaware River at that point was bonded and constructed jointly by the Authority and the Pennsylvania Turnpike Commission. A full interchange connecting the extension to Route 130 in Florence Township, New Jersey, was opened in 1999.
The Turnpike roadway is two lanes in each direction from Interchange 1 (Deepwater) to Interchange 4 (Camden-Philadelphia) and three lanes in each direction from Interchange 4 to Interchange 6.
From Interchange 6 to north of Interchange 14 (Newark), the Turnpike is configured as a “dual/dual” highway; it has two distinct sets of lanes in each direction, an inner roadway and an outer roadway. Under normal operating conditions, truck, bus, and passenger car traffic is permitted on the outer roadways, but only passenger car traffic is permitted on the inner roadways. Ramps at the interchanges enable traffic to enter or exit the Turnpike from any of the four roadways.
xi
Vehicles are prevented from crossing back and forth between the inner and outer roadways by a median with a guardrail. Crossovers have been provided on those medians to allow access to emergency and maintenance vehicles and to provide for the detouring of traffic under police control if an accident should block one of the roadways. The northbound and southbound roadways are separated by a specially designed, crash-tested, heavy concrete barrier to prevent cross-over traffic. Grade-separated U-turn structures have been provided at appropriate locations so that police, maintenance, and other vehicles can change direction safely.
Between Interchanges 6 and 11 (Woodbridge), there are 12 lanes total, three outer and three inner in each direction. And from Interchange 11 to Interchange 14, there are 14 total lanes, four lanes in each direction on the outer roadways and three in each direction on the inner roadways.
North of Interchange 14, the inner and outer roadways of the Turnpike merge and divide through a complex configuration referred to as the “Southern Mixing Bowl” to follow two separate alignments, one west of the Hackensack River, the other, east of the Hackensack River. The Westerly Alignment is six lanes from north of the Southern Mixing Bowl to the NJ Route 3 crossing; it narrows to four lanes from north of this point to the point where it rejoins the Easterly Alignment just south of US Route 46. The Easterly Alignment is six lanes from the Southern Mixing Bowl to the confluence with the Westerly Alignment. North of northbound US Route 46, the roadway separates into dual express and local roadways leading to the George Washington Bridge.
A ground breaking ceremony was held in July 2009 for the construction of the Turnpike’s Interchange 6 to 9 Widening Program. The Program widened the Turnpike from Interchange 6 (Newark) to Interchange 9 (East Brunswick Township), a linear distance of 35 miles. The Program was designed to relieve heavy and recurring congestion on this section of the Turnpike, improve operational and maintenance performance, and provide for the increased demand for capacity in the future. The construction added 170 lane miles to the roadway by widening it from six to 12 lanes from two miles south of Interchange 6 to Interchange 8A (South Brunswick Township), a distance of approximately 25 miles, and from 10 lanes to 12 lanes between Interchange 8A and Interchange 9, a distance of 10 miles. The Program created a dual/dual roadway between Interchange 6 and Interchange 8A and expanded the outer roadway in each direction between Interchange 8A and Interchange 9. The work included improvements at Interchange 7A and the construction of a new toll plaza at Interchange 8. The Program was completed in the fall of 2014 with the opening of the northbound lanes on October 26, 2014, and the southbound lanes on November 2, 2014 at an estimated cost of $2.3 billion.
The Parkway
The Parkway is a 173-mile limited access toll road with connections in the south to Route 9 near Cape May, New Jersey, and in the north to the New York State Thruway at the New York-New Jersey border near Spring Valley, New York. The Parkway interchanges are numbered according to their distance from the southern terminus.
The northern section of the Parkway serves the metropolitan suburban areas in Bergen, Union, Essex, and Passaic Counties near Newark and New York City. In addition to being heavily used by commuters, the location of many businesses and industrial complexes in or near the Parkway corridor has resulted in significant local business traffic. The Parkway also is the principal highway route between metropolitan Newark-New York City and the New Jersey seashore. Heavy trucks are not allowed north of milepost 105.
For approximately 135 miles, the Parkway is distinguished by a wide natural-area median separating northbound from southbound traffic. The purpose of the median is threefold: to prevent head-on collisions between traffic traveling in opposite directions, to prevent visual interference by opposing traffic, and to provide areas that allow extensive flexibility in road configuration. The wide natural-area median is a distinctive feature of the Parkway.
xii
Three sections of the Parkway were constructed by NJDOT and maintained by that agency until June 30, 1987. On July 1, 1987, the Highway Authority took ownership of those sections together with all previous responsibilities and obligations. These sections total approximately 19 miles and include a 13-mile link between US Route 22 and US Route 9 in Union and Middlesex Counties, a two-mile link in Ocean County, and a four-mile link in Cape May County. These portions of the road are known collectively as the “State Sections.” The term “Parkway” as used herein includes the State Sections. No tolls are charged on the State Sections.
The Parkway is four lanes (two in each direction) from Cape May to milepost 48, six lanes to milepost 91, eight lanes to milepost 102, 10 lanes to milepost 117, 12 lanes to milepost 127, 10 lanes to milepost 140, eight lanes to milepost 145, six lanes to milepost 168, and four lanes to the New York border.
The widening of the Parkway from milepost 63 in Stafford Township to milepost 80 in South Toms River opened in May 2011 was funded as part of the $7 Billion CIP. This widening program, from milepost 35 to milepost 80 was designed to relieve heavy traffic congestion and to improve motorist safety by the addition of one new lane in both the northbound and southbound directions and full-width shoulders. In addition to the widening from milepost 63 to milepost 80, the Parkway was widened from milepost 48 to milepost 63. The widening to milepost 52 opened in the spring of 2014. The remaining widening of this section to milepost 48 was opened in May 2015 upon the completion of the rehabilitation of the Bass River Bridge. The final phase of the Parkway widening from milepost 48 to milepost 35 is under construction with a projected completion from milepost 48 to milepost 41 in late 2016 and the remainder in the spring of 2018.
xiii
$7 BILLION CAPITAL IMPROVEMENT PROGRAM
As previously mentioned, the Authority is in the midst of its $7 Billion Capital Improvement Program. Funding for the 10-year CIP began with the issuance of $160 million of Series 2008A Subordinate Bond Anticipation Notes. Then in April 2009, the Authority issued $1.75 billion of Turnpike Revenue Bonds, which included $1.38 billion of Federally Taxable, Issuer Subsidy, Build America Bonds issued under the American Recovery and Reinvestment Act of 2009. The Authority was one of the first issuers in the country to take advantage of this financing option. To date, the Authority has issued $6.75 billion of Turnpike Revenue Bonds to fund the $7 billion CIP an additional $1.33 billion of bonds are expected to be issued through 2018.
Recognizing the significance of undertaking a debt financed $7 billion CIP, the Authority’s Board of Commissioners adopted Financial Management Principals and Guidelines (the Guidelines) in December 2012, which represent management’s commitment to fiscal prudence, credit quality and long term repayment of outstanding debt. The guidelines were amended in November 2015. The Guidelines are intended to serve as a management tool to enable the Authority to communicate its commitment to a sound financial decision making process, and affirm to investors and the credit rating agencies management’s commitment to the long term financial viability of the Authority and the repayment of its bonds. The Guidelines are also intended to serve as guidance in respect to the issuance and management of debt in appropriate amounts with the goals of achieving the lowest possible costs of capital within prudent risk parameters and ensuring ongoing access to the capital markets. Finally, the Guidelines emphasize the Authority’s commitment to compliance with all provisions of the New Jersey Turnpike Authority Act and the Authority’s General Bond Resolution, as well as all other federal, state and local laws. The Guidelines are comprehensive and include items such as:
Control of operating costs while maintaining the quality of roads and services
Establish a five-year financial plan based upon conservative revenue projections from the Authority’s Traffic Engineer
Continue the Capital Improvement Program with the lowest possible cost of capital
Adequately fund the Maintenance Reserve, Special Project Reserve and other capital needs
Maintain a minimum General Reserve Fund balance of $100 million
Maintain a minimum debt service coverage ratio of 1.4 times, and a minimum total requirements coverage ratio of 1.2 times without transfers from the General Reserve Fund
The Guidelines were implemented at the option of the Authority and are not a legal covenant with Bondholders. A full copy of the Guidelines can be found on the Authority’s website at http://www.state.nj.us/turnpike/.
xiv

xv
$7 BILLION CAPITAL IMPROVEMENT PROGRAM – PROJECT SUMMARY
The $7 billion CIP includes the following projects:
New Jersey Turnpike
(1) Interchanges 6 to 9 Widening
a. Location: Burlington, Mercer, and Middlesex counties
b. Description: Some 170 new lane miles of roadway will be added to this chronically congested stretch of the Turnpike. Three additional lanes will be added in each direction between Interchanges 6 and 8A, and one additional lane will be added in each direction between Interchanges 8A and 9. A new toll plaza will be built at Interchange 8.
c. Schedule: Construction began in June 2009 and was completed in 2014. The new Interchange 8 toll plaza was completed in February 2013.
(2) Interchange 9 Improvements
a. Location: Middlesex County
b. Description: Interchange 9 will be improved to better accommodate existing and future projected traffic volumes utilizing the interchange and along Route 18. The ramp from Route 18 southbound to the Turnpike will be widened to two lanes and Route 18 will be shifted to the east to minimize impacts to the adjacent residential neighborhood. The merge of Route 18 northbound traffic with vehicles entering from the Turnpike will also be modified to improve traffic flow.
c. Schedule: Construction began in 2012 and is scheduled to be completed in the fall of 2016. This project is approximately a year behind the original schedule due to utility company delays involving NJDOT fiber optic relocation on Route 18. A compensable extension of time will be issued once all utility issues are resolved.
(3) Interchange 10 Improvements
a. Location: Middlesex County
b. Description: Ramp improvements will be undertaken to accommodate existing and future projected traffic volumes utilizing the interchange. The ramp carrying traffic from the toll plaza to the southbound Turnpike will be widened to two lanes and other ramps will be realigned to minimize traffic weaving and improve traffic flow.
c. Schedule: Construction began in 2013 and is scheduled to be completed by the end of 2016. The project is approximately two years behind the original completion date due to unforeseen field conditions, conflicts with adjacent Authority’s contracts and Authority issued Change of Plans.
(4) Newark Bay-Hudson County Extension Bridge Deck Reconstruction, Between Interchanges 14 and 14A
a. Location: Essex and Hudson counties
b. Description: The bridge deck is being replaced in two phases between Interchanges 14 and 14A under ongoing Contract No. T100.034 and proposed Contract No. T100.184.
xvi
c. Schedule: Construction on the first phase began in 2010 and is now complete. Construction on the second phase is scheduled to begin in mid-2016 and be substantially completed by late 2020.
(5) Newark Bay-Hudson County Extension Bridge Deck Reconstruction, Between Interchange 14C and Jersey Avenue
a. Location: Hudson Counties
b. Description: The bridge deck is being replaced in the westbound roadway from the intersection of 14th Street and Jersey Avenue in Jersey City to Interchange 14C. The scope of work involves reconstruction of the six viaduct and ramp structures located within the project limits.
c. Schedule: Construction started in 2012 and was completed in April 2016.
(6) Interchange 14A Improvements
a. Location: Hudson County
b. Description: The interchange will be reconfigured to accommodate existing traffic volumes and the future growth in traffic volume resulting from the expansion of an adjacent port facility and a large residential/commercial development.
c. Schedule: A construction contract was awarded in late 2014. Construction is scheduled to be completed in 2018.
(7) Interchange 15W Improvements
a. Location: Hudson County
b. Description: Minor ramp realignments and signing improvements were undertaken to improve traffic flow and reduce the potential for truck overturns.
c. Schedule: Construction began in 2014 and is complete.
(8) Interchange 16W Improvements
a. Location: Bergen County
b. Description: The interchange ramps will be modified to improve traffic operations and safety. The improvements will include widening the ramp from the toll plaza to the southbound Turnpike to provide for two acceleration lanes and signing improvements to address truck overturns.
c. Schedule: Construction began in 2014 and is expected to be completed in the fall of 2016.

xvii
Garden State Parkway
(1) Interchanges 9, 10, and 11 Improvements
a. Location: Cape May County
b. Description: The Garden State Parkway connects to local roads at these at-grade, signalized interchanges. This project will create true grade-separated intersections. Bridges will carry the Parkway over the local streets. Access to the Parkway northbound and southbound will be available at all three interchanges. The project will eliminate a traffic hazard and reduce congestion.
c. Schedule: Construction began in 2013 and is scheduled to be completed in May 2016.
(2) Great Egg Harbor Bridge Improvements
a. Location: Atlantic and Cape May counties
b. Description: A new southbound span will be built to the west of the existing southbound span over Great Egg Harbor and Drag Channel. The existing southbound span will be demolished. The nearby Beasley’s Point Bridge on Route 9 will also be demolished as part of this project.
c. Schedule: Construction of the new span began in 2013 and is scheduled to be completed in October 2016.
(3) Bass River Bridge Widening
a. Location: Burlington County
b. Description: A new span will be built alongside the existing span, and the existing span will be redecked, repaired, and upgraded. The project is part of the second phase of the MP 30-80 Widening Project.
c. Schedule: Construction of the new span was completed in 2013. Rehabilitation of the existing span was completed in May 2015.
(4) Interchange 30 to 80 Widening
a. Location: Atlantic, Burlington, and Ocean counties
b. Description: The Parkway will be widened from two to three lanes in each direction. Express E-ZPass will be added at the Barnegat Toll Plaza.
c. Schedule: The project is being built in phases. Construction on the first phase of the widening (adding a lane in each direction between Mileposts 63 and 80 and installing Express E-ZPass at the Barnegat Toll Plaza) was completed in May 2011. Construction on the second phase (adding a lane in each direction from Mileposts 48 to 63 and making grading and drainage improvements from mileposts 30 to 48) began in 2011. The new lanes were completed and opened to traffic from Mileposts 52 to 63 in the summer of 2013. The remainder of the second phase was opened to traffic after the completion of the Bass River Bridge rehabilitation in 2015. Construction on the third phase of the Widening (Mileposts 35 to 48) began in 2014 and the last contract is scheduled to be completed in August 2018.

xviii
(5) Interchanges 36, 37 and 38 Improvements
a. Location: Atlantic County
b. Description: This project will improve traffic operations at these closely grouped interchanges by adding a deceleration lane on the southbound Parkway and an acceleration lane on Tilton Road at Interchange 36 and by separating the traffic entering the Parkway at Interchange 38 (Atlantic City Expressway) from traffic exiting the Parkway at Interchange 37 (Washington Avenue CR 608).
c. Schedule: Pending permits and other necessary approvals, construction began in 2014 and will continue until 2017.
(6) Interchange 41 Improvements
a. Location: Atlantic County
b. Description: This interchange will provide northbound and southbound access to and from Jimmie Leeds Road.
c. Schedule: Construction began in July 2013 and was completed in August 2015.
(7) Interchange 44 Improvements
a. Location: Atlantic County
b. Description: The project will add two untolled ramps to provide access to the Parkway to and from the south. Access is now available only to and from the north.
c. Schedule: Construction began in July 2013 and was completed in April 2016.
(8) Interchanges 83 to 100 Shoulder Installation
a. Location: Ocean and Monmouth counties
b. Description: Full-width shoulders will be built. Sight distances will be improved and obstructions eliminated. This section of road currently has a reduced speed limit because of safety concerns.
c. Schedule: Construction began in the fall of 2012 and was completed in phases between August 2015 and April 2016.
(9) Interchange 88 Improvements
a. Location: Ocean County
b. Description: A joint effort between the Turnpike Authority and Ocean County, this project will provide ramp movements currently missing at the interchange, along with modifications to existing movements to and from the north, and relocation of ramp toll facilities.
c. Schedule: Construction began in the fall of 2012 and was completed in July 2015.
xix
(10) Interchange 91 Improvements
a. Location: Ocean County
b. Description: A joint effort between the Turnpike Authority and Ocean County, this project will provide ramp movements currently missing at the interchange, reconstruction and safety improvements to the existing northbound ramp toll plaza, construction of two extended services roads, and improvements to nearby county roads to simplify the traffic flow pattern and relieve congestion on local roads.
c. Schedule: Construction began in late 2014 and will be completed in 2016.
(11) Interchange 105 Improvements
a. Location: Monmouth County
b. Description: This project is intended to improve access to and from the Parkway at Interchange 105 as well as safety and operations at the Hope Road/NJ Route 36 intersection. The improvements include a new southbound connection from the Parkway outer roadway to Wayside Road, the addition of a second northbound deceleration lane from the Parkway outer roadway to Interchange 105 and the reconstruction of the Hope Road/NJ Route 36 intersection.
c. Schedule: Construction began in the spring of 2014 and is scheduled to be completed in 2018. The Hope Road / NJ Rte. 36 portion of the project was completed in June 2015.
(12) Interchange 125
a. Location: Middlesex County
b. Description: The interchange will be reconfigured to accommodate existing traffic volumes and the future growth resulting from the development of the waterfront. New ramps from the Parkway southbound and to the Parkway northbound will provide full access to Chevalier Avenue and the waterfront development.
c. Schedule: Construction is expected to begin in mid-2016 and be completed by the end of 2019.
(13) Interchange 163 Improvements
a. Location: Bergen County
b. Description: In order to improve traffic operations, this project will relocate the exits onto Route 17 from the left side of the road to the right side of the road by realigning the Parkway into the existing median in the vicinity of Interchange 163.
c. Schedule: Construction began in 2014 and is scheduled to be completed in May 2017.
The New Revenue B122 (McGAuthorityan indepefinancial s Consistenengages temployeeAudit ComMembers requiremeindepende Managemfor the yefinancial including Accepted amounts b Managemcontrol detheft or mfinancial but not abthat: (1) th
CHRIS CHRGOVERN
KIM GUADA
LIEUTENANT GO
New
Jersey TurnpBond ResoluGreevy, 2004
y’s (the Authoendent auditorstatements of
nt with Executthe independ
es of the Authmmittee periof the Autho
ents, as well aent auditors h
ment of the Auars ended Deinformation all disclosurAccounting
based upon th
ment of the Aesigned to promisuse, and tstatements inbsolute, assurhe cost of a co
RISTIE NOR
AGNO OVERNOR
W
w JersADMIN
P.O. BOX
pike Authorittion of 1991,
4) and 37 (Cority) financiar to satisfy th
f the Authority
tive Order Nodent auditorshority, and whodically meeority in overas overseeing
have unrestrict
uthority is recember 31, 2presented, thres. The finaPrinciples (G
he best estima
Authority is alovide reasonathat adequate
n conformity wance that thesontrol should
Website address h
sey TuNISTRATION BX 5042 - WOO
TELEPHO
REPORT O
ty Act of 194, as amended,
Corzine,2006)al statements hese audit reqy is included
o. 122, (McG. The Audit ho meet certaits with the inseeing the A
g the integrityted access to
esponsible for015 and 2014
he completenancial statemGAAP) in th
ates and judgm
lso responsibable assurance accounting with GAAP. se objectives
d not exceed th
http://www.state.n
xx
urnpikBUILDING - 581DBRIDGE, NE
ONE (732) 750-
OF MANAGEM
48, as amende, restated and), require an by a firm of
quirements. Tin the audited
Greevy, 2004) Committee
in standards ondependent a
Authority’s coy and quality the Audit Co
r the financia4. Managemeness of the reents have behe United Stment of mana
ble for establie that the assrecords are The internal are met. The
he resulting b
nj.us/turnpike
ke Au1 MAIN STREE
EW JERSEY 07-5300
MENT
ed, restated ad supplemente
annual audif independent The report of d financial sta
the Authorityis comprise
of independenauditors, and ompliance wit
of the Authoommittee.
al statements ent is responsieport, and theen prepared tates and conagement.
ishing and msets of the Aumaintained tcontrols are d
e concept of rbenefits; and (
uthoritET 7095
and supplemeed, as well ast of the Newauditors. Thethe independ
atements.
y, through itsd of individnce and finanis responsiblth legal, regu
ority’s financi
included in tible for both t
he fairness ofin accordan
nsequently, th
maintaining a uthority are prto allow for designed to preasonable ass(2) the analys
RICHARDRONALDMICHAERAYMONULISES EDANIEL JOHN D.JOSEPH
ty
nted, the Turs Executive Ow Jersey Ture Authority rdent auditor o
s Audit Commduals who arncial expertisele for assistinulatory and eial statements
this Annual Rthe accuracy f the present
nce with Genhey reflect c
system of inrotected fromthe preparati
provide reasonsurance recogsis of costs an
D T. HAMMER, CD GRAVINO, ViceL R. DuPONT, TND M. POCINO, E. DIAZ, CommiF. BECHT, Com MINELLA, Com
H W. MROZEK, E
rnpike Orders rnpike retains on the
mittee, re not e. The ng the ethical s. The
Report of the tation, nerally certain
nternal m loss, ion of nable, gnizes nd
Chairman e Chairman
Treasurer Commissioner ssioner missioner
mmissioner Executive Directoor
benefits rcapital prreasonablysystem of To the bewith the ain a manndisclosurehave beenand have and 2014 2015 and conformit
Joseph WExecutive
requires estimrojects, the Ay ensure com
f internal cont
est of our knoannual audit aner designed tes necessary tn included. Tconcluded thpresent fairly2014, and th
ty with GAAP
W. Mrozek e Director
mates and judAuthority is rempliance withtrol of the Au
owledge and band containedto present fairto enable the
The Authorityhat in their opy, in all materhe changes inP.
dgments by mequired to en
h applicable luthority is subj
belief, the inf in this annuarly the financireader to gai
y’s external ainion, the finrial aspects, thn its financia
xxi
management. nsure that adlaws and reguject to ongoin
formation proal report is accial position anin an understaauditors, KPMancial statemhe financial p
al position an
As a recipiedequate internulations relating evaluation
ovided to the curate in all mnd results of anding of the
MG LLP, havments for the yposition of thnd its cash flo
D C
ent of federalnal controls aing to the fed
n by managem
external audmaterial respeoperations of
e Authority’s ve completedyears ended De Authority aows for the y
Donna ManueChief Financia
l funds for care in place wderal funding
ment.
itors in conneects and is repf the Authoritfinancial acti
d their examinDecember 31,as of Decembyear then end
elli al Officer
certain which g. The
ection ported ty. All ivities nation , 2015 er 31,
ded in
1
Independent Auditors’ Report
The Commissioners
New Jersey Turnpike Authority:
Report on the Financial Statements
We have audited the accompanying basic financial statements of the New Jersey Turnpike Authority
(the Authority), a component unit of the State of New Jersey, as of and for the years ended December 31,
2015 and 2014, and the related notes to the basic financial statements, which collectively comprise the
Authority’s basic financial statements as listed in the table of contents.
Management’s Responsibility for the Financial Statements
Management is responsible for the preparation and fair presentation of these financial statements in
accordance with U.S. generally accepted accounting principles; this includes the design, implementation,
and maintenance of internal control relevant to the preparation and fair presentation of financial statements
that are free from material misstatement, whether due to fraud or error.
Auditors’ Responsibility
Our responsibility is to express an opinion on these financial statements based on our audits. We conducted
our audits in accordance with auditing standards generally accepted in the United States of America. Those
standards require that we plan and perform the audit to obtain reasonable assurance about whether the
financial statements are free from material misstatement.
An audit involves performing procedures to obtain audit evidence about the amounts and disclosures in the
financial statements. The procedures selected depend on the auditors’ judgment, including the assessment of
the risks of material misstatement of the financial statements, whether due to fraud or error. In making those
risk assessments, the auditor considers internal control relevant to the entity’s preparation and fair
presentation of the financial statements in order to design audit procedures that are appropriate in the
circumstances, but not for the purpose of expressing an opinion on the effectiveness of the entity’s internal
control. Accordingly, we express no such opinion. An audit also includes evaluating the appropriateness of
accounting policies used and the reasonableness of significant accounting estimates made by management,
as well as evaluating the overall presentation of the financial statements.
We believe that the audit evidence we have obtained is sufficient and appropriate to provide a basis for our
audit opinion.
Opinion
In our opinion, the financial statements referred to above present fairly, in all material respects, the financial
position of the Authority, as of December 31, 2015 and 2014, and the respective statements of revenues,
expenses, and changes in net position, and cash flows thereof for the years then ended in accordance with
U.S. generally accepted accounting principles.
KPMG LLP New Jersey Headquarters 51 John F. Kennedy Parkway Short Hills, NJ 07078-2702
KPMG LLP is a Delaware limited liability partnership, the U.S. member firm of KPMG International Cooperative (“KPMG International”), a Swiss entity.
2
Other Matters
Emphasis of Matter
As discussed in Note 2(t), during 2015, the Authority implemented Governmental Accounting Standards
Board (GASB) Statement No. 68, Accounting and Financial Reporting for Pensions as of January 1, 2014.
Concurrently with the implementation of GASB No. 68, the Authority implemented GASB Statement No.
71, Pension Transition for Contributions Made Subsequent to the Measurement Date (GASB No. 71). As a
result of adopting this pronouncement, the Authority has restated the beginning net position at January 1,
2014 and the statement of revenues, expenses and change in net position for the year ended December 31,
2014 has also be restated. Our opinion is not modified with respect to this matter.
Required Supplementary Information
U.S. generally accepted accounting principles require that the management’s discussion and analysis on
pages 3 through 38, the schedule of funding progress – other postemployment benefits plan (schedule 1) on
page 90 and Schedule of Proportionate Share, Employer Contributions and Notes (schedule 2) on page 91
be presented to supplement the basic financial statements. Such information, although not a part of the basic
financial statements, is required by the Governmental Accounting Standards Board who considers it to be an
essential part of financial reporting for placing the basic financial statements in an appropriate operational,
economic, or historical context. We have applied certain limited procedures to the required supplementary
information in accordance with auditing standards generally accepted in the United States of America, which
consisted of inquiries of management about the methods of preparing the information and comparing the
information for consistency with management’s responses to our inquiries, the basic financial statements,
and other knowledge we obtained during our audit of the basic financial statements. We do not express an
opinion or provide any assurance on the information because the limited procedures do not provide us with
sufficient evidence to express an opinion or provide any assurance.
Other Supplemental Information
Our audits for the year ended December 31, 2015 and 2014 were conducted for the purpose of forming an
opinion on the basic financial statements that collectively comprise the Authority’s basic financial
statements. The supplemental information included on Schedules 3 through 11B and the introductory and
statistical sections, as listed in the table of contents, is presented for purposes of additional analysis and is
not a required part of the basic financial statements. The supplemental information is the responsibility of
management and was derived from and relates directly to the underlying accounting and other records used
to prepare the basic financial statements. This information, except for those schedules and portions of
schedules marked “unaudited,” on which we express no opinion, has been subjected to the auditing
procedures applied in the audits of the basic financial statements for the years ended December 31, 2015 and
2014 and certain additional procedures, including comparing and reconciling such information directly to
the underlying accounting and other records used to prepare the basic financial statements or to the basic
financial statements themselves, and other additional procedures in accordance with auditing standards
generally accepted in the United States of America. In our opinion, the supplementary information included
in Schedules 3 through 11B is fairly stated in all material respects, in relation to the basic financial statements
as a whole.
The introductory and statistical sections have not been subjected to the auditing procedures applied in the
audit of the basic financial statements, and accordingly, we do not express an opinion or provide any
assurance on them.
June 28, 2016
3
December 31, 2015 and 2014 (Continued)
New Jersey Turnpike Authority Management’s Discussion and Analysis (A Component Unit of the State of New Jersey) (Dollars shown in thousands)
(Unaudited)
The management of the New Jersey Turnpike Authority (the Authority) offers this narrative overview and analysis of the Authority’s financial activities for the years ended December 31, 2015 and 2014, which should be read in conjunction with the Authority’s financial statements.
Overview of the Financial Statements
This discussion and analysis is intended to present an overview of the Authority’s financial performance for the years ended December 31, 2015 and 2014. The Authority’s financial statements are prepared in accordance with Generally Accepted Accounting Principles (GAAP). This section is intended to provide an assessment of how the Authority’s financial position has improved or deteriorated and identify the factors that, in management’s view, significantly affected the Authority’s overall financial position. It may contain opinions, assumptions, or conclusions by the Authority’s management that should not be considered a replacement for the financial statements included in this report.
The Statement of Net Position provides information about the nature and amount of investments in resources (assets) and the obligations to Authority creditors (liabilities), as well as the deferred outflows and inflows of resources, with the difference between these amounts reported as net position.
The Statement of Revenues, Expenses, and Changes in Net Position, which accounts for all of the current year’s revenues and expenses, measures the success of the Authority’s operations over the past year and can be used to determine how the Authority has funded its costs.
The Statement of Cash Flows provides information about the Authority’s cash receipts, cash payments, and net changes in cash resulting from operating, investing and financing activities.
The notes to the Financial Statements provide:
Information that is essential to understanding the basic financial statements, such as the Authority’s accounting methods and policies.
Details of contractual obligations, future commitments and contingencies of the Authority.
Other events or developing situations that could materially affect the Authority’s financial position.
The Required Supplementary Information included in Schedule 1 presents information regarding the Authority’s progress in funding its obligation to provide postemployment benefits other than pensions to its employees.
The Required Supplementary Information included in Schedule 2 presents information regarding the Authority’s proportionate share, employer contributions and notes related to the State of New Jersey Public Employees’ Retirement System (PERS).
4
December 31, 2015 and 2014 (Continued)
New Jersey Turnpike Authority Management’s Discussion and Analysis (A Component Unit of the State of New Jersey) (Dollars shown in thousands)
(Unaudited)
The Other Supplementary Information included in Schedules 3 through 11B presents information regarding the Authority’s accounting and compliance with its 1991 Turnpike Revenue Bond Resolution, as amended, restated and supplemented (the Resolution), and the Authority’s interpretation of such Resolution.
The Authority’s Business
The New Jersey Turnpike Authority (the Authority), is a body corporate and politic created by the New Jersey Turnpike Authority Act of 1948, as amended and supplemented (the Act). The Act authorizes the Authority to construct, maintain, repair, and operate the New Jersey Turnpike (the Turnpike System), to fix and establish tolls for the use of the Turnpike System and to issue Turnpike revenue bonds or notes of the Authority, subject to prior approval in writing from the Governor and from either or both the State Treasurer and the Director of the Division of Budget and Accounting of the Department of the Treasury, payable solely from tolls and other revenues of the Authority. Under the provisions of the Act, the Turnpike bonds or notes and the interest thereon shall not be deemed to constitute a debt or liability or a pledge of the faith and credit of the State of New Jersey (the State) or any political subdivision thereof. The Act further provides that the powers conferred upon the Governor and the Treasurer of the State described shall be exercised with due regard for the rights of the holders of bonds of the Authority at any time outstanding, and nothing in, or done pursuant to, the Act shall in any way limit, restrict or alter the obligation or powers of the Authority or any representative or officer of the Authority to carry out and perform in every detail each and every covenant, agreement or contract at any time made or entered into by or on behalf of the Authority with respect to its bonds or for the benefit, protection or security of the holders thereof.
On May 27, 2003, the Act was amended. The amendment empowered the Turnpike Authority, effective on the Transfer Date, to assume all powers, rights, obligations and duties of the New Jersey Highway Authority (the Highway Authority), which owned and operated the Garden State Parkway (the Parkway) and PNC Bank Arts Center.
5
December 31, 2015 and 2014 (Continued)
New Jersey Turnpike Authority Management’s Discussion and Analysis (A Component Unit of the State of New Jersey) (Dollars shown in thousands)
(Unaudited)
Highlights
The Authority was a first time recipient of the Government Finance Officers Association (GFOA) Distinguished Budget Presentation Award for the submission of its first ever 2015 Annual Budget. The GFOA established the Distinguished Budget Presentation Awards Program in 1984 to encourage and assist state and local governments to prepare budget documents of the very highest quality.
The Authority received the IBTTA (The International Bridge, Tunnel and Turnpike Association) Toll Excellence Award in 2015 in the category of Toll Operations, Maintenance and Engineering. The Authority’s winning initiative, “Traffic Permitting and Lane Closure Application,” was implemented to efficiently manage the more than 850 weekly lane closure requests the Authority receives.
The Authority won the 2015 CIO 100 award for demonstrating the innovative use of technology to deliver business value. This prestigious award was granted to the business partnership between the Operations and Integrated Technology Services (ITS) departments that led to the creation of the Advanced Traffic Management Program (ATMP). Receipt of this award places the Authority among the top 100 organizations in the nation who are using technology to deliver true business value.
The Authority was a first time recipient of the GFAO’s Certificate of Achievement for Excellence in Financial Reporting for the submission of its first ever Comprehensive Annual Financial Report (CAFR) for the year ended December 31, 2014. The program was established by the GFOA in 1945 to assist state and local governments in preparing financial reports that evidence the spirit of transparency and full disclosure.
The Grover Cleveland Service Area, which had been closed since hurricane Sandy in October 2012, was reopened in November 2015. The new and improved service area is being touted as a potential model for future service area renovations.
The Authority hired a licensing agent to put together merchandise deals for both roadways in May 2015. New Jersey Turnpike and Garden State Parkway licensed products will be available for sale. The merchandise will be carried at retail stores, service areas and at the future official Authority online store.
The Authority’s $7 Billion Capital Improvement Program (CIP) continued, and as of December 31, 2015, nearly 89% of the overall budget has been spent or committed on projects. The Authority spent over $742,000 on CIP projects in 2015.
6
December 31, 2015 and 2014 (Continued)
New Jersey Turnpike Authority Management’s Discussion and Analysis (A Component Unit of the State of New Jersey) (Dollars shown in thousands)
(Unaudited)
The Authority issued $750,000 of Series 2015E Turnpike Revenue Bonds to continue to fund the $7 billion CIP. The Authority’s credit ratings were re-affirmed by all three rating agencies as part of the bond sale.
Toll revenue in 2015 was $1,523,133, which was $8,300, or 0.5% above projections. In 2015, traffic on the Turnpike increased by 6.2% compared to 2014, while toll transactions on the Parkway increased by 2.4%. Traffic and revenue increased due to declining gas prices, improving economic conditions, favorable weather conditions from April through December 2015, and the widening of both roadways. This was the fourth consecutive year that the Authority met its toll revenue projections.
The Authority’s net position increased by $120,675, or 22.4%, from $537,615 in 2014 to $658,290 in 2015. Net position increased as the Authority’s operating income exceeded its net non-operating expenses. Prior to GASB 68 adoption, net position increased by $131,092 or 14.0% from $934,924 to $1,066,016 in 2015.
7
December 31, 2015 and 2014 (Continued)
New Jersey Turnpike Authority Management’s Discussion and Analysis (A Component Unit of the State of New Jersey) (Dollars shown in thousands)
(Unaudited)
Implementation of GASB 68
During 2015, the Authority adopted GASB Statement 68, Accounting and Financial Reporting for Pensions (GASB 68). This statement addresses accounting and financial reporting for pensions that are provided to the employees of state and local governmental employers through pension plans that are administered through trusts. Concurrently with the adoption of GASB 68, the Authority implemented GASB Statement No. 71, Pension Transition for Contributions Made Subsequent to the Measurement Date (GASB 71). This statement addresses an issue in GASB 68 concerning transition provisions related to certain pension contributions made to defined benefit plans prior to the implementation of GASB 68 by employers and nonemployer contributing entities.
The Authority participates in the State of New Jersey Public Employees’ Retirement System (PERS), a defined benefit cost-sharing multiple-employer pension plan. GASB 68 requires that the proportionate share of the net pension liability be recognized by each participating employer in the plan. The net pension liability is the portion of the actuarial present value of projected benefit payments attributed to past periods of employee service net of the pension plan’s fiduciary net position. A cost-sharing employer is also required to recognize its proportionate share of pension expense and report deferred outflows and deferred inflows of resources for its proportionate share. The changes in net pension liability adjusted for the deferred inflows and deferred outflows of resources result in pension expense. Prior to the adoption of GASB 68, the Authority only recognized pension expense for these plans up to the amount contributed to the plan as indicated within the fringe benefit rate provided by the State of New Jersey. As of December 31, 2015 and 2014, the Authority recognized a net pension liability of $435,015 and $366,300, respectively, for its proportionate share of PERS net pension liability. The Authority was required to decrease the beginning net position at January 1, 2014 by $394,252 to reflect the cumulative effect of the adoption of GASB 68, as well as restate the 2014 financial statements. (See note 2(t)).
8
December 31, 2015 and 2014 (Continued)
New Jersey Turnpike Authority Management’s Discussion and Analysis (A Component Unit of the State of New Jersey) (Dollars shown in thousands)
(Unaudited)
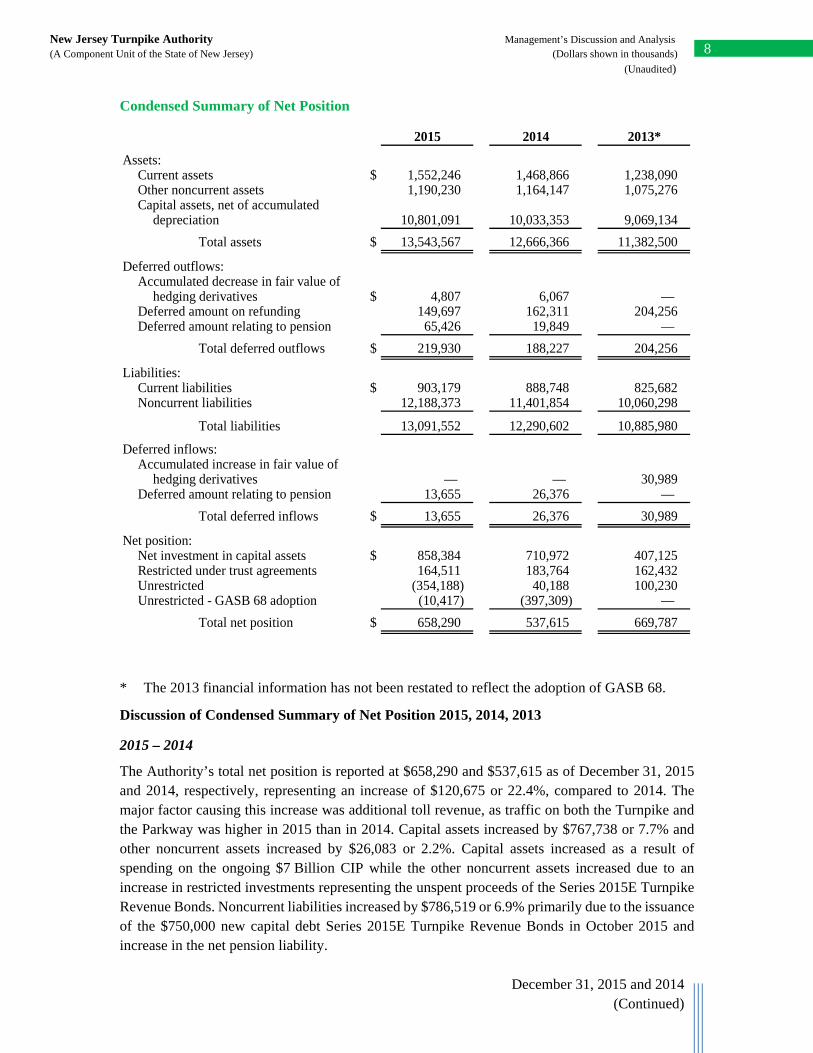
Condensed Summary of Net Position
2015 2014 2013*
Assets:Current assets $ 1,552,246 1,468,866 1,238,090 Other noncurrent assets 1,190,230 1,164,147 1,075,276 Capital assets, net of accumulated
depreciation 10,801,091 10,033,353 9,069,134
Total assets $ 13,543,567 12,666,366 11,382,500
Deferred outflows:Accumulated decrease in fair value of
hedging derivatives $ 4,807 6,067 — Deferred amount on refunding 149,697 162,311 204,256 Deferred amount relating to pension 65,426 19,849 —
Total deferred outflows $ 219,930 188,227 204,256
Liabilities:Current liabilities $ 903,179 888,748 825,682 Noncurrent liabilities 12,188,373 11,401,854 10,060,298
Total liabilities 13,091,552 12,290,602 10,885,980
Deferred inflows:Accumulated increase in fair value of
hedging derivatives — — 30,989 Deferred amount relating to pension 13,655 26,376 —
Total deferred inflows $ 13,655 26,376 30,989
Net position:Net investment in capital assets $ 858,384 710,972 407,125 Restricted under trust agreements 164,511 183,764 162,432 Unrestricted (354,188) 40,188 100,230 Unrestricted - GASB 68 adoption (10,417) (397,309) —
Total net position $ 658,290 537,615 669,787
* The 2013 financial information has not been restated to reflect the adoption of GASB 68.
Discussion of Condensed Summary of Net Position 2015, 2014, 2013
2015 – 2014
The Authority’s total net position is reported at $658,290 and $537,615 as of December 31, 2015 and 2014, respectively, representing an increase of $120,675 or 22.4%, compared to 2014. The major factor causing this increase was additional toll revenue, as traffic on both the Turnpike and the Parkway was higher in 2015 than in 2014. Capital assets increased by $767,738 or 7.7% and other noncurrent assets increased by $26,083 or 2.2%. Capital assets increased as a result of spending on the ongoing $7 Billion CIP while the other noncurrent assets increased due to an increase in restricted investments representing the unspent proceeds of the Series 2015E Turnpike Revenue Bonds. Noncurrent liabilities increased by $786,519 or 6.9% primarily due to the issuance of the $750,000 new capital debt Series 2015E Turnpike Revenue Bonds in October 2015 and increase in the net pension liability.
9
December 31, 2015 and 2014 (Continued)
New Jersey Turnpike Authority Management’s Discussion and Analysis (A Component Unit of the State of New Jersey) (Dollars shown in thousands)
(Unaudited)
2014 – 2013
The Authority’s total net position is reported at $537,615 and $669,787 as of December 31, 2014 and 2013, respectively, representing a decrease of $132,172 or 19.7%, compared to 2013. The major factor causing this decrease was due to the adoption of GASB 68 in 2015. This resulted in a restatement of the beginning net position as of January 1, 2014. Prior to the adoption of GASB 68, net position increased by $265,137 or 39.6% from $669,787 to $934,924. Capital assets increased by $964,219 or 10.6% and other noncurrent assets increased by $88,871 or 8.3%. Capital assets increased as a result of spending on the ongoing $7 Billion CIP, while the other noncurrent assets increased due to an increase in restricted investments representing the unspent proceeds of the $1,000,000 Series 2014A Turnpike Revenue Bonds. Noncurrent liabilities increased by $1,341,556 or 13.3% primarily due to the issuance of the $1,000,000 Series 2014A Turnpike Revenue Bonds in May 2014 and GASB 68 net pension liability.
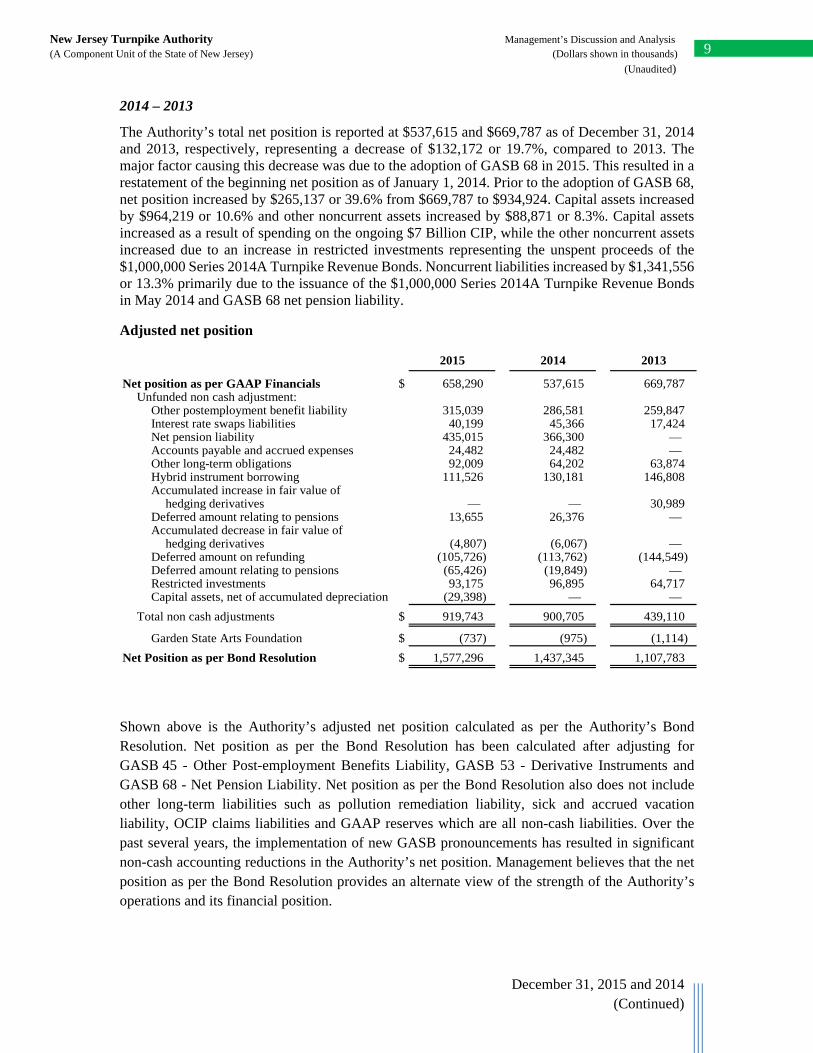
Adjusted net position
2015 2014 2013
Net position as per GAAP Financials $ 658,290 537,615 669,787 Unfunded non cash adjustment:
Other postemployment benefit liability 315,039 286,581 259,847 Interest rate swaps liabilities 40,199 45,366 17,424 Net pension liability 435,015 366,300 — Accounts payable and accrued expenses 24,482 24,482 — Other long-term obligations 92,009 64,202 63,874 Hybrid instrument borrowing 111,526 130,181 146,808
hedging derivatives — — 30,989 Deferred amount relating to pensions 13,655 26,376 —
hedging derivatives (4,807) (6,067) — Deferred amount on refunding (105,726) (113,762) (144,549) Deferred amount relating to pensions (65,426) (19,849) — Restricted investments 93,175 96,895 64,717 Capital assets, net of accumulated depreciation (29,398) — —
Total non cash adjustments $ 919,743 900,705 439,110
Garden State Arts Foundation $ (737) (975) (1,114)
Net Position as per Bond Resolution $ 1,577,296 1,437,345 1,107,783
Accumulated decrease in fair value of
Accumulated increase in fair value of
Shown above is the Authority’s adjusted net position calculated as per the Authority’s Bond Resolution. Net position as per the Bond Resolution has been calculated after adjusting for GASB 45 - Other Post-employment Benefits Liability, GASB 53 - Derivative Instruments and GASB 68 - Net Pension Liability. Net position as per the Bond Resolution also does not include other long-term liabilities such as pollution remediation liability, sick and accrued vacation liability, OCIP claims liabilities and GAAP reserves which are all non-cash liabilities. Over the past several years, the implementation of new GASB pronouncements has resulted in significant non-cash accounting reductions in the Authority’s net position. Management believes that the net position as per the Bond Resolution provides an alternate view of the strength of the Authority’s operations and its financial position.
10
December 31, 2015 and 2014 (Continued)
New Jersey Turnpike Authority Management’s Discussion and Analysis (A Component Unit of the State of New Jersey) (Dollars shown in thousands)
(Unaudited)
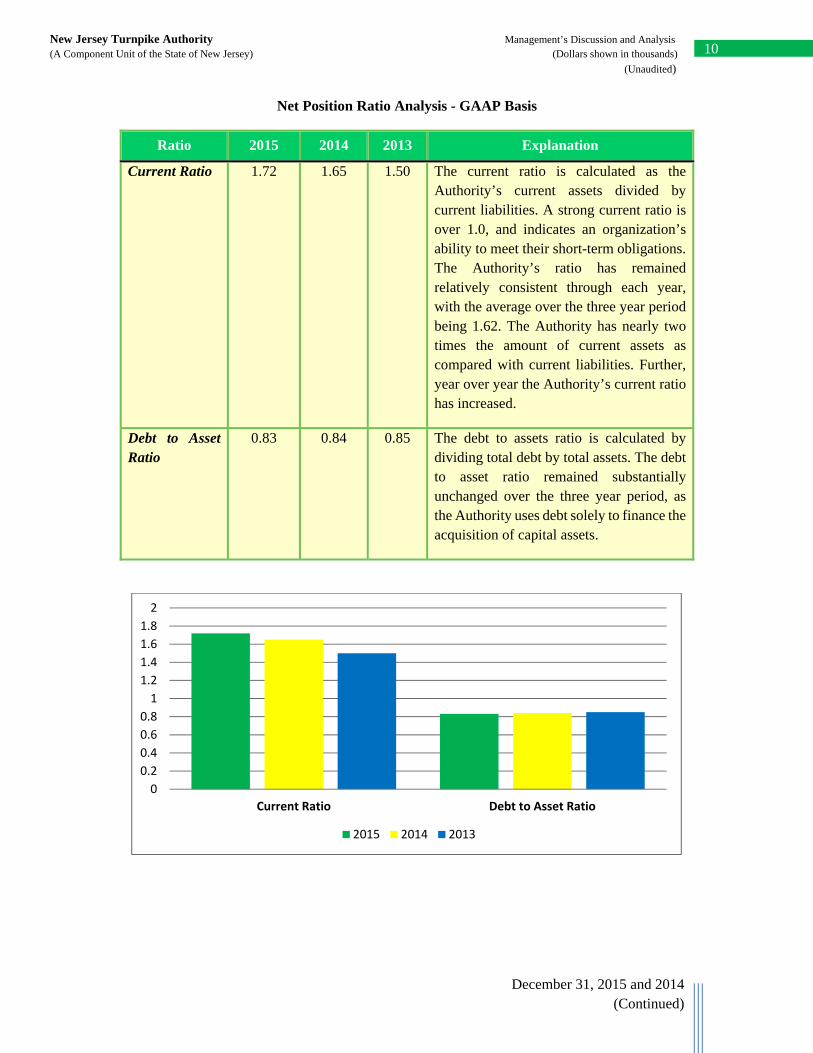
Net Position Ratio Analysis - GAAP Basis
Ratio 2015 2014 2013 Explanation
Current Ratio 1.72 1.65 1.50 The current ratio is calculated as the Authority’s current assets divided by current liabilities. A strong current ratio is over 1.0, and indicates an organization’s ability to meet their short-term obligations. The Authority’s ratio has remained relatively consistent through each year, with the average over the three year period being 1.62. The Authority has nearly two times the amount of current assets as compared with current liabilities. Further, year over year the Authority’s current ratio has increased.
Debt to Asset Ratio
0.83 0.84 0.85 The debt to assets ratio is calculated by dividing total debt by total assets. The debt to asset ratio remained substantially unchanged over the three year period, as the Authority uses debt solely to finance the acquisition of capital assets.
0
0.2
0.4
0.6
0.8
1
1.2
1.4
1.6
1.8
2
Current Ratio Debt to Asset Ratio
2015 2014 2013
11
December 31, 2015 and 2014 (Continued)
New Jersey Turnpike Authority Management’s Discussion and Analysis (A Component Unit of the State of New Jersey) (Dollars shown in thousands)
(Unaudited)
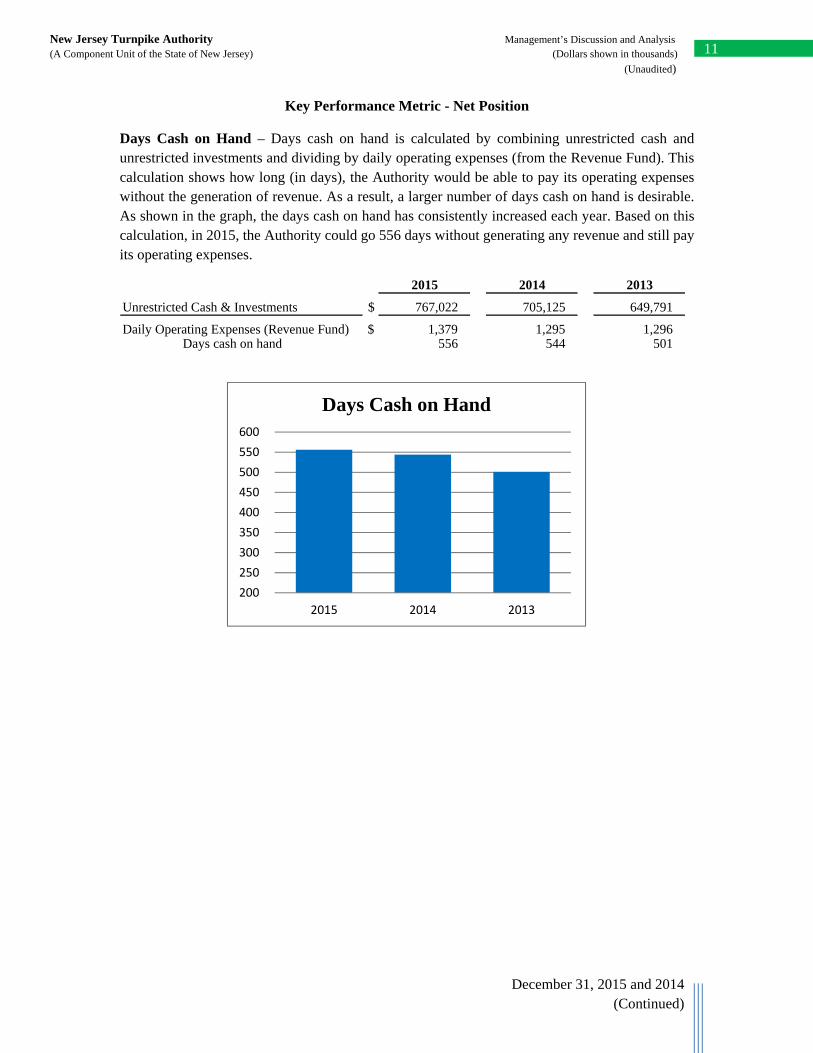
Key Performance Metric - Net Position
Days Cash on Hand – Days cash on hand is calculated by combining unrestricted cash and unrestricted investments and dividing by daily operating expenses (from the Revenue Fund). This calculation shows how long (in days), the Authority would be able to pay its operating expenses without the generation of revenue. As a result, a larger number of days cash on hand is desirable. As shown in the graph, the days cash on hand has consistently increased each year. Based on this calculation, in 2015, the Authority could go 556 days without generating any revenue and still pay its operating expenses.
2015 2014 2013
Unrestricted Cash & Investments $ 767,022 705,125 649,791
Daily Operating Expenses (Revenue Fund) $ 1,379 1,295 1,296 Days cash on hand 556 544 501
200
250
300
350
400
450
500
550
600
2015 2014 2013
Days Cash on Hand

12
December 31, 2015 and 2014 (Continued)
New Jersey Turnpike Authority Management’s Discussion and Analysis (A Component Unit of the State of New Jersey) (Dollars shown in thousands)
(Unaudited)
Capital Improvement Program (CIP)
The Authority is in the midst of a $7 Billion CIP that includes large scale projects such as widening stretches of both the Turnpike and Parkway and smaller projects that improve interchanges, rehabilitate bridges, and deploy new technologies. The $7 Billion CIP continues to be on time and on budget or even ahead of schedule and under budget on some projects. Nearly seven years into the program, the Authority has spent or committed 89%, or $6,205,000, of its original $7,000,000 budget with minimal impact to traffic.
Bond proceeds are deposited in the Construction Fund to support the $7 Billion CIP. Total expenditures in the Construction Fund for the twelve months ended December 31, 2015 were approximately $741,700. Expenses included approximately $90,400 for the Parkway 35–63 Widening Project, approximately $90,600 for the Turnpike Interchange 14A Reconstruction Project, approximately $87,800 for the Authority Phase I Facilities Improvements Program, approximately $80,400 for the Authority Phase II Facilities Improvements Program and approximately $78,100 for the Turnpike Interchange 6 to 9 Widening Project. In addition to these expenditures, there are open contracts and commitments totaling approximately $1,175,700. On March 11, 2015, the Authority broke ground on the $400,000 Turnpike Interchange 14A Reconstruction project.
As a part of the $7 Billion CIP the Authority has taken great measures to increase the mobility and commuting speeds on both the Parkway and Turnpike. One of the main projects that were successfully completed in 2014 was the widening between Interchanges 6 and 9 on the Turnpike. This project provided three additional travel lanes in each direction from interchange 6 to 8A and also added one additional lane in both directions from 8A to 9. As a result of the widening, there has been a reduction in congestion between these exits. The Authority has also undertaken additional projects beyond the Turnpike Interchange 6 to 9 widening to improve the mobility of traffic on both the Parkway and Turnpike. For example, the Authority has also undertaken a project to improve traffic conditions at Turnpike Interchanges 15W and 16W. At Interchange 15W, the improvements will include ramp realignments, median barrier extension and signing, and at Interchange 16W the improvements include widening of a south west toll ramp over Berry’s Creek Canal from one lane to two lanes to accommodate existing and projected traffic volumes.
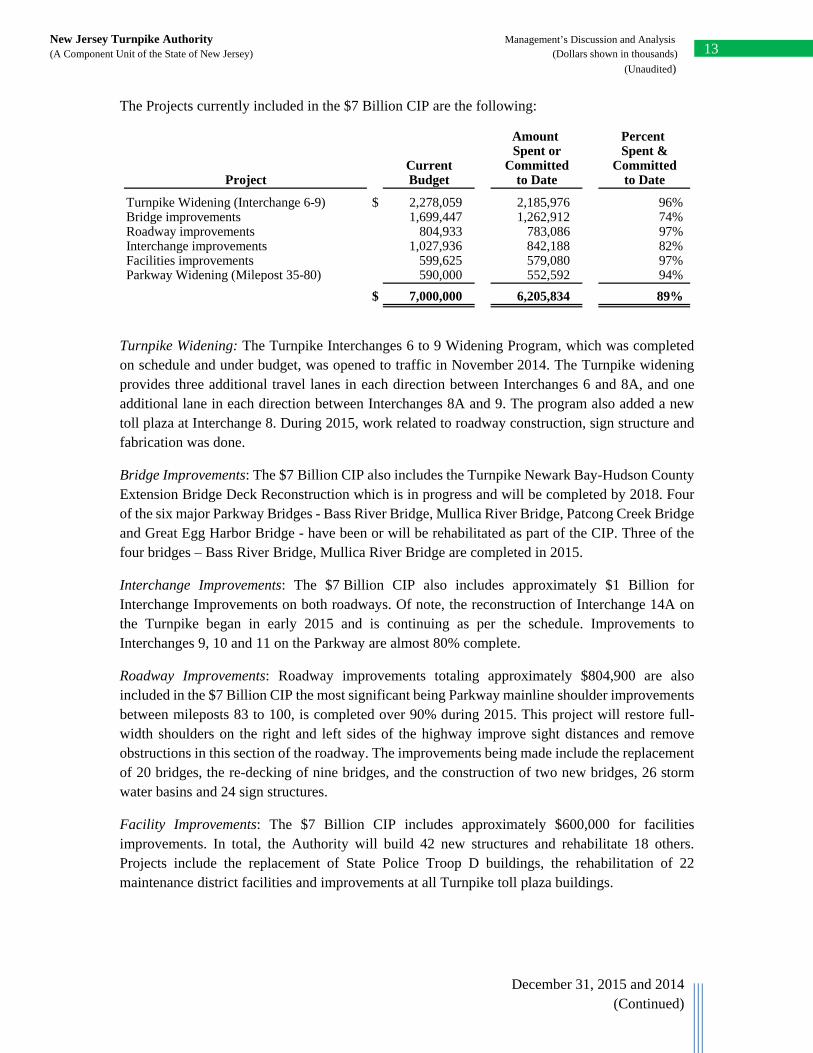
13
December 31, 2015 and 2014 (Continued)
New Jersey Turnpike Authority Management’s Discussion and Analysis (A Component Unit of the State of New Jersey) (Dollars shown in thousands)
(Unaudited)
The Projects currently included in the $7 Billion CIP are the following:
Amount Percent Spent or Spent &
Current Committed CommittedProject Budget to Date to Date
Turnpike Widening (Interchange 6-9) $ 2,278,059 2,185,976 96%Bridge improvements 1,699,447 1,262,912 74%Roadway improvements 804,933 783,086 97%Interchange improvements 1,027,936 842,188 82%Facilities improvements 599,625 579,080 97%Parkway Widening (Milepost 35-80) 590,000 552,592 94%
$ 7,000,000 6,205,834 89%
Turnpike Widening: The Turnpike Interchanges 6 to 9 Widening Program, which was completed on schedule and under budget, was opened to traffic in November 2014. The Turnpike widening provides three additional travel lanes in each direction between Interchanges 6 and 8A, and one additional lane in each direction between Interchanges 8A and 9. The program also added a new toll plaza at Interchange 8. During 2015, work related to roadway construction, sign structure and fabrication was done.
Bridge Improvements: The $7 Billion CIP also includes the Turnpike Newark Bay-Hudson County Extension Bridge Deck Reconstruction which is in progress and will be completed by 2018. Four of the six major Parkway Bridges - Bass River Bridge, Mullica River Bridge, Patcong Creek Bridge and Great Egg Harbor Bridge - have been or will be rehabilitated as part of the CIP. Three of the four bridges – Bass River Bridge, Mullica River Bridge are completed in 2015.
Interchange Improvements: The $7 Billion CIP also includes approximately $1 Billion for Interchange Improvements on both roadways. Of note, the reconstruction of Interchange 14A on the Turnpike began in early 2015 and is continuing as per the schedule. Improvements to Interchanges 9, 10 and 11 on the Parkway are almost 80% complete.
Roadway Improvements: Roadway improvements totaling approximately $804,900 are also included in the $7 Billion CIP the most significant being Parkway mainline shoulder improvements between mileposts 83 to 100, is completed over 90% during 2015. This project will restore full-width shoulders on the right and left sides of the highway improve sight distances and remove obstructions in this section of the roadway. The improvements being made include the replacement of 20 bridges, the re-decking of nine bridges, and the construction of two new bridges, 26 storm water basins and 24 sign structures.
Facility Improvements: The $7 Billion CIP includes approximately $600,000 for facilities improvements. In total, the Authority will build 42 new structures and rehabilitate 18 others. Projects include the replacement of State Police Troop D buildings, the rehabilitation of 22 maintenance district facilities and improvements at all Turnpike toll plaza buildings.
14
December 31, 2015 and 2014 (Continued)
New Jersey Turnpike Authority Management’s Discussion and Analysis (A Component Unit of the State of New Jersey) (Dollars shown in thousands)
(Unaudited)
Garden State Parkway Widening: The Parkway widening project will add a third travel lane and full-width shoulders between Mileposts 35 and 80 and will be completed as follows:
Phase I – Milepost 63 to 80 – Construction completed and open to motorists in May 2011.
Phase II – Milepost 48 to 63 –The widening between Milepost 52-63 was opened in the spring of 2014, with the remaining widening of this section to Milepost 48 opened in May 2015 upon the completion of the rehabilitation of the Bass River Bridge.
Phase III – Milepost 35 to 48 – The first construction contract for this section was awarded in June 2014 and construction began in July 2014. The widening between Milepost 48 to 41 is expected to be completed in late 2016 and the remainder in the spring of 2018.
Total budgeted costs for the Parkway 35-80 Widening Program are approximately $600,000; however, $100,000 of those costs were financed from the proceeds of bond anticipation notes prior to the issuance of the first Series of Bonds for the Capital Improvement Program.
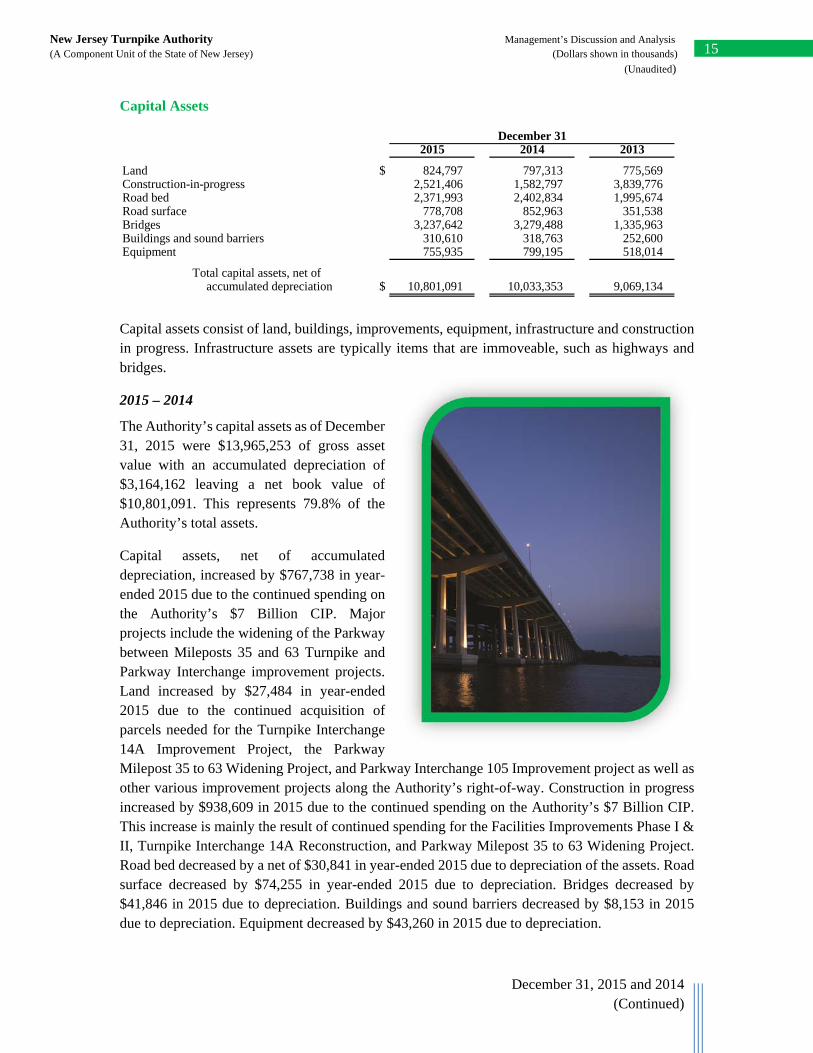
15
December 31, 2015 and 2014 (Continued)
New Jersey Turnpike Authority Management’s Discussion and Analysis (A Component Unit of the State of New Jersey) (Dollars shown in thousands)
(Unaudited)
Capital Assets
December 312015 2014 2013
Land $ 824,797 797,313 775,569 Construction-in-progress 2,521,406 1,582,797 3,839,776 Road bed 2,371,993 2,402,834 1,995,674 Road surface 778,708 852,963 351,538 Bridges 3,237,642 3,279,488 1,335,963 Buildings and sound barriers 310,610 318,763 252,600 Equipment 755,935 799,195 518,014
Total capital assets, net ofaccumulated depreciation $ 10,801,091 10,033,353 9,069,134
Capital assets consist of land, buildings, improvements, equipment, infrastructure and construction in progress. Infrastructure assets are typically items that are immoveable, such as highways and bridges.
2015 – 2014
The Authority’s capital assets as of December 31, 2015 were $13,965,253 of gross asset value with an accumulated depreciation of $3,164,162 leaving a net book value of $10,801,091. This represents 79.8% of the Authority’s total assets.
Capital assets, net of accumulated depreciation, increased by $767,738 in year-ended 2015 due to the continued spending on the Authority’s $7 Billion CIP. Major projects include the widening of the Parkway between Mileposts 35 and 63 Turnpike and Parkway Interchange improvement projects. Land increased by $27,484 in year-ended 2015 due to the continued acquisition of parcels needed for the Turnpike Interchange 14A Improvement Project, the Parkway Milepost 35 to 63 Widening Project, and Parkway Interchange 105 Improvement project as well as other various improvement projects along the Authority’s right-of-way. Construction in progress increased by $938,609 in 2015 due to the continued spending on the Authority’s $7 Billion CIP. This increase is mainly the result of continued spending for the Facilities Improvements Phase I & II, Turnpike Interchange 14A Reconstruction, and Parkway Milepost 35 to 63 Widening Project. Road bed decreased by a net of $30,841 in year-ended 2015 due to depreciation of the assets. Road surface decreased by $74,255 in year-ended 2015 due to depreciation. Bridges decreased by $41,846 in 2015 due to depreciation. Buildings and sound barriers decreased by $8,153 in 2015 due to depreciation. Equipment decreased by $43,260 in 2015 due to depreciation.
16
December 31, 2015 and 2014 (Continued)
New Jersey Turnpike Authority Management’s Discussion and Analysis (A Component Unit of the State of New Jersey) (Dollars shown in thousands)
(Unaudited)
The Authority had open commitments related to construction contracts totaling $1,175,668 as of December 31, 2015. This work relates to the Authority’s $7 Billion CIP and will be completed over the next few years.
2014 – 2013
The Authority’s capital assets as of December 31, 2014 were $12,881,138 of gross asset value with an accumulated depreciation of $2,847,785 leaving a net book value of $10,033,353. This investment represents 79.2% of the Authority’s total assets.
Capital assets, net of accumulated depreciation, increased by $964,219 due to the continued spending on the Authority’s $7 Billion CIP. Major projects include the widening of the Parkway between Mileposts 35 and 80 which is still under construction and the Turnpike Interchange 6 to 9 widening which was opened in November 2014. Land increased by $21,744 in 2014 due to the continued acquisition of parcels needed for the Turnpike Interchange 14A Improvement Project, the Parkway Milepost 35 to 63 Widening Project, and the Parkway Interchange 105 Improvement project as well as other various improvement projects along the Authority’s right-of-way. Construction in progress decreased by $2,256,979 in 2014, the decrease is a result of the additional lanes constructed for the Turnpike 6 to 9 Widening Project being put into service. This decrease was partially offset by continued spending on the Parkway Mainline Shoulder Improvement Project, the Authority Phase I & II Facilities Projects, the Parkway Great Egg Harbor/Drag Channel Bridge Improvement and the Parkway Milepost 35 to 63 Widening Project. Road Bed increased by a net of $407,160 in 2014. This was largely due to the completion of contracts related to the Turnpike 6 to 9 Widening Project, the Authority Drainage Improvement Project, and the Parkway Milepost 35 to 63 Widening Project. Road Surface increased by a net of $501,425 in 2014 due to the Turnpike 6 to 9 Widening Project and the Parkway Interchange 35 to 63 Widening Project as well as general maintenance resurfacing on both the Turnpike and Parkway. Bridges increased by a net of $1,943,525 in 2014 largely due to on Turnpike Interchange 6 to 9 Widening Project, the Newark Bay Hudson County Extension Project and the Hackensack Easterly River Bridge Re-decking Bridge. Buildings and sound barriers increased by a net of $66,163 in 2014 largely due to sound barrier construction for the Turnpike Interchange 6 to 9 Widening Project. Equipment increased by a net of $281,181 in 2014 primarily due to the installation of signs and technology equipment for the Turnpike Interchange 6 to 9 Widening Project and the Parkway Milepost 35 to 63 Widening Project.
The Authority had open commitments related to construction contracts totaling approximately $1,411,224 as of December 31, 2014. This work relates to the Authority’s $7 Billion CIP and will be completed over the next several years.
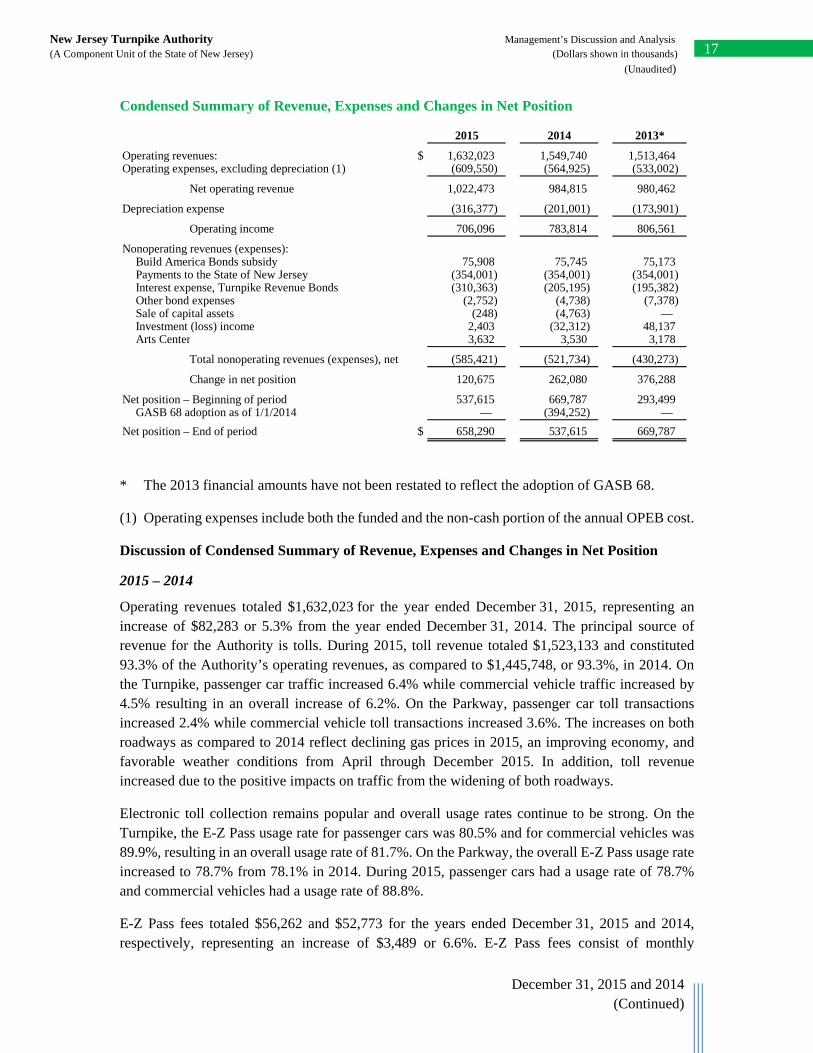
17
December 31, 2015 and 2014 (Continued)
New Jersey Turnpike Authority Management’s Discussion and Analysis (A Component Unit of the State of New Jersey) (Dollars shown in thousands)
(Unaudited)
Condensed Summary of Revenue, Expenses and Changes in Net Position
2015 2014 2013*
Operating revenues: $ 1,632,023 1,549,740 1,513,464 Operating expenses, excluding depreciation (1) (609,550) (564,925) (533,002)
Net operating revenue 1,022,473 984,815 980,462
Depreciation expense (316,377) (201,001) (173,901)
Operating income 706,096 783,814 806,561
Nonoperating revenues (expenses):Build America Bonds subsidy 75,908 75,745 75,173 Payments to the State of New Jersey (354,001) (354,001) (354,001) Interest expense, Turnpike Revenue Bonds (310,363) (205,195) (195,382) Other bond expenses (2,752) (4,738) (7,378) Sale of capital assets (248) (4,763) — Investment (loss) income 2,403 (32,312) 48,137 Arts Center 3,632 3,530 3,178
Total nonoperating revenues (expenses), net (585,421) (521,734) (430,273)
Change in net position 120,675 262,080 376,288
Net position – Beginning of period 537,615 669,787 293,499 GASB 68 adoption as of 1/1/2014 — (394,252) —
Net position – End of period $ 658,290 537,615 669,787
* The 2013 financial amounts have not been restated to reflect the adoption of GASB 68.
(1) Operating expenses include both the funded and the non-cash portion of the annual OPEB cost.
Discussion of Condensed Summary of Revenue, Expenses and Changes in Net Position
2015 – 2014
Operating revenues totaled $1,632,023 for the year ended December 31, 2015, representing an increase of $82,283 or 5.3% from the year ended December 31, 2014. The principal source of revenue for the Authority is tolls. During 2015, toll revenue totaled $1,523,133 and constituted 93.3% of the Authority’s operating revenues, as compared to $1,445,748, or 93.3%, in 2014. On the Turnpike, passenger car traffic increased 6.4% while commercial vehicle traffic increased by 4.5% resulting in an overall increase of 6.2%. On the Parkway, passenger car toll transactions increased 2.4% while commercial vehicle toll transactions increased 3.6%. The increases on both roadways as compared to 2014 reflect declining gas prices in 2015, an improving economy, and favorable weather conditions from April through December 2015. In addition, toll revenue increased due to the positive impacts on traffic from the widening of both roadways.
Electronic toll collection remains popular and overall usage rates continue to be strong. On the Turnpike, the E-Z Pass usage rate for passenger cars was 80.5% and for commercial vehicles was 89.9%, resulting in an overall usage rate of 81.7%. On the Parkway, the overall E-Z Pass usage rate increased to 78.7% from 78.1% in 2014. During 2015, passenger cars had a usage rate of 78.7% and commercial vehicles had a usage rate of 88.8%.
E-Z Pass fees totaled $56,262 and $52,773 for the years ended December 31, 2015 and 2014, respectively, representing an increase of $3,489 or 6.6%. E-Z Pass fees consist of monthly
18
December 31, 2015 and 2014 (Continued)
New Jersey Turnpike Authority Management’s Discussion and Analysis (A Component Unit of the State of New Jersey) (Dollars shown in thousands)
(Unaudited)
membership fees, transponder sales, returned check fees, administrative fees, fiber lease revenue, interest on prepaid accounts and monthly statement fees. The increase resulted from gains in membership fees and administrative fees. There are approximately 126,000 more NJ E-Z Pass accounts at the end of 2015 as compared to 2014. Administrative fee collections increased due to enhanced enforcement and collection efforts, including New Jersey Motor Vehicle Commission registration holds for repeat violators.
Concession revenues were $38,993, constituting 2.4% of total operating revenues. This represents an increase of $2,151 or 5.8% from $36,842 in 2014. The increase is due to the higher than expected commissions received on diesel fuel sales on the Turnpike. Overall, revenue from fuel sales on the Turnpike increased 16.3% and decreased 6.3% on the Parkway. Revenue from food sales on the Turnpike increased 4.6% and decreased 2.7% on the Parkway. The increase in food and fuel sales was partly due to the reopening of the Grover Cleveland Service Area on November 23, 2015 after three years of closure due to the effects of Superstorm Sandy.
Miscellaneous revenue totaled $13,635 for the year ended December 31, 2015, representing a decrease of $742, or 5.2%, compared to the year ended December 31, 2014. Miscellaneous revenue includes rentals of cell tower sites, fiber optic lines, towing commissions, park and ride receipts and easements. Miscellaneous revenue decreased primarily due to lower amounts received in 2015 from the Federal Emergency Management Agency (FEMA) for previously declared weather events.
19
December 31, 2015 and 2014 (Continued)
New Jersey Turnpike Authority Management’s Discussion and Analysis (A Component Unit of the State of New Jersey) (Dollars shown in thousands)
(Unaudited)
General operating expenses, excluding depreciation, totaled $609,550 for the year ended December 31, 2015, representing an increase of $44,625 or 7.9% from $564,925 for the year ended December 31, 2014. The higher costs are primarily the result of an increase of approximately $25,000 in the non-cash portion of the OPEB expense and an increase of $10,417 in the non-cash portion of the pension expense. In accordance with GASB Statement No. 45, Accounting and Financial Reporting by Employers for Postemployment Benefits Other than Pensions (OPEB) (GASB 45), the Authority recorded an expense of $100,182 representing the annual OPEB cost. The increase is due to increase in normal cost as compared to prior valuation period, increase in amortization of the unfunded actuarial accrued liability (UAAL) and additional adjustments for timing differences between cash and accrual accounting, and to prevent double counting of OPEB plan costs. The annual OPEB cost, including the non-cash portion, is included in Operating Expenses and is allocated to each functional expense category based upon the number of active full time employees in each category. Maintenance expenses increased by $22,732 primarily due to the non-cash increase in the annual OPEB cost allocated to maintenance of $8,600, additional maintenance work for roadway and related repairs of $7,600 and an increase in snow and severe weather costs of $2,800. In 2015, the Authority spent a record amount on snow and severe weather totaling $46,731. State police and traffic control costs increased by $5,538 due primarily to a planned increase in the number of State Troopers patrolling the roadways, as well as higher fringe benefit costs. General and Administrative expenses increased by $7,161. Toll collection costs increased by $3,726. The increase in General and Administrative and Toll Collection expenses is primarily due to an increase in the OPEB expense and pension expense allocated to these areas. Depreciation expense during 2015 totaled $316,377, which was an increase of $115,376 from 2014 due to the increase in capital assets generated from the $7 Billion CIP.
Net non-operating expenses increased by $63,687 from 2014 primarily due to increase in interest expense on the Turnpike Revenue Bonds. The increase in interest expense was partially offset by the increase in investment income in 2015 as compared to an investment loss in 2014.
The Build America Bonds subsidy represents a direct payment by the United States Treasury to the Authority originally equal to 35% of the interest payable on the Series 2009F bonds and the Series 2010A bonds. The Build America Bonds subsidy in 2015 was $75,908, an increase of $163 from 2014 due to increase in 2015 interest expenses and a change in the automatic Federal deficit reduction spending cuts. The subsidy payment received in June 2015 was reduced by 7.3%, and the payment received in December 2015 was reduced by 6.8%, while in 2014 the comparable payments were reduced by 7.2% and 7.3%.
Payments to the State of New Jersey remained unchanged at $354,001 in 2015 and 2014. Under the terms of an agreement dated April 27, 1984 and amendments dated August 1, 1995 and March 27, 2000, the Authority agreed to make annual payments to the State of New Jersey to assist in transportation purposes. These payments are $22,000 annually and are due until all obligations of the New Jersey Transportation Trust Fund Authority, as set forth in the 2000 Amendment, are paid for or such payment has been provided for. The payments are made from the General Reserve Fund and are subordinate to debt service payments on all outstanding bonds and all other obligations under the Authority’s General Bond Resolution. Under the terms of a State Transportation Projects Funding Agreement dated September 30, 2011, the Authority agreed to
20
December 31, 2015 and 2014 (Continued)
New Jersey Turnpike Authority Management’s Discussion and Analysis (A Component Unit of the State of New Jersey) (Dollars shown in thousands)
(Unaudited)
make annual payments to the State of New Jersey for the development of state transportation projects. These payments total $324,000 in calendar 2013, $324,000 in calendar 2014, $324,000 in calendar 2015, and $162,000 in calendar 2016. The agreement terminates on June 30, 2016. The payments are made from the General Reserve Fund and are subordinate to debt service payments on all outstanding bonds and all other obligations under the Authority’s General Bond Resolution. The Authority also made annual payments to the State of New Jersey in the amount of $8,001 in 2015 and 2014 for feeder road maintenance provided by the New Jersey Department of Transportation. This agreement is expected to be renewed annually.
Investment earnings were a gain of $2,403 in 2015 as compared to loss of $32,312 in 2014. Interest income earned by the Authority on investments was $11,683 in 2015, slightly decreasing from $12,541 in 2014. The adoption of GASB Statement No. 53 in 2010 requires the recognition of certain of the Authority’s interest rate swaps as investments. Accordingly, the fixed payments made on these interest rate swaps, the variable payments received and the changes in fair market value are required to be reported as investment income (loss). In 2015 and 2014, the Authority was required to report the mark-to-market value of the interest rate swaps that hedge the Series 2000B-G bonds as investments. In 2015, the Authority recorded an investment loss of $13,005 representing the fixed interest payments on the Series 2000B-G swaps, net of the variable payments received, compared to an investment loss of $12,678 in 2014. In 2015, the Authority recognized an investment gain of $3,720, representing the change in fair market value of the Series 2000B-G swaps as compared to an investment loss of $32,178 in 2014. In addition, in 2015 and 2014, the Authority recorded capitalized interest income of $2,290 and $2,577, respectively.
Interest expense increased by $105,168 in 2015 as compared to 2014, due to less interest capitalization in 2015 as work in progress for which interest can be capitalized during the construction period, decreased in 2015. Work in progress decreased due to the completion of the Turnpike Interchange 6 to 9 widening project in November 2014
2014 – 2013
Operating revenues totaled $1,549,740 for the year ended December 31, 2014, representing an increase of $36,276, or 2.4% from the year ended December 31, 2013. The principal source of revenue for the Authority is tolls. During 2014, toll revenue totaled $1,445,748 and constituted 93.3% of the Authority’s operating revenues, as compared to $1,413,763, or 93.4%, in 2013. On the New Jersey Turnpike, passenger car traffic increased 3.7% while commercial vehicle traffic increased by 2.1% resulting in an overall increase of 3.5%. On the Garden State Parkway, passenger car toll transactions increased 0.4% while commercial vehicle toll transactions decreased 0.5%. Passenger cars constituted 98.6% of all Parkway toll transactions; therefore, changes in commercial toll transactions only have minimal impacts. The increases on both roadways as compared to 2013 reflect an improving economy, declining gas prices in 2014 and favorable weather conditions from April through December 2014.
Electronic toll collection remains popular and overall usage rates continue to be strong. On the New Jersey Turnpike, the E-Z Pass usage rate for passenger cars was 80.0% and for commercial vehicles was 89.3%, resulting in an overall usage rate of 81.2%. On the Garden State Parkway, the overall
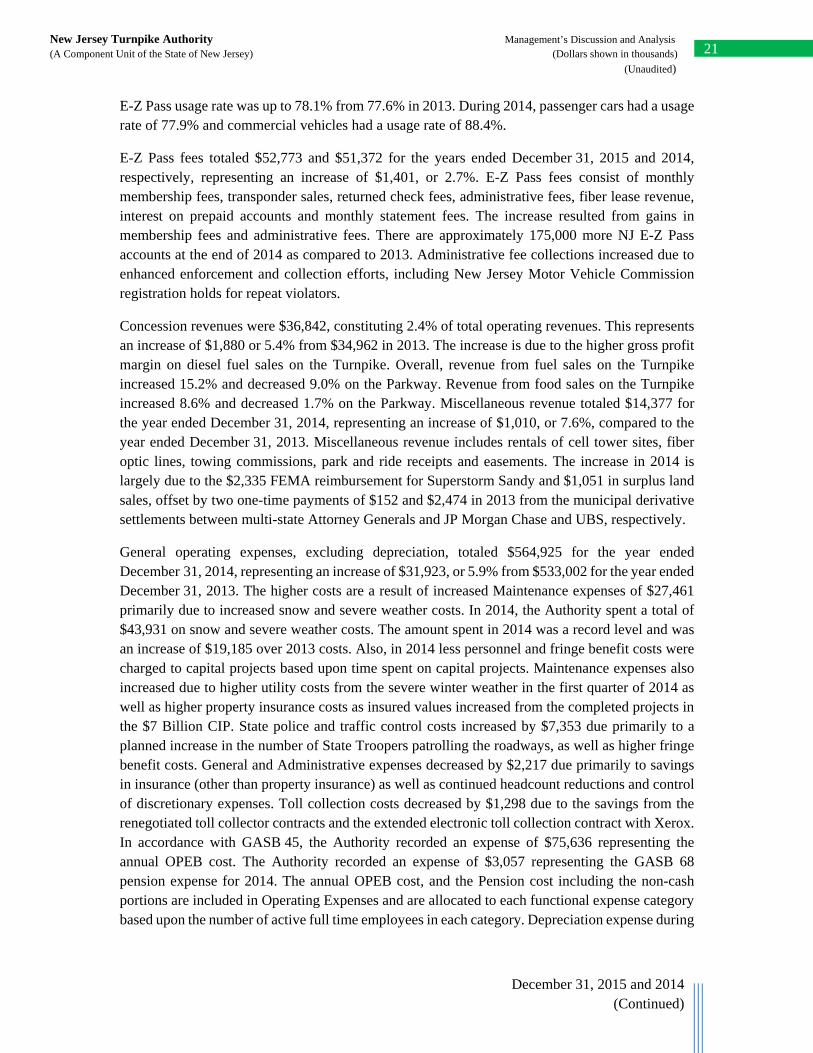
21
December 31, 2015 and 2014 (Continued)
New Jersey Turnpike Authority Management’s Discussion and Analysis (A Component Unit of the State of New Jersey) (Dollars shown in thousands)
(Unaudited)
E-Z Pass usage rate was up to 78.1% from 77.6% in 2013. During 2014, passenger cars had a usage rate of 77.9% and commercial vehicles had a usage rate of 88.4%.
E-Z Pass fees totaled $52,773 and $51,372 for the years ended December 31, 2015 and 2014, respectively, representing an increase of $1,401, or 2.7%. E-Z Pass fees consist of monthly membership fees, transponder sales, returned check fees, administrative fees, fiber lease revenue, interest on prepaid accounts and monthly statement fees. The increase resulted from gains in membership fees and administrative fees. There are approximately 175,000 more NJ E-Z Pass accounts at the end of 2014 as compared to 2013. Administrative fee collections increased due to enhanced enforcement and collection efforts, including New Jersey Motor Vehicle Commission registration holds for repeat violators.
Concession revenues were $36,842, constituting 2.4% of total operating revenues. This represents an increase of $1,880 or 5.4% from $34,962 in 2013. The increase is due to the higher gross profit margin on diesel fuel sales on the Turnpike. Overall, revenue from fuel sales on the Turnpike increased 15.2% and decreased 9.0% on the Parkway. Revenue from food sales on the Turnpike increased 8.6% and decreased 1.7% on the Parkway. Miscellaneous revenue totaled $14,377 for the year ended December 31, 2014, representing an increase of $1,010, or 7.6%, compared to the year ended December 31, 2013. Miscellaneous revenue includes rentals of cell tower sites, fiber optic lines, towing commissions, park and ride receipts and easements. The increase in 2014 is largely due to the $2,335 FEMA reimbursement for Superstorm Sandy and $1,051 in surplus land sales, offset by two one-time payments of $152 and $2,474 in 2013 from the municipal derivative settlements between multi-state Attorney Generals and JP Morgan Chase and UBS, respectively.
General operating expenses, excluding depreciation, totaled $564,925 for the year ended December 31, 2014, representing an increase of $31,923, or 5.9% from $533,002 for the year ended December 31, 2013. The higher costs are a result of increased Maintenance expenses of $27,461 primarily due to increased snow and severe weather costs. In 2014, the Authority spent a total of $43,931 on snow and severe weather costs. The amount spent in 2014 was a record level and was an increase of $19,185 over 2013 costs. Also, in 2014 less personnel and fringe benefit costs were charged to capital projects based upon time spent on capital projects. Maintenance expenses also increased due to higher utility costs from the severe winter weather in the first quarter of 2014 as well as higher property insurance costs as insured values increased from the completed projects in the $7 Billion CIP. State police and traffic control costs increased by $7,353 due primarily to a planned increase in the number of State Troopers patrolling the roadways, as well as higher fringe benefit costs. General and Administrative expenses decreased by $2,217 due primarily to savings in insurance (other than property insurance) as well as continued headcount reductions and control of discretionary expenses. Toll collection costs decreased by $1,298 due to the savings from the renegotiated toll collector contracts and the extended electronic toll collection contract with Xerox. In accordance with GASB 45, the Authority recorded an expense of $75,636 representing the annual OPEB cost. The Authority recorded an expense of $3,057 representing the GASB 68 pension expense for 2014. The annual OPEB cost, and the Pension cost including the non-cash portions are included in Operating Expenses and are allocated to each functional expense category based upon the number of active full time employees in each category. Depreciation expense during
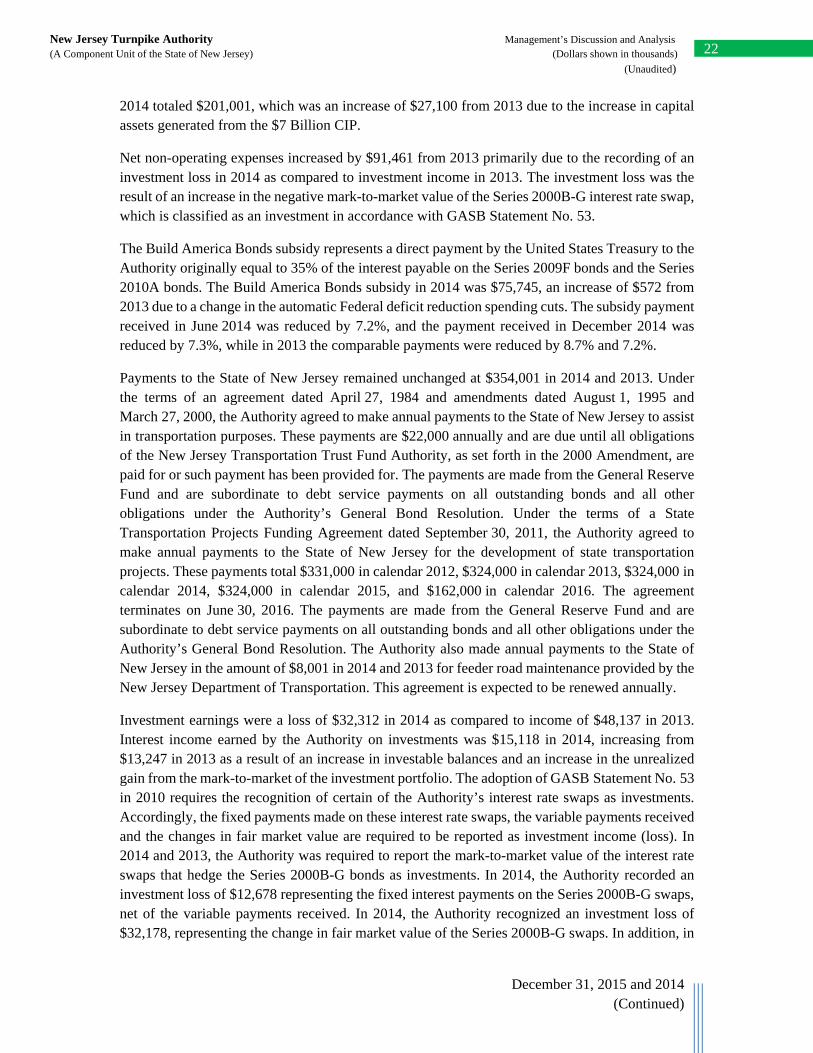
22
December 31, 2015 and 2014 (Continued)
New Jersey Turnpike Authority Management’s Discussion and Analysis (A Component Unit of the State of New Jersey) (Dollars shown in thousands)
(Unaudited)
2014 totaled $201,001, which was an increase of $27,100 from 2013 due to the increase in capital assets generated from the $7 Billion CIP.
Net non-operating expenses increased by $91,461 from 2013 primarily due to the recording of an investment loss in 2014 as compared to investment income in 2013. The investment loss was the result of an increase in the negative mark-to-market value of the Series 2000B-G interest rate swap, which is classified as an investment in accordance with GASB Statement No. 53.
The Build America Bonds subsidy represents a direct payment by the United States Treasury to the Authority originally equal to 35% of the interest payable on the Series 2009F bonds and the Series 2010A bonds. The Build America Bonds subsidy in 2014 was $75,745, an increase of $572 from 2013 due to a change in the automatic Federal deficit reduction spending cuts. The subsidy payment received in June 2014 was reduced by 7.2%, and the payment received in December 2014 was reduced by 7.3%, while in 2013 the comparable payments were reduced by 8.7% and 7.2%.
Payments to the State of New Jersey remained unchanged at $354,001 in 2014 and 2013. Under the terms of an agreement dated April 27, 1984 and amendments dated August 1, 1995 and March 27, 2000, the Authority agreed to make annual payments to the State of New Jersey to assist in transportation purposes. These payments are $22,000 annually and are due until all obligations of the New Jersey Transportation Trust Fund Authority, as set forth in the 2000 Amendment, are paid for or such payment has been provided for. The payments are made from the General Reserve Fund and are subordinate to debt service payments on all outstanding bonds and all other obligations under the Authority’s General Bond Resolution. Under the terms of a State Transportation Projects Funding Agreement dated September 30, 2011, the Authority agreed to make annual payments to the State of New Jersey for the development of state transportation projects. These payments total $331,000 in calendar 2012, $324,000 in calendar 2013, $324,000 in calendar 2014, $324,000 in calendar 2015, and $162,000 in calendar 2016. The agreement terminates on June 30, 2016. The payments are made from the General Reserve Fund and are subordinate to debt service payments on all outstanding bonds and all other obligations under the Authority’s General Bond Resolution. The Authority also made annual payments to the State of New Jersey in the amount of $8,001 in 2014 and 2013 for feeder road maintenance provided by the New Jersey Department of Transportation. This agreement is expected to be renewed annually.
Investment earnings were a loss of $32,312 in 2014 as compared to income of $48,137 in 2013. Interest income earned by the Authority on investments was $15,118 in 2014, increasing from $13,247 in 2013 as a result of an increase in investable balances and an increase in the unrealized gain from the mark-to-market of the investment portfolio. The adoption of GASB Statement No. 53 in 2010 requires the recognition of certain of the Authority’s interest rate swaps as investments. Accordingly, the fixed payments made on these interest rate swaps, the variable payments received and the changes in fair market value are required to be reported as investment income (loss). In 2014 and 2013, the Authority was required to report the mark-to-market value of the interest rate swaps that hedge the Series 2000B-G bonds as investments. In 2014, the Authority recorded an investment loss of $12,678 representing the fixed interest payments on the Series 2000B-G swaps, net of the variable payments received. In 2014, the Authority recognized an investment loss of $32,178, representing the change in fair market value of the Series 2000B-G swaps. In addition, in

23
December 31, 2015 and 2014 (Continued)
New Jersey Turnpike Authority Management’s Discussion and Analysis (A Component Unit of the State of New Jersey) (Dollars shown in thousands)
(Unaudited)
2014 and 2013, the Authority recorded capitalized interest income of $2,577 and $3,123, respectively. In 2013, the Authority recorded an investment loss of $13,837 representing the fixed interest payments on the Series 2000B-G swaps, net of the variable payments received. In addition, in 2013, the Authority recognized investment income of $51,848 representing the change in fair market value of the Series 2000B-G swaps.
Interest expense increased by $9,813 in 2014 as compared to 2013, due to interest expense on the Series 2013A Bonds for a full year in 2014 and the interest paid on the Series 2014A bonds issued in May 2014, partially offset by a higher deduction for interest capitalized to projects in 2014, as well as an increase in amortization.
Adjusted Revenue, Expenses and Change in Net Position
2015 2014 2013
Change in Net Position as per GAAP Financials $ 120,675 262,080 376,288 Unfunded non cash adjustments:
Total operating expenses - GAAP adjustments 37,285 30,120 21,291 Interest expense, Turnpike Revenue Bonds (226,702) (316,837) (294,982) Investment income (loss) 11,574 47,432 (34,888) Interfund transfers 196,880 306,629 273,204
Total Non Cash Adjustment $ 19,037 67,344 (35,375)
Garden State Arts Foundation 238 139 45
Change in net position as per Bond Resolution $ 139,950 329,563 340,958
Add other Non cash expensesDepreciation 316,377 201,001 173,901 Amortization (35,382) (28,722) (20,686)
Change in Net Position - Non-GAAP $ 420,945 501,842 494,173
Shown above is the change in Net Position as per the Bond Resolution and has been calculated by adjusting the change in Net Position as per GAAP for non-cash expenses such as the non-cash portion of the Annual OPEB expense, GASB 68 Pension Expenses, and interest expense and investment income or loss due to the effects of GASB 53. The Change in Net Position – Non-GAAP is calculated by adding back the non-cash expenses such as depreciation and amortization of discounts and premium to the Adjusted Change in Net Position – Bond Resolution. Management believes that the Adjusted Change in Net Position above, which eliminates the more significant GAAP basis non-cash line items, presents an alternate view of the strength of the Authority’s financial results.
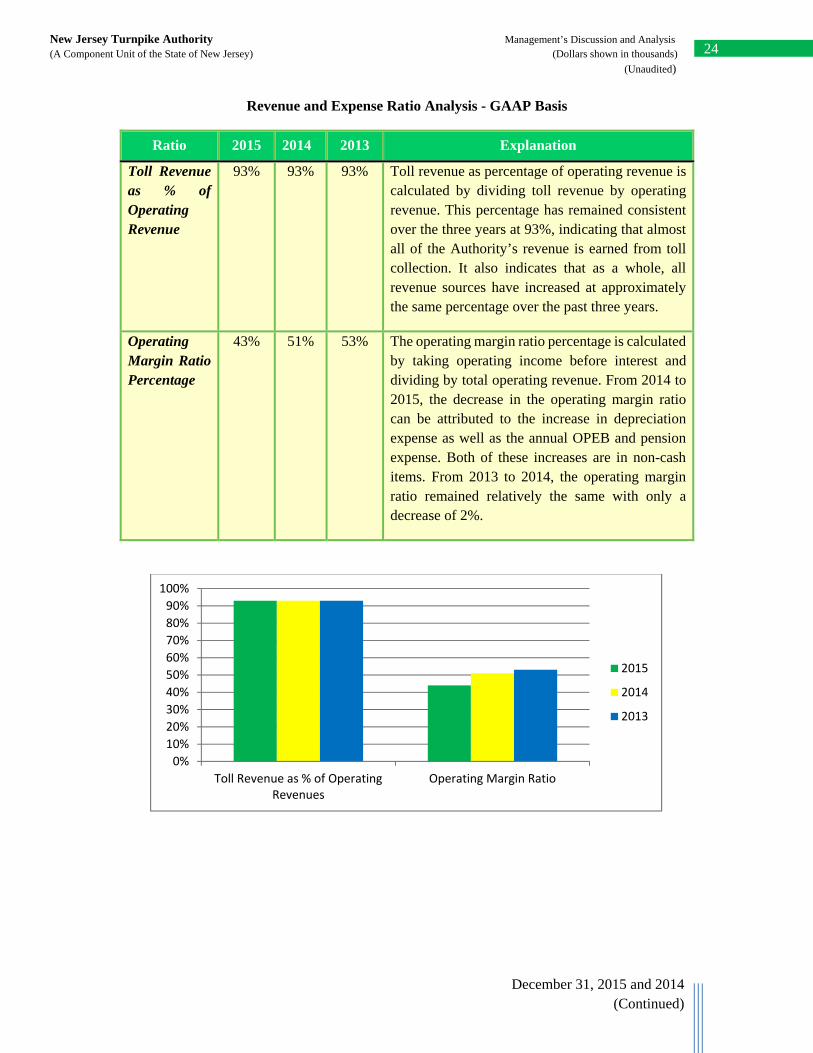
24
December 31, 2015 and 2014 (Continued)
New Jersey Turnpike Authority Management’s Discussion and Analysis (A Component Unit of the State of New Jersey) (Dollars shown in thousands)
(Unaudited)
Revenue and Expense Ratio Analysis - GAAP Basis
Ratio 2015 2014 2013 Explanation
Toll Revenue as % of Operating Revenue
93% 93% 93% Toll revenue as percentage of operating revenue is calculated by dividing toll revenue by operating revenue. This percentage has remained consistent over the three years at 93%, indicating that almost all of the Authority’s revenue is earned from toll collection. It also indicates that as a whole, all revenue sources have increased at approximately the same percentage over the past three years.
Operating Margin Ratio Percentage
43% 51% 53% The operating margin ratio percentage is calculated by taking operating income before interest and dividing by total operating revenue. From 2014 to 2015, the decrease in the operating margin ratio can be attributed to the increase in depreciation expense as well as the annual OPEB and pension expense. Both of these increases are in non-cash items. From 2013 to 2014, the operating margin ratio remained relatively the same with only a decrease of 2%.
0%
10%
20%
30%
40%
50%
60%
70%
80%
90%
100%
Toll Revenue as % of OperatingRevenues
Operating Margin Ratio
2015
2014
2013
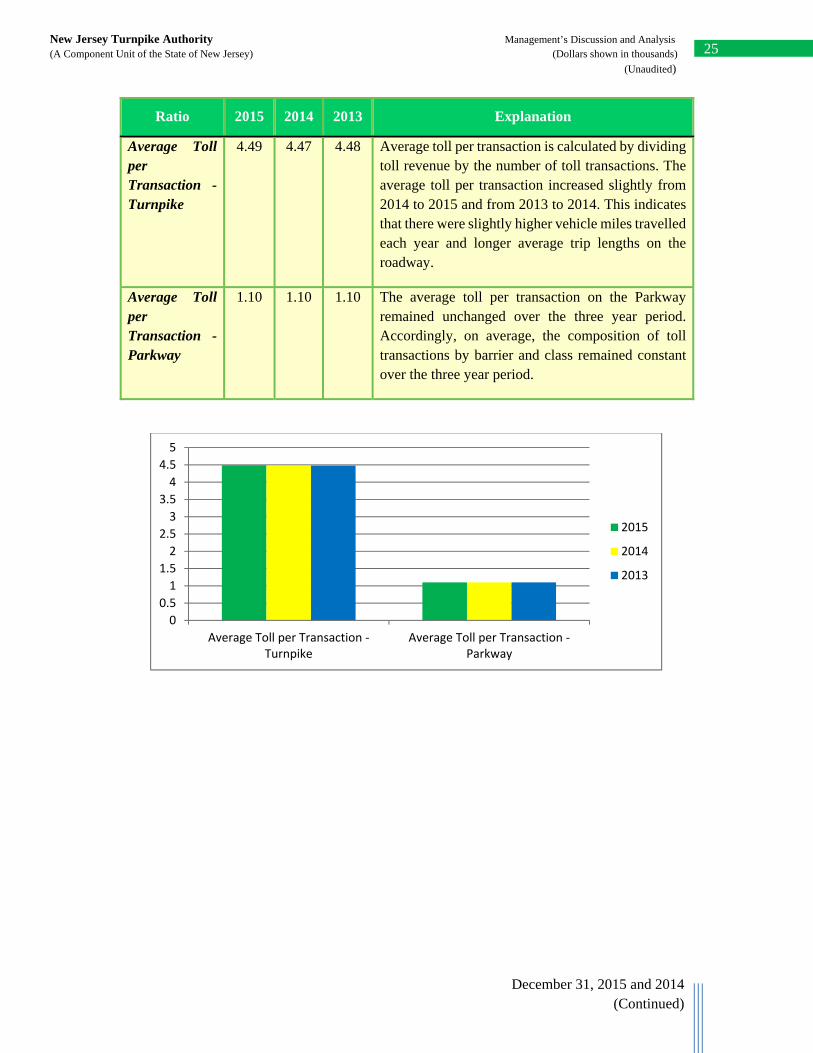
25
December 31, 2015 and 2014 (Continued)
New Jersey Turnpike Authority Management’s Discussion and Analysis (A Component Unit of the State of New Jersey) (Dollars shown in thousands)
(Unaudited)
Ratio 2015 2014 2013 Explanation
Average Toll per Transaction -Turnpike
4.49 4.47 4.48 Average toll per transaction is calculated by dividing toll revenue by the number of toll transactions. The average toll per transaction increased slightly from 2014 to 2015 and from 2013 to 2014. This indicates that there were slightly higher vehicle miles travelled each year and longer average trip lengths on the roadway.
Average Toll per Transaction -Parkway
1.10 1.10 1.10 The average toll per transaction on the Parkway remained unchanged over the three year period. Accordingly, on average, the composition of toll transactions by barrier and class remained constant over the three year period.
0
0.5
1
1.5
2
2.5
3
3.5
4
4.5
5
Average Toll per Transaction ‐Turnpike
Average Toll per Transaction ‐Parkway
2015
2014
2013
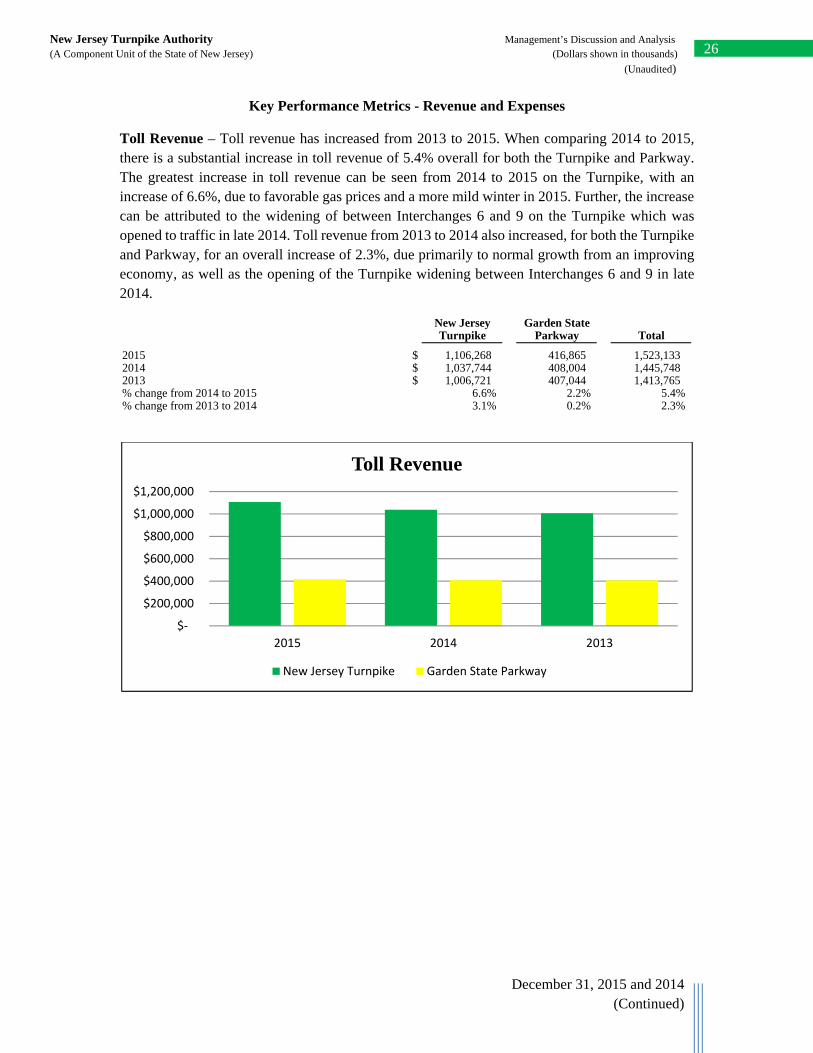
26
December 31, 2015 and 2014 (Continued)
New Jersey Turnpike Authority Management’s Discussion and Analysis (A Component Unit of the State of New Jersey) (Dollars shown in thousands)
(Unaudited)
Key Performance Metrics - Revenue and Expenses
Toll Revenue – Toll revenue has increased from 2013 to 2015. When comparing 2014 to 2015, there is a substantial increase in toll revenue of 5.4% overall for both the Turnpike and Parkway. The greatest increase in toll revenue can be seen from 2014 to 2015 on the Turnpike, with an increase of 6.6%, due to favorable gas prices and a more mild winter in 2015. Further, the increase can be attributed to the widening of between Interchanges 6 and 9 on the Turnpike which was opened to traffic in late 2014. Toll revenue from 2013 to 2014 also increased, for both the Turnpike and Parkway, for an overall increase of 2.3%, due primarily to normal growth from an improving economy, as well as the opening of the Turnpike widening between Interchanges 6 and 9 in late 2014.
New Jersey Garden StateTurnpike Parkway Total
$ 1,106,268 416,865 1,523,133 $ 1,037,744 408,004 1,445,748 $ 1,006,721 407,044 1,413,765
% change from 2014 to 2015 6.6% 2.2% 5.4%% change from 2013 to 2014 3.1% 0.2% 2.3%
201520142013
$‐
$200,000
$400,000
$600,000
$800,000
$1,000,000
$1,200,000
2015 2014 2013
Toll Revenue
New Jersey Turnpike Garden State Parkway
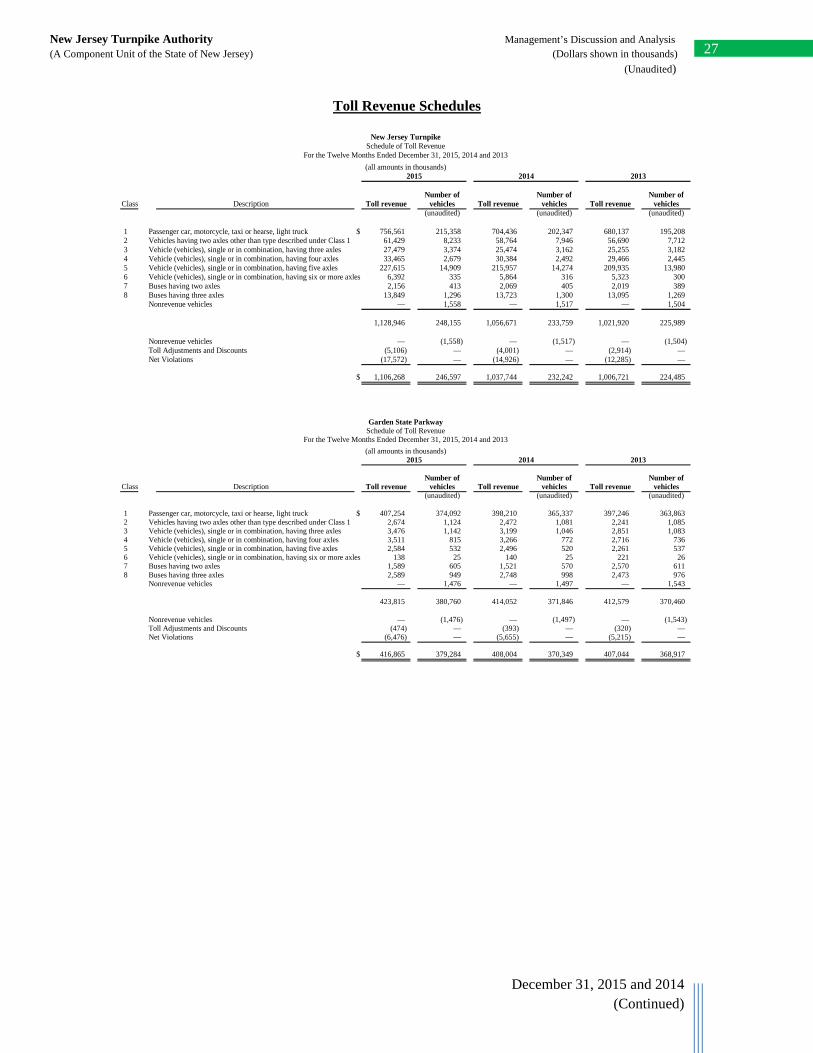
27
December 31, 2015 and 2014 (Continued)
New Jersey Turnpike Authority Management’s Discussion and Analysis (A Component Unit of the State of New Jersey) (Dollars shown in thousands)
(Unaudited)
Toll Revenue Schedules
New Jersey TurnpikeSchedule of Toll Revenue
For the Twelve Months Ended December 31, 2015, 2014 and 2013
(all amounts in thousands)2015 2014 2013
Number of Number of Number ofClass Description Toll revenue vehicles Toll revenue vehicles Toll revenue vehicles
(unaudited) (unaudited) (unaudited)
1 Passenger car, motorcycle, taxi or hearse, light truck $ 756,561 215,358 704,436 202,347 680,137 195,208 2 Vehicles having two axles other than type described under Class 1 61,429 8,233 58,764 7,946 56,690 7,712 3 Vehicle (vehicles), single or in combination, having three axles 27,479 3,374 25,474 3,162 25,255 3,182 4 Vehicle (vehicles), single or in combination, having four axles 33,465 2,679 30,384 2,492 29,466 2,445 5 Vehicle (vehicles), single or in combination, having five axles 227,615 14,909 215,957 14,274 209,935 13,980 6 Vehicle (vehicles), single or in combination, having six or more axles 6,392 335 5,864 316 5,323 300 7 Buses having two axles 2,156 413 2,069 405 2,019 389 8 Buses having three axles 13,849 1,296 13,723 1,300 13,095 1,269
Nonrevenue vehicles — 1,558 — 1,517 — 1,504
1,128,946 248,155 1,056,671 233,759 1,021,920 225,989
Nonrevenue vehicles — (1,558) — (1,517) — (1,504) Toll Adjustments and Discounts (5,106) — (4,001) — (2,914) — Net Violations (17,572) — (14,926) — (12,285) —
$ 1,106,268 246,597 1,037,744 232,242 1,006,721 224,485
Garden State ParkwaySchedule of Toll Revenue
For the Twelve Months Ended December 31, 2015, 2014 and 2013
(all amounts in thousands)2015 2014 2013
Number of Number of Number ofClass Description Toll revenue vehicles Toll revenue vehicles Toll revenue vehicles
(unaudited) (unaudited) (unaudited)
1 Passenger car, motorcycle, taxi or hearse, light truck $ 407,254 374,092 398,210 365,337 397,246 363,863 2 Vehicles having two axles other than type described under Class 1 2,674 1,124 2,472 1,081 2,241 1,085 3 Vehicle (vehicles), single or in combination, having three axles 3,476 1,142 3,199 1,046 2,851 1,083 4 Vehicle (vehicles), single or in combination, having four axles 3,511 815 3,266 772 2,716 736 5 Vehicle (vehicles), single or in combination, having five axles 2,584 532 2,496 520 2,261 537 6 Vehicle (vehicles), single or in combination, having six or more axles 138 25 140 25 221 26 7 Buses having two axles 1,589 605 1,521 570 2,570 611 8 Buses having three axles 2,589 949 2,748 998 2,473 976
Nonrevenue vehicles — 1,476 — 1,497 — 1,543
423,815 380,760 414,052 371,846 412,579 370,460
Nonrevenue vehicles — (1,476) — (1,497) — (1,543) Toll Adjustments and Discounts (474) — (393) — (320) — Net Violations (6,476) — (5,655) — (5,215) —
$ 416,865 379,284 408,004 370,349 407,044 368,917
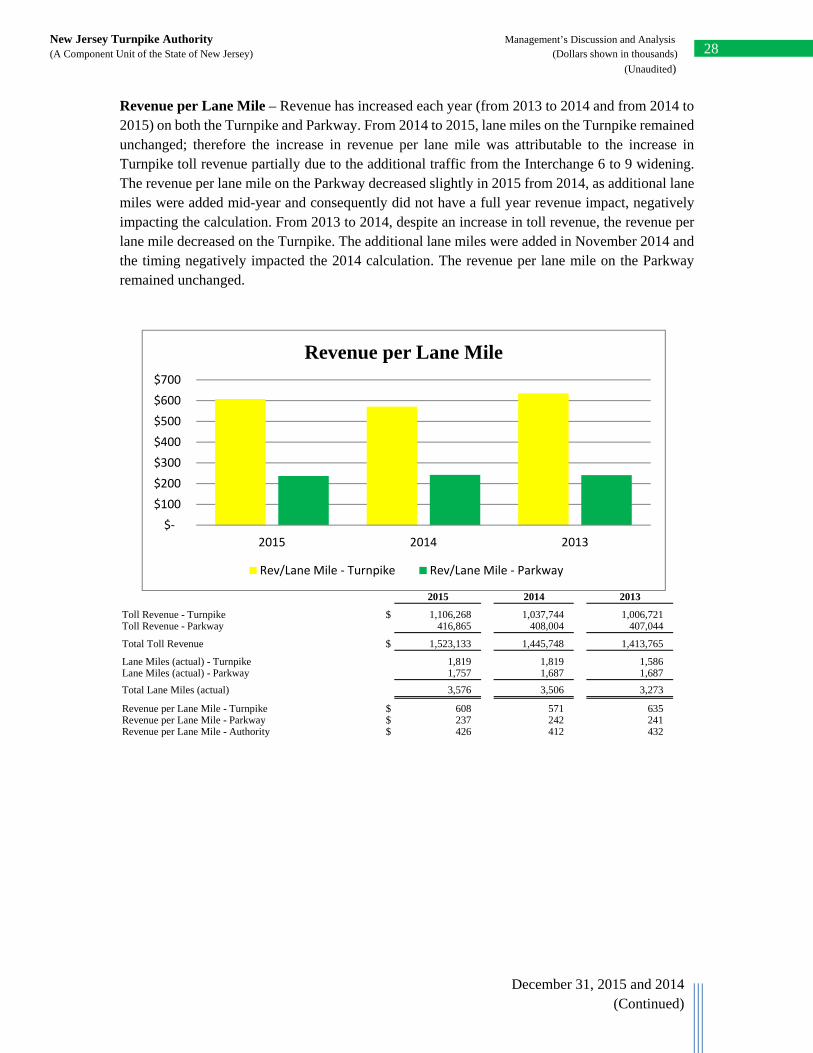
28
December 31, 2015 and 2014 (Continued)
New Jersey Turnpike Authority Management’s Discussion and Analysis (A Component Unit of the State of New Jersey) (Dollars shown in thousands)
(Unaudited)
Revenue per Lane Mile – Revenue has increased each year (from 2013 to 2014 and from 2014 to 2015) on both the Turnpike and Parkway. From 2014 to 2015, lane miles on the Turnpike remained unchanged; therefore the increase in revenue per lane mile was attributable to the increase in Turnpike toll revenue partially due to the additional traffic from the Interchange 6 to 9 widening. The revenue per lane mile on the Parkway decreased slightly in 2015 from 2014, as additional lane miles were added mid-year and consequently did not have a full year revenue impact, negatively impacting the calculation. From 2013 to 2014, despite an increase in toll revenue, the revenue per lane mile decreased on the Turnpike. The additional lane miles were added in November 2014 and the timing negatively impacted the 2014 calculation. The revenue per lane mile on the Parkway remained unchanged.
2015 2014 2013
Toll Revenue - Turnpike $ 1,106,268 1,037,744 1,006,721 Toll Revenue - Parkway 416,865 408,004 407,044
Total Toll Revenue $ 1,523,133 1,445,748 1,413,765
Lane Miles (actual) - Turnpike 1,819 1,819 1,586 Lane Miles (actual) - Parkway 1,757 1,687 1,687
Total Lane Miles (actual) 3,576 3,506 3,273
Revenue per Lane Mile - Turnpike $ 608 571 635 Revenue per Lane Mile - Parkway $ 237 242 241 Revenue per Lane Mile - Authority $ 426 412 432
$‐
$100
$200
$300
$400
$500
$600
$700
2015 2014 2013
Revenue per Lane Mile
Rev/Lane Mile ‐ Turnpike Rev/Lane Mile ‐ Parkway
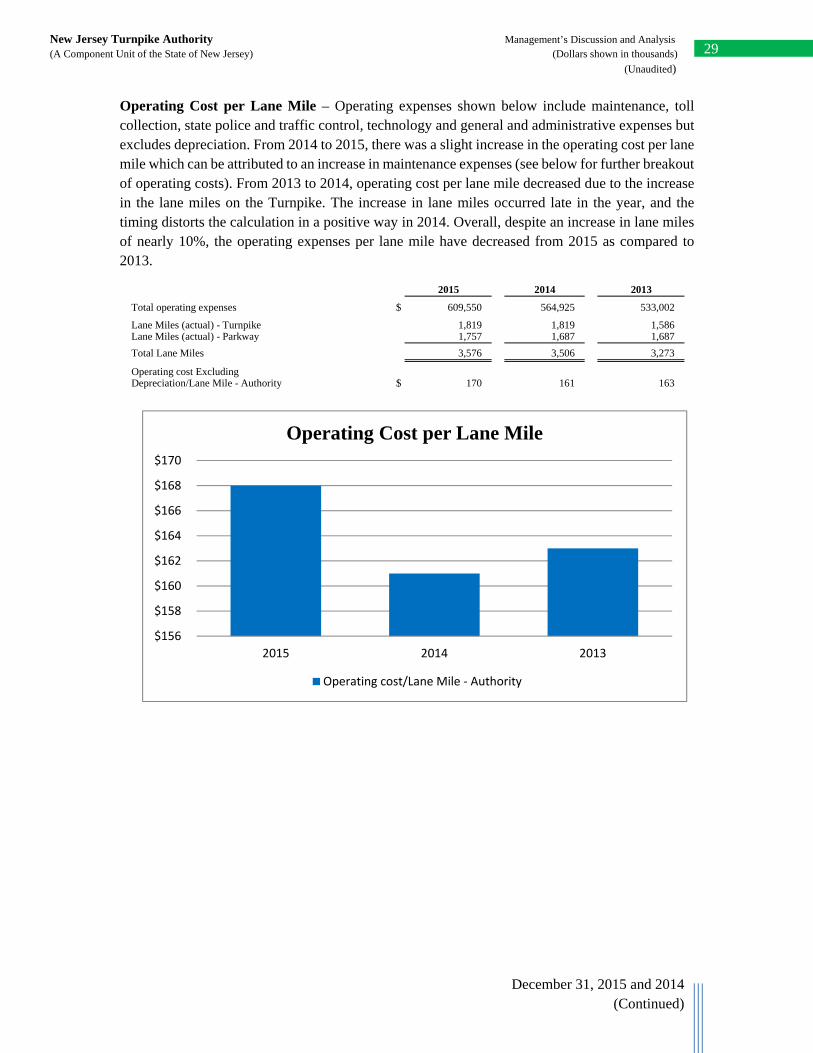
29
December 31, 2015 and 2014 (Continued)
New Jersey Turnpike Authority Management’s Discussion and Analysis (A Component Unit of the State of New Jersey) (Dollars shown in thousands)
(Unaudited)
Operating Cost per Lane Mile – Operating expenses shown below include maintenance, toll collection, state police and traffic control, technology and general and administrative expenses but excludes depreciation. From 2014 to 2015, there was a slight increase in the operating cost per lane mile which can be attributed to an increase in maintenance expenses (see below for further breakout of operating costs). From 2013 to 2014, operating cost per lane mile decreased due to the increase in the lane miles on the Turnpike. The increase in lane miles occurred late in the year, and the timing distorts the calculation in a positive way in 2014. Overall, despite an increase in lane miles of nearly 10%, the operating expenses per lane mile have decreased from 2015 as compared to 2013.
2015 2014 2013
Total operating expenses $ 609,550 564,925 533,002
Lane Miles (actual) - Turnpike 1,819 1,819 1,586 Lane Miles (actual) - Parkway 1,757 1,687 1,687
Total Lane Miles 3,576 3,506 3,273
Operating cost ExcludingDepreciation/Lane Mile - Authority $ 170 161 163
$156
$158
$160
$162
$164
$166
$168
$170
2015 2014 2013
Operating Cost per Lane Mile
Operating cost/Lane Mile ‐ Authority
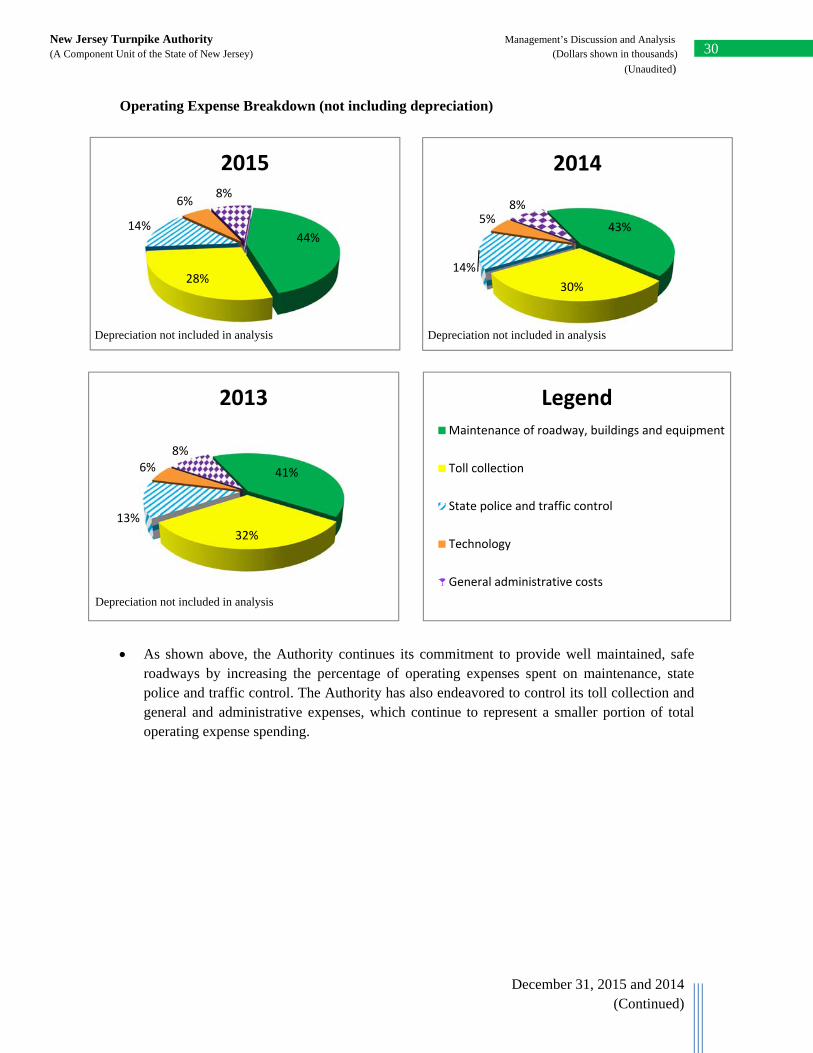
30
December 31, 2015 and 2014 (Continued)
New Jersey Turnpike Authority Management’s Discussion and Analysis (A Component Unit of the State of New Jersey) (Dollars shown in thousands)
(Unaudited)
Operating Expense Breakdown (not including depreciation)
As shown above, the Authority continues its commitment to provide well maintained, safe roadways by increasing the percentage of operating expenses spent on maintenance, state police and traffic control. The Authority has also endeavored to control its toll collection and general and administrative expenses, which continue to represent a smaller portion of total operating expense spending.
44%
28%
14%
6%8%
2015
41%
32%
13%
6%8%
2013
43%
30%
14%
5%8%
2014
Depreciation not included in analysis
LegendMaintenance of roadway, buildings and equipment
Toll collection
State police and traffic control
Technology
General administrative costs
Depreciation not included in analysis
Depreciation not included in analysis
Depreciation not included in analysis
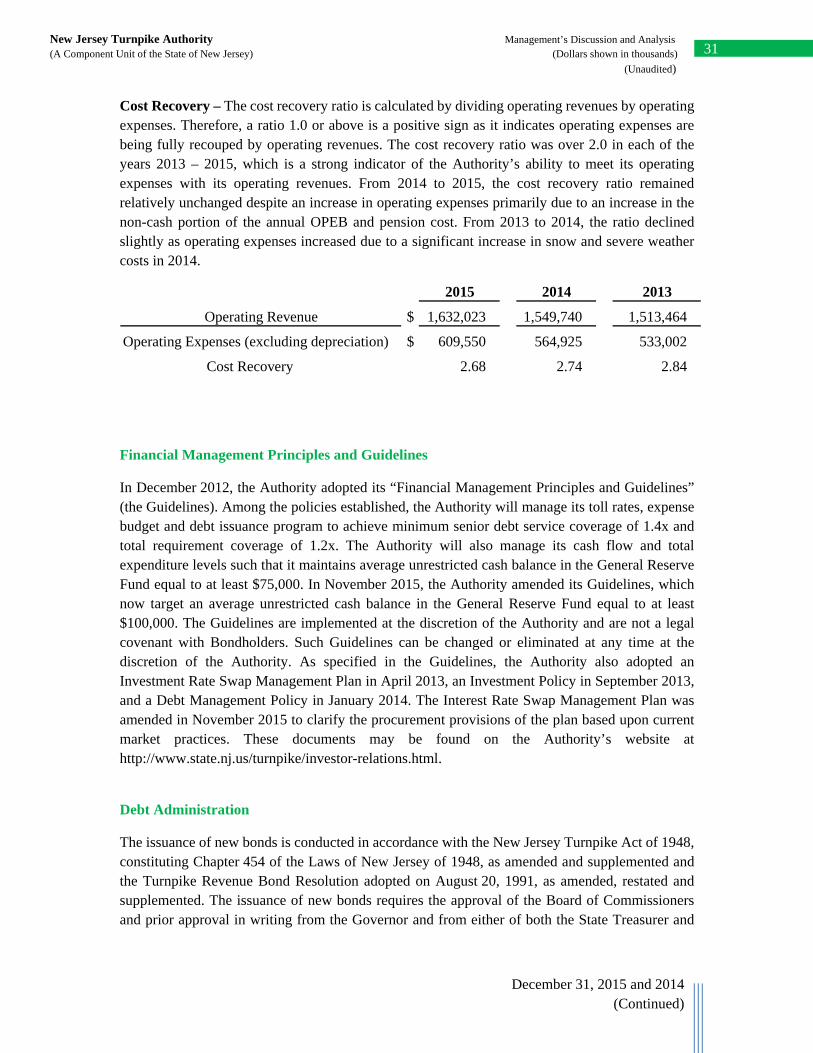
31
December 31, 2015 and 2014 (Continued)
New Jersey Turnpike Authority Management’s Discussion and Analysis (A Component Unit of the State of New Jersey) (Dollars shown in thousands)
(Unaudited)
Cost Recovery – The cost recovery ratio is calculated by dividing operating revenues by operating expenses. Therefore, a ratio 1.0 or above is a positive sign as it indicates operating expenses are being fully recouped by operating revenues. The cost recovery ratio was over 2.0 in each of the years 2013 – 2015, which is a strong indicator of the Authority’s ability to meet its operating expenses with its operating revenues. From 2014 to 2015, the cost recovery ratio remained relatively unchanged despite an increase in operating expenses primarily due to an increase in the non-cash portion of the annual OPEB and pension cost. From 2013 to 2014, the ratio declined slightly as operating expenses increased due to a significant increase in snow and severe weather costs in 2014.
2015 2014 2013
Operating Revenue $ 1,632,023 1,549,740 1,513,464
Operating Expenses (excluding depreciation) $ 609,550 564,925 533,002
Cost Recovery 2.68 2.74 2.84
Financial Management Principles and Guidelines
In December 2012, the Authority adopted its “Financial Management Principles and Guidelines” (the Guidelines). Among the policies established, the Authority will manage its toll rates, expense budget and debt issuance program to achieve minimum senior debt service coverage of 1.4x and total requirement coverage of 1.2x. The Authority will also manage its cash flow and total expenditure levels such that it maintains average unrestricted cash balance in the General Reserve Fund equal to at least $75,000. In November 2015, the Authority amended its Guidelines, which now target an average unrestricted cash balance in the General Reserve Fund equal to at least $100,000. The Guidelines are implemented at the discretion of the Authority and are not a legal covenant with Bondholders. Such Guidelines can be changed or eliminated at any time at the discretion of the Authority. As specified in the Guidelines, the Authority also adopted an Investment Rate Swap Management Plan in April 2013, an Investment Policy in September 2013, and a Debt Management Policy in January 2014. The Interest Rate Swap Management Plan was amended in November 2015 to clarify the procurement provisions of the plan based upon current market practices. These documents may be found on the Authority’s website at http://www.state.nj.us/turnpike/investor-relations.html.
Debt Administration
The issuance of new bonds is conducted in accordance with the New Jersey Turnpike Act of 1948, constituting Chapter 454 of the Laws of New Jersey of 1948, as amended and supplemented and the Turnpike Revenue Bond Resolution adopted on August 20, 1991, as amended, restated and supplemented. The issuance of new bonds requires the approval of the Board of Commissioners and prior approval in writing from the Governor and from either of both the State Treasurer and
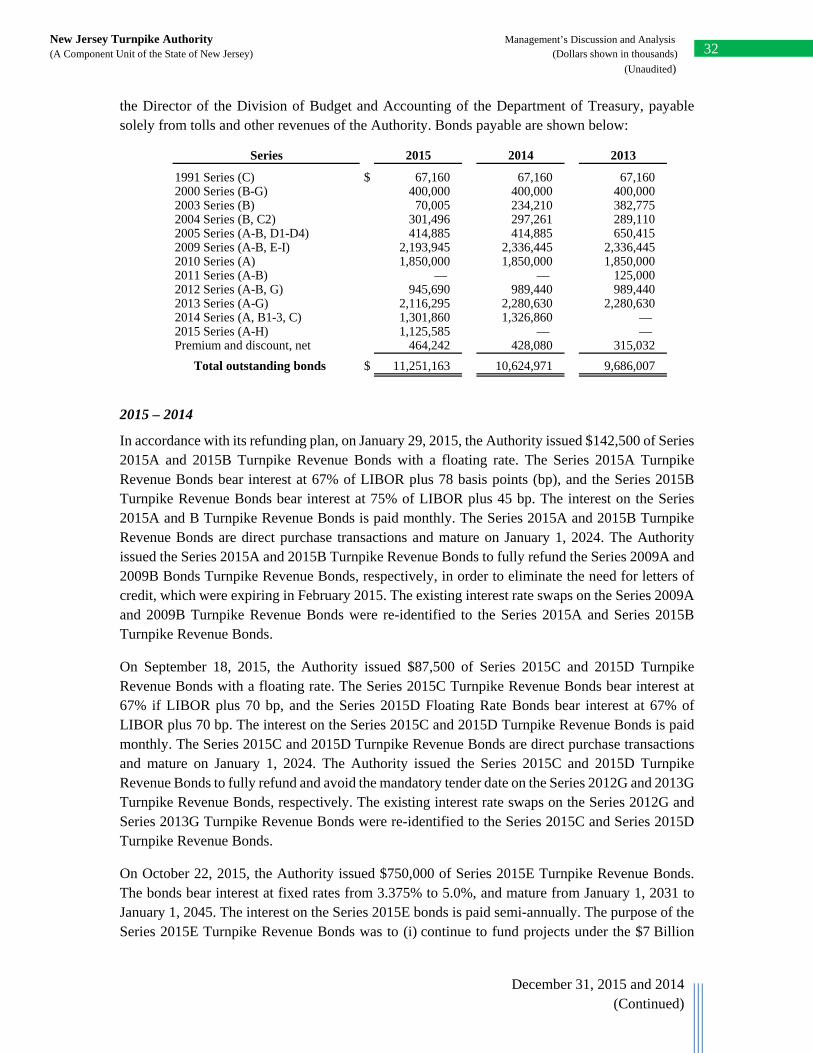
32
December 31, 2015 and 2014 (Continued)
New Jersey Turnpike Authority Management’s Discussion and Analysis (A Component Unit of the State of New Jersey) (Dollars shown in thousands)
(Unaudited)
the Director of the Division of Budget and Accounting of the Department of Treasury, payable solely from tolls and other revenues of the Authority. Bonds payable are shown below:
Series 2015 2014 2013
1991 Series (C) $ 67,160 67,160 67,160 2000 Series (B-G) 400,000 400,000 400,000 2003 Series (B) 70,005 234,210 382,775 2004 Series (B, C2) 301,496 297,261 289,110 2005 Series (A-B, D1-D4) 414,885 414,885 650,415 2009 Series (A-B, E-I) 2,193,945 2,336,445 2,336,445 2010 Series (A) 1,850,000 1,850,000 1,850,000 2011 Series (A-B) — — 125,000 2012 Series (A-B, G) 945,690 989,440 989,440 2013 Series (A-G) 2,116,295 2,280,630 2,280,630 2014 Series (A, B1-3, C) 1,301,860 1,326,860 — 2015 Series (A-H) 1,125,585 — — Premium and discount, net 464,242 428,080 315,032
Total outstanding bonds $ 11,251,163 10,624,971 9,686,007
2015 – 2014
In accordance with its refunding plan, on January 29, 2015, the Authority issued $142,500 of Series 2015A and 2015B Turnpike Revenue Bonds with a floating rate. The Series 2015A Turnpike Revenue Bonds bear interest at 67% of LIBOR plus 78 basis points (bp), and the Series 2015B Turnpike Revenue Bonds bear interest at 75% of LIBOR plus 45 bp. The interest on the Series 2015A and B Turnpike Revenue Bonds is paid monthly. The Series 2015A and 2015B Turnpike Revenue Bonds are direct purchase transactions and mature on January 1, 2024. The Authority issued the Series 2015A and 2015B Turnpike Revenue Bonds to fully refund the Series 2009A and 2009B Bonds Turnpike Revenue Bonds, respectively, in order to eliminate the need for letters of credit, which were expiring in February 2015. The existing interest rate swaps on the Series 2009A and 2009B Turnpike Revenue Bonds were re-identified to the Series 2015A and Series 2015B Turnpike Revenue Bonds.
On September 18, 2015, the Authority issued $87,500 of Series 2015C and 2015D Turnpike Revenue Bonds with a floating rate. The Series 2015C Turnpike Revenue Bonds bear interest at 67% if LIBOR plus 70 bp, and the Series 2015D Floating Rate Bonds bear interest at 67% of LIBOR plus 70 bp. The interest on the Series 2015C and 2015D Turnpike Revenue Bonds is paid monthly. The Series 2015C and 2015D Turnpike Revenue Bonds are direct purchase transactions and mature on January 1, 2024. The Authority issued the Series 2015C and 2015D Turnpike Revenue Bonds to fully refund and avoid the mandatory tender date on the Series 2012G and 2013G Turnpike Revenue Bonds, respectively. The existing interest rate swaps on the Series 2012G and Series 2013G Turnpike Revenue Bonds were re-identified to the Series 2015C and Series 2015D Turnpike Revenue Bonds.
On October 22, 2015, the Authority issued $750,000 of Series 2015E Turnpike Revenue Bonds. The bonds bear interest at fixed rates from 3.375% to 5.0%, and mature from January 1, 2031 to January 1, 2045. The interest on the Series 2015E bonds is paid semi-annually. The purpose of the Series 2015E Turnpike Revenue Bonds was to (i) continue to fund projects under the $7 Billion
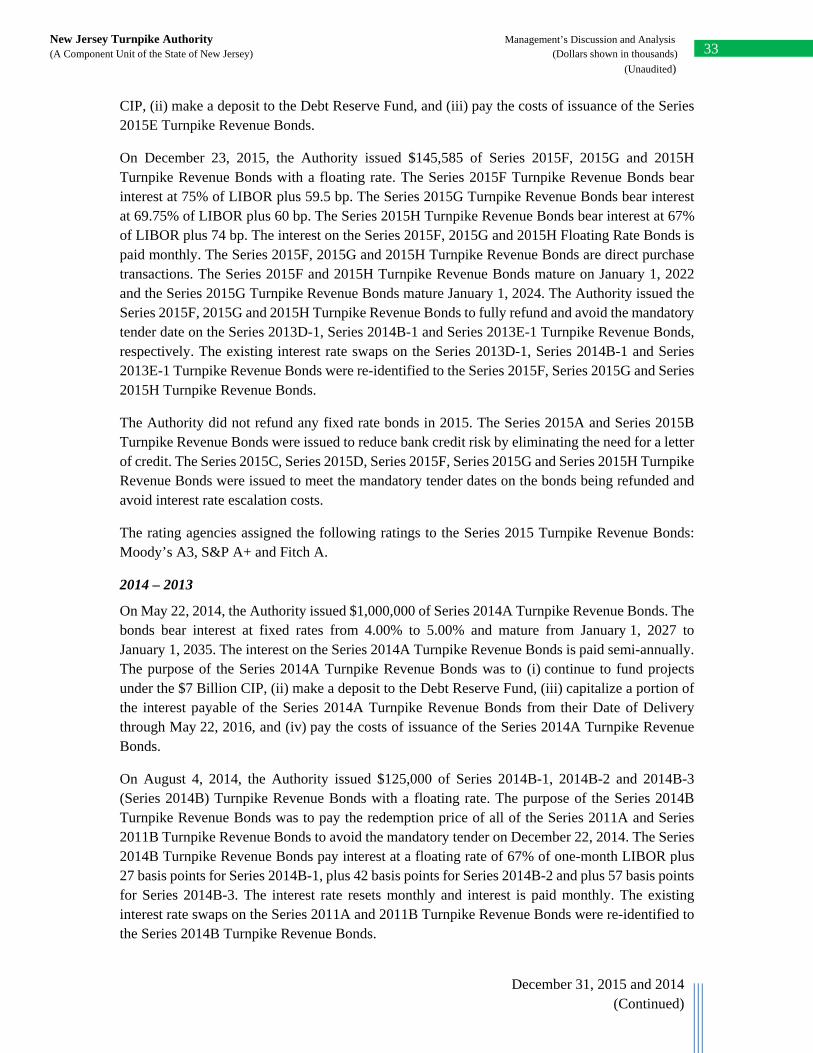
33
December 31, 2015 and 2014 (Continued)
New Jersey Turnpike Authority Management’s Discussion and Analysis (A Component Unit of the State of New Jersey) (Dollars shown in thousands)
(Unaudited)
CIP, (ii) make a deposit to the Debt Reserve Fund, and (iii) pay the costs of issuance of the Series 2015E Turnpike Revenue Bonds.
On December 23, 2015, the Authority issued $145,585 of Series 2015F, 2015G and 2015H Turnpike Revenue Bonds with a floating rate. The Series 2015F Turnpike Revenue Bonds bear interest at 75% of LIBOR plus 59.5 bp. The Series 2015G Turnpike Revenue Bonds bear interest at 69.75% of LIBOR plus 60 bp. The Series 2015H Turnpike Revenue Bonds bear interest at 67% of LIBOR plus 74 bp. The interest on the Series 2015F, 2015G and 2015H Floating Rate Bonds is paid monthly. The Series 2015F, 2015G and 2015H Turnpike Revenue Bonds are direct purchase transactions. The Series 2015F and 2015H Turnpike Revenue Bonds mature on January 1, 2022 and the Series 2015G Turnpike Revenue Bonds mature January 1, 2024. The Authority issued the Series 2015F, 2015G and 2015H Turnpike Revenue Bonds to fully refund and avoid the mandatory tender date on the Series 2013D-1, Series 2014B-1 and Series 2013E-1 Turnpike Revenue Bonds, respectively. The existing interest rate swaps on the Series 2013D-1, Series 2014B-1 and Series 2013E-1 Turnpike Revenue Bonds were re-identified to the Series 2015F, Series 2015G and Series 2015H Turnpike Revenue Bonds.
The Authority did not refund any fixed rate bonds in 2015. The Series 2015A and Series 2015B Turnpike Revenue Bonds were issued to reduce bank credit risk by eliminating the need for a letter of credit. The Series 2015C, Series 2015D, Series 2015F, Series 2015G and Series 2015H Turnpike Revenue Bonds were issued to meet the mandatory tender dates on the bonds being refunded and avoid interest rate escalation costs.
The rating agencies assigned the following ratings to the Series 2015 Turnpike Revenue Bonds: Moody’s A3, S&P A+ and Fitch A.
2014 – 2013
On May 22, 2014, the Authority issued $1,000,000 of Series 2014A Turnpike Revenue Bonds. The bonds bear interest at fixed rates from 4.00% to 5.00% and mature from January 1, 2027 to January 1, 2035. The interest on the Series 2014A Turnpike Revenue Bonds is paid semi-annually. The purpose of the Series 2014A Turnpike Revenue Bonds was to (i) continue to fund projects under the $7 Billion CIP, (ii) make a deposit to the Debt Reserve Fund, (iii) capitalize a portion of the interest payable of the Series 2014A Turnpike Revenue Bonds from their Date of Delivery through May 22, 2016, and (iv) pay the costs of issuance of the Series 2014A Turnpike Revenue Bonds.
On August 4, 2014, the Authority issued $125,000 of Series 2014B-1, 2014B-2 and 2014B-3 (Series 2014B) Turnpike Revenue Bonds with a floating rate. The purpose of the Series 2014B Turnpike Revenue Bonds was to pay the redemption price of all of the Series 2011A and Series 2011B Turnpike Revenue Bonds to avoid the mandatory tender on December 22, 2014. The Series 2014B Turnpike Revenue Bonds pay interest at a floating rate of 67% of one-month LIBOR plus 27 basis points for Series 2014B-1, plus 42 basis points for Series 2014B-2 and plus 57 basis points for Series 2014B-3. The interest rate resets monthly and interest is paid monthly. The existing interest rate swaps on the Series 2011A and 2011B Turnpike Revenue Bonds were re-identified to the Series 2014B Turnpike Revenue Bonds.
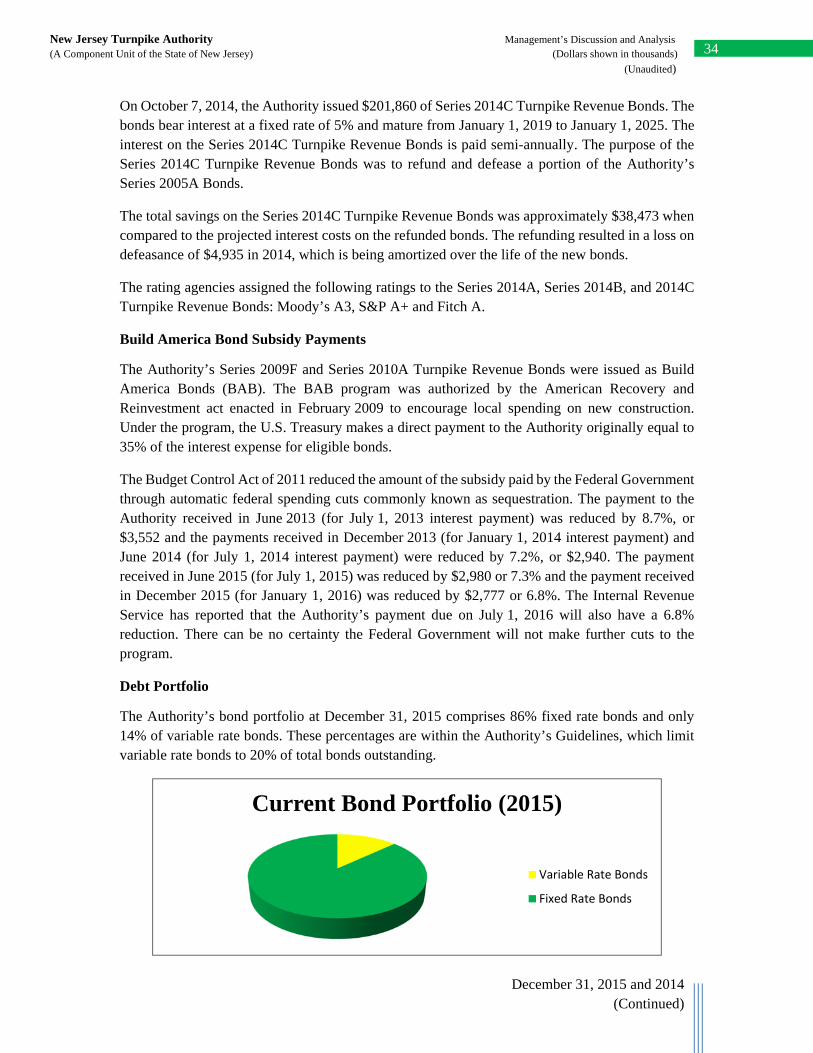
34
December 31, 2015 and 2014 (Continued)
New Jersey Turnpike Authority Management’s Discussion and Analysis (A Component Unit of the State of New Jersey) (Dollars shown in thousands)
(Unaudited)
On October 7, 2014, the Authority issued $201,860 of Series 2014C Turnpike Revenue Bonds. The bonds bear interest at a fixed rate of 5% and mature from January 1, 2019 to January 1, 2025. The interest on the Series 2014C Turnpike Revenue Bonds is paid semi-annually. The purpose of the Series 2014C Turnpike Revenue Bonds was to refund and defease a portion of the Authority’s Series 2005A Bonds.
The total savings on the Series 2014C Turnpike Revenue Bonds was approximately $38,473 when compared to the projected interest costs on the refunded bonds. The refunding resulted in a loss on defeasance of $4,935 in 2014, which is being amortized over the life of the new bonds.
The rating agencies assigned the following ratings to the Series 2014A, Series 2014B, and 2014C Turnpike Revenue Bonds: Moody’s A3, S&P A+ and Fitch A.
Build America Bond Subsidy Payments
The Authority’s Series 2009F and Series 2010A Turnpike Revenue Bonds were issued as Build America Bonds (BAB). The BAB program was authorized by the American Recovery and Reinvestment act enacted in February 2009 to encourage local spending on new construction. Under the program, the U.S. Treasury makes a direct payment to the Authority originally equal to 35% of the interest expense for eligible bonds.
The Budget Control Act of 2011 reduced the amount of the subsidy paid by the Federal Government through automatic federal spending cuts commonly known as sequestration. The payment to the Authority received in June 2013 (for July 1, 2013 interest payment) was reduced by 8.7%, or $3,552 and the payments received in December 2013 (for January 1, 2014 interest payment) and June 2014 (for July 1, 2014 interest payment) were reduced by 7.2%, or $2,940. The payment received in June 2015 (for July 1, 2015) was reduced by $2,980 or 7.3% and the payment received in December 2015 (for January 1, 2016) was reduced by $2,777 or 6.8%. The Internal Revenue Service has reported that the Authority’s payment due on July 1, 2016 will also have a 6.8% reduction. There can be no certainty the Federal Government will not make further cuts to the program.
Debt Portfolio
The Authority’s bond portfolio at December 31, 2015 comprises 86% fixed rate bonds and only 14% of variable rate bonds. These percentages are within the Authority’s Guidelines, which limit variable rate bonds to 20% of total bonds outstanding.
Current Bond Portfolio (2015)
Variable Rate Bonds
Fixed Rate Bonds
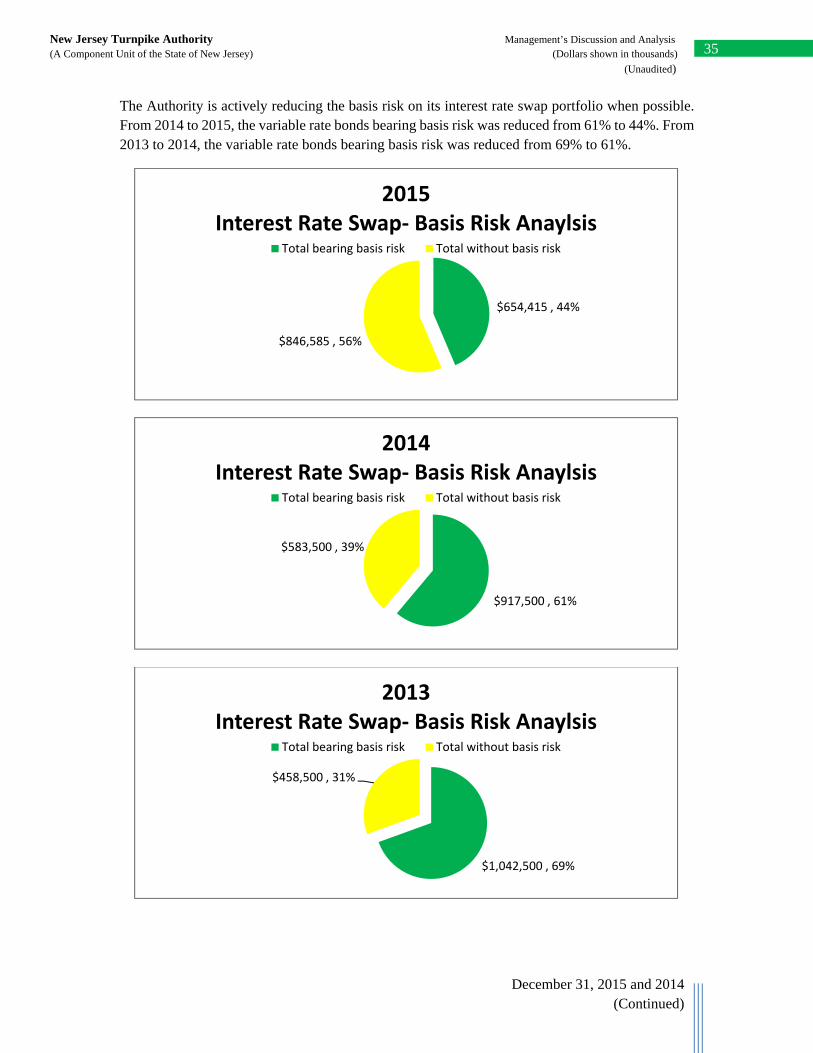
35
December 31, 2015 and 2014 (Continued)
New Jersey Turnpike Authority Management’s Discussion and Analysis (A Component Unit of the State of New Jersey) (Dollars shown in thousands)
(Unaudited)
The Authority is actively reducing the basis risk on its interest rate swap portfolio when possible. From 2014 to 2015, the variable rate bonds bearing basis risk was reduced from 61% to 44%. From 2013 to 2014, the variable rate bonds bearing basis risk was reduced from 69% to 61%.
$654,415 , 44%
$846,585 , 56%
2015Interest Rate Swap‐ Basis Risk Anaylsis
Total bearing basis risk Total without basis risk
$917,500 , 61%
$583,500 , 39%
2014Interest Rate Swap‐ Basis Risk Anaylsis
Total bearing basis risk Total without basis risk
$1,042,500 , 69%
$458,500 , 31%
2013Interest Rate Swap‐ Basis Risk Anaylsis
Total bearing basis risk Total without basis risk
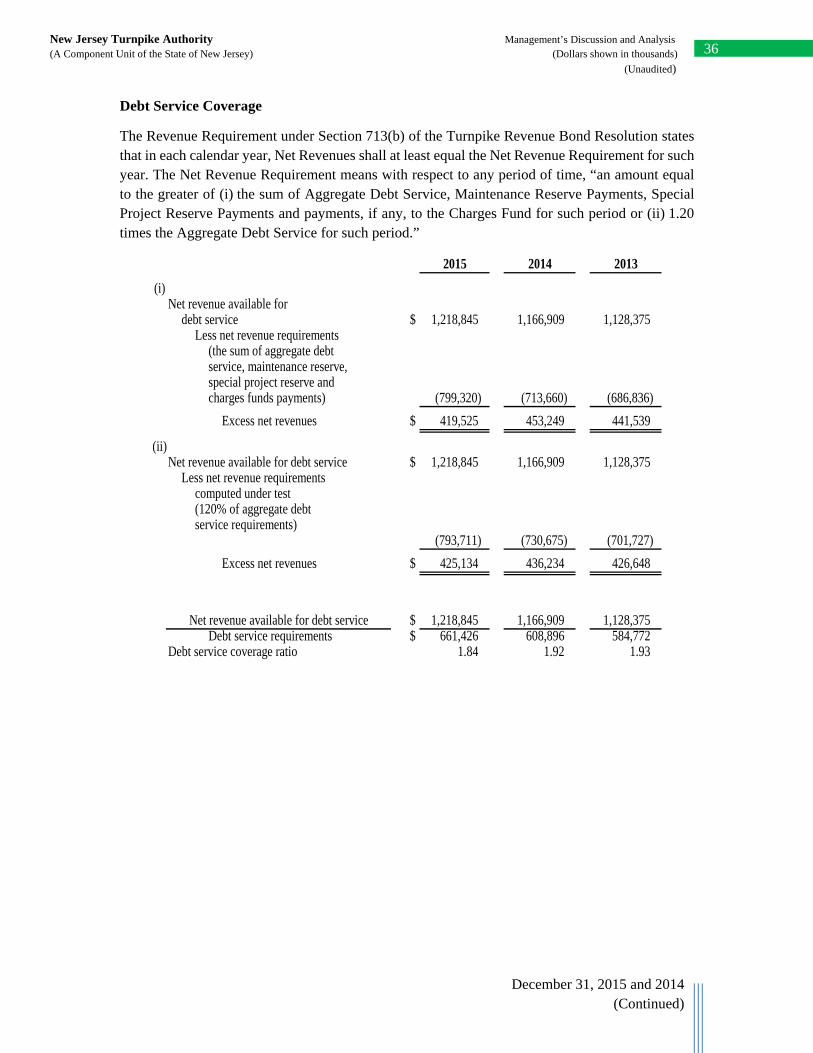
36
December 31, 2015 and 2014 (Continued)
New Jersey Turnpike Authority Management’s Discussion and Analysis (A Component Unit of the State of New Jersey) (Dollars shown in thousands)
(Unaudited)
Debt Service Coverage
The Revenue Requirement under Section 713(b) of the Turnpike Revenue Bond Resolution states that in each calendar year, Net Revenues shall at least equal the Net Revenue Requirement for such year. The Net Revenue Requirement means with respect to any period of time, “an amount equal to the greater of (i) the sum of Aggregate Debt Service, Maintenance Reserve Payments, Special Project Reserve Payments and payments, if any, to the Charges Fund for such period or (ii) 1.20 times the Aggregate Debt Service for such period.”
2015 2014 2013
(i)Net revenue available for
debt service $ 1,218,845 1,166,909 1,128,375 Less net revenue requirements
(the sum of aggregate debtservice, maintenance reserve,special project reserve andcharges funds payments) (799,320) (713,660) (686,836)
Excess net revenues $ 419,525 453,249 441,539
(ii)Net revenue available for debt service $ 1,218,845 1,166,909 1,128,375
Less net revenue requirementscomputed under test(120% of aggregate debtservice requirements)
(793,711) (730,675) (701,727)
Excess net revenues $ 425,134 436,234 426,648
Net revenue available for debt service $ 1,218,845 1,166,909 1,128,375 Debt service requirements $ 661,426 608,896 584,772
Debt service coverage ratio 1.84 1.92 1.93
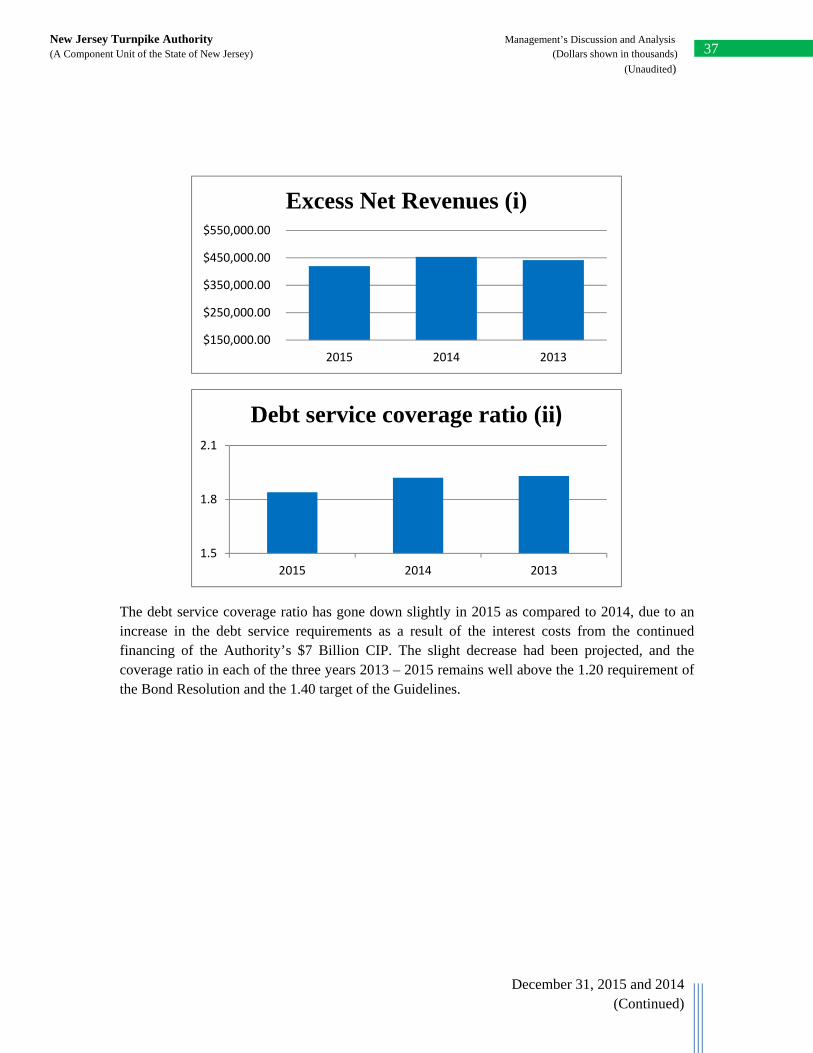
37
December 31, 2015 and 2014 (Continued)
New Jersey Turnpike Authority Management’s Discussion and Analysis (A Component Unit of the State of New Jersey) (Dollars shown in thousands)
(Unaudited)
The debt service coverage ratio has gone down slightly in 2015 as compared to 2014, due to an increase in the debt service requirements as a result of the interest costs from the continued financing of the Authority’s $7 Billion CIP. The slight decrease had been projected, and the coverage ratio in each of the three years 2013 – 2015 remains well above the 1.20 requirement of the Bond Resolution and the 1.40 target of the Guidelines.
$150,000.00
$250,000.00
$350,000.00
$450,000.00
$550,000.00
2015 2014 2013
Excess Net Revenues (i)
1.5
1.8
2.1
2015 2014 2013
Debt service coverage ratio (ii)
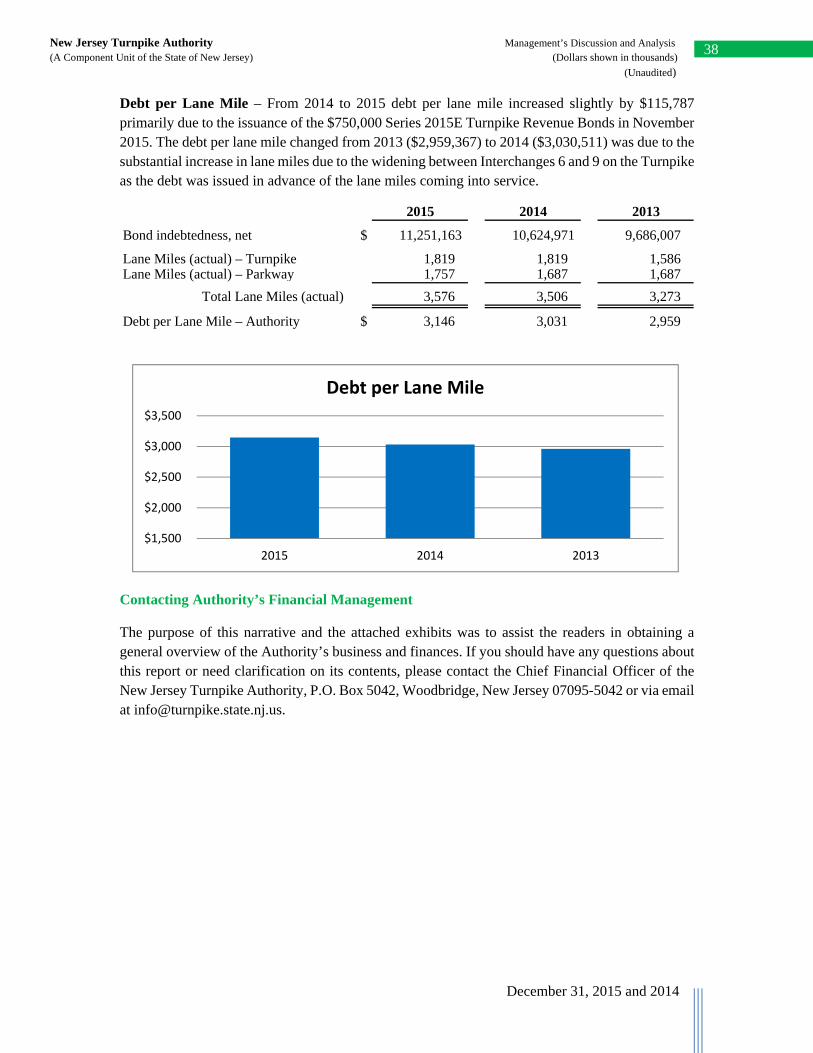
New Jersey Turnpike Authority Management’s Discussion and Analysis (A Component Unit of the State of New Jersey) (Dollars shown in thousands)
(Unaudited)
38
December 31, 2015 and 2014
Debt per Lane Mile – From 2014 to 2015 debt per lane mile increased slightly by $115,787 primarily due to the issuance of the $750,000 Series 2015E Turnpike Revenue Bonds in November 2015. The debt per lane mile changed from 2013 ($2,959,367) to 2014 ($3,030,511) was due to the substantial increase in lane miles due to the widening between Interchanges 6 and 9 on the Turnpike as the debt was issued in advance of the lane miles coming into service.
2015 2014 2013
Bond indebtedness, net $ 11,251,163 10,624,971 9,686,007
Lane Miles (actual) – Turnpike 1,819 1,819 1,586 Lane Miles (actual) – Parkway 1,757 1,687 1,687
Total Lane Miles (actual) 3,576 3,506 3,273
Debt per Lane Mile – Authority $ 3,146 3,031 2,959
Contacting Authority’s Financial Management
The purpose of this narrative and the attached exhibits was to assist the readers in obtaining a general overview of the Authority’s business and finances. If you should have any questions about this report or need clarification on its contents, please contact the Chief Financial Officer of the New Jersey Turnpike Authority, P.O. Box 5042, Woodbridge, New Jersey 07095-5042 or via email at [email protected].
$1,500
$2,000
$2,500
$3,000
$3,500
2015 2014 2013
Debt per Lane Mile
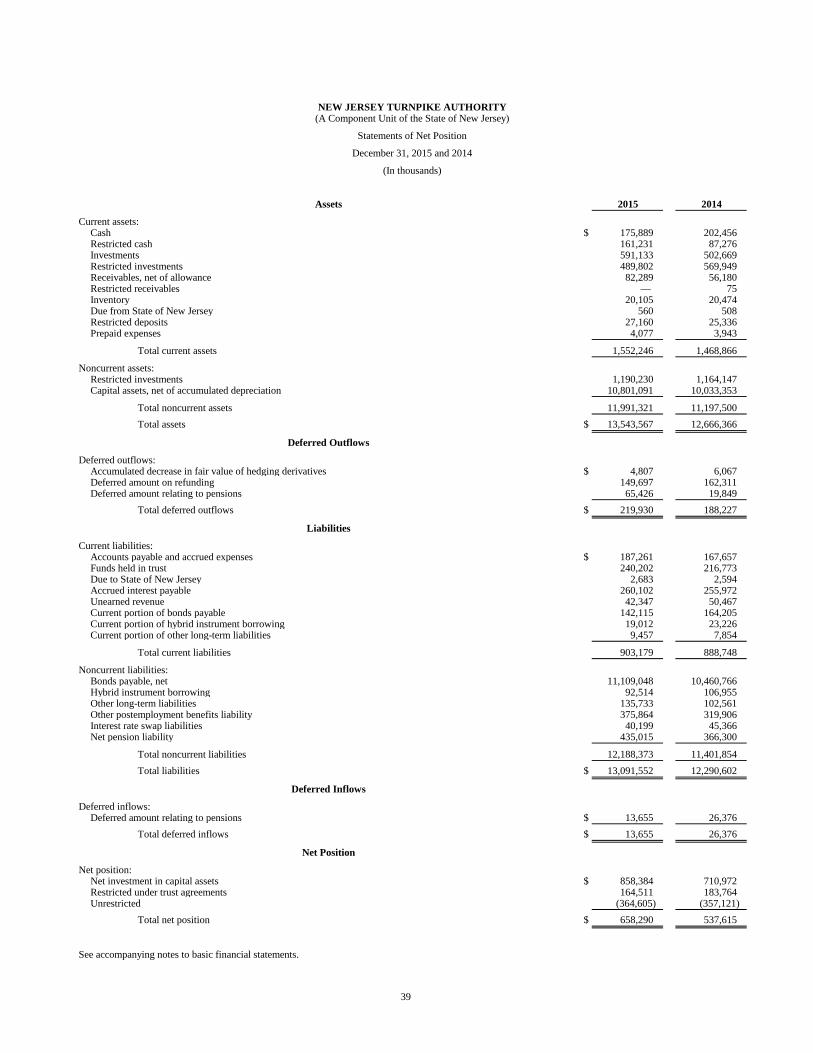
39
NEW JERSEY TURNPIKE AUTHORITY(A Component Unit of the State of New Jersey)
Statements of Net Position
December 31, 2015 and 2014
(In thousands)
Assets 2015 2014
Current assets:Cash $ 175,889 202,456 Restricted cash 161,231 87,276 Investments 591,133 502,669 Restricted investments 489,802 569,949 Receivables, net of allowance 82,289 56,180 Restricted receivables — 75 Inventory 20,105 20,474 Due from State of New Jersey 560 508 Restricted deposits 27,160 25,336 Prepaid expenses 4,077 3,943
Total current assets 1,552,246 1,468,866
Noncurrent assets:Restricted investments 1,190,230 1,164,147 Capital assets, net of accumulated depreciation 10,801,091 10,033,353
Total noncurrent assets 11,991,321 11,197,500
Total assets $ 13,543,567 12,666,366
Deferred Outflows
Deferred outflows:Accumulated decrease in fair value of hedging derivatives $ 4,807 6,067 Deferred amount on refunding 149,697 162,311 Deferred amount relating to pensions 65,426 19,849
Total deferred outflows $ 219,930 188,227
Liabilities
Current liabilities:Accounts payable and accrued expenses $ 187,261 167,657 Funds held in trust 240,202 216,773 Due to State of New Jersey 2,683 2,594 Accrued interest payable 260,102 255,972 Unearned revenue 42,347 50,467 Current portion of bonds payable 142,115 164,205 Current portion of hybrid instrument borrowing 19,012 23,226 Current portion of other long-term liabilities 9,457 7,854
Total current liabilities 903,179 888,748
Noncurrent liabilities:Bonds payable, net 11,109,048 10,460,766 Hybrid instrument borrowing 92,514 106,955 Other long-term liabilities 135,733 102,561 Other postemployment benefits liability 375,864 319,906 Interest rate swap liabilities 40,199 45,366 Net pension liability 435,015 366,300
Total noncurrent liabilities 12,188,373 11,401,854
Total liabilities $ 13,091,552 12,290,602
Deferred Inflows
Deferred inflows:Deferred amount relating to pensions $ 13,655 26,376
Total deferred inflows $ 13,655 26,376
Net Position
Net position:Net investment in capital assets $ 858,384 710,972 Restricted under trust agreements 164,511 183,764 Unrestricted (364,605) (357,121)
Total net position $ 658,290 537,615
See accompanying notes to basic financial statements.
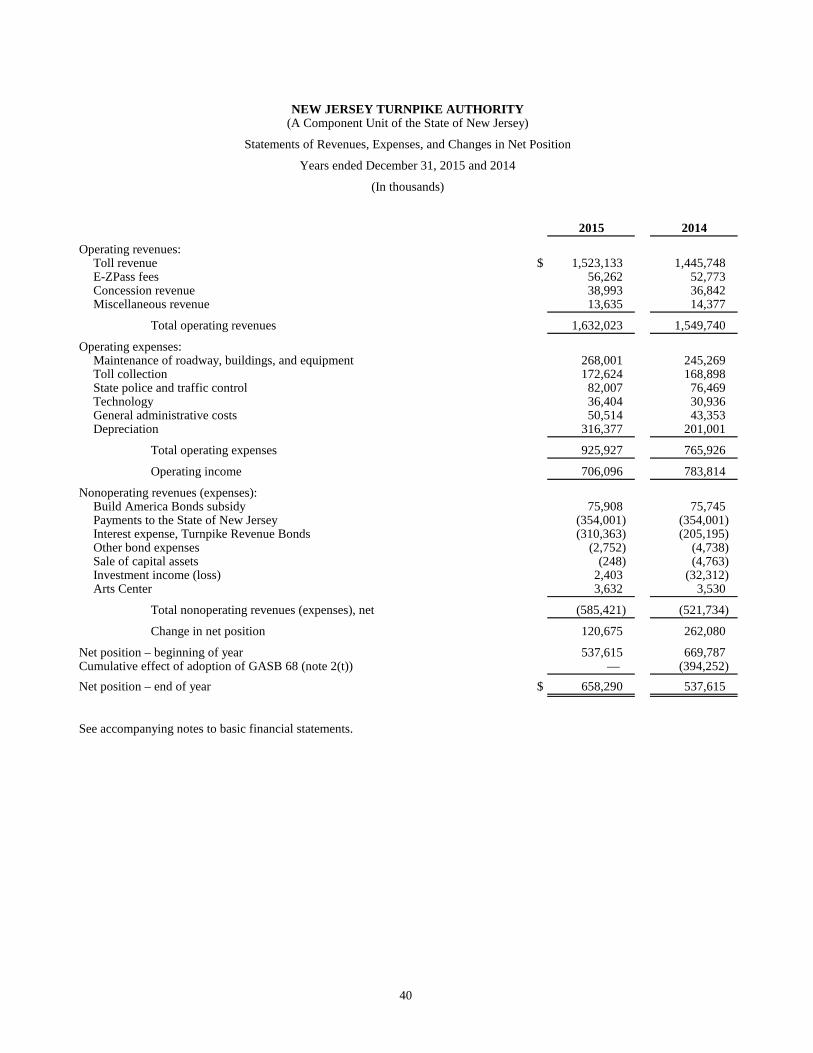
40
NEW JERSEY TURNPIKE AUTHORITY(A Component Unit of the State of New Jersey)
Statements of Revenues, Expenses, and Changes in Net Position
Years ended December 31, 2015 and 2014
(In thousands)
2015 2014
Operating revenues:Toll revenue $ 1,523,133 1,445,748 E-ZPass fees 56,262 52,773 Concession revenue 38,993 36,842 Miscellaneous revenue 13,635 14,377
Total operating revenues 1,632,023 1,549,740
Operating expenses:Maintenance of roadway, buildings, and equipment 268,001 245,269 Toll collection 172,624 168,898 State police and traffic control 82,007 76,469 Technology 36,404 30,936 General administrative costs 50,514 43,353 Depreciation 316,377 201,001
Total operating expenses 925,927 765,926
Operating income 706,096 783,814
Nonoperating revenues (expenses):Build America Bonds subsidy 75,908 75,745 Payments to the State of New Jersey (354,001) (354,001) Interest expense, Turnpike Revenue Bonds (310,363) (205,195) Other bond expenses (2,752) (4,738) Sale of capital assets (248) (4,763) Investment income (loss) 2,403 (32,312) Arts Center 3,632 3,530
Total nonoperating revenues (expenses), net (585,421) (521,734)
Change in net position 120,675 262,080
Net position – beginning of year 537,615 669,787 Cumulative effect of adoption of GASB 68 (note 2(t)) — (394,252)
Net position – end of year $ 658,290 537,615
See accompanying notes to basic financial statements.
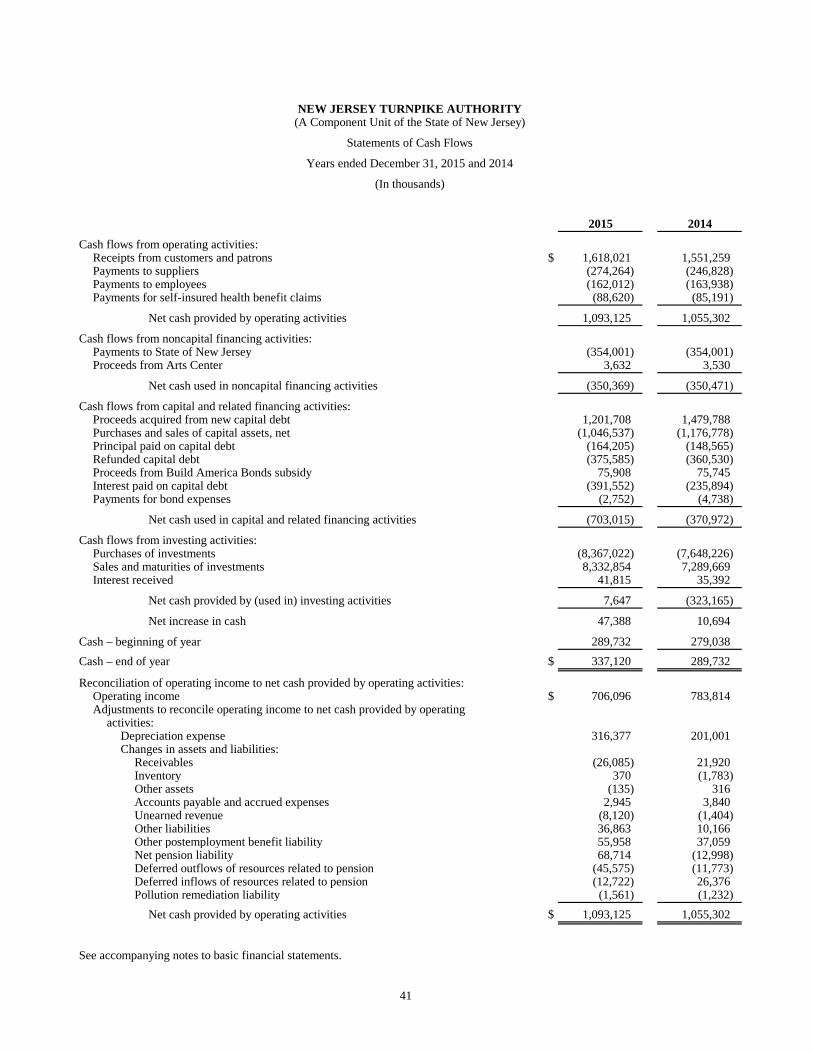
41
NEW JERSEY TURNPIKE AUTHORITY(A Component Unit of the State of New Jersey)
Statements of Cash Flows
Years ended December 31, 2015 and 2014
(In thousands)
2015 2014
Cash flows from operating activities:Receipts from customers and patrons $ 1,618,021 1,551,259 Payments to suppliers (274,264) (246,828) Payments to employees (162,012) (163,938) Payments for self-insured health benefit claims (88,620) (85,191)
Net cash provided by operating activities 1,093,125 1,055,302
Cash flows from noncapital financing activities:Payments to State of New Jersey (354,001) (354,001) Proceeds from Arts Center 3,632 3,530
Net cash used in noncapital financing activities (350,369) (350,471)
Cash flows from capital and related financing activities:Proceeds acquired from new capital debt 1,201,708 1,479,788 Purchases and sales of capital assets, net (1,046,537) (1,176,778) Principal paid on capital debt (164,205) (148,565) Refunded capital debt (375,585) (360,530) Proceeds from Build America Bonds subsidy 75,908 75,745 Interest paid on capital debt (391,552) (235,894) Payments for bond expenses (2,752) (4,738)
Net cash used in capital and related financing activities (703,015) (370,972)
Cash flows from investing activities:Purchases of investments (8,367,022) (7,648,226) Sales and maturities of investments 8,332,854 7,289,669 Interest received 41,815 35,392
Net cash provided by (used in) investing activities 7,647 (323,165)
Net increase in cash 47,388 10,694
Cash – beginning of year 289,732 279,038
Cash – end of year $ 337,120 289,732
Reconciliation of operating income to net cash provided by operating activities:Operating income $ 706,096 783,814 Adjustments to reconcile operating income to net cash provided by operating
activities:Depreciation expense 316,377 201,001 Changes in assets and liabilities:
Receivables (26,085) 21,920 Inventory 370 (1,783) Other assets (135) 316 Accounts payable and accrued expenses 2,945 3,840 Unearned revenue (8,120) (1,404) Other liabilities 36,863 10,166 Other postemployment benefit liability 55,958 37,059 Net pension liability 68,714 (12,998) Deferred outflows of resources related to pension (45,575) (11,773) Deferred inflows of resources related to pension (12,722) 26,376 Pollution remediation liability (1,561) (1,232)
Net cash provided by operating activities $ 1,093,125 1,055,302
See accompanying notes to basic financial statements.
New Jersey Turnpike Authority Notes to Financial Statements
(A Component Unit of the State of New Jersey) (Dollars shown in thousands) 42
December 31, 2015 and 2014
(Continued)
(1) Organization
The New Jersey Turnpike Authority (the Authority) is a body corporate and politic created
by the New Jersey Turnpike Authority Act of 1948, as amended, restated and supplemented
(the Act). The Act authorizes the Authority to construct, maintain, repair, and operate the
New Jersey Turnpike (the Turnpike System) projects at locations established by law, to fix
and establish tolls for the use of the Turnpike System, and to issue Turnpike revenue bonds
or notes of the Authority, subject to prior approval in writing from the Governor and from
either or both the State Treasurer and the Director of the Division of Budget and Accounting
of the Department of the Treasury, payable solely from tolls and other revenues of the
Authority. Under the provisions of the Act, the Turnpike bonds or notes and the interest
thereon shall not be deemed to constitute a debt or liability or a pledge of the faith and credit
of the State or any political subdivision thereof.
On May 27, 2003, the Act was amended. The amendment empowered the Turnpike
Authority, effective at the Transfer Date, which was July 9, 2003, to assume all powers,
rights, obligations and duties of the New Jersey Highway Authority (the Highway Authority),
which owned and operated the Garden State Parkway and the PNC Bank Arts Center.
The Authority has no stockholders or equity holders and all bond proceeds, revenues or other
cash received must be applied for specific purposes in accordance with the provisions of the
above Act and the Turnpike Revenue Bond Resolution of 1991 as amended, restated and
supplemented (the Bond Resolution) for security of the bondholders. The Authority’s board
of commissioners is comprised of eight members as follows: the Commissioner of the New
Jersey Department of Transportation, ex officio, or his designee; five members appointed by
the Governor with the advice and consent of the Senate, and two members appointed by the
Governor, one upon the recommendation of the President of the Senate and one upon the
recommendation of the Speaker of the General Assembly. As of December 31, 2015, one
seat was vacant, with all seats filled as of December 31, 2014.
The Act provides that the Governor shall have the right to veto any action of the Authority,
and that the prior written approval of the Governor and either the State Treasurer or the
Director of the Division of Budget and Accounting in the Department of the Treasury shall
be obtained prior to adoption of any bond resolution or revision of tolls.
(2) Summary of Significant Accounting Policies
(a) Reporting Entity
The Governmental Accounting Standards Board (GASB) establishes the criteria used
in determining which organizations should be included in these financial statements.
The GASB’s Codification of Governmental Accounting and Financial Reporting
Standards, Section 2100, requires the inclusion of government organizations for which
the Authority is financially accountable. Financial accountability is defined as:
1) appointment of a voting majority of the component unit’s board and either (a) the
ability to impose will by the primary government or (b) the possibility that the
component unit will provide a financial benefit to or impose a financial burden on the
primary government; or 2) fiscal dependency on the primary government.
New Jersey Turnpike Authority Notes to Financial Statements
(A Component Unit of the State of New Jersey) (Dollars shown in thousands) 43
December 31, 2015 and 2014
(Continued)
The Garden State Arts Foundation, Inc. (the Foundation) (see note 14) is included in
the financial statements presented in accordance with accounting principles generally
accepted in the United States of America as a blended component unit. Although
legally separate from the Authority, the Foundation’s members include the
Commissioners of the Authority, who represent a voting majority of the Foundation’s
members.
Additionally, the Authority is a component unit of the State of New Jersey, and its
financial statements are included in the State of New Jersey’s Comprehensive Annual
Financial Report.
(b) Basis of Accounting
The Authority’s activities are accounted for using the flow of economic resources
measurement focus and the accrual basis of accounting. All assets, liabilities, net
position, revenues and expenses are accounted for as an enterprise fund with revenues
recorded when earned and expenses recorded at the time liabilities are incurred.
The Authority follows the pronouncements of the GASB Statement No. 62,
Codification of Accounting and Financial Reporting Guidance Contained in
Pre-November 30, 1989 FASB and AICPA Pronouncements, which requires the
Authority to follow the pronouncements of the GASB in its accounting and financial
reporting.
(c) Capital Assets
Capitalization Policy
The cost to construct, acquire or replace an existing asset (or otherwise prolong the
useful life of an existing asset) is capitalized under the Authority’s capitalization
policy. The capitalization threshold is $50 and includes equipment valued over $50 or
any purchase related to a capital project whose project value exceeds $50.
Capital assets are reported at cost, including all ancillary charges necessary to place
the assets in their intended location and condition for use. If land is purchased, the
capitalized amount includes the purchase price plus costs such as legal fees, filling,
and excavation costs incurred to put the land in condition for its intended use. The
capitalized amounts for building include both acquisition and capital improvement
costs and net construction period interest.
An asset is deemed substantially complete when the structure or project is ready for
the purpose for which it was constructed.
New Jersey Turnpike Authority Notes to Financial Statements
(A Component Unit of the State of New Jersey) (Dollars shown in thousands) 44
December 31, 2015 and 2014
(Continued)
Depreciation Policy
Capital assets are depreciated using straight-line method over their estimated useful
lives as follows:
Road bed 100 yearsRoad surface 5–10 yearsMajor bridge repairs 20 yearsBridges:
Bridges piers and abutments 75 yearsBridges deck 40 yearsBridge spans 40 years
Buildings and sound barriers 35 yearsEquipment 3–15 years
(d) Investments
Investments are reported at fair value based on quoted market prices, except for time
deposits and certificates of deposit, which are reported at cost plus accrued interest.
All investment income, including changes in the fair value of investments, is reported
as non-operating revenue.
Authorized Investments – Investment Policy
The investment policies of the Authority are established in conformity with the
Investment Policy adopted by the Board of Commissioners on September 24, 2013,
which defines investment securities to mean any of the following securities legal for
investment of the Authority’s funds at the time of the purchase thereof:
(i) Federal securities, which are (a) any direct and general obligations of, or any
obligations guaranteed by, the United States of America, including but not
limited to interest obligations of the Resolution Funding Corporation or any
successor thereto, (b) any obligations of any state or political subdivision of a
state (collectively Municipal Bonds) which Municipal Bonds are fully secured
as to principal and interest by an irrevocable pledge of moneys or direct and
general obligations of, or obligations guaranteed by, the United States of
America, which moneys or obligations are segregated in trust and pledged for
the benefit of the holders of the Municipal Bonds, and (c) certificates of
ownership of the principal or interest of direct and general obligations of, or
obligations guaranteed by, the United States of America, which obligations are
held in trust by a commercial bank which is a member of the Federal Reserve
System;
(ii) Bonds, debentures, notes or other evidences of indebtedness issued by any
agency or instrumentality of the United States to the extent such obligations are
guaranteed by the United States or by another such agency the obligations
(including guarantees) of which are guaranteed by the United States;
(iii) Bonds, debentures, notes or other evidences of indebtedness issued by any of the
following agencies: Government National Mortgage Association, Federal Land
Banks, Federal Agency Notes, Federal Intermediate Credit Banks, Banks for
Cooperatives, Tennessee Valley Authority, United States Postal Service,
New Jersey Turnpike Authority Notes to Financial Statements
(A Component Unit of the State of New Jersey) (Dollars shown in thousands) 45
December 31, 2015 and 2014
(Continued)
Farmers Home Administration, Export-Import Bank, Federal Financing Bank
and Student Loan Marketing Association;
(iv) Negotiable or nonnegotiable certificates of deposit issued by any bank, trust
company or national banking association, which certificates of deposit shall be
continuously secured or collateralized by obligations described in subparagraphs
(i) or (ii) of this definition, which shall have a market value (exclusive of accrued
interest) at all times at least equal to the principal amount of such certificates of
deposit and shall be lodged with the Trustee, as custodian, by the bank, trust
company or national banking association issuing such certificates of deposit;
(v) Uncollateralized negotiable or nonnegotiable certificates of deposit issued by
any bank, trust company or national banking association, the unsecured
obligations of which are rated in one of the two highest rating categories, without
regard to rating sub-categories, by Moody’s and Standard & Poor’s (S&P);
(vi) Repurchase agreements collateralized by obligations described in subparagraphs
(i), (ii) or (iii) of this definition with any registered broker/dealer subject to the
Securities Investors’ Protection Corporation jurisdiction, which has an
uninsured, unsecured and unguaranteed obligation rated Prime-1 or A3 or better
by Moody’s and A-1 or A or better by S&P, or any commercial bank with the
above ratings, provided:
(a) master repurchase agreement or specific written repurchase agreement
governs the transaction, which characterizes the transaction as a purchase
and sale of securities,
(b) the securities are held free and clear of any lien, by the Trustee or an
independent third party acting solely as agent for the Trustee, and such
third party is (i) a Federal Reserve Bank, (ii) a bank which is a member of
the FDIC and which has combined capital, surplus, and undivided profits
of not less than $75,000, or (iii) a bank approved in writing for such
purpose by each Credit Issuer, if any, and the Trustee shall have received
written confirmation from such third party that it holds such securities,
free and clear of any lien, as agent for the Trustee,
(c) a perfected first security interest under the Uniform Commerce Code, or
book entry procedures prescribed at 31 CFR 306.1 et seq. or 31 CFR 350.0
et seq. or a successor provision in such securities is created for the benefit
of the Trustee,
(d) the repurchase agreement has a term of six months or less, or the Authority
will value the collateral securities no less frequently than monthly and will
liquidate the collateral securities if any deficiency in the required collateral
percentage is not restored within two business days of such valuation,
(e) the repurchase agreement matures on or before a debt service payment
date (or other appropriate liquidation period), and
(f) the fair market value of the securities in relation to the amount of the
repurchase obligation is equal to at least 100%.
New Jersey Turnpike Authority Notes to Financial Statements
(A Component Unit of the State of New Jersey) (Dollars shown in thousands) 46
December 31, 2015 and 2014
(Continued)
(vii) Banker’s acceptances, Eurodollar deposits and certificates of deposit (in addition
to the certificates of deposit provided for by subparagraphs (iv) and (v) above)
of the domestic branches of foreign banks having a capital and surplus of
$1,000,000 or more, or any bank or trust company organized under the laws of
the United States of America or Canada, or any state or province thereof, having
capital and surplus, in the amount of $1,000,000; provided that the aggregate
maturity value of all such bankers acceptances and certificates of deposit held at
any time as investments of funds under this Resolution with respect to any
particular bank, trust company, or national association shall not exceed 5% of its
capital and surplus; and provided further that any such bank, trust company, or
national association shall be rated in one of the two highest rating categories,
without regard to rating sub-categories, by both Moody’s and S&P;
(viii) Other obligations of the United States of America or any agency thereof which
may then be purchased with funds belonging to the State of New Jersey or which
are legal investments for savings banks in the State of New Jersey;
(ix) Deposits in the New Jersey Cash Management Fund;
(x) Obligations of any state, commonwealth or possession of the United States or a
political subdivision thereof or any agency or instrumentality of such a state,
commonwealth, possession or political subdivision, provided that at the time of
their purchase such obligations are rated in either of the two highest rating
categories by both Moody’s and S&P; and
(xi) Commercial paper with a maturity date not in excess of 270 days rated A-1+ by
S&P and P-1 by Moody’s at the time of such investment, issued by an entity
incorporated under the laws of the United States or any state thereof.
New Jersey Turnpike Authority Notes to Financial Statements
(A Component Unit of the State of New Jersey) (Dollars shown in thousands) 47
December 31, 2015 and 2014
(Continued)
(e) Accounts Receivable
Accounts receivable consist of various tolls, charges and amounts due from
individuals, commercial companies and other agencies and concession revenues
receivable from operators of food and fuel concessions at the service plazas. Toll
accounts receivable from E-ZPass postpaid customers are collateralized by a surety
bond or cash. Reserves for uncollectible accounts receivable are established based on
specific identification and historical experience. Toll accounts receivable from other
agencies are guaranteed under an Interagency Group Reciprocity Agreement.
(f) Inventories
Inventories are reported at average cost basis. Inventories consist of stock (includes
materials to maintain the roadway and vehicles), E-ZPass transponders, fuel (gas and
diesel), and rock salt/calcium chloride.
(g) Deposits
Deposits consist mainly of collateral deposits for owner controlled insurance policies
relating to the Authority’s worker’s compensation program.
(h) Net Capitalized Interest
Net Interest Costs on funds borrowed to finance the construction or acquisition of
certain capital assets, during the period of construction or acquisition, are capitalized
and depreciated over the life of the related assets placed in service. The Authority
capitalized net interest expense of $196,880 and $306,629 during the years ended
December 31, 2015 and 2014, respectively.
(i) Bonds Payable
Bonds payable consist of the total amount of outstanding bonds plus unamortized
premiums and less unamortized discounts.
(j) Compensated Absences
The Authority accrues employees’ unused sick leave and vacation time to be used at a
later date or paid in cash upon termination or retirement from the Authority. The
liability for sick leave is based on application dates and limits vary based upon the
employee’s specific contract and effective dates. The liability for unused vacation is
calculated based on years of service, and the terms of the relevant labor agreement.
The liability for both amounts is calculated based on the pay and salary rates in effect
at the statement of net position date.
(k) Funds Held in Trust
Included in the December 31, 2015 and 2014 statements of net position is
approximately $31,466 and $36,250, respectively, for amounts retained from
contractors and engineers and approximately $205,200 and $176,400, respectively,
received primarily from New Jersey E-ZPass Customer Service Center customers for
E-ZPass tag deposits and account prepayments.
New Jersey Turnpike Authority Notes to Financial Statements
(A Component Unit of the State of New Jersey) (Dollars shown in thousands) 48
December 31, 2015 and 2014
(Continued)
(l) Unearned Revenue
The New Jersey Turnpike Authority recognizes revenue when earned. Amounts
received in advance of the periods in which related services are rendered are recorded
as a liability, which consists of pre-funding from the Pennsylvania Turnpike
Commission for cost sharing construction work and prepayment of rent by customers
for the use of the Authority’s fiber optic lines and communication towers.
(m) Deferred Outflows and Deferred Inflows of Resources
Deferred outflows include change in fair value of hedging derivatives, deferred amount
on refunding and deferred amount relating to pensions. Deferred outflows of resources
are a consumption of net position that is applicable to a future reporting period.
Deferred inflows include deferred amount relating to pensions. Deferred inflows of
resources are an increase in net position that is applicable to a future reporting period.
Accumulated decrease in fair value of hedging derivatives is resulting from the change
due to deferred gain or loss and amortization of deferred gain or loss on interest rate
swaps. Deferred amount on refunding is resulting from a loss in refinancing of debts
due to difference between the reacquisition price and the net carrying amount of the
old debt and is amortized over the life of the related debt. Deferred outflows and
deferred inflows of resources are reported for differences between expected or
projected results compared to actual results related to the Authority’s proportionate
share in the cost sharing pension plan as well as changes in the Authority’s proportion
of the plan from the prior period.
(n) Net Position
Net position is displayed in three components as follows:
Net investment in capital assets – This consists of capital assets, net of accumulated
depreciation, less the outstanding balances of any bonds, notes, or other borrowings
that are attributable to the acquisition, construction, or improvement of those assets.
Restricted under trust agreements – This consists of net position that is legally
restricted by outside parties or by law through constitutional provisions or enabling
legislation. When both restricted and unrestricted resources are available for use,
generally it is the Authority’s policy to use restricted resources first, and then
unrestricted resources when they are needed.
Unrestricted – This consists of net position that does not meet the definition of
“restricted” or “net investment in capital assets.”
(o) Toll Revenue
Revenues from tolls are recognized in the period earned except for tolls collected
through the violation enforcement process which are recognized when received.
Pursuant to the provisions of the Bond Resolution, the Authority has covenanted to
charge and collect such tolls as are required in order that in each calendar year net
revenue shall at least equal the net revenue requirement under the aforementioned
resolution. The Act authorizes the Authority to set tolls subject to prior approval in
writing from the Governor and from either or both the State Treasurer and the Director
of Budget and Accounting of the Department of the Treasury. The Act further provides
New Jersey Turnpike Authority Notes to Financial Statements
(A Component Unit of the State of New Jersey) (Dollars shown in thousands) 49
December 31, 2015 and 2014
(Continued)
that the powers conferred upon the Governor and the Treasurer of the State described
shall be exercised with due regard for the rights of the holders of bonds of the Authority
at any time outstanding, and nothing in, or done pursuant to, the Act shall in any way
limit, restrict or alter the obligation or powers of the Authority or officer of the
Authority to carry out and perform in every detail each and every covenant, agreement
or contract at any time made or entered into by or on behalf of the Authority with
respect to its bonds or for the benefit, protection or security of the holders thereof.
E-ZPass Fees
E-ZPass fees consist of the Authority’s share of fees and charges generated from the
operation of the New Jersey E-ZPass Customer Service Center. This Customer Service
Center is currently operated on behalf of the New Jersey Turnpike Authority, South
Jersey Transportation Authority, Delaware River Port Authority, Delaware River Bay
Authority, the Burlington County Bridge Commission and the Delaware River Joint
Toll Bridge Commission by Xerox State and Local Solutions, Inc. The fees and charges
consist primarily of the monthly membership fee charged to New Jersey E-ZPass
account holders and the administrative fee collected from toll evaders. In addition,
other fees are charged to E-ZPass account holders for such items as monthly statement
delivery, transponders sales, lost and stolen transponders and returned checks. Revenue
is also generated from leasing of the Authority’s fiber optic network, allowing certain
parking lots to accept E-ZPass as payment and interest on prepaid and tag deposit
account balances. For financial reporting purposes, fees and charges are recognized
when earned for all but administrative fees which are recognized when received from
the patrons.
(p) Classification of Revenues over Expenses
The Authority has classified its revenues and expenses as either operating or non-
operating.
Operating revenues include activities that have the characteristics of exchange
transactions including tolls, E-Z Pass fees, rental fees received from concessionaires,
and miscellaneous operating revenues. Non-operating revenue includes activities that
have the characteristics of non-exchange transactions, such as the Build America
Bonds subsidy and investment income.
Operating expenses include the costs of operating and maintaining the toll roads,
administrative expenses, and depreciation on capital assets. All expenses not meeting
this definition, including interest expense, are reported as non-operating expenses.
(q) Income Taxes
The Authority is exempt from federal income taxes under the Internal Revenue Code
Section 115 and from state income taxes under N.J.S.A. 27:25-16. Accordingly, no
provision is recorded for federal and state income taxes.
(r) Pension and Other Postemployment Benefits
GASB Statement No. 68, Accounting and Financial Reporting for Pensions
(GASB 68), establishes standards for the measurement and reporting of the
proportionate share of the net pension liability and pension expense. For purposes of
measuring the net pension liability, deferred outflows of resources and deferred inflows
of resources related to pension expense, information about the fiduciary net position of
New Jersey Turnpike Authority Notes to Financial Statements
(A Component Unit of the State of New Jersey) (Dollars shown in thousands) 50
December 31, 2015 and 2014
(Continued)
the State of New Jersey Public Employees’ Retirement System (PERS) and additions
to/deductions from PERS fiduciary net position have been determined on the same
basis as they are reported by PERS. For this purpose, benefit payments (including
refunds of employee contributions) are recognized when due and payable in
accordance with the benefit terms. Investments are reported at fair value. (See note 11).
GASB Statement No. 45, Accounting and Financial Reporting by Employers for
Postemployment Benefits Other Than Pensions (GASB 45), establishes standards for
the measurement, recognition, and display of OPEB and related liabilities (assets),
note disclosures, and, if applicable, required supplementary information in the
financial reports of state and local governmental employers. OPEB includes
postemployment healthcare, as well as other forms of postemployment benefits (e.g.,
life insurance) when provided separately from a pension plan. (See note 12).
(s) Use of Estimates
The preparation of financial statements in conformity with U.S. generally accepted
accounting principles requires management to make estimates and assumptions that
affect the reported amounts of assets and liabilities and disclosure of contingent assets
and liabilities at the date of the financial statements and the reported amounts of
revenues and expenses during the reporting period. Actual results could differ from
those estimates.
(t) Adoption of Accounting Pronouncement
The Authority adopted GASB 68 in 2015. GASB 68 addresses accounting and
financial reporting for pensions that are provided to the employees of state and local
governmental employers. This statement establishes standards for measuring and
recognizing liabilities, deferred outflows of resources, deferred inflows of resources,
and expense related to pensions. Note disclosure and required supplementary
information requirements about pensions also are addressed. For defined benefit
pensions, this statement also identifies the methods and assumptions that should be
used to project benefit payments, discount projected benefit payments to their actuarial
present value, and attribute that present value to periods of employee service. In
accordance with the provisions of GASB 68, the Authority has reported its
proportionate share of State of New Jersey Public Employees’ Retirement System
(PERS) net pension liability, deferred outflows of resources, deferred inflows of
resources, and pension expense.
The Authority also adopted GASB Statement No. 71, Pension Transition for
Contributions Made Subsequent to the Measurement Date (GASB 71). GASB 71
requires that, at transition, a government recognize a beginning deferred outflow of
resources for its pension contributions, if any, made subsequent to the measurement
date of the beginning net pension liability.
The provisions of GASB 68 and 71 have been applied to the 2014 beginning net
position, and the 2014 financial statements have been restated. As a result of the
implementation of GASB 68 and 71, beginning unrestricted net position as of
January 1, 2014, was decreased by $394,252. The following is a reconciliation of the
2014 amounts as previously reported to the total restated amounts:
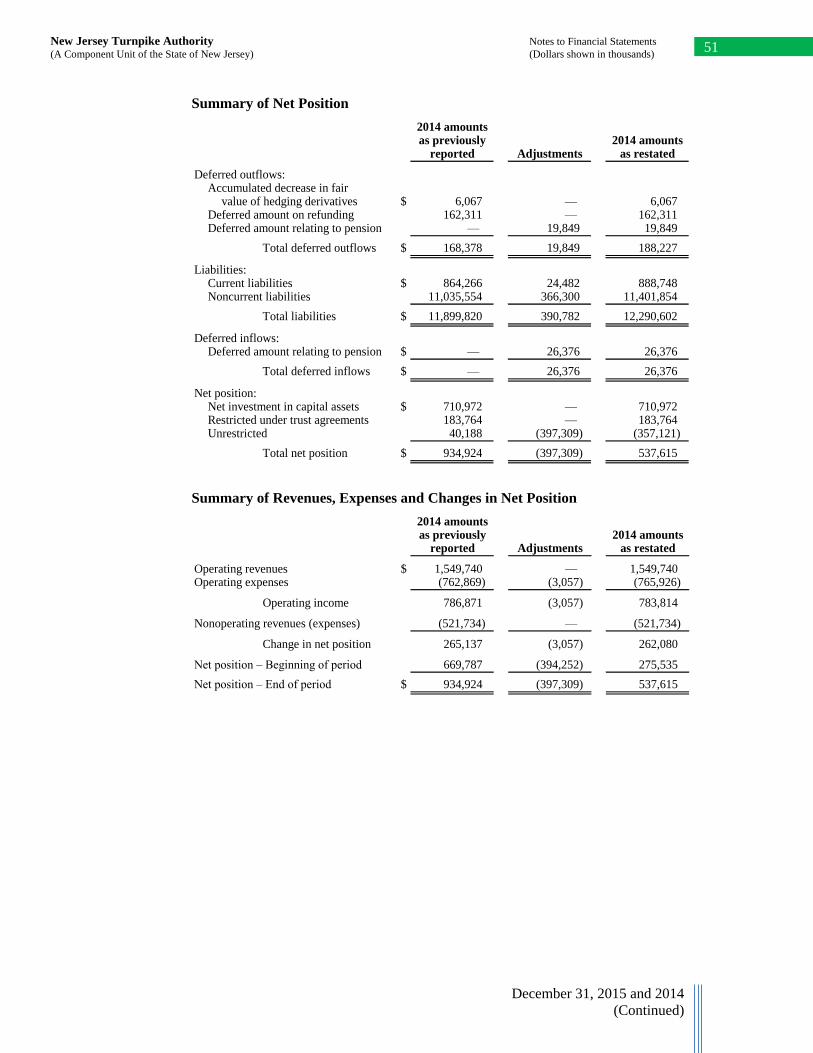
New Jersey Turnpike Authority Notes to Financial Statements
(A Component Unit of the State of New Jersey) (Dollars shown in thousands) 51
December 31, 2015 and 2014
(Continued)
Summary of Net Position
2014 amountsas previously 2014 amounts
reported Adjustments as restated
Deferred outflows:Accumulated decrease in fair
value of hedging derivatives $ 6,067 — 6,067 Deferred amount on refunding 162,311 — 162,311 Deferred amount relating to pension — 19,849 19,849
Total deferred outflows $ 168,378 19,849 188,227
Liabilities:Current liabilities $ 864,266 24,482 888,748 Noncurrent liabilities 11,035,554 366,300 11,401,854
Total liabilities $ 11,899,820 390,782 12,290,602
Deferred inflows:Deferred amount relating to pension $ — 26,376 26,376
Total deferred inflows $ — 26,376 26,376
Net position:Net investment in capital assets $ 710,972 — 710,972 Restricted under trust agreements 183,764 — 183,764 Unrestricted 40,188 (397,309) (357,121)
Total net position $ 934,924 (397,309) 537,615
Summary of Revenues, Expenses and Changes in Net Position
2014 amountsas previously 2014 amounts
reported Adjustments as restated
Operating revenues $ 1,549,740 — 1,549,740 Operating expenses (762,869) (3,057) (765,926)
Operating income 786,871 (3,057) 783,814
Nonoperating revenues (expenses) (521,734) — (521,734)
Change in net position 265,137 (3,057) 262,080
Net position – Beginning of period 669,787 (394,252) 275,535
Net position – End of period $ 934,924 (397,309) 537,615
New Jersey Turnpike Authority Notes to Financial Statements
(A Component Unit of the State of New Jersey) (Dollars shown in thousands) 52
December 31, 2015 and 2014
(Continued)
(3) Cash and Investments
The New Jersey Turnpike Authority is authorized to engage in investment activity pursuant
to the Act, and the Bond Resolution. Specific investment policies and practices are set forth
in certain sections of the Authority’s Investment Policy adopted on September 24, 2013.
These guidelines are adhered to by the Authority’s Finance Department when making
day-to-day investment decisions. The Authority principally invests in securities of United
States agencies, highly rated commercial paper, demand accounts, certificates of deposit, and
repurchase agreements. According to management, the Authority is not in violation of any
provisions of its Investment Policy.
(a) Cash
The total cash carrying amount as of December 31, 2015 and 2014 is $337,120 and
$289,732, respectively. The actual amount of cash on deposit in all bank accounts as
of December 31, 2015 and 2014 was $328,050 and $282,092, respectively. Authority
accounts had a book balance as of December 31, 2015 and 2014 of $336,381 and
$288,833, respectively, actual cash on deposit of $327,300 and $281,165, respectively,
and are collateralized by pledged securities totaling $346,219 and $413,335,
respectively, held in the Authority’s name by the Authority’s financial institutions or
its agents. The Foundation’s cash balance as of December 31, 2015 and 2014 includes
a book balance of $739 and $899, respectively. The actual amount of cash on deposit
in the Foundation’s bank accounts as of December 31, 2015 and 2014 was $750 and
$927, respectively, of which $549 and $500, respectively, was insured by the Federal
Deposit Insurance Corporation (FDIC) and $201 and $427, respectively, which was
not insured or collateralized.
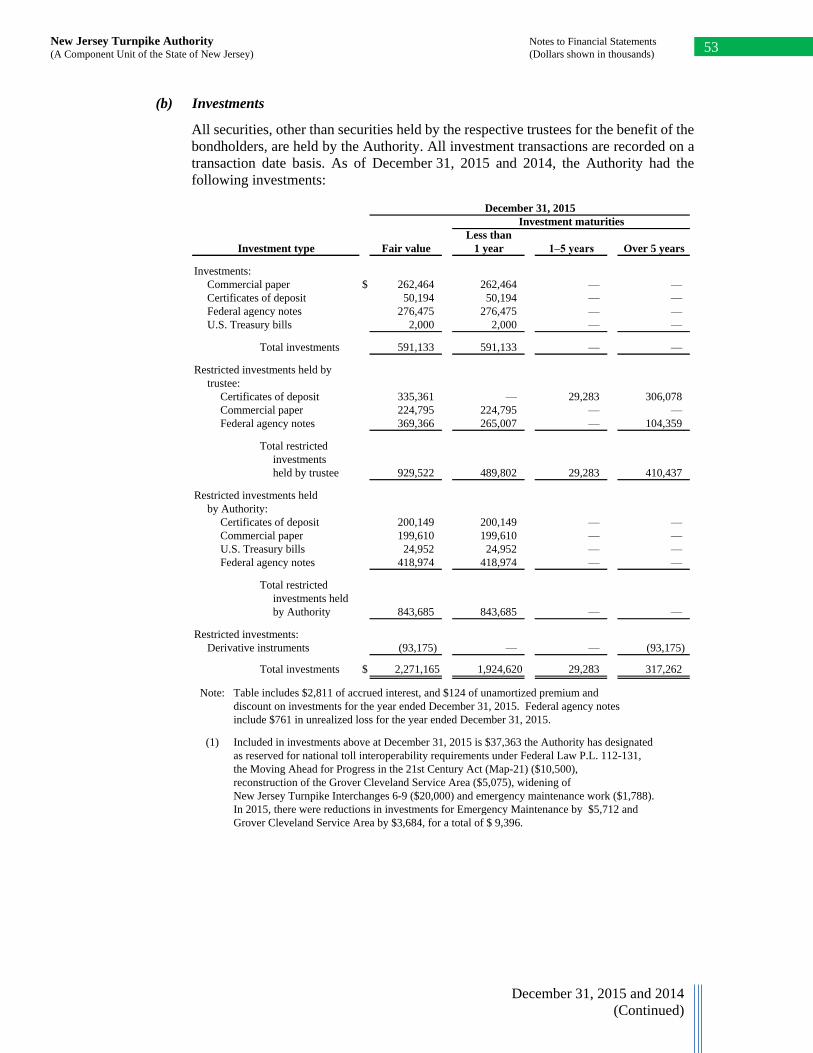
New Jersey Turnpike Authority Notes to Financial Statements
(A Component Unit of the State of New Jersey) (Dollars shown in thousands) 53
December 31, 2015 and 2014
(Continued)
(b) Investments
All securities, other than securities held by the respective trustees for the benefit of the
bondholders, are held by the Authority. All investment transactions are recorded on a
transaction date basis. As of December 31, 2015 and 2014, the Authority had the
following investments:
December 31, 2015
Investment maturities
Less than
Investment type Fair value 1 year 1–5 years Over 5 years
Investments:
Commercial paper $ 262,464 262,464 — —
Certificates of deposit 50,194 50,194 — —
Federal agency notes 276,475 276,475 — —
U.S. Treasury bills 2,000 2,000 — —
Total investments 591,133 591,133 — —
Restricted investments held by
trustee:
Certificates of deposit 335,361 — 29,283 306,078
Commercial paper 224,795 224,795 — —
Federal agency notes 369,366 265,007 — 104,359
Total restricted
investments
held by trustee 929,522 489,802 29,283 410,437
Restricted investments held
by Authority:
Certificates of deposit 200,149 200,149 — —
Commercial paper 199,610 199,610 — —
U.S. Treasury bills 24,952 24,952 — —
Federal agency notes 418,974 418,974 — —
Total restricted
investments held
by Authority 843,685 843,685 — —
Restricted investments:
Derivative instruments (93,175) — — (93,175)
Total investments $ 2,271,165 1,924,620 29,283 317,262
Note: Table includes $2,811 of accrued interest, and $124 of unamortized premium and
discount on investments for the year ended December 31, 2015. Federal agency notes
include $761 in unrealized loss for the year ended December 31, 2015.
(1) Included in investments above at December 31, 2015 is $37,363 the Authority has designated
as reserved for national toll interoperability requirements under Federal Law P.L. 112-131,
the Moving Ahead for Progress in the 21st Century Act (Map-21) ($10,500),
reconstruction of the Grover Cleveland Service Area ($5,075), widening of
New Jersey Turnpike Interchanges 6-9 ($20,000) and emergency maintenance work ($1,788).
In 2015, there were reductions in investments for Emergency Maintenance by $5,712 and
Grover Cleveland Service Area by $3,684, for a total of $ 9,396.
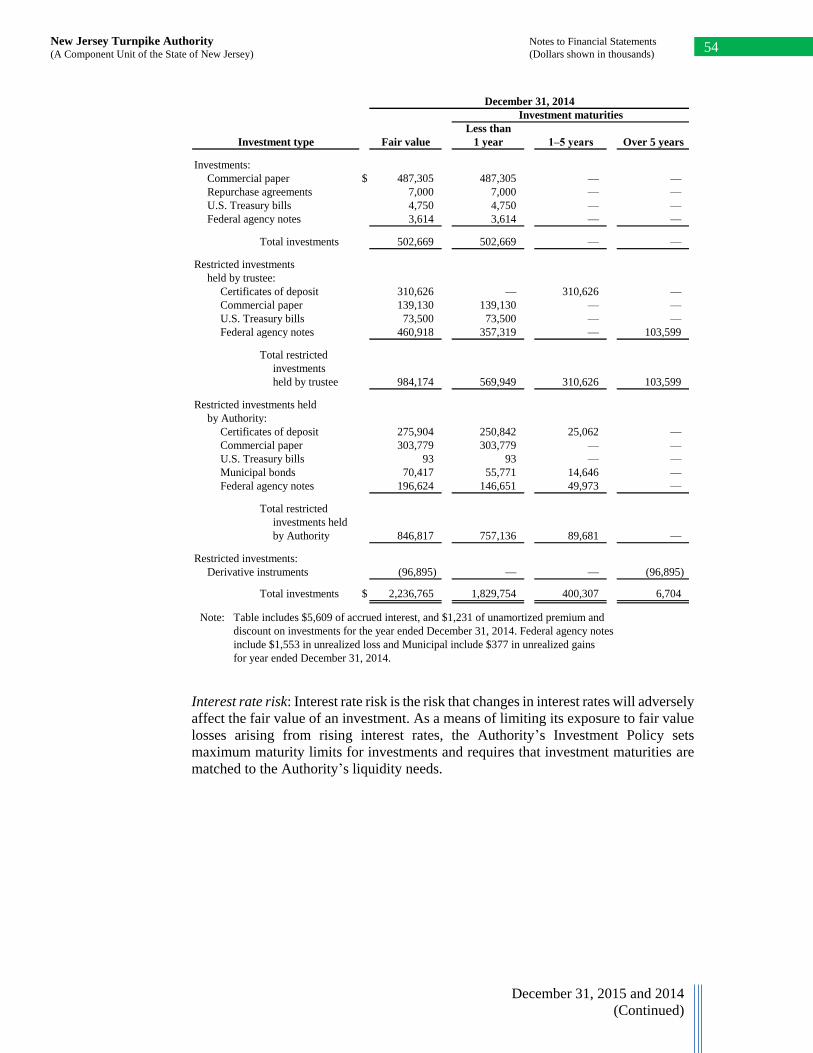
New Jersey Turnpike Authority Notes to Financial Statements
(A Component Unit of the State of New Jersey) (Dollars shown in thousands) 54
December 31, 2015 and 2014
(Continued)
December 31, 2014
Investment maturities
Less than
Investment type Fair value 1 year 1–5 years Over 5 years
Investments:
Commercial paper $ 487,305 487,305 — —
Repurchase agreements 7,000 7,000 — —
U.S. Treasury bills 4,750 4,750 — —
Federal agency notes 3,614 3,614 — —
Total investments 502,669 502,669 — —
Restricted investments
held by trustee:
Certificates of deposit 310,626 — 310,626 —
Commercial paper 139,130 139,130 — —
U.S. Treasury bills 73,500 73,500 — —
Federal agency notes 460,918 357,319 — 103,599
Total restricted
investments
held by trustee 984,174 569,949 310,626 103,599
Restricted investments held
by Authority:
Certificates of deposit 275,904 250,842 25,062 —
Commercial paper 303,779 303,779 — —
U.S. Treasury bills 93 93 — —
Municipal bonds 70,417 55,771 14,646 —
Federal agency notes 196,624 146,651 49,973 —
Total restricted
investments held
by Authority 846,817 757,136 89,681 —
Restricted investments:
Derivative instruments (96,895) — — (96,895)
Total investments $ 2,236,765 1,829,754 400,307 6,704
Note: Table includes $5,609 of accrued interest, and $1,231 of unamortized premium and
discount on investments for the year ended December 31, 2014. Federal agency notes
include $1,553 in unrealized loss and Municipal include $377 in unrealized gains
for year ended December 31, 2014.
Interest rate risk: Interest rate risk is the risk that changes in interest rates will adversely
affect the fair value of an investment. As a means of limiting its exposure to fair value
losses arising from rising interest rates, the Authority’s Investment Policy sets
maximum maturity limits for investments and requires that investment maturities are
matched to the Authority’s liquidity needs.
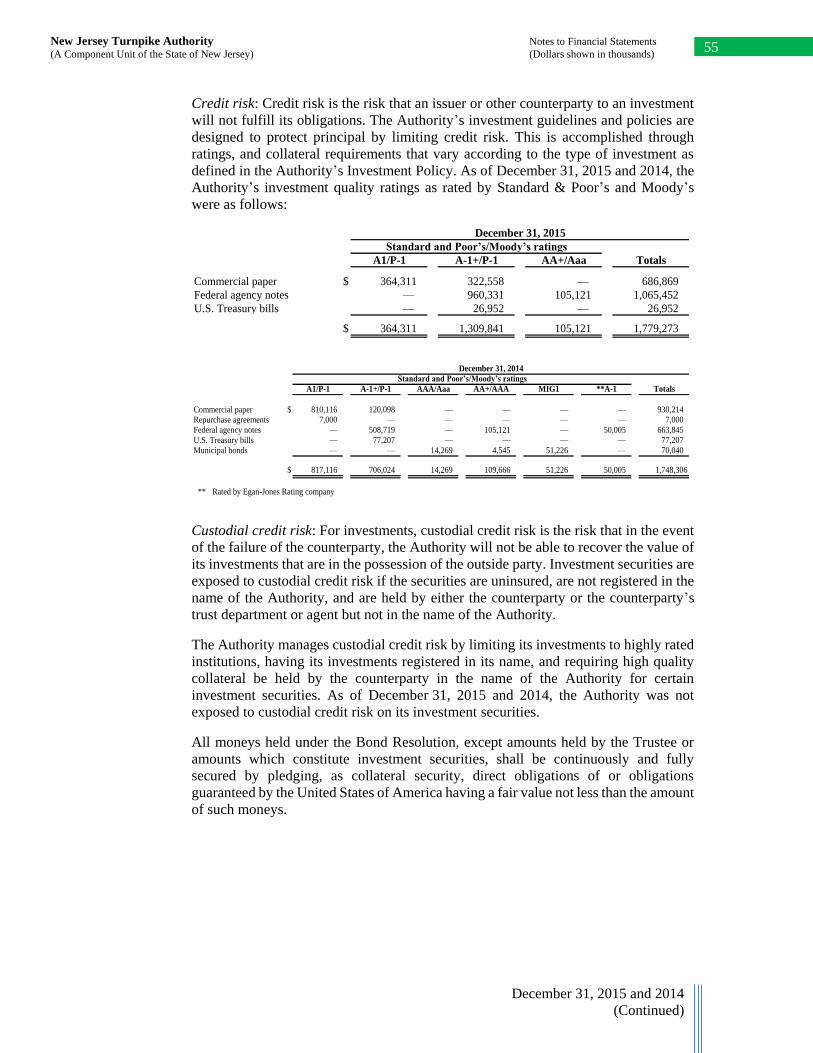
New Jersey Turnpike Authority Notes to Financial Statements
(A Component Unit of the State of New Jersey) (Dollars shown in thousands) 55
December 31, 2015 and 2014
(Continued)
Credit risk: Credit risk is the risk that an issuer or other counterparty to an investment
will not fulfill its obligations. The Authority’s investment guidelines and policies are
designed to protect principal by limiting credit risk. This is accomplished through
ratings, and collateral requirements that vary according to the type of investment as
defined in the Authority’s Investment Policy. As of December 31, 2015 and 2014, the
Authority’s investment quality ratings as rated by Standard & Poor’s and Moody’s
were as follows:
Standard and Poor’s/Moody’s ratings
A1/P-1 A-1+/P-1 AA+/Aaa Totals
Commercial paper $ 364,311 322,558 — 686,869
Federal agency notes — 960,331 105,121 1,065,452
U.S. Treasury bills — 26,952 — 26,952
$ 364,311 1,309,841 105,121 1,779,273
December 31, 2015
December 31, 2014
Standard and Poor’s/Moody’s ratings
A1/P-1 A-1+/P-1 AAA/Aaa AA+/AAA MIG1 **A-1 Totals
Commercial paper $ 810,116 120,098 — — — — 930,214
Repurchase agreements 7,000 — — — — — 7,000
Federal agency notes — 508,719 — 105,121 — 50,005 663,845
U.S. Treasury bills — 77,207 — — — — 77,207
Municipal bonds — — 14,269 4,545 51,226 — 70,040
$ 817,116 706,024 14,269 109,666 51,226 50,005 1,748,306
** Rated by Egan-Jones Rating company
Custodial credit risk: For investments, custodial credit risk is the risk that in the event
of the failure of the counterparty, the Authority will not be able to recover the value of
its investments that are in the possession of the outside party. Investment securities are
exposed to custodial credit risk if the securities are uninsured, are not registered in the
name of the Authority, and are held by either the counterparty or the counterparty’s
trust department or agent but not in the name of the Authority.
The Authority manages custodial credit risk by limiting its investments to highly rated
institutions, having its investments registered in its name, and requiring high quality
collateral be held by the counterparty in the name of the Authority for certain
investment securities. As of December 31, 2015 and 2014, the Authority was not
exposed to custodial credit risk on its investment securities.
All moneys held under the Bond Resolution, except amounts held by the Trustee or
amounts which constitute investment securities, shall be continuously and fully
secured by pledging, as collateral security, direct obligations of or obligations
guaranteed by the United States of America having a fair value not less than the amount
of such moneys.
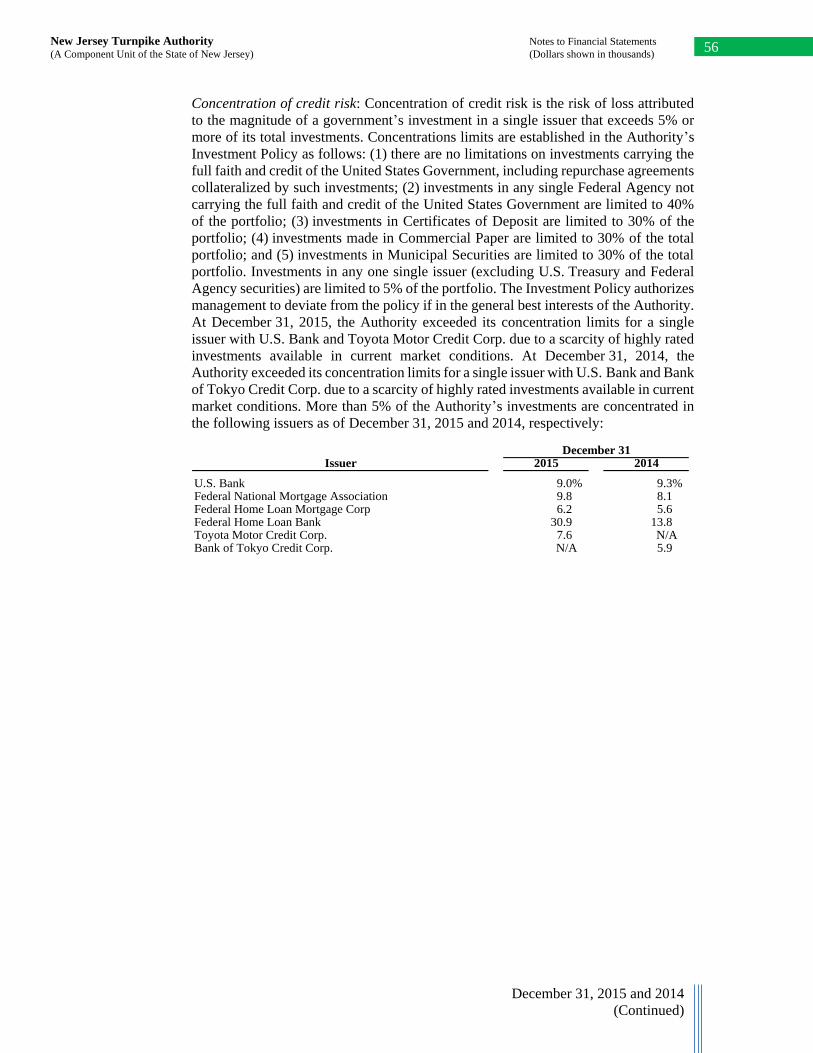
New Jersey Turnpike Authority Notes to Financial Statements
(A Component Unit of the State of New Jersey) (Dollars shown in thousands) 56
December 31, 2015 and 2014
(Continued)
Concentration of credit risk: Concentration of credit risk is the risk of loss attributed
to the magnitude of a government’s investment in a single issuer that exceeds 5% or
more of its total investments. Concentrations limits are established in the Authority’s
Investment Policy as follows: (1) there are no limitations on investments carrying the
full faith and credit of the United States Government, including repurchase agreements
collateralized by such investments; (2) investments in any single Federal Agency not
carrying the full faith and credit of the United States Government are limited to 40%
of the portfolio; (3) investments in Certificates of Deposit are limited to 30% of the
portfolio; (4) investments made in Commercial Paper are limited to 30% of the total
portfolio; and (5) investments in Municipal Securities are limited to 30% of the total
portfolio. Investments in any one single issuer (excluding U.S. Treasury and Federal
Agency securities) are limited to 5% of the portfolio. The Investment Policy authorizes
management to deviate from the policy if in the general best interests of the Authority.
At December 31, 2015, the Authority exceeded its concentration limits for a single
issuer with U.S. Bank and Toyota Motor Credit Corp. due to a scarcity of highly rated
investments available in current market conditions. At December 31, 2014, the
Authority exceeded its concentration limits for a single issuer with U.S. Bank and Bank
of Tokyo Credit Corp. due to a scarcity of highly rated investments available in current
market conditions. More than 5% of the Authority’s investments are concentrated in
the following issuers as of December 31, 2015 and 2014, respectively:
December 31Issuer 2015 2014
U.S. Bank 9.0% 9.3%Federal National Mortgage Association 9.8 8.1Federal Home Loan Mortgage Corp 6.2 5.6Federal Home Loan Bank 30.9 13.8Toyota Motor Credit Corp. 7.6 N/ABank of Tokyo Credit Corp. N/A 5.9
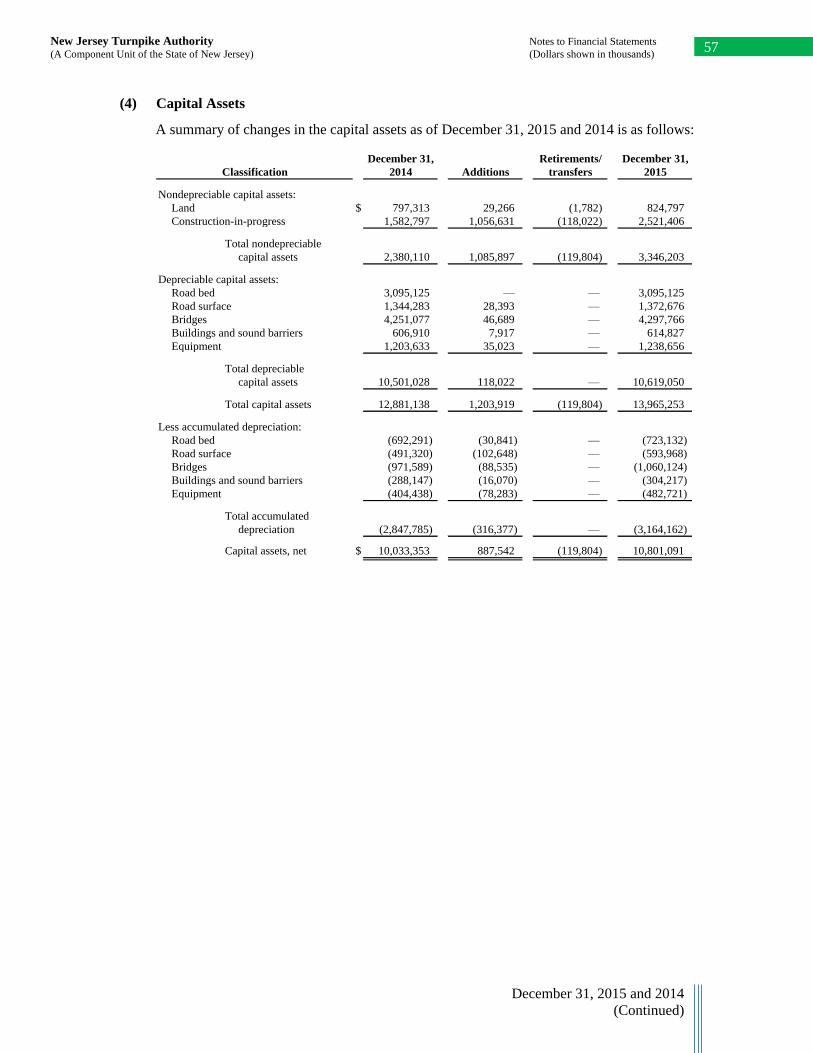
New Jersey Turnpike Authority Notes to Financial Statements
(A Component Unit of the State of New Jersey) (Dollars shown in thousands) 57
December 31, 2015 and 2014
(Continued)
(4) Capital Assets
A summary of changes in the capital assets as of December 31, 2015 and 2014 is as follows:
December 31, Retirements/ December 31,
Classification 2014 Additions transfers 2015
Nondepreciable capital assets:
Land $ 797,313 29,266 (1,782) 824,797
Construction-in-progress 1,582,797 1,056,631 (118,022) 2,521,406
Total nondepreciable
capital assets 2,380,110 1,085,897 (119,804) 3,346,203
Depreciable capital assets:
Road bed 3,095,125 — — 3,095,125
Road surface 1,344,283 28,393 — 1,372,676
Bridges 4,251,077 46,689 — 4,297,766
Buildings and sound barriers 606,910 7,917 — 614,827
Equipment 1,203,633 35,023 — 1,238,656
Total depreciable
capital assets 10,501,028 118,022 — 10,619,050
Total capital assets 12,881,138 1,203,919 (119,804) 13,965,253
Less accumulated depreciation:
Road bed (692,291) (30,841) — (723,132)
Road surface (491,320) (102,648) — (593,968)
Bridges (971,589) (88,535) — (1,060,124)
Buildings and sound barriers (288,147) (16,070) — (304,217)
Equipment (404,438) (78,283) — (482,721)
Total accumulated
depreciation (2,847,785) (316,377) — (3,164,162)
Capital assets, net $ 10,033,353 887,542 (119,804) 10,801,091
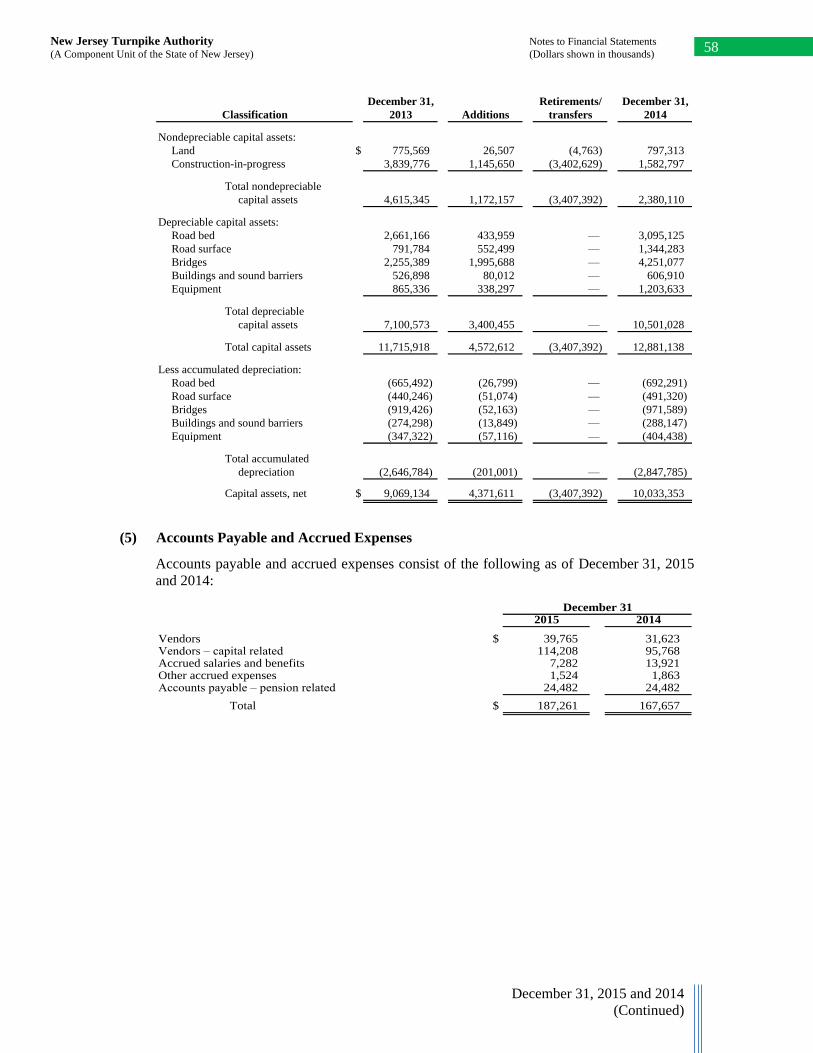
New Jersey Turnpike Authority Notes to Financial Statements
(A Component Unit of the State of New Jersey) (Dollars shown in thousands) 58
December 31, 2015 and 2014
(Continued)
December 31, Retirements/ December 31,
Classification 2013 Additions transfers 2014
Nondepreciable capital assets:
Land $ 775,569 26,507 (4,763) 797,313
Construction-in-progress 3,839,776 1,145,650 (3,402,629) 1,582,797
Total nondepreciable
capital assets 4,615,345 1,172,157 (3,407,392) 2,380,110
Depreciable capital assets:
Road bed 2,661,166 433,959 — 3,095,125
Road surface 791,784 552,499 — 1,344,283
Bridges 2,255,389 1,995,688 — 4,251,077
Buildings and sound barriers 526,898 80,012 — 606,910
Equipment 865,336 338,297 — 1,203,633
Total depreciable
capital assets 7,100,573 3,400,455 — 10,501,028
Total capital assets 11,715,918 4,572,612 (3,407,392) 12,881,138
Less accumulated depreciation:
Road bed (665,492) (26,799) — (692,291)
Road surface (440,246) (51,074) — (491,320)
Bridges (919,426) (52,163) — (971,589)
Buildings and sound barriers (274,298) (13,849) — (288,147)
Equipment (347,322) (57,116) — (404,438)
Total accumulated
depreciation (2,646,784) (201,001) — (2,847,785)
Capital assets, net $ 9,069,134 4,371,611 (3,407,392) 10,033,353
(5) Accounts Payable and Accrued Expenses
Accounts payable and accrued expenses consist of the following as of December 31, 2015
and 2014:
December 312015 2014
Vendors $ 39,765 31,623 Vendors – capital related 114,208 95,768 Accrued salaries and benefits 7,282 13,921 Other accrued expenses 1,524 1,863 Accounts payable – pension related 24,482 24,482
Total $ 187,261 167,657
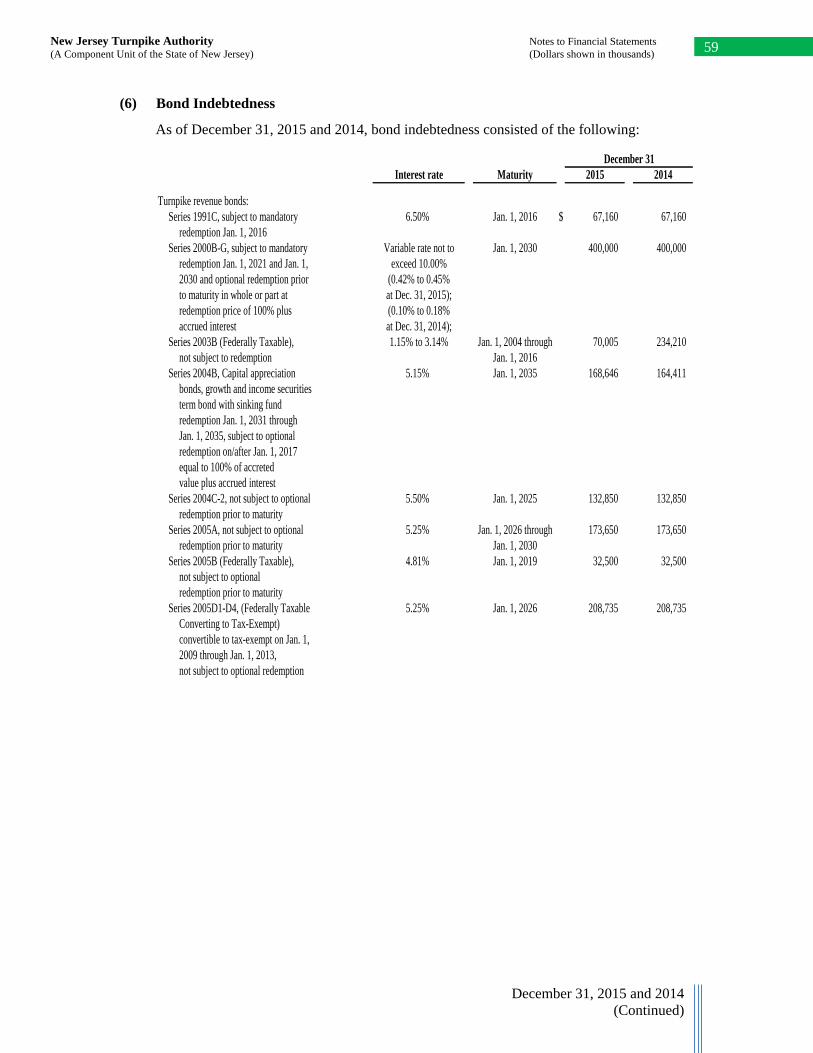
New Jersey Turnpike Authority Notes to Financial Statements
(A Component Unit of the State of New Jersey) (Dollars shown in thousands) 59
December 31, 2015 and 2014
(Continued)
(6) Bond Indebtedness
As of December 31, 2015 and 2014, bond indebtedness consisted of the following:
December 31
Interest rate Maturity 2015 2014
Turnpike revenue bonds:
Series 1991C, subject to mandatory 6.50% Jan. 1, 2016 $ 67,160 67,160
redemption Jan. 1, 2016
Series 2000B-G, subject to mandatory Variable rate not to Jan. 1, 2030 400,000 400,000
redemption Jan. 1, 2021 and Jan. 1, exceed 10.00%
2030 and optional redemption prior (0.42% to 0.45%
to maturity in whole or part at at Dec. 31, 2015);
redemption price of 100% plus (0.10% to 0.18%
accrued interest at Dec. 31, 2014);
Series 2003B (Federally Taxable), 1.15% to 3.14% Jan. 1, 2004 through 70,005 234,210
not subject to redemption Jan. 1, 2016
Series 2004B, Capital appreciation 5.15% Jan. 1, 2035 168,646 164,411
bonds, growth and income securities
term bond with sinking fund
redemption Jan. 1, 2031 through
Jan. 1, 2035, subject to optional
redemption on/after Jan. 1, 2017
equal to 100% of accreted
value plus accrued interest
Series 2004C-2, not subject to optional 5.50% Jan. 1, 2025 132,850 132,850
redemption prior to maturity
Series 2005A, not subject to optional 5.25% Jan. 1, 2026 through 173,650 173,650
redemption prior to maturity Jan. 1, 2030
Series 2005B (Federally Taxable), 4.81% Jan. 1, 2019 32,500 32,500
not subject to optional
redemption prior to maturity
Series 2005D1-D4, (Federally Taxable 5.25% Jan. 1, 2026 208,735 208,735
Converting to Tax-Exempt)
convertible to tax-exempt on Jan. 1,
2009 through Jan. 1, 2013,
not subject to optional redemption
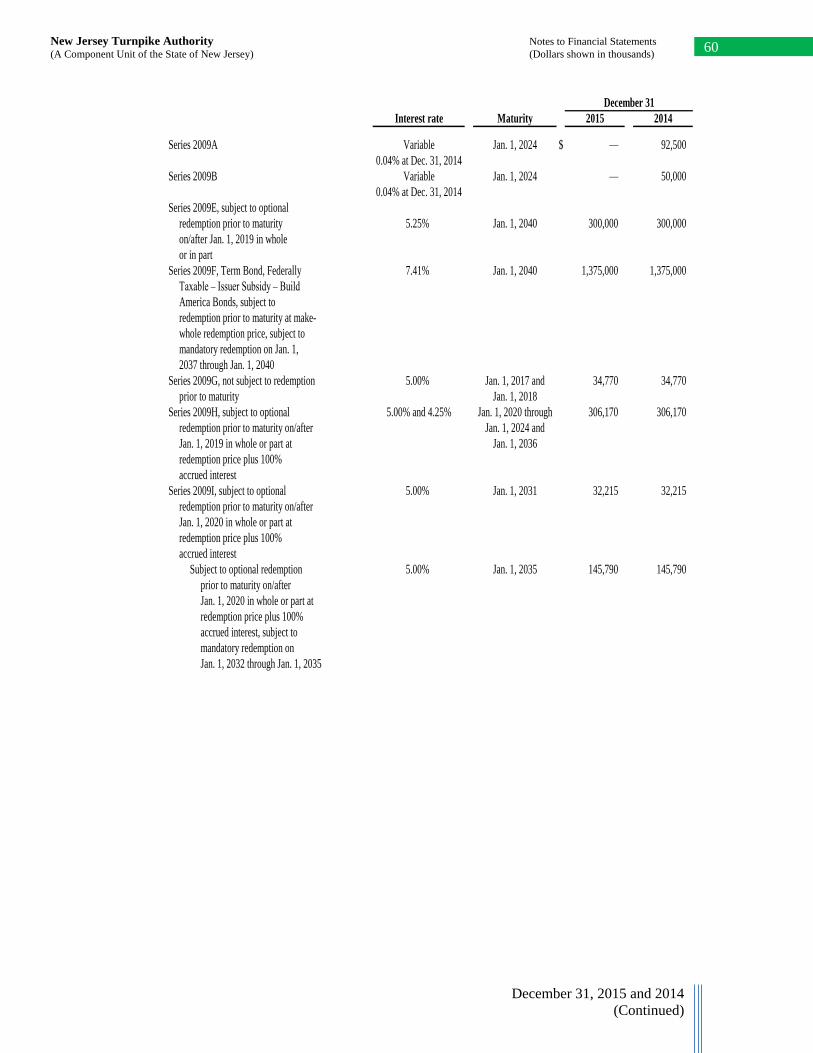
New Jersey Turnpike Authority Notes to Financial Statements
(A Component Unit of the State of New Jersey) (Dollars shown in thousands) 60
December 31, 2015 and 2014
(Continued)
December 31
Interest rate Maturity 2015 2014
Series 2009A Variable Jan. 1, 2024 $ — 92,500
0.04% at Dec. 31, 2014
Series 2009B Variable Jan. 1, 2024 — 50,000
0.04% at Dec. 31, 2014
Series 2009E, subject to optional
redemption prior to maturity 5.25% Jan. 1, 2040 300,000 300,000
on/after Jan. 1, 2019 in whole
or in part
Series 2009F, Term Bond, Federally 7.41% Jan. 1, 2040 1,375,000 1,375,000
Taxable – Issuer Subsidy – Build
America Bonds, subject to
redemption prior to maturity at make-
whole redemption price, subject to
mandatory redemption on Jan. 1,
2037 through Jan. 1, 2040
Series 2009G, not subject to redemption 5.00% Jan. 1, 2017 and 34,770 34,770
prior to maturity Jan. 1, 2018
Series 2009H, subject to optional 5.00% and 4.25% Jan. 1, 2020 through 306,170 306,170
redemption prior to maturity on/after Jan. 1, 2024 and
Jan. 1, 2019 in whole or part at Jan. 1, 2036
redemption price plus 100%
accrued interest
Series 2009I, subject to optional 5.00% Jan. 1, 2031 32,215 32,215
redemption prior to maturity on/after
Jan. 1, 2020 in whole or part at
redemption price plus 100%
accrued interest
Subject to optional redemption 5.00% Jan. 1, 2035 145,790 145,790
prior to maturity on/after
Jan. 1, 2020 in whole or part at
redemption price plus 100%
accrued interest, subject to
mandatory redemption on
Jan. 1, 2032 through Jan. 1, 2035

New Jersey Turnpike Authority Notes to Financial Statements
(A Component Unit of the State of New Jersey) (Dollars shown in thousands) 61
December 31, 2015 and 2014
(Continued)
December 31
Interest rate Maturity 2015 2014
Series 2010A, Federally Taxable – Issuer 7.10% Jan. 1, 2041 $ 1,850,000 1,850,000
Subsidy Build America Bonds, subject
to optional redemption prior to
maturity at make-whole redemption
price. Subject to mandatory
redemption on Jan. 1, 2035 through
Jan. 1, 2041
Series 2012A, subject to optional 3.63% to 5.00% Jan. 1, 2031 through 80,740 80,740
redemption prior to maturity on/after Jan. 1, 2033
Jan. 1, 2022 in whole or in part
Subject to mandatory redemption 5.00% Jan. 1, 2035 60,515 60,515
on Jan. 1, 2034 and 2035
Series 2012B, not subject to optional 5.00% Jan. 1, 2019 through 329,250 329,250
redemption prior to Jan. 1, 2023 Jan. 1, 2023
Subject to optional redemption in whole or 3.50% to 5.00% Jan. 1, 2024 through 475,185 475,185
in part on any date on/after Jan. 1, 2023 Jan. 1, 2030
Series 2012G, subject to mandatory Variable
tender Sept. 21, 2015, subject to 0.72% at Dec 31, 2014 Jan. 1, 2024 — 43,750
redemption Jan. 1, 2020 to
Jan. 1, 2024
Series 2013A, not subject to optional 3.00% to 5.00% Jan. 1, 2016 through
redemption prior to Jan. 1,2023 Jan. 1, 2023 78,315 78,315
Maturing on/after Jan. 1, 2024
subject to optional redemption 3.00% to 5.00% Jan. 1, 2024 through 1,321,685 1,321,685
on/after Jul. 1, 2022 Jan. 1, 2043
Series 2013B, not subject to optional Variable Jan. 1, 2018 100,000 100,000
redemption prior to maturity 0.74% at Dec 31, 2015
0.74% at Dec 31, 2014
Series 2013C, not subject to optional Variable
redemption prior to maturity 0.49% at Dec 31, 2015 Jan. 1, 2017 129,500 129,500
0.52% at Dec 31, 2014
0.56% at Dec 31, 2015 Jan. 1, 2018 141,500 141,500
0.59% at Dec 31, 2014
Series 2013D1, subject to optional Variable
redemption Jul. 1, 2015 and 0.57% at Dec 31, 2014 Jan. 1, 2022 — 72,350
Mandatory tender Jan. 1, 2016
Series 2013D2, subject to optional redemption Variable Jan. 1, 2023 75,025 75,025
Jul. 1, 2016 and mandatory 0.63% at Dec 31, 2015
tender Jan. 1, 2017 0.66% at Dec 31, 2014
Series 2013D3, subject to optional redemption Variable Jan. 1, 2024 77,625 77,625
Jul. 1, 2017 and mandatory 0.69% at Dec 31, 2015
tender Jan. 1, 2018 0.72% at Dec 31, 2014
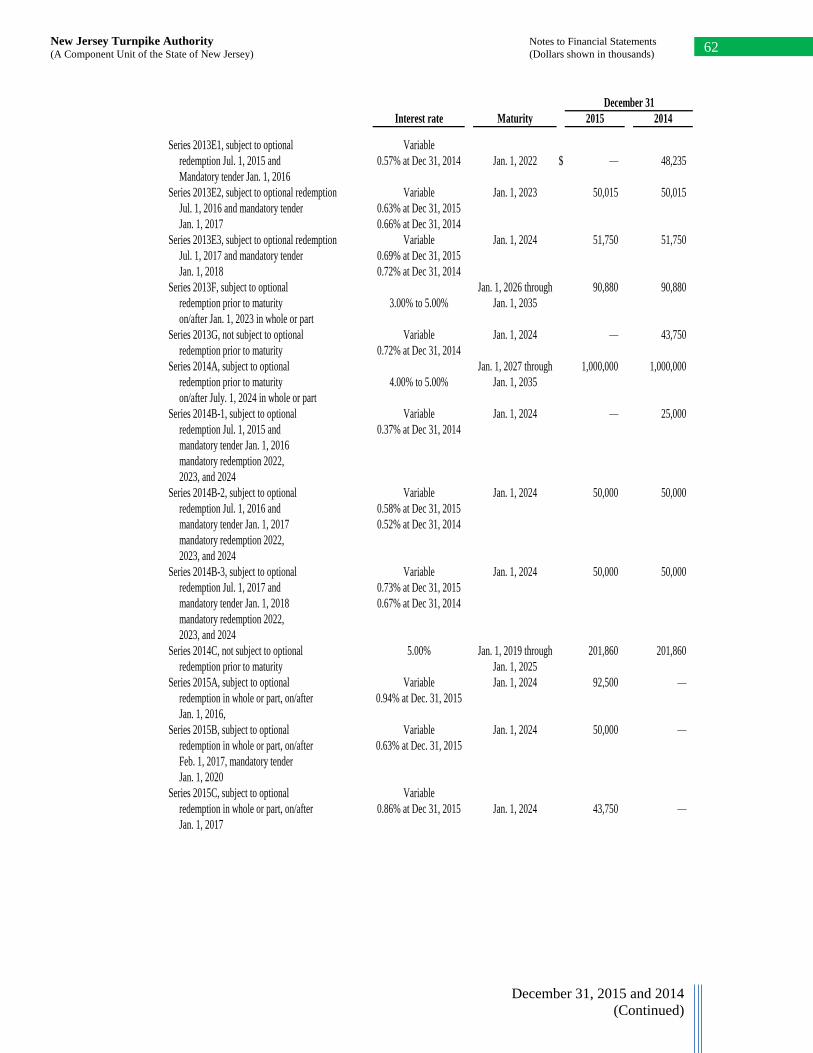
New Jersey Turnpike Authority Notes to Financial Statements
(A Component Unit of the State of New Jersey) (Dollars shown in thousands) 62
December 31, 2015 and 2014
(Continued)
December 31
Interest rate Maturity 2015 2014
Series 2013E1, subject to optional Variable
redemption Jul. 1, 2015 and 0.57% at Dec 31, 2014 Jan. 1, 2022 $ — 48,235
Mandatory tender Jan. 1, 2016
Series 2013E2, subject to optional redemption Variable Jan. 1, 2023 50,015 50,015
Jul. 1, 2016 and mandatory tender 0.63% at Dec 31, 2015
Jan. 1, 2017 0.66% at Dec 31, 2014
Series 2013E3, subject to optional redemption Variable Jan. 1, 2024 51,750 51,750
Jul. 1, 2017 and mandatory tender 0.69% at Dec 31, 2015
Jan. 1, 2018 0.72% at Dec 31, 2014
Series 2013F, subject to optional Jan. 1, 2026 through 90,880 90,880
redemption prior to maturity 3.00% to 5.00% Jan. 1, 2035
on/after Jan. 1, 2023 in whole or part
Series 2013G, not subject to optional Variable Jan. 1, 2024 — 43,750
redemption prior to maturity 0.72% at Dec 31, 2014
Series 2014A, subject to optional Jan. 1, 2027 through 1,000,000 1,000,000
redemption prior to maturity 4.00% to 5.00% Jan. 1, 2035
on/after July. 1, 2024 in whole or part
Series 2014B-1, subject to optional Variable Jan. 1, 2024 — 25,000
redemption Jul. 1, 2015 and 0.37% at Dec 31, 2014
mandatory tender Jan. 1, 2016
mandatory redemption 2022,
2023, and 2024
Series 2014B-2, subject to optional Variable Jan. 1, 2024 50,000 50,000
redemption Jul. 1, 2016 and 0.58% at Dec 31, 2015
mandatory tender Jan. 1, 2017 0.52% at Dec 31, 2014
mandatory redemption 2022,
2023, and 2024
Series 2014B-3, subject to optional Variable Jan. 1, 2024 50,000 50,000
redemption Jul. 1, 2017 and 0.73% at Dec 31, 2015
mandatory tender Jan. 1, 2018 0.67% at Dec 31, 2014
mandatory redemption 2022,
2023, and 2024
Series 2014C, not subject to optional 5.00% Jan. 1, 2019 through 201,860 201,860
redemption prior to maturity Jan. 1, 2025
Series 2015A, subject to optional Variable Jan. 1, 2024 92,500 —
redemption in whole or part, on/after 0.94% at Dec. 31, 2015
Jan. 1, 2016,
Series 2015B, subject to optional Variable Jan. 1, 2024 50,000 —
redemption in whole or part, on/after 0.63% at Dec. 31, 2015
Feb. 1, 2017, mandatory tender
Jan. 1, 2020
Series 2015C, subject to optional Variable
redemption in whole or part, on/after 0.86% at Dec 31, 2015 Jan. 1, 2024 43,750 —
Jan. 1, 2017
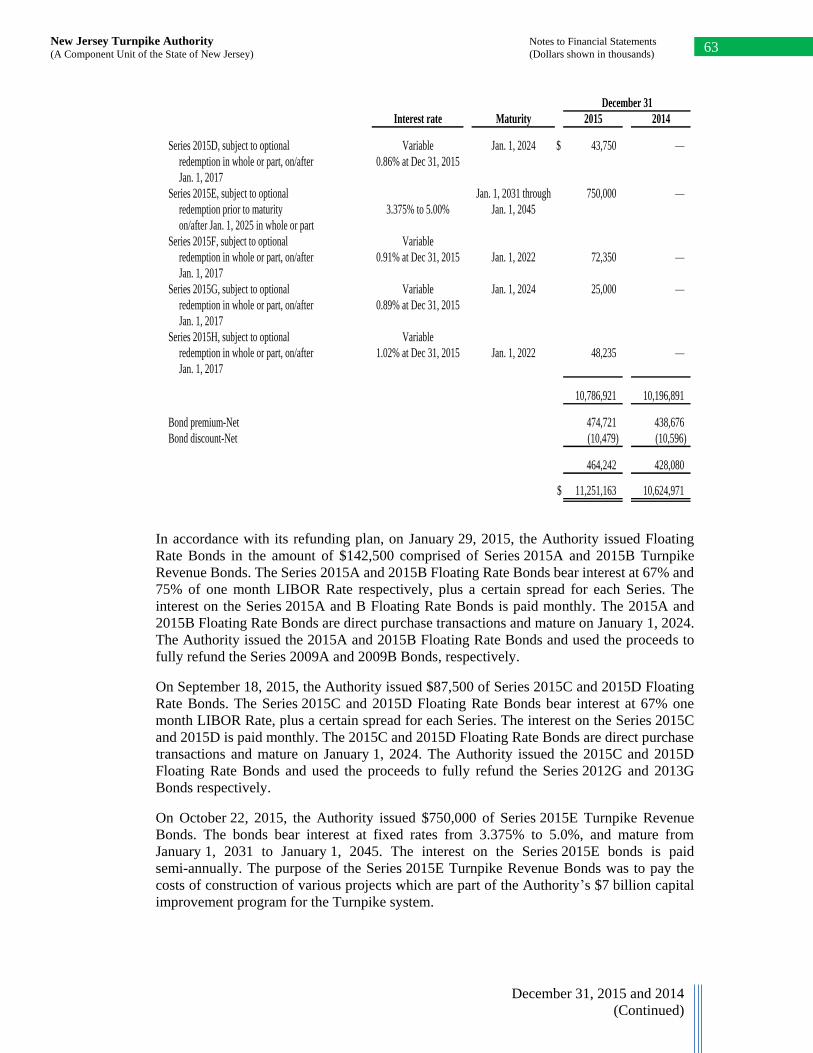
New Jersey Turnpike Authority Notes to Financial Statements
(A Component Unit of the State of New Jersey) (Dollars shown in thousands) 63
December 31, 2015 and 2014
(Continued)
December 31
Interest rate Maturity 2015 2014
Series 2015D, subject to optional Variable Jan. 1, 2024 $ 43,750 —
redemption in whole or part, on/after 0.86% at Dec 31, 2015
Jan. 1, 2017
Series 2015E, subject to optional Jan. 1, 2031 through 750,000 —
redemption prior to maturity 3.375% to 5.00% Jan. 1, 2045
on/after Jan. 1, 2025 in whole or part
Series 2015F, subject to optional Variable
redemption in whole or part, on/after 0.91% at Dec 31, 2015 Jan. 1, 2022 72,350 —
Jan. 1, 2017
Series 2015G, subject to optional Variable Jan. 1, 2024 25,000 —
redemption in whole or part, on/after 0.89% at Dec 31, 2015
Jan. 1, 2017
Series 2015H, subject to optional Variable
redemption in whole or part, on/after 1.02% at Dec 31, 2015 Jan. 1, 2022 48,235 —
Jan. 1, 2017
10,786,921 10,196,891
Bond premium-Net 474,721 438,676
Bond discount-Net (10,479) (10,596)
464,242 428,080
$ 11,251,163 10,624,971
In accordance with its refunding plan, on January 29, 2015, the Authority issued Floating
Rate Bonds in the amount of $142,500 comprised of Series 2015A and 2015B Turnpike
Revenue Bonds. The Series 2015A and 2015B Floating Rate Bonds bear interest at 67% and
75% of one month LIBOR Rate respectively, plus a certain spread for each Series. The
interest on the Series 2015A and B Floating Rate Bonds is paid monthly. The 2015A and
2015B Floating Rate Bonds are direct purchase transactions and mature on January 1, 2024.
The Authority issued the 2015A and 2015B Floating Rate Bonds and used the proceeds to
fully refund the Series 2009A and 2009B Bonds, respectively.
On September 18, 2015, the Authority issued $87,500 of Series 2015C and 2015D Floating
Rate Bonds. The Series 2015C and 2015D Floating Rate Bonds bear interest at 67% one
month LIBOR Rate, plus a certain spread for each Series. The interest on the Series 2015C
and 2015D is paid monthly. The 2015C and 2015D Floating Rate Bonds are direct purchase
transactions and mature on January 1, 2024. The Authority issued the 2015C and 2015D
Floating Rate Bonds and used the proceeds to fully refund the Series 2012G and 2013G
Bonds respectively.
On October 22, 2015, the Authority issued $750,000 of Series 2015E Turnpike Revenue
Bonds. The bonds bear interest at fixed rates from 3.375% to 5.0%, and mature from
January 1, 2031 to January 1, 2045. The interest on the Series 2015E bonds is paid
semi-annually. The purpose of the Series 2015E Turnpike Revenue Bonds was to pay the
costs of construction of various projects which are part of the Authority’s $7 billion capital
improvement program for the Turnpike system.
New Jersey Turnpike Authority Notes to Financial Statements
(A Component Unit of the State of New Jersey) (Dollars shown in thousands) 64
December 31, 2015 and 2014
(Continued)
On December 23, 2015, the Authority issued $145,585 of Series 2015F, 2015G and 2015H
Floating Rate Bonds. The Series 2015F, 2015G and 2015H Floating Rate Bonds bear interest
at 75%, 69.75% and 67% of one month LIBOR, respectively, plus a certain spread for each
Series. The interest on the Series 2015F, 2015G and 2015H Floating Rate Bonds is paid
monthly. The 2015F, 2015G and 2015H Floating Rate Bonds are direct purchase
transactions. The Series 2015F and 2015H Bonds mature on January 1, 2022 and the
Series 2015G Bonds mature January 1, 2024. The Authority issued the 2015F, 2015G and
2015H Floating Rate Bonds and used the proceeds to fully refund the Series 2013D-1,
Series 2014B-1 and Series 2013E-1 Bonds, respectively.
(a) Bond Insurance
For the Series 2000B-G, Series 2003B-C, Series 2004B-C and Series 2005A-D Bonds,
principal and interest payments are insured on the stated maturity and interest payment
dates through municipal bond, insurance, which totaled $1,119,020 and $1,150,375 as
of December 31, 2015 and 2014, respectively.
In order to meet the Debt Reserve Requirement under the Bond Resolution, the
Authority must deposit cash and investments in the Debt Reserve Fund. In lieu of cash
and investments, the Authority may maintain a surety bond or insurance policy payable
to the Trustee. The Debt Reserve Requirement of $589,672 as of December 31, 2015,
was met through investments in the Debt Reserve Fund with a fair market value of
$590,782, and insurance policies payable to the Trustee with a payment limit of
$322,019. The Debt Reserve Requirement of $561,104 as of December 31, 2014, was
met through investments in the Debt Reserve Fund with a fair market value of
$565,212. Although the insurance policies are still in effect at December 31, 2015,
according to the terms of the insurance policies, cash and investments in the Debt
Reserve Fund must be drawn upon first to satisfy any payments required from the Debt
Reserve Fund. As of December 31, 2015 and December 31, 2014, the fair market value
of the cash and investments in the Debt Reserve Fund meets the Debt Reserve
Requirement in its entirety.
(b) Interest Payments – Fixed Rate Debt
Interest payments on all fixed rate debt are payable semi-annually on July 1 and
January 1 except for Capital Appreciation Bonds.
(c) Interest Payments – Capital Appreciation Bonds
Interest on Capital Appreciation Bonds is not paid as current interest, but rather added
to the face value of the bond and paid at maturity.
The Series 2004B bonds, which are capital appreciation bonds, were originally issued
in the amount of $101,280 and are reported at their accreted value of $168,646 and
$164,411 as of December 31, 2015 and 2014, respectively. The Series 2004B bonds
are subject to mandatory redemption on January 1, 2031 through January 1, 2035 at
100% of the principal amount plus accrued interest.
(d) Interest Payments – Variable Rate Debt
Interest rates on variable rate debt, except for the Auction Rate Securities (see below)
are reset weekly. Interest is paid monthly.
New Jersey Turnpike Authority Notes to Financial Statements
(A Component Unit of the State of New Jersey) (Dollars shown in thousands) 65
December 31, 2015 and 2014
(Continued)
(e) Auction Rate Bond Interest
The Series 2000B-G bonds were issued as auction rate bonds with interest rates not to
exceed 10%. The auction date for the Series 2000B-G bonds generally occurs every
seven days. Interest on the auction rate bonds accrues for each auction interest period
and is payable in arrears on each succeeding interest payment date. An interest auction
period begins on, and includes, an interest payment date and ends on (but excludes) the
next succeeding interest payment date. The final interest payment date on the
Series 2000B-G bonds is January 1, 2030.
(f) Build America Bonds
The Series 2009F bonds are designated as Federally Taxable, Issuer Subsidy Build
America Bonds for purposes of the American Recovery and Reinvestment Act of 2009.
The Authority receives a cash subsidy from the United States Treasury originally equal
to 35% of the interest payable on the bonds. The Budget Control Act of 2011 reduced
the amount of the subsidy paid by the Federal Government through automatic federal
spending cuts commonly known as sequestration. The payment to the Authority
received for the July 1, 2015 interest payment was reduced by 7.3%, and the payment
received in December 2015 (for January 1, 2016 interest payment) was reduced by
6.8%. The Internal Revenue Service has reported that the Authority’s payment due on
July 1, 2016 will also have a 6.8% reduction. There can be no certainty the Federal
Government will not make further cuts to the program. These cash payments constitute
pledged revenues under the Authority’s bond resolution. The Series 2009F bonds are
subject to redemption prior to maturity at the make-whole redemption price which is
equal to the greater of (i) 100% of the principal amount of the bonds to be redeemed
plus accrued and unpaid interest and (ii) the sum of the present value of the remaining
scheduled payments of principal and interest, discounted to the date on which the bonds
are to be redeemed on a semi-annual basis, assuming a 360 day year consisting of
twelve 30 day months, at the adjusted Treasury Rate plus 50 basis points, plus accrued
and unpaid interest. The bonds are also subject to redemption prior to their maturity at
the option of the Authority upon a material adverse change to Section 54AA or 6431
of the Internal Revenue Code of 1986 pursuant to which the Authority’s 35% cash
subsidy payment is reduced or eliminated. In this case the redemption price is equal to
the greater of (i) 100% of principal amount of the bonds to be redeemed plus accrued
and unpaid interest and (ii) the sum of the present value of the remaining scheduled
payments of principal and interest, discounted to the date on which the bonds are to be
redeemed on a semi-annual basis, assuming a 360 day year consisting of twelve 30 day
months, at the adjusted Treasury Rate plus 100 basis points, plus accrued and unpaid
interest. The Series 2009F bonds are subject to mandatory redemption on January 1,
2037 through January 1, 2040 at 100% of the principal amount plus accrued interest.
The Series 2010A bonds are designated as Federally Taxable, Issuer Subsidy Build
America Bonds for purposes of the American Recovery and Reinvestment Act of 2009.
The Authority receives a cash subsidy from the United States Treasury originally equal
to 35% of the interest payable on the bonds. The Budget Control Act of 2011 reduced
the amount of the subsidy paid by the Federal Government through automatic federal
spending cuts commonly known as sequestration. The payment to the Authority
received for the July 1, 2015 interest payment was reduced by 7.3%, and the payment
received in December 2015 (for January 1, 2016 interest payment) was reduced by
6.8%. The Internal Revenue Service has reported that the Authority’s payment due on
July 1, 2016 will also have a 6.8% reduction. There can be no certainty the Federal
New Jersey Turnpike Authority Notes to Financial Statements
(A Component Unit of the State of New Jersey) (Dollars shown in thousands) 66
December 31, 2015 and 2014
(Continued)
Government will not make further cuts to the program. These cash payments constitute
Pledged Revenues under the Authority’s bond resolution. The Series 2010A bonds are
subject to redemption prior to maturity at the make-whole redemption price which is
equal to the greater of (i) 100% of the principal amount of the bonds to be redeemed
plus accrued and unpaid interest and (ii) the sum of the present value of the remaining
scheduled payments of principal and interest, discounted to the date on which the bonds
are to be redeemed on a semi-annual basis, assuming a 360 day year consisting of
twelve 30 day months, at the adjusted Treasury Rate plus 40 basis points, plus accrued
and unpaid interest. The bonds are also subject to redemption prior to their maturity at
the option of the Authority upon a material adverse change to Section 54AA or 6431
of the Internal Revenue Code of 1986 pursuant to which the Authority’s 35% cash
subsidy payment is reduced or eliminated. In this case the redemption price is equal to
the greater of (i) 100% of principal amount of the bonds to be redeemed plus accrued
and unpaid interest and (ii) the sum of the present value of the remaining scheduled
payments of principal and interest, discounted to the date on which the bonds are to be
redeemed on a semi-annual basis, assuming a 360 day year consisting of twelve 30 day
months, at the adjusted Treasury Rate plus 100 basis points, plus accrued and unpaid
interest. The Series 2010A bonds are subject to mandatory redemption on January 1,
2035 through January 1, 2041 at 100% of the principal amount plus accrued interest.
(g) Floating Rate Bonds and SIFMA Index Bonds
The following table summarizes the terms of the Authority’s direct placement of
Floating Rate Bonds, SIFMA Index Bonds, and publically offered Floating Rate Bonds
as of December 31, 2015:
Tax exempt
or federally Final Par Interest rate Mandatory
Series of bonds taxable maturity date amount Floating rate reset tender date
2013B Tax-Exempt 1/1/2018 $ 100,000 75% of the sum of 1-month Weekly
LIBOR + 79bp
2013C1 Tax-Exempt 1/1/2017 121,000 SIFMA + 48 bp Weekly
2013C2 Tax-Exempt 1/1/2018 150,000 SIFMA + 55 bp Weekly
2013D2 Tax-Exempt 1/1/2023 75,025 SIFMA + 62 bp Weekly 1/1/2017
2013D3 Tax-Exempt 1/1/2024 77,625 SIFMA + 68 bp Weekly 1/1/2018
2013E2 Tax-Exempt 1/1/2023 50,015 SIFMA + 62 bp Weekly 1/1/2017
2013E3 Tax-Exempt 1/1/2024 51,750 SIFMA + 68 bp Weekly 1/1/2018
2014B2 Tax-Exempt 1/1/2024 50,000 67% LIBOR + 42 bp Weekly 1/1/2017
2014B3 Tax-Exempt 1/1/2024 50,000 67% LIBOR + 57 bp Weekly 1/1/2018
2015A Tax-Exempt 1/1/2024 92,500 67% 1 month LIBOR + 78 bp Weekly
2015B Tax-Exempt 1/1/2024 50,000 75% 1 month LIBOR + 45 bp Weekly 1/1/2020
2015C Tax-Exempt 1/1/2024 43,750 67% 1 month LIBOR + 70 bp Weekly
2015D Tax-Exempt 1/1/2024 43,750 67% 1 month LIBOR + 70 bp Weekly
2015F Tax-Exempt 1/1/2022 72,350 75% 1 month LIBOR + 59.5 bp Weekly
2015G Tax-Exempt 1/1/2024 25,000 69.75% 1 month LIBOR + 60 bp Weekly
2015H Tax-Exempt 1/1/2022 48,235 67% 1 month LIBOR + 74 bp Weekly
The Series 2013B, Series 2015A, Series 2015B, Series 2015C, Series 2015D,
Series 2015F, Series 2015G and Series 2015H Bonds are direct placements of Floating
Rate Bonds. The Series 2013C1-C2, Series 2013 D2-D3 and Series 2013E2-E3 are
publically offered SIFMA Index Bonds and Series 2014B2-B3 are publically offered
Floating Rate Bonds. Pursuant to the terms of the Series 2013B, Series 2015A,
Series 2015B, Series 2015C, Series 2015D, Series 2015F, Series 2015G and
Series 2015H Bonds, in addition to being subject to mandatory tender for purchase on
the Mandatory Tender Date or maturity date set forth in the chart above, upon the
occurrence of certain enumerated extraordinary mandatory purchase events, the
respective Series of Bonds may also be subject to mandatory tender for purchase at the
option of the applicable bank that is the holder of such Series of Bonds prior to the
occurrence of such Mandatory Tender Date. In the event that the Authority cannot pay

New Jersey Turnpike Authority Notes to Financial Statements
(A Component Unit of the State of New Jersey) (Dollars shown in thousands) 67
December 31, 2015 and 2014
(Continued)
the purchase price for all or a portion of such Series of Bonds on the Mandatory Tender
Date or any such extraordinary mandatory purchase date, (i) 50% of the principal
amount of any unpurchased Bonds will be subject to mandatory redemption on the date
that is one year after such Mandatory Tender Date or extraordinary mandatory
purchase date, at a Redemption Price equal to 100% of the principal amount of such
Bonds to be redeemed plus accrued interest to the redemption date, and (ii) the entire
remaining aggregate principal amount of such unpurchased Bonds will be subject to
mandatory redemption on the date that is two years after such Mandatory Tender Date
or extraordinary mandatory purchase date, at a Redemption Price equal to 100% of the
principal amount of such Bonds to be redeemed plus accrued interest to the redemption
date.
(h) Security
All bonds outstanding under the Bond Resolution, together with amounts owed under
the interest rate swap agreements, are secured on a parity by a pledge of net revenues
of the Authority senior in priority to any other Authority obligations secured by such
net revenues.
(i) Future Payments of Debt Service
The following table sets forth as of December 31, 2015, payments of principal (through
sinking fund installments) and interest to be made to the Debt Service Fund from the
Revenue Fund on all outstanding bonds of the Authority for the next five years and
thereafter. Interest on variable-rate debt and interest rate swaps in the following table
is based upon the variable-rates as of December 31, 2015.
Interest rate
Principal Interest swaps, net Total
December 31:
2016 $ 142,115 454,734 69,132 665,981
2017 197,740 507,632 69,591 774,963
2018 218,475 525,744 58,614 802,833
2019 199,685 524,520 46,662 770,867
2020 247,420 514,624 46,662 808,706
2021–2025 1,584,645 2,473,065 145,788 4,203,498
2026–2030 1,708,650 2,185,827 30,364 3,924,841
2031–2035 1,963,603 1,792,182 — 3,755,785
2036–2040 3,182,864 1,074,983 — 4,257,847
2041–2045 1,341,724 141,824 — 1,483,548
$ 10,786,921 10,195,135 466,813 21,448,869
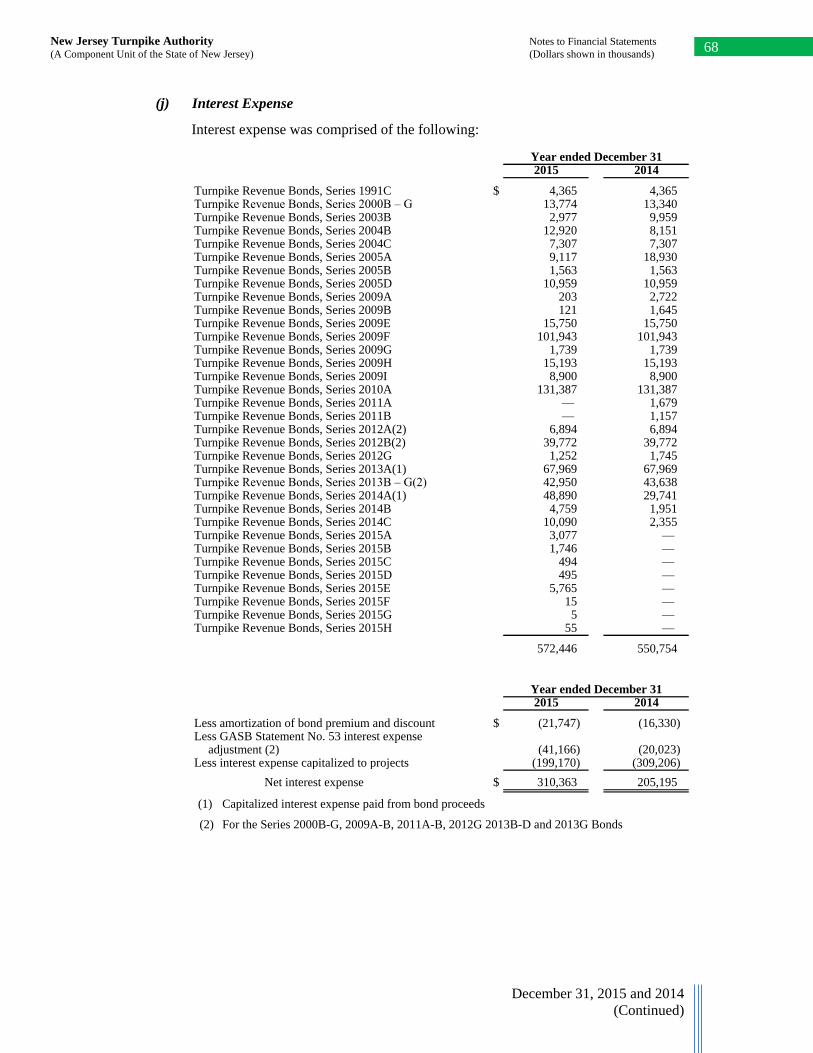
New Jersey Turnpike Authority Notes to Financial Statements
(A Component Unit of the State of New Jersey) (Dollars shown in thousands) 68
December 31, 2015 and 2014
(Continued)
(j) Interest Expense
Interest expense was comprised of the following:
Year ended December 312015 2014
Turnpike Revenue Bonds, Series 1991C $ 4,365 4,365 Turnpike Revenue Bonds, Series 2000B – G 13,774 13,340 Turnpike Revenue Bonds, Series 2003B 2,977 9,959 Turnpike Revenue Bonds, Series 2004B 12,920 8,151 Turnpike Revenue Bonds, Series 2004C 7,307 7,307 Turnpike Revenue Bonds, Series 2005A 9,117 18,930 Turnpike Revenue Bonds, Series 2005B 1,563 1,563 Turnpike Revenue Bonds, Series 2005D 10,959 10,959 Turnpike Revenue Bonds, Series 2009A 203 2,722 Turnpike Revenue Bonds, Series 2009B 121 1,645 Turnpike Revenue Bonds, Series 2009E 15,750 15,750 Turnpike Revenue Bonds, Series 2009F 101,943 101,943 Turnpike Revenue Bonds, Series 2009G 1,739 1,739 Turnpike Revenue Bonds, Series 2009H 15,193 15,193 Turnpike Revenue Bonds, Series 2009I 8,900 8,900 Turnpike Revenue Bonds, Series 2010A 131,387 131,387 Turnpike Revenue Bonds, Series 2011A — 1,679 Turnpike Revenue Bonds, Series 2011B — 1,157 Turnpike Revenue Bonds, Series 2012A(2) 6,894 6,894 Turnpike Revenue Bonds, Series 2012B(2) 39,772 39,772 Turnpike Revenue Bonds, Series 2012G 1,252 1,745 Turnpike Revenue Bonds, Series 2013A(1) 67,969 67,969 Turnpike Revenue Bonds, Series 2013B – G(2) 42,950 43,638 Turnpike Revenue Bonds, Series 2014A(1) 48,890 29,741 Turnpike Revenue Bonds, Series 2014B 4,759 1,951 Turnpike Revenue Bonds, Series 2014C 10,090 2,355 Turnpike Revenue Bonds, Series 2015A 3,077 — Turnpike Revenue Bonds, Series 2015B 1,746 — Turnpike Revenue Bonds, Series 2015C 494 — Turnpike Revenue Bonds, Series 2015D 495 — Turnpike Revenue Bonds, Series 2015E 5,765 — Turnpike Revenue Bonds, Series 2015F 15 — Turnpike Revenue Bonds, Series 2015G 5 — Turnpike Revenue Bonds, Series 2015H 55 —
572,446 550,754
Year ended December 312015 2014
Less amortization of bond premium and discount $ (21,747) (16,330) Less GASB Statement No. 53 interest expense
adjustment (2) (41,166) (20,023) Less interest expense capitalized to projects (199,170) (309,206)
Net interest expense $ 310,363 205,195
(1) Capitalized interest expense paid from bond proceeds
(2) For the Series 2000B-G, 2009A-B, 2011A-B, 2012G 2013B-D and 2013G Bonds
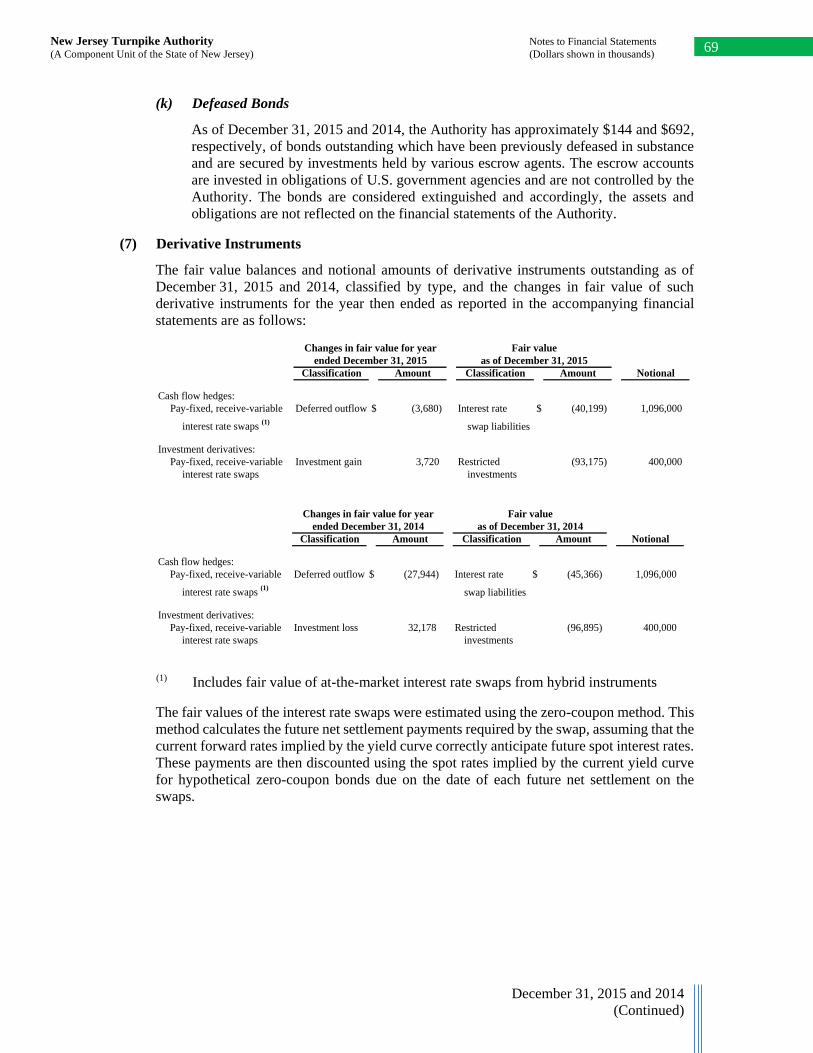
New Jersey Turnpike Authority Notes to Financial Statements
(A Component Unit of the State of New Jersey) (Dollars shown in thousands) 69
December 31, 2015 and 2014
(Continued)
(k) Defeased Bonds
As of December 31, 2015 and 2014, the Authority has approximately $144 and $692,
respectively, of bonds outstanding which have been previously defeased in substance
and are secured by investments held by various escrow agents. The escrow accounts
are invested in obligations of U.S. government agencies and are not controlled by the
Authority. The bonds are considered extinguished and accordingly, the assets and
obligations are not reflected on the financial statements of the Authority.
(7) Derivative Instruments
The fair value balances and notional amounts of derivative instruments outstanding as of
December 31, 2015 and 2014, classified by type, and the changes in fair value of such
derivative instruments for the year then ended as reported in the accompanying financial
statements are as follows:
Changes in fair value for year Fair value
ended December 31, 2015 as of December 31, 2015
Classification Amount Classification Amount Notional
Cash flow hedges:
Pay-fixed, receive-variable Deferred outflow $ (3,680) Interest rate $ (40,199) 1,096,000
interest rate swaps (1)
swap liabilities
Investment derivatives:
Pay-fixed, receive-variable Investment gain 3,720 Restricted (93,175) 400,000
interest rate swaps investments
Changes in fair value for year Fair value
ended December 31, 2014 as of December 31, 2014
Classification Amount Classification Amount Notional
Cash flow hedges:
Pay-fixed, receive-variable Deferred outflow $ (27,944) Interest rate $ (45,366) 1,096,000
interest rate swaps (1)
swap liabilities
Investment derivatives:
Pay-fixed, receive-variable Investment loss 32,178 Restricted (96,895) 400,000
interest rate swaps investments
(1) Includes fair value of at-the-market interest rate swaps from hybrid instruments
The fair values of the interest rate swaps were estimated using the zero-coupon method. This
method calculates the future net settlement payments required by the swap, assuming that the
current forward rates implied by the yield curve correctly anticipate future spot interest rates.
These payments are then discounted using the spot rates implied by the current yield curve
for hypothetical zero-coupon bonds due on the date of each future net settlement on the
swaps.
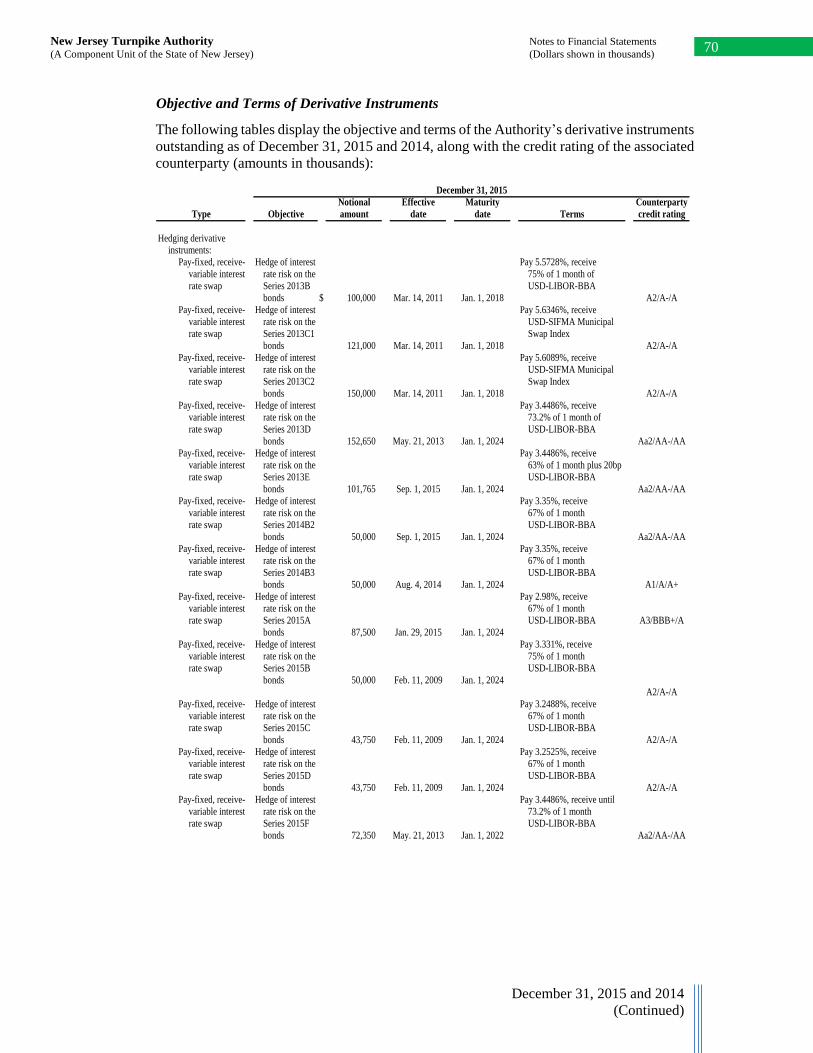
New Jersey Turnpike Authority Notes to Financial Statements
(A Component Unit of the State of New Jersey) (Dollars shown in thousands) 70
December 31, 2015 and 2014
(Continued)
Objective and Terms of Derivative Instruments
The following tables display the objective and terms of the Authority’s derivative instruments
outstanding as of December 31, 2015 and 2014, along with the credit rating of the associated
counterparty (amounts in thousands):
December 31, 2015
Notional Effective Maturity Counterparty
Type Objective amount date date Terms credit rating
Hedging derivativeinstruments:
Pay-fixed, receive- Hedge of interest Pay 5.5728%, receive
variable interest rate risk on the 75% of 1 month of
rate swap Series 2013B USD-LIBOR-BBA
bonds $ 100,000 Mar. 14, 2011 Jan. 1, 2018 A2/A-/A
Pay-fixed, receive- Hedge of interest Pay 5.6346%, receive
variable interest rate risk on the USD-SIFMA Municipal
rate swap Series 2013C1 Swap Index
bonds 121,000 Mar. 14, 2011 Jan. 1, 2018 A2/A-/A
Pay-fixed, receive- Hedge of interest Pay 5.6089%, receive
variable interest rate risk on the USD-SIFMA Municipal
rate swap Series 2013C2 Swap Index
bonds 150,000 Mar. 14, 2011 Jan. 1, 2018 A2/A-/A
Pay-fixed, receive- Hedge of interest Pay 3.4486%, receive
variable interest rate risk on the 73.2% of 1 month of
rate swap Series 2013D USD-LIBOR-BBA
bonds 152,650 May. 21, 2013 Jan. 1, 2024 Aa2/AA-/AA
Pay-fixed, receive- Hedge of interest Pay 3.4486%, receive
variable interest rate risk on the 63% of 1 month plus 20bp
rate swap Series 2013E USD-LIBOR-BBA
bonds 101,765 Sep. 1, 2015 Jan. 1, 2024 Aa2/AA-/AA
Pay-fixed, receive- Hedge of interest Pay 3.35%, receive
variable interest rate risk on the 67% of 1 month
rate swap Series 2014B2 USD-LIBOR-BBA
bonds 50,000 Sep. 1, 2015 Jan. 1, 2024 Aa2/AA-/AA
Pay-fixed, receive- Hedge of interest Pay 3.35%, receive
variable interest rate risk on the 67% of 1 month
rate swap Series 2014B3 USD-LIBOR-BBA
bonds 50,000 Aug. 4, 2014 Jan. 1, 2024 A1/A/A+
Pay-fixed, receive- Hedge of interest Pay 2.98%, receive
variable interest rate risk on the 67% of 1 month
rate swap Series 2015A USD-LIBOR-BBA A3/BBB+/A
bonds 87,500 Jan. 29, 2015 Jan. 1, 2024
Pay-fixed, receive- Hedge of interest Pay 3.331%, receive
variable interest rate risk on the 75% of 1 month
rate swap Series 2015B USD-LIBOR-BBA
bonds 50,000 Feb. 11, 2009 Jan. 1, 2024
A2/A-/A
Pay-fixed, receive- Hedge of interest Pay 3.2488%, receive
variable interest rate risk on the 67% of 1 month
rate swap Series 2015C USD-LIBOR-BBA
bonds 43,750 Feb. 11, 2009 Jan. 1, 2024 A2/A-/A
Pay-fixed, receive- Hedge of interest Pay 3.2525%, receive
variable interest rate risk on the 67% of 1 month
rate swap Series 2015D USD-LIBOR-BBA
bonds 43,750 Feb. 11, 2009 Jan. 1, 2024 A2/A-/A
Pay-fixed, receive- Hedge of interest Pay 3.4486%, receive until
variable interest rate risk on the 73.2% of 1 month
rate swap Series 2015F USD-LIBOR-BBA
bonds 72,350 May. 21, 2013 Jan. 1, 2022 Aa2/AA-/AA
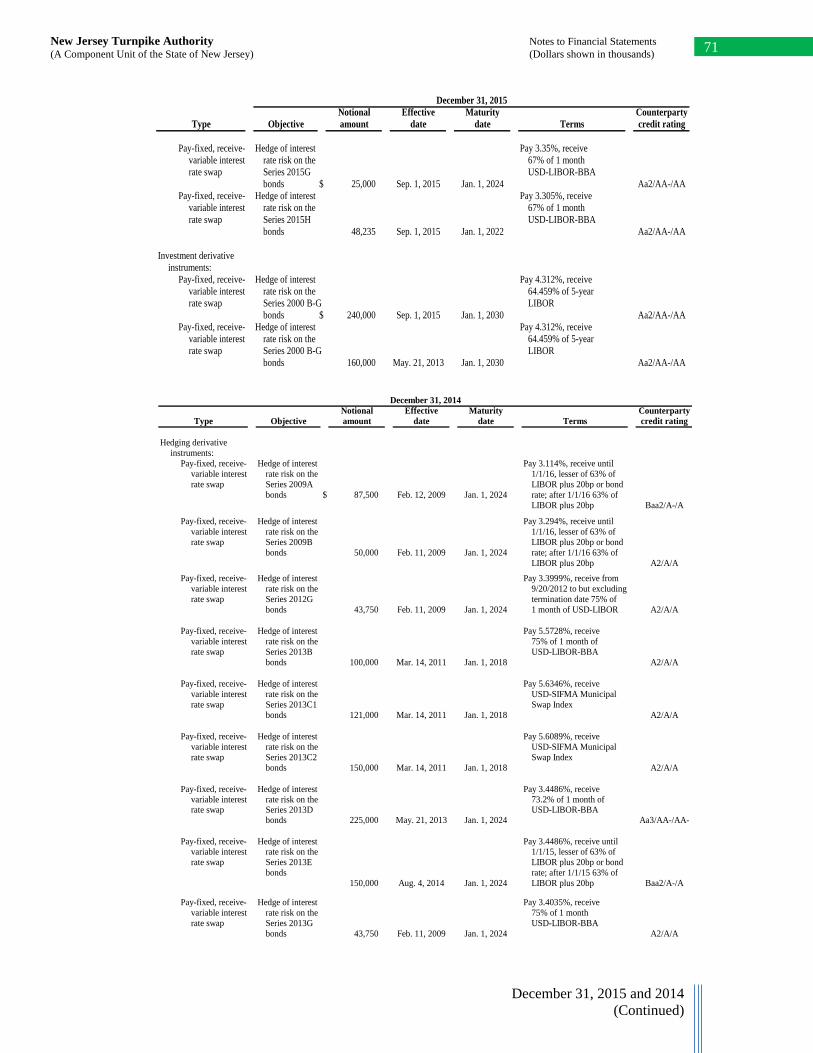
New Jersey Turnpike Authority Notes to Financial Statements
(A Component Unit of the State of New Jersey) (Dollars shown in thousands) 71
December 31, 2015 and 2014
(Continued)
December 31, 2015
Notional Effective Maturity Counterparty
Type Objective amount date date Terms credit rating
Pay-fixed, receive- Hedge of interest Pay 3.35%, receive
variable interest rate risk on the 67% of 1 month
rate swap Series 2015G USD-LIBOR-BBA
bonds $ 25,000 Sep. 1, 2015 Jan. 1, 2024 Aa2/AA-/AA
Pay-fixed, receive- Hedge of interest Pay 3.305%, receive
variable interest rate risk on the 67% of 1 month
rate swap Series 2015H USD-LIBOR-BBA
bonds 48,235 Sep. 1, 2015 Jan. 1, 2022 Aa2/AA-/AA
Investment derivative
instruments:
Pay-fixed, receive- Hedge of interest Pay 4.312%, receive
variable interest rate risk on the 64.459% of 5-year
rate swap Series 2000 B-G LIBOR
bonds $ 240,000 Sep. 1, 2015 Jan. 1, 2030 Aa2/AA-/AA
Pay-fixed, receive- Hedge of interest Pay 4.312%, receive
variable interest rate risk on the 64.459% of 5-year
rate swap Series 2000 B-G LIBOR
bonds 160,000 May. 21, 2013 Jan. 1, 2030 Aa2/AA-/AA
December 31, 2014
Notional Effective Maturity Counterparty
Type Objective amount date date Terms credit rating
Hedging derivative
instruments:Pay-fixed, receive- Hedge of interest Pay 3.114%, receive until
variable interest rate risk on the 1/1/16, lesser of 63% ofrate swap Series 2009A LIBOR plus 20bp or bond
bonds $ 87,500 Feb. 12, 2009 Jan. 1, 2024 rate; after 1/1/16 63% ofLIBOR plus 20bp Baa2/A-/A
Pay-fixed, receive- Hedge of interest Pay 3.294%, receive untilvariable interest rate risk on the 1/1/16, lesser of 63% ofrate swap Series 2009B LIBOR plus 20bp or bond
bonds 50,000 Feb. 11, 2009 Jan. 1, 2024 rate; after 1/1/16 63% of
LIBOR plus 20bp A2/A/A
Pay-fixed, receive- Hedge of interest Pay 3.3999%, receive fromvariable interest rate risk on the 9/20/2012 to but excludingrate swap Series 2012G termination date 75% of
bonds 43,750 Feb. 11, 2009 Jan. 1, 2024 1 month of USD-LIBOR A2/A/A
Pay-fixed, receive- Hedge of interest Pay 5.5728%, receivevariable interest rate risk on the 75% of 1 month ofrate swap Series 2013B USD-LIBOR-BBA
bonds 100,000 Mar. 14, 2011 Jan. 1, 2018 A2/A/A
Pay-fixed, receive- Hedge of interest Pay 5.6346%, receivevariable interest rate risk on the USD-SIFMA Municipalrate swap Series 2013C1 Swap Index
bonds 121,000 Mar. 14, 2011 Jan. 1, 2018 A2/A/A
Pay-fixed, receive- Hedge of interest Pay 5.6089%, receivevariable interest rate risk on the USD-SIFMA Municipalrate swap Series 2013C2 Swap Index
bonds 150,000 Mar. 14, 2011 Jan. 1, 2018 A2/A/A
Pay-fixed, receive- Hedge of interest Pay 3.4486%, receivevariable interest rate risk on the 73.2% of 1 month ofrate swap Series 2013D USD-LIBOR-BBA
bonds 225,000 May. 21, 2013 Jan. 1, 2024 Aa3/AA-/AA-
Pay-fixed, receive- Hedge of interest Pay 3.4486%, receive untilvariable interest rate risk on the 1/1/15, lesser of 63% ofrate swap Series 2013E LIBOR plus 20bp or bond
bonds rate; after 1/1/15 63% of150,000 Aug. 4, 2014 Jan. 1, 2024 LIBOR plus 20bp Baa2/A-/A
Pay-fixed, receive- Hedge of interest Pay 3.4035%, receivevariable interest rate risk on the 75% of 1 monthrate swap Series 2013G USD-LIBOR-BBA
bonds 43,750 Feb. 11, 2009 Jan. 1, 2024 A2/A/A
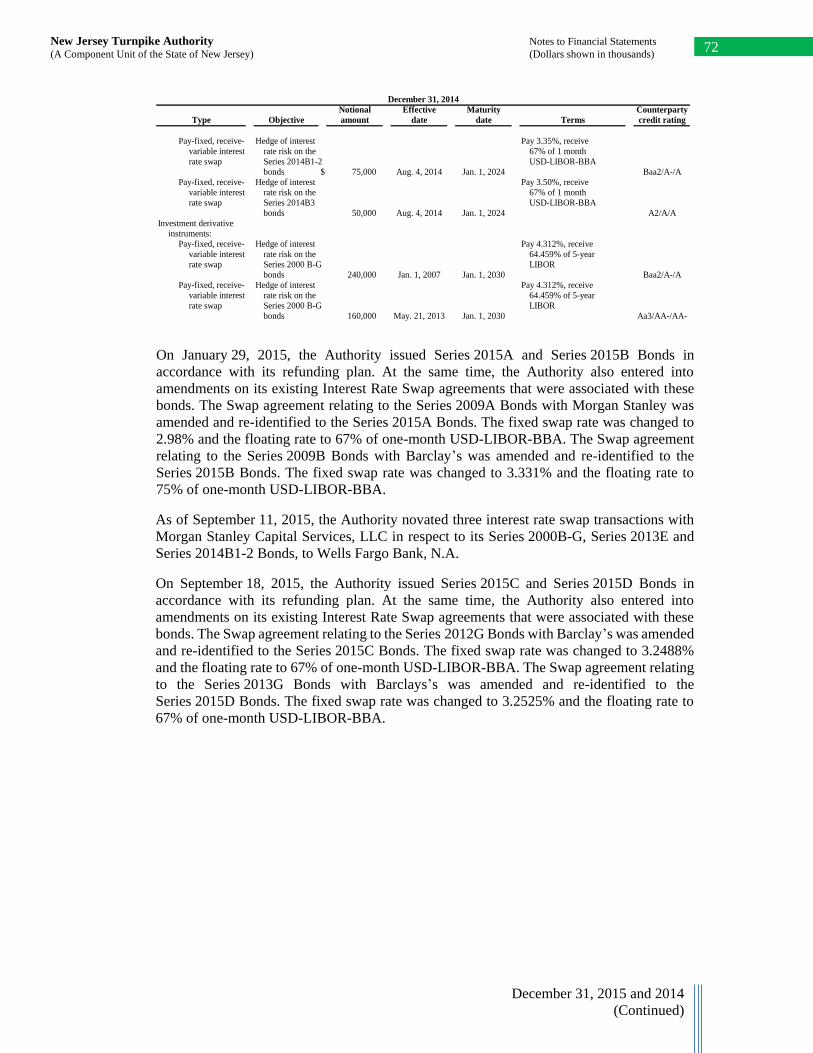
New Jersey Turnpike Authority Notes to Financial Statements
(A Component Unit of the State of New Jersey) (Dollars shown in thousands) 72
December 31, 2015 and 2014
(Continued)
December 31, 2014
Notional Effective Maturity Counterparty
Type Objective amount date date Terms credit rating
Pay-fixed, receive- Hedge of interest Pay 3.35%, receivevariable interest rate risk on the 67% of 1 month
rate swap Series 2014B1-2 USD-LIBOR-BBAbonds $ 75,000 Aug. 4, 2014 Jan. 1, 2024 Baa2/A-/A
Pay-fixed, receive- Hedge of interest Pay 3.50%, receivevariable interest rate risk on the 67% of 1 monthrate swap Series 2014B3 USD-LIBOR-BBA
bonds 50,000 Aug. 4, 2014 Jan. 1, 2024 A2/A/AInvestment derivative
instruments:Pay-fixed, receive- Hedge of interest Pay 4.312%, receive
variable interest rate risk on the 64.459% of 5-yearrate swap Series 2000 B-G LIBOR
bonds 240,000 Jan. 1, 2007 Jan. 1, 2030 Baa2/A-/APay-fixed, receive- Hedge of interest Pay 4.312%, receive
variable interest rate risk on the 64.459% of 5-yearrate swap Series 2000 B-G LIBOR
bonds 160,000 May. 21, 2013 Jan. 1, 2030 Aa3/AA-/AA-
On January 29, 2015, the Authority issued Series 2015A and Series 2015B Bonds in
accordance with its refunding plan. At the same time, the Authority also entered into
amendments on its existing Interest Rate Swap agreements that were associated with these
bonds. The Swap agreement relating to the Series 2009A Bonds with Morgan Stanley was
amended and re-identified to the Series 2015A Bonds. The fixed swap rate was changed to
2.98% and the floating rate to 67% of one-month USD-LIBOR-BBA. The Swap agreement
relating to the Series 2009B Bonds with Barclay’s was amended and re-identified to the
Series 2015B Bonds. The fixed swap rate was changed to 3.331% and the floating rate to
75% of one-month USD-LIBOR-BBA.
As of September 11, 2015, the Authority novated three interest rate swap transactions with
Morgan Stanley Capital Services, LLC in respect to its Series 2000B-G, Series 2013E and
Series 2014B1-2 Bonds, to Wells Fargo Bank, N.A.
On September 18, 2015, the Authority issued Series 2015C and Series 2015D Bonds in
accordance with its refunding plan. At the same time, the Authority also entered into
amendments on its existing Interest Rate Swap agreements that were associated with these
bonds. The Swap agreement relating to the Series 2012G Bonds with Barclay’s was amended
and re-identified to the Series 2015C Bonds. The fixed swap rate was changed to 3.2488%
and the floating rate to 67% of one-month USD-LIBOR-BBA. The Swap agreement relating
to the Series 2013G Bonds with Barclays’s was amended and re-identified to the
Series 2015D Bonds. The fixed swap rate was changed to 3.2525% and the floating rate to
67% of one-month USD-LIBOR-BBA.
New Jersey Turnpike Authority Notes to Financial Statements
(A Component Unit of the State of New Jersey) (Dollars shown in thousands) 73
December 31, 2015 and 2014
(Continued)
On December 21, 2015, the Authority amended an interest rate swap transaction relating to
the Series 2013E-1 Bonds with Wells Fargo Bank, N.A. The fixed swap rate was changed to
3.305% and the floating rate to 67% of one-month USD-LIBOR-BBA. On December 23,
2015, the Authority issued Series 2015H Bonds in accordance with its refunding plan. The
Swap agreement relating to the Series 2013E-1 Bonds with Wells Fargo Bank, N.A. was
re-identified to the Series 2015H Bonds. Also on December 23, 2015, the Authority issued
Series 2015F Bonds and Series 2015G Bonds, in accordance with its refunding plan. The
Swap agreement relating to the Series 2013D-1 Bonds with Wells Fargo Bank, N.A. was re-
identified to the Series 2015F Bonds and the Swap agreement relating to the Series 2014B-1
Bonds with Wells Fargo Bank, N.A. was re-identified to the Series 2015G Bonds.
(a) Risks
Credit risk: The Authority is exposed to credit risk on derivative instruments that are
in asset positions. To minimize its exposure to loss related to credit risk, it is the
Authority’s policy to require counterparty collateral posting provisions in its derivative
instruments. These terms require full collateralization of the fair value of derivative
instruments in asset positions (net of the effect of applicable netting arrangements)
should the counterparty’s credit rating fall below BBB-as issued by Standard & Poor’s
or Baa3 as issued by Moody’s Investors Service. Collateral posted is to be in the form
of U.S. Treasury securities held by a third-party custodian. All of the Authority’s
derivative investments provide for the netting of the value of asset and liability
positions with the same counterparty upon termination. There were no derivative
instruments in asset positions as of December 31, 2015 and 2014, respectively.
Basis risk: The Authority is exposed to basis risk on its pay-fixed, receive-variable
interest rate swaps that hedge its Series 2000B-G, 2013D and 2013E bonds because
the variable-rate payments received by the Authority on these hedging derivative
instruments generally are based on a rate or index other than interest rates the Authority
pays on its hedged variable-rate debt, which is remarketed every 7 days. As of
December 31, 2015 and 2014, the weighted average interest rate on the Authority’s
hedged variable-rate debt is 0.53% and 0.34%, respectively, while 64.459% of USD
LIBOR is 1.05% and 1.18%, respectively, 73.2% of one-month LIBOR is 0.25% and
0.12%, respectively, 63% of LIBOR plus 20 basis points is 0.46% and 0.30%,
respectively.
Termination risk: The Authority or its counterparties may terminate a derivative
instrument if the other party fails to perform under the terms of the contract. If at the
time of termination, a hedging derivative instrument is in a liability position, the
Authority would be liable to the counterparty for a payment equal to the liability,
subject to netting arrangements.
(b) Contingencies
All of the Authority’s derivative instruments, except for the $101,765, $100,000,
$25,000 and $48,235 notional value swaps that hedge the Series 2013E, Series 2014B,
2015G, and 2015H bonds, respectively, include provisions that require the Authority
to post collateral in the event its credit rating falls below BBB as issued by Standard &
Poor’s or Baa2 as issued by Moody’s Investors Service. For the Series 2013E, 2014B,
2015G and 2015H Swap Agreements only, the rating on the respective Series 2013E,
Series 2014B, 2015G, and 2015H Bonds would have to drop below A2 from Moody’s,
below A from S&P and below A from Fitch for any collateral posting requirements to
be imposed upon the Authority under such agreements. The collateral posted is to be
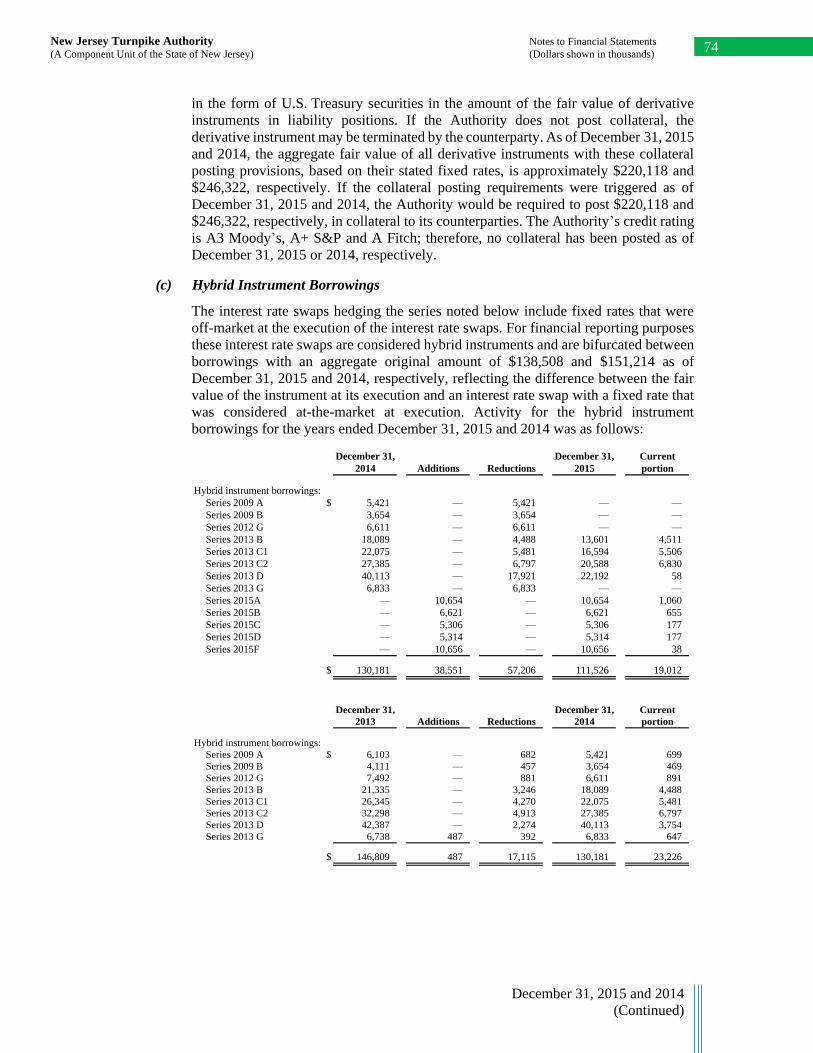
New Jersey Turnpike Authority Notes to Financial Statements
(A Component Unit of the State of New Jersey) (Dollars shown in thousands) 74
December 31, 2015 and 2014
(Continued)
in the form of U.S. Treasury securities in the amount of the fair value of derivative
instruments in liability positions. If the Authority does not post collateral, the
derivative instrument may be terminated by the counterparty. As of December 31, 2015
and 2014, the aggregate fair value of all derivative instruments with these collateral
posting provisions, based on their stated fixed rates, is approximately $220,118 and
$246,322, respectively. If the collateral posting requirements were triggered as of
December 31, 2015 and 2014, the Authority would be required to post $220,118 and
$246,322, respectively, in collateral to its counterparties. The Authority’s credit rating
is A3 Moody’s, A+ S&P and A Fitch; therefore, no collateral has been posted as of
December 31, 2015 or 2014, respectively.
(c) Hybrid Instrument Borrowings
The interest rate swaps hedging the series noted below include fixed rates that were
off-market at the execution of the interest rate swaps. For financial reporting purposes
these interest rate swaps are considered hybrid instruments and are bifurcated between
borrowings with an aggregate original amount of $138,508 and $151,214 as of
December 31, 2015 and 2014, respectively, reflecting the difference between the fair
value of the instrument at its execution and an interest rate swap with a fixed rate that
was considered at-the-market at execution. Activity for the hybrid instrument
borrowings for the years ended December 31, 2015 and 2014 was as follows:
December 31, December 31, Current
2014 Additions Reductions 2015 portion
Hybrid instrument borrowings:
Series 2009 A $ 5,421 — 5,421 — —
Series 2009 B 3,654 — 3,654 — —
Series 2012 G 6,611 — 6,611 — —
Series 2013 B 18,089 — 4,488 13,601 4,511
Series 2013 C1 22,075 — 5,481 16,594 5,506
Series 2013 C2 27,385 — 6,797 20,588 6,830
Series 2013 D 40,113 — 17,921 22,192 58
Series 2013 G 6,833 — 6,833 — —
Series 2015A — 10,654 — 10,654 1,060
Series 2015B — 6,621 — 6,621 655
Series 2015C — 5,306 — 5,306 177
Series 2015D — 5,314 — 5,314 177
Series 2015F — 10,656 — 10,656 38
$ 130,181 38,551 57,206 111,526 19,012
December 31, December 31, Current
2013 Additions Reductions 2014 portion
Hybrid instrument borrowings:
Series 2009 A $ 6,103 — 682 5,421 699
Series 2009 B 4,111 — 457 3,654 469
Series 2012 G 7,492 — 881 6,611 891
Series 2013 B 21,335 — 3,246 18,089 4,488
Series 2013 C1 26,345 — 4,270 22,075 5,481
Series 2013 C2 32,298 — 4,913 27,385 6,797
Series 2013 D 42,387 — 2,274 40,113 3,754
Series 2013 G 6,738 487 392 6,833 647
$ 146,809 487 17,115 130,181 23,226
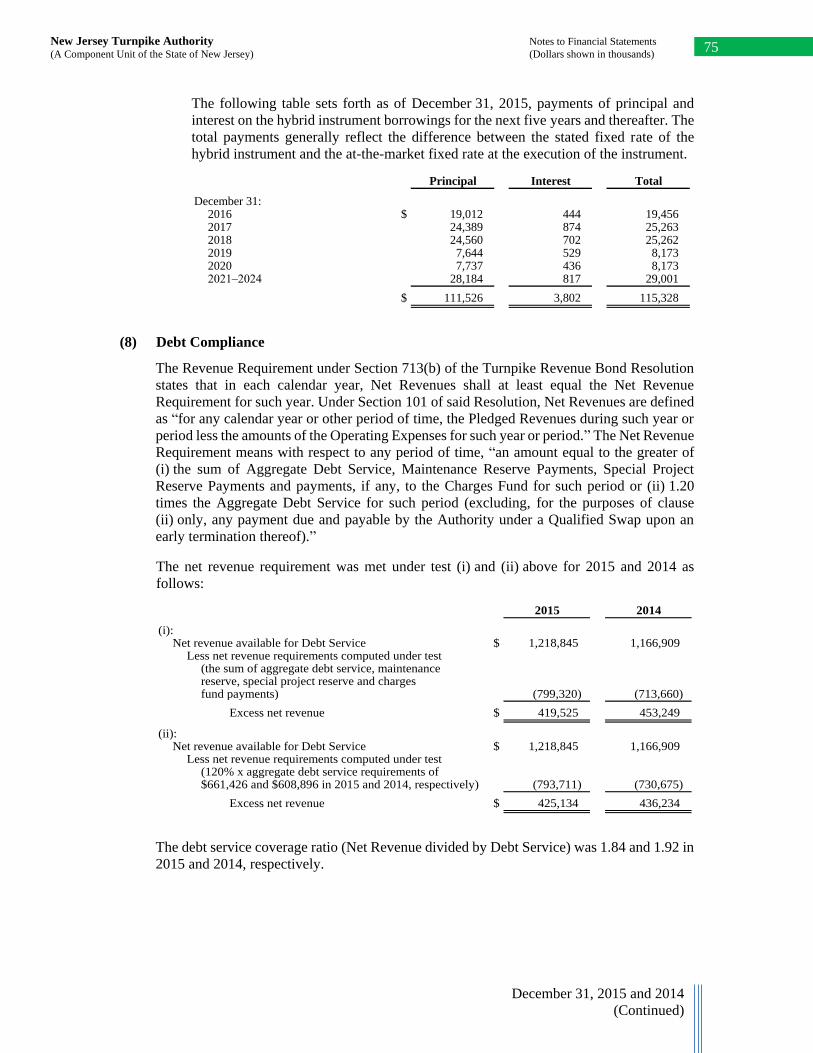
New Jersey Turnpike Authority Notes to Financial Statements
(A Component Unit of the State of New Jersey) (Dollars shown in thousands) 75
December 31, 2015 and 2014
(Continued)
The following table sets forth as of December 31, 2015, payments of principal and
interest on the hybrid instrument borrowings for the next five years and thereafter. The
total payments generally reflect the difference between the stated fixed rate of the
hybrid instrument and the at-the-market fixed rate at the execution of the instrument.
Principal Interest Total
December 31:2016 $ 19,012 444 19,456 2017 24,389 874 25,263 2018 24,560 702 25,262 2019 7,644 529 8,173 2020 7,737 436 8,173 2021–2024 28,184 817 29,001
$ 111,526 3,802 115,328
(8) Debt Compliance
The Revenue Requirement under Section 713(b) of the Turnpike Revenue Bond Resolution
states that in each calendar year, Net Revenues shall at least equal the Net Revenue
Requirement for such year. Under Section 101 of said Resolution, Net Revenues are defined
as “for any calendar year or other period of time, the Pledged Revenues during such year or
period less the amounts of the Operating Expenses for such year or period.” The Net Revenue
Requirement means with respect to any period of time, “an amount equal to the greater of
(i) the sum of Aggregate Debt Service, Maintenance Reserve Payments, Special Project
Reserve Payments and payments, if any, to the Charges Fund for such period or (ii) 1.20
times the Aggregate Debt Service for such period (excluding, for the purposes of clause
(ii) only, any payment due and payable by the Authority under a Qualified Swap upon an
early termination thereof).”
The net revenue requirement was met under test (i) and (ii) above for 2015 and 2014 as
follows:
2015 2014
(i):Net revenue available for Debt Service $ 1,218,845 1,166,909
Less net revenue requirements computed under test(the sum of aggregate debt service, maintenancereserve, special project reserve and chargesfund payments) (799,320) (713,660)
Excess net revenue $ 419,525 453,249
(ii):Net revenue available for Debt Service $ 1,218,845 1,166,909
Less net revenue requirements computed under test(120% x aggregate debt service requirements of$661,426 and $608,896 in 2015 and 2014, respectively) (793,711) (730,675)
Excess net revenue $ 425,134 436,234
The debt service coverage ratio (Net Revenue divided by Debt Service) was 1.84 and 1.92 in
2015 and 2014, respectively.
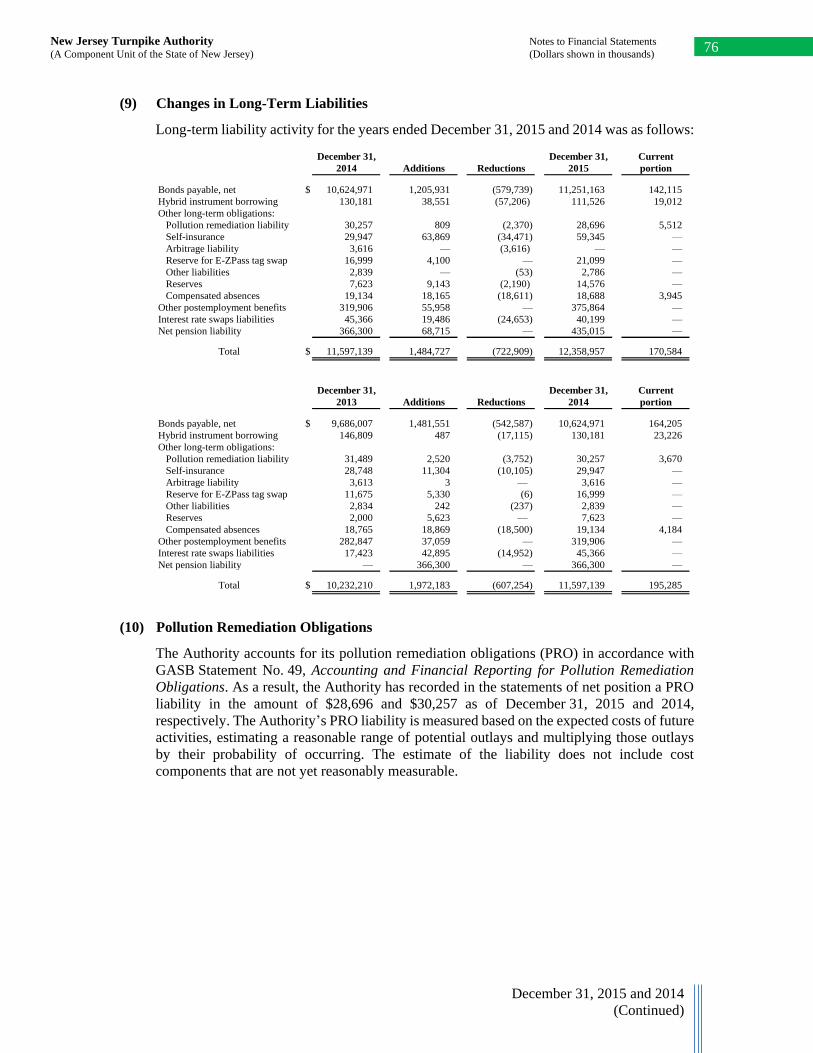
New Jersey Turnpike Authority Notes to Financial Statements
(A Component Unit of the State of New Jersey) (Dollars shown in thousands) 76
December 31, 2015 and 2014
(Continued)
(9) Changes in Long-Term Liabilities
Long-term liability activity for the years ended December 31, 2015 and 2014 was as follows:
December 31, December 31, Current
2014 Additions Reductions 2015 portion
Bonds payable, net $ 10,624,971 1,205,931 (579,739) 11,251,163 142,115
Hybrid instrument borrowing 130,181 38,551 (57,206) 111,526 19,012
Other long-term obligations:
Pollution remediation liability 30,257 809 (2,370) 28,696 5,512
Self-insurance 29,947 63,869 (34,471) 59,345 —
Arbitrage liability 3,616 — (3,616) — —
Reserve for E-ZPass tag swap 16,999 4,100 — 21,099 —
Other liabilities 2,839 — (53) 2,786 —
Reserves 7,623 9,143 (2,190) 14,576 —
Compensated absences 19,134 18,165 (18,611) 18,688 3,945
Other postemployment benefits 319,906 55,958 — 375,864 —
Interest rate swaps liabilities 45,366 19,486 (24,653) 40,199 —
Net pension liability 366,300 68,715 — 435,015 —
Total $ 11,597,139 1,484,727 (722,909) 12,358,957 170,584
December 31, December 31, Current
2013 Additions Reductions 2014 portion
Bonds payable, net $ 9,686,007 1,481,551 (542,587) 10,624,971 164,205
Hybrid instrument borrowing 146,809 487 (17,115) 130,181 23,226
Other long-term obligations:
Pollution remediation liability 31,489 2,520 (3,752) 30,257 3,670
Self-insurance 28,748 11,304 (10,105) 29,947 —
Arbitrage liability 3,613 3 — 3,616 —
Reserve for E-ZPass tag swap 11,675 5,330 (6) 16,999 —
Other liabilities 2,834 242 (237) 2,839 —
Reserves 2,000 5,623 — 7,623 —
Compensated absences 18,765 18,869 (18,500) 19,134 4,184
Other postemployment benefits 282,847 37,059 — 319,906 —
Interest rate swaps liabilities 17,423 42,895 (14,952) 45,366 —
Net pension liability — 366,300 — 366,300 —
Total $ 10,232,210 1,972,183 (607,254) 11,597,139 195,285
(10) Pollution Remediation Obligations
The Authority accounts for its pollution remediation obligations (PRO) in accordance with
GASB Statement No. 49, Accounting and Financial Reporting for Pollution Remediation
Obligations. As a result, the Authority has recorded in the statements of net position a PRO
liability in the amount of $28,696 and $30,257 as of December 31, 2015 and 2014,
respectively. The Authority’s PRO liability is measured based on the expected costs of future
activities, estimating a reasonable range of potential outlays and multiplying those outlays
by their probability of occurring. The estimate of the liability does not include cost
components that are not yet reasonably measurable.
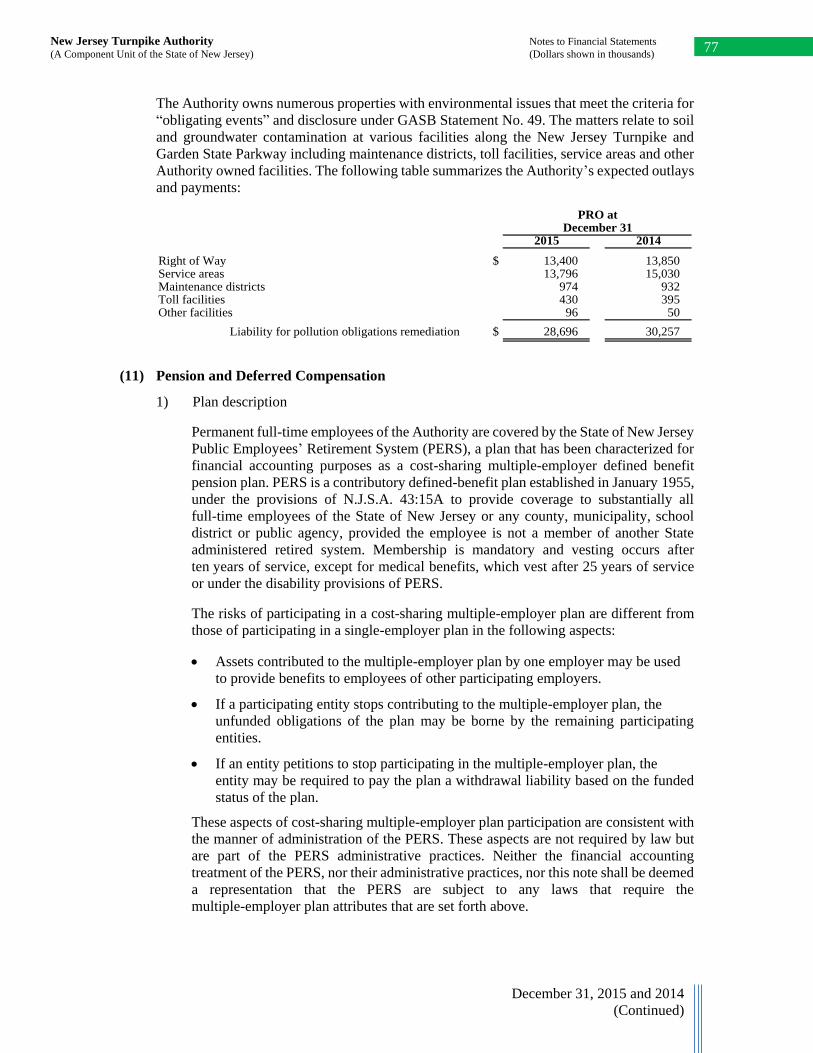
New Jersey Turnpike Authority Notes to Financial Statements
(A Component Unit of the State of New Jersey) (Dollars shown in thousands) 77
December 31, 2015 and 2014
(Continued)
The Authority owns numerous properties with environmental issues that meet the criteria for
“obligating events” and disclosure under GASB Statement No. 49. The matters relate to soil
and groundwater contamination at various facilities along the New Jersey Turnpike and
Garden State Parkway including maintenance districts, toll facilities, service areas and other
Authority owned facilities. The following table summarizes the Authority’s expected outlays
and payments:
PRO atDecember 31
2015 2014
Right of Way $ 13,400 13,850 Service areas 13,796 15,030 Maintenance districts 974 932 Toll facilities 430 395 Other facilities 96 50
Liability for pollution obligations remediation $ 28,696 30,257
(11) Pension and Deferred Compensation
1) Plan description
Permanent full-time employees of the Authority are covered by the State of New Jersey
Public Employees’ Retirement System (PERS), a plan that has been characterized for
financial accounting purposes as a cost-sharing multiple-employer defined benefit
pension plan. PERS is a contributory defined-benefit plan established in January 1955,
under the provisions of N.J.S.A. 43:15A to provide coverage to substantially all
full-time employees of the State of New Jersey or any county, municipality, school
district or public agency, provided the employee is not a member of another State
administered retired system. Membership is mandatory and vesting occurs after
ten years of service, except for medical benefits, which vest after 25 years of service
or under the disability provisions of PERS.
The risks of participating in a cost-sharing multiple-employer plan are different from
those of participating in a single-employer plan in the following aspects:
Assets contributed to the multiple-employer plan by one employer may be used
to provide benefits to employees of other participating employers.
If a participating entity stops contributing to the multiple-employer plan, the
unfunded obligations of the plan may be borne by the remaining participating
entities.
If an entity petitions to stop participating in the multiple-employer plan, the
entity may be required to pay the plan a withdrawal liability based on the funded
status of the plan.
These aspects of cost-sharing multiple-employer plan participation are consistent with
the manner of administration of the PERS. These aspects are not required by law but
are part of the PERS administrative practices. Neither the financial accounting
treatment of the PERS, nor their administrative practices, nor this note shall be deemed
a representation that the PERS are subject to any laws that require the
multiple-employer plan attributes that are set forth above.
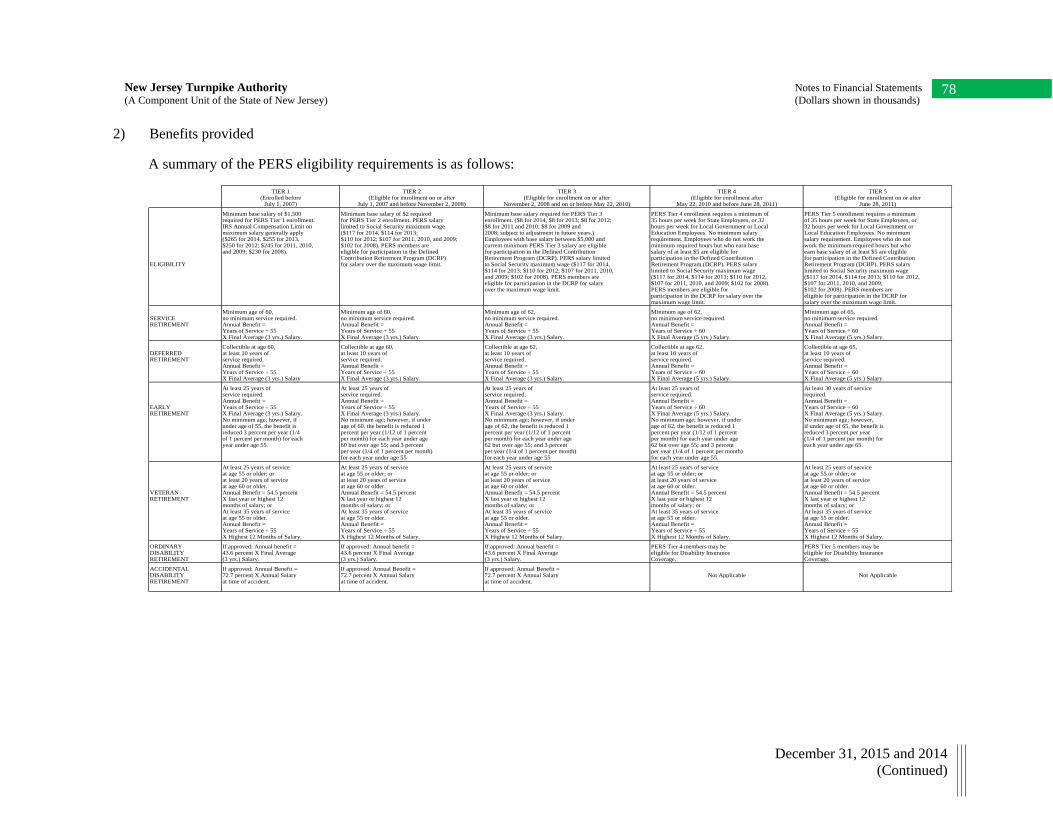
New Jersey Turnpike Authority Notes to Financial Statements
(A Component Unit of the State of New Jersey) (Dollars shown in thousands) 82 78
December 31, 2015 and 2014
(Continued)
2) Benefits provided
A summary of the PERS eligibility requirements is as follows:
TIER 1 TIER 2 TIER 3 TIER 4 TIER 5(Enrolled before (Eligible for enrollment on or after (Eligible for enrollment on or after (Eligible for enrollment after (Eligible for enrollment on or after
July 1, 2007) July 1, 2007 and before November 2, 2008) November 2, 2008 and on or before May 22, 2010) May 22, 2010 and before June 28, 2011) June 28, 2011)
Minimum base salary of $1,500 Minimum base salary of $2 required Minimum base salary required for PERS Tier 3 PERS Tier 4 enrollment requires a minimum of PERS Tier 5 enrollment requires a minimumrequired for PERS Tier 1 enrollment. for PERS Tier 2 enrollment. PERS salary enrollment. ($8 for 2014, $8 for 2013; $8 for 2012; 35 hours per week for State Employees, or 32 of 35 hours per week for State Employees, orIRS Annual Compensation Limit on limited to Social Security maximum wage $8 for 2011 and 2010; $8 for 2009 and hours per week for Local Government or Local 32 hours per week for Local Government ormaximum salary generally apply ($117 for 2014, $114 for 2013; 2008; subject to adjustment in future years.) Education Employees. No minimum salary Local Education Employees. No minimum($265 for 2014, $255 for 2013, $110 for 2012; $107 for 2011, 2010, and 2009; Employees with base salary between $5,000 and requirement. Employees who do not work the salary requirement. Employees who do not$250 for 2012; $245 for 2011, 2010, $102 for 2008). PERS members are current minimum PERS Tier 3 salary are eligible minimum required hours but who earn base work the minimum required hours but whoand 2009; $230 for 2008). eligible for participation in the Defined for participation in the Defined Contribution salary of at least $5 are eligible for earn base salary of at least $5 are eligible
Contribution Retirement Program (DCRP) Retirement Program (DCRP). PERS salary limited participation in the Defined Contribution for participation in the Defined ContributionELIGIBILITY for salary over the maximum wage limit. to Social Security maximum wage ($117 for 2014, Retirement Program (DCRP). PERS salary Retirement Program (DCRP). PERS salary
$114 for 2013; $110 for 2012; $107 for 2011, 2010, limited to Social Security maximum wage limited to Social Security maximum wageand 2009; $102 for 2008). PERS members are ($117 for 2014, $114 for 2013; $110 for 2012, ($117 for 2014, $114 for 2013; $110 for 2012,eligible for participation in the DCRP for salary $107 for 2011, 2010, and 2009; $102 for 2008). $107 for 2011, 2010, and 2009;over the maximum wage limit. PERS members are eligible for $102 for 2008). PERS members are
participation in the DCRP for salary over the eligible for participation in the DCRP formaximum wage limit. salary over the maximum wage limit.
Minimum age of 60, Minimum age of 60, Minimum age of 62, Minimum age of 62, Minimum age of 65,SERVICE no minimum service required. no minimum service required. no minimum service required. no minimum service required. no minimum service required.RETIREMENT Annual Benefit = Annual Benefit = Annual Benefit = Annual Benefit = Annual Benefit =
Years of Service ÷ 55 Years of Service ÷ 55 Years of Service ÷ 55 Years of Service ÷ 60 Years of Service ÷ 60X Final Average (3 yrs.) Salary. X Final Average (3 yrs.) Salary. X Final Average (3 yrs.) Salary. X Final Average (5 yrs.) Salary. X Final Average (5 yrs.) Salary.
Collectible at age 60, Collectible at age 60, Collectible at age 62, Collectible at age 62, Collectible at age 65,DEFERRED at least 10 years of at least 10 years of at least 10 years of at least 10 years of at least 10 years ofRETIREMENT service required. service required. service required. service required. service required.
Annual Benefit = Annual Benefit = Annual Benefit = Annual Benefit = Annual Benefit =Years of Service ÷ 55 Years of Service ÷ 55 Years of Service ÷ 55 Years of Service ÷ 60 Years of Service ÷ 60X Final Average (3 yrs.) Salary X Final Average (3 yrs.) Salary. X Final Average (3 yrs.) Salary. X Final Average (5 yrs.) Salary. X Final Average (5 yrs.) Salary.
At least 25 years of At least 25 years of At least 25 years of At least 25 years of At least 30 years of serviceservice required. service required. service required. service required. required.Annual Benefit = Annual Benefit = Annual Benefit = Annual Benefit = Annual Benefit =
EARLY Years of Service ÷ 55 Years of Service ÷ 55 Years of Service ÷ 55 Years of Service ÷ 60 Years of Service ÷ 60RETIREMENT X Final Average (3 yrs.) Salary. X Final Average (3 yrs.) Salary. X Final Average (3 yrs.) Salary. X Final Average (5 yrs.) Salary. X Final Average (5 yrs.) Salary.
No minimum age; however, if No minimum age; however, if under No minimum age; however, if under No minimum age; however, if under No minimum age; however,under age of 55, the benefit is age of 60, the benefit is reduced 1 age of 62, the benefit is reduced 1 age of 62, the benefit is reduced 1 if under age of 65, the benefit isreduced 3 percent per year (1/4 percent per year (1/12 of 1 percent percent per year (1/12 of 1 percent percent per year (1/12 of 1 percent reduced 3 percent per yearof 1 percent per month) for each per month) for each year under age per month) for each year under age per month) for each year under age (1/4 of 1 percent per month) foryear under age 55. 60 but over age 55; and 3 percent 62 but over age 55; and 3 percent 62 but over age 55; and 3 percent each year under age 65.
per year (1/4 of 1 percent per month) per year (1/4 of 1 percent per month) per year (1/4 of 1 percent per month)for each year under age 55 for each year under age 55 for each year under age 55.
At least 25 years of service At least 25 years of service At least 25 years of service At least 25 years of service At least 25 years of serviceat age 55 or older; or at age 55 or older; or at age 55 or older; or at age 55 or older; or at age 55 or older; orat least 20 years of service at least 20 years of service at least 20 years of service at least 20 years of service at least 20 years of serviceat age 60 or older. at age 60 or older. at age 60 or older. at age 60 or older. at age 60 or older.
VETERAN Annual Benefit = 54.5 percent Annual Benefit = 54.5 percent Annual Benefit = 54.5 percent Annual Benefit = 54.5 percent Annual Benefit = 54.5 percentRETIREMENT X last year or highest 12 X last year or highest 12 X last year or highest 12 X last year or highest 12 X last year or highest 12
months of salary; or months of salary; or months of salary; or months of salary; or months of salary; orAt least 35 years of service At least 35 years of service At least 35 years of service At least 35 years of service At least 35 years of serviceat age 55 or older. at age 55 or older. at age 55 or older. at age 55 or older. at age 55 or older.Annual Benefit = Annual Benefit = Annual Benefit = Annual Benefit = Annual Benefit =Years of Service ÷ 55 Years of Service ÷ 55 Years of Service ÷ 55 Years of Service ÷ 55 Years of Service ÷ 55X Highest 12 Months of Salary. X Highest 12 Months of Salary. X Highest 12 Months of Salary. X Highest 12 Months of Salary. X Highest 12 Months of Salary.
ORDINARY If approved: Annual benefit = If approved: Annual benefit = If approved: Annual benefit = PERS Tier 4 members may be PERS Tier 5 members may beDISABILITY 43.6 percent X Final Average 43.6 percent X Final Average 43.6 percent X Final Average eligible for Disability Insurance eligible for Disability InsuranceRETIREMENT (3 yrs.) Salary. (3 yrs.) Salary. (3 yrs.) Salary. Coverage. Coverage.
ACCIDENTAL If approved: Annual Benefit = If approved: Annual Benefit = If approved: Annual Benefit =DISABILITY 72.7 percent X Annual Salary 72.7 percent X Annual Salary 72.7 percent X Annual Salary Not Applicable Not ApplicableRETIREMENT at time of accident. at time of accident. at time of accident.
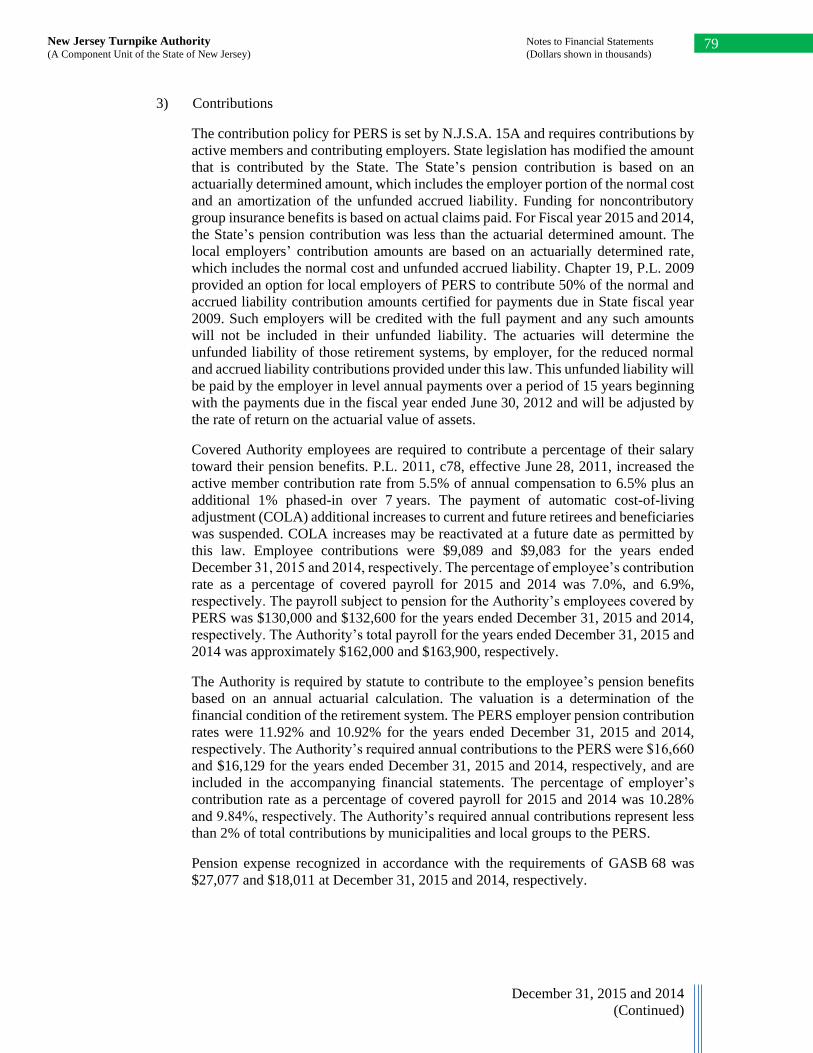
79 New Jersey Turnpike Authority Notes to Financial Statements
(A Component Unit of the State of New Jersey) (Dollars shown in thousands)
December 31, 2015 and 2014
(Continued)
3) Contributions
The contribution policy for PERS is set by N.J.S.A. 15A and requires contributions by
active members and contributing employers. State legislation has modified the amount
that is contributed by the State. The State’s pension contribution is based on an
actuarially determined amount, which includes the employer portion of the normal cost
and an amortization of the unfunded accrued liability. Funding for noncontributory
group insurance benefits is based on actual claims paid. For Fiscal year 2015 and 2014,
the State’s pension contribution was less than the actuarial determined amount. The
local employers’ contribution amounts are based on an actuarially determined rate,
which includes the normal cost and unfunded accrued liability. Chapter 19, P.L. 2009
provided an option for local employers of PERS to contribute 50% of the normal and
accrued liability contribution amounts certified for payments due in State fiscal year
2009. Such employers will be credited with the full payment and any such amounts
will not be included in their unfunded liability. The actuaries will determine the
unfunded liability of those retirement systems, by employer, for the reduced normal
and accrued liability contributions provided under this law. This unfunded liability will
be paid by the employer in level annual payments over a period of 15 years beginning
with the payments due in the fiscal year ended June 30, 2012 and will be adjusted by
the rate of return on the actuarial value of assets.
Covered Authority employees are required to contribute a percentage of their salary
toward their pension benefits. P.L. 2011, c78, effective June 28, 2011, increased the
active member contribution rate from 5.5% of annual compensation to 6.5% plus an
additional 1% phased-in over 7 years. The payment of automatic cost-of-living
adjustment (COLA) additional increases to current and future retirees and beneficiaries
was suspended. COLA increases may be reactivated at a future date as permitted by
this law. Employee contributions were $9,089 and $9,083 for the years ended
December 31, 2015 and 2014, respectively. The percentage of employee’s contribution
rate as a percentage of covered payroll for 2015 and 2014 was 7.0%, and 6.9%,
respectively. The payroll subject to pension for the Authority’s employees covered by
PERS was $130,000 and $132,600 for the years ended December 31, 2015 and 2014,
respectively. The Authority’s total payroll for the years ended December 31, 2015 and
2014 was approximately $162,000 and $163,900, respectively.
The Authority is required by statute to contribute to the employee’s pension benefits
based on an annual actuarial calculation. The valuation is a determination of the
financial condition of the retirement system. The PERS employer pension contribution
rates were 11.92% and 10.92% for the years ended December 31, 2015 and 2014,
respectively. The Authority’s required annual contributions to the PERS were $16,660
and $16,129 for the years ended December 31, 2015 and 2014, respectively, and are
included in the accompanying financial statements. The percentage of employer’s
contribution rate as a percentage of covered payroll for 2015 and 2014 was 10.28%
and 9.84%, respectively. The Authority’s required annual contributions represent less
than 2% of total contributions by municipalities and local groups to the PERS.
Pension expense recognized in accordance with the requirements of GASB 68 was
$27,077 and $18,011 at December 31, 2015 and 2014, respectively.
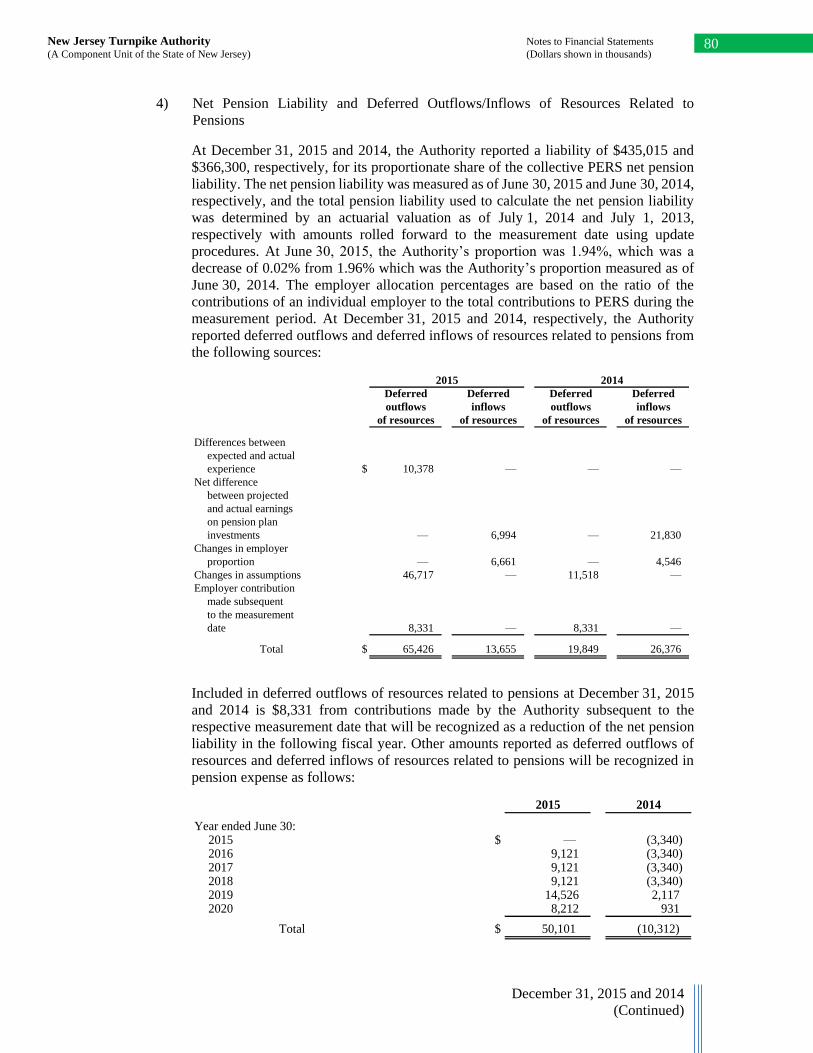
80 New Jersey Turnpike Authority Notes to Financial Statements
(A Component Unit of the State of New Jersey) (Dollars shown in thousands)
December 31, 2015 and 2014
(Continued)
4) Net Pension Liability and Deferred Outflows/Inflows of Resources Related to
Pensions
At December 31, 2015 and 2014, the Authority reported a liability of $435,015 and
$366,300, respectively, for its proportionate share of the collective PERS net pension
liability. The net pension liability was measured as of June 30, 2015 and June 30, 2014,
respectively, and the total pension liability used to calculate the net pension liability
was determined by an actuarial valuation as of July 1, 2014 and July 1, 2013,
respectively with amounts rolled forward to the measurement date using update
procedures. At June 30, 2015, the Authority’s proportion was 1.94%, which was a
decrease of 0.02% from 1.96% which was the Authority’s proportion measured as of
June 30, 2014. The employer allocation percentages are based on the ratio of the
contributions of an individual employer to the total contributions to PERS during the
measurement period. At December 31, 2015 and 2014, respectively, the Authority
reported deferred outflows and deferred inflows of resources related to pensions from
the following sources:
2015 2014
Deferred Deferred Deferred Deferred
outflows inflows outflows inflows
of resources of resources of resources of resources
Differences between
expected and actual
experience $ 10,378 — — —
Net difference
between projected
and actual earnings
on pension plan
investments — 6,994 — 21,830
Changes in employer
proportion — 6,661 — 4,546
Changes in assumptions 46,717 — 11,518 —
Employer contribution
made subsequent
to the measurement
date 8,331 — 8,331 —
Total $ 65,426 13,655 19,849 26,376
Included in deferred outflows of resources related to pensions at December 31, 2015
and 2014 is $8,331 from contributions made by the Authority subsequent to the
respective measurement date that will be recognized as a reduction of the net pension
liability in the following fiscal year. Other amounts reported as deferred outflows of
resources and deferred inflows of resources related to pensions will be recognized in
pension expense as follows:
2015 2014
Year ended June 30:2015 $ — (3,340) 2016 9,121 (3,340) 2017 9,121 (3,340) 2018 9,121 (3,340) 2019 14,526 2,117 2020 8,212 931
Total $ 50,101 (10,312)
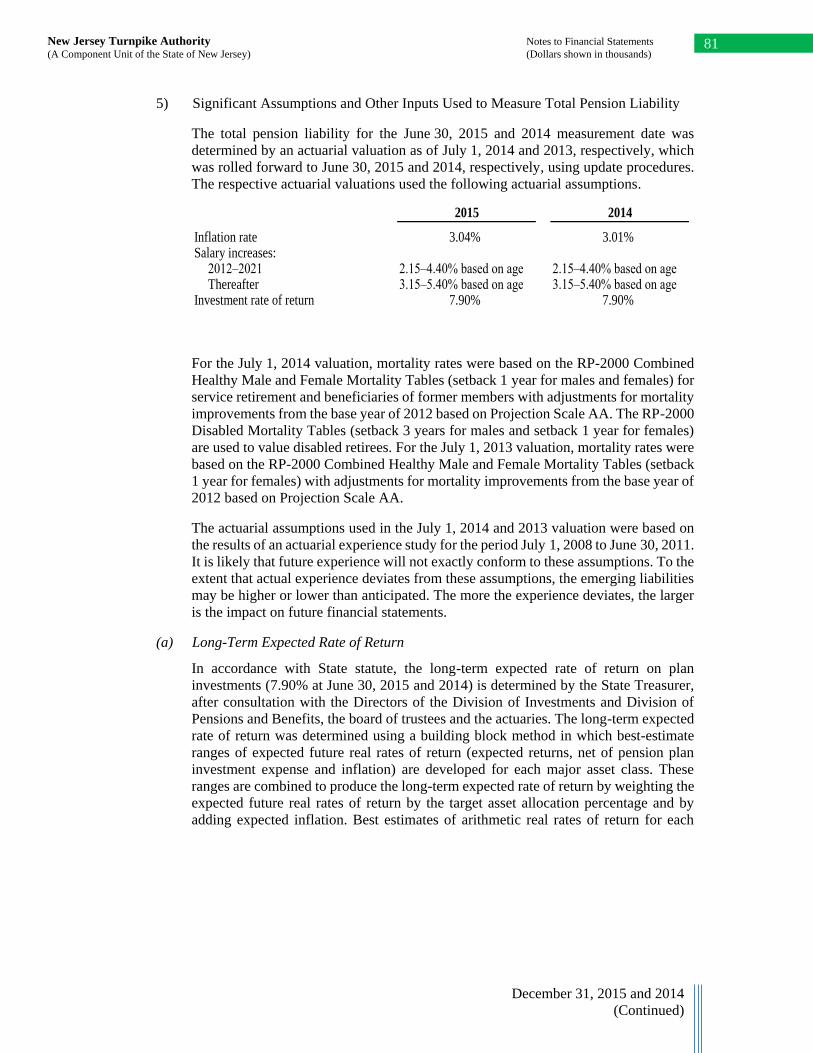
81 New Jersey Turnpike Authority Notes to Financial Statements
(A Component Unit of the State of New Jersey) (Dollars shown in thousands)
December 31, 2015 and 2014
(Continued)
5) Significant Assumptions and Other Inputs Used to Measure Total Pension Liability
The total pension liability for the June 30, 2015 and 2014 measurement date was
determined by an actuarial valuation as of July 1, 2014 and 2013, respectively, which
was rolled forward to June 30, 2015 and 2014, respectively, using update procedures.
The respective actuarial valuations used the following actuarial assumptions.
2015 2014
Inflation rate 3.04% 3.01%Salary increases:
2012–2021 2.15–4.40% based on age 2.15–4.40% based on ageThereafter 3.15–5.40% based on age 3.15–5.40% based on age
Investment rate of return 7.90% 7.90%
For the July 1, 2014 valuation, mortality rates were based on the RP-2000 Combined
Healthy Male and Female Mortality Tables (setback 1 year for males and females) for
service retirement and beneficiaries of former members with adjustments for mortality
improvements from the base year of 2012 based on Projection Scale AA. The RP-2000
Disabled Mortality Tables (setback 3 years for males and setback 1 year for females)
are used to value disabled retirees. For the July 1, 2013 valuation, mortality rates were
based on the RP-2000 Combined Healthy Male and Female Mortality Tables (setback
1 year for females) with adjustments for mortality improvements from the base year of
2012 based on Projection Scale AA.
The actuarial assumptions used in the July 1, 2014 and 2013 valuation were based on
the results of an actuarial experience study for the period July 1, 2008 to June 30, 2011.
It is likely that future experience will not exactly conform to these assumptions. To the
extent that actual experience deviates from these assumptions, the emerging liabilities
may be higher or lower than anticipated. The more the experience deviates, the larger
is the impact on future financial statements.
(a) Long-Term Expected Rate of Return
In accordance with State statute, the long-term expected rate of return on plan
investments (7.90% at June 30, 2015 and 2014) is determined by the State Treasurer,
after consultation with the Directors of the Division of Investments and Division of
Pensions and Benefits, the board of trustees and the actuaries. The long-term expected
rate of return was determined using a building block method in which best-estimate
ranges of expected future real rates of return (expected returns, net of pension plan
investment expense and inflation) are developed for each major asset class. These
ranges are combined to produce the long-term expected rate of return by weighting the
expected future real rates of return by the target asset allocation percentage and by
adding expected inflation. Best estimates of arithmetic real rates of return for each
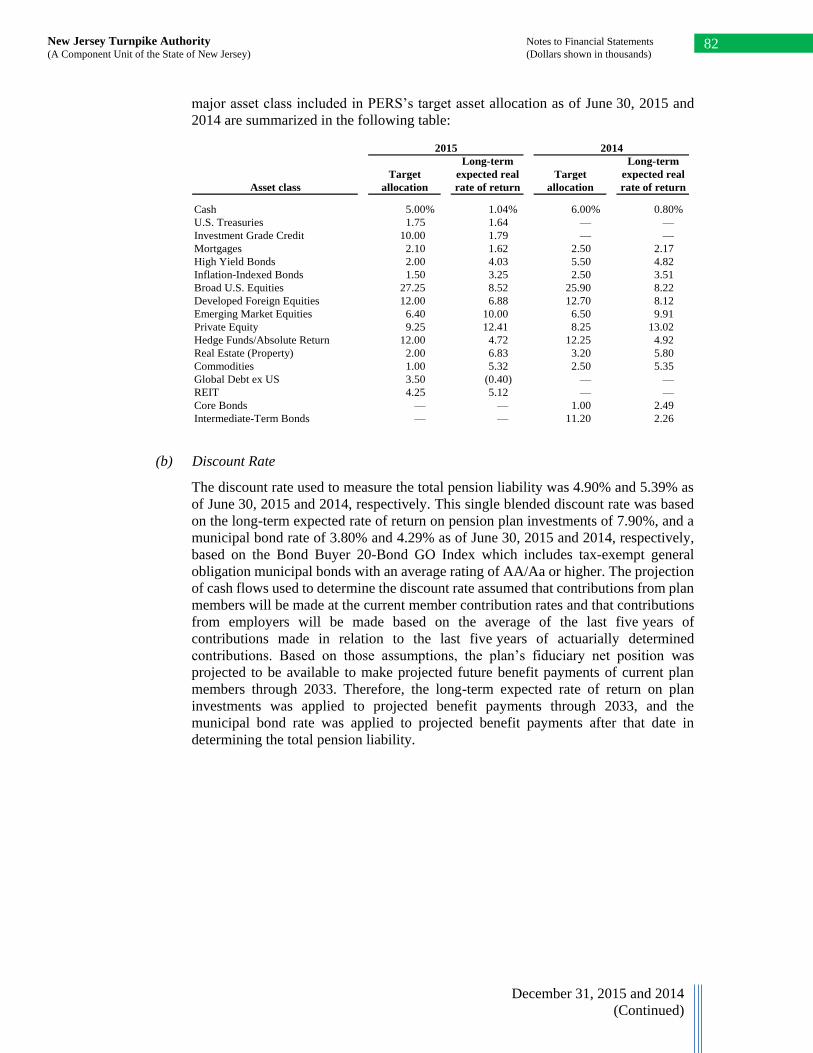
82 New Jersey Turnpike Authority Notes to Financial Statements
(A Component Unit of the State of New Jersey) (Dollars shown in thousands)
December 31, 2015 and 2014
(Continued)
major asset class included in PERS’s target asset allocation as of June 30, 2015 and
2014 are summarized in the following table:
2015 2014
Long-term Long-term
Target expected real Target expected real
Asset class allocation rate of return allocation rate of return
Cash 5.00% 1.04% 6.00% 0.80%
U.S. Treasuries 1.75 1.64 — —
Investment Grade Credit 10.00 1.79 — —
Mortgages 2.10 1.62 2.50 2.17
High Yield Bonds 2.00 4.03 5.50 4.82
Inflation-Indexed Bonds 1.50 3.25 2.50 3.51
Broad U.S. Equities 27.25 8.52 25.90 8.22
Developed Foreign Equities 12.00 6.88 12.70 8.12
Emerging Market Equities 6.40 10.00 6.50 9.91
Private Equity 9.25 12.41 8.25 13.02
Hedge Funds/Absolute Return 12.00 4.72 12.25 4.92
Real Estate (Property) 2.00 6.83 3.20 5.80
Commodities 1.00 5.32 2.50 5.35
Global Debt ex US 3.50 (0.40) — —
REIT 4.25 5.12 — —
Core Bonds — — 1.00 2.49
Intermediate-Term Bonds — — 11.20 2.26
(b) Discount Rate
The discount rate used to measure the total pension liability was 4.90% and 5.39% as
of June 30, 2015 and 2014, respectively. This single blended discount rate was based
on the long-term expected rate of return on pension plan investments of 7.90%, and a
municipal bond rate of 3.80% and 4.29% as of June 30, 2015 and 2014, respectively,
based on the Bond Buyer 20-Bond GO Index which includes tax-exempt general
obligation municipal bonds with an average rating of AA/Aa or higher. The projection
of cash flows used to determine the discount rate assumed that contributions from plan
members will be made at the current member contribution rates and that contributions
from employers will be made based on the average of the last five years of
contributions made in relation to the last five years of actuarially determined
contributions. Based on those assumptions, the plan’s fiduciary net position was
projected to be available to make projected future benefit payments of current plan
members through 2033. Therefore, the long-term expected rate of return on plan
investments was applied to projected benefit payments through 2033, and the
municipal bond rate was applied to projected benefit payments after that date in
determining the total pension liability.
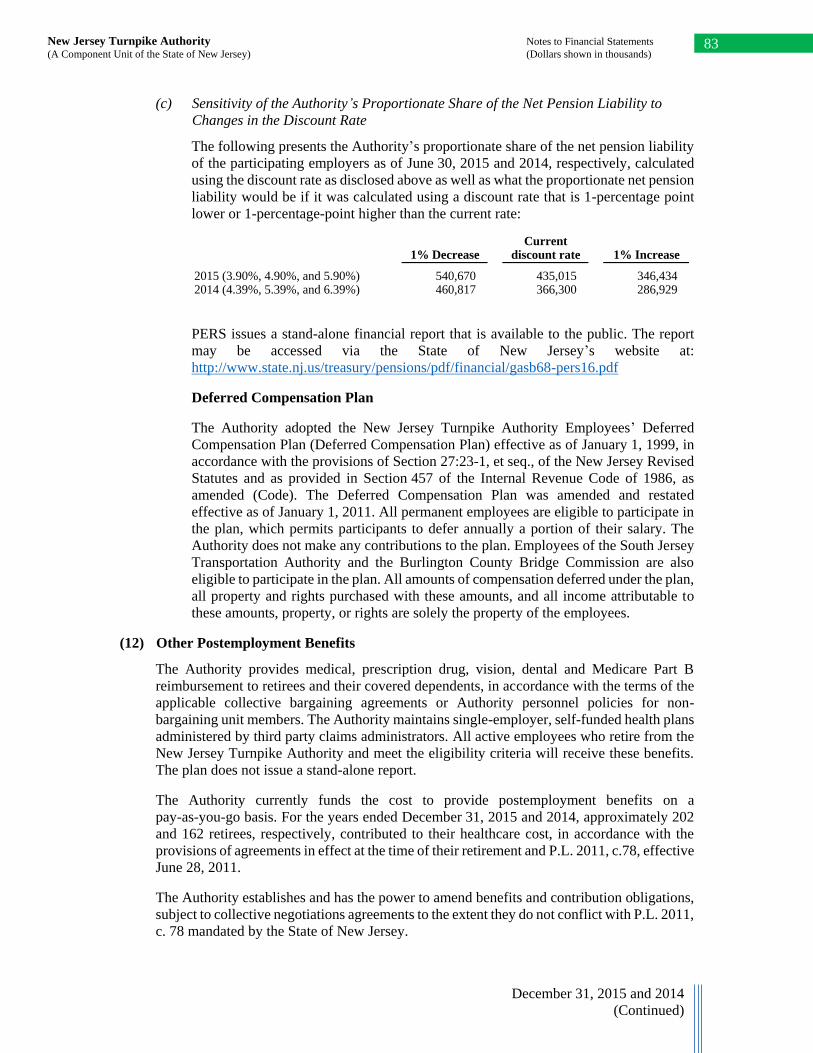
83 New Jersey Turnpike Authority Notes to Financial Statements
(A Component Unit of the State of New Jersey) (Dollars shown in thousands)
December 31, 2015 and 2014
(Continued)
(c) Sensitivity of the Authority’s Proportionate Share of the Net Pension Liability to
Changes in the Discount Rate
The following presents the Authority’s proportionate share of the net pension liability
of the participating employers as of June 30, 2015 and 2014, respectively, calculated
using the discount rate as disclosed above as well as what the proportionate net pension
liability would be if it was calculated using a discount rate that is 1-percentage point
lower or 1-percentage-point higher than the current rate:
Current1% Decrease discount rate 1% Increase
2015 (3.90%, 4.90%, and 5.90%) 540,670 435,015 346,434 2014 (4.39%, 5.39%, and 6.39%) 460,817 366,300 286,929
PERS issues a stand-alone financial report that is available to the public. The report
may be accessed via the State of New Jersey’s website at:
http://www.state.nj.us/treasury/pensions/pdf/financial/gasb68-pers16.pdf
Deferred Compensation Plan
The Authority adopted the New Jersey Turnpike Authority Employees’ Deferred
Compensation Plan (Deferred Compensation Plan) effective as of January 1, 1999, in
accordance with the provisions of Section 27:23-1, et seq., of the New Jersey Revised
Statutes and as provided in Section 457 of the Internal Revenue Code of 1986, as
amended (Code). The Deferred Compensation Plan was amended and restated
effective as of January 1, 2011. All permanent employees are eligible to participate in
the plan, which permits participants to defer annually a portion of their salary. The
Authority does not make any contributions to the plan. Employees of the South Jersey
Transportation Authority and the Burlington County Bridge Commission are also
eligible to participate in the plan. All amounts of compensation deferred under the plan,
all property and rights purchased with these amounts, and all income attributable to
these amounts, property, or rights are solely the property of the employees.
(12) Other Postemployment Benefits
The Authority provides medical, prescription drug, vision, dental and Medicare Part B
reimbursement to retirees and their covered dependents, in accordance with the terms of the
applicable collective bargaining agreements or Authority personnel policies for non-
bargaining unit members. The Authority maintains single-employer, self-funded health plans
administered by third party claims administrators. All active employees who retire from the
New Jersey Turnpike Authority and meet the eligibility criteria will receive these benefits.
The plan does not issue a stand-alone report.
The Authority currently funds the cost to provide postemployment benefits on a
pay-as-you-go basis. For the years ended December 31, 2015 and 2014, approximately 202
and 162 retirees, respectively, contributed to their healthcare cost, in accordance with the
provisions of agreements in effect at the time of their retirement and P.L. 2011, c.78, effective
June 28, 2011.
The Authority establishes and has the power to amend benefits and contribution obligations,
subject to collective negotiations agreements to the extent they do not conflict with P.L. 2011,
c. 78 mandated by the State of New Jersey.
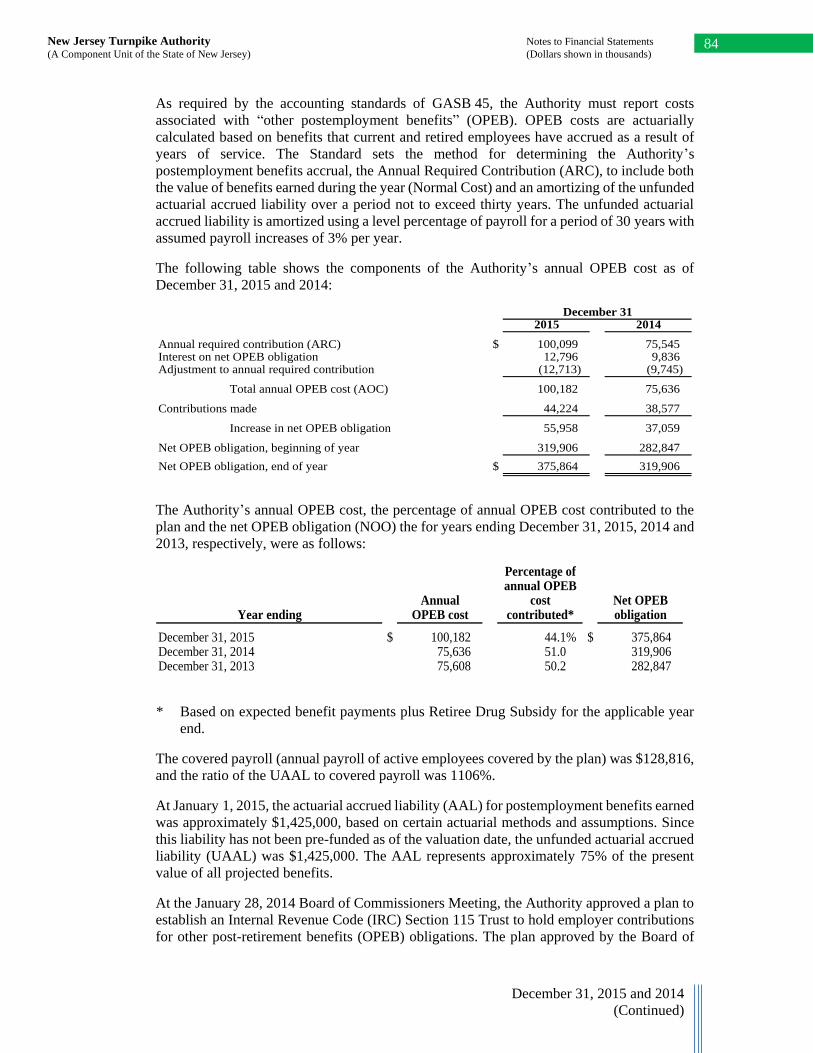
84 New Jersey Turnpike Authority Notes to Financial Statements
(A Component Unit of the State of New Jersey) (Dollars shown in thousands)
December 31, 2015 and 2014
(Continued)
As required by the accounting standards of GASB 45, the Authority must report costs
associated with “other postemployment benefits” (OPEB). OPEB costs are actuarially
calculated based on benefits that current and retired employees have accrued as a result of
years of service. The Standard sets the method for determining the Authority’s
postemployment benefits accrual, the Annual Required Contribution (ARC), to include both
the value of benefits earned during the year (Normal Cost) and an amortizing of the unfunded
actuarial accrued liability over a period not to exceed thirty years. The unfunded actuarial
accrued liability is amortized using a level percentage of payroll for a period of 30 years with
assumed payroll increases of 3% per year.
The following table shows the components of the Authority’s annual OPEB cost as of
December 31, 2015 and 2014:
December 312015 2014
Annual required contribution (ARC) $ 100,099 75,545 Interest on net OPEB obligation 12,796 9,836 Adjustment to annual required contribution (12,713) (9,745)
Total annual OPEB cost (AOC) 100,182 75,636
Contributions made 44,224 38,577
Increase in net OPEB obligation 55,958 37,059
Net OPEB obligation, beginning of year 319,906 282,847
Net OPEB obligation, end of year $ 375,864 319,906
The Authority’s annual OPEB cost, the percentage of annual OPEB cost contributed to the
plan and the net OPEB obligation (NOO) the for years ending December 31, 2015, 2014 and
2013, respectively, were as follows:
Percentage ofannual OPEB
Annual cost Net OPEBYear ending OPEB cost contributed* obligation
December 31, 2015 $ 100,182 44.1% $ 375,864 December 31, 2014 75,636 51.0 319,906 December 31, 2013 75,608 50.2 282,847
* Based on expected benefit payments plus Retiree Drug Subsidy for the applicable year
end.
The covered payroll (annual payroll of active employees covered by the plan) was $128,816,
and the ratio of the UAAL to covered payroll was 1106%.
At January 1, 2015, the actuarial accrued liability (AAL) for postemployment benefits earned
was approximately $1,425,000, based on certain actuarial methods and assumptions. Since
this liability has not been pre-funded as of the valuation date, the unfunded actuarial accrued
liability (UAAL) was $1,425,000. The AAL represents approximately 75% of the present
value of all projected benefits.
At the January 28, 2014 Board of Commissioners Meeting, the Authority approved a plan to
establish an Internal Revenue Code (IRC) Section 115 Trust to hold employer contributions
for other post-retirement benefits (OPEB) obligations. The plan approved by the Board of
85 New Jersey Turnpike Authority Notes to Financial Statements
(A Component Unit of the State of New Jersey) (Dollars shown in thousands)
December 31, 2015 and 2014
(Continued)
Commissioners includes (1) the establishment of an OPEB Committee comprised of
Authority personnel, (2) the issuance of Request For Proposals for an institutional trustee and
an investment manager/advisor for the plan assets, (3) the development of an OPEB Trust
agreement with outside counsel, (4) obtaining a private letter ruling from the Internal
Revenue Service, and (5) obtaining all necessary legal opinions from outside general counsel
and bond counsel. As of December 31, 2015, the trust has not been established
The actuarial valuation date is January 1, 2015. Actuarial valuations involve estimates of the
value of reported amounts and assumptions about the probability of events in the future.
Amounts determined regarding the funded status of the plan and the annual required
contributions of the employer are subject to continual revision as actual results are compared
to past expectations and new estimates are made about the future. The required schedule of
funding progress presented as required supplementary information provides multiyear trend
information that shows whether the actuarial value of plan assets is increasing or decreasing
over time relative to the actuarial accrued liability for benefits.
Actuarial Methods and Assumptions
Projections of benefits are based on the substantive plan (the plan as understood by the
employer and plan members) and include the types of benefits in force at the valuation date
and the pattern of sharing benefit costs between the employer and the plan members to that
point. Actuarial calculations reflect a long-term perspective and employ methods and
assumptions that are designed to reduce short-term volatility in actuarial accrued liabilities
and the actuarial value of assets.
For the most recent actuarial valuation dated January 1, 2015, the projected unit credit cost
method was used as the actuarial cost method. The actuarial assumptions included an
investment rate of return of 4%, and an annual healthcare cost trend rate of 9.5% medical and
grading down to an ultimate rate of 5% after 9 years. For prescription drug benefits, the initial
trend rate is 10.5%, decreasing to a 5.0% long-term trend rate after 11 years. For Medicare
Part B reimbursement, the trend rate is 5.0% and for dental benefits the trend is 3.0%. The
amortization method used was the level percentage of payroll, for a period of 30 years, with
an assumption that payroll increases by 3% per year.
The unfunded actuarial accrued liability (UAAL) as of January 1, 2015 is approximately
$1,425,271, an increase of $334,109 from the prior valuation UAAL of $1,091,162. This
increase is due to the demographic changes since last valuation, changes in premium rates on
which the retiree contributions are based, changes in demographic assumptions, and changes
in per capita claims and trends reflecting more recent claims experience and future
expectations.
The annual OPEB cost increased to $100,182 for the year ended December 31, 2015 from
$75,636 for the year ended December 31, 2014. The increase is due to increase in normal
cost as compared to prior valuation period, increase in amortization of UAAL and additional
adjustments for timing differences between cash and accrual accounting, to prevent double
counting of OPEB plan costs.
The required schedule of funding progress immediately following the notes to the financial
statements presents multi-year trend information as of January 1, 2015 and whether the
actuarial value of plan assets is increasing or decreasing over time relative to the actuarial
accrued liabilities for benefits.
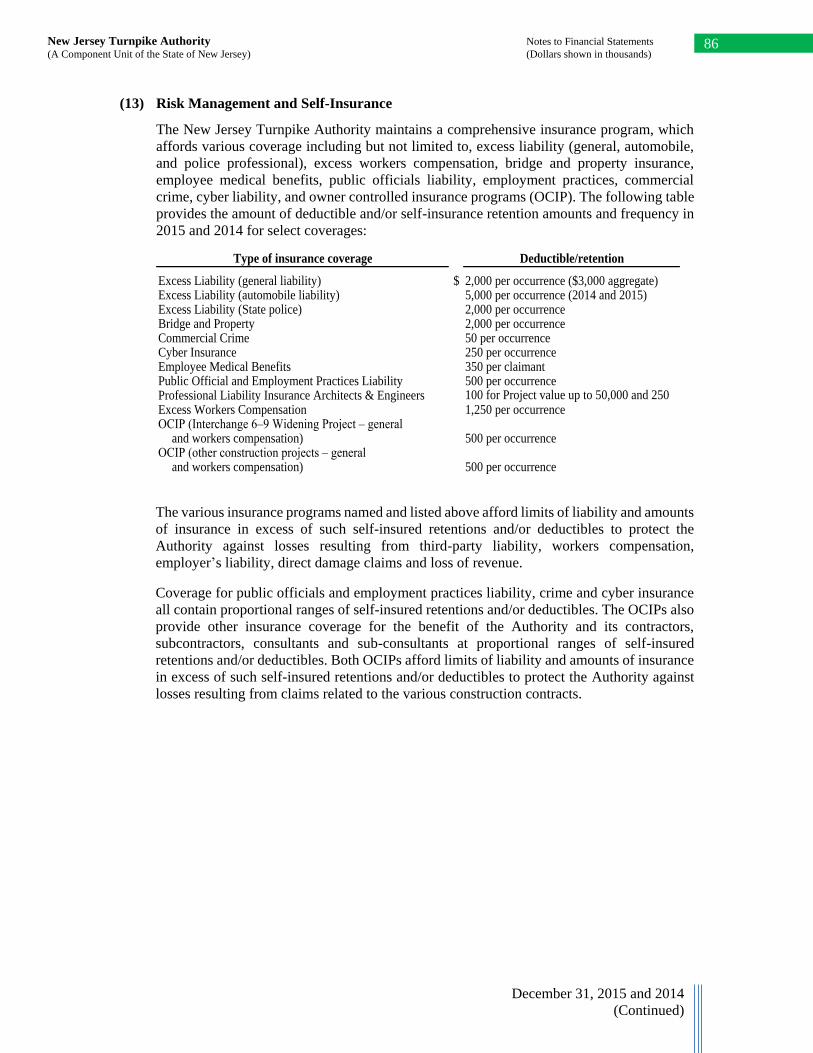
86 New Jersey Turnpike Authority Notes to Financial Statements
(A Component Unit of the State of New Jersey) (Dollars shown in thousands)
December 31, 2015 and 2014
(Continued)
(13) Risk Management and Self-Insurance
The New Jersey Turnpike Authority maintains a comprehensive insurance program, which
affords various coverage including but not limited to, excess liability (general, automobile,
and police professional), excess workers compensation, bridge and property insurance,
employee medical benefits, public officials liability, employment practices, commercial
crime, cyber liability, and owner controlled insurance programs (OCIP). The following table
provides the amount of deductible and/or self-insurance retention amounts and frequency in
2015 and 2014 for select coverages:
Type of insurance coverage Deductible/retention
Excess Liability (general liability) $ 2,000 per occurrence ($3,000 aggregate)Excess Liability (automobile liability) 5,000 per occurrence (2014 and 2015)Excess Liability (State police) 2,000 per occurrenceBridge and Property 2,000 per occurrenceCommercial Crime 50 per occurrenceCyber Insurance 250 per occurrenceEmployee Medical Benefits 350 per claimantPublic Official and Employment Practices Liability 500 per occurrenceProfessional Liability Insurance Architects & Engineers 100 for Project value up to 50,000 and 250 Excess Workers Compensation 1,250 per occurrenceOCIP (Interchange 6–9 Widening Project – general
and workers compensation) 500 per occurrenceOCIP (other construction projects – general
and workers compensation) 500 per occurrence
The various insurance programs named and listed above afford limits of liability and amounts
of insurance in excess of such self-insured retentions and/or deductibles to protect the
Authority against losses resulting from third-party liability, workers compensation,
employer’s liability, direct damage claims and loss of revenue.
Coverage for public officials and employment practices liability, crime and cyber insurance
all contain proportional ranges of self-insured retentions and/or deductibles. The OCIPs also
provide other insurance coverage for the benefit of the Authority and its contractors,
subcontractors, consultants and sub-consultants at proportional ranges of self-insured
retentions and/or deductibles. Both OCIPs afford limits of liability and amounts of insurance
in excess of such self-insured retentions and/or deductibles to protect the Authority against
losses resulting from claims related to the various construction contracts.
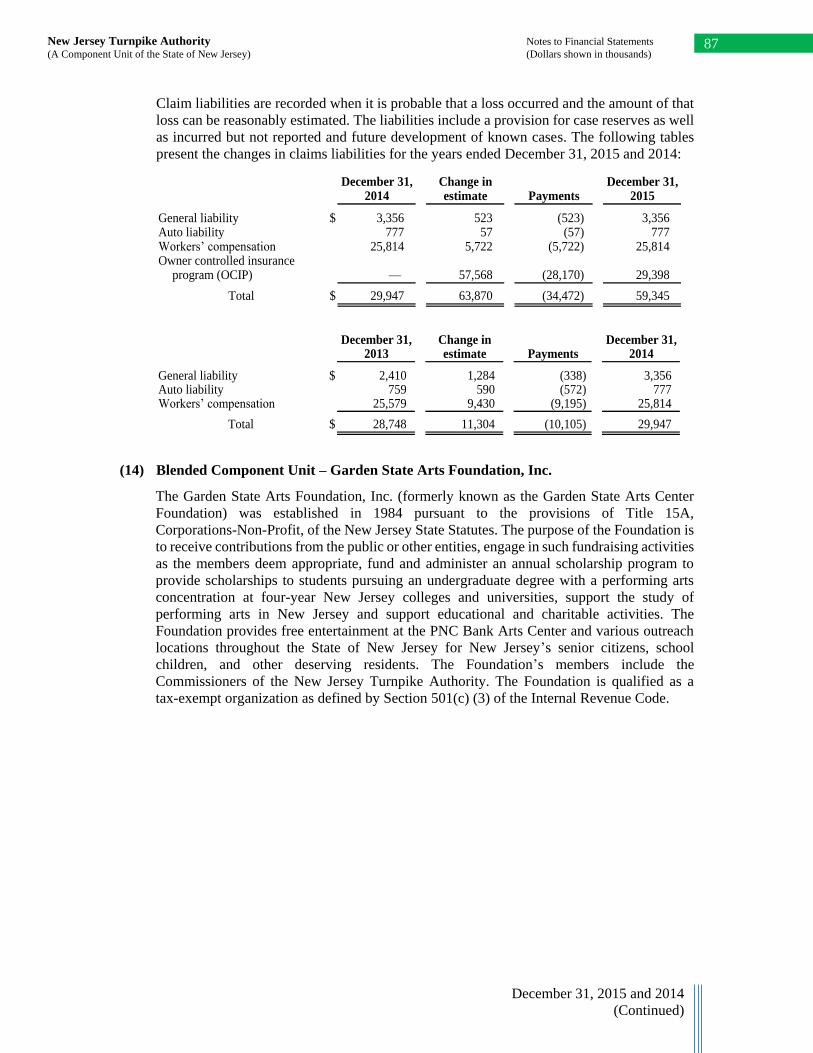
87 New Jersey Turnpike Authority Notes to Financial Statements
(A Component Unit of the State of New Jersey) (Dollars shown in thousands)
December 31, 2015 and 2014
(Continued)
Claim liabilities are recorded when it is probable that a loss occurred and the amount of that
loss can be reasonably estimated. The liabilities include a provision for case reserves as well
as incurred but not reported and future development of known cases. The following tables
present the changes in claims liabilities for the years ended December 31, 2015 and 2014:
December 31, Change in December 31,2014 estimate Payments 2015
General liability $ 3,356 523 (523) 3,356 Auto liability 777 57 (57) 777 Workers’ compensation 25,814 5,722 (5,722) 25,814 Owner controlled insurance
program (OCIP) — 57,568 (28,170) 29,398
Total $ 29,947 63,870 (34,472) 59,345
December 31, Change in December 31,2013 estimate Payments 2014
General liability $ 2,410 1,284 (338) 3,356 Auto liability 759 590 (572) 777 Workers’ compensation 25,579 9,430 (9,195) 25,814
Total $ 28,748 11,304 (10,105) 29,947
(14) Blended Component Unit – Garden State Arts Foundation, Inc.
The Garden State Arts Foundation, Inc. (formerly known as the Garden State Arts Center
Foundation) was established in 1984 pursuant to the provisions of Title 15A,
Corporations-Non-Profit, of the New Jersey State Statutes. The purpose of the Foundation is
to receive contributions from the public or other entities, engage in such fundraising activities
as the members deem appropriate, fund and administer an annual scholarship program to
provide scholarships to students pursuing an undergraduate degree with a performing arts
concentration at four-year New Jersey colleges and universities, support the study of
performing arts in New Jersey and support educational and charitable activities. The
Foundation provides free entertainment at the PNC Bank Arts Center and various outreach
locations throughout the State of New Jersey for New Jersey’s senior citizens, school
children, and other deserving residents. The Foundation’s members include the
Commissioners of the New Jersey Turnpike Authority. The Foundation is qualified as a
tax-exempt organization as defined by Section 501(c) (3) of the Internal Revenue Code.
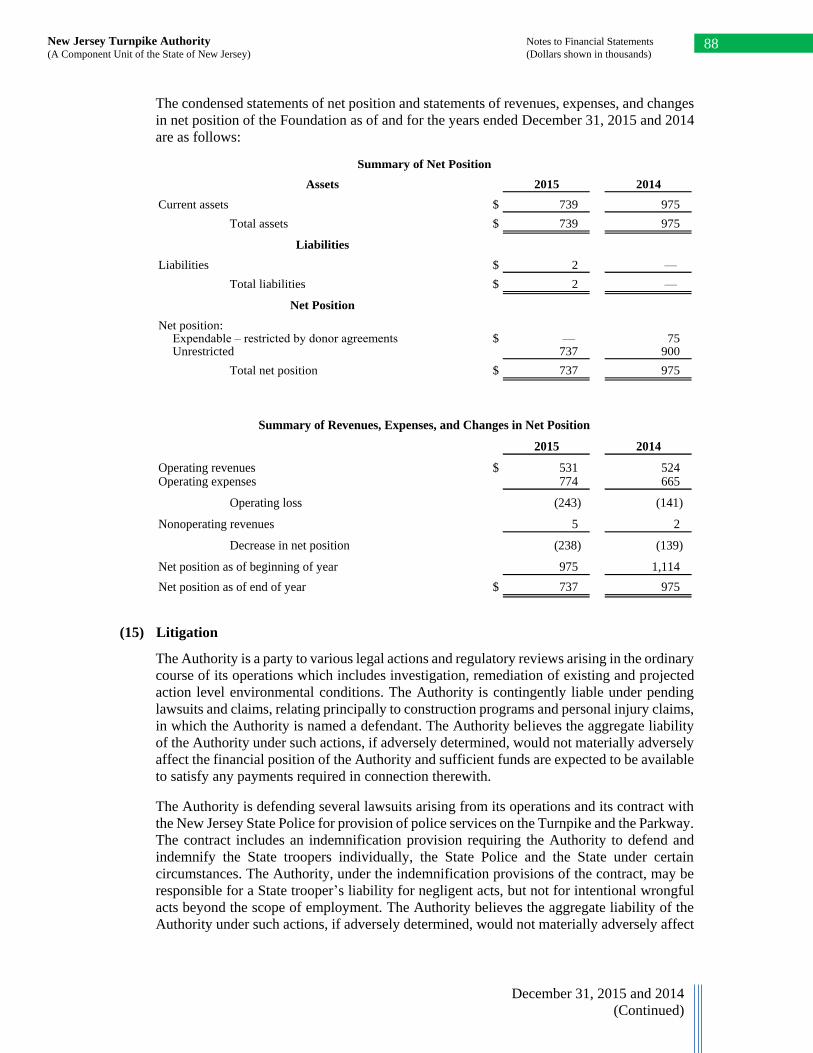
88 New Jersey Turnpike Authority Notes to Financial Statements
(A Component Unit of the State of New Jersey) (Dollars shown in thousands)
December 31, 2015 and 2014
(Continued)
The condensed statements of net position and statements of revenues, expenses, and changes
in net position of the Foundation as of and for the years ended December 31, 2015 and 2014
are as follows:
Summary of Net Position
Assets 2015 2014
Current assets $ 739 975
Total assets $ 739 975
Liabilities
Liabilities $ 2 —
Total liabilities $ 2 —
Net Position
Net position:Expendable – restricted by donor agreements $ — 75 Unrestricted 737 900
Total net position $ 737 975
Summary of Revenues, Expenses, and Changes in Net Position
2015 2014
Operating revenues $ 531 524 Operating expenses 774 665
Operating loss (243) (141)
Nonoperating revenues 5 2
Decrease in net position (238) (139)
Net position as of beginning of year 975 1,114
Net position as of end of year $ 737 975
(15) Litigation
The Authority is a party to various legal actions and regulatory reviews arising in the ordinary
course of its operations which includes investigation, remediation of existing and projected
action level environmental conditions. The Authority is contingently liable under pending
lawsuits and claims, relating principally to construction programs and personal injury claims,
in which the Authority is named a defendant. The Authority believes the aggregate liability
of the Authority under such actions, if adversely determined, would not materially adversely
affect the financial position of the Authority and sufficient funds are expected to be available
to satisfy any payments required in connection therewith.
The Authority is defending several lawsuits arising from its operations and its contract with
the New Jersey State Police for provision of police services on the Turnpike and the Parkway.
The contract includes an indemnification provision requiring the Authority to defend and
indemnify the State troopers individually, the State Police and the State under certain
circumstances. The Authority, under the indemnification provisions of the contract, may be
responsible for a State trooper’s liability for negligent acts, but not for intentional wrongful
acts beyond the scope of employment. The Authority believes the aggregate liability of the
Authority under such actions, if adversely determined, would not materially adversely affect
89 New Jersey Turnpike Authority Notes to Financial Statements
(A Component Unit of the State of New Jersey) (Dollars shown in thousands)
December 31, 2015 and 2014
(Continued)
the financial position of the Authority and sufficient funds are expected to be available to
satisfy any payments required in connection therewith.
Soil and/or groundwater contamination found on off-site properties and waterway
contamination that resulted from or is inferred to be the result of operations conducted at
roadway facilities has led to litigation by others against the Authority and may lead to
additional litigation in the future. Claims for reimbursement of remediation costs filed by the
parties undertaking remediation activities at these properties may be forthcoming. In some
cases the Authority may be required to undertake, fund or reimburse others for remediation
activities at properties where the contamination has been discovered. The ultimate cost, if
any, of these potential liabilities is unknown at this time.
(16) Commitments and Contingent Liabilities
The Authority has open commitments related to construction contracts totaling
approximately $1,175,668 and $1,411,224 as of December 31, 2015 and 2014, respectively.
This work relates to the Authority’s $7 billion Capital Improvement Program and will be
completed over the next several years.
Under the terms of an agreement dated April 27, 1984 and amendments dated August 1, 1995
and March 27, 2000, the Authority agreed to make annual payments to the State of New
Jersey to assist in transportation purposes. These payments are $22,000 annually and are due
until all obligations of the New Jersey Transportation Trust Fund Authority, as set forth in
the 2000 Amendment, are paid for or such payment has been provided for. The payments are
made from the General Reserve Fund and are subordinate to debt service payments on all
outstanding bonds and all other obligations under the Authority’s General Bond Resolution.
Under the terms of a State Transportation Projects Funding Agreement dated September 30,
2011, the Authority agreed to make annual payments to the State of New Jersey for the
development of state transportation purposes. These payments total $324,000 in calendar
2013, $324,000 in calendar 2014, $324,000 in calendar 2015 and $162,000 in calendar 2016.
The agreement terminates on June 30, 2016. The payments are made from the General
Reserve Fund and are subordinate to debt service payments on all outstanding bonds and all
other obligations under the Authority’s General Bond Resolution.
The Authority also made annual payments to the state of $8,001 in 2015 and 2014 for feeder
road maintenance provided by the New Jersey Department of Transportation. The current
agreement expires on June 30, 2016 and is expected to be renewed annually.
On September 23, 2015, the Authority has entered into a lease agreement (with an option for
purchase) for a new office building located at 1 Hess Plaza. By entering into this lease
agreement, this allows the Authority to house its entire administrative staff in one location.
The Authority will begin renting the property for 2 years beginning on February 1, 2017 and
then the Authority can purchase the property.
(17) Subsequent Events
On February 2, 2016, the Authority issued $149,995 of Series 2016A Bonds to refund the
Series 2004B Bonds. The bonds bear interest at fixed rates from 3.125% to 5.0%, and mature
from January 1, 2031 to January 1, 2035. The interest on the Series 2016A Bonds is paid
semi-annually. The refunding resulted in approximately $29,000 in net present value savings
from cash flow.
December 31, 2015 and 2014
90 New Jersey Turnpike Authority Notes to Financial Statements
(A Component Unit of the State of New Jersey) (Dollars shown in thousands)
On June 28, 2016, the Authority’s Board of Commissioners authorized the Authority to enter
into a State Transportation Projects Funding Agreement (“Funding Agreement”) with the
Treasurer of the State of New Jersey. Under the Funding Agreement, the Authority will make
annual payments to the State of New Jersey to be used for statewide transportation purposes
for a five year period beginning on July 1, 2016 and ending on June 30, 2021. The Authority
will make annual payments, payable quarterly, of $204,000 per year in state fiscal years 2017
and 2018, and $129,000 per year in state fiscal years 2019, 2020, and 2021. The total
payments over the five-year period will be $795,000, nearly half of the total payments
required under the expiring agreement. Payments are to be made only from legally available
revenues in the General Reserve Fund, and are subordinate to the payments required to be
made to the Authority’s bondholders and all other payments required to be made under the
Authority’s General Bond Resolution. The Board of Commissioners also authorized the
Authority to enter into a Feeder Road Maintenance and Cost Sharing Agreement with the
State for the period July 1, 2016 through June 30, 2023, a term of seven years. Under the
terms of the new Feeder Road Agreement, the State will continue to reconstruct, maintain
and repair 280 miles of feeder roads leading to 20 interchanges on the New Jersey Turnpike
and 36 interchanges on the Garden State Parkway. The Authority will reimburse the State on
an annual basis, payable quarterly, $8,000 in state fiscal year 2017, $5,000 in state fiscal year
2018, $4,000 in state fiscal year 2019, $2,750 in state fiscal year 2020, and $2,500 per year
in state fiscal years 2021, 2022 and 2023, for a total of $27,250 over the seven year term. If
the payments had remained at the current contractual amount of $8,000 per year, the
Authority would have paid $56,000 over the seven year term of the new Feeder Road
Agreement. Thus, the new Feeder Road Agreement represents a reduction of $28,750 from
the current Feeder Road Agreement.
On June 28, 2016, the Authority’s Board of Commissioners rescinded its prior approval from
August 2009, under Agenda Item No. 195-09, to enter into a multi-party Memorandum of
Agreement (MOA) with the Port Authority of New York and New Jersey, New Jersey
Department of Transportation (NJDOT), City of Elizabeth, and County of Union to address
the funding of roadway improvements along North Avenue in the vicinity of New Jersey
Turnpike Interchange 13A. The MOA was to include a financial contribution by the
Authority in the amount of $45,000, payable annually at $4,500 per year for a ten-year period
with payments to be made from the Authority’s General Reserve Fund. The MOA was never
executed by the parties because the project has not advanced. Authority staff has been
informed that the project has been removed from the NJDOT’s current capital plan. If the
project becomes active in the future, the State has agreed to relieve the Authority of any
financial obligation. The Authority had included a $4,500 payment in its 2016 General
Reserve Fund spending budget in the event the MOA was executed this year, and has
included the $4,500 annual payment from its General Reserve Fund in each of the subsequent
years as part of its Financial Plan projections. By rescinding this authorization, the Authority
will save $45,000 over a 10 year period beginning in calendar 2016.
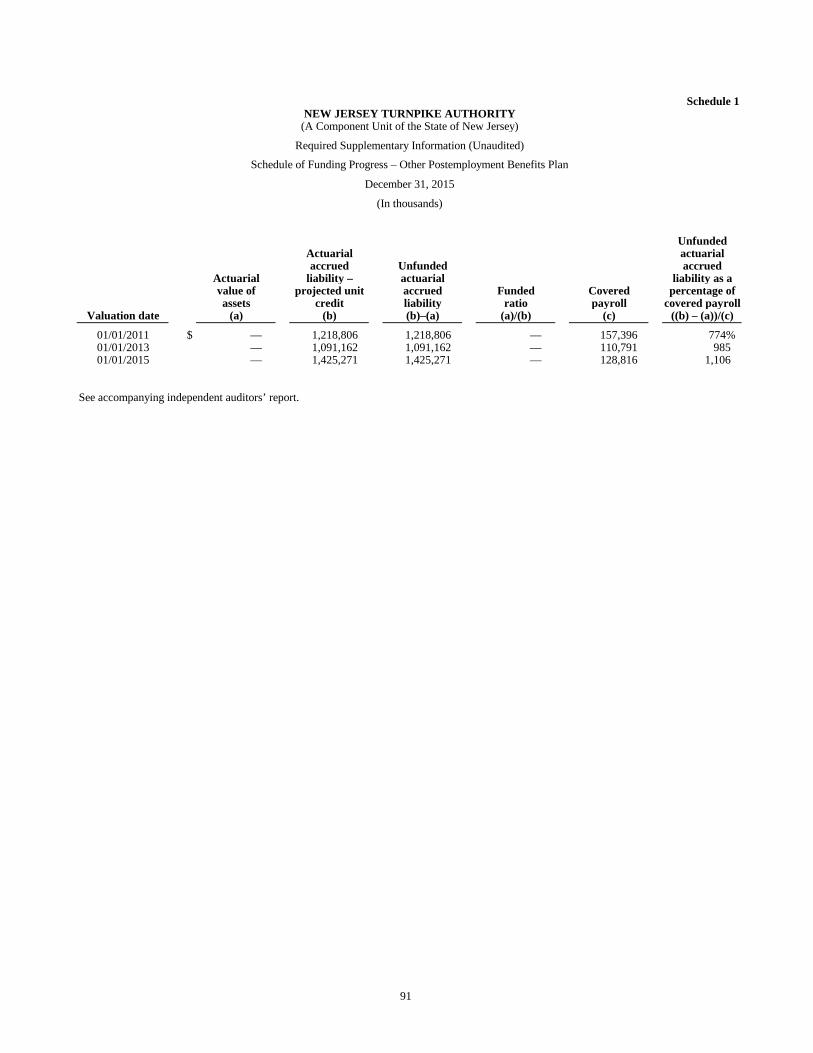
91
Schedule 1NEW JERSEY TURNPIKE AUTHORITY
(A Component Unit of the State of New Jersey)
Required Supplementary Information (Unaudited)
Schedule of Funding Progress – Other Postemployment Benefits Plan
December 31, 2015
(In thousands)
UnfundedActuarial actuarialaccrued Unfunded accrued
Actuarial liability – actuarial liability as avalue of projected unit accrued Funded Covered percentage ofassets credit liability ratio payroll covered payroll
Valuation date (a) (b) (b)–(a) (a)/(b) (c) ((b) – (a))/(c)
01/01/2011 $ — 1,218,806 1,218,806 — 157,396 774%01/01/2013 — 1,091,162 1,091,162 — 110,791 985 01/01/2015 — 1,425,271 1,425,271 — 128,816 1,106
See accompanying independent auditors’ report.
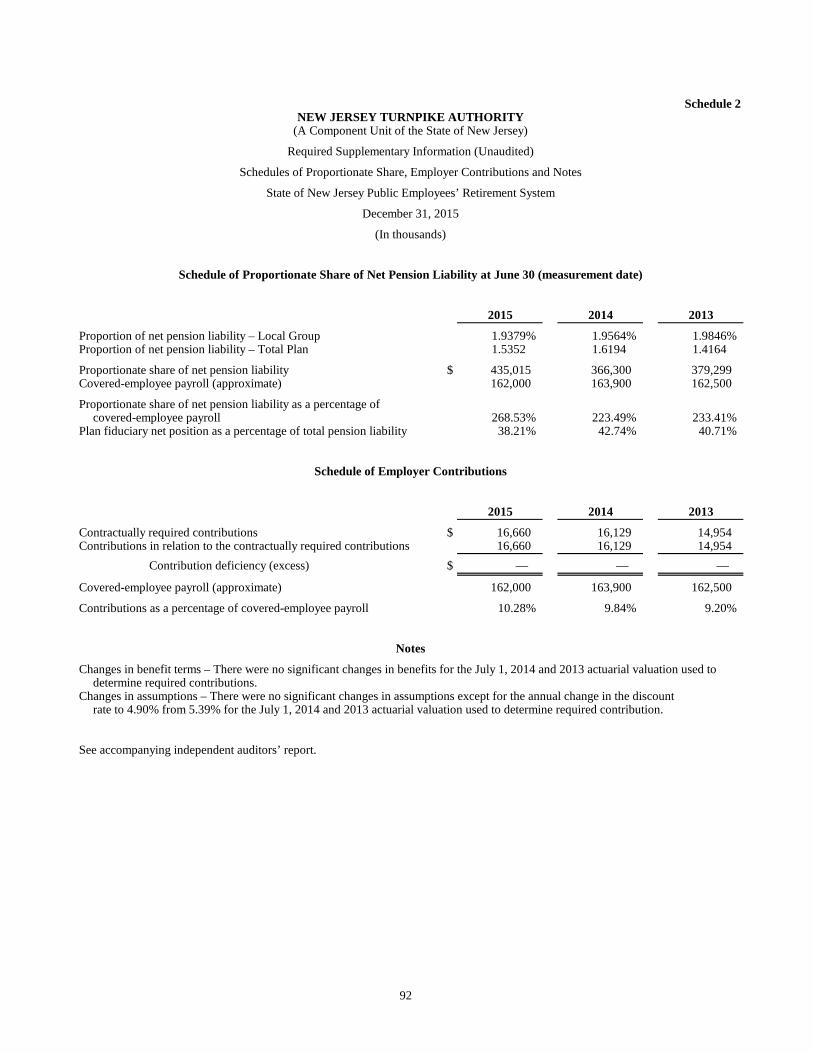
92
Schedule 2NEW JERSEY TURNPIKE AUTHORITY
(A Component Unit of the State of New Jersey)
Required Supplementary Information (Unaudited)
Schedules of Proportionate Share, Employer Contributions and Notes
State of New Jersey Public Employees’ Retirement System
Schedule of Proportionate Share of Net Pension Liability at June 30 (measurement date)
2015 2014 2013
Proportion of net pension liability – Local Group 1.9379% 1.9564% 1.9846%Proportion of net pension liability – Total Plan 1.5352 1.6194 1.4164
Proportionate share of net pension liability $ 435,015 366,300 379,299 Covered-employee payroll (approximate) 162,000 163,900 162,500
Proportionate share of net pension liability as a percentage ofcovered-employee payroll 268.53% 223.49% 233.41%
Plan fiduciary net position as a percentage of total pension liability 38.21% 42.74% 40.71%
Schedule of Employer Contributions
2015 2014 2013
Contractually required contributions $ 16,660 16,129 14,954 Contributions in relation to the contractually required contributions 16,660 16,129 14,954
Contribution deficiency (excess) $ — — —
Covered-employee payroll (approximate) 162,000 163,900 162,500
Contributions as a percentage of covered-employee payroll 10.28% 9.84% 9.20%
Notes
Changes in benefit terms – There were no significant changes in benefits for the July 1, 2014 and 2013 actuarial valuation used todetermine required contributions.
Changes in assumptions – There were no significant changes in assumptions except for the annual change in the discountrate to 4.90% from 5.39% for the July 1, 2014 and 2013 actuarial valuation used to determine required contribution.
See accompanying independent auditors’ report.
December 31, 2015
(In thousands)
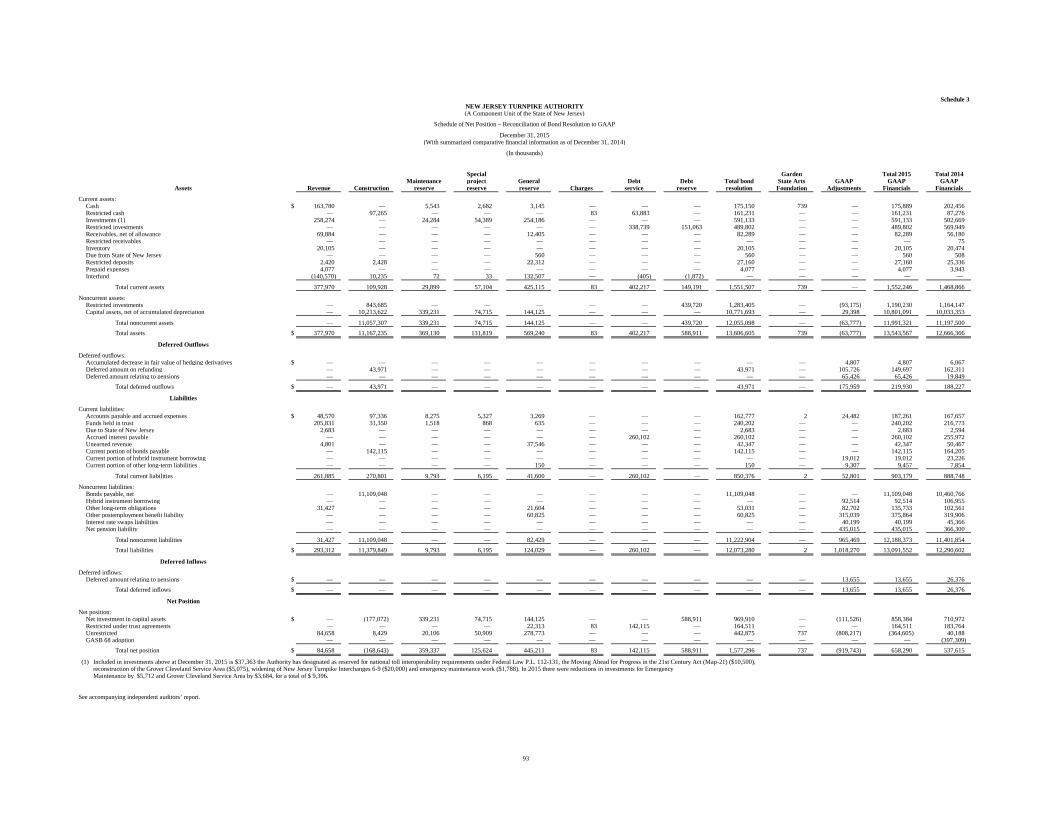
93
Schedule 3NEW JERSEY TURNPIKE AUTHORITY(A Component Unit of the State of New Jersey)
Schedule of Net Position – Reconciliation of Bond Resolution to GAAP
December 31, 2015(With summarized comparative financial information as of December 31, 2014)
(In thousands)
Special Garden Total 2015 Total 2014Maintenance project General Debt Debt Total bond State Arts GAAP GAAP GAAP
Assets Revenue Construction reserve reserve reserve Charges service reserve resolution Foundation Adjustments Financials Financials
Current assets:Cash $ 163,780 — 5,543 2,682 3,145 — — — 175,150 739 — 175,889 202,456 Restricted cash — 97,265 — — — 83 63,883 — 161,231 — — 161,231 87,276 Investments (1) 258,274 — 24,284 54,389 254,186 — — — 591,133 — — 591,133 502,669 Restricted investments — — — — — — 338,739 151,063 489,802 — — 489,802 569,949 Receivables, net of allowance 69,884 — — — 12,405 — — — 82,289 — — 82,289 56,180 Restricted receivables — — — — — — — — — — — — 75 Inventory 20,105 — — — — — — — 20,105 — — 20,105 20,474 Due from State of New Jersey — — — — 560 — — — 560 — — 560 508 Restricted deposits 2,420 2,428 — — 22,312 — — — 27,160 — — 27,160 25,336 Prepaid expenses 4,077 — — — — — — — 4,077 — — 4,077 3,943 Interfund (140,570) 10,235 72 33 132,507 — (405) (1,872) — — — — —
Total current assets 377,970 109,928 29,899 57,104 425,115 83 402,217 149,191 1,551,507 739 — 1,552,246 1,468,866
Noncurrent assets:Restricted investments — 843,685 — — — — — 439,720 1,283,405 — (93,175) 1,190,230 1,164,147 Capital assets, net of accumulated depreciation — 10,213,622 339,231 74,715 144,125 — — — 10,771,693 — 29,398 10,801,091 10,033,353
Total noncurrent assets — 11,057,307 339,231 74,715 144,125 — — 439,720 12,055,098 — (63,777) 11,991,321 11,197,500
Total assets $ 377,970 11,167,235 369,130 131,819 569,240 83 402,217 588,911 13,606,605 739 (63,777) 13,543,567 12,666,366
Deferred Outflows
Deferred outflows:Accumulated decrease in fair value of hedging derivatives $ — — — — — — — — — — 4,807 4,807 6,067 Deferred amount on refunding — 43,971 — — — — — — 43,971 — 105,726 149,697 162,311 Deferred amount relating to pensions — — — — — — — — — — 65,426 65,426 19,849
Total deferred outflows $ — 43,971 — — — — — — 43,971 — 175,959 219,930 188,227
Liabilities
Current liabilities:Accounts payable and accrued expenses $ 48,570 97,336 8,275 5,327 3,269 — — — 162,777 2 24,482 187,261 167,657 Funds held in trust 205,831 31,350 1,518 868 635 — — — 240,202 — — 240,202 216,773 Due to State of New Jersey 2,683 — — — — — — — 2,683 — — 2,683 2,594 Accrued interest payable — — — — — — 260,102 — 260,102 — — 260,102 255,972 Unearned revenue 4,801 — — — 37,546 — — — 42,347 — — 42,347 50,467 Current portion of bonds payable — 142,115 — — — — — — 142,115 — — 142,115 164,205 Current portion of hybrid instrument borrowing — — — — — — — — — — 19,012 19,012 23,226 Current portion of other long-term liabilities — — — — 150 — — — 150 — 9,307 9,457 7,854
Total current liabilities 261,885 270,801 9,793 6,195 41,600 — 260,102 — 850,376 2 52,801 903,179 888,748
Noncurrent liabilities:Bonds payable, net — 11,109,048 — — — — — — 11,109,048 — — 11,109,048 10,460,766 Hybrid instrument borrowing — — — — — — — — — — 92,514 92,514 106,955 Other long-term obligations 31,427 — — — 21,604 — — — 53,031 — 82,702 135,733 102,561 Other postemployment benefit liability — — — — 60,825 — — — 60,825 — 315,039 375,864 319,906 Interest rate swaps liabilities — — — — — — — — — — 40,199 40,199 45,366 Net pension liability — — — — — — — — — — 435,015 435,015 366,300
Total noncurrent liabilities 31,427 11,109,048 — — 82,429 — — — 11,222,904 — 965,469 12,188,373 11,401,854
Total liabilities $ 293,312 11,379,849 9,793 6,195 124,029 — 260,102 — 12,073,280 2 1,018,270 13,091,552 12,290,602
Deferred Inflows
Deferred inflows:Deferred amount relating to pensions $ — — — — — — — — — — 13,655 13,655 26,376
Total deferred inflows $ — — — — — — — — — — 13,655 13,655 26,376
Net Position
Net position:Net investment in capital assets $ — (177,072) 339,231 74,715 144,125 — — 588,911 969,910 — (111,526) 858,384 710,972 Restricted under trust agreements — — — — 22,313 83 142,115 — 164,511 — — 164,511 183,764 Unrestricted 84,658 8,429 20,106 50,909 278,773 — — — 442,875 737 (808,217) (364,605) 40,188 GASB 68 adoption — — — — — — — — — — — — (397,309)
Total net position $ 84,658 (168,643) 359,337 125,624 445,211 83 142,115 588,911 1,577,296 737 (919,743) 658,290 537,615
(1) Included in investments above at December 31, 2015 is $37,363 the Authority has designated as reserved for national toll interoperability requirements under Federal Law P.L. 112-131, the Moving Ahead for Progress in the 21st Century Act (Map-21) ($10,500),reconstruction of the Grover Cleveland Service Area ($5,075), widening of New Jersey Turnpike Interchanges 6-9 ($20,000) and emergency maintenance work ($1,788). In 2015 there were reductions in investments for Emergency Maintenance by $5,712 and Grover Cleveland Service Area by $3,684, for a total of $ 9,396.
See accompanying independent auditors’ report.
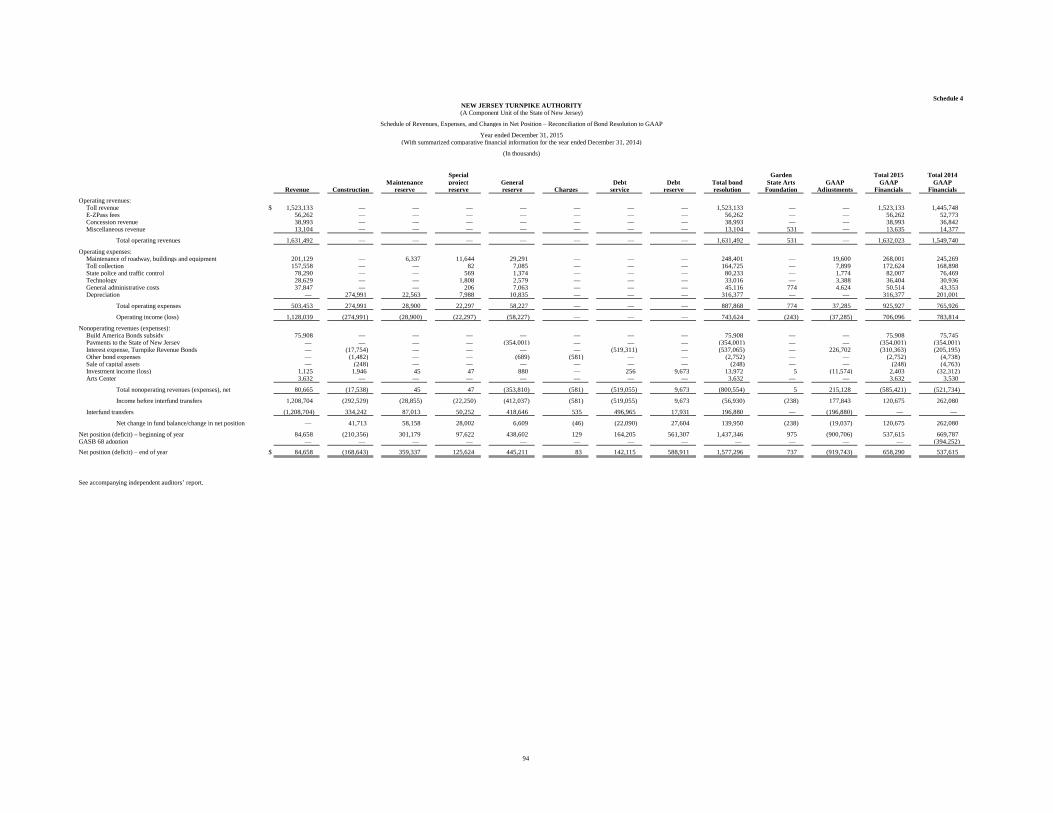
94
Schedule 4NEW JERSEY TURNPIKE AUTHORITY(A Component Unit of the State of New Jersey)
Schedule of Revenues, Expenses, and Changes in Net Position – Reconciliation of Bond Resolution to GAAP
Year ended December 31, 2015(With summarized comparative financial information for the year ended December 31, 2014)
(In thousands)
Special Garden Total 2015 Total 2014Maintenance project General Debt Debt Total bond State Arts GAAP GAAP GAAP
Revenue Construction reserve reserve reserve Charges service reserve resolution Foundation Adjustments Financials Financials
Operating revenues:Toll revenue $ 1,523,133 — — — — — — — 1,523,133 — — 1,523,133 1,445,748 E-ZPass fees 56,262 — — — — — — — 56,262 — — 56,262 52,773 Concession revenue 38,993 — — — — — — — 38,993 — — 38,993 36,842 Miscellaneous revenue 13,104 — — — — — — — 13,104 531 — 13,635 14,377
Total operating revenues 1,631,492 — — — — — — — 1,631,492 531 — 1,632,023 1,549,740
Operating expenses:Maintenance of roadway, buildings and equipment 201,129 — 6,337 11,644 29,291 — — — 248,401 — 19,600 268,001 245,269 Toll collection 157,558 — — 82 7,085 — — — 164,725 — 7,899 172,624 168,898 State police and traffic control 78,290 — — 569 1,374 — — — 80,233 — 1,774 82,007 76,469 Technology 28,629 — — 1,808 2,579 — — — 33,016 — 3,388 36,404 30,936 General administrative costs 37,847 — — 206 7,063 — — — 45,116 774 4,624 50,514 43,353 Depreciation — 274,991 22,563 7,988 10,835 — — — 316,377 — — 316,377 201,001
Total operating expenses 503,453 274,991 28,900 22,297 58,227 — — — 887,868 774 37,285 925,927 765,926
Operating income (loss) 1,128,039 (274,991) (28,900) (22,297) (58,227) — — — 743,624 (243) (37,285) 706,096 783,814
Nonoperating revenues (expenses):Build America Bonds subsidy 75,908 — — — — — — — 75,908 — — 75,908 75,745 Payments to the State of New Jersey — — — — (354,001) — — — (354,001) — — (354,001) (354,001) Interest expense, Turnpike Revenue Bonds — (17,754) — — — — (519,311) — (537,065) — 226,702 (310,363) (205,195) Other bond expenses — (1,482) — — (689) (581) — — (2,752) — — (2,752) (4,738) Sale of capital assets — (248) — — — — — — (248) — — (248) (4,763) Investment income (loss) 1,125 1,946 45 47 880 — 256 9,673 13,972 5 (11,574) 2,403 (32,312) Arts Center 3,632 — — — — — — — 3,632 — — 3,632 3,530
Total nonoperating revenues (expenses), net 80,665 (17,538) 45 47 (353,810) (581) (519,055) 9,673 (800,554) 5 215,128 (585,421) (521,734)
Income before interfund transfers 1,208,704 (292,529) (28,855) (22,250) (412,037) (581) (519,055) 9,673 (56,930) (238) 177,843 120,675 262,080
Interfund transfers (1,208,704) 334,242 87,013 50,252 418,646 535 496,965 17,931 196,880 — (196,880) — —
Net change in fund balance/change in net position — 41,713 58,158 28,002 6,609 (46) (22,090) 27,604 139,950 (238) (19,037) 120,675 262,080
Net position (deficit) – beginning of year 84,658 (210,356) 301,179 97,622 438,602 129 164,205 561,307 1,437,346 975 (900,706) 537,615 669,787 GASB 68 adoption — — — — — — — — — — — — (394,252)
Net position (deficit) – end of year $ 84,658 (168,643) 359,337 125,624 445,211 83 142,115 588,911 1,577,296 737 (919,743) 658,290 537,615
See accompanying independent auditors’ report.
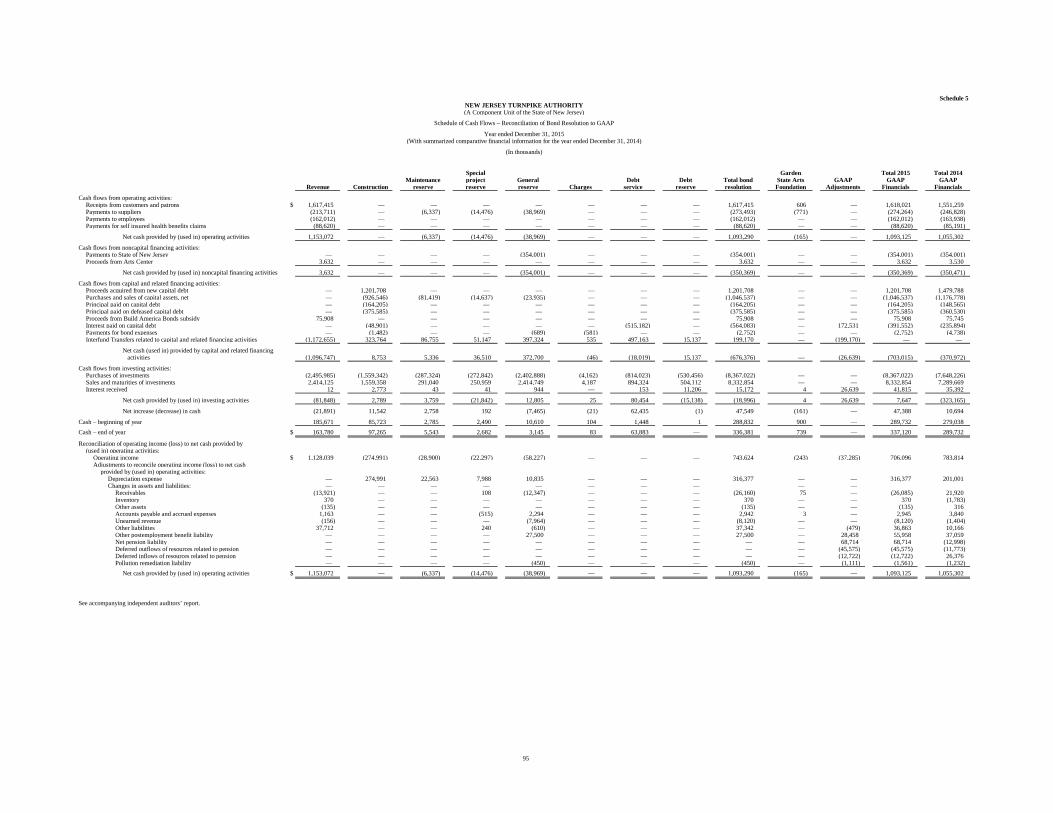
95
Schedule 5NEW JERSEY TURNPIKE AUTHORITY(A Component Unit of the State of New Jersey)
Schedule of Cash Flows – Reconciliation of Bond Resolution to GAAP
Year ended December 31, 2015(With summarized comparative financial information for the year ended December 31, 2014)
(In thousands)
Special Garden Total 2015 Total 2014Maintenance project General Debt Debt Total bond State Arts GAAP GAAP GAAP
Revenue Construction reserve reserve reserve Charges service reserve resolution Foundation Adjustments Financials Financials
Cash flows from operating activities:Receipts from customers and patrons $ 1,617,415 — — — — — — — 1,617,415 606 — 1,618,021 1,551,259 Payments to suppliers (213,711) — (6,337) (14,476) (38,969) — — — (273,493) (771) — (274,264) (246,828) Payments to employees (162,012) — — — — — — — (162,012) — — (162,012) (163,938) Payments for self insured health benefits claims (88,620) — — — — — — — (88,620) — — (88,620) (85,191)
Net cash provided by (used in) operating activities 1,153,072 — (6,337) (14,476) (38,969) — — — 1,093,290 (165) — 1,093,125 1,055,302
Cash flows from noncapital financing activities:Payments to State of New Jersey — — — — (354,001) — — — (354,001) — — (354,001) (354,001) Proceeds from Arts Center 3,632 — — — — — — — 3,632 — — 3,632 3,530
Net cash provided by (used in) noncapital financing activities 3,632 — — — (354,001) — — — (350,369) — — (350,369) (350,471)
Cash flows from capital and related financing activities:Proceeds acquired from new capital debt — 1,201,708 — — — — — — 1,201,708 — — 1,201,708 1,479,788 Purchases and sales of capital assets, net — (926,546) (81,419) (14,637) (23,935) — — — (1,046,537) — — (1,046,537) (1,176,778) Principal paid on capital debt — (164,205) — — — — — — (164,205) — — (164,205) (148,565) Principal paid on defeased capital debt — (375,585) — — — — — — (375,585) — — (375,585) (360,530) Proceeds from Build America Bonds subsidy 75,908 — — — — — — — 75,908 — — 75,908 75,745 Interest paid on capital debt — (48,901) — — — — (515,182) — (564,083) — 172,531 (391,552) (235,894) Payments for bond expenses — (1,482) — — (689) (581) — — (2,752) — — (2,752) (4,738) Interfund Transfers related to capital and related financing activities (1,172,655) 323,764 86,755 51,147 397,324 535 497,163 15,137 199,170 — (199,170) — —
Net cash (used in) provided by capital and related financing activities (1,096,747) 8,753 5,336 36,510 372,700 (46) (18,019) 15,137 (676,376) — (26,639) (703,015) (370,972)
Cash flows from investing activities:Purchases of investments (2,495,985) (1,559,342) (287,324) (272,842) (2,402,888) (4,162) (814,023) (530,456) (8,367,022) — — (8,367,022) (7,648,226) Sales and maturities of investments 2,414,125 1,559,358 291,040 250,959 2,414,749 4,187 894,324 504,112 8,332,854 — — 8,332,854 7,289,669 Interest received 12 2,773 43 41 944 — 153 11,206 15,172 4 26,639 41,815 35,392
Net cash provided by (used in) investing activities (81,848) 2,789 3,759 (21,842) 12,805 25 80,454 (15,138) (18,996) 4 26,639 7,647 (323,165)
Net increase (decrease) in cash (21,891) 11,542 2,758 192 (7,465) (21) 62,435 (1) 47,549 (161) — 47,388 10,694
Cash – beginning of year 185,671 85,723 2,785 2,490 10,610 104 1,448 1 288,832 900 — 289,732 279,038
Cash – end of year $ 163,780 97,265 5,543 2,682 3,145 83 63,883 — 336,381 739 — 337,120 289,732
Reconciliation of operating income (loss) to net cash provided by(used in) operating activities:
Operating income $ 1,128,039 (274,991) (28,900) (22,297) (58,227) — — — 743,624 (243) (37,285) 706,096 783,814 Adjustments to reconcile operating income (loss) to net cash
provided by (used in) operating activities:Depreciation expense — 274,991 22,563 7,988 10,835 — — — 316,377 — — 316,377 201,001 Changes in assets and liabilities: — — — — — — — — — —
Receivables (13,921) — — 108 (12,347) — — — (26,160) 75 — (26,085) 21,920 Inventory 370 — — — — — — — 370 — — 370 (1,783) Other assets (135) — — — — — — — (135) — — (135) 316 Accounts payable and accrued expenses 1,163 — — (515) 2,294 — — — 2,942 3 — 2,945 3,840 Unearned revenue (156) — — — (7,964) — — — (8,120) — — (8,120) (1,404) Other liabilities 37,712 — — 240 (610) — — — 37,342 — (479) 36,863 10,166 Other postemployment benefit liability — — — — 27,500 — — — 27,500 — 28,458 55,958 37,059 Net pension liability — — — — — — — — — — 68,714 68,714 (12,998) Deferred outflows of resources related to pension — — — — — — — — — — (45,575) (45,575) (11,773) Deferred inflows of resources related to pension — — — — — — — — — — (12,722) (12,722) 26,376 Pollution remediation liability — — — — (450) — — — (450) — (1,111) (1,561) (1,232)
Net cash provided by (used in) operating activities $ 1,153,072 — (6,337) (14,476) (38,969) — — — 1,093,290 (165) — 1,093,125 1,055,302
See accompanying independent auditors’ report.
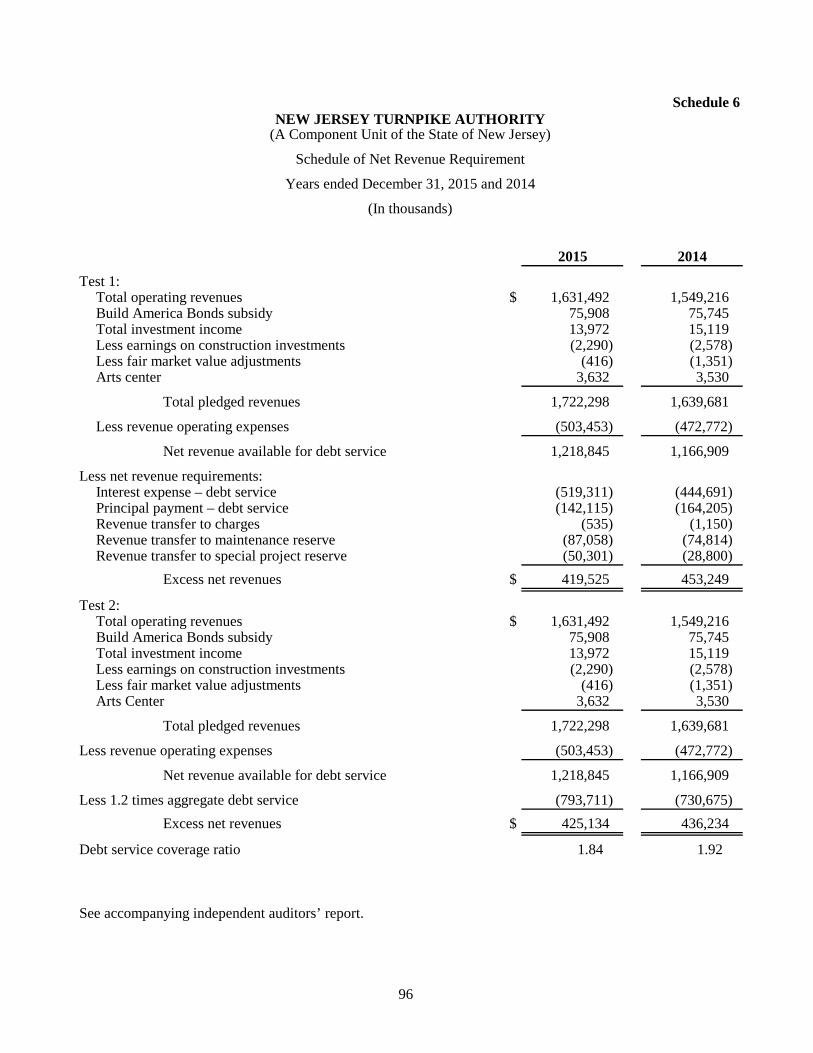
96
Schedule 6NEW JERSEY TURNPIKE AUTHORITY
(A Component Unit of the State of New Jersey)
Schedule of Net Revenue Requirement
Years ended December 31, 2015 and 2014
(In thousands)
2015 2014
Test 1:Total operating revenues $ 1,631,492 1,549,216 Build America Bonds subsidy 75,908 75,745 Total investment income 13,972 15,119 Less earnings on construction investments (2,290) (2,578) Less fair market value adjustments (416) (1,351) Arts center 3,632 3,530
Total pledged revenues 1,722,298 1,639,681
Less revenue operating expenses (503,453) (472,772)
Net revenue available for debt service 1,218,845 1,166,909
Less net revenue requirements:Interest expense – debt service (519,311) (444,691) Principal payment – debt service (142,115) (164,205) Revenue transfer to charges (535) (1,150) Revenue transfer to maintenance reserve (87,058) (74,814) Revenue transfer to special project reserve (50,301) (28,800)
Excess net revenues $ 419,525 453,249
Test 2:Total operating revenues $ 1,631,492 1,549,216 Build America Bonds subsidy 75,908 75,745 Total investment income 13,972 15,119 Less earnings on construction investments (2,290) (2,578) Less fair market value adjustments (416) (1,351) Arts Center 3,632 3,530
Total pledged revenues 1,722,298 1,639,681
Less revenue operating expenses (503,453) (472,772)
Net revenue available for debt service 1,218,845 1,166,909
Less 1.2 times aggregate debt service (793,711) (730,675)
Excess net revenues $ 425,134 436,234
Debt service coverage ratio 1.84 1.92
See accompanying independent auditors’ report.
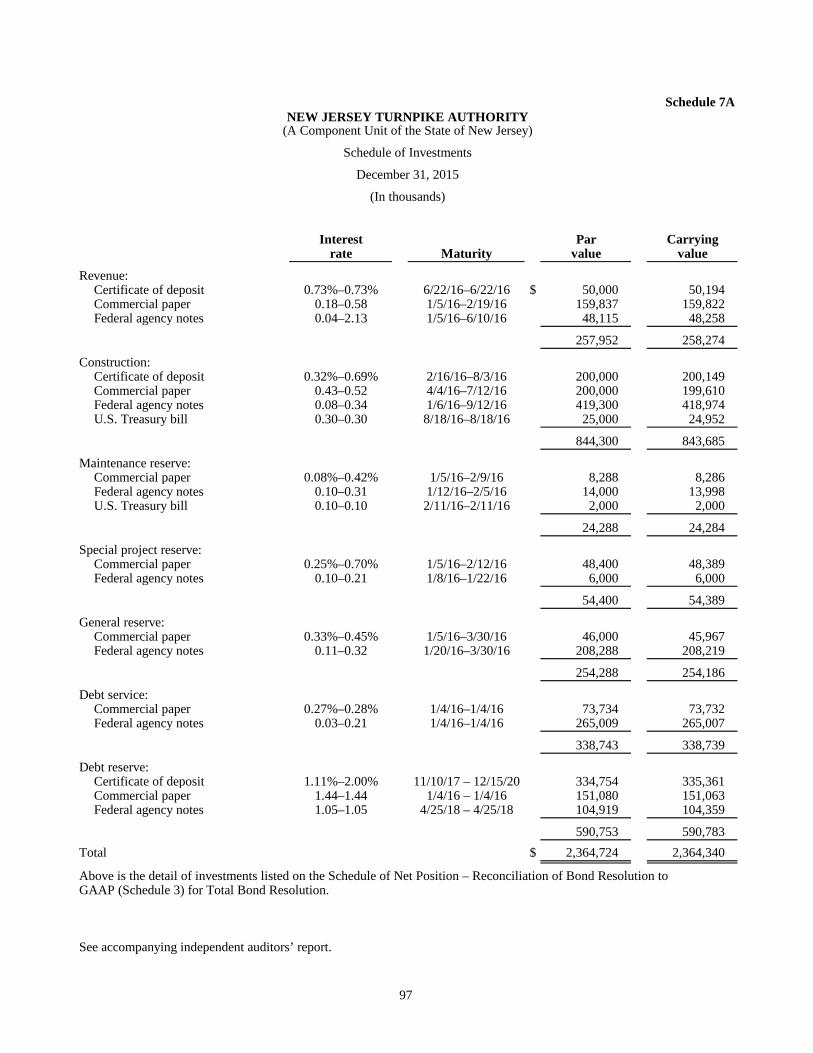
97
Schedule 7ANEW JERSEY TURNPIKE AUTHORITY
(A Component Unit of the State of New Jersey)
Schedule of Investments
December 31, 2015
(In thousands)
Interest Par Carryingrate Maturity value value
Revenue:Certificate of deposit 0.73%–0.73% 6/22/16–6/22/16 $ 50,000 50,194 Commercial paper 0.18–0.58 1/5/16–2/19/16 159,837 159,822 Federal agency notes 0.04–2.13 1/5/16–6/10/16 48,115 48,258
257,952 258,274
Construction:Certificate of deposit 0.32%–0.69% 2/16/16–8/3/16 200,000 200,149 Commercial paper 0.43–0.52 4/4/16–7/12/16 200,000 199,610 Federal agency notes 0.08–0.34 1/6/16–9/12/16 419,300 418,974 U.S. Treasury bill 0.30–0.30 8/18/16–8/18/16 25,000 24,952
844,300 843,685
Maintenance reserve:Commercial paper 0.08%–0.42% 1/5/16–2/9/16 8,288 8,286 Federal agency notes 0.10–0.31 1/12/16–2/5/16 14,000 13,998 U.S. Treasury bill 0.10–0.10 2/11/16–2/11/16 2,000 2,000
24,288 24,284
Special project reserve:Commercial paper 0.25%–0.70% 1/5/16–2/12/16 48,400 48,389 Federal agency notes 0.10–0.21 1/8/16–1/22/16 6,000 6,000
54,400 54,389
General reserve:Commercial paper 0.33%–0.45% 1/5/16–3/30/16 46,000 45,967 Federal agency notes 0.11–0.32 1/20/16–3/30/16 208,288 208,219
254,288 254,186
Debt service:Commercial paper 0.27%–0.28% 1/4/16–1/4/16 73,734 73,732 Federal agency notes 0.03–0.21 1/4/16–1/4/16 265,009 265,007
338,743 338,739
Debt reserve:Certificate of deposit 1.11%–2.00% 11/10/17 – 12/15/20 334,754 335,361 Commercial paper 1.44–1.44 1/4/16 – 1/4/16 151,080 151,063 Federal agency notes 1.05–1.05 4/25/18 – 4/25/18 104,919 104,359
590,753 590,783
Total $ 2,364,724 2,364,340
Above is the detail of investments listed on the Schedule of Net Position – Reconciliation of Bond Resolution toGAAP (Schedule 3) for Total Bond Resolution.
See accompanying independent auditors’ report.
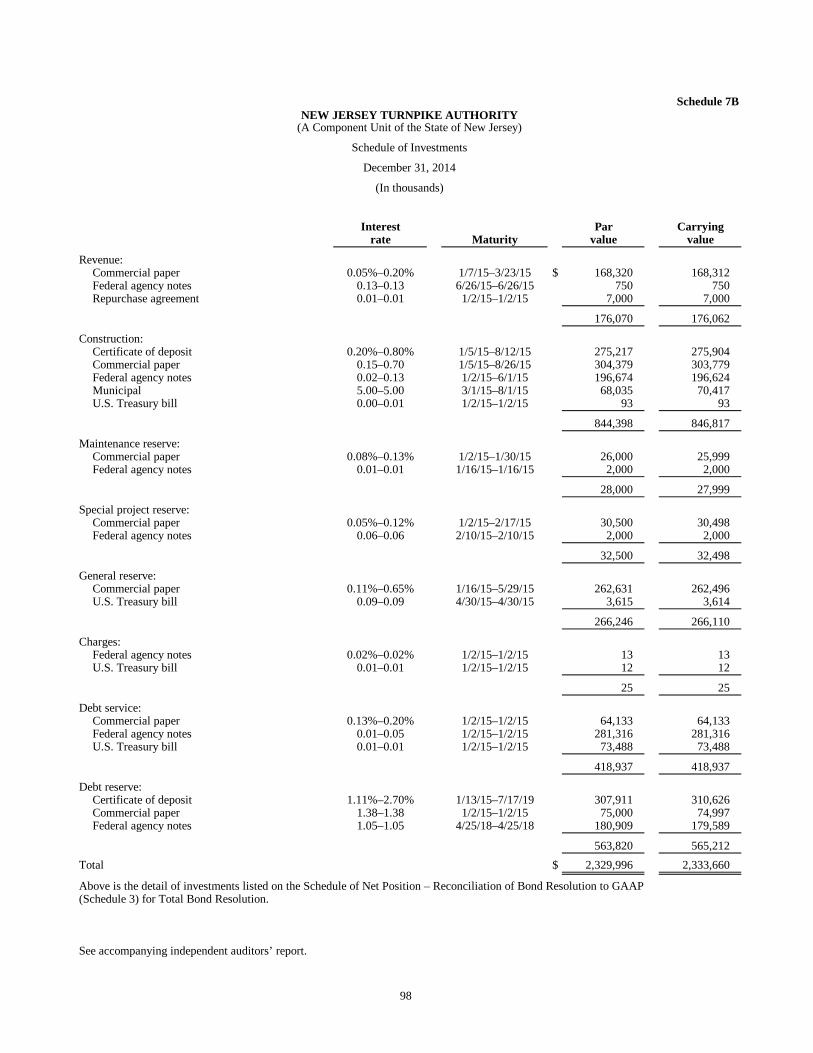
98
Schedule 7BNEW JERSEY TURNPIKE AUTHORITY
(A Component Unit of the State of New Jersey)
Schedule of Investments
December 31, 2014
(In thousands)
Interest Par Carryingrate Maturity value value
Revenue:Commercial paper 0.05%–0.20% 1/7/15–3/23/15 $ 168,320 168,312 Federal agency notes 0.13–0.13 6/26/15–6/26/15 750 750 Repurchase agreement 0.01–0.01 1/2/15–1/2/15 7,000 7,000
176,070 176,062
Construction:Certificate of deposit 0.20%–0.80% 1/5/15–8/12/15 275,217 275,904 Commercial paper 0.15–0.70 1/5/15–8/26/15 304,379 303,779 Federal agency notes 0.02–0.13 1/2/15–6/1/15 196,674 196,624 Municipal 5.00–5.00 3/1/15–8/1/15 68,035 70,417 U.S. Treasury bill 0.00–0.01 1/2/15–1/2/15 93 93
844,398 846,817
Maintenance reserve:Commercial paper 0.08%–0.13% 1/2/15–1/30/15 26,000 25,999 Federal agency notes 0.01–0.01 1/16/15–1/16/15 2,000 2,000
28,000 27,999
Special project reserve:Commercial paper 0.05%–0.12% 1/2/15–2/17/15 30,500 30,498 Federal agency notes 0.06–0.06 2/10/15–2/10/15 2,000 2,000
32,500 32,498
General reserve:Commercial paper 0.11%–0.65% 1/16/15–5/29/15 262,631 262,496 U.S. Treasury bill 0.09–0.09 4/30/15–4/30/15 3,615 3,614
266,246 266,110
Charges:Federal agency notes 0.02%–0.02% 1/2/15–1/2/15 13 13 U.S. Treasury bill 0.01–0.01 1/2/15–1/2/15 12 12
25 25
Debt service:Commercial paper 0.13%–0.20% 1/2/15–1/2/15 64,133 64,133 Federal agency notes 0.01–0.05 1/2/15–1/2/15 281,316 281,316 U.S. Treasury bill 0.01–0.01 1/2/15–1/2/15 73,488 73,488
418,937 418,937
Debt reserve:Certificate of deposit 1.11%–2.70% 1/13/15–7/17/19 307,911 310,626 Commercial paper 1.38–1.38 1/2/15–1/2/15 75,000 74,997 Federal agency notes 1.05–1.05 4/25/18–4/25/18 180,909 179,589
563,820 565,212
Total $ 2,329,996 2,333,660
Above is the detail of investments listed on the Schedule of Net Position – Reconciliation of Bond Resolution to GAAP(Schedule 3) for Total Bond Resolution.
See accompanying independent auditors’ report.
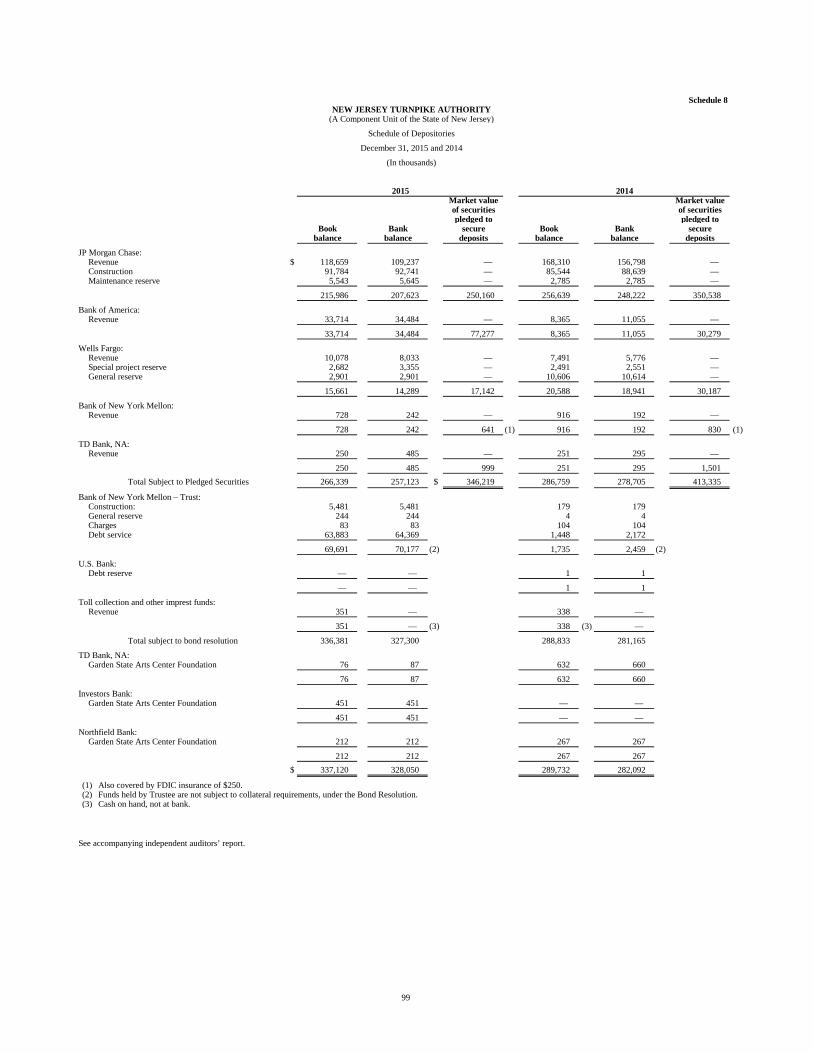
99
Schedule 8NEW JERSEY TURNPIKE AUTHORITY
(A Component Unit of the State of New Jersey)
Schedule of Depositories
December 31, 2015 and 2014
(In thousands)
2015 2014Market value Market valueof securities of securitiespledged to pledged to
Book Bank secure Book Bank securebalance balance deposits balance balance deposits
JP Morgan Chase:Revenue $ 118,659 109,237 — 168,310 156,798 — Construction 91,784 92,741 — 85,544 88,639 — Maintenance reserve 5,543 5,645 — 2,785 2,785 —
215,986 207,623 250,160 256,639 248,222 350,538
Bank of America:Revenue 33,714 34,484 — 8,365 11,055 —
33,714 34,484 77,277 8,365 11,055 30,279
Wells Fargo:Revenue 10,078 8,033 — 7,491 5,776 — Special project reserve 2,682 3,355 — 2,491 2,551 — General reserve 2,901 2,901 — 10,606 10,614 —
15,661 14,289 17,142 20,588 18,941 30,187
Bank of New York Mellon:Revenue 728 242 — 916 192 —
728 242 641 (1) 916 192 830 (1)
TD Bank, NA:Revenue 250 485 — 251 295 —
250 485 999 251 295 1,501
Total Subject to Pledged Securities 266,339 257,123 $ 346,219 286,759 278,705 413,335
Bank of New York Mellon – Trust:Construction: 5,481 5,481 179 179 General reserve 244 244 4 4 Charges 83 83 104 104 Debt service 63,883 64,369 1,448 2,172
69,691 70,177 (2) 1,735 2,459 (2)
U.S. Bank:Debt reserve — — 1 1
— — 1 1
Toll collection and other imprest funds:Revenue 351 — 338 —
351 — (3) 338 (3) —
Total subject to bond resolution 336,381 327,300 288,833 281,165
TD Bank, NA:Garden State Arts Center Foundation 76 87 632 660
76 87 632 660
Investors Bank:Garden State Arts Center Foundation 451 451 — —
451 451 — —
Northfield Bank:Garden State Arts Center Foundation 212 212 267 267
212 212 267 267
$ 337,120 328,050 289,732 282,092
(1) Also covered by FDIC insurance of $250.(2) Funds held by Trustee are not subject to collateral requirements, under the Bond Resolution.(3) Cash on hand, not at bank.
See accompanying independent auditors’ report.
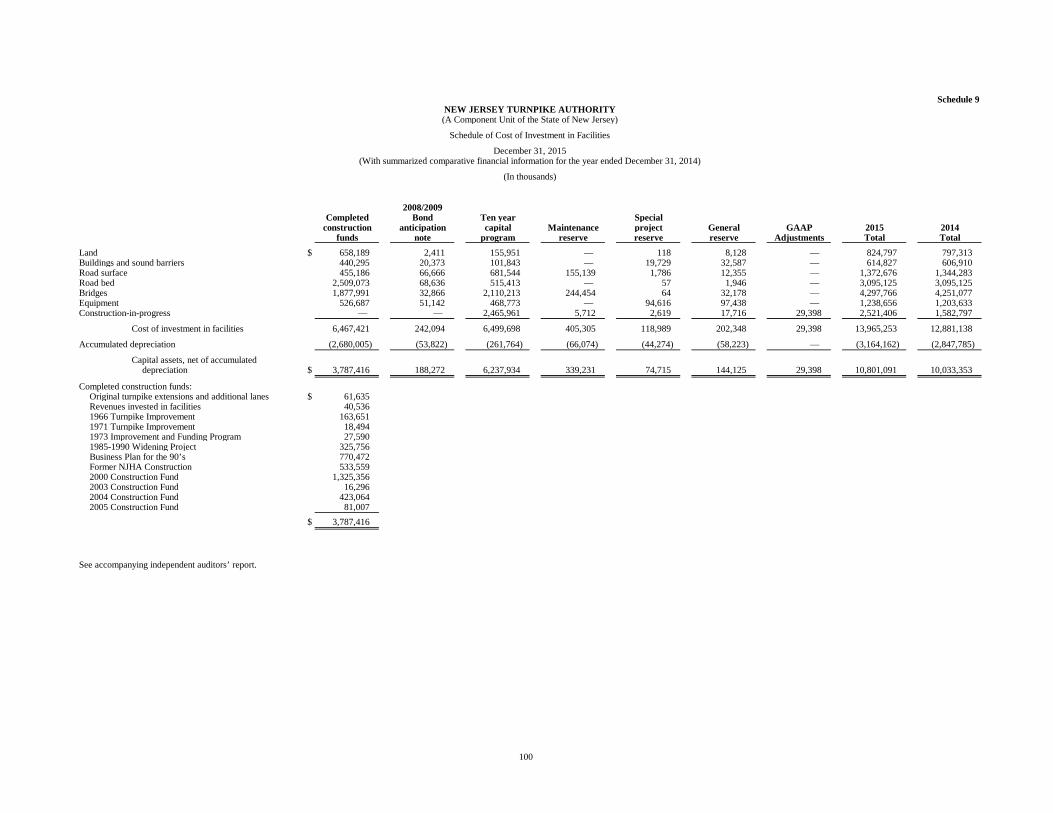
100
Schedule 9NEW JERSEY TURNPIKE AUTHORITY(A Component Unit of the State of New Jersey)
Schedule of Cost of Investment in Facilities
December 31, 2015(With summarized comparative financial information for the year ended December 31, 2014)
(In thousands)
2008/2009Completed Bond Ten year Special
construction anticipation capital Maintenance project General GAAP 2015 2014funds note program reserve reserve reserve Adjustments Total Total
Land $ 658,189 2,411 155,951 — 118 8,128 — 824,797 797,313 Buildings and sound barriers 440,295 20,373 101,843 — 19,729 32,587 — 614,827 606,910 Road surface 455,186 66,666 681,544 155,139 1,786 12,355 — 1,372,676 1,344,283 Road bed 2,509,073 68,636 515,413 — 57 1,946 — 3,095,125 3,095,125 Bridges 1,877,991 32,866 2,110,213 244,454 64 32,178 — 4,297,766 4,251,077 Equipment 526,687 51,142 468,773 — 94,616 97,438 — 1,238,656 1,203,633 Construction-in-progress — — 2,465,961 5,712 2,619 17,716 29,398 2,521,406 1,582,797
Cost of investment in facilities 6,467,421 242,094 6,499,698 405,305 118,989 202,348 29,398 13,965,253 12,881,138
Accumulated depreciation (2,680,005) (53,822) (261,764) (66,074) (44,274) (58,223) — (3,164,162) (2,847,785)
Capital assets, net of accumulateddepreciation $ 3,787,416 188,272 6,237,934 339,231 74,715 144,125 29,398 10,801,091 10,033,353
Completed construction funds:Original turnpike extensions and additional lanes $ 61,635 Revenues invested in facilities 40,536 1966 Turnpike Improvement 163,651 1971 Turnpike Improvement 18,494 1973 Improvement and Funding Program 27,590 1985-1990 Widening Project 325,756 Business Plan for the 90’s 770,472 Former NJHA Construction 533,559 2000 Construction Fund 1,325,356 2003 Construction Fund 16,296 2004 Construction Fund 423,064 2005 Construction Fund 81,007
$ 3,787,416
See accompanying independent auditors’ report.
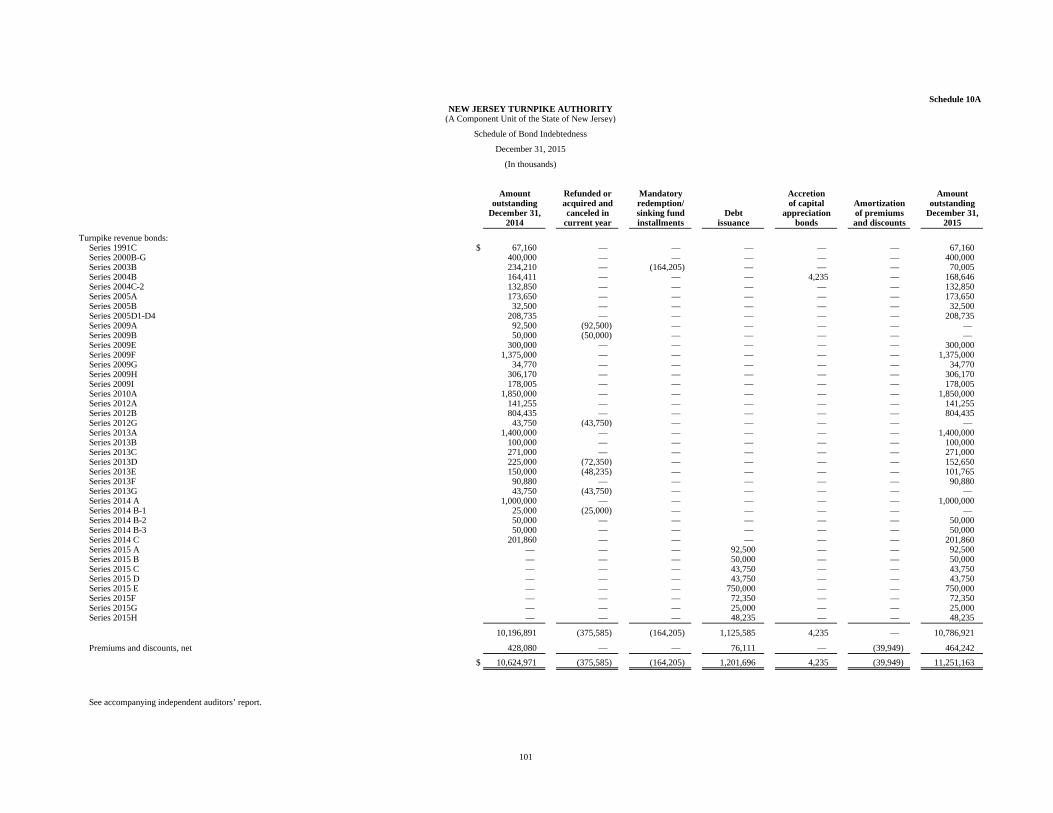
101
Schedule 10ANEW JERSEY TURNPIKE AUTHORITY
(A Component Unit of the State of New Jersey)
Schedule of Bond Indebtedness
December 31, 2015
(In thousands)
Amount Refunded or Mandatory Accretion Amountoutstanding acquired and redemption/ of capital Amortization outstanding
December 31, canceled in sinking fund Debt appreciation of premiums December 31,2014 current year installments issuance bonds and discounts 2015
Turnpike revenue bonds:Series 1991C $ 67,160 — — — — — 67,160 Series 2000B-G 400,000 — — — — — 400,000 Series 2003B 234,210 — (164,205) — — — 70,005 Series 2004B 164,411 — — — 4,235 — 168,646 Series 2004C-2 132,850 — — — — — 132,850 Series 2005A 173,650 — — — — — 173,650 Series 2005B 32,500 — — — — — 32,500 Series 2005D1-D4 208,735 — — — — — 208,735 Series 2009A 92,500 (92,500) — — — — — Series 2009B 50,000 (50,000) — — — — — Series 2009E 300,000 — — — — — 300,000 Series 2009F 1,375,000 — — — — — 1,375,000 Series 2009G 34,770 — — — — — 34,770 Series 2009H 306,170 — — — — — 306,170 Series 2009I 178,005 — — — — — 178,005 Series 2010A 1,850,000 — — — — — 1,850,000 Series 2012A 141,255 — — — — — 141,255 Series 2012B 804,435 — — — — — 804,435 Series 2012G 43,750 (43,750) — — — — — Series 2013A 1,400,000 — — — — — 1,400,000 Series 2013B 100,000 — — — — — 100,000 Series 2013C 271,000 — — — — — 271,000 Series 2013D 225,000 (72,350) — — — — 152,650 Series 2013E 150,000 (48,235) — — — — 101,765 Series 2013F 90,880 — — — — — 90,880 Series 2013G 43,750 (43,750) — — — — — Series 2014 A 1,000,000 — — — — — 1,000,000 Series 2014 B-1 25,000 (25,000) — — — — — Series 2014 B-2 50,000 — — — — — 50,000 Series 2014 B-3 50,000 — — — — — 50,000 Series 2014 C 201,860 — — — — — 201,860 Series 2015 A — — — 92,500 — — 92,500 Series 2015 B — — — 50,000 — — 50,000 Series 2015 C — — — 43,750 — — 43,750 Series 2015 D — — — 43,750 — — 43,750 Series 2015 E — — — 750,000 — — 750,000 Series 2015F — — — 72,350 — — 72,350 Series 2015G — — — 25,000 — — 25,000 Series 2015H — — — 48,235 — — 48,235
10,196,891 (375,585) (164,205) 1,125,585 4,235 — 10,786,921
Premiums and discounts, net 428,080 — — 76,111 — (39,949) 464,242
$ 10,624,971 (375,585) (164,205) 1,201,696 4,235 (39,949) 11,251,163
See accompanying independent auditors’ report.
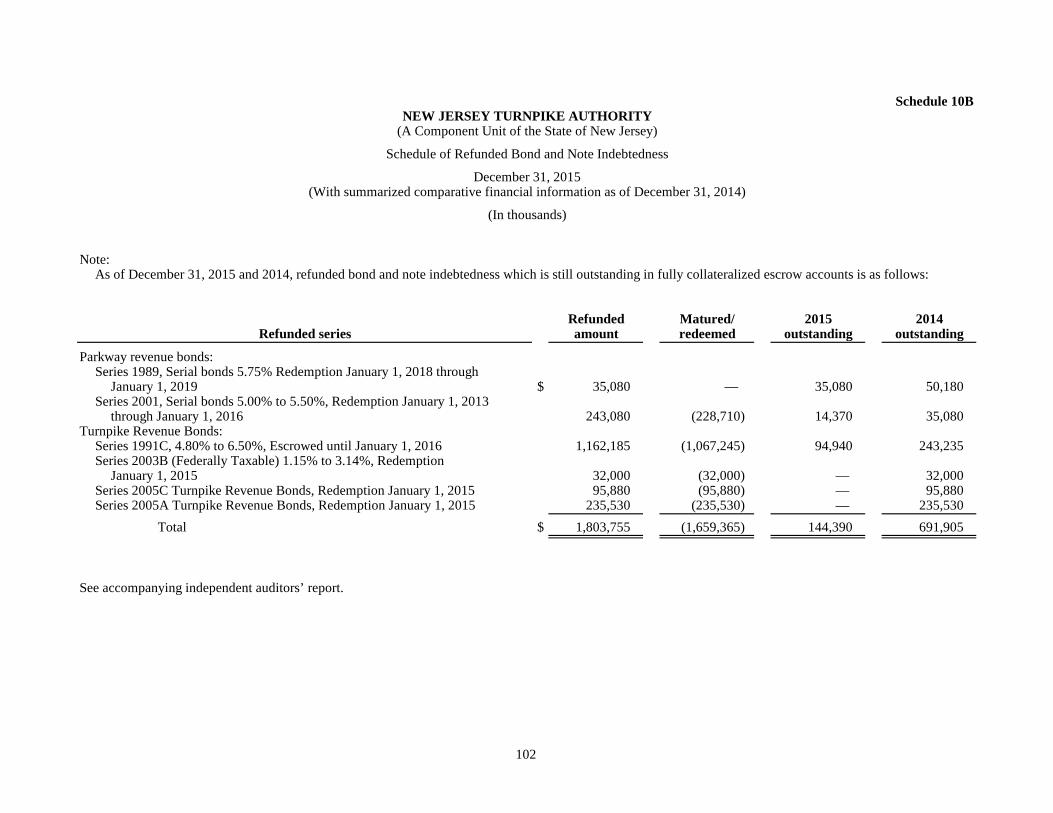
102
Schedule 10BNEW JERSEY TURNPIKE AUTHORITY
(A Component Unit of the State of New Jersey)
Schedule of Refunded Bond and Note Indebtedness
December 31, 2015(With summarized comparative financial information as of December 31, 2014)
(In thousands)
Note:As of December 31, 2015 and 2014, refunded bond and note indebtedness which is still outstanding in fully collateralized escrow accounts is as follows:
Refunded Matured/ 2015 2014Refunded series amount redeemed outstanding outstanding
Parkway revenue bonds:Series 1989, Serial bonds 5.75% Redemption January 1, 2018 through
January 1, 2019 $ 35,080 — 35,080 50,180 Series 2001, Serial bonds 5.00% to 5.50%, Redemption January 1, 2013
through January 1, 2016 243,080 (228,710) 14,370 35,080 Turnpike Revenue Bonds:
Series 1991C, 4.80% to 6.50%, Escrowed until January 1, 2016 1,162,185 (1,067,245) 94,940 243,235 Series 2003B (Federally Taxable) 1.15% to 3.14%, Redemption
January 1, 2015 32,000 (32,000) — 32,000 Series 2005C Turnpike Revenue Bonds, Redemption January 1, 2015 95,880 (95,880) — 95,880 Series 2005A Turnpike Revenue Bonds, Redemption January 1, 2015 235,530 (235,530) — 235,530
Total $ 1,803,755 (1,659,365) 144,390 691,905
See accompanying independent auditors’ report.
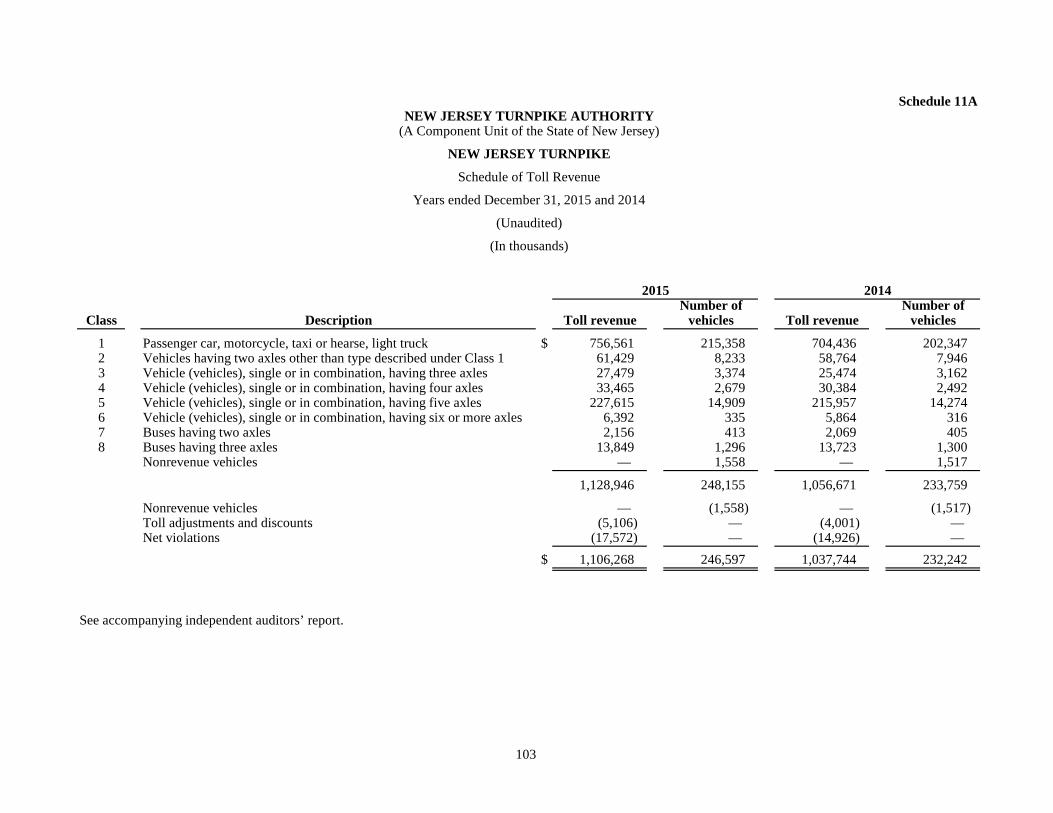
103
Schedule 11ANEW JERSEY TURNPIKE AUTHORITY
(A Component Unit of the State of New Jersey)
NEW JERSEY TURNPIKE
Schedule of Toll Revenue
Years ended December 31, 2015 and 2014
(Unaudited)
(In thousands)
2015 2014Number of Number of
Class Description Toll revenue vehicles Toll revenue vehicles
1 Passenger car, motorcycle, taxi or hearse, light truck $ 756,561 215,358 704,436 202,347 2 Vehicles having two axles other than type described under Class 1 61,429 8,233 58,764 7,946 3 Vehicle (vehicles), single or in combination, having three axles 27,479 3,374 25,474 3,162 4 Vehicle (vehicles), single or in combination, having four axles 33,465 2,679 30,384 2,492 5 Vehicle (vehicles), single or in combination, having five axles 227,615 14,909 215,957 14,274 6 Vehicle (vehicles), single or in combination, having six or more axles 6,392 335 5,864 316 7 Buses having two axles 2,156 413 2,069 405 8 Buses having three axles 13,849 1,296 13,723 1,300
Nonrevenue vehicles — 1,558 — 1,517
1,128,946 248,155 1,056,671 233,759
Nonrevenue vehicles — (1,558) — (1,517) Toll adjustments and discounts (5,106) — (4,001) — Net violations (17,572) — (14,926) —
$ 1,106,268 246,597 1,037,744 232,242
See accompanying independent auditors’ report.

104
Schedule 11BNEW JERSEY TURNPIKE AUTHORITY
(A Component Unit of the State of New Jersey)
GARDEN STATE PARKWAY
Schedule of Toll Revenue
Years ended December 31, 2015 and 2014
(Unaudited)
(In thousands)
2015 2014Number of Number of
Class Description Toll revenue vehicles Toll revenue vehicles
1 Passenger car, motorcycle, taxi or hearse, light truck $ 407,254 374,092 398,210 365,337 2 Vehicles having two axles other than type described under Class 1 2,674 1,124 2,472 1,081 3 Vehicle (vehicles), single or in combination, having three axles 3,476 1,142 3,199 1,046 4 Vehicle (vehicles), single or in combination, having four axles 3,511 815 3,266 772 5 Vehicle (vehicles), single or in combination, having five axles 2,584 532 2,496 520 6 Vehicle (vehicles), single or in combination, having six or more axles 138 25 140 25 7 Buses having two axles 1,589 605 1,521 570 8 Buses having three axles 2,589 949 2,748 998
Nonrevenue vehicles — 1,476 — 1,497
423,815 380,760 414,052 371,846
Nonrevenue vehicles — (1,476) — (1,497) Toll adjustments and discounts (474) — (393) — Net violations (6,476) — (5,655) —
$ 416,865 379,284 408,004 370,349
See accompanying independent auditors’ report.

STATISTICAL SECTION (UNAUDITED)

(This Page Intentionally Left Blank)
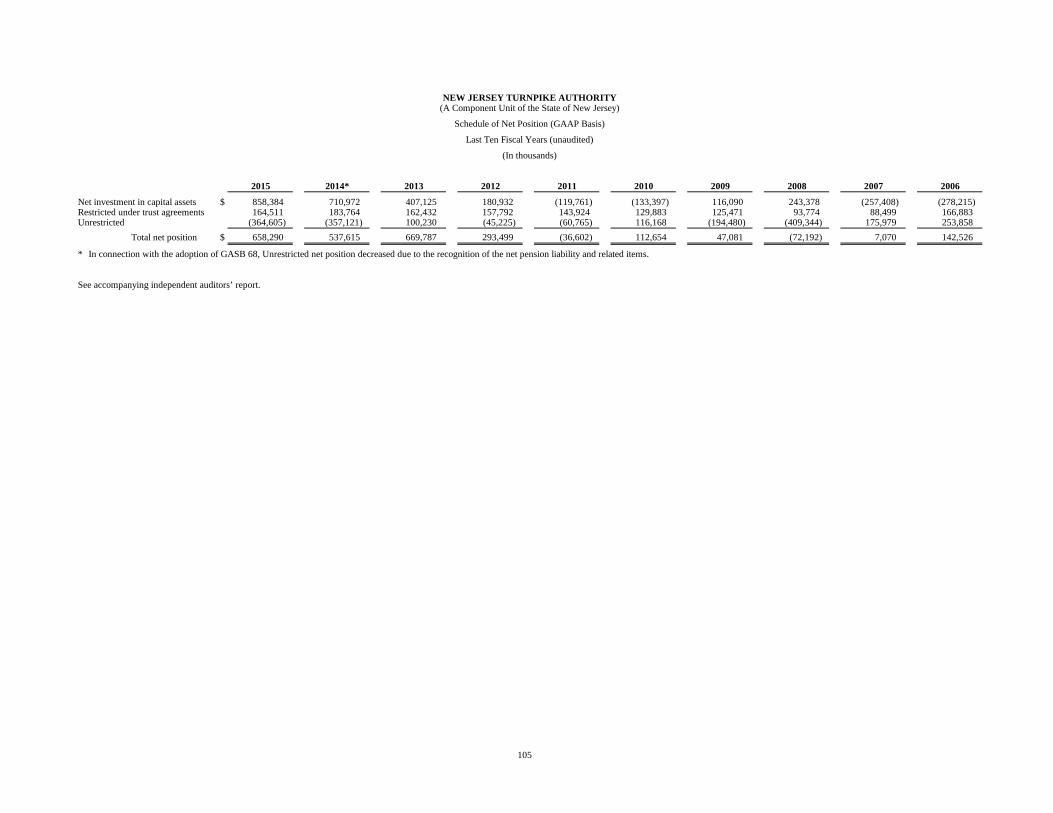
105
NEW JERSEY TURNPIKE AUTHORITY(A Component Unit of the State of New Jersey)
Schedule of Net Position (GAAP Basis)
Last Ten Fiscal Years (unaudited)
(In thousands)
2015 2014* 2013 2012 2011 2010 2009 2008 2007 2006
Net investment in capital assets $ 858,384 710,972 407,125 180,932 (119,761) (133,397) 116,090 243,378 (257,408) (278,215) Restricted under trust agreements 164,511 183,764 162,432 157,792 143,924 129,883 125,471 93,774 88,499 166,883 Unrestricted (364,605) (357,121) 100,230 (45,225) (60,765) 116,168 (194,480) (409,344) 175,979 253,858
Total net position $ 658,290 537,615 669,787 293,499 (36,602) 112,654 47,081 (72,192) 7,070 142,526
* In connection with the adoption of GASB 68, Unrestricted net position decreased due to the recognition of the net pension liability and related items.
See accompanying independent auditors’ report.
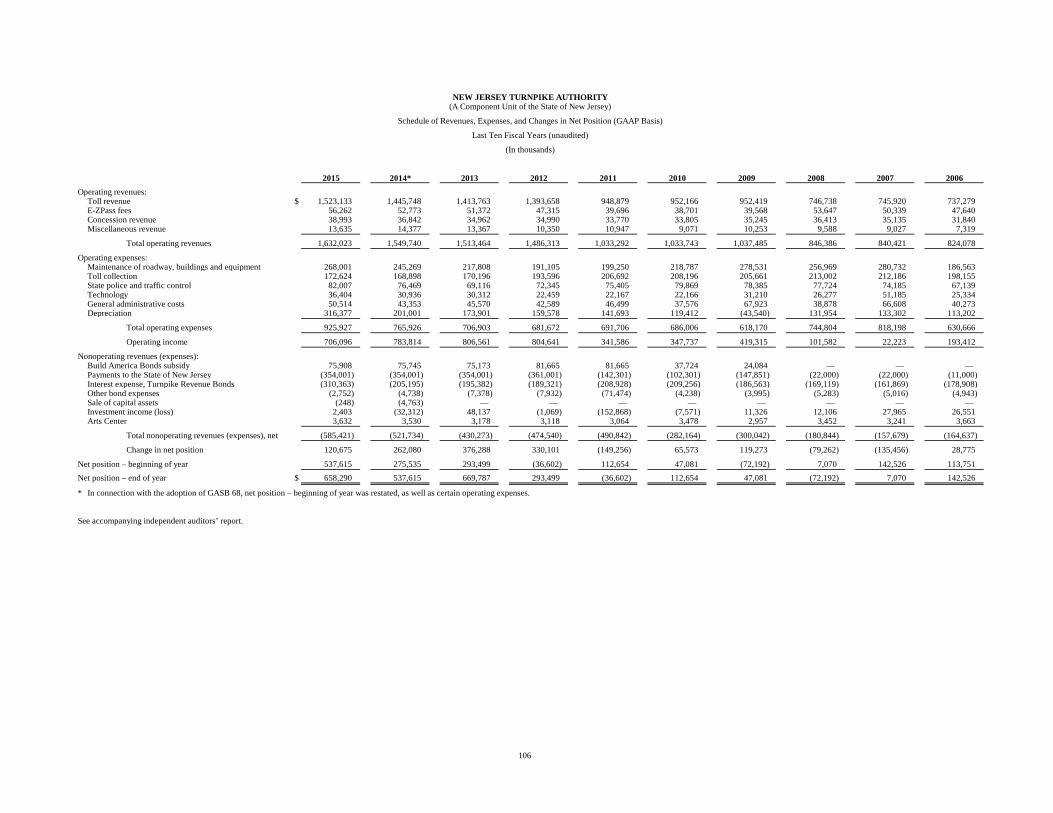
106
NEW JERSEY TURNPIKE AUTHORITY(A Component Unit of the State of New Jersey)
Schedule of Revenues, Expenses, and Changes in Net Position (GAAP Basis)
Last Ten Fiscal Years (unaudited)
(In thousands)
2015 2014* 2013 2012 2011 2010 2009 2008 2007 2006
Operating revenues:Toll revenue $ 1,523,133 1,445,748 1,413,763 1,393,658 948,879 952,166 952,419 746,738 745,920 737,279 E-ZPass fees 56,262 52,773 51,372 47,315 39,696 38,701 39,568 53,647 50,339 47,640 Concession revenue 38,993 36,842 34,962 34,990 33,770 33,805 35,245 36,413 35,135 31,840 Miscellaneous revenue 13,635 14,377 13,367 10,350 10,947 9,071 10,253 9,588 9,027 7,319
Total operating revenues 1,632,023 1,549,740 1,513,464 1,486,313 1,033,292 1,033,743 1,037,485 846,386 840,421 824,078
Operating expenses:Maintenance of roadway, buildings and equipment 268,001 245,269 217,808 191,105 199,250 218,787 278,531 256,969 280,732 186,563 Toll collection 172,624 168,898 170,196 193,596 206,692 208,196 205,661 213,002 212,186 198,155 State police and traffic control 82,007 76,469 69,116 72,345 75,405 79,869 78,385 77,724 74,185 67,139 Technology 36,404 30,936 30,312 22,459 22,167 22,166 31,210 26,277 51,185 25,334 General administrative costs 50,514 43,353 45,570 42,589 46,499 37,576 67,923 38,878 66,608 40,273 Depreciation 316,377 201,001 173,901 159,578 141,693 119,412 (43,540) 131,954 133,302 113,202
Total operating expenses 925,927 765,926 706,903 681,672 691,706 686,006 618,170 744,804 818,198 630,666
Operating income 706,096 783,814 806,561 804,641 341,586 347,737 419,315 101,582 22,223 193,412
Nonoperating revenues (expenses):Build America Bonds subsidy 75,908 75,745 75,173 81,665 81,665 37,724 24,084 — — — Payments to the State of New Jersey (354,001) (354,001) (354,001) (361,001) (142,301) (102,301) (147,851) (22,000) (22,000) (11,000) Interest expense, Turnpike Revenue Bonds (310,363) (205,195) (195,382) (189,321) (208,928) (209,256) (186,563) (169,119) (161,869) (178,908) Other bond expenses (2,752) (4,738) (7,378) (7,932) (71,474) (4,238) (3,995) (5,283) (5,016) (4,943) Sale of capital assets (248) (4,763) — — — — — — — — Investment income (loss) 2,403 (32,312) 48,137 (1,069) (152,868) (7,571) 11,326 12,106 27,965 26,551 Arts Center 3,632 3,530 3,178 3,118 3,064 3,478 2,957 3,452 3,241 3,663
Total nonoperating revenues (expenses), net (585,421) (521,734) (430,273) (474,540) (490,842) (282,164) (300,042) (180,844) (157,679) (164,637)
Change in net position 120,675 262,080 376,288 330,101 (149,256) 65,573 119,273 (79,262) (135,456) 28,775
Net position – beginning of year 537,615 275,535 293,499 (36,602) 112,654 47,081 (72,192) 7,070 142,526 113,751
Net position – end of year $ 658,290 537,615 669,787 293,499 (36,602) 112,654 47,081 (72,192) 7,070 142,526
* In connection with the adoption of GASB 68, net position – beginning of year was restated, as well as certain operating expenses.
See accompanying independent auditors’ report.
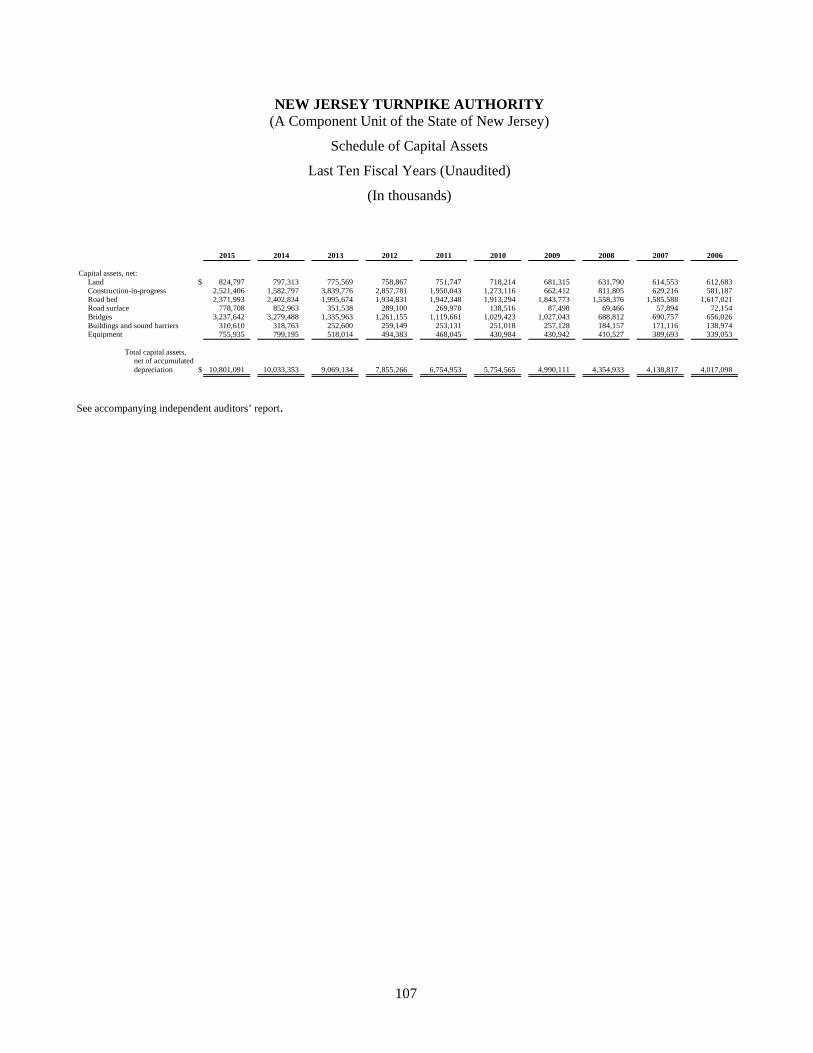
NEW JERSEY TURNPIKE AUTHORITY (A Component Unit of the State of New Jersey)
Schedule of Capital Assets
Last Ten Fiscal Years (Unaudited)
(In thousands)
107
2015 2014 2013 2012 2011 2010 2009 2008 2007 2006
Capital assets, net:Land $ 824,797 797,313 775,569 758,867 751,747 718,214 681,315 631,790 614,553 612,683 Construction-in-progress 2,521,406 1,582,797 3,839,776 2,857,781 1,950,043 1,273,116 662,412 811,805 629,216 581,187 Road bed 2,371,993 2,402,834 1,995,674 1,934,831 1,942,348 1,913,294 1,843,773 1,558,376 1,585,588 1,617,021 Road surface 778,708 852,963 351,538 289,100 269,978 138,516 87,498 69,466 57,894 72,154 Bridges 3,237,642 3,279,488 1,335,963 1,261,155 1,119,661 1,029,423 1,027,043 688,812 690,757 656,026 Buildings and sound barriers 310,610 318,763 252,600 259,149 253,131 251,018 257,128 184,157 171,116 138,974 Equipment 755,935 799,195 518,014 494,383 468,045 430,984 430,942 410,527 389,693 339,053
Total capital assets,net of accumulateddepreciation $ 10,801,091 10,033,353 9,069,134 7,855,266 6,754,953 5,754,565 4,990,111 4,354,933 4,138,817 4,017,098
See accompanying independent auditors’ report.
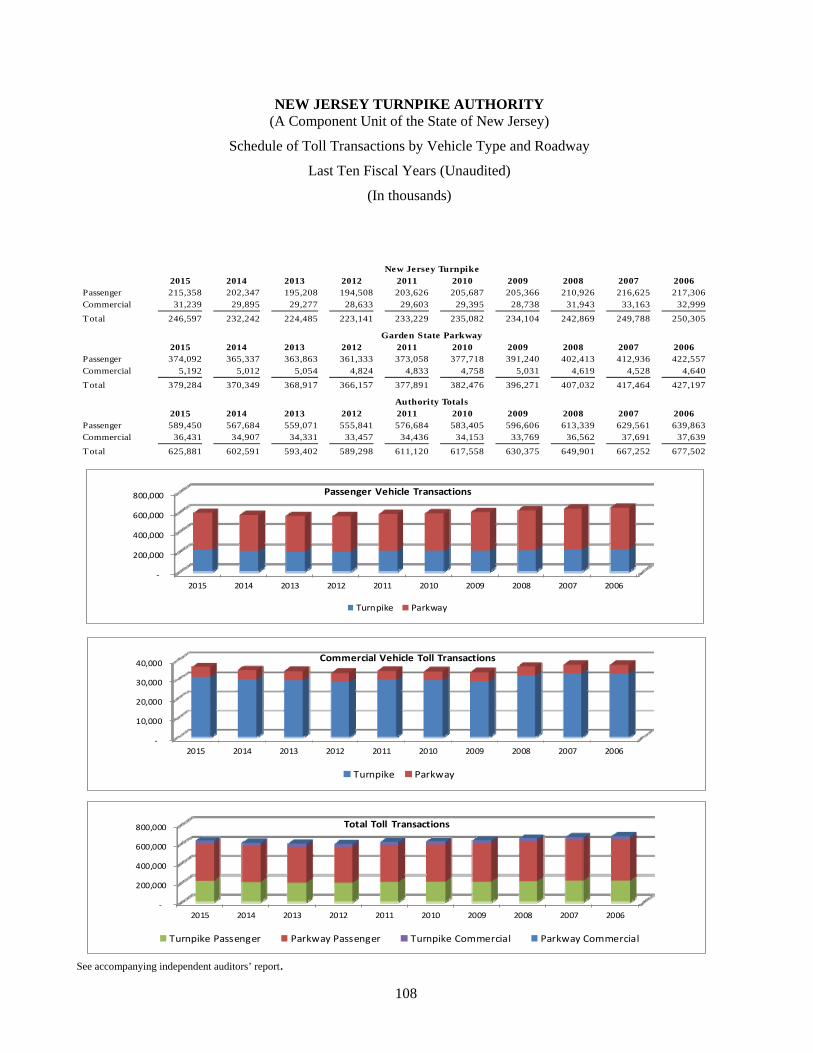
NEW JERSEY TURNPIKE AUTHORITY (A Component Unit of the State of New Jersey)
Schedule of Toll Transactions by Vehicle Type and Roadway
Last Ten Fiscal Years (Unaudited)
(In thousands)
108
2015 2014 2013 2012 2011 2010 2009 2008 2007 2006Passenger 215,358 202,347 195,208 194,508 203,626 205,687 205,366 210,926 216,625 217,306 Commercial 31,239 29,895 29,277 28,633 29,603 29,395 28,738 31,943 33,163 32,999
Total 246,597 232,242 224,485 223,141 233,229 235,082 234,104 242,869 249,788 250,305
2015 2014 2013 2012 2011 2010 2009 2008 2007 2006Passenger 374,092 365,337 363,863 361,333 373,058 377,718 391,240 402,413 412,936 422,557 Commercial 5,192 5,012 5,054 4,824 4,833 4,758 5,031 4,619 4,528 4,640
Total 379,284 370,349 368,917 366,157 377,891 382,476 396,271 407,032 417,464 427,197
2015 2014 2013 2012 2011 2010 2009 2008 2007 2006Passenger 589,450 567,684 559,071 555,841 576,684 583,405 596,606 613,339 629,561 639,863 Commercial 36,431 34,907 34,331 33,457 34,436 34,153 33,769 36,562 37,691 37,639
Total 625,881 602,591 593,402 589,298 611,120 617,558 630,375 649,901 667,252 677,502
New Jersey Turnpike
Garden State Parkway
Authority Totals
‐
200,000
400,000
600,000
800,000
2015 2014 2013 2012 2011 2010 2009 2008 2007 2006
Passenger Vehicle Transactions
Turnpike Parkway
‐
10,000
20,000
30,000
40,000
2015 2014 2013 2012 2011 2010 2009 2008 2007 2006
Commercial Vehicle Toll Transactions
Turnpike Parkway
‐
200,000
400,000
600,000
800,000
2015 2014 2013 2012 2011 2010 2009 2008 2007 2006
Total Toll Transactions
Turnpike Passenger Parkway Passenger Turnpike Commercial Parkway Commercial
See accompanying independent auditors’ report.
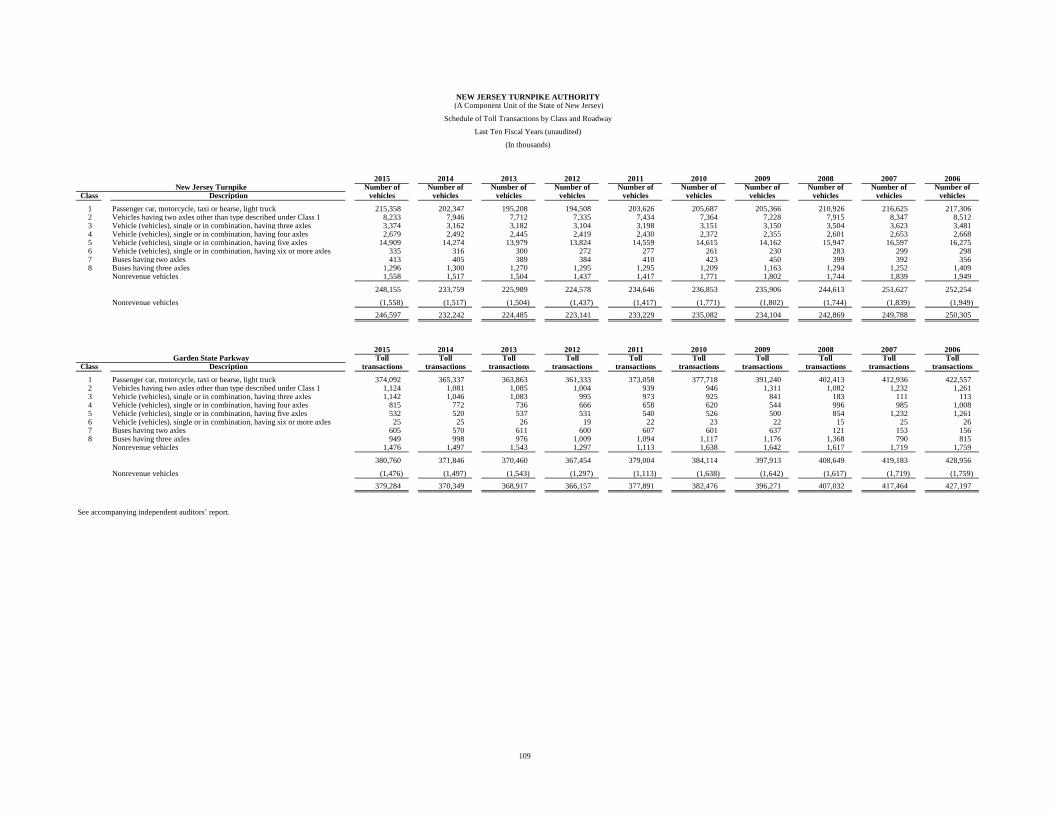
109
NEW JERSEY TURNPIKE AUTHORITY (A Component Unit of the State of New Jersey)
Schedule of Toll Transactions by Class and Roadway
Last Ten Fiscal Years (unaudited)
(In thousands)
2015 2014 2013 2012 2011 2010 2009 2008 2007 2006New Jersey Turnpike Number of Number of Number of Number of Number of Number of Number of Number of Number of Number of
Class Description vehicles vehicles vehicles vehicles vehicles vehicles vehicles vehicles vehicles vehicles
1 Passenger car, motorcycle, taxi or hearse, light truck 215,358 202,347 195,208 194,508 203,626 205,687 205,366 210,926 216,625 217,306 2 Vehicles having two axles other than type described under Class 1 8,233 7,946 7,712 7,335 7,434 7,364 7,228 7,915 8,347 8,512 3 Vehicle (vehicles), single or in combination, having three axles 3,374 3,162 3,182 3,104 3,198 3,151 3,150 3,504 3,623 3,481 4 Vehicle (vehicles), single or in combination, having four axles 2,679 2,492 2,445 2,419 2,430 2,372 2,355 2,601 2,653 2,668 5 Vehicle (vehicles), single or in combination, having five axles 14,909 14,274 13,979 13,824 14,559 14,615 14,162 15,947 16,597 16,275 6 Vehicle (vehicles), single or in combination, having six or more axles 335 316 300 272 277 261 230 283 299 298 7 Buses having two axles 413 405 389 384 410 423 450 399 392 356 8 Buses having three axles 1,296 1,300 1,270 1,295 1,295 1,209 1,163 1,294 1,252 1,409
Nonrevenue vehicles 1,558 1,517 1,504 1,437 1,417 1,771 1,802 1,744 1,839 1,949
248,155 233,759 225,989 224,578 234,646 236,853 235,906 244,613 251,627 252,254
Nonrevenue vehicles (1,558) (1,517) (1,504) (1,437) (1,417) (1,771) (1,802) (1,744) (1,839) (1,949)
246,597 232,242 224,485 223,141 233,229 235,082 234,104 242,869 249,788 250,305
2015 2014 2013 2012 2011 2010 2009 2008 2007 2006Garden State Parkway Toll Toll Toll Toll Toll Toll Toll Toll Toll Toll
Class Description transactions transactions transactions transactions transactions transactions transactions transactions transactions transactions
1 Passenger car, motorcycle, taxi or hearse, light truck 374,092 365,337 363,863 361,333 373,058 377,718 391,240 402,413 412,936 422,557 2 Vehicles having two axles other than type described under Class 1 1,124 1,081 1,085 1,004 939 946 1,311 1,082 1,232 1,261 3 Vehicle (vehicles), single or in combination, having three axles 1,142 1,046 1,083 995 973 925 841 183 111 113 4 Vehicle (vehicles), single or in combination, having four axles 815 772 736 666 658 620 544 996 985 1,008 5 Vehicle (vehicles), single or in combination, having five axles 532 520 537 531 540 526 500 854 1,232 1,261 6 Vehicle (vehicles), single or in combination, having six or more axles 25 25 26 19 22 23 22 15 25 26 7 Buses having two axles 605 570 611 600 607 601 637 121 153 156 8 Buses having three axles 949 998 976 1,009 1,094 1,117 1,176 1,368 790 815
Nonrevenue vehicles 1,476 1,497 1,543 1,297 1,113 1,638 1,642 1,617 1,719 1,759
380,760 371,846 370,460 367,454 379,004 384,114 397,913 408,649 419,183 428,956
Nonrevenue vehicles (1,476) (1,497) (1,543) (1,297) (1,113) (1,638) (1,642) (1,617) (1,719) (1,759)
379,284 370,349 368,917 366,157 377,891 382,476 396,271 407,032 417,464 427,197
See accompanying independent auditors’ report.
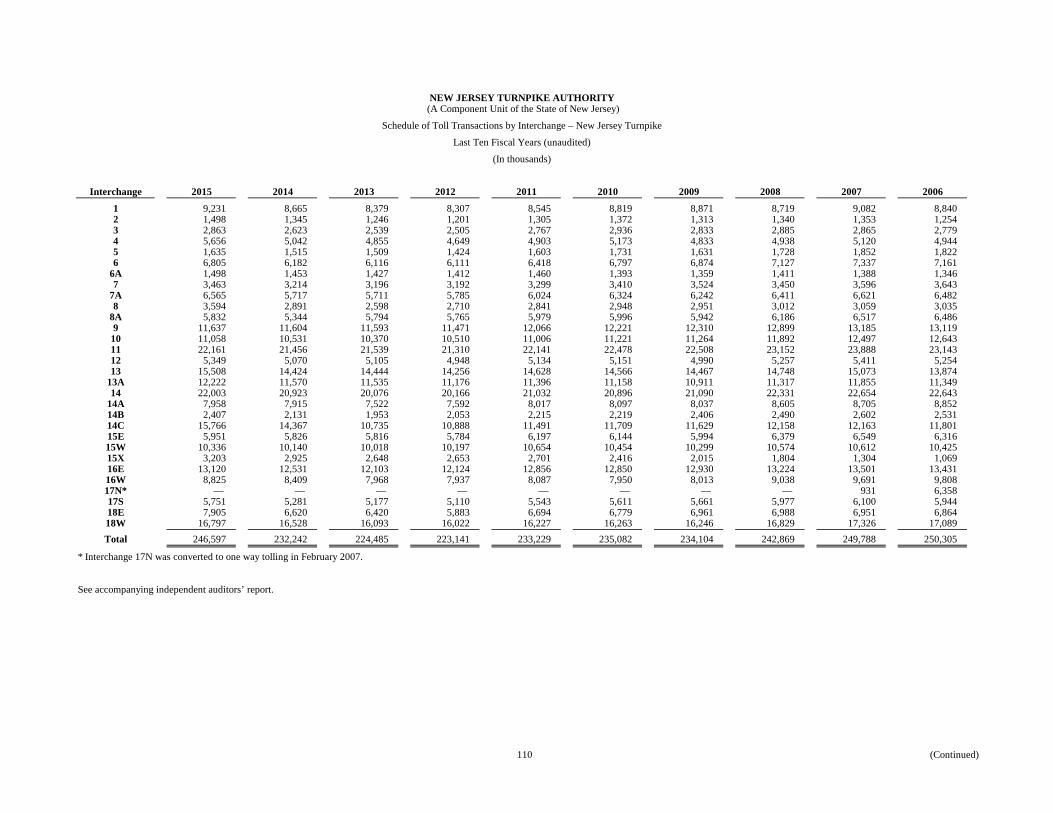
110 (Continued)
NEW JERSEY TURNPIKE AUTHORITY (A Component Unit of the State of New Jersey)
Schedule of Toll Transactions by Interchange – New Jersey Turnpike
Last Ten Fiscal Years (unaudited)
(In thousands)
Interchange 2015 2014 2013 2012 2011 2010 2009 2008 2007 2006
1 9,231 8,665 8,379 8,307 8,545 8,819 8,871 8,719 9,082 8,840 2 1,498 1,345 1,246 1,201 1,305 1,372 1,313 1,340 1,353 1,254 3 2,863 2,623 2,539 2,505 2,767 2,936 2,833 2,885 2,865 2,779 4 5,656 5,042 4,855 4,649 4,903 5,173 4,833 4,938 5,120 4,944 5 1,635 1,515 1,509 1,424 1,603 1,731 1,631 1,728 1,852 1,822 6 6,805 6,182 6,116 6,111 6,418 6,797 6,874 7,127 7,337 7,161
6A 1,498 1,453 1,427 1,412 1,460 1,393 1,359 1,411 1,388 1,346 7 3,463 3,214 3,196 3,192 3,299 3,410 3,524 3,450 3,596 3,643
7A 6,565 5,717 5,711 5,785 6,024 6,324 6,242 6,411 6,621 6,482 8 3,594 2,891 2,598 2,710 2,841 2,948 2,951 3,012 3,059 3,035
8A 5,832 5,344 5,794 5,765 5,979 5,996 5,942 6,186 6,517 6,486 9 11,637 11,604 11,593 11,471 12,066 12,221 12,310 12,899 13,185 13,119
10 11,058 10,531 10,370 10,510 11,006 11,221 11,264 11,892 12,497 12,643 11 22,161 21,456 21,539 21,310 22,141 22,478 22,508 23,152 23,888 23,143 12 5,349 5,070 5,105 4,948 5,134 5,151 4,990 5,257 5,411 5,254 13 15,508 14,424 14,444 14,256 14,628 14,566 14,467 14,748 15,073 13,874
13A 12,222 11,570 11,535 11,176 11,396 11,158 10,911 11,317 11,855 11,349 14 22,003 20,923 20,076 20,166 21,032 20,896 21,090 22,331 22,654 22,643
14A 7,958 7,915 7,522 7,592 8,017 8,097 8,037 8,605 8,705 8,852 14B 2,407 2,131 1,953 2,053 2,215 2,219 2,406 2,490 2,602 2,531 14C 15,766 14,367 10,735 10,888 11,491 11,709 11,629 12,158 12,163 11,801 15E 5,951 5,826 5,816 5,784 6,197 6,144 5,994 6,379 6,549 6,316 15W 10,336 10,140 10,018 10,197 10,654 10,454 10,299 10,574 10,612 10,425 15X 3,203 2,925 2,648 2,653 2,701 2,416 2,015 1,804 1,304 1,069 16E 13,120 12,531 12,103 12,124 12,856 12,850 12,930 13,224 13,501 13,431 16W 8,825 8,409 7,968 7,937 8,087 7,950 8,013 9,038 9,691 9,808 17N* — — — — — — — — 931 6,358 17S 5,751 5,281 5,177 5,110 5,543 5,611 5,661 5,977 6,100 5,944 18E 7,905 6,620 6,420 5,883 6,694 6,779 6,961 6,988 6,951 6,864 18W 16,797 16,528 16,093 16,022 16,227 16,263 16,246 16,829 17,326 17,089
Total 246,597 232,242 224,485 223,141 233,229 235,082 234,104 242,869 249,788 250,305
* Interchange 17N was converted to one way tolling in February 2007.
See accompanying independent auditors’ report.
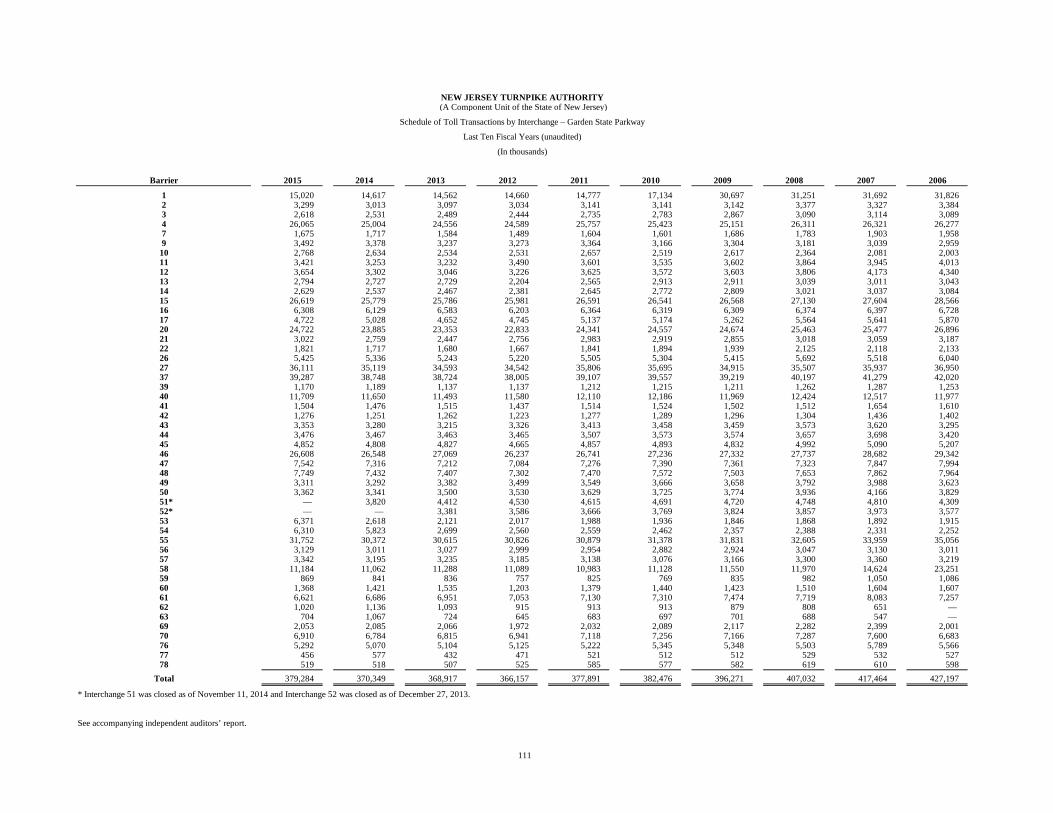
111
NEW JERSEY TURNPIKE AUTHORITY (A Component Unit of the State of New Jersey)
Schedule of Toll Transactions by Interchange – Garden State Parkway
Last Ten Fiscal Years (unaudited)
(In thousands)
Barrier 2015 2014 2013 2012 2011 2010 2009 2008 2007 2006
1 15,020 14,617 14,562 14,660 14,777 17,134 30,697 31,251 31,692 31,826 2 3,299 3,013 3,097 3,034 3,141 3,141 3,142 3,377 3,327 3,384 3 2,618 2,531 2,489 2,444 2,735 2,783 2,867 3,090 3,114 3,089 4 26,065 25,004 24,556 24,589 25,757 25,423 25,151 26,311 26,321 26,277 7 1,675 1,717 1,584 1,489 1,604 1,601 1,686 1,783 1,903 1,958 9 3,492 3,378 3,237 3,273 3,364 3,166 3,304 3,181 3,039 2,959
10 2,768 2,634 2,534 2,531 2,657 2,519 2,617 2,364 2,081 2,003 11 3,421 3,253 3,232 3,490 3,601 3,535 3,602 3,864 3,945 4,013 12 3,654 3,302 3,046 3,226 3,625 3,572 3,603 3,806 4,173 4,340 13 2,794 2,727 2,729 2,204 2,565 2,913 2,911 3,039 3,011 3,043 14 2,629 2,537 2,467 2,381 2,645 2,772 2,809 3,021 3,037 3,084 15 26,619 25,779 25,786 25,981 26,591 26,541 26,568 27,130 27,604 28,566 16 6,308 6,129 6,583 6,203 6,364 6,319 6,309 6,374 6,397 6,728 17 4,722 5,028 4,652 4,745 5,137 5,174 5,262 5,564 5,641 5,870 20 24,722 23,885 23,353 22,833 24,341 24,557 24,674 25,463 25,477 26,896 21 3,022 2,759 2,447 2,756 2,983 2,919 2,855 3,018 3,059 3,187 22 1,821 1,717 1,680 1,667 1,841 1,894 1,939 2,125 2,118 2,133 26 5,425 5,336 5,243 5,220 5,505 5,304 5,415 5,692 5,518 6,040 27 36,111 35,119 34,593 34,542 35,806 35,695 34,915 35,507 35,937 36,950 37 39,287 38,748 38,724 38,005 39,107 39,557 39,219 40,197 41,279 42,020 39 1,170 1,189 1,137 1,137 1,212 1,215 1,211 1,262 1,287 1,253 40 11,709 11,650 11,493 11,580 12,110 12,186 11,969 12,424 12,517 11,977 41 1,504 1,476 1,515 1,437 1,514 1,524 1,502 1,512 1,654 1,610 42 1,276 1,251 1,262 1,223 1,277 1,289 1,296 1,304 1,436 1,402 43 3,353 3,280 3,215 3,326 3,413 3,458 3,459 3,573 3,620 3,295 44 3,476 3,467 3,463 3,465 3,507 3,573 3,574 3,657 3,698 3,420 45 4,852 4,808 4,827 4,665 4,857 4,893 4,832 4,992 5,090 5,207 46 26,608 26,548 27,069 26,237 26,741 27,236 27,332 27,737 28,682 29,342 47 7,542 7,316 7,212 7,084 7,276 7,390 7,361 7,323 7,847 7,994 48 7,749 7,432 7,407 7,302 7,470 7,572 7,503 7,653 7,862 7,964 49 3,311 3,292 3,382 3,499 3,549 3,666 3,658 3,792 3,988 3,623 50 3,362 3,341 3,500 3,530 3,629 3,725 3,774 3,936 4,166 3,829
51* — 3,820 4,412 4,530 4,615 4,691 4,720 4,748 4,810 4,309 52* — — 3,381 3,586 3,666 3,769 3,824 3,857 3,973 3,577
53 6,371 2,618 2,121 2,017 1,988 1,936 1,846 1,868 1,892 1,915 54 6,310 5,823 2,699 2,560 2,559 2,462 2,357 2,388 2,331 2,252 55 31,752 30,372 30,615 30,826 30,879 31,378 31,831 32,605 33,959 35,056 56 3,129 3,011 3,027 2,999 2,954 2,882 2,924 3,047 3,130 3,011 57 3,342 3,195 3,235 3,185 3,138 3,076 3,166 3,300 3,360 3,219 58 11,184 11,062 11,288 11,089 10,983 11,128 11,550 11,970 14,624 23,251 59 869 841 836 757 825 769 835 982 1,050 1,086 60 1,368 1,421 1,535 1,203 1,379 1,440 1,423 1,510 1,604 1,607 61 6,621 6,686 6,951 7,053 7,130 7,310 7,474 7,719 8,083 7,257 62 1,020 1,136 1,093 915 913 913 879 808 651 — 63 704 1,067 724 645 683 697 701 688 547 — 69 2,053 2,085 2,066 1,972 2,032 2,089 2,117 2,282 2,399 2,001 70 6,910 6,784 6,815 6,941 7,118 7,256 7,166 7,287 7,600 6,683 76 5,292 5,070 5,104 5,125 5,222 5,345 5,348 5,503 5,789 5,566 77 456 577 432 471 521 512 512 529 532 527 78 519 518 507 525 585 577 582 619 610 598
Total 379,284 370,349 368,917 366,157 377,891 382,476 396,271 407,032 417,464 427,197
* Interchange 51 was closed as of November 11, 2014 and Interchange 52 was closed as of December 27, 2013.
See accompanying independent auditors’ report.
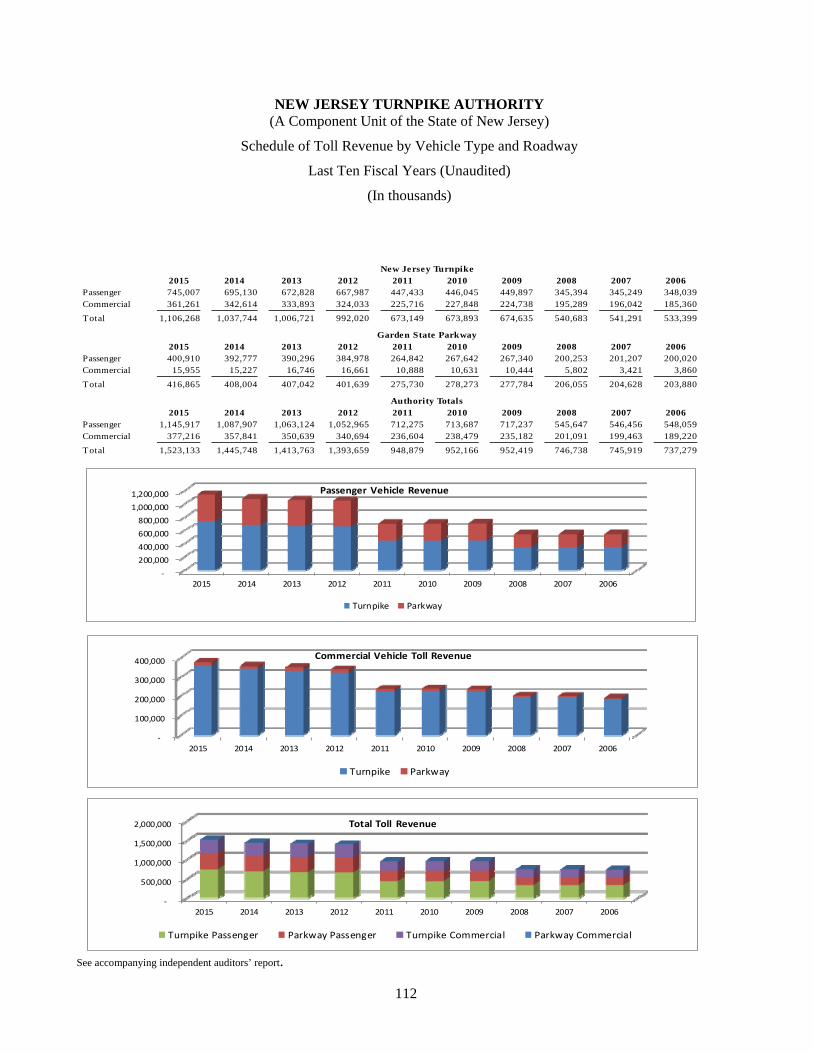
NEW JERSEY TURNPIKE AUTHORITY (A Component Unit of the State of New Jersey)
Schedule of Toll Revenue by Vehicle Type and Roadway
Last Ten Fiscal Years (Unaudited)
(In thousands)
112
2015 2014 2013 2012 2011 2010 2009 2008 2007 2006Passenger 745,007 695,130 672,828 667,987 447,433 446,045 449,897 345,394 345,249 348,039 Commercial 361,261 342,614 333,893 324,033 225,716 227,848 224,738 195,289 196,042 185,360
Total 1,106,268 1,037,744 1,006,721 992,020 673,149 673,893 674,635 540,683 541,291 533,399
2015 2014 2013 2012 2011 2010 2009 2008 2007 2006Passenger 400,910 392,777 390,296 384,978 264,842 267,642 267,340 200,253 201,207 200,020 Commercial 15,955 15,227 16,746 16,661 10,888 10,631 10,444 5,802 3,421 3,860
Total 416,865 408,004 407,042 401,639 275,730 278,273 277,784 206,055 204,628 203,880
2015 2014 2013 2012 2011 2010 2009 2008 2007 2006Passenger 1,145,917 1,087,907 1,063,124 1,052,965 712,275 713,687 717,237 545,647 546,456 548,059 Commercial 377,216 357,841 350,639 340,694 236,604 238,479 235,182 201,091 199,463 189,220
Total 1,523,133 1,445,748 1,413,763 1,393,659 948,879 952,166 952,419 746,738 745,919 737,279
New Jersey Turnpike
Garden State Parkway
Authority Totals
‐
200,000
400,000
600,000
800,000
1,000,000
1,200,000
2015 2014 2013 2012 2011 2010 2009 2008 2007 2006
Passenger Vehicle Revenue
Turnpike Parkway
‐
100,000
200,000
300,000
400,000
2015 2014 2013 2012 2011 2010 2009 2008 2007 2006
Commercial Vehicle Toll Revenue
Turnpike Parkway
‐
500,000
1,000,000
1,500,000
2,000,000
2015 2014 2013 2012 2011 2010 2009 2008 2007 2006
Total Toll Revenue
Turnpike Passenger Parkway Passenger Turnpike Commercial Parkway Commercial
See accompanying independent auditors’ report.
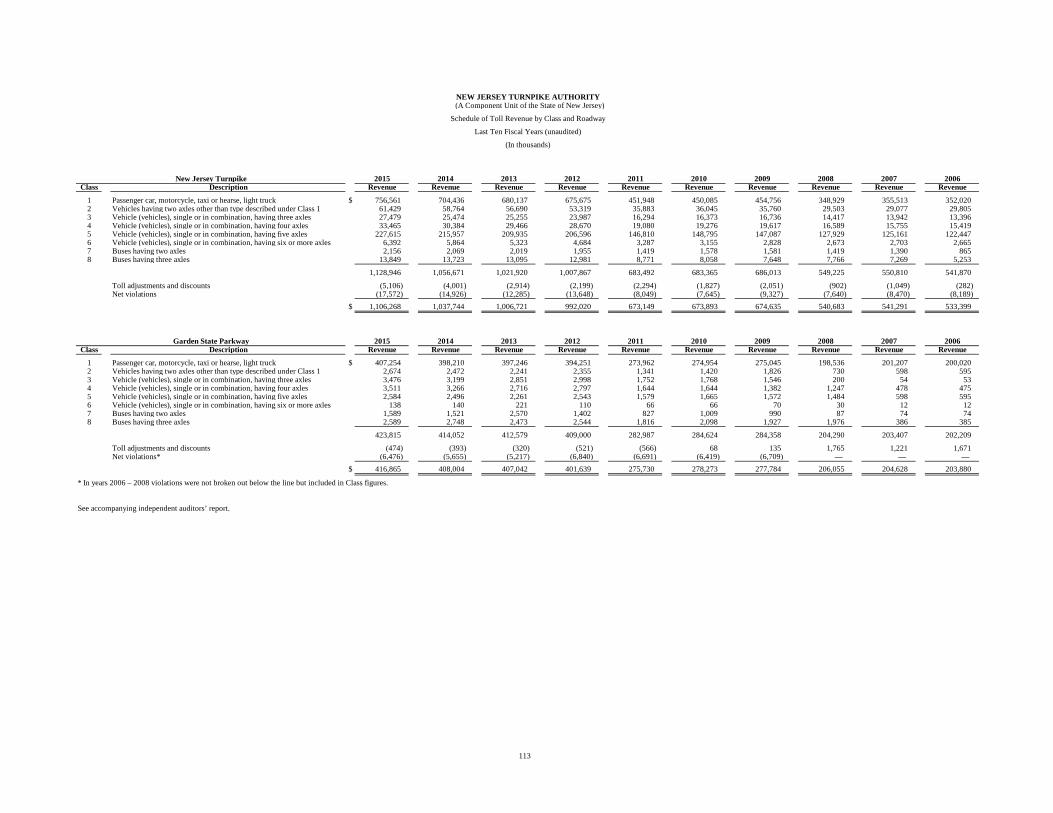
113
NEW JERSEY TURNPIKE AUTHORITY (A Component Unit of the State of New Jersey)
Schedule of Toll Revenue by Class and Roadway
Last Ten Fiscal Years (unaudited)
(In thousands)
New Jersey Turnpike 2015 2014 2013 2012 2011 2010 2009 2008 2007 2006Class Description Revenue Revenue Revenue Revenue Revenue Revenue Revenue Revenue Revenue Revenue
1 Passenger car, motorcycle, taxi or hearse, light truck $ 756,561 704,436 680,137 675,675 451,948 450,085 454,756 348,929 355,513 352,020 2 Vehicles having two axles other than type described under Class 1 61,429 58,764 56,690 53,319 35,883 36,045 35,760 29,503 29,077 29,805 3 Vehicle (vehicles), single or in combination, having three axles 27,479 25,474 25,255 23,987 16,294 16,373 16,736 14,417 13,942 13,396 4 Vehicle (vehicles), single or in combination, having four axles 33,465 30,384 29,466 28,670 19,080 19,276 19,617 16,589 15,755 15,419 5 Vehicle (vehicles), single or in combination, having five axles 227,615 215,957 209,935 206,596 146,810 148,795 147,087 127,929 125,161 122,447 6 Vehicle (vehicles), single or in combination, having six or more axles 6,392 5,864 5,323 4,684 3,287 3,155 2,828 2,673 2,703 2,665 7 Buses having two axles 2,156 2,069 2,019 1,955 1,419 1,578 1,581 1,419 1,390 865 8 Buses having three axles 13,849 13,723 13,095 12,981 8,771 8,058 7,648 7,766 7,269 5,253
1,128,946 1,056,671 1,021,920 1,007,867 683,492 683,365 686,013 549,225 550,810 541,870
Toll adjustments and discounts (5,106) (4,001) (2,914) (2,199) (2,294) (1,827) (2,051) (902) (1,049) (282) Net violations (17,572) (14,926) (12,285) (13,648) (8,049) (7,645) (9,327) (7,640) (8,470) (8,189)
$ 1,106,268 1,037,744 1,006,721 992,020 673,149 673,893 674,635 540,683 541,291 533,399
Garden State Parkway 2015 2014 2013 2012 2011 2010 2009 2008 2007 2006Class Description Revenue Revenue Revenue Revenue Revenue Revenue Revenue Revenue Revenue Revenue
1 Passenger car, motorcycle, taxi or hearse, light truck $ 407,254 398,210 397,246 394,251 273,962 274,954 275,045 198,536 201,207 200,020 2 Vehicles having two axles other than type described under Class 1 2,674 2,472 2,241 2,355 1,341 1,420 1,826 730 598 595 3 Vehicle (vehicles), single or in combination, having three axles 3,476 3,199 2,851 2,998 1,752 1,768 1,546 200 54 53 4 Vehicle (vehicles), single or in combination, having four axles 3,511 3,266 2,716 2,797 1,644 1,644 1,382 1,247 478 475 5 Vehicle (vehicles), single or in combination, having five axles 2,584 2,496 2,261 2,543 1,579 1,665 1,572 1,484 598 595 6 Vehicle (vehicles), single or in combination, having six or more axles 138 140 221 110 66 66 70 30 12 12 7 Buses having two axles 1,589 1,521 2,570 1,402 827 1,009 990 87 74 74 8 Buses having three axles 2,589 2,748 2,473 2,544 1,816 2,098 1,927 1,976 386 385
423,815 414,052 412,579 409,000 282,987 284,624 284,358 204,290 203,407 202,209
Toll adjustments and discounts (474) (393) (320) (521) (566) 68 135 1,765 1,221 1,671 Net violations* (6,476) (5,655) (5,217) (6,840) (6,691) (6,419) (6,709) — — —
$ 416,865 408,004 407,042 401,639 275,730 278,273 277,784 206,055 204,628 203,880
* In years 2006 – 2008 violations were not broken out below the line but included in Class figures.
See accompanying independent auditors’ report.
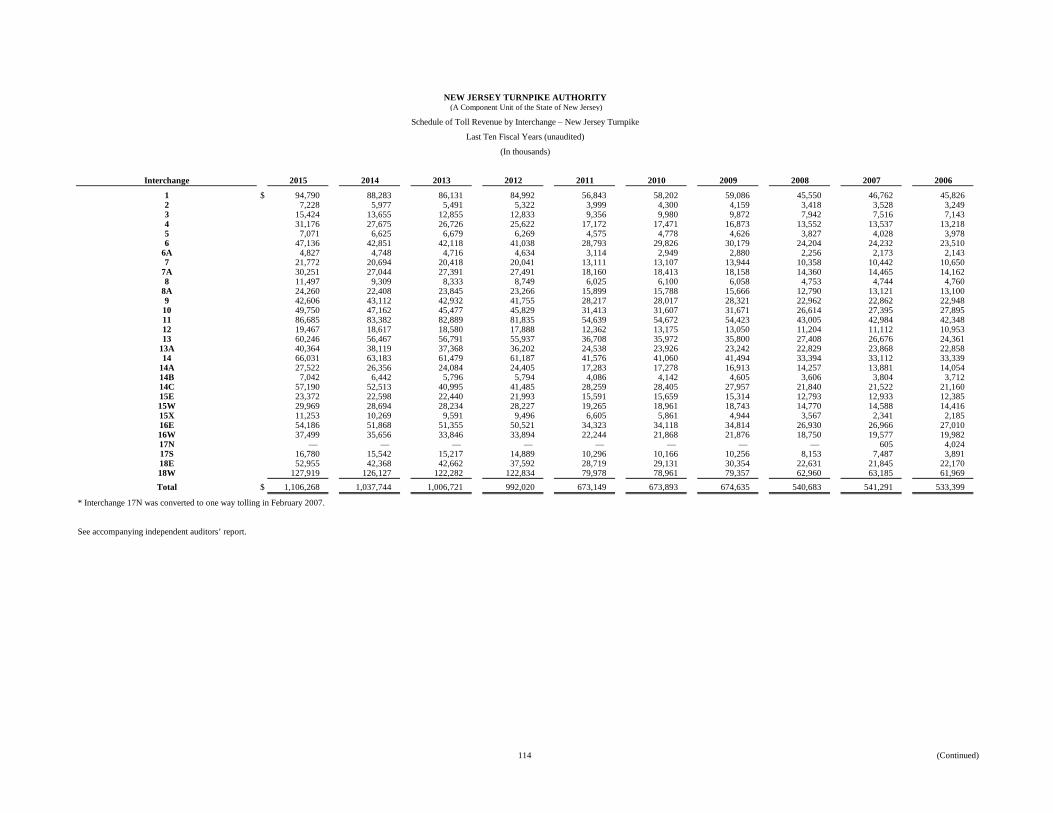
114 (Continued)
NEW JERSEY TURNPIKE AUTHORITY (A Component Unit of the State of New Jersey)
Schedule of Toll Revenue by Interchange – New Jersey Turnpike
Last Ten Fiscal Years (unaudited)
(In thousands)
Interchange 2015 2014 2013 2012 2011 2010 2009 2008 2007 2006
1 $ 94,790 88,283 86,131 84,992 56,843 58,202 59,086 45,550 46,762 45,826 2 7,228 5,977 5,491 5,322 3,999 4,300 4,159 3,418 3,528 3,249 3 15,424 13,655 12,855 12,833 9,356 9,980 9,872 7,942 7,516 7,143 4 31,176 27,675 26,726 25,622 17,172 17,471 16,873 13,552 13,537 13,218 5 7,071 6,625 6,679 6,269 4,575 4,778 4,626 3,827 4,028 3,978 6 47,136 42,851 42,118 41,038 28,793 29,826 30,179 24,204 24,232 23,510
6A 4,827 4,748 4,716 4,634 3,114 2,949 2,880 2,256 2,173 2,143 7 21,772 20,694 20,418 20,041 13,111 13,107 13,944 10,358 10,442 10,650
7A 30,251 27,044 27,391 27,491 18,160 18,413 18,158 14,360 14,465 14,162 8 11,497 9,309 8,333 8,749 6,025 6,100 6,058 4,753 4,744 4,760
8A 24,260 22,408 23,845 23,266 15,899 15,788 15,666 12,790 13,121 13,100 9 42,606 43,112 42,932 41,755 28,217 28,017 28,321 22,962 22,862 22,948
10 49,750 47,162 45,477 45,829 31,413 31,607 31,671 26,614 27,395 27,895 11 86,685 83,382 82,889 81,835 54,639 54,672 54,423 43,005 42,984 42,348 12 19,467 18,617 18,580 17,888 12,362 13,175 13,050 11,204 11,112 10,953 13 60,246 56,467 56,791 55,937 36,708 35,972 35,800 27,408 26,676 24,361
13A 40,364 38,119 37,368 36,202 24,538 23,926 23,242 22,829 23,868 22,858 14 66,031 63,183 61,479 61,187 41,576 41,060 41,494 33,394 33,112 33,339
14A 27,522 26,356 24,084 24,405 17,283 17,278 16,913 14,257 13,881 14,054 14B 7,042 6,442 5,796 5,794 4,086 4,142 4,605 3,606 3,804 3,712 14C 57,190 52,513 40,995 41,485 28,259 28,405 27,957 21,840 21,522 21,160 15E 23,372 22,598 22,440 21,993 15,591 15,659 15,314 12,793 12,933 12,385 15W 29,969 28,694 28,234 28,227 19,265 18,961 18,743 14,770 14,588 14,416 15X 11,253 10,269 9,591 9,496 6,605 5,861 4,944 3,567 2,341 2,185 16E 54,186 51,868 51,355 50,521 34,323 34,118 34,814 26,930 26,966 27,010 16W 37,499 35,656 33,846 33,894 22,244 21,868 21,876 18,750 19,577 19,982 17N — — — — — — — — 605 4,024 17S 16,780 15,542 15,217 14,889 10,296 10,166 10,256 8,153 7,487 3,891 18E 52,955 42,368 42,662 37,592 28,719 29,131 30,354 22,631 21,845 22,170 18W 127,919 126,127 122,282 122,834 79,978 78,961 79,357 62,960 63,185 61,969
Total $ 1,106,268 1,037,744 1,006,721 992,020 673,149 673,893 674,635 540,683 541,291 533,399
* Interchange 17N was converted to one way tolling in February 2007.
See accompanying independent auditors’ report.
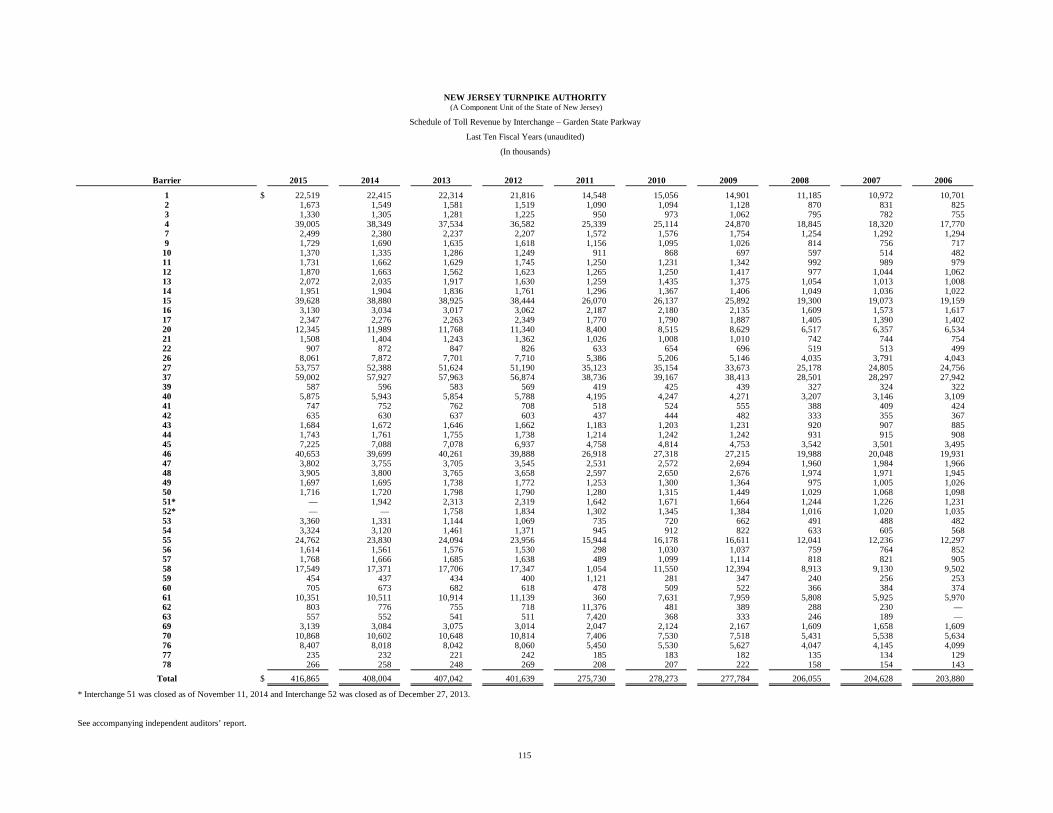
115
NEW JERSEY TURNPIKE AUTHORITY (A Component Unit of the State of New Jersey)
Schedule of Toll Revenue by Interchange – Garden State Parkway
Last Ten Fiscal Years (unaudited)
(In thousands)
Barrier 2015 2014 2013 2012 2011 2010 2009 2008 2007 2006
1 $ 22,519 22,415 22,314 21,816 14,548 15,056 14,901 11,185 10,972 10,701 2 1,673 1,549 1,581 1,519 1,090 1,094 1,128 870 831 825 3 1,330 1,305 1,281 1,225 950 973 1,062 795 782 755 4 39,005 38,349 37,534 36,582 25,339 25,114 24,870 18,845 18,320 17,770 7 2,499 2,380 2,237 2,207 1,572 1,576 1,754 1,254 1,292 1,294 9 1,729 1,690 1,635 1,618 1,156 1,095 1,026 814 756 717
10 1,370 1,335 1,286 1,249 911 868 697 597 514 482 11 1,731 1,662 1,629 1,745 1,250 1,231 1,342 992 989 979 12 1,870 1,663 1,562 1,623 1,265 1,250 1,417 977 1,044 1,062 13 2,072 2,035 1,917 1,630 1,259 1,435 1,375 1,054 1,013 1,008 14 1,951 1,904 1,836 1,761 1,296 1,367 1,406 1,049 1,036 1,022 15 39,628 38,880 38,925 38,444 26,070 26,137 25,892 19,300 19,073 19,159 16 3,130 3,034 3,017 3,062 2,187 2,180 2,135 1,609 1,573 1,617 17 2,347 2,276 2,263 2,349 1,770 1,790 1,887 1,405 1,390 1,402 20 12,345 11,989 11,768 11,340 8,400 8,515 8,629 6,517 6,357 6,534 21 1,508 1,404 1,243 1,362 1,026 1,008 1,010 742 744 754 22 907 872 847 826 633 654 696 519 513 499 26 8,061 7,872 7,701 7,710 5,386 5,206 5,146 4,035 3,791 4,043 27 53,757 52,388 51,624 51,190 35,123 35,154 33,673 25,178 24,805 24,756 37 59,002 57,927 57,963 56,874 38,736 39,167 38,413 28,501 28,297 27,942 39 587 596 583 569 419 425 439 327 324 322 40 5,875 5,943 5,854 5,788 4,195 4,247 4,271 3,207 3,146 3,109 41 747 752 762 708 518 524 555 388 409 424 42 635 630 637 603 437 444 482 333 355 367 43 1,684 1,672 1,646 1,662 1,183 1,203 1,231 920 907 885 44 1,743 1,761 1,755 1,738 1,214 1,242 1,242 931 915 908 45 7,225 7,088 7,078 6,937 4,758 4,814 4,753 3,542 3,501 3,495 46 40,653 39,699 40,261 39,888 26,918 27,318 27,215 19,988 20,048 19,931 47 3,802 3,755 3,705 3,545 2,531 2,572 2,694 1,960 1,984 1,966 48 3,905 3,800 3,765 3,658 2,597 2,650 2,676 1,974 1,971 1,945 49 1,697 1,695 1,738 1,772 1,253 1,300 1,364 975 1,005 1,026 50 1,716 1,720 1,798 1,790 1,280 1,315 1,449 1,029 1,068 1,098
51* — 1,942 2,313 2,319 1,642 1,671 1,664 1,244 1,226 1,231 52* — — 1,758 1,834 1,302 1,345 1,384 1,016 1,020 1,035
53 3,360 1,331 1,144 1,069 735 720 662 491 488 482 54 3,324 3,120 1,461 1,371 945 912 822 633 605 568 55 24,762 23,830 24,094 23,956 15,944 16,178 16,611 12,041 12,236 12,297 56 1,614 1,561 1,576 1,530 298 1,030 1,037 759 764 852 57 1,768 1,666 1,685 1,638 489 1,099 1,114 818 821 905 58 17,549 17,371 17,706 17,347 1,054 11,550 12,394 8,913 9,130 9,502 59 454 437 434 400 1,121 281 347 240 256 253 60 705 673 682 618 478 509 522 366 384 374 61 10,351 10,511 10,914 11,139 360 7,631 7,959 5,808 5,925 5,970 62 803 776 755 718 11,376 481 389 288 230 — 63 557 552 541 511 7,420 368 333 246 189 — 69 3,139 3,084 3,075 3,014 2,047 2,124 2,167 1,609 1,658 1,609 70 10,868 10,602 10,648 10,814 7,406 7,530 7,518 5,431 5,538 5,634 76 8,407 8,018 8,042 8,060 5,450 5,530 5,627 4,047 4,145 4,099 77 235 232 221 242 185 183 182 135 134 129 78 266 258 248 269 208 207 222 158 154 143
Total $ 416,865 408,004 407,042 401,639 275,730 278,273 277,784 206,055 204,628 203,880
* Interchange 51 was closed as of November 11, 2014 and Interchange 52 was closed as of December 27, 2013.
See accompanying independent auditors’ report.
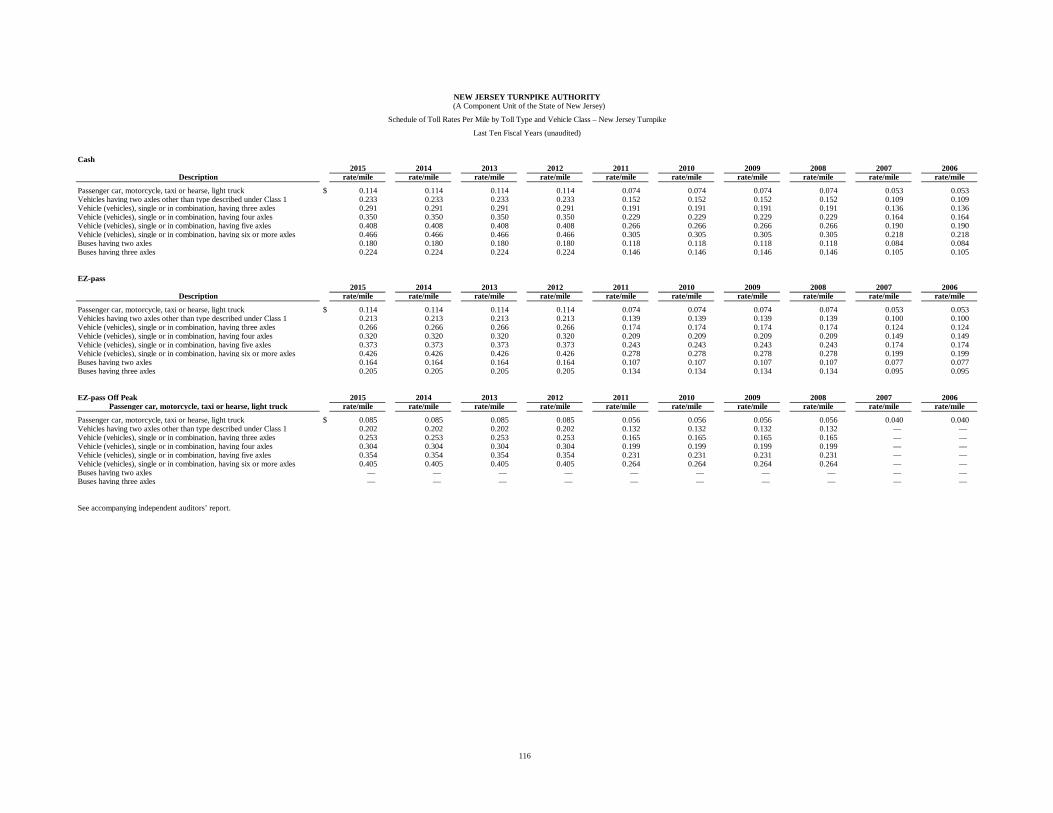
116
NEW JERSEY TURNPIKE AUTHORITY (A Component Unit of the State of New Jersey)
Schedule of Toll Rates Per Mile by Toll Type and Vehicle Class – New Jersey Turnpike
Last Ten Fiscal Years (unaudited)
Cash2015 2014 2013 2012 2011 2010 2009 2008 2007 2006
Description rate/mile rate/mile rate/mile rate/mile rate/mile rate/mile rate/mile rate/mile rate/mile rate/mile
Passenger car, motorcycle, taxi or hearse, light truck $ 0.114 0.114 0.114 0.114 0.074 0.074 0.074 0.074 0.053 0.053 Vehicles having two axles other than type described under Class 1 0.233 0.233 0.233 0.233 0.152 0.152 0.152 0.152 0.109 0.109 Vehicle (vehicles), single or in combination, having three axles 0.291 0.291 0.291 0.291 0.191 0.191 0.191 0.191 0.136 0.136 Vehicle (vehicles), single or in combination, having four axles 0.350 0.350 0.350 0.350 0.229 0.229 0.229 0.229 0.164 0.164 Vehicle (vehicles), single or in combination, having five axles 0.408 0.408 0.408 0.408 0.266 0.266 0.266 0.266 0.190 0.190 Vehicle (vehicles), single or in combination, having six or more axles 0.466 0.466 0.466 0.466 0.305 0.305 0.305 0.305 0.218 0.218 Buses having two axles 0.180 0.180 0.180 0.180 0.118 0.118 0.118 0.118 0.084 0.084 Buses having three axles 0.224 0.224 0.224 0.224 0.146 0.146 0.146 0.146 0.105 0.105
EZ-pass2015 2014 2013 2012 2011 2010 2009 2008 2007 2006
Description rate/mile rate/mile rate/mile rate/mile rate/mile rate/mile rate/mile rate/mile rate/mile rate/mile
Passenger car, motorcycle, taxi or hearse, light truck $ 0.114 0.114 0.114 0.114 0.074 0.074 0.074 0.074 0.053 0.053 Vehicles having two axles other than type described under Class 1 0.213 0.213 0.213 0.213 0.139 0.139 0.139 0.139 0.100 0.100 Vehicle (vehicles), single or in combination, having three axles 0.266 0.266 0.266 0.266 0.174 0.174 0.174 0.174 0.124 0.124 Vehicle (vehicles), single or in combination, having four axles 0.320 0.320 0.320 0.320 0.209 0.209 0.209 0.209 0.149 0.149 Vehicle (vehicles), single or in combination, having five axles 0.373 0.373 0.373 0.373 0.243 0.243 0.243 0.243 0.174 0.174 Vehicle (vehicles), single or in combination, having six or more axles 0.426 0.426 0.426 0.426 0.278 0.278 0.278 0.278 0.199 0.199 Buses having two axles 0.164 0.164 0.164 0.164 0.107 0.107 0.107 0.107 0.077 0.077 Buses having three axles 0.205 0.205 0.205 0.205 0.134 0.134 0.134 0.134 0.095 0.095
EZ-pass Off Peak 2015 2014 2013 2012 2011 2010 2009 2008 2007 2006Passenger car, motorcycle, taxi or hearse, light truck rate/mile rate/mile rate/mile rate/mile rate/mile rate/mile rate/mile rate/mile rate/mile rate/mile
Passenger car, motorcycle, taxi or hearse, light truck $ 0.085 0.085 0.085 0.085 0.056 0.056 0.056 0.056 0.040 0.040 Vehicles having two axles other than type described under Class 1 0.202 0.202 0.202 0.202 0.132 0.132 0.132 0.132 — — Vehicle (vehicles), single or in combination, having three axles 0.253 0.253 0.253 0.253 0.165 0.165 0.165 0.165 — — Vehicle (vehicles), single or in combination, having four axles 0.304 0.304 0.304 0.304 0.199 0.199 0.199 0.199 — — Vehicle (vehicles), single or in combination, having five axles 0.354 0.354 0.354 0.354 0.231 0.231 0.231 0.231 — — Vehicle (vehicles), single or in combination, having six or more axles 0.405 0.405 0.405 0.405 0.264 0.264 0.264 0.264 — — Buses having two axles — — — — — — — — — — Buses having three axles — — — — — — — — — —
See accompanying independent auditors’ report.
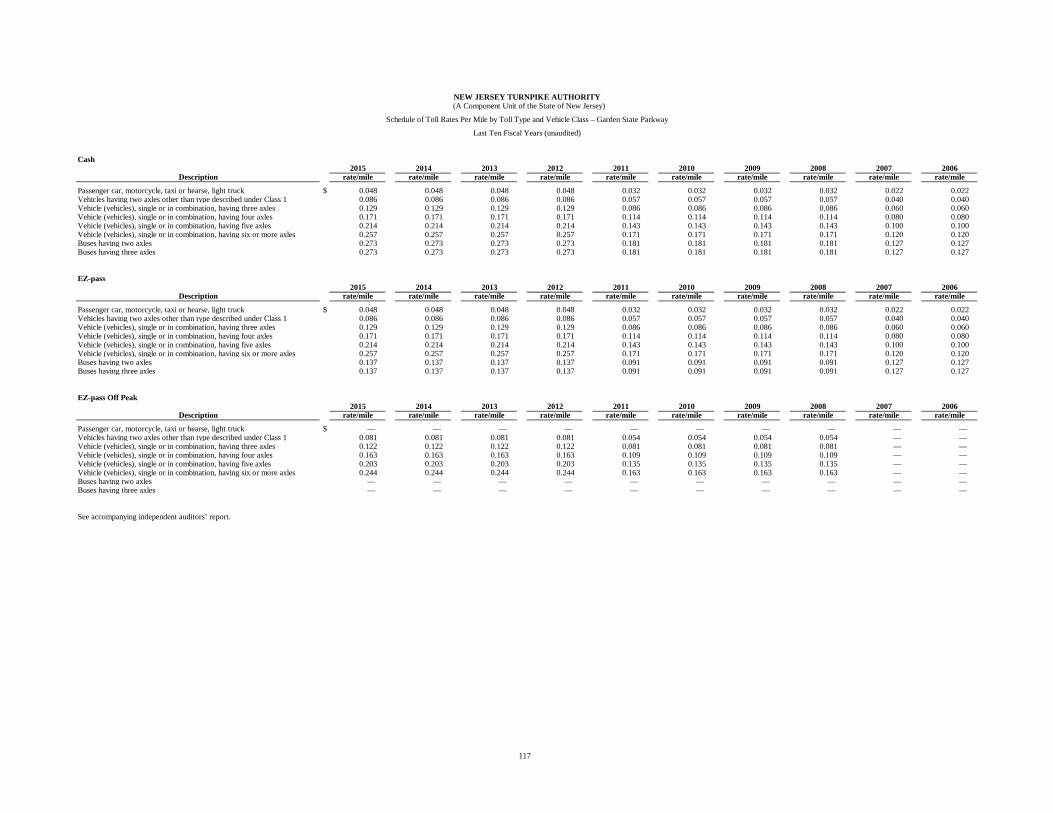
117
NEW JERSEY TURNPIKE AUTHORITY (A Component Unit of the State of New Jersey)
Schedule of Toll Rates Per Mile by Toll Type and Vehicle Class – Garden State Parkway
Last Ten Fiscal Years (unaudited)
Cash2015 2014 2013 2012 2011 2010 2009 2008 2007 2006
Description rate/mile rate/mile rate/mile rate/mile rate/mile rate/mile rate/mile rate/mile rate/mile rate/mile
Passenger car, motorcycle, taxi or hearse, light truck $ 0.048 0.048 0.048 0.048 0.032 0.032 0.032 0.032 0.022 0.022 Vehicles having two axles other than type described under Class 1 0.086 0.086 0.086 0.086 0.057 0.057 0.057 0.057 0.040 0.040 Vehicle (vehicles), single or in combination, having three axles 0.129 0.129 0.129 0.129 0.086 0.086 0.086 0.086 0.060 0.060 Vehicle (vehicles), single or in combination, having four axles 0.171 0.171 0.171 0.171 0.114 0.114 0.114 0.114 0.080 0.080 Vehicle (vehicles), single or in combination, having five axles 0.214 0.214 0.214 0.214 0.143 0.143 0.143 0.143 0.100 0.100 Vehicle (vehicles), single or in combination, having six or more axles 0.257 0.257 0.257 0.257 0.171 0.171 0.171 0.171 0.120 0.120 Buses having two axles 0.273 0.273 0.273 0.273 0.181 0.181 0.181 0.181 0.127 0.127 Buses having three axles 0.273 0.273 0.273 0.273 0.181 0.181 0.181 0.181 0.127 0.127
EZ-pass2015 2014 2013 2012 2011 2010 2009 2008 2007 2006
Description rate/mile rate/mile rate/mile rate/mile rate/mile rate/mile rate/mile rate/mile rate/mile rate/mile
Passenger car, motorcycle, taxi or hearse, light truck $ 0.048 0.048 0.048 0.048 0.032 0.032 0.032 0.032 0.022 0.022 Vehicles having two axles other than type described under Class 1 0.086 0.086 0.086 0.086 0.057 0.057 0.057 0.057 0.040 0.040 Vehicle (vehicles), single or in combination, having three axles 0.129 0.129 0.129 0.129 0.086 0.086 0.086 0.086 0.060 0.060 Vehicle (vehicles), single or in combination, having four axles 0.171 0.171 0.171 0.171 0.114 0.114 0.114 0.114 0.080 0.080 Vehicle (vehicles), single or in combination, having five axles 0.214 0.214 0.214 0.214 0.143 0.143 0.143 0.143 0.100 0.100 Vehicle (vehicles), single or in combination, having six or more axles 0.257 0.257 0.257 0.257 0.171 0.171 0.171 0.171 0.120 0.120 Buses having two axles 0.137 0.137 0.137 0.137 0.091 0.091 0.091 0.091 0.127 0.127 Buses having three axles 0.137 0.137 0.137 0.137 0.091 0.091 0.091 0.091 0.127 0.127
EZ-pass Off Peak2015 2014 2013 2012 2011 2010 2009 2008 2007 2006
Description rate/mile rate/mile rate/mile rate/mile rate/mile rate/mile rate/mile rate/mile rate/mile rate/mile
Passenger car, motorcycle, taxi or hearse, light truck $ — — — — — — — — — — Vehicles having two axles other than type described under Class 1 0.081 0.081 0.081 0.081 0.054 0.054 0.054 0.054 — — Vehicle (vehicles), single or in combination, having three axles 0.122 0.122 0.122 0.122 0.081 0.081 0.081 0.081 — — Vehicle (vehicles), single or in combination, having four axles 0.163 0.163 0.163 0.163 0.109 0.109 0.109 0.109 — — Vehicle (vehicles), single or in combination, having five axles 0.203 0.203 0.203 0.203 0.135 0.135 0.135 0.135 — — Vehicle (vehicles), single or in combination, having six or more axles 0.244 0.244 0.244 0.244 0.163 0.163 0.163 0.163 — — Buses having two axles — — — — — — — — — — Buses having three axles — — — — — — — — — —
See accompanying independent auditors’ report.
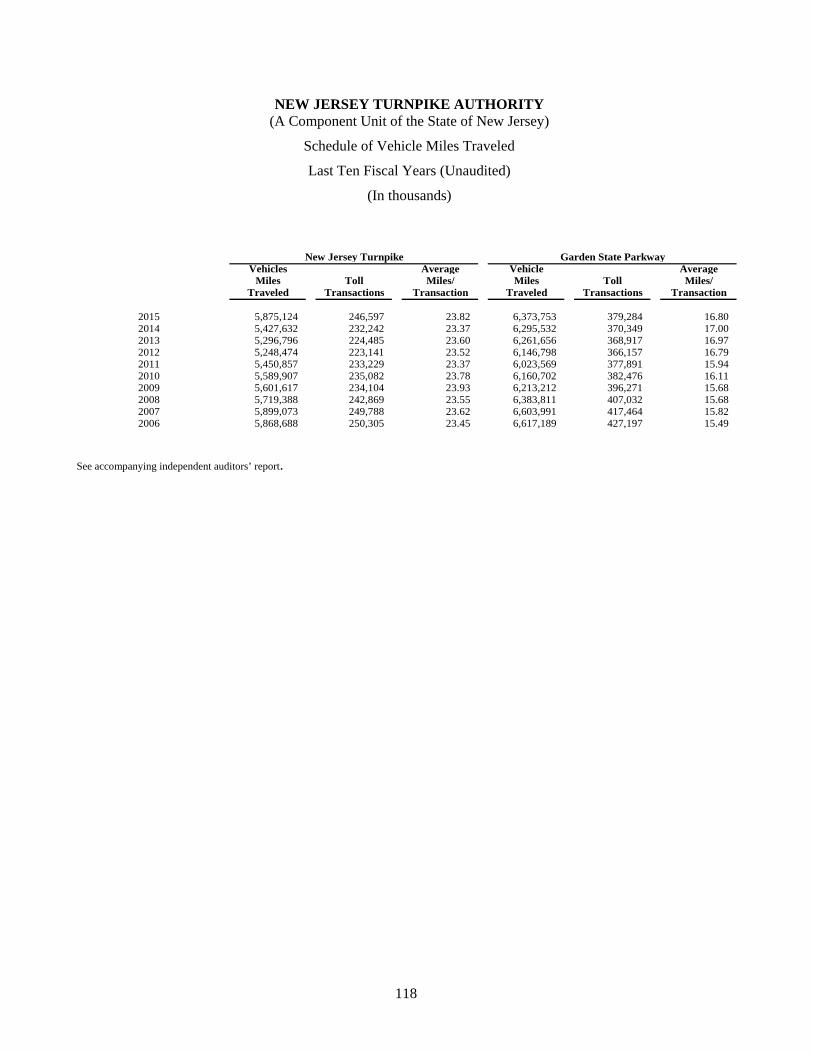
NEW JERSEY TURNPIKE AUTHORITY (A Component Unit of the State of New Jersey)
Schedule of Vehicle Miles Traveled
Last Ten Fiscal Years (Unaudited)
(In thousands)
118
New Jersey Turnpike Garden State ParkwayVehicles Average Vehicle Average
Miles Toll Miles/ Miles Toll Miles/Traveled Transactions Transaction Traveled Transactions Transaction
2015 5,875,124 246,597 23.82 6,373,753 379,284 16.80 2014 5,427,632 232,242 23.37 6,295,532 370,349 17.00 2013 5,296,796 224,485 23.60 6,261,656 368,917 16.97 2012 5,248,474 223,141 23.52 6,146,798 366,157 16.79 2011 5,450,857 233,229 23.37 6,023,569 377,891 15.94 2010 5,589,907 235,082 23.78 6,160,702 382,476 16.11 2009 5,601,617 234,104 23.93 6,213,212 396,271 15.68 2008 5,719,388 242,869 23.55 6,383,811 407,032 15.68 2007 5,899,073 249,788 23.62 6,603,991 417,464 15.82 2006 5,868,688 250,305 23.45 6,617,189 427,197 15.49
See accompanying independent auditors’ report.
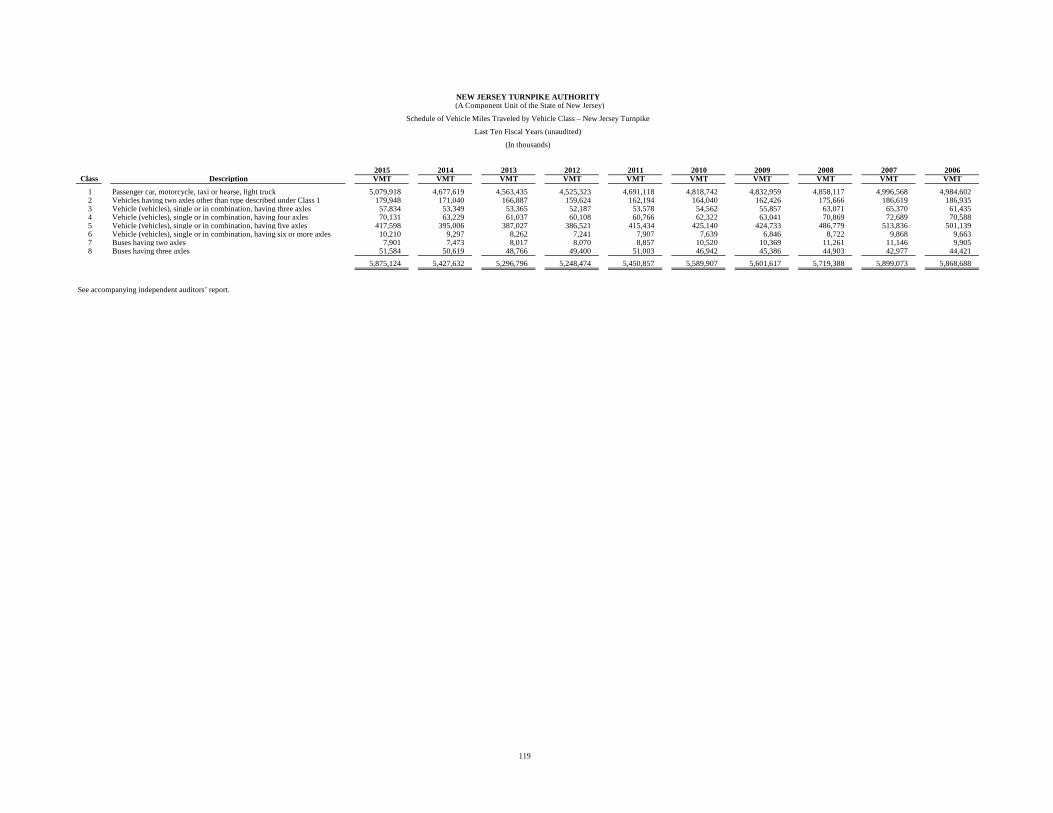
119
NEW JERSEY TURNPIKE AUTHORITY (A Component Unit of the State of New Jersey)
Schedule of Vehicle Miles Traveled by Vehicle Class – New Jersey Turnpike
Last Ten Fiscal Years (unaudited)
(In thousands)
2015 2014 2013 2012 2011 2010 2009 2008 2007 2006Class Description VMT VMT VMT VMT VMT VMT VMT VMT VMT VMT
1 Passenger car, motorcycle, taxi or hearse, light truck 5,079,918 4,677,619 4,563,435 4,525,323 4,691,118 4,818,742 4,832,959 4,858,117 4,996,568 4,984,602 2 Vehicles having two axles other than type described under Class 1 179,948 171,040 166,887 159,624 162,194 164,040 162,426 175,666 186,619 186,935 3 Vehicle (vehicles), single or in combination, having three axles 57,834 53,349 53,365 52,187 53,578 54,562 55,857 63,071 65,370 61,435 4 Vehicle (vehicles), single or in combination, having four axles 70,131 63,229 61,037 60,108 60,766 62,322 63,041 70,869 72,689 70,588 5 Vehicle (vehicles), single or in combination, having five axles 417,598 395,006 387,027 386,521 415,434 425,140 424,733 486,779 513,836 501,139 6 Vehicle (vehicles), single or in combination, having six or more axles 10,210 9,297 8,262 7,241 7,907 7,639 6,846 8,722 9,868 9,663 7 Buses having two axles 7,901 7,473 8,017 8,070 8,857 10,520 10,369 11,261 11,146 9,905 8 Buses having three axles 51,584 50,619 48,766 49,400 51,003 46,942 45,386 44,903 42,977 44,421
5,875,124 5,427,632 5,296,796 5,248,474 5,450,857 5,589,907 5,601,617 5,719,388 5,899,073 5,868,688
See accompanying independent auditors’ report.
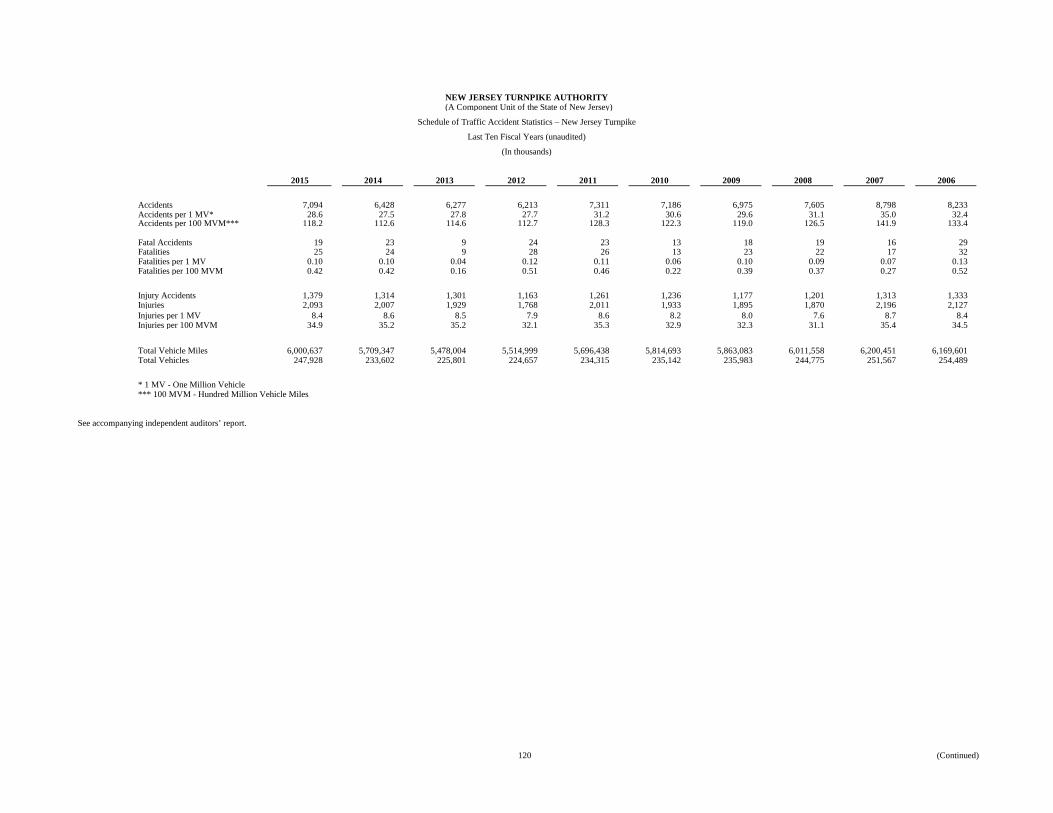
(Continued)120
NEW JERSEY TURNPIKE AUTHORITY (A Component Unit of the State of New Jersey)
Schedule of Traffic Accident Statistics – New Jersey Turnpike
Last Ten Fiscal Years (unaudited)
(In thousands)
2015 2014 2013 2012 2011 2010 2009 2008 2007 2006
Accidents 7,094 6,428 6,277 6,213 7,311 7,186 6,975 7,605 8,798 8,233 Accidents per 1 MV* 28.6 27.5 27.8 27.7 31.2 30.6 29.6 31.1 35.0 32.4 Accidents per 100 MVM*** 118.2 112.6 114.6 112.7 128.3 122.3 119.0 126.5 141.9 133.4
Fatal Accidents 19 23 9 24 23 13 18 19 16 29 Fatalities 25 24 9 28 26 13 23 22 17 32 Fatalities per 1 MV 0.10 0.10 0.04 0.12 0.11 0.06 0.10 0.09 0.07 0.13 Fatalities per 100 MVM 0.42 0.42 0.16 0.51 0.46 0.22 0.39 0.37 0.27 0.52
Injury Accidents 1,379 1,314 1,301 1,163 1,261 1,236 1,177 1,201 1,313 1,333 Injuries 2,093 2,007 1,929 1,768 2,011 1,933 1,895 1,870 2,196 2,127 Injuries per 1 MV 8.4 8.6 8.5 7.9 8.6 8.2 8.0 7.6 8.7 8.4 Injuries per 100 MVM 34.9 35.2 35.2 32.1 35.3 32.9 32.3 31.1 35.4 34.5
Total Vehicle Miles 6,000,637 5,709,347 5,478,004 5,514,999 5,696,438 5,814,693 5,863,083 6,011,558 6,200,451 6,169,601 Total Vehicles 247,928 233,602 225,801 224,657 234,315 235,142 235,983 244,775 251,567 254,489
* 1 MV - One Million Vehicle*** 100 MVM - Hundred Million Vehicle Miles
See accompanying independent auditors’ report.
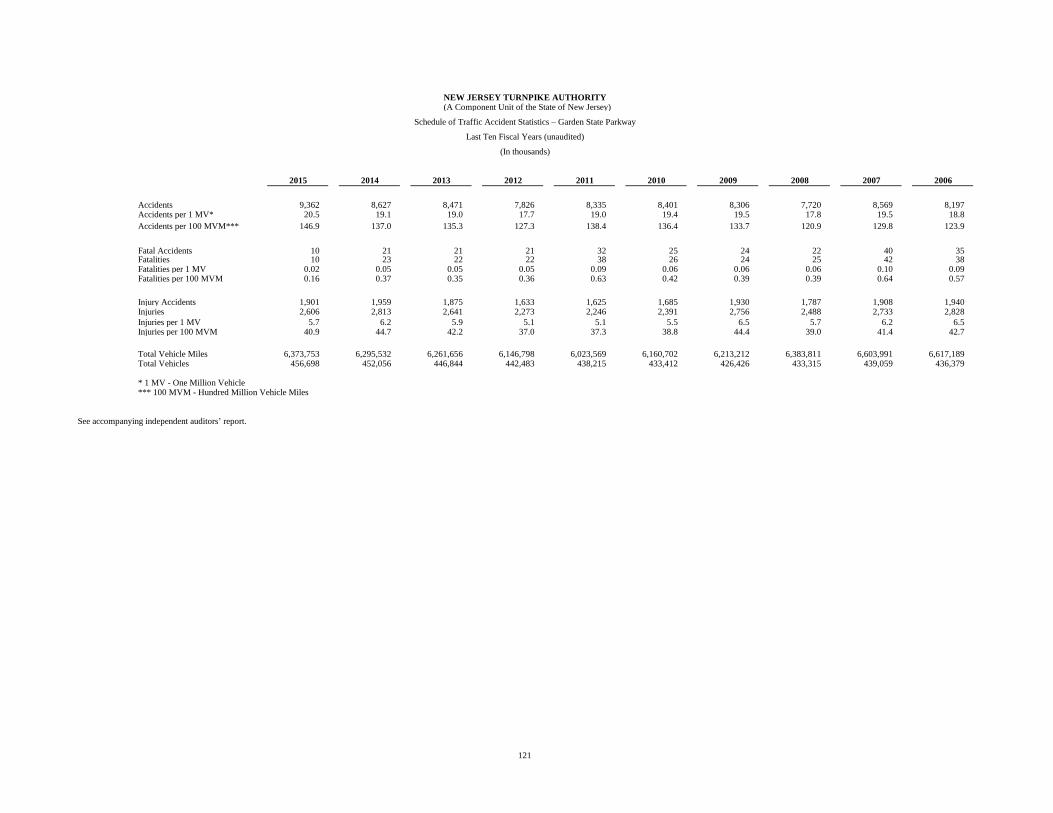
121
NEW JERSEY TURNPIKE AUTHORITY (A Component Unit of the State of New Jersey)
Schedule of Traffic Accident Statistics – Garden State Parkway
Last Ten Fiscal Years (unaudited)
(In thousands)
2015 2014 2013 2012 2011 2010 2009 2008 2007 2006
Accidents 9,362 8,627 8,471 7,826 8,335 8,401 8,306 7,720 8,569 8,197 Accidents per 1 MV* 20.5 19.1 19.0 17.7 19.0 19.4 19.5 17.8 19.5 18.8 Accidents per 100 MVM*** 146.9 137.0 135.3 127.3 138.4 136.4 133.7 120.9 129.8 123.9
Fatal Accidents 10 21 21 21 32 25 24 22 40 35 Fatalities 10 23 22 22 38 26 24 25 42 38 Fatalities per 1 MV 0.02 0.05 0.05 0.05 0.09 0.06 0.06 0.06 0.10 0.09 Fatalities per 100 MVM 0.16 0.37 0.35 0.36 0.63 0.42 0.39 0.39 0.64 0.57
Injury Accidents 1,901 1,959 1,875 1,633 1,625 1,685 1,930 1,787 1,908 1,940 Injuries 2,606 2,813 2,641 2,273 2,246 2,391 2,756 2,488 2,733 2,828 Injuries per 1 MV 5.7 6.2 5.9 5.1 5.1 5.5 6.5 5.7 6.2 6.5 Injuries per 100 MVM 40.9 44.7 42.2 37.0 37.3 38.8 44.4 39.0 41.4 42.7
Total Vehicle Miles 6,373,753 6,295,532 6,261,656 6,146,798 6,023,569 6,160,702 6,213,212 6,383,811 6,603,991 6,617,189 Total Vehicles 456,698 452,056 446,844 442,483 438,215 433,412 426,426 433,315 439,059 436,379
* 1 MV - One Million Vehicle*** 100 MVM - Hundred Million Vehicle Miles
See accompanying independent auditors’ report.
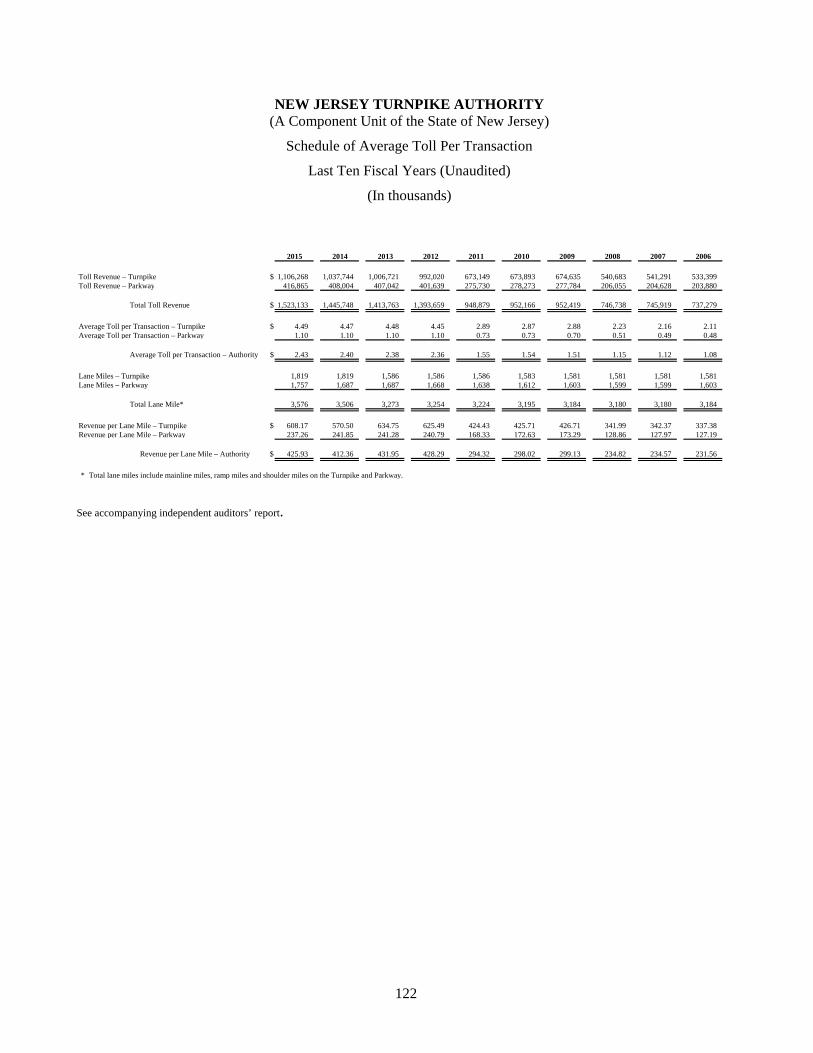
NEW JERSEY TURNPIKE AUTHORITY (A Component Unit of the State of New Jersey)
Schedule of Average Toll Per Transaction
Last Ten Fiscal Years (Unaudited)
(In thousands)
122
2015 2014 2013 2012 2011 2010 2009 2008 2007 2006
Toll Revenue – Turnpike $ 1,106,268 1,037,744 1,006,721 992,020 673,149 673,893 674,635 540,683 541,291 533,399 Toll Revenue – Parkway 416,865 408,004 407,042 401,639 275,730 278,273 277,784 206,055 204,628 203,880
Total Toll Revenue $ 1,523,133 1,445,748 1,413,763 1,393,659 948,879 952,166 952,419 746,738 745,919 737,279
Average Toll per Transaction – Turnpike $ 4.49 4.47 4.48 4.45 2.89 2.87 2.88 2.23 2.16 2.11 Average Toll per Transaction – Parkway 1.10 1.10 1.10 1.10 0.73 0.73 0.70 0.51 0.49 0.48
Average Toll per Transaction – Authority $ 2.43 2.40 2.38 2.36 1.55 1.54 1.51 1.15 1.12 1.08
Lane Miles – Turnpike 1,819 1,819 1,586 1,586 1,586 1,583 1,581 1,581 1,581 1,581 Lane Miles – Parkway 1,757 1,687 1,687 1,668 1,638 1,612 1,603 1,599 1,599 1,603
Total Lane Mile* 3,576 3,506 3,273 3,254 3,224 3,195 3,184 3,180 3,180 3,184
Revenue per Lane Mile – Turnpike $ 608.17 570.50 634.75 625.49 424.43 425.71 426.71 341.99 342.37 337.38 Revenue per Lane Mile – Parkway 237.26 241.85 241.28 240.79 168.33 172.63 173.29 128.86 127.97 127.19
Revenue per Lane Mile – Authority $ 425.93 412.36 431.95 428.29 294.32 298.02 299.13 234.82 234.57 231.56
* Total lane miles include mainline miles, ramp miles and shoulder miles on the Turnpike and Parkway.
See accompanying independent auditors’ report.
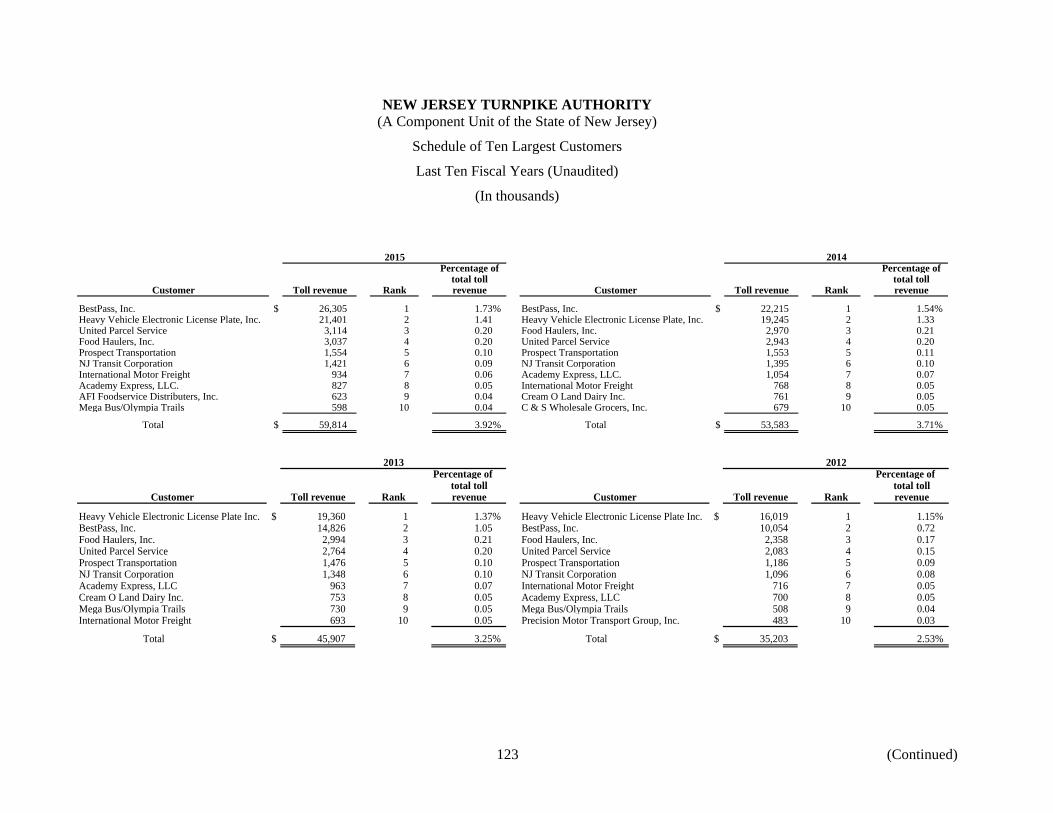
NEW JERSEY TURNPIKE AUTHORITY (A Component Unit of the State of New Jersey)
Schedule of Ten Largest Customers
Last Ten Fiscal Years (Unaudited)
(In thousands)
123 (Continued)
2015Percentage of Percentage of
total toll total tollCustomer Toll revenue Rank revenue Customer Toll revenue Rank revenue
BestPass, Inc. $ 26,305 1 1.73% BestPass, Inc. $ 22,215 1 1.54%Heavy Vehicle Electronic License Plate, Inc. 21,401 2 1.41 Heavy Vehicle Electronic License Plate, Inc. 19,245 2 1.33United Parcel Service 3,114 3 0.20 Food Haulers, Inc. 2,970 3 0.21Food Haulers, Inc. 3,037 4 0.20 United Parcel Service 2,943 4 0.20Prospect Transportation 1,554 5 0.10 Prospect Transportation 1,553 5 0.11NJ Transit Corporation 1,421 6 0.09 NJ Transit Corporation 1,395 6 0.10International Motor Freight 934 7 0.06 Academy Express, LLC. 1,054 7 0.07Academy Express, LLC. 827 8 0.05 International Motor Freight 768 8 0.05AFI Foodservice Distributers, Inc. 623 9 0.04 Cream O Land Dairy Inc. 761 9 0.05Mega Bus/Olympia Trails 598 10 0.04 C & S Wholesale Grocers, Inc. 679 10 0.05
Total $ 59,814 3.92% Total $ 53,583 3.71%
2014
2013 2012Percentage of Percentage of
total toll total tollCustomer Toll revenue Rank revenue Customer Toll revenue Rank revenue
Heavy Vehicle Electronic License Plate Inc. $ 19,360 1 1.37% Heavy Vehicle Electronic License Plate Inc. $ 16,019 1 1.15%BestPass, Inc. 14,826 2 1.05 BestPass, Inc. 10,054 2 0.72Food Haulers, Inc. 2,994 3 0.21 Food Haulers, Inc. 2,358 3 0.17United Parcel Service 2,764 4 0.20 United Parcel Service 2,083 4 0.15Prospect Transportation 1,476 5 0.10 Prospect Transportation 1,186 5 0.09NJ Transit Corporation 1,348 6 0.10 NJ Transit Corporation 1,096 6 0.08Academy Express, LLC 963 7 0.07 International Motor Freight 716 7 0.05Cream O Land Dairy Inc. 753 8 0.05 Academy Express, LLC 700 8 0.05Mega Bus/Olympia Trails 730 9 0.05 Mega Bus/Olympia Trails 508 9 0.04International Motor Freight 693 10 0.05 Precision Motor Transport Group, Inc. 483 10 0.03
Total $ 45,907 3.25% Total $ 35,203 2.53%
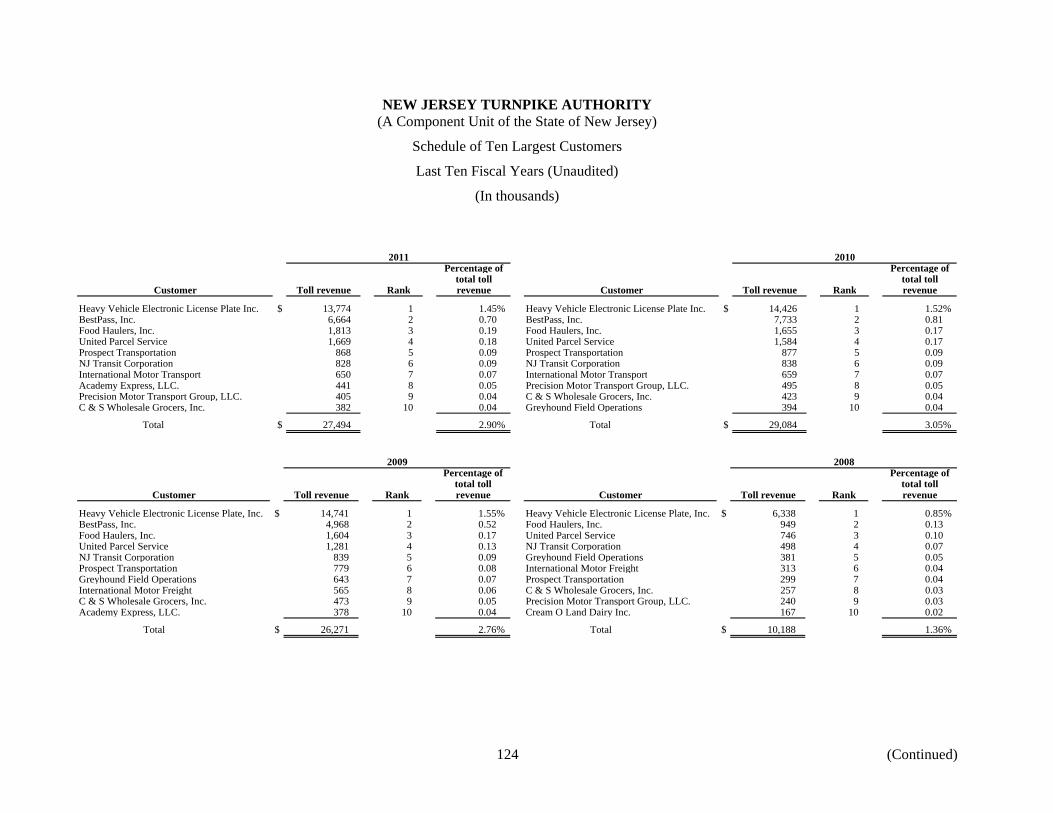
NEW JERSEY TURNPIKE AUTHORITY (A Component Unit of the State of New Jersey)
Schedule of Ten Largest Customers
Last Ten Fiscal Years (Unaudited)
(In thousands)
124 (Continued)
2011 2010Percentage of Percentage of
total toll total tollCustomer Toll revenue Rank revenue Customer Toll revenue Rank revenue
Heavy Vehicle Electronic License Plate Inc. $ 13,774 1 1.45% Heavy Vehicle Electronic License Plate Inc. $ 14,426 1 1.52%BestPass, Inc. 6,664 2 0.70 BestPass, Inc. 7,733 2 0.81Food Haulers, Inc. 1,813 3 0.19 Food Haulers, Inc. 1,655 3 0.17United Parcel Service 1,669 4 0.18 United Parcel Service 1,584 4 0.17Prospect Transportation 868 5 0.09 Prospect Transportation 877 5 0.09NJ Transit Corporation 828 6 0.09 NJ Transit Corporation 838 6 0.09International Motor Transport 650 7 0.07 International Motor Transport 659 7 0.07Academy Express, LLC. 441 8 0.05 Precision Motor Transport Group, LLC. 495 8 0.05Precision Motor Transport Group, LLC. 405 9 0.04 C & S Wholesale Grocers, Inc. 423 9 0.04C & S Wholesale Grocers, Inc. 382 10 0.04 Greyhound Field Operations 394 10 0.04
Total $ 27,494 2.90% Total $ 29,084 3.05%
2009 2008Percentage of Percentage of
total toll total tollCustomer Toll revenue Rank revenue Customer Toll revenue Rank revenue
Heavy Vehicle Electronic License Plate, Inc. $ 14,741 1 1.55% Heavy Vehicle Electronic License Plate, Inc. $ 6,338 1 0.85%BestPass, Inc. 4,968 2 0.52 Food Haulers, Inc. 949 2 0.13Food Haulers, Inc. 1,604 3 0.17 United Parcel Service 746 3 0.10United Parcel Service 1,281 4 0.13 NJ Transit Corporation 498 4 0.07NJ Transit Corporation 839 5 0.09 Greyhound Field Operations 381 5 0.05Prospect Transportation 779 6 0.08 International Motor Freight 313 6 0.04Greyhound Field Operations 643 7 0.07 Prospect Transportation 299 7 0.04International Motor Freight 565 8 0.06 C & S Wholesale Grocers, Inc. 257 8 0.03C & S Wholesale Grocers, Inc. 473 9 0.05 Precision Motor Transport Group, LLC. 240 9 0.03Academy Express, LLC. 378 10 0.04 Cream O Land Dairy Inc. 167 10 0.02
Total $ 26,271 2.76% Total $ 10,188 1.36%
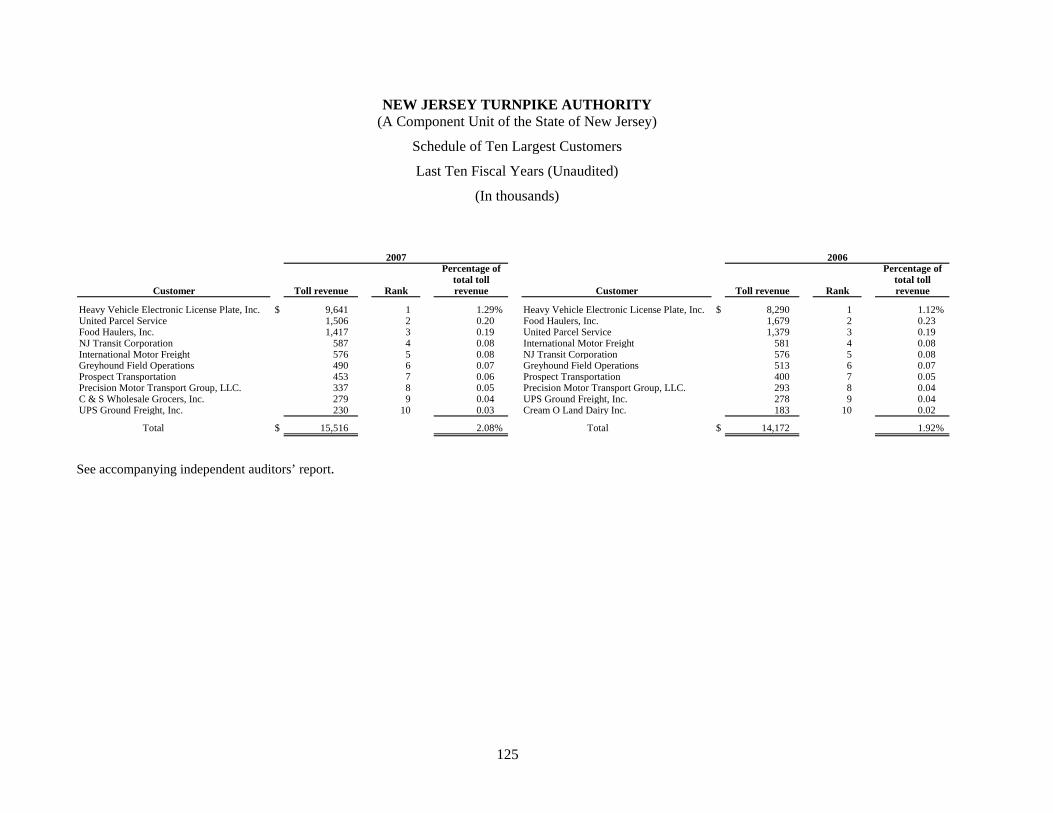
NEW JERSEY TURNPIKE AUTHORITY (A Component Unit of the State of New Jersey)
Schedule of Ten Largest Customers
Last Ten Fiscal Years (Unaudited)
(In thousands)
125
2007 2006Percentage of Percentage of
total toll total tollCustomer Toll revenue Rank revenue Customer Toll revenue Rank revenue
Heavy Vehicle Electronic License Plate, Inc. $ 9,641 1 1.29% Heavy Vehicle Electronic License Plate, Inc. $ 8,290 1 1.12%United Parcel Service 1,506 2 0.20 Food Haulers, Inc. 1,679 2 0.23Food Haulers, Inc. 1,417 3 0.19 United Parcel Service 1,379 3 0.19NJ Transit Corporation 587 4 0.08 International Motor Freight 581 4 0.08International Motor Freight 576 5 0.08 NJ Transit Corporation 576 5 0.08Greyhound Field Operations 490 6 0.07 Greyhound Field Operations 513 6 0.07Prospect Transportation 453 7 0.06 Prospect Transportation 400 7 0.05Precision Motor Transport Group, LLC. 337 8 0.05 Precision Motor Transport Group, LLC. 293 8 0.04C & S Wholesale Grocers, Inc. 279 9 0.04 UPS Ground Freight, Inc. 278 9 0.04UPS Ground Freight, Inc. 230 10 0.03 Cream O Land Dairy Inc. 183 10 0.02
Total $ 15,516 2.08% Total $ 14,172 1.92%
See accompanying independent auditors’ report.
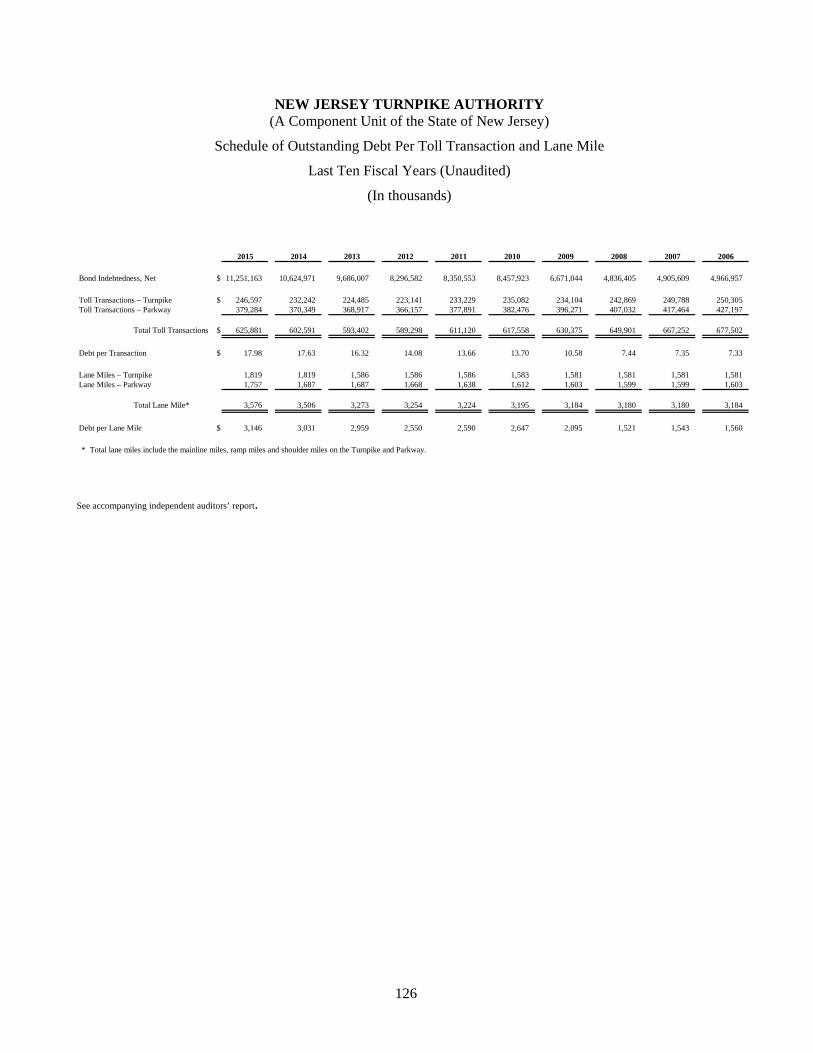
NEW JERSEY TURNPIKE AUTHORITY (A Component Unit of the State of New Jersey)
Schedule of Outstanding Debt Per Toll Transaction and Lane Mile
Last Ten Fiscal Years (Unaudited)
(In thousands)
126
2015 2014 2013 2012 2011 2010 2009 2008 2007 2006
Bond Indebtedness, Net $ 11,251,163 10,624,971 9,686,007 8,296,582 8,350,553 8,457,923 6,671,044 4,836,405 4,905,609 4,966,957
Toll Transactions – Turnpike $ 246,597 232,242 224,485 223,141 233,229 235,082 234,104 242,869 249,788 250,305 Toll Transactions – Parkway 379,284 370,349 368,917 366,157 377,891 382,476 396,271 407,032 417,464 427,197
Total Toll Transactions $ 625,881 602,591 593,402 589,298 611,120 617,558 630,375 649,901 667,252 677,502
Debt per Transaction $ 17.98 17.63 16.32 14.08 13.66 13.70 10.58 7.44 7.35 7.33
Lane Miles – Turnpike 1,819 1,819 1,586 1,586 1,586 1,583 1,581 1,581 1,581 1,581 Lane Miles – Parkway 1,757 1,687 1,687 1,668 1,638 1,612 1,603 1,599 1,599 1,603
Total Lane Mile* 3,576 3,506 3,273 3,254 3,224 3,195 3,184 3,180 3,180 3,184
Debt per Lane Mile $ 3,146 3,031 2,959 2,550 2,590 2,647 2,095 1,521 1,543 1,560
* Total lane miles include the mainline miles, ramp miles and shoulder miles on the Turnpike and Parkway.
See accompanying independent auditors’ report.
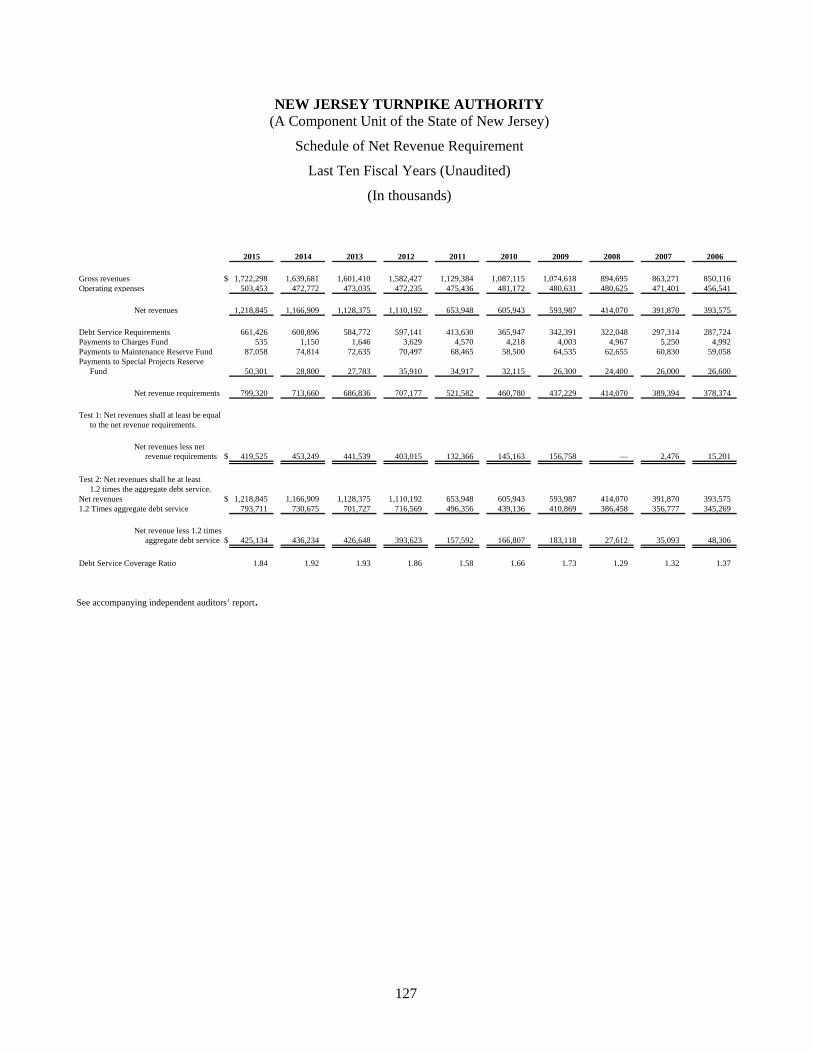
NEW JERSEY TURNPIKE AUTHORITY (A Component Unit of the State of New Jersey)
Schedule of Net Revenue Requirement
Last Ten Fiscal Years (Unaudited)
(In thousands)
127
2015 2014 2013 2012 2011 2010 2009 2008 2007 2006
Gross revenues $ 1,722,298 1,639,681 1,601,410 1,582,427 1,129,384 1,087,115 1,074,618 894,695 863,271 850,116 Operating expenses 503,453 472,772 473,035 472,235 475,436 481,172 480,631 480,625 471,401 456,541
Net revenues 1,218,845 1,166,909 1,128,375 1,110,192 653,948 605,943 593,987 414,070 391,870 393,575
Debt Service Requirements 661,426 608,896 584,772 597,141 413,630 365,947 342,391 322,048 297,314 287,724 Payments to Charges Fund 535 1,150 1,646 3,629 4,570 4,218 4,003 4,967 5,250 4,992 Payments to Maintenance Reserve Fund 87,058 74,814 72,635 70,497 68,465 58,500 64,535 62,655 60,830 59,058 Payments to Special Projects Reserve
Fund 50,301 28,800 27,783 35,910 34,917 32,115 26,300 24,400 26,000 26,600
Net revenue requirements 799,320 713,660 686,836 707,177 521,582 460,780 437,229 414,070 389,394 378,374
Test 1: Net revenues shall at least be equalto the net revenue requirements.
Net revenues less netrevenue requirements $ 419,525 453,249 441,539 403,015 132,366 145,163 156,758 — 2,476 15,201
Test 2: Net revenues shall be at least1.2 times the aggregate debt service.
Net revenues $ 1,218,845 1,166,909 1,128,375 1,110,192 653,948 605,943 593,987 414,070 391,870 393,575 1.2 Times aggregate debt service 793,711 730,675 701,727 716,569 496,356 439,136 410,869 386,458 356,777 345,269
Net revenue less 1.2 timesaggregate debt service $ 425,134 436,234 426,648 393,623 157,592 166,807 183,118 27,612 35,093 48,306
Debt Service Coverage Ratio 1.84 1.92 1.93 1.86 1.58 1.66 1.73 1.29 1.32 1.37
See accompanying independent auditors’ report.
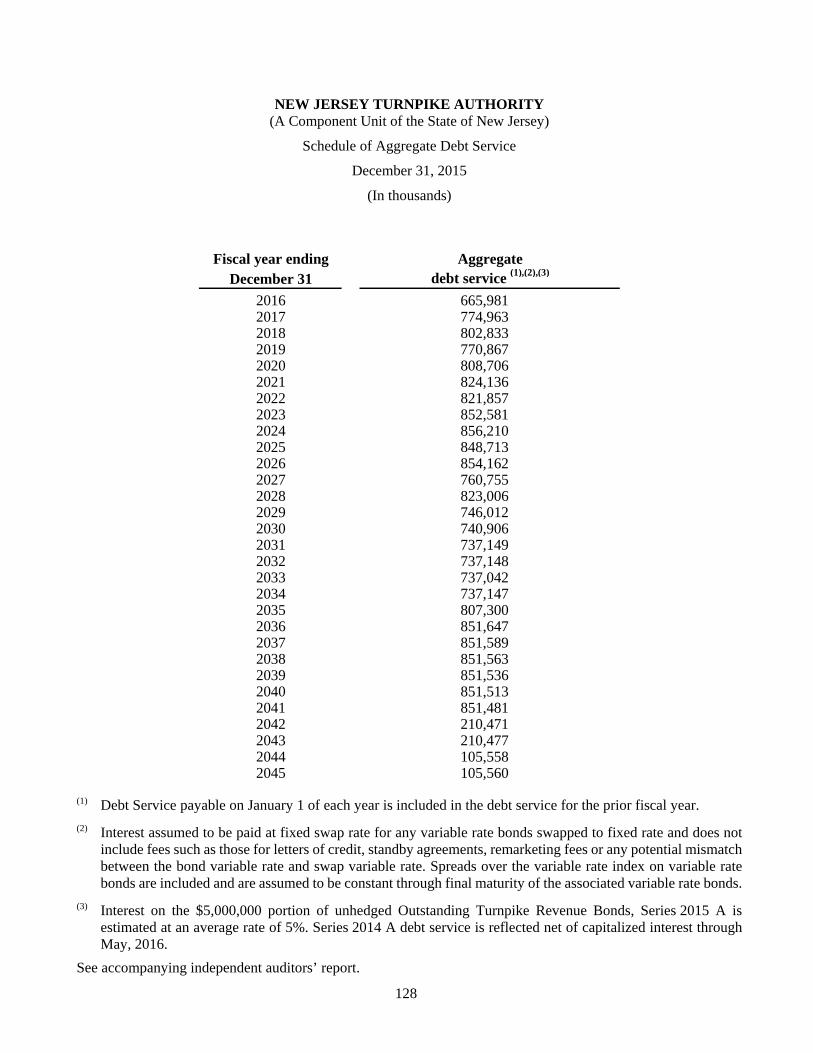
NEW JERSEY TURNPIKE AUTHORITY (A Component Unit of the State of New Jersey)
Schedule of Aggregate Debt Service
December 31, 2015
(In thousands)
128
Fiscal year ending AggregateDecember 31 debt service (1),(2),(3)
2016 665,981 2017 774,963 2018 802,833 2019 770,867 2020 808,706 2021 824,136 2022 821,857 2023 852,581 2024 856,210 2025 848,713 2026 854,162 2027 760,755 2028 823,006 2029 746,012 2030 740,906 2031 737,149 2032 737,148 2033 737,042 2034 737,147 2035 807,300 2036 851,647 2037 851,589 2038 851,563 2039 851,536 2040 851,513 2041 851,481 2042 210,471 2043 210,477 2044 105,558 2045 105,560
(1) Debt Service payable on January 1 of each year is included in the debt service for the prior fiscal year.
(2) Interest assumed to be paid at fixed swap rate for any variable rate bonds swapped to fixed rate and does not include fees such as those for letters of credit, standby agreements, remarketing fees or any potential mismatch between the bond variable rate and swap variable rate. Spreads over the variable rate index on variable rate bonds are included and are assumed to be constant through final maturity of the associated variable rate bonds.
(3) Interest on the $5,000,000 portion of unhedged Outstanding Turnpike Revenue Bonds, Series 2015 A is estimated at an average rate of 5%. Series 2014 A debt service is reflected net of capitalized interest through May, 2016.
See accompanying independent auditors’ report.
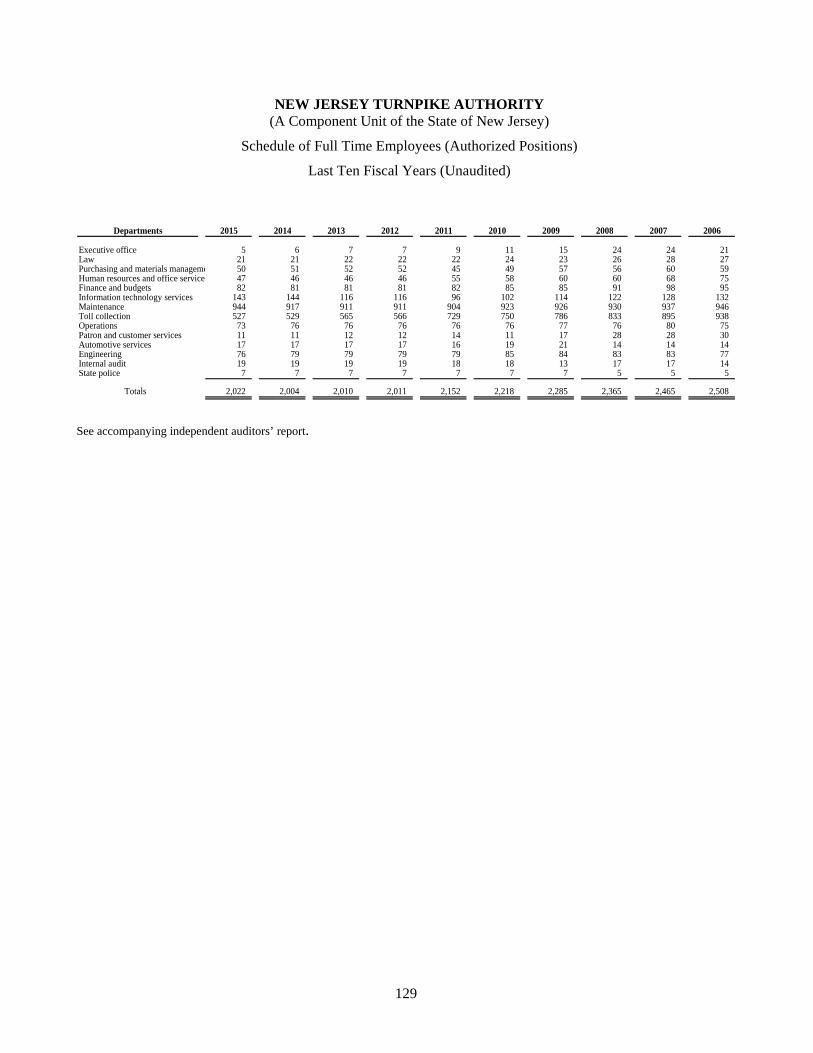
NEW JERSEY TURNPIKE AUTHORITY (A Component Unit of the State of New Jersey)
Schedule of Full Time Employees (Authorized Positions)
Last Ten Fiscal Years (Unaudited)
129
Departments 2015 2014 2013 2012 2011 2010 2009 2008 2007 2006
Executive office 5 6 7 7 9 11 15 24 24 21 Law 21 21 22 22 22 24 23 26 28 27 Purchasing and materials manageme 50 51 52 52 45 49 57 56 60 59 Human resources and office service 47 46 46 46 55 58 60 60 68 75 Finance and budgets 82 81 81 81 82 85 85 91 98 95 Information technology services 143 144 116 116 96 102 114 122 128 132 Maintenance 944 917 911 911 904 923 926 930 937 946 Toll collection 527 529 565 566 729 750 786 833 895 938 Operations 73 76 76 76 76 76 77 76 80 75 Patron and customer services 11 11 12 12 14 11 17 28 28 30 Automotive services 17 17 17 17 16 19 21 14 14 14 Engineering 76 79 79 79 79 85 84 83 83 77 Internal audit 19 19 19 19 18 18 13 17 17 14 State police 7 7 7 7 7 7 7 5 5 5
Totals 2,022 2,004 2,010 2,011 2,152 2,218 2,285 2,365 2,465 2,508
See accompanying independent auditors’ report.
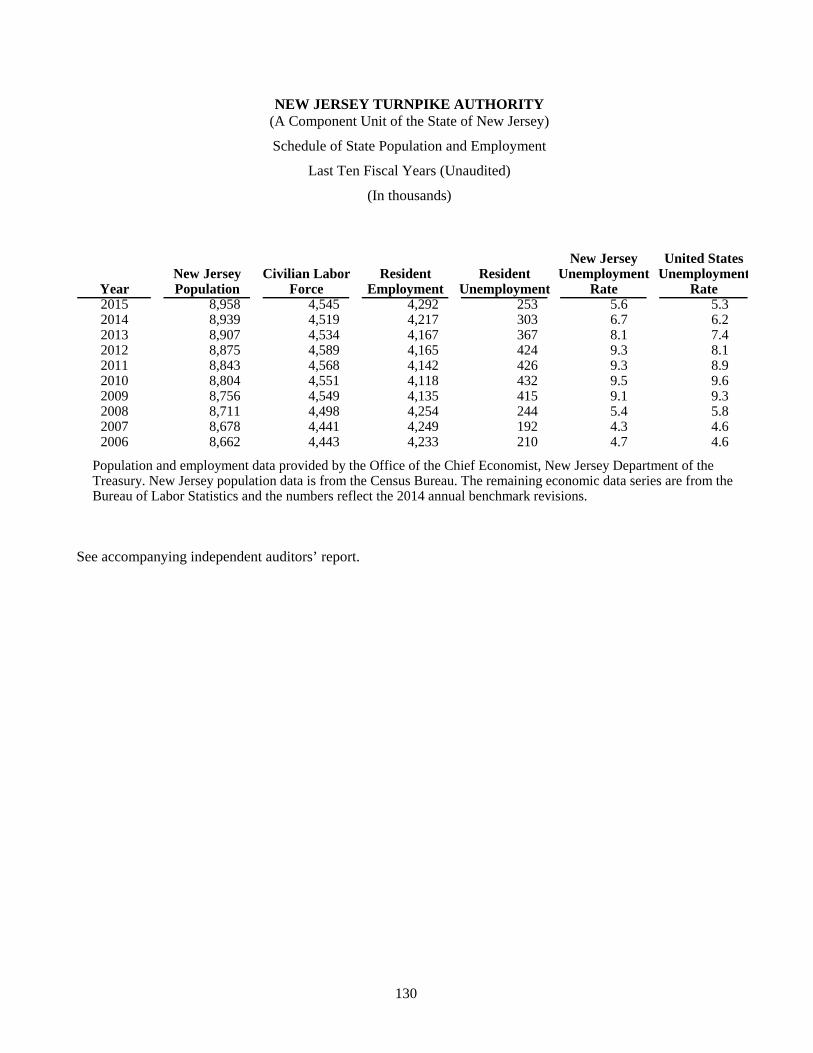
NEW JERSEY TURNPIKE AUTHORITY (A Component Unit of the State of New Jersey)
Schedule of State Population and Employment
Last Ten Fiscal Years (Unaudited)
(In thousands)
130
New Jersey United StatesNew Jersey Civilian Labor Resident Resident Unemployment Unemployment
Year Population Force Employment Unemployment Rate Rate2015 8,958 4,545 4,292 253 5.6 5.32014 8,939 4,519 4,217 303 6.7 6.22013 8,907 4,534 4,167 367 8.1 7.42012 8,875 4,589 4,165 424 9.3 8.12011 8,843 4,568 4,142 426 9.3 8.92010 8,804 4,551 4,118 432 9.5 9.62009 8,756 4,549 4,135 415 9.1 9.32008 8,711 4,498 4,254 244 5.4 5.82007 8,678 4,441 4,249 192 4.3 4.62006 8,662 4,443 4,233 210 4.7 4.6
Population and employment data provided by the Office of the Chief Economist, New Jersey Department of theTreasury. New Jersey population data is from the Census Bureau. The remaining economic data series are from theBureau of Labor Statistics and the numbers reflect the 2014 annual benchmark revisions.
See accompanying independent auditors’ report.
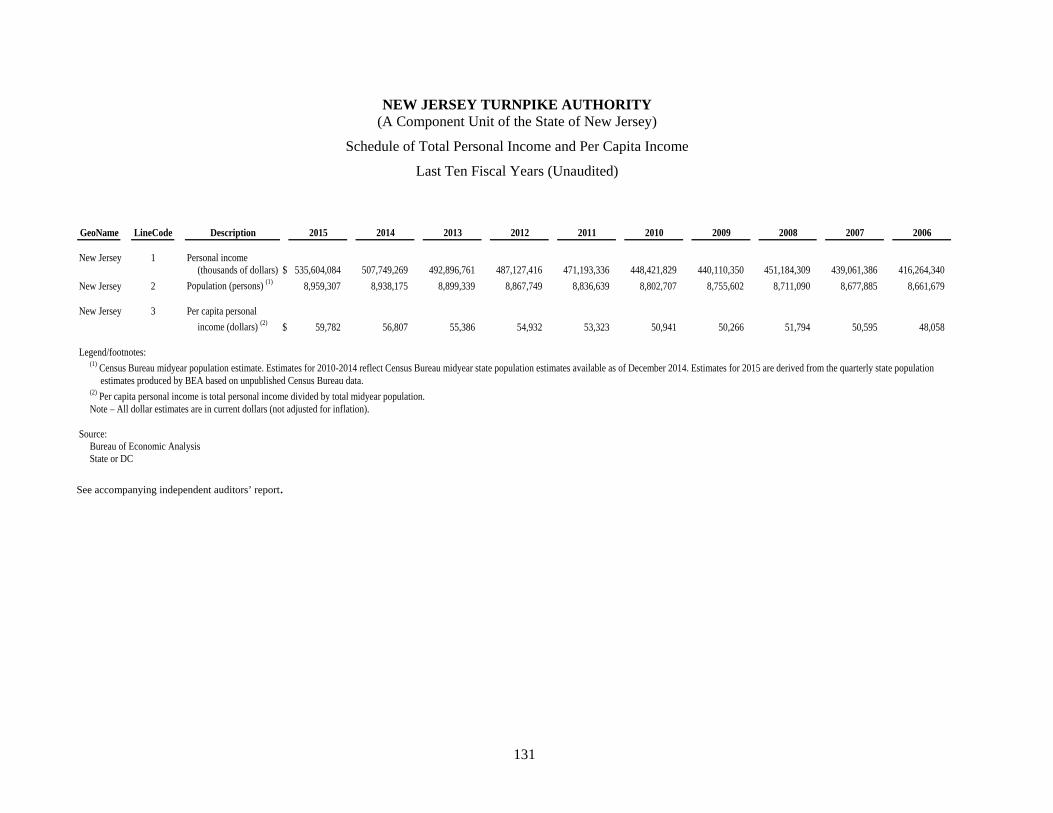
NEW JERSEY TURNPIKE AUTHORITY (A Component Unit of the State of New Jersey)
Schedule of Total Personal Income and Per Capita Income
Last Ten Fiscal Years (Unaudited)
131
GeoName LineCode Description 2015 2014 2013 2012 2011 2010 2009 2008 2007 2006
New Jersey 1 Personal income(thousands of dollars) $ 535,604,084 507,749,269 492,896,761 487,127,416 471,193,336 448,421,829 440,110,350 451,184,309 439,061,386 416,264,340
New Jersey 2 Population (persons) (1) 8,959,307 8,938,175 8,899,339 8,867,749 8,836,639 8,802,707 8,755,602 8,711,090 8,677,885 8,661,679
New Jersey 3 Per capita personal
income (dollars) (2) $ 59,782 56,807 55,386 54,932 53,323 50,941 50,266 51,794 50,595 48,058
Legend/footnotes:(1) Census Bureau midyear population estimate. Estimates for 2010-2014 reflect Census Bureau midyear state population estimates available as of December 2014. Estimates for 2015 are derived from the quarterly state population
estimates produced by BEA based on unpublished Census Bureau data.(2) Per capita personal income is total personal income divided by total midyear population.Note – All dollar estimates are in current dollars (not adjusted for inflation).
Source:Bureau of Economic AnalysisState or DC
See accompanying independent auditors’ report.
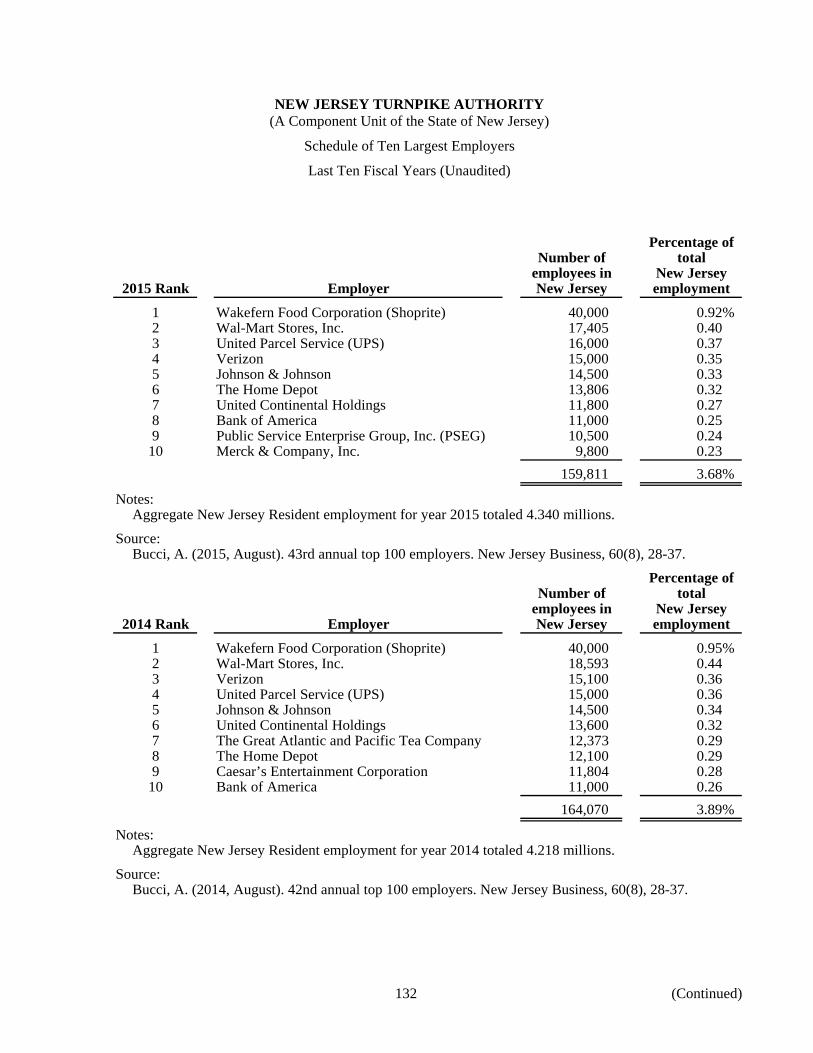
NEW JERSEY TURNPIKE AUTHORITY (A Component Unit of the State of New Jersey)
Schedule of Ten Largest Employers
Last Ten Fiscal Years (Unaudited)
132 (Continued)
Percentage ofNumber of total
employees in New Jersey2015 Rank Employer New Jersey employment
1 Wakefern Food Corporation (Shoprite) 40,000 0.92%2 Wal-Mart Stores, Inc. 17,405 0.403 United Parcel Service (UPS) 16,000 0.374 Verizon 15,000 0.355 Johnson & Johnson 14,500 0.336 The Home Depot 13,806 0.327 United Continental Holdings 11,800 0.278 Bank of America 11,000 0.259 Public Service Enterprise Group, Inc. (PSEG) 10,500 0.24
10 Merck & Company, Inc. 9,800 0.23
159,811 3.68%
Notes:Aggregate New Jersey Resident employment for year 2015 totaled 4.340 millions.
Source:Bucci, A. (2015, August). 43rd annual top 100 employers. New Jersey Business, 60(8), 28-37.
Percentage ofNumber of total
employees in New Jersey2014 Rank Employer New Jersey employment
1 Wakefern Food Corporation (Shoprite) 40,000 0.95%2 Wal-Mart Stores, Inc. 18,593 0.443 Verizon 15,100 0.364 United Parcel Service (UPS) 15,000 0.365 Johnson & Johnson 14,500 0.346 United Continental Holdings 13,600 0.327 The Great Atlantic and Pacific Tea Company 12,373 0.298 The Home Depot 12,100 0.299 Caesar’s Entertainment Corporation 11,804 0.28
10 Bank of America 11,000 0.26
164,070 3.89%
Notes:Aggregate New Jersey Resident employment for year 2014 totaled 4.218 millions.
Source:Bucci, A. (2014, August). 42nd annual top 100 employers. New Jersey Business, 60(8), 28-37.
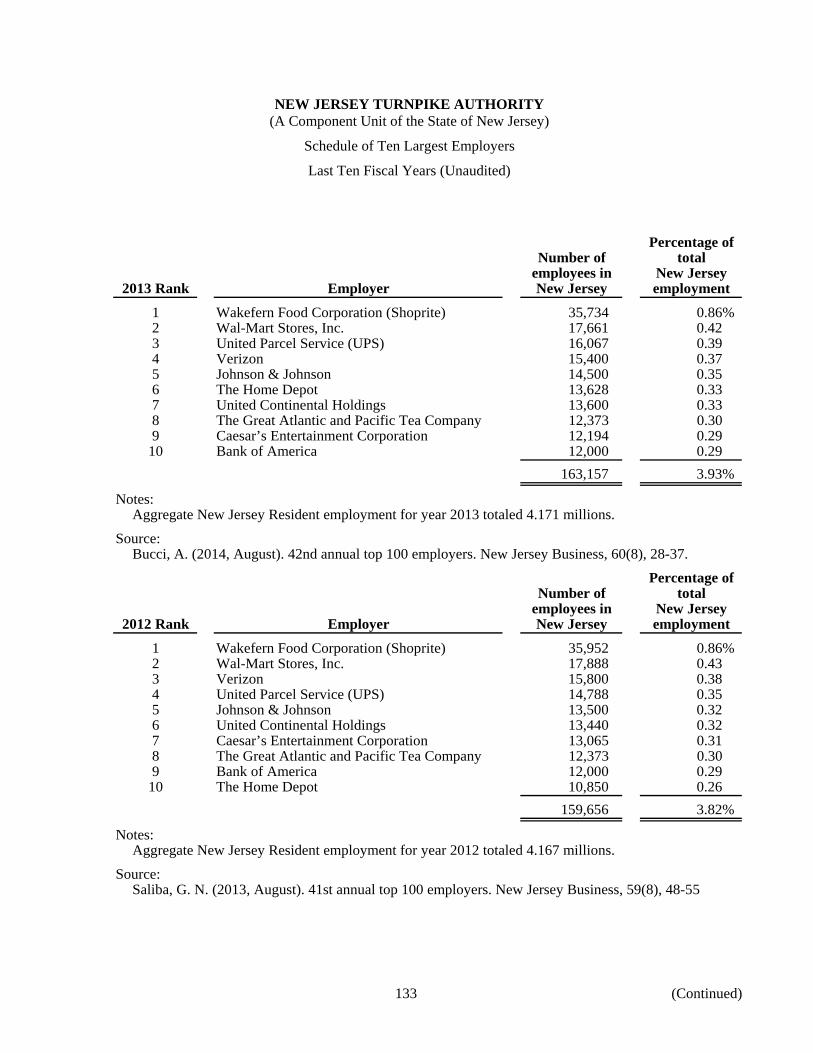
NEW JERSEY TURNPIKE AUTHORITY (A Component Unit of the State of New Jersey)
Schedule of Ten Largest Employers
Last Ten Fiscal Years (Unaudited)
133 (Continued)
Percentage ofNumber of total
employees in New Jersey2013 Rank Employer New Jersey employment
1 Wakefern Food Corporation (Shoprite) 35,734 0.86%2 Wal-Mart Stores, Inc. 17,661 0.423 United Parcel Service (UPS) 16,067 0.394 Verizon 15,400 0.375 Johnson & Johnson 14,500 0.356 The Home Depot 13,628 0.337 United Continental Holdings 13,600 0.338 The Great Atlantic and Pacific Tea Company 12,373 0.309 Caesar’s Entertainment Corporation 12,194 0.29
10 Bank of America 12,000 0.29
163,157 3.93%
Notes:Aggregate New Jersey Resident employment for year 2013 totaled 4.171 millions.
Source:Bucci, A. (2014, August). 42nd annual top 100 employers. New Jersey Business, 60(8), 28-37.
Percentage ofNumber of total
employees in New Jersey2012 Rank Employer New Jersey employment
1 Wakefern Food Corporation (Shoprite) 35,952 0.86%2 Wal-Mart Stores, Inc. 17,888 0.433 Verizon 15,800 0.384 United Parcel Service (UPS) 14,788 0.355 Johnson & Johnson 13,500 0.326 United Continental Holdings 13,440 0.327 Caesar’s Entertainment Corporation 13,065 0.318 The Great Atlantic and Pacific Tea Company 12,373 0.309 Bank of America 12,000 0.29
10 The Home Depot 10,850 0.26
159,656 3.82%
Notes:Aggregate New Jersey Resident employment for year 2012 totaled 4.167 millions.
Source:Saliba, G. N. (2013, August). 41st annual top 100 employers. New Jersey Business, 59(8), 48-55
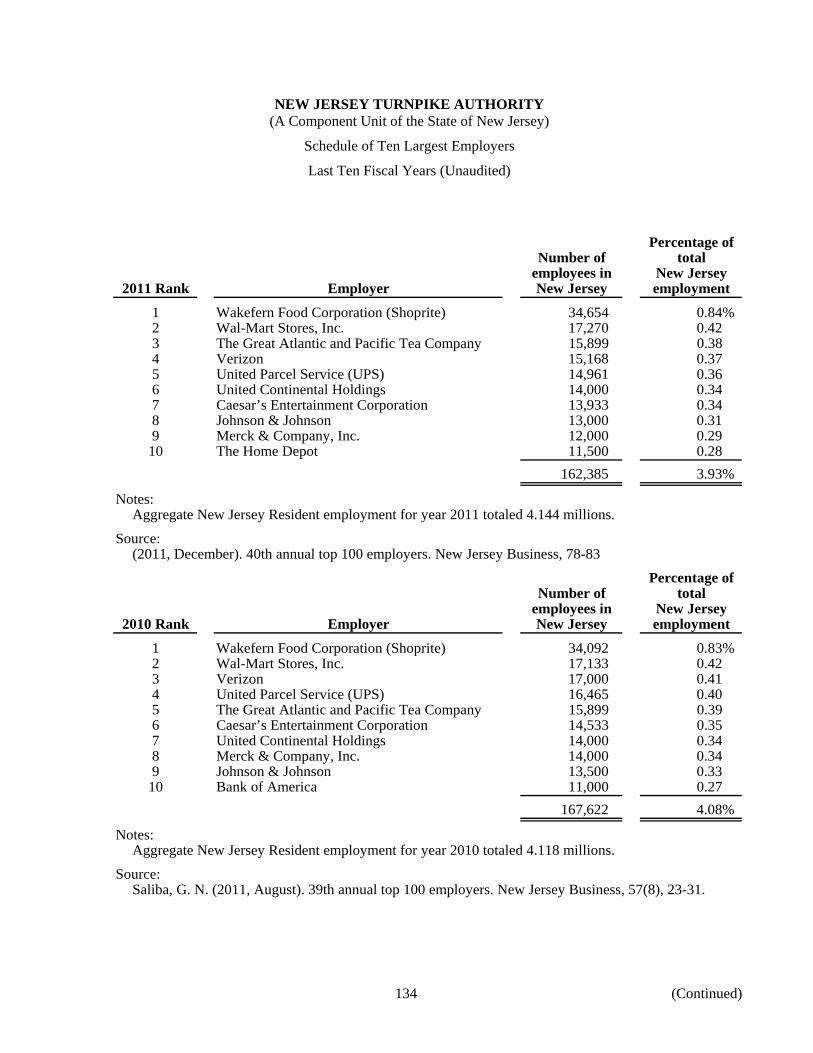
NEW JERSEY TURNPIKE AUTHORITY (A Component Unit of the State of New Jersey)
Schedule of Ten Largest Employers
Last Ten Fiscal Years (Unaudited)
134 (Continued)
Percentage ofNumber of total
employees in New Jersey2011 Rank Employer New Jersey employment
1 Wakefern Food Corporation (Shoprite) 34,654 0.84%2 Wal-Mart Stores, Inc. 17,270 0.423 The Great Atlantic and Pacific Tea Company 15,899 0.384 Verizon 15,168 0.375 United Parcel Service (UPS) 14,961 0.366 United Continental Holdings 14,000 0.347 Caesar’s Entertainment Corporation 13,933 0.348 Johnson & Johnson 13,000 0.319 Merck & Company, Inc. 12,000 0.29
10 The Home Depot 11,500 0.28
162,385 3.93%
Notes:Aggregate New Jersey Resident employment for year 2011 totaled 4.144 millions.
Source:(2011, December). 40th annual top 100 employers. New Jersey Business, 78-83
Percentage ofNumber of total
employees in New Jersey2010 Rank Employer New Jersey employment
1 Wakefern Food Corporation (Shoprite) 34,092 0.83%2 Wal-Mart Stores, Inc. 17,133 0.423 Verizon 17,000 0.414 United Parcel Service (UPS) 16,465 0.405 The Great Atlantic and Pacific Tea Company 15,899 0.396 Caesar’s Entertainment Corporation 14,533 0.357 United Continental Holdings 14,000 0.348 Merck & Company, Inc. 14,000 0.349 Johnson & Johnson 13,500 0.33
10 Bank of America 11,000 0.27
167,622 4.08%
Notes:Aggregate New Jersey Resident employment for year 2010 totaled 4.118 millions.
Source:Saliba, G. N. (2011, August). 39th annual top 100 employers. New Jersey Business, 57(8), 23-31.
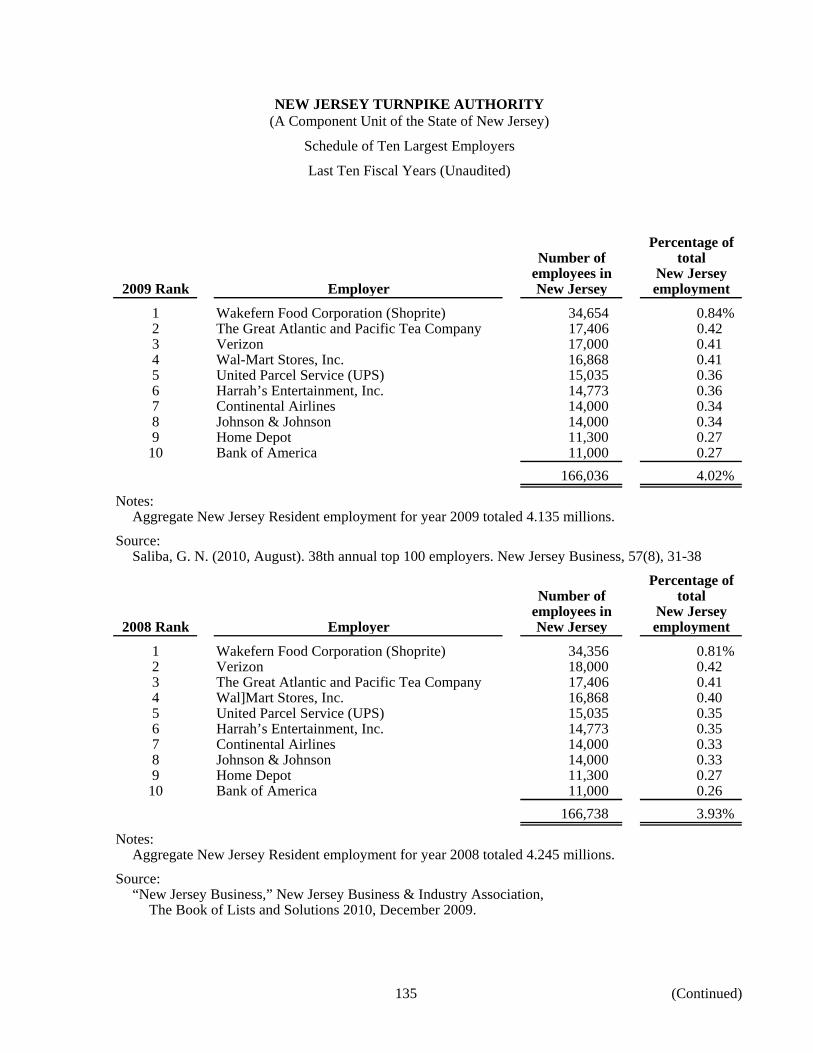
NEW JERSEY TURNPIKE AUTHORITY (A Component Unit of the State of New Jersey)
Schedule of Ten Largest Employers
Last Ten Fiscal Years (Unaudited)
135 (Continued)
Percentage ofNumber of total
employees in New Jersey2009 Rank Employer New Jersey employment
1 Wakefern Food Corporation (Shoprite) 34,654 0.84%2 The Great Atlantic and Pacific Tea Company 17,406 0.423 Verizon 17,000 0.414 Wal-Mart Stores, Inc. 16,868 0.415 United Parcel Service (UPS) 15,035 0.366 Harrah’s Entertainment, Inc. 14,773 0.367 Continental Airlines 14,000 0.348 Johnson & Johnson 14,000 0.349 Home Depot 11,300 0.27
10 Bank of America 11,000 0.27
166,036 4.02%
Notes:Aggregate New Jersey Resident employment for year 2009 totaled 4.135 millions.
Source:Saliba, G. N. (2010, August). 38th annual top 100 employers. New Jersey Business, 57(8), 31-38
Percentage ofNumber of total
employees in New Jersey2008 Rank Employer New Jersey employment
1 Wakefern Food Corporation (Shoprite) 34,356 0.81%2 Verizon 18,000 0.423 The Great Atlantic and Pacific Tea Company 17,406 0.414 Wal ]Mart Stores, Inc. 16,868 0.405 United Parcel Service (UPS) 15,035 0.356 Harrah’s Entertainment, Inc. 14,773 0.357 Continental Airlines 14,000 0.338 Johnson & Johnson 14,000 0.339 Home Depot 11,300 0.27
10 Bank of America 11,000 0.26
166,738 3.93%
Notes:Aggregate New Jersey Resident employment for year 2008 totaled 4.245 millions.
Source:“New Jersey Business,” New Jersey Business & Industry Association,
The Book of Lists and Solutions 2010, December 2009.
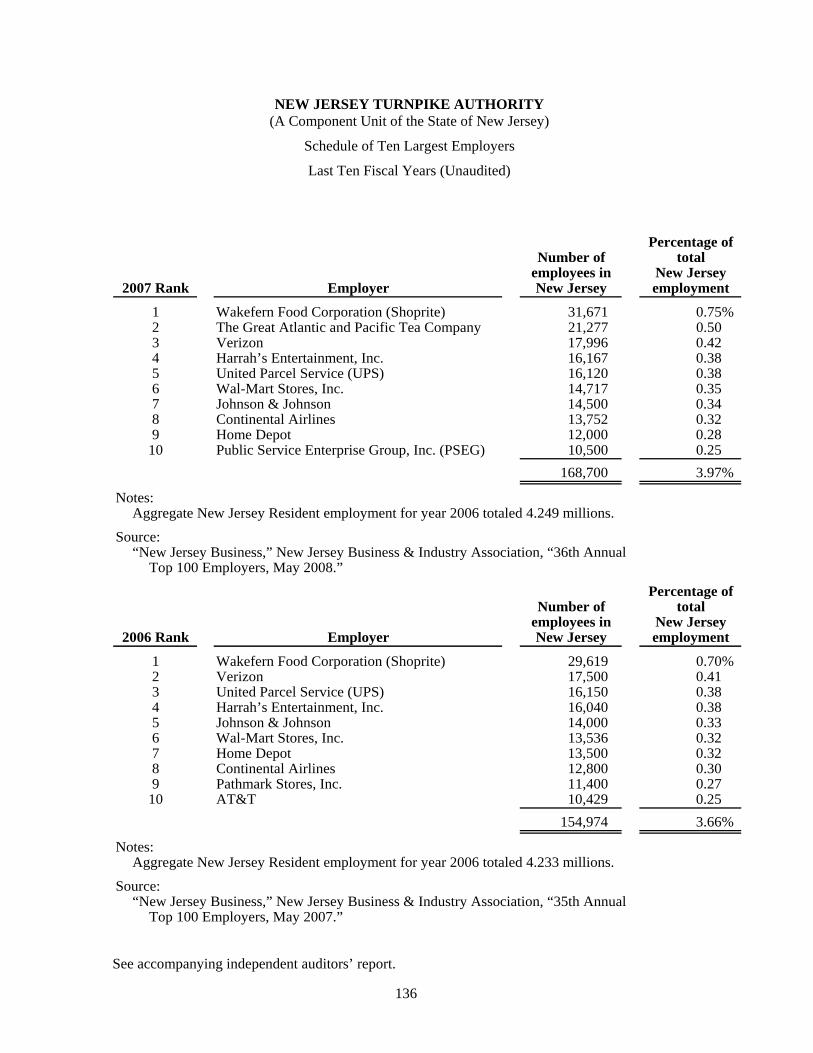
NEW JERSEY TURNPIKE AUTHORITY (A Component Unit of the State of New Jersey)
Schedule of Ten Largest Employers
Last Ten Fiscal Years (Unaudited)
136
Percentage ofNumber of total
employees in New Jersey2007 Rank Employer New Jersey employment
1 Wakefern Food Corporation (Shoprite) 31,671 0.75%2 The Great Atlantic and Pacific Tea Company 21,277 0.503 Verizon 17,996 0.424 Harrah’s Entertainment, Inc. 16,167 0.385 United Parcel Service (UPS) 16,120 0.386 Wal-Mart Stores, Inc. 14,717 0.357 Johnson & Johnson 14,500 0.348 Continental Airlines 13,752 0.329 Home Depot 12,000 0.28
10 Public Service Enterprise Group, Inc. (PSEG) 10,500 0.25
168,700 3.97%
Notes:Aggregate New Jersey Resident employment for year 2006 totaled 4.249 millions.
Source:“New Jersey Business,” New Jersey Business & Industry Association, “36th Annual
Top 100 Employers, May 2008.”
Percentage ofNumber of total
employees in New Jersey2006 Rank Employer New Jersey employment
1 Wakefern Food Corporation (Shoprite) 29,619 0.70%2 Verizon 17,500 0.413 United Parcel Service (UPS) 16,150 0.384 Harrah’s Entertainment, Inc. 16,040 0.385 Johnson & Johnson 14,000 0.336 Wal-Mart Stores, Inc. 13,536 0.327 Home Depot 13,500 0.328 Continental Airlines 12,800 0.309 Pathmark Stores, Inc. 11,400 0.27
10 AT&T 10,429 0.25
154,974 3.66%
Notes:Aggregate New Jersey Resident employment for year 2006 totaled 4.233 millions.
Source:“New Jersey Business,” New Jersey Business & Industry Association, “35th Annual
Top 100 Employers, May 2007.”
See accompanying independent auditors’ report.
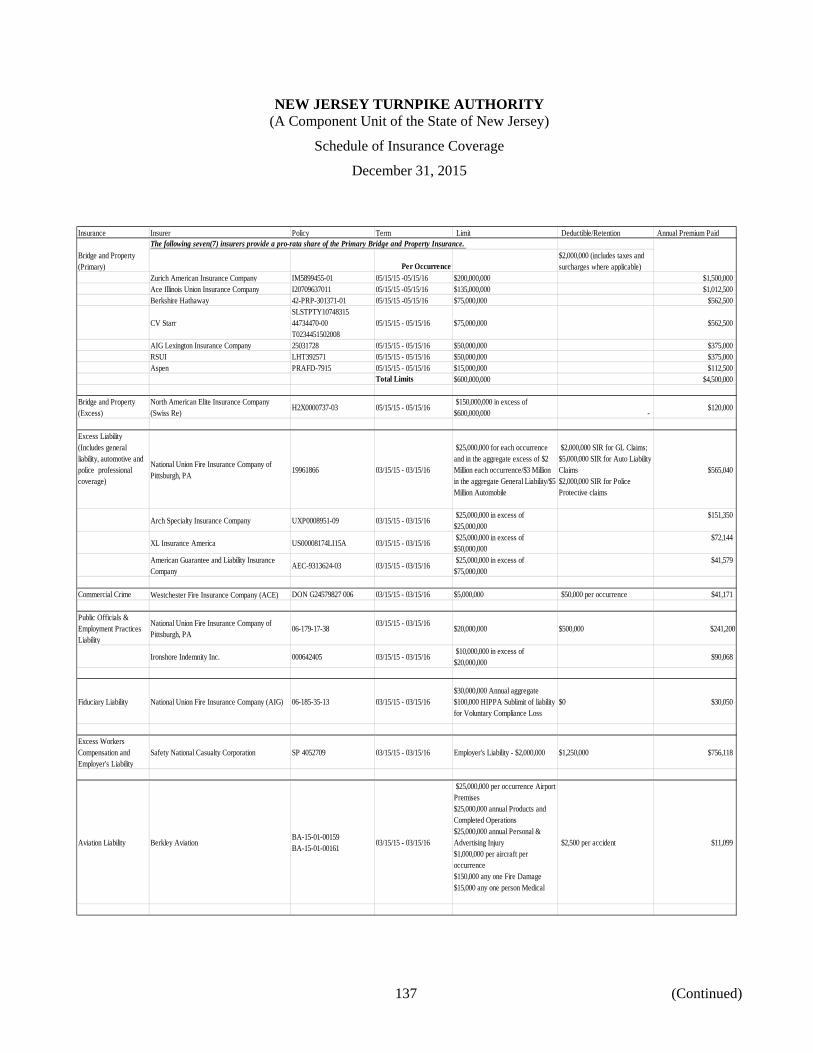
NEW JERSEY TURNPIKE AUTHORITY (A Component Unit of the State of New Jersey)
Schedule of Insurance Coverage
December 31, 2015
137 (Continued)
Insurance Insurer Policy Term Limit Deductible/Retention Annual Premium PaidThe following seven(7) insurers provide a pro-rata share of the Primary Bridge and Property Insurance.
Per Occurrence$2,000,000 (includes taxes and surcharges where applicable)
Zurich American Insurance Company IM5899455-01 05/15/15 -05/15/16 $200,000,000 $1,500,000Ace Illinois Union Insurance Company I20709637011 05/15/15 -05/15/16 $135,000,000 $1,012,500Berkshire Hathaway 42-PRP-301371-01 05/15/15 -05/15/16 $75,000,000 $562,500
CV StarrSLSTPTY1074831544734470-00T0234451502008
05/15/15 - 05/15/16 $75,000,000 $562,500
AIG Lexington Insurance Company 25031728 05/15/15 - 05/15/16 $50,000,000 $375,000RSUI LHT392571 05/15/15 - 05/15/16 $50,000,000 $375,000Aspen PRAFD-7915 05/15/15 - 05/15/16 $15,000,000 $112,500
Total Limits $600,000,000 $4,500,000
Bridge and Property (Excess)
North American Elite Insurance Company (Swiss Re)
H2X0000737-03 05/15/15 - 05/15/16 $150,000,000 in excess of $600,000,000 -
$120,000
Excess Liability (Includes general liability, automotive and police professional coverage)
National Union Fire Insurance Company of Pittsburgh, PA
19961866 03/15/15 - 03/15/16
$25,000,000 for each occurrence and in the aggregate excess of $2 Million each occurrence/$3 Million in the aggregate General Liability/$5 Million Automobile
$2,000,000 SIR for GL Claims; $5,000,000 SIR for Auto Liability Claims$2,000,000 SIR for Police Protective claims
$565,040
Arch Specialty Insurance Company UXP0008951-09 03/15/15 - 03/15/16 $25,000,000 in excess of $25,000,000
$151,350
XL Insurance America US00008174LI15A 03/15/15 - 03/15/16 $25,000,000 in excess of $50,000,000
$72,144
American Guarantee and Liability Insurance Company
AEC-9313624-03 03/15/15 - 03/15/16 $25,000,000 in excess of $75,000,000
$41,579
Commercial Crime Westchester Fire Insurance Company (ACE) DON G24579827 006 03/15/15 - 03/15/16 $5,000,000 $50,000 per occurrence $41,171
Public Officials & Employment Practices Liability
National Union Fire Insurance Company of Pittsburgh, PA
06-179-17-3803/15/15 - 03/15/16
$20,000,000 $500,000 $241,200
Ironshore Indemnity Inc. 000642405 03/15/15 - 03/15/16 $10,000,000 in excess of $20,000,000
$90,068
Fiduciary Liability National Union Fire Insurance Company (AIG) 06-185-35-13 03/15/15 - 03/15/16$30,000,000 Annual aggregate$100,000 HIPPA Sublimit of liability for Voluntary Compliance Loss
$0 $30,050
Excess Workers Compensation and Employer's Liability
Safety National Casualty Corporation SP 4052709 03/15/15 - 03/15/16 Employer's Liability - $2,000,000 $1,250,000 $756,118
Aviation Liability Berkley AviationBA-15-01-00159BA-15-01-00161
03/15/15 - 03/15/16
$25,000,000 per occurrence Airport Premises$25,000,000 annual Products and Completed Operations$25,000,000 annual Personal & Advertising Injury$1,000,000 per aircraft per occurrence$150,000 any one Fire Damage$15,000 any one person Medical
$2,500 per accident $11,099
Bridge and Property (Primary)
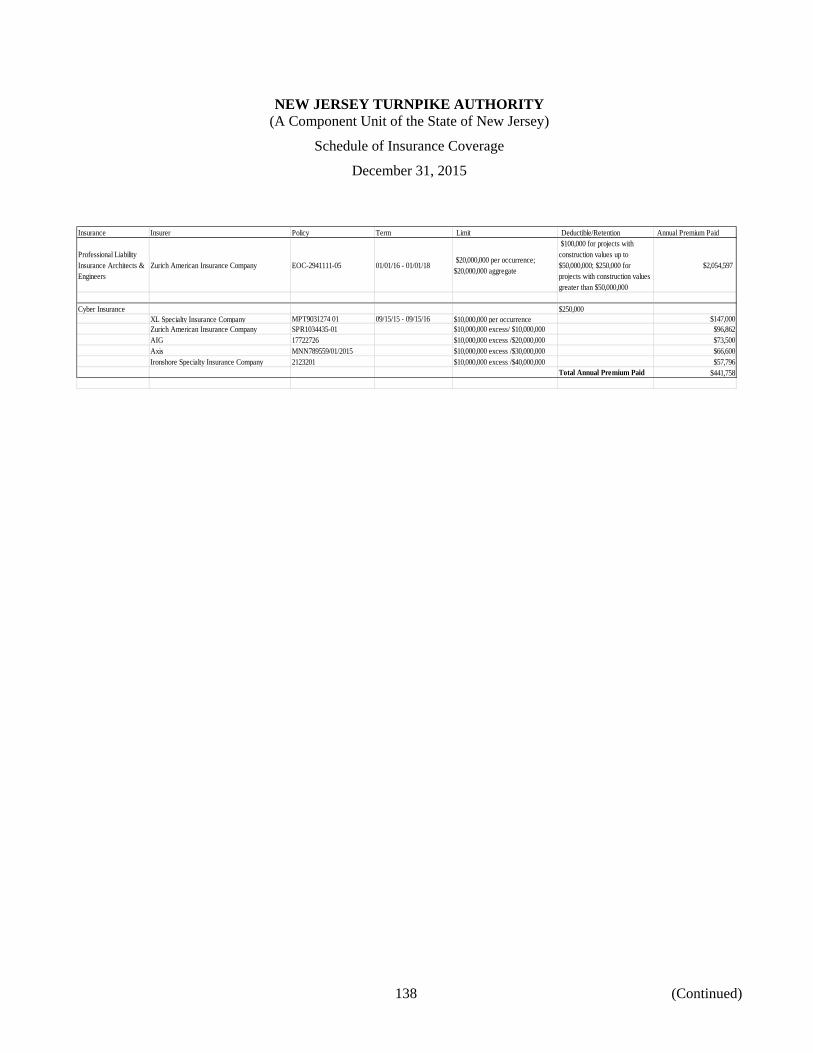
NEW JERSEY TURNPIKE AUTHORITY (A Component Unit of the State of New Jersey)
Schedule of Insurance Coverage
December 31, 2015
138 (Continued)
Insurance Insurer Policy Term Limit Deductible/Retention Annual Premium Paid
Professional Liability Insurance Architects & Engineers
Zurich American Insurance Company EOC-2941111-05 01/01/16 - 01/01/18 $20,000,000 per occurrence; $20,000,000 aggregate
$100,000 for projects with construction values up to $50,000,000; $250,000 for projects with construction values greater than $50,000,000
$2,054,597
Cyber Insurance $250,000XL Specialty Insurance Company MPT9031274 01 09/15/15 - 09/15/16 $10,000,000 per occurrence $147,000Zurich American Insurance Company SPR1034435-01 $10,000,000 excess/ $10,000,000 $96,862AIG 17722726 $10,000,000 excess /$20,000,000 $73,500Axis MNN789559/01/2015 $10,000,000 excess /$30,000,000 $66,600Ironshore Specialty Insurance Company 2123201 $10,000,000 excess /$40,000,000 $57,796
Total Annual Premium Paid $441,758
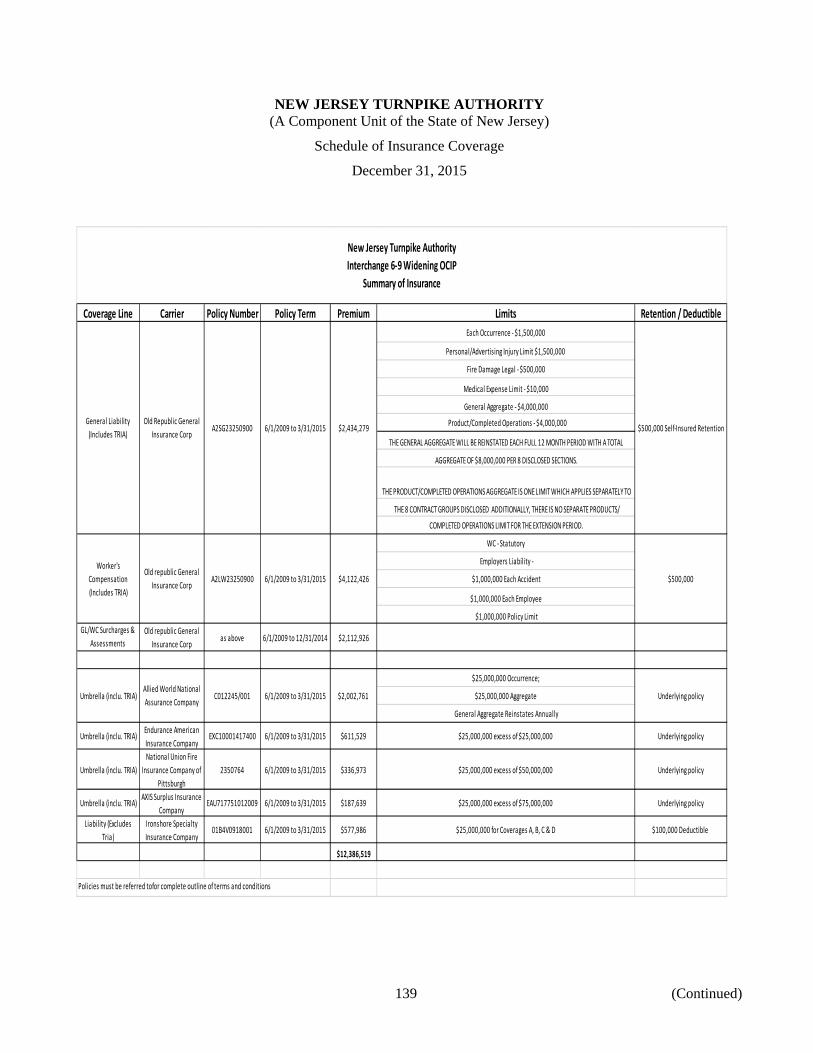
NEW JERSEY TURNPIKE AUTHORITY (A Component Unit of the State of New Jersey)
Schedule of Insurance Coverage
December 31, 2015
139 (Continued)
Coverage Line Carrier Policy Number Policy Term Premium Limits Retention / Deductible
Each Occurrence ‐ $1,500,000
Personal/Advertising Injury Limit $1,500,000
Fire Damage Legal ‐ $500,000
Medical Expense Limit ‐ $10,000
General Aggregate ‐ $4,000,000
Product/Completed Operations ‐ $4,000,000
THE GENERAL AGGREGATE WILL BE REINSTATED EACH FULL 12 MONTH PERIOD WITH A TOTAL
AGGREGATE OF $8,000,000 PER 8 DISCLOSED SECTIONS.
THE PRODUCT/COMPLETED OPERATIONS AGGREGATE IS ONE LIMIT WHICH APPLIES SEPARATELY TO
THE 8 CONTRACT GROUPS DISCLOSED ADDITIONALLY, THERE IS NO SEPARATE PRODUCTS/
COMPLETED OPERATIONS LIMIT FOR THE EXTENSION PERIOD.
WC ‐ Statutory
Employers Liability ‐
$1,000,000 Each Accident
$1,000,000 Each Employee
$1,000,000 Policy Limit
GL/WC Surcharges &
Assessments
Old republic General
Insurance Corpas above 6/1/2009 to 12/31/2014 $2,112,926
$25,000,000 Occurrence;
$25,000,000 Aggregate
General Aggregate Reinstates Annually
Umbrella (inclu. TRIA)Endurance American
Insurance CompanyEXC10001417400 6/1/2009 to 3/31/2015 $611,529 $25,000,000 excess of $25,000,000 Underlying policy
Umbrella (inclu. TRIA)
National Union Fire
Insurance Company of
Pittsburgh
2350764 6/1/2009 to 3/31/2015 $336,973 $25,000,000 excess of $50,000,000 Underlying policy
Umbrella (inclu. TRIA)AXIS Surplus Insurance
Company EAU717751012009 6/1/2009 to 3/31/2015 $187,639 $25,000,000 excess of $75,000,000 Underlying policy
Liability (Excludes
Tria)
Ironshore Specialty
Insurance Company01B4V0918001 6/1/2009 to 3/31/2015 $577,986 $25,000,000 for Coverages A, B, C & D $100,000 Deductible
$12,386,519
Policies must be referred tofor complete outline of terms and conditions
$4,122,426 $500,000
Umbrella (inclu. TRIA)Allied World National
Assurance CompanyC012245/001 6/1/2009 to 3/31/2015 $2,002,761 Underlying policy
Worker's
Compensation
(Includes TRIA)
Old republic General
Insurance CorpA2LW23250900 6/1/2009 to 3/31/2015
New Jersey Turnpike Authority
Interchange 6‐9 Widening OCIP
Summary of Insurance
Old Republic General
Insurance CorpA2SG23250900 6/1/2009 to 3/31/2015 $2,434,279 $500,000 Self‐Insured Retention
General Liability
(Includes TRIA)
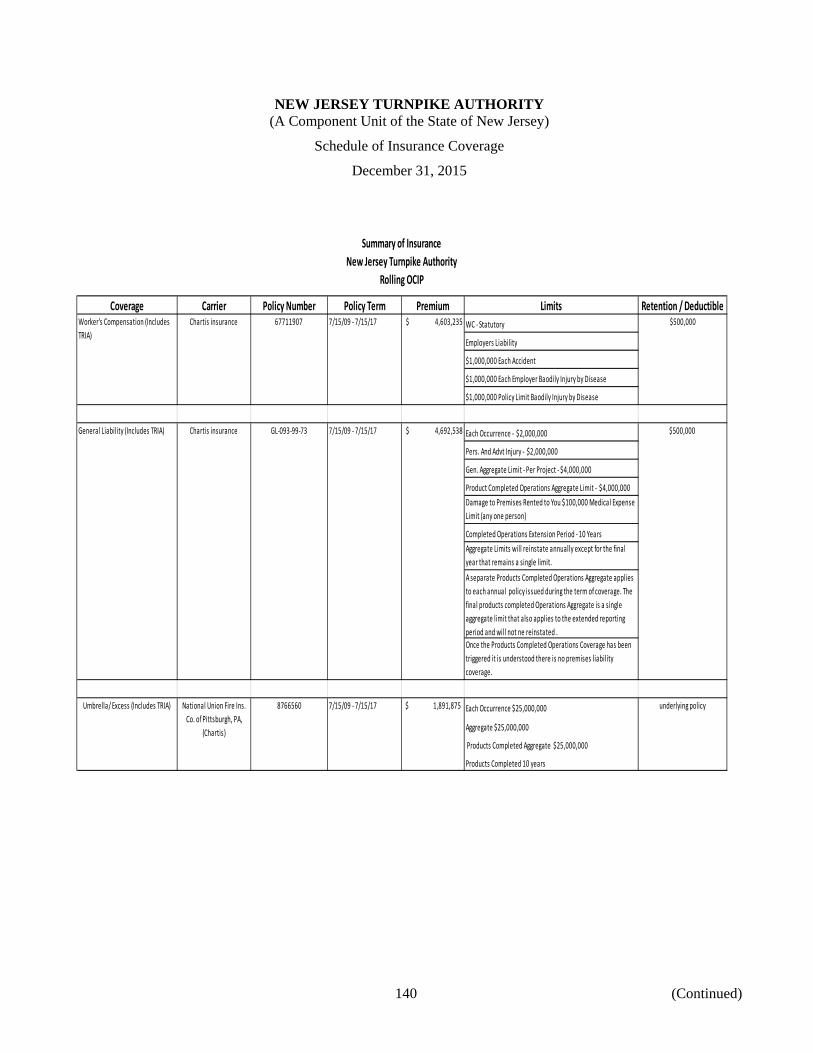
NEW JERSEY TURNPIKE AUTHORITY (A Component Unit of the State of New Jersey)
Schedule of Insurance Coverage
December 31, 2015
140 (Continued)
Coverage Carrier Policy Number Policy Term Premium Limits Retention / Deductible
WC ‐ Statutory
Employers Liability
$1,000,000 Each Accident
$1,000,000 Each Employer Baodily Injury by Disease
$1,000,000 Policy Limit Baodily Injury by Disease
Each Occurrence ‐ $2,000,000
Pers. And Advt Injury ‐ $2,000,000
Gen. Aggregate Limit ‐ Per Project ‐ $4,000,000
Product Completed Operations Aggregate Limit ‐ $4,000,000
Damage to Premises Rented to You $100,000 Medical Expense
Limit (any one person)
Completed Operations Extension Period ‐ 10 Years
Aggregate Limits will reinstate annually except for the final
year that remains a single limit.
A separate Products Completed Operations Aggregate applies
to each annual policy issued during the term of coverage. The
final products completed Operations Aggregate is a single
aggregate limit that also applies to the extended reporting
period and will not ne reinstated .
Once the Products Completed Operations Coverage has been
triggered it is understood there is no premises liability
coverage.
Each Occurrence $25,000,000
Aggregate $25,000,000
Products Completed Aggregate $25,000,000
Products Completed 10 years
underlying policy
General Liability (Includes TRIA) Chartis insurance GL‐093‐99‐73 7/15/09 ‐ 7/15/17 $ 4,692,538 $500,000
Umbrella/ Excess (Includes TRIA) National Union Fire Ins.
Co. of Pittsburgh, PA,
(Chartis)
8766560 7/15/09 ‐ 7/15/17 1,891,875$
Summary of Insurance
New Jersey Turnpike Authority
Rolling OCIP
Worker's Compensation (Includes
TRIA)
Chartis insurance 67711907 7/15/09 ‐ 7/15/17 $ 4,603,235 $500,000
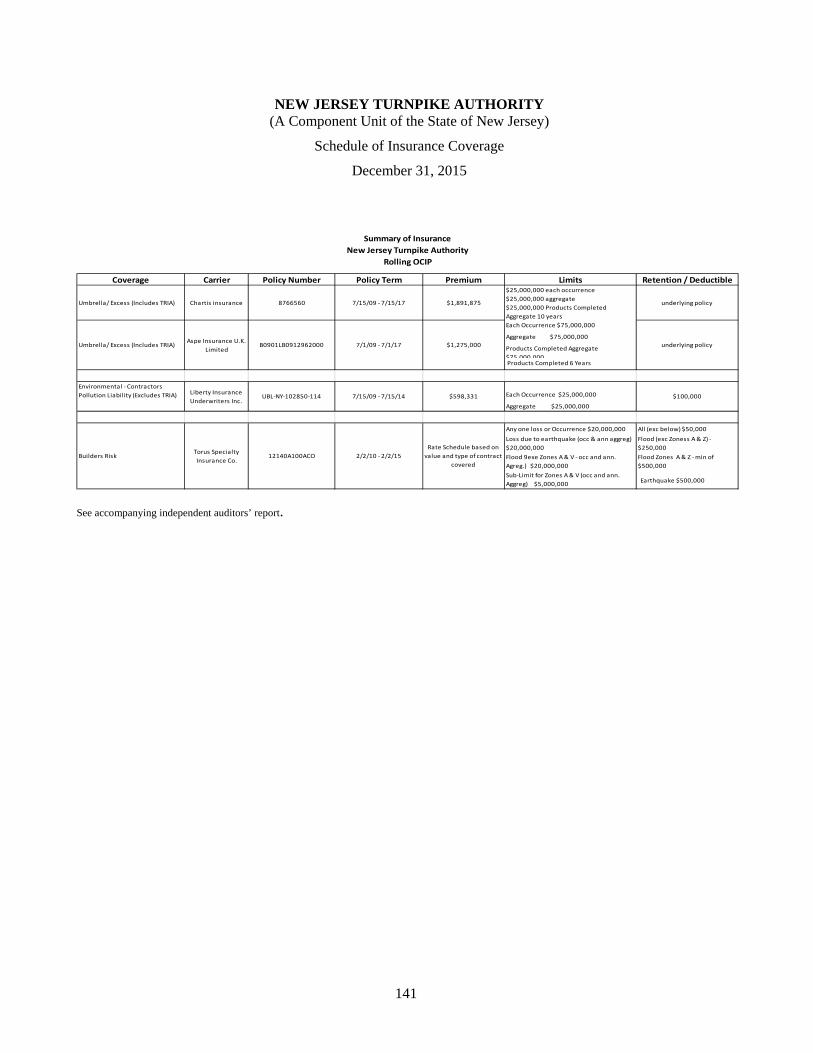
NEW JERSEY TURNPIKE AUTHORITY (A Component Unit of the State of New Jersey)
Schedule of Insurance Coverage
December 31, 2015
141
Coverage Carrier Policy Number Policy Term Premium Limits Retention / Deductible
Umbrella/ Excess (Includes TRIA) Chartis insurance 8766560 7/15/09 ‐ 7/15/17 $1,891,875
$25,000,000 each occurrence
$25,000,000 aggregate
$25,000,000 Products Completed
Aggregate 10 years
underlying policy
Each Occurrence $75,000,000
Aggregate $75,000,000
Products Completed Aggregate
$75 000 000 Products Completed 6 Years
Each Occurrence $25,000,000
Aggregate $25,000,000
Any one loss or Occurrence $20,000,000 All (exc below) $50,000
Loss due to earthquake (occ & ann aggreg)
$20,000,000
Flood (exc Zoness A & Z) ‐
$250,000
Flood 9exe Zones A & V ‐ occ and ann.
Agreg.) $20,000,000
Flood Zones A & Z ‐ min of
$500,000
Sub‐Limit for Zones A & V (occ and ann.
Aggreg) $5,000,000 Earthquake $500,000
Rate Schedule based on
value and type of contract
covered
Builders Risk Torus Specialty
Insurance Co.12140A100ACO 2/2/10 ‐ 2/2/15
$100,000
Summary of Insurance
New Jersey Turnpike Authority
Rolling OCIP
Umbrella/ Excess (Includes TRIA)Aspe Insurance U.K.
Limited B0901LB0912962000 7/1/09 ‐ 7/1/17 $1,275,000 underlying policy
Environmental ‐ Contractors
Pollution Liability (Excludes TRIA) Liberty Insurance
Underwriters Inc.UBL‐NY‐102850‐114 7/15/09 ‐ 7/15/14 $598,331
See accompanying independent auditors’ report.
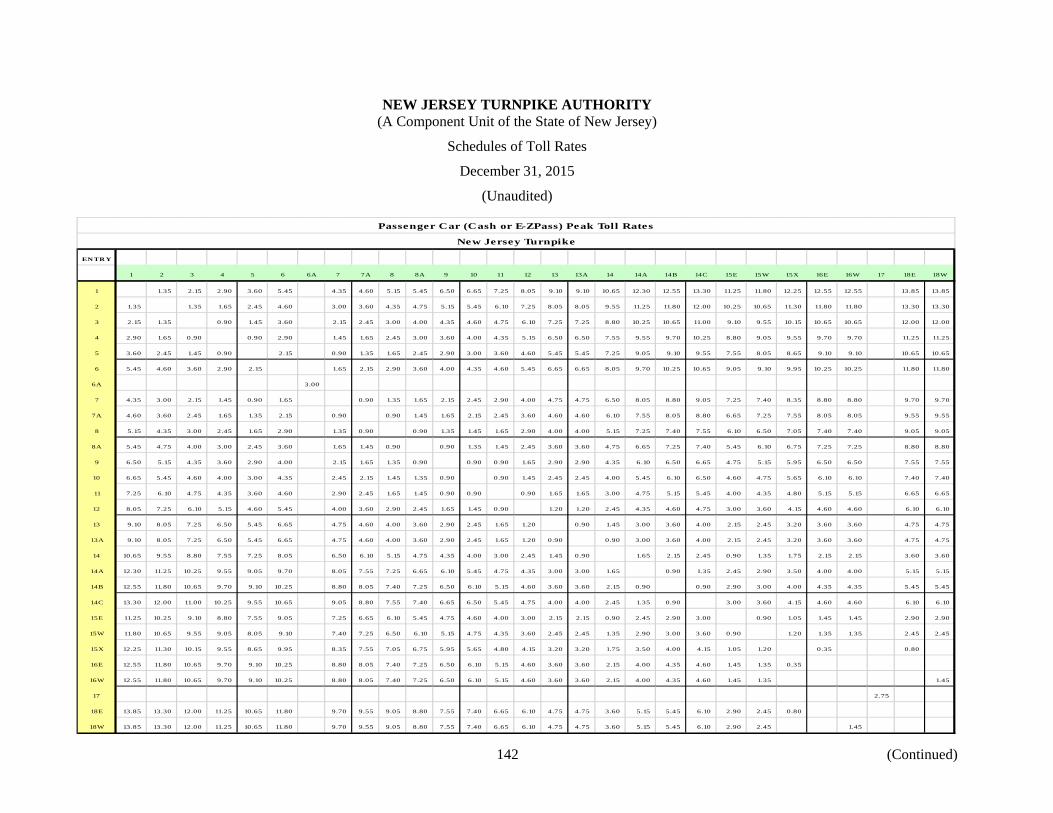
NEW JERSEY TURNPIKE AUTHORITY (A Component Unit of the State of New Jersey)
Schedules of Toll Rates
December 31, 2015
(Unaudited)
142 (Continued)
EN TR Y
1 2 3 4 5 6 6A 7 7A 8 8A 9 10 11 12 13 13A 14 14A 14B 14C 15E 15W 15X 16E 16W 17 18E 18W
1 1.35 2.15 2.90 3.60 5.45 4.35 4.60 5.15 5.45 6.50 6.65 7.25 8.05 9.10 9.10 10.65 12.30 12.55 13.30 11.25 11.80 12.25 12.55 12.55 13.85 13.85
2 1.35 1.35 1.65 2.45 4.60 3.00 3.60 4.35 4.75 5.15 5.45 6.10 7.25 8.05 8.05 9.55 11.25 11.80 12.00 10.25 10.65 11.30 11.80 11.80 13.30 13.30
3 2.15 1.35 0.90 1.45 3.60 2.15 2.45 3.00 4.00 4.35 4.60 4.75 6.10 7.25 7.25 8.80 10.25 10.65 11.00 9.10 9.55 10.15 10.65 10.65 12.00 12.00
4 2.90 1.65 0.90 0.90 2.90 1.45 1.65 2.45 3.00 3.60 4.00 4.35 5.15 6.50 6.50 7.55 9.55 9.70 10.25 8.80 9.05 9.55 9.70 9.70 11.25 11.25
5 3.60 2.45 1.45 0.90 2.15 0.90 1.35 1.65 2.45 2.90 3.00 3.60 4.60 5.45 5.45 7.25 9.05 9.10 9.55 7.55 8.05 8.65 9.10 9.10 10.65 10.65
6 5.45 4.60 3.60 2.90 2.15 1.65 2.15 2.90 3.60 4.00 4.35 4.60 5.45 6.65 6.65 8.05 9.70 10.25 10.65 9.05 9.10 9.95 10.25 10.25 11.80 11.80
6A 3.00
7 4.35 3.00 2.15 1.45 0.90 1.65 0.90 1.35 1.65 2.15 2.45 2.90 4.00 4.75 4.75 6.50 8.05 8.80 9.05 7.25 7.40 8.35 8.80 8.80 9.70 9.70
7A 4.60 3.60 2.45 1.65 1.35 2.15 0.90 0.90 1.45 1.65 2.15 2.45 3.60 4.60 4.60 6.10 7.55 8.05 8.80 6.65 7.25 7.55 8.05 8.05 9.55 9.55
8 5.15 4.35 3.00 2.45 1.65 2.90 1.35 0.90 0.90 1.35 1.45 1.65 2.90 4.00 4.00 5.15 7.25 7.40 7.55 6.10 6.50 7.05 7.40 7.40 9.05 9.05
8A 5.45 4.75 4.00 3.00 2.45 3.60 1.65 1.45 0.90 0.90 1.35 1.45 2.45 3.60 3.60 4.75 6.65 7.25 7.40 5.45 6.10 6.75 7.25 7.25 8.80 8.80
9 6.50 5.15 4.35 3.60 2.90 4.00 2.15 1.65 1.35 0.90 0.90 0.90 1.65 2.90 2.90 4.35 6.10 6.50 6.65 4.75 5.15 5.95 6.50 6.50 7.55 7.55
10 6.65 5.45 4.60 4.00 3.00 4.35 2.45 2.15 1.45 1.35 0.90 0.90 1.45 2.45 2.45 4.00 5.45 6.10 6.50 4.60 4.75 5.65 6.10 6.10 7.40 7.40
11 7.25 6.10 4.75 4.35 3.60 4.60 2.90 2.45 1.65 1.45 0.90 0.90 0.90 1.65 1.65 3.00 4.75 5.15 5.45 4.00 4.35 4.80 5.15 5.15 6.65 6.65
12 8.05 7.25 6.10 5.15 4.60 5.45 4.00 3.60 2.90 2.45 1.65 1.45 0.90 1.20 1.20 2.45 4.35 4.60 4.75 3.00 3.60 4.15 4.60 4.60 6.10 6.10
13 9.10 8.05 7.25 6.50 5.45 6.65 4.75 4.60 4.00 3.60 2.90 2.45 1.65 1.20 0.90 1.45 3.00 3.60 4.00 2.15 2.45 3.20 3.60 3.60 4.75 4.75
13A 9.10 8.05 7.25 6.50 5.45 6.65 4.75 4.60 4.00 3.60 2.90 2.45 1.65 1.20 0.90 0.90 3.00 3.60 4.00 2.15 2.45 3.20 3.60 3.60 4.75 4.75
14 10.65 9.55 8.80 7.55 7.25 8.05 6.50 6.10 5.15 4.75 4.35 4.00 3.00 2.45 1.45 0.90 1.65 2.15 2.45 0.90 1.35 1.75 2.15 2.15 3.60 3.60
14A 12.30 11.25 10.25 9.55 9.05 9.70 8.05 7.55 7.25 6.65 6.10 5.45 4.75 4.35 3.00 3.00 1.65 0.90 1.35 2.45 2.90 3.50 4.00 4.00 5.15 5.15
14B 12.55 11.80 10.65 9.70 9.10 10.25 8.80 8.05 7.40 7.25 6.50 6.10 5.15 4.60 3.60 3.60 2.15 0.90 0.90 2.90 3.00 4.00 4.35 4.35 5.45 5.45
14C 13.30 12.00 11.00 10.25 9.55 10.65 9.05 8.80 7.55 7.40 6.65 6.50 5.45 4.75 4.00 4.00 2.45 1.35 0.90 3.00 3.60 4.15 4.60 4.60 6.10 6.10
15E 11.25 10.25 9.10 8.80 7.55 9.05 7.25 6.65 6.10 5.45 4.75 4.60 4.00 3.00 2.15 2.15 0.90 2.45 2.90 3.00 0.90 1.05 1.45 1.45 2.90 2.90
15W 11.80 10.65 9.55 9.05 8.05 9.10 7.40 7.25 6.50 6.10 5.15 4.75 4.35 3.60 2.45 2.45 1.35 2.90 3.00 3.60 0.90 1.20 1.35 1.35 2.45 2.45
15X 12.25 11.30 10.15 9.55 8.65 9.95 8.35 7.55 7.05 6.75 5.95 5.65 4.80 4.15 3.20 3.20 1.75 3.50 4.00 4.15 1.05 1.20 0.35 0.80
16E 12.55 11.80 10.65 9.70 9.10 10.25 8.80 8.05 7.40 7.25 6.50 6.10 5.15 4.60 3.60 3.60 2.15 4.00 4.35 4.60 1.45 1.35 0.35
16W 12.55 11.80 10.65 9.70 9.10 10.25 8.80 8.05 7.40 7.25 6.50 6.10 5.15 4.60 3.60 3.60 2.15 4.00 4.35 4.60 1.45 1.35 1.45
17 2.75
18E 13.85 13.30 12.00 11.25 10.65 11.80 9.70 9.55 9.05 8.80 7.55 7.40 6.65 6.10 4.75 4.75 3.60 5.15 5.45 6.10 2.90 2.45 0.80
18W 13.85 13.30 12.00 11.25 10.65 11.80 9.70 9.55 9.05 8.80 7.55 7.40 6.65 6.10 4.75 4.75 3.60 5.15 5.45 6.10 2.90 2.45 1.45
Passenger Car (Cash or E-ZPass) Peak Toll Rates
New Jersey Turnpike
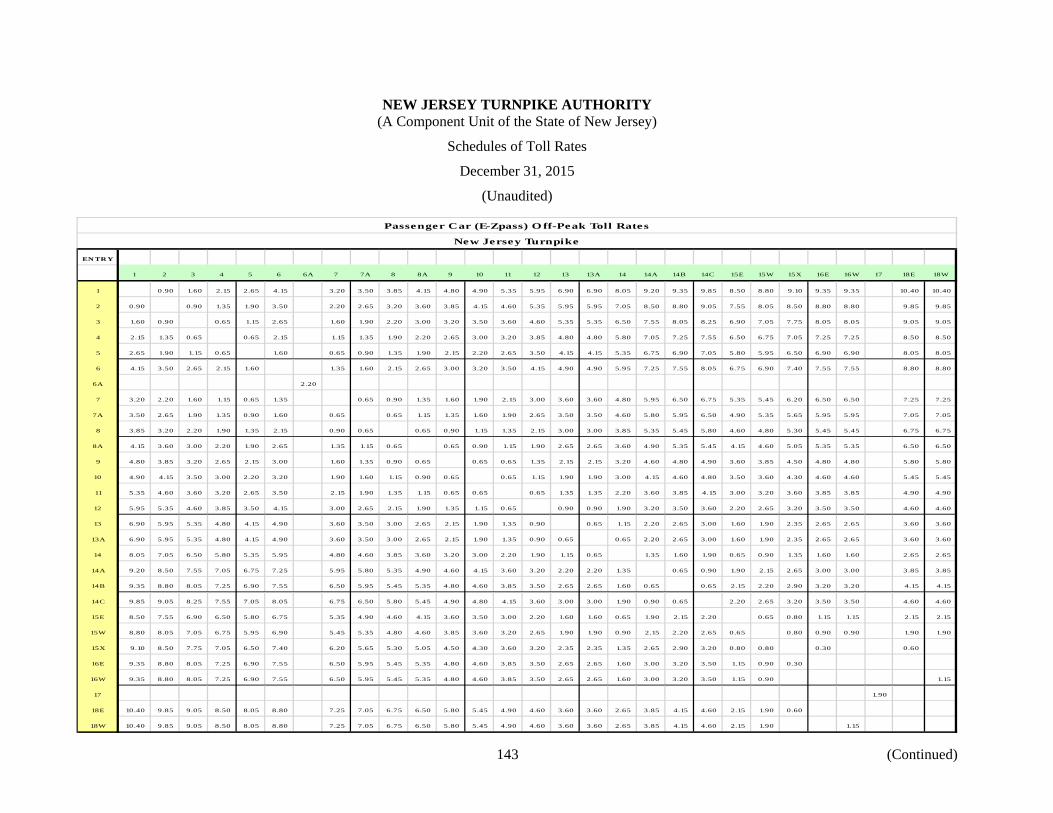
NEW JERSEY TURNPIKE AUTHORITY (A Component Unit of the State of New Jersey)
Schedules of Toll Rates
December 31, 2015
(Unaudited)
143 (Continued)
EN TR Y
1 2 3 4 5 6 6A 7 7A 8 8A 9 10 11 12 13 13A 14 14A 14B 14C 15E 15W 15X 16E 16W 17 18E 18W
1 0.90 1.60 2.15 2.65 4.15 3.20 3.50 3.85 4.15 4.80 4.90 5.35 5.95 6.90 6.90 8.05 9.20 9.35 9.85 8.50 8.80 9.10 9.35 9.35 10.40 10.40
2 0.90 0.90 1.35 1.90 3.50 2.20 2.65 3.20 3.60 3.85 4.15 4.60 5.35 5.95 5.95 7.05 8.50 8.80 9.05 7.55 8.05 8.50 8.80 8.80 9.85 9.85
3 1.60 0.90 0.65 1.15 2.65 1.60 1.90 2.20 3.00 3.20 3.50 3.60 4.60 5.35 5.35 6.50 7.55 8.05 8.25 6.90 7.05 7.75 8.05 8.05 9.05 9.05
4 2.15 1.35 0.65 0.65 2.15 1.15 1.35 1.90 2.20 2.65 3.00 3.20 3.85 4.80 4.80 5.80 7.05 7.25 7.55 6.50 6.75 7.05 7.25 7.25 8.50 8.50
5 2.65 1.90 1.15 0.65 1.60 0.65 0.90 1.35 1.90 2.15 2.20 2.65 3.50 4.15 4.15 5.35 6.75 6.90 7.05 5.80 5.95 6.50 6.90 6.90 8.05 8.05
6 4.15 3.50 2.65 2.15 1.60 1.35 1.60 2.15 2.65 3.00 3.20 3.50 4.15 4.90 4.90 5.95 7.25 7.55 8.05 6.75 6.90 7.40 7.55 7.55 8.80 8.80
6A 2.20
7 3.20 2.20 1.60 1.15 0.65 1.35 0.65 0.90 1.35 1.60 1.90 2.15 3.00 3.60 3.60 4.80 5.95 6.50 6.75 5.35 5.45 6.20 6.50 6.50 7.25 7.25
7A 3.50 2.65 1.90 1.35 0.90 1.60 0.65 0.65 1.15 1.35 1.60 1.90 2.65 3.50 3.50 4.60 5.80 5.95 6.50 4.90 5.35 5.65 5.95 5.95 7.05 7.05
8 3.85 3.20 2.20 1.90 1.35 2.15 0.90 0.65 0.65 0.90 1.15 1.35 2.15 3.00 3.00 3.85 5.35 5.45 5.80 4.60 4.80 5.30 5.45 5.45 6.75 6.75
8A 4.15 3.60 3.00 2.20 1.90 2.65 1.35 1.15 0.65 0.65 0.90 1.15 1.90 2.65 2.65 3.60 4.90 5.35 5.45 4.15 4.60 5.05 5.35 5.35 6.50 6.50
9 4.80 3.85 3.20 2.65 2.15 3.00 1.60 1.35 0.90 0.65 0.65 0.65 1.35 2.15 2.15 3.20 4.60 4.80 4.90 3.60 3.85 4.50 4.80 4.80 5.80 5.80
10 4.90 4.15 3.50 3.00 2.20 3.20 1.90 1.60 1.15 0.90 0.65 0.65 1.15 1.90 1.90 3.00 4.15 4.60 4.80 3.50 3.60 4.30 4.60 4.60 5.45 5.45
11 5.35 4.60 3.60 3.20 2.65 3.50 2.15 1.90 1.35 1.15 0.65 0.65 0.65 1.35 1.35 2.20 3.60 3.85 4.15 3.00 3.20 3.60 3.85 3.85 4.90 4.90
12 5.95 5.35 4.60 3.85 3.50 4.15 3.00 2.65 2.15 1.90 1.35 1.15 0.65 0.90 0.90 1.90 3.20 3.50 3.60 2.20 2.65 3.20 3.50 3.50 4.60 4.60
13 6.90 5.95 5.35 4.80 4.15 4.90 3.60 3.50 3.00 2.65 2.15 1.90 1.35 0.90 0.65 1.15 2.20 2.65 3.00 1.60 1.90 2.35 2.65 2.65 3.60 3.60
13A 6.90 5.95 5.35 4.80 4.15 4.90 3.60 3.50 3.00 2.65 2.15 1.90 1.35 0.90 0.65 0.65 2.20 2.65 3.00 1.60 1.90 2.35 2.65 2.65 3.60 3.60
14 8.05 7.05 6.50 5.80 5.35 5.95 4.80 4.60 3.85 3.60 3.20 3.00 2.20 1.90 1.15 0.65 1.35 1.60 1.90 0.65 0.90 1.35 1.60 1.60 2.65 2.65
14A 9.20 8.50 7.55 7.05 6.75 7.25 5.95 5.80 5.35 4.90 4.60 4.15 3.60 3.20 2.20 2.20 1.35 0.65 0.90 1.90 2.15 2.65 3.00 3.00 3.85 3.85
14B 9.35 8.80 8.05 7.25 6.90 7.55 6.50 5.95 5.45 5.35 4.80 4.60 3.85 3.50 2.65 2.65 1.60 0.65 0.65 2.15 2.20 2.90 3.20 3.20 4.15 4.15
14C 9.85 9.05 8.25 7.55 7.05 8.05 6.75 6.50 5.80 5.45 4.90 4.80 4.15 3.60 3.00 3.00 1.90 0.90 0.65 2.20 2.65 3.20 3.50 3.50 4.60 4.60
15E 8.50 7.55 6.90 6.50 5.80 6.75 5.35 4.90 4.60 4.15 3.60 3.50 3.00 2.20 1.60 1.60 0.65 1.90 2.15 2.20 0.65 0.80 1.15 1.15 2.15 2.15
15W 8.80 8.05 7.05 6.75 5.95 6.90 5.45 5.35 4.80 4.60 3.85 3.60 3.20 2.65 1.90 1.90 0.90 2.15 2.20 2.65 0.65 0.80 0.90 0.90 1.90 1.90
15X 9.10 8.50 7.75 7.05 6.50 7.40 6.20 5.65 5.30 5.05 4.50 4.30 3.60 3.20 2.35 2.35 1.35 2.65 2.90 3.20 0.80 0.80 0.30 0.60
16E 9.35 8.80 8.05 7.25 6.90 7.55 6.50 5.95 5.45 5.35 4.80 4.60 3.85 3.50 2.65 2.65 1.60 3.00 3.20 3.50 1.15 0.90 0.30
16W 9.35 8.80 8.05 7.25 6.90 7.55 6.50 5.95 5.45 5.35 4.80 4.60 3.85 3.50 2.65 2.65 1.60 3.00 3.20 3.50 1.15 0.90 1.15
17 1.90
18E 10.40 9.85 9.05 8.50 8.05 8.80 7.25 7.05 6.75 6.50 5.80 5.45 4.90 4.60 3.60 3.60 2.65 3.85 4.15 4.60 2.15 1.90 0.60
18W 10.40 9.85 9.05 8.50 8.05 8.80 7.25 7.05 6.75 6.50 5.80 5.45 4.90 4.60 3.60 3.60 2.65 3.85 4.15 4.60 2.15 1.90 1.15
Passenger Car (E-Zpass) O ff-Peak Toll Rates
New Jersey Turnpike

NEW JERSEY TURNPIKE AUTHORITY (A Component Unit of the State of New Jersey)
Schedules of Toll Rates
December 31, 2015
(Unaudited)
144 (Continued)
EN TR Y
1 2 3 4 5 6 6A 7 7A 8 8A 9 10 11 12 13 13A 14 14A 14B 14C 15E 15W 15X 16E 16W 17 18E 18W
1 2.15 4.60 5.65 7.40 11.45 8.40 9.35 10.65 11.45 12.85 13.40 15.85 16.90 18.65 18.65 21.35 25.15 26.25 27.10 22.70 23.85 24.85 25.70 25.70 28.45 28.45
2 2.15 2.45 3.50 5.30 9.35 6.35 7.40 8.40 9.85 10.65 11.45 13.90 15.45 16.50 16.50 19.20 23.50 24.10 24.95 21.10 21.65 23.20 23.85 23.85 26.45 26.45
3 4.60 2.45 1.20 2.75 7.40 4.35 4.90 6.10 7.40 8.25 8.65 11.45 12.85 13.90 13.90 16.70 21.10 21.65 22.40 18.65 19.20 20.60 21.35 21.35 24.10 24.10
4 5.65 3.50 1.20 1.65 5.65 2.75 3.50 4.90 6.10 7.40 8.05 10.40 11.45 12.85 12.85 15.60 19.35 20.60 21.35 16.90 18.00 19.05 19.90 19.90 22.70 22.70
5 7.40 5.30 2.75 1.65 4.35 1.20 2.15 3.30 4.60 5.30 6.10 8.40 9.85 10.95 10.95 13.90 18.00 18.80 19.35 15.60 16.50 17.75 18.65 18.65 21.35 21.35
6 11.45 9.35 7.40 5.65 4.35 3.30 4.35 5.30 6.35 7.35 8.25 10.65 11.80 13.10 13.10 15.85 19.90 21.10 21.65 17.60 18.65 19.75 20.60 20.60 23.50 23.50
6A 5.45
7 8.40 6.35 4.35 2.75 1.20 3.30 1.20 2.15 3.30 4.35 4.90 7.35 8.40 9.85 9.85 12.85 16.70 17.60 18.65 14.25 15.45 16.15 16.90 16.90 19.90 19.90
7A 9.35 7.40 4.90 3.50 2.15 4.35 1.20 1.20 2.45 3.30 4.35 6.35 8.05 8.65 8.65 11.80 15.85 16.70 17.60 13.40 14.25 15.60 16.50 16.50 19.20 19.20
8 10.65 8.40 6.10 4.90 3.30 5.30 2.15 1.20 1.20 2.15 2.75 5.30 6.35 8.05 8.05 10.65 14.55 15.60 16.50 12.30 13.10 14.55 15.45 15.45 18.00 18.00
8A 11.45 9.85 7.40 6.10 4.60 6.35 3.30 2.45 1.20 1.20 2.15 4.60 5.65 7.40 7.40 9.85 13.90 14.55 15.60 11.45 12.30 13.45 14.25 14.25 16.90 16.90
9 12.85 10.65 8.25 7.40 5.30 7.35 4.35 3.30 2.15 1.20 1.20 3.30 4.60 5.65 5.65 8.40 12.85 13.40 14.25 10.40 10.95 12.30 13.10 13.10 15.85 15.85
10 13.40 11.45 8.65 8.05 6.10 8.25 4.90 4.35 2.75 2.15 1.20 2.45 3.50 4.90 4.90 8.05 11.80 12.85 13.40 9.35 10.40 11.45 12.30 12.30 15.45 15.45
11 15.85 13.90 11.45 10.40 8.40 10.65 7.35 6.35 5.30 4.60 3.30 2.45 1.20 2.45 2.45 5.30 9.35 10.40 10.95 7.40 8.05 9.10 9.85 9.85 12.85 12.85
12 16.90 15.45 12.85 11.45 9.85 11.80 8.40 8.05 6.35 5.65 4.60 3.50 1.20 1.20 1.20 4.35 8.25 8.65 9.85 5.65 6.35 7.75 8.40 8.40 11.45 11.45
13 18.65 16.50 13.90 12.85 10.95 13.10 9.85 8.65 8.05 7.40 5.65 4.90 2.45 1.20 1.20 2.75 7.40 8.05 8.40 4.60 5.30 6.65 7.35 7.35 10.40 10.40
13A 18.65 16.50 13.90 12.85 10.95 13.10 9.85 8.65 8.05 7.40 5.65 4.90 2.45 1.20 1.20 1.75 7.40 8.05 8.40 4.60 5.30 6.65 7.35 7.35 10.40 10.40
14 21.35 19.20 16.70 15.60 13.90 15.85 12.85 11.80 10.65 9.85 8.40 8.05 5.30 4.35 2.75 1.75 4.35 4.90 5.65 1.65 2.45 3.75 4.60 4.60 7.35 7.35
14A 25.15 23.50 21.10 19.35 18.00 19.90 16.70 15.85 14.55 13.90 12.85 11.80 9.35 8.25 7.40 7.40 4.35 1.65 2.45 5.65 6.35 7.75 8.40 8.40 11.45 11.45
14B 26.25 24.10 21.65 20.60 18.80 21.10 17.60 16.70 15.60 14.55 13.40 12.85 10.40 8.65 8.05 8.05 4.90 1.65 1.20 6.35 7.35 8.40 9.35 9.35 12.30 12.30
14C 27.10 24.95 22.40 21.35 19.35 21.65 18.65 17.60 16.50 15.60 14.25 13.40 10.95 9.85 8.40 8.40 5.65 2.45 1.20 7.35 8.25 9.55 10.40 10.40 13.10 13.10
15E 22.70 21.10 18.65 16.90 15.60 17.60 14.25 13.40 12.30 11.45 10.40 9.35 7.40 5.65 4.60 4.60 1.65 5.65 6.35 7.35 2.15 2.00 2.75 2.75 5.65 5.65
15W 23.85 21.65 19.20 18.00 16.50 18.65 15.45 14.25 13.10 12.30 10.95 10.40 8.05 6.35 5.30 5.30 2.45 6.35 7.35 8.25 2.15 2.15 2.15 2.15 4.90 4.90
15X 24.85 23.20 20.60 19.05 17.75 19.75 16.15 15.60 14.55 13.45 12.30 11.45 9.10 7.75 6.65 6.65 3.75 7.75 8.40 9.55 2.00 2.15 0.65 1.60
16E 25.70 23.85 21.35 19.90 18.65 20.60 16.90 16.50 15.45 14.25 13.10 12.30 9.85 8.40 7.35 7.35 4.60 8.40 9.35 10.40 2.75 2.15 0.65
16W 25.70 23.85 21.35 19.90 18.65 20.60 16.90 16.50 15.45 14.25 13.10 12.30 9.85 8.40 7.35 7.35 4.60 8.40 9.35 10.40 2.75 2.15 2.45
17 5.60
18E 28.45 26.45 24.10 22.70 21.35 23.50 19.90 19.20 18.00 16.90 15.85 15.45 12.85 11.45 10.40 10.40 7.35 11.45 12.30 13.10 5.65 4.90 1.60
18W 28.45 26.45 24.10 22.70 21.35 23.50 19.90 19.20 18.00 16.90 15.85 15.45 12.85 11.45 10.40 10.40 7.35 11.45 12.30 13.10 5.65 4.90 2.45
Truck Class 2 (Cash) Toll Rates
New Jersey Turnpike

NEW JERSEY TURNPIKE AUTHORITY (A Component Unit of the State of New Jersey)
Schedules of Toll Rates
December 31, 2015
(Unaudited)
145 (Continued)
EN TR Y
1 2 3 4 5 6 6A 7 7A 8 8A 9 10 11 12 13 13A 14 14A 14B 14C 15E 15W 15X 16E 16W 17 18E 18W
1 1.90 4.30 5.30 6.75 10.50 7.75 8.50 9.70 10.50 11.80 12.25 14.45 15.55 17.05 17.05 19.35 23.05 24.00 24.70 20.65 21.75 22.70 23.50 23.50 26.00 26.00
2 1.90 2.20 3.20 4.75 8.50 5.80 6.75 7.75 9.05 9.70 10.50 12.80 14.00 15.00 15.00 17.45 21.50 21.95 22.80 19.20 19.80 20.95 21.75 21.75 24.35 24.35
3 4.30 2.20 1.20 2.60 6.45 4.05 4.50 5.60 6.75 7.50 8.05 10.50 11.80 12.80 12.80 15.30 19.20 19.80 20.45 17.05 17.45 18.75 19.35 19.35 21.95 21.95
4 5.30 3.20 1.20 1.45 5.30 2.60 3.20 4.50 5.60 6.45 7.25 9.55 10.50 11.80 11.80 14.25 17.65 18.75 19.35 15.55 16.50 17.60 18.30 18.30 20.65 20.65
5 6.75 4.75 2.60 1.45 4.05 1.20 1.90 3.00 4.30 4.75 5.60 7.75 9.05 9.95 9.95 12.80 16.50 17.20 17.65 14.25 15.00 16.30 17.05 17.05 19.35 19.35
6 10.50 8.50 6.45 5.30 4.05 3.00 4.05 4.75 5.80 6.75 7.50 9.70 10.70 12.00 12.00 14.45 18.30 19.20 19.80 16.00 17.05 18.00 18.75 18.75 21.50 21.50
6A 4.90
7 7.75 5.80 4.05 2.60 1.20 3.00 1.20 1.90 3.00 4.05 4.50 6.75 7.75 9.05 9.05 11.80 15.30 16.00 17.05 12.95 14.00 14.75 15.55 15.55 18.30 18.30
7A 8.50 6.75 4.50 3.20 1.90 4.05 1.20 1.20 2.20 3.00 4.05 5.80 7.25 8.05 8.05 10.70 14.45 15.30 16.00 12.25 12.95 14.25 15.00 15.00 17.45 17.45
8 9.70 7.75 5.60 4.50 3.00 4.75 1.90 1.20 1.20 1.90 2.60 4.75 5.80 7.25 7.25 9.70 13.15 14.25 15.00 11.25 12.00 13.30 14.00 14.00 16.50 16.50
8A 10.50 9.05 6.75 5.60 4.30 5.80 3.00 2.20 1.20 1.20 1.90 4.30 5.30 6.45 6.45 9.05 12.80 13.15 14.25 10.50 11.25 12.30 12.95 12.95 15.55 15.55
9 11.80 9.70 7.50 6.45 4.75 6.75 4.05 3.00 1.90 1.20 1.20 3.00 4.30 5.30 5.30 7.75 11.80 12.25 12.95 9.55 9.95 11.30 12.00 12.00 14.45 14.45
10 12.25 10.50 8.05 7.25 5.60 7.50 4.50 4.05 2.60 1.90 1.20 2.20 3.20 4.50 4.50 7.25 10.70 11.80 12.25 8.50 9.55 10.50 11.25 11.25 14.00 14.00
11 14.45 12.80 10.50 9.55 7.75 9.70 6.75 5.80 4.75 4.30 3.00 2.20 1.20 2.20 2.20 4.75 8.50 9.55 9.95 6.45 7.25 8.25 9.05 9.05 11.80 11.80
12 15.55 14.00 11.80 10.50 9.05 10.70 7.75 7.25 5.80 5.30 4.30 3.20 1.20 1.20 1.20 4.05 7.50 8.05 9.05 5.30 5.80 7.05 7.75 7.75 10.50 10.50
13 17.05 15.00 12.80 11.80 9.95 12.00 9.05 8.05 7.25 6.45 5.30 4.50 2.20 1.20 1.20 2.60 6.45 7.25 7.75 4.30 4.75 6.10 6.75 6.75 9.55 9.55
13A 17.05 15.00 12.80 11.80 9.95 12.00 9.05 8.05 7.25 6.45 5.30 4.50 2.20 1.20 1.20 1.60 6.45 7.25 7.75 4.30 4.75 6.10 6.75 6.75 9.55 9.55
14 19.35 17.45 15.30 14.25 12.80 14.45 11.80 10.70 9.70 9.05 7.75 7.25 4.75 4.05 2.60 1.60 4.05 4.50 5.30 1.45 2.20 3.50 4.30 4.30 6.75 6.75
14A 23.05 21.50 19.20 17.65 16.50 18.30 15.30 14.45 13.15 12.80 11.80 10.70 8.50 7.50 6.45 6.45 4.05 1.45 2.20 5.30 5.80 7.05 7.75 7.75 10.50 10.50
14B 24.00 21.95 19.80 18.75 17.20 19.20 16.00 15.30 14.25 13.15 12.25 11.80 9.55 8.05 7.25 7.25 4.50 1.45 1.20 5.80 6.75 7.75 8.50 8.50 11.25 11.25
14C 24.70 22.80 20.45 19.35 17.65 19.80 17.05 16.00 15.00 14.25 12.95 12.25 9.95 9.05 7.75 7.75 5.30 2.20 1.20 6.75 7.50 8.80 9.55 9.55 12.00 12.00
15E 20.65 19.20 17.05 15.55 14.25 16.00 12.95 12.25 11.25 10.50 9.55 8.50 6.45 5.30 4.30 4.30 1.45 5.30 5.80 6.75 1.90 1.75 2.60 2.60 5.30 5.30
15W 21.75 19.80 17.45 16.50 15.00 17.05 14.00 12.95 12.00 11.25 9.95 9.55 7.25 5.80 4.75 4.75 2.20 5.80 6.75 7.50 1.90 1.90 1.90 1.90 4.50 4.50
15X 22.70 20.95 18.75 17.60 16.30 18.00 14.75 14.25 13.30 12.30 11.30 10.50 8.25 7.05 6.10 6.10 3.50 7.05 7.75 8.80 1.75 1.90 0.65 1.45
16E 23.50 21.75 19.35 18.30 17.05 18.75 15.55 15.00 14.00 12.95 12.00 11.25 9.05 7.75 6.75 6.75 4.30 7.75 8.50 9.55 2.60 1.90 0.65
16W 23.50 21.75 19.35 18.30 17.05 18.75 15.55 15.00 14.00 12.95 12.00 11.25 9.05 7.75 6.75 6.75 4.30 7.75 8.50 9.55 2.60 1.90 2.20
17 5.10
18E 26.00 24.35 21.95 20.65 19.35 21.50 18.30 17.45 16.50 15.55 14.45 14.00 11.80 10.50 9.55 9.55 6.75 10.50 11.25 12.00 5.30 4.50 1.45
18W 26.00 24.35 21.95 20.65 19.35 21.50 18.30 17.45 16.50 15.55 14.45 14.00 11.80 10.50 9.55 9.55 6.75 10.50 11.25 12.00 5.30 4.50 2.20
Truck Class 2 (E-ZPass) Peak Toll Rates
New Jersey Turnpike

NEW JERSEY TURNPIKE AUTHORITY (A Component Unit of the State of New Jersey)
Schedules of Toll Rates
December 31, 2015
(Unaudited)
146 (Continued)
EN TR Y
1 2 3 4 5 6 6A 7 7A 8 8A 9 10 11 12 13 13A 14 14A 14B 14C 15E 15W 15X 16E 16W 17 18E 18W
1 1.80 4.10 5.05 6.40 10.00 7.35 8.05 9.20 10.00 11.20 11.65 13.75 14.75 16.20 16.20 18.40 21.90 22.80 23.45 19.60 20.65 21.55 22.35 22.35 24.70 24.70
2 1.80 2.10 3.05 4.50 8.05 5.50 6.40 7.35 8.60 9.20 10.00 12.15 13.30 14.25 14.25 16.60 20.45 20.85 21.65 18.25 18.80 19.90 20.65 20.65 23.15 23.15
3 4.10 2.10 1.15 2.45 6.15 3.85 4.30 5.30 6.40 7.15 7.65 10.00 11.20 12.15 12.15 14.55 18.25 18.80 19.45 16.20 16.60 17.80 18.40 18.40 20.85 20.85
4 5.05 3.05 1.15 1.40 5.05 2.45 3.05 4.30 5.30 6.15 6.90 9.05 10.00 11.20 11.20 13.55 16.75 17.80 18.40 14.75 15.65 16.70 17.40 17.40 19.60 19.60
5 6.40 4.50 2.45 1.40 3.85 1.15 1.80 2.85 4.05 4.50 5.30 7.35 8.60 9.45 9.45 12.15 15.65 16.35 16.75 13.55 14.25 15.50 16.20 16.20 18.40 18.40
6 10.00 8.05 6.15 5.05 3.85 2.85 3.85 4.50 5.50 6.40 7.15 9.20 10.15 11.40 11.40 13.75 17.40 18.25 18.80 15.20 16.20 17.10 17.80 17.80 20.45 20.45
6A 4.65
7 7.35 5.50 3.85 2.45 1.15 2.85 1.15 1.80 2.85 3.85 4.30 6.40 7.35 8.60 8.60 11.20 14.55 15.20 16.20 12.30 13.30 14.00 14.75 14.75 17.40 17.40
7A 8.05 6.40 4.30 3.05 1.80 3.85 1.15 1.15 2.10 2.85 3.85 5.50 6.90 7.65 7.65 10.15 13.75 14.55 15.20 11.65 12.30 13.55 14.25 14.25 16.60 16.60
8 9.20 7.35 5.30 4.30 2.85 4.50 1.80 1.15 1.15 1.80 2.45 4.50 5.50 6.90 6.90 9.20 12.50 13.55 14.25 10.70 11.40 12.65 13.30 13.30 15.65 15.65
8A 10.00 8.60 6.40 5.30 4.05 5.50 2.85 2.10 1.15 1.15 1.80 4.10 5.05 6.10 6.10 8.60 12.15 12.50 13.55 10.00 10.70 11.70 12.30 12.30 14.75 14.75
9 11.20 9.20 7.15 6.15 4.50 6.40 3.85 2.85 1.80 1.15 1.15 2.80 4.05 5.05 5.05 7.35 11.20 11.65 12.30 9.05 9.45 10.75 11.40 11.40 13.75 13.75
10 11.65 10.00 7.65 6.90 5.30 7.15 4.30 3.85 2.45 1.80 1.15 2.10 3.05 4.30 4.30 6.90 10.15 11.20 11.65 8.00 9.05 10.00 10.70 10.70 13.30 13.30
11 13.75 12.15 10.00 9.05 7.35 9.20 6.40 5.50 4.50 4.10 2.80 2.10 1.15 2.10 2.10 4.40 8.00 9.05 9.45 6.10 6.90 7.85 8.60 8.60 11.20 11.20
12 14.75 13.30 11.20 10.00 8.60 10.15 7.35 6.90 5.50 5.05 4.05 3.05 1.15 1.15 1.15 3.85 7.10 7.65 8.60 5.05 5.45 6.70 7.35 7.35 10.00 10.00
13 16.20 14.25 12.15 11.20 9.45 11.40 8.60 7.65 6.90 6.10 5.05 4.30 2.10 1.15 1.15 2.35 6.10 6.90 7.35 4.05 4.40 5.80 6.40 6.40 9.05 9.05
13A 16.20 14.25 12.15 11.20 9.45 11.40 8.60 7.65 6.90 6.10 5.05 4.30 2.10 1.15 1.15 1.50 6.10 6.90 7.35 4.05 4.40 5.80 6.40 6.40 9.05 9.05
14 18.40 16.60 14.55 13.55 12.15 13.75 11.20 10.15 9.20 8.60 7.35 6.90 4.40 3.85 2.35 1.50 3.85 4.30 5.05 1.40 2.10 3.30 4.05 4.05 6.40 6.40
14A 21.90 20.45 18.25 16.75 15.65 17.40 14.55 13.75 12.50 12.15 11.20 10.15 8.00 7.10 6.10 6.10 3.85 1.40 2.10 5.05 5.45 6.70 7.35 7.35 10.00 10.00
14B 22.80 20.85 18.80 17.80 16.35 18.25 15.20 14.55 13.55 12.50 11.65 11.20 9.05 7.65 6.90 6.90 4.30 1.40 1.15 5.45 6.40 7.35 8.00 8.00 10.70 10.70
14C 23.45 21.65 19.45 18.40 16.75 18.80 16.20 15.20 14.25 13.55 12.30 11.65 9.45 8.60 7.35 7.35 5.05 2.10 1.15 6.40 7.10 8.35 9.05 9.05 11.40 11.40
15E 19.60 18.25 16.20 14.75 13.55 15.20 12.30 11.65 10.70 10.00 9.05 8.00 6.10 5.05 4.05 4.05 1.40 5.05 5.45 6.40 1.80 1.65 2.35 2.35 5.05 5.05
15W 20.65 18.80 16.60 15.65 14.25 16.20 13.30 12.30 11.40 10.70 9.45 9.05 6.90 5.45 4.40 4.40 2.10 5.45 6.40 7.10 1.80 1.80 1.80 1.80 4.30 4.30
15X 21.55 19.90 17.80 16.70 15.50 17.10 14.00 13.55 12.65 11.70 10.75 10.00 7.85 6.70 5.80 5.80 3.30 6.70 7.35 8.35 1.65 1.80 0.60 1.40
16E 22.35 20.65 18.40 17.40 16.20 17.80 14.75 14.25 13.30 12.30 11.40 10.70 8.60 7.35 6.40 6.40 4.05 7.35 8.00 9.05 2.35 1.80 0.60
16W 22.35 20.65 18.40 17.40 16.20 17.80 14.75 14.25 13.30 12.30 11.40 10.70 8.60 7.35 6.40 6.40 4.05 7.35 8.00 9.05 2.35 1.80 2.10
17 4.85
18E 24.70 23.15 20.85 19.60 18.40 20.45 17.40 16.60 15.65 14.75 13.75 13.30 11.20 10.00 9.05 9.05 6.40 10.00 10.70 11.40 5.05 4.30 1.40
18W 24.70 23.15 20.85 19.60 18.40 20.45 17.40 16.60 15.65 14.75 13.75 13.30 11.20 10.00 9.05 9.05 6.40 10.00 10.70 11.40 5.05 4.30 2.10
Truck Class 2 (E-Zpass) O ff-Peak Toll Rates
New Jersey Turnpike

NEW JERSEY TURNPIKE AUTHORITY (A Component Unit of the State of New Jersey)
Schedules of Toll Rates
December 31, 2015
(Unaudited)
147 (Continued)
EN TR Y
1 2 3 4 5 6 6A 7 7A 8 8A 9 10 11 12 13 13A 14 14A 14B 14C 15E 15W 15X 16E 16W 17 18E 18W
1 2.75 5.65 8.05 9.85 15.60 11.80 12.85 14.55 15.85 17.60 18.80 21.35 23.50 25.15 25.15 29.55 34.50 35.55 35.55 31.65 32.95 34.35 35.35 35.35 35.55 35.55
2 2.75 2.75 4.90 7.20 12.85 8.65 9.85 11.80 13.40 14.55 15.85 18.65 20.60 22.40 22.40 26.45 31.65 32.75 33.45 28.70 30.05 31.35 32.35 32.35 35.55 35.55
3 5.65 2.75 2.15 4.35 9.85 5.65 7.20 8.65 10.65 11.80 13.10 15.60 17.60 19.35 19.35 23.85 28.70 29.75 30.60 25.70 27.30 28.45 29.55 29.55 32.95 32.95
4 8.05 4.90 2.15 2.15 8.05 4.35 4.90 7.20 8.40 9.85 10.95 13.40 15.60 17.60 17.60 21.65 26.45 27.60 28.70 23.85 25.15 26.30 27.30 27.30 30.85 30.85
5 9.85 7.20 4.35 2.15 5.65 2.15 2.75 4.90 6.35 8.05 8.65 11.45 13.40 15.60 15.60 19.35 24.55 25.70 26.45 21.65 23.50 24.15 25.15 25.15 29.20 29.20
6 15.60 12.85 9.85 8.05 5.65 4.60 5.30 7.40 8.65 10.40 11.45 13.90 15.85 18.00 18.00 22.20 27.10 28.15 29.20 24.10 25.70 26.70 27.60 27.60 31.65 31.65
6A 5.45
7 11.80 8.65 5.65 4.35 2.15 4.60 2.15 2.75 4.60 5.65 7.20 9.35 11.45 13.40 13.40 17.60 22.40 23.85 24.55 19.35 21.35 22.25 23.50 23.50 27.10 27.10
7A 12.85 9.85 7.20 4.90 2.75 5.30 2.15 2.15 3.50 4.90 6.10 8.40 10.65 12.85 12.85 16.70 21.65 22.70 23.85 18.80 20.60 21.40 22.40 22.40 26.25 26.25
8 14.55 11.80 8.65 7.20 4.90 7.40 2.75 2.15 1.65 2.75 4.35 6.35 8.40 10.65 10.65 14.55 19.35 21.10 21.65 16.70 18.65 19.50 20.60 20.60 24.10 24.10
8A 15.85 13.40 10.65 8.40 6.35 8.65 4.60 3.50 1.65 1.65 2.75 5.30 7.40 9.35 9.35 13.40 18.65 19.35 20.60 15.60 16.90 18.20 19.20 19.20 22.70 22.70
9 17.60 14.55 11.80 9.85 8.05 10.40 5.65 4.90 2.75 1.65 1.65 3.50 5.65 8.05 8.05 11.80 16.70 18.00 18.80 13.90 15.60 16.60 17.60 17.60 21.35 21.35
10 18.80 15.85 13.10 10.95 8.65 11.45 7.20 6.10 4.35 2.75 1.65 2.45 4.60 6.35 6.35 10.65 15.60 16.70 17.60 12.85 14.25 15.55 16.50 16.50 19.90 19.90
11 21.35 18.65 15.60 13.40 11.45 13.90 9.35 8.40 6.35 5.30 3.50 2.45 2.15 4.35 4.35 8.25 13.10 14.25 15.45 10.40 11.80 12.95 13.90 13.90 17.60 17.60
12 23.50 20.60 17.60 15.60 13.40 15.85 11.45 10.65 8.40 7.40 5.65 4.60 2.15 2.15 2.15 6.10 10.95 12.30 13.10 8.25 9.85 10.80 11.80 11.80 15.60 15.60
13 25.15 22.40 19.35 17.60 15.60 18.00 13.40 12.85 10.65 9.35 8.05 6.35 4.35 2.15 1.65 4.35 8.65 10.40 10.95 6.10 8.05 8.80 9.85 9.85 13.40 13.40
13A 25.15 22.40 19.35 17.60 15.60 18.00 13.40 12.85 10.65 9.35 8.05 6.35 4.35 2.15 1.65 2.75 8.65 10.40 10.95 6.10 8.05 8.80 9.85 9.85 13.40 13.40
14 29.55 26.45 23.85 21.65 19.35 22.20 17.60 16.70 14.55 13.40 11.80 10.65 8.25 6.10 4.35 2.75 4.90 6.10 7.20 2.15 3.50 4.75 5.65 5.65 9.35 9.35
14A 34.50 31.65 28.70 26.45 24.55 27.10 22.40 21.65 19.35 18.65 16.70 15.60 13.10 10.95 8.65 8.65 4.90 2.15 2.75 7.20 8.40 9.65 10.65 10.65 14.25 14.25
14B 35.55 32.75 29.75 27.60 25.70 28.15 23.85 22.70 21.10 19.35 18.00 16.70 14.25 12.30 10.40 10.40 6.10 2.15 2.15 8.25 9.85 10.80 11.80 11.80 15.60 15.60
14C 35.55 33.45 30.60 28.70 26.45 29.20 24.55 23.85 21.65 20.60 18.80 17.60 15.45 13.10 10.95 10.95 7.20 2.75 2.15 8.65 10.65 11.70 12.85 12.85 16.50 16.50
15E 31.65 28.70 25.70 23.85 21.65 24.10 19.35 18.80 16.70 15.60 13.90 12.85 10.40 8.25 6.10 6.10 2.15 7.20 8.25 8.65 2.15 2.60 3.50 3.50 7.40 7.40
15W 32.95 30.05 27.30 25.15 23.50 25.70 21.35 20.60 18.65 16.90 15.60 14.25 11.80 9.85 8.05 8.05 3.50 8.40 9.85 10.65 2.15 2.30 2.45 2.45 5.65 5.65
15X 34.35 31.35 28.45 26.30 24.15 26.70 22.25 21.40 19.50 18.20 16.60 15.55 12.95 10.80 8.80 8.80 4.75 9.65 10.80 11.70 2.60 2.30 0.90 2.00
16E 35.35 32.35 29.55 27.30 25.15 27.60 23.50 22.40 20.60 19.20 17.60 16.50 13.90 11.80 9.85 9.85 5.65 10.65 11.80 12.85 3.50 2.45 0.90
16W 35.35 32.35 29.55 27.30 25.15 27.60 23.50 22.40 20.60 19.20 17.60 16.50 13.90 11.80 9.85 9.85 5.65 10.65 11.80 12.85 3.50 2.45 3.30
17 5.60
18E 35.55 35.55 32.95 30.85 29.20 31.65 27.10 26.25 24.10 22.70 21.35 19.90 17.60 15.60 13.40 13.40 9.35 14.25 15.60 16.50 7.40 5.65 2.00
18W 35.55 35.55 32.95 30.85 29.20 31.65 27.10 26.25 24.10 22.70 21.35 19.90 17.60 15.60 13.40 13.40 9.35 14.25 15.60 16.50 7.40 5.65 3.30
Truck Class 3 (Cash) Toll Rates
New Jersey Turnpike

NEW JERSEY TURNPIKE AUTHORITY (A Component Unit of the State of New Jersey)
Schedules of Toll Rates
December 31, 2015
(Unaudited)
148 (Continued)
EN TR Y
1 2 3 4 5 6 6A 7 7A 8 8A 9 10 11 12 13 13A 14 14A 14B 14C 15E 15W 15X 16E 16W 17 18E 18W
1 2.60 5.30 7.25 9.05 14.25 10.70 11.80 13.15 14.45 16.00 17.20 19.35 21.50 23.05 23.05 27.00 31.50 32.45 32.45 29.00 30.20 31.35 32.20 32.20 32.45 32.45
2 2.60 2.60 4.50 6.45 11.80 8.05 9.05 10.70 12.25 13.15 14.45 17.05 18.75 20.45 20.45 24.35 29.00 30.00 30.50 26.25 27.55 28.60 29.45 29.45 32.45 32.45
3 5.30 2.60 1.90 4.05 9.05 5.30 6.45 8.05 9.70 10.70 12.00 14.25 16.00 17.65 17.65 21.75 26.25 27.25 27.90 23.50 24.95 26.00 27.00 27.00 30.20 30.20
4 7.25 4.50 1.90 1.90 7.25 4.05 4.50 6.45 7.75 9.05 9.95 12.25 14.25 16.00 16.00 19.80 24.35 25.15 26.25 21.75 23.05 24.10 24.95 24.95 28.30 28.30
5 9.05 6.45 4.05 1.90 5.30 1.90 2.60 4.50 5.80 7.25 8.05 10.50 12.25 14.25 14.25 17.65 22.50 23.50 24.35 19.80 21.50 22.20 23.05 23.05 26.70 26.70
6 14.25 11.80 9.05 7.25 5.30 4.30 4.75 6.75 8.05 9.55 10.50 12.80 14.45 16.50 16.50 20.25 24.70 25.70 26.70 21.95 23.50 24.35 25.15 25.15 29.00 29.00
6A 4.90
7 10.70 8.05 5.30 4.05 1.90 4.30 1.90 2.60 4.30 5.30 6.45 8.50 10.50 12.25 12.25 16.00 20.45 21.75 22.50 17.65 19.35 20.45 21.50 21.50 24.70 24.70
7A 11.80 9.05 6.45 4.50 2.60 4.75 1.90 1.90 3.20 4.50 5.60 7.75 9.70 11.80 11.80 15.30 19.80 20.65 21.75 17.20 18.75 19.60 20.45 20.45 24.00 24.00
8 13.15 10.70 8.05 6.45 4.50 6.75 2.60 1.90 1.45 2.60 4.05 5.80 7.75 9.70 9.70 13.15 17.65 19.20 19.80 15.30 17.05 17.75 18.75 18.75 21.95 21.95
8A 14.45 12.25 9.70 7.75 5.80 8.05 4.30 3.20 1.45 1.45 2.60 4.75 6.75 8.50 8.50 12.25 17.05 17.65 18.75 14.25 15.55 16.60 17.45 17.45 20.65 20.65
9 16.00 13.15 10.70 9.05 7.25 9.55 5.30 4.50 2.60 1.45 1.45 3.20 5.30 7.25 7.25 10.70 15.30 16.50 17.20 12.80 14.25 15.05 16.00 16.00 19.35 19.35
10 17.20 14.45 12.00 9.95 8.05 10.50 6.45 5.60 4.05 2.60 1.45 2.20 4.30 5.80 5.80 9.70 14.25 15.30 16.00 11.80 12.95 14.15 15.00 15.00 18.30 18.30
11 19.35 17.05 14.25 12.25 10.50 12.80 8.50 7.75 5.80 4.75 3.20 2.20 1.90 4.05 4.05 7.50 12.00 12.95 14.00 9.55 10.70 11.85 12.80 12.80 16.00 16.00
12 21.50 18.75 16.00 14.25 12.25 14.45 10.50 9.70 7.75 6.75 5.30 4.30 1.90 1.90 1.90 5.60 9.95 11.25 12.00 7.50 9.05 9.85 10.70 10.70 14.25 14.25
13 23.05 20.45 17.65 16.00 14.25 16.50 12.25 11.80 9.70 8.50 7.25 5.80 4.05 1.90 1.45 4.05 8.05 9.55 9.95 5.60 7.25 8.05 9.05 9.05 12.25 12.25
13A 23.05 20.45 17.65 16.00 14.25 16.50 12.25 11.80 9.70 8.50 7.25 5.80 4.05 1.90 1.45 2.60 8.05 9.55 9.95 5.60 7.25 8.05 9.05 9.05 12.25 12.25
14 27.00 24.35 21.75 19.80 17.65 20.25 16.00 15.30 13.15 12.25 10.70 9.70 7.50 5.60 4.05 2.60 4.50 5.60 6.45 1.90 3.20 4.30 5.30 5.30 8.50 8.50
14A 31.50 29.00 26.25 24.35 22.50 24.70 20.45 19.80 17.65 17.05 15.30 14.25 12.00 9.95 8.05 8.05 4.50 1.90 2.60 6.45 7.75 8.80 9.70 9.70 12.95 12.95
14B 32.45 30.00 27.25 25.15 23.50 25.70 21.75 20.65 19.20 17.65 16.50 15.30 12.95 11.25 9.55 9.55 5.60 1.90 1.90 7.50 9.05 9.85 10.70 10.70 14.25 14.25
14C 32.45 30.50 27.90 26.25 24.35 26.70 22.50 21.75 19.80 18.75 17.20 16.00 14.00 12.00 9.95 9.95 6.45 2.60 1.90 8.05 9.70 10.70 11.80 11.80 15.00 15.00
15E 29.00 26.25 23.50 21.75 19.80 21.95 17.65 17.20 15.30 14.25 12.80 11.80 9.55 7.50 5.60 5.60 1.90 6.45 7.50 8.05 1.90 2.35 3.20 3.20 6.75 6.75
15W 30.20 27.55 24.95 23.05 21.50 23.50 19.35 18.75 17.05 15.55 14.25 12.95 10.70 9.05 7.25 7.25 3.20 7.75 9.05 9.70 1.90 2.15 2.20 2.20 5.30 5.30
15X 31.35 28.60 26.00 24.10 22.20 24.35 20.45 19.60 17.75 16.60 15.05 14.15 11.85 9.85 8.05 8.05 4.30 8.80 9.85 10.70 2.35 2.15 0.80 1.90
16E 32.20 29.45 27.00 24.95 23.05 25.15 21.50 20.45 18.75 17.45 16.00 15.00 12.80 10.70 9.05 9.05 5.30 9.70 10.70 11.80 3.20 2.20 0.80
16W 32.20 29.45 27.00 24.95 23.05 25.15 21.50 20.45 18.75 17.45 16.00 15.00 12.80 10.70 9.05 9.05 5.30 9.70 10.70 11.80 3.20 2.20 3.00
17 5.15
18E 32.45 32.45 30.20 28.30 26.70 29.00 24.70 24.00 21.95 20.65 19.35 18.30 16.00 14.25 12.25 12.25 8.50 12.95 14.25 15.00 6.75 5.30 1.90
18W 32.45 32.45 30.20 28.30 26.70 29.00 24.70 24.00 21.95 20.65 19.35 18.30 16.00 14.25 12.25 12.25 8.50 12.95 14.25 15.00 6.75 5.30 3.00
Truck Class 3 (E-ZPass) Peak Toll Rates
New Jersey Turnpike

NEW JERSEY TURNPIKE AUTHORITY (A Component Unit of the State of New Jersey)
Schedules of Toll Rates
December 31, 2015
(Unaudited)
149 (Continued)
EN TR Y
1 2 3 4 5 6 6A 7 7A 8 8A 9 10 11 12 13 13A 14 14A 14B 14C 15E 15W 15X 16E 16W 17 18E 18W
1 2.45 5.05 6.90 8.60 13.55 10.15 11.20 12.50 13.75 15.20 16.35 18.40 20.45 21.90 21.90 25.65 29.90 30.85 30.85 27.55 28.70 29.80 30.60 30.60 30.85 30.85
2 2.45 2.45 4.30 6.15 11.20 7.70 8.60 10.15 11.65 12.50 13.75 16.20 17.80 19.45 19.45 23.15 27.55 28.50 28.95 24.95 26.15 27.15 28.00 28.00 30.85 30.85
3 5.05 2.45 1.80 3.85 8.60 5.05 6.15 7.70 9.20 10.15 11.40 13.55 15.20 16.75 16.75 20.65 24.95 25.90 26.50 22.35 23.70 24.70 25.65 25.65 28.70 28.70
4 6.90 4.30 1.80 1.80 6.90 3.85 4.30 6.15 7.35 8.60 9.45 11.65 13.55 15.20 15.20 18.80 23.15 23.90 24.95 20.65 21.90 22.90 23.70 23.70 26.90 26.90
5 8.60 6.15 3.85 1.80 5.05 1.80 2.45 4.30 5.50 6.90 7.70 10.00 11.65 13.55 13.55 16.75 21.40 22.35 23.15 18.80 20.45 21.10 21.90 21.90 25.35 25.35
6 13.55 11.20 8.60 6.90 5.05 4.10 4.50 6.40 7.70 9.05 10.00 12.15 13.75 15.65 15.65 19.25 23.45 24.40 25.35 20.85 22.35 23.15 23.90 23.90 27.55 27.55
6A 4.65
7 10.15 7.70 5.05 3.85 1.80 4.10 1.80 2.45 4.10 5.05 6.15 8.00 10.00 11.65 11.65 15.20 19.45 20.65 21.40 16.75 18.40 19.45 20.45 20.45 23.45 23.45
7A 11.20 8.60 6.15 4.30 2.45 4.50 1.80 1.80 3.05 4.30 5.30 7.35 9.20 11.20 11.20 14.55 18.80 19.60 20.65 16.35 17.80 18.60 19.45 19.45 22.80 22.80
8 12.50 10.15 7.70 6.15 4.30 6.40 2.45 1.80 1.40 2.45 3.85 5.50 7.35 9.20 9.20 12.50 16.75 18.25 18.80 14.55 16.20 16.85 17.80 17.80 20.85 20.85
8A 13.75 11.65 9.20 7.35 5.50 7.70 4.10 3.05 1.40 1.40 2.45 4.50 6.40 8.00 8.00 11.65 16.20 16.75 17.80 13.55 14.75 15.75 16.60 16.60 19.60 19.60
9 15.20 12.50 10.15 8.60 6.90 9.05 5.05 4.30 2.45 1.40 1.40 3.05 5.05 6.90 6.90 10.15 14.55 15.65 16.35 12.15 13.55 14.30 15.20 15.20 18.40 18.40
10 16.35 13.75 11.40 9.45 7.70 10.00 6.15 5.30 3.85 2.45 1.40 2.10 4.10 5.50 5.50 9.20 13.55 14.55 15.20 11.20 12.35 13.45 14.25 14.25 17.40 17.40
11 18.40 16.20 13.55 11.65 10.00 12.15 8.00 7.35 5.50 4.50 3.05 2.10 1.80 3.85 3.85 7.15 11.40 12.35 13.30 9.05 10.15 11.25 12.15 12.15 15.20 15.20
12 20.45 17.80 15.20 13.55 11.65 13.75 10.00 9.20 7.35 6.40 5.05 4.10 1.80 1.80 1.80 5.30 9.45 10.70 11.40 7.15 8.60 9.35 10.15 10.15 13.55 13.55
13 21.90 19.45 16.75 15.20 13.55 15.65 11.65 11.20 9.20 8.00 6.90 5.50 3.85 1.80 1.40 3.85 7.70 9.05 9.45 5.30 6.90 7.70 8.60 8.60 11.65 11.65
13A 21.90 19.45 16.75 15.20 13.55 15.65 11.65 11.20 9.20 8.00 6.90 5.50 3.85 1.80 1.40 2.45 7.70 9.05 9.45 5.30 6.90 7.70 8.60 8.60 11.65 11.65
14 25.65 23.15 20.65 18.80 16.75 19.25 15.20 14.55 12.50 11.65 10.15 9.20 7.15 5.30 3.85 2.45 4.30 5.30 6.15 1.80 3.05 4.10 5.05 5.05 8.00 8.00
14A 29.90 27.55 24.95 23.15 21.40 23.45 19.45 18.80 16.75 16.20 14.55 13.55 11.40 9.45 7.70 7.70 4.30 1.80 2.45 6.15 7.35 8.40 9.20 9.20 12.35 12.35
14B 30.85 28.50 25.90 23.90 22.35 24.40 20.65 19.60 18.25 16.75 15.65 14.55 12.35 10.70 9.05 9.05 5.30 1.80 1.80 7.15 8.60 9.35 10.15 10.15 13.55 13.55
14C 30.85 28.95 26.50 24.95 23.15 25.35 21.40 20.65 18.80 17.80 16.35 15.20 13.30 11.40 9.45 9.45 6.15 2.45 1.80 7.70 9.20 10.15 11.20 11.20 14.25 14.25
15E 27.55 24.95 22.35 20.65 18.80 20.85 16.75 16.35 14.55 13.55 12.15 11.20 9.05 7.15 5.30 5.30 1.80 6.15 7.15 7.70 1.80 2.20 3.05 3.05 6.40 6.40
15W 28.70 26.15 23.70 21.90 20.45 22.35 18.40 17.80 16.20 14.75 13.55 12.35 10.15 8.60 6.90 6.90 3.05 7.35 8.60 9.20 1.80 2.00 2.10 2.10 5.05 5.05
15X 29.80 27.15 24.70 22.90 21.10 23.15 19.45 18.60 16.85 15.75 14.30 13.45 11.25 9.35 7.70 7.70 4.10 8.40 9.35 10.15 2.20 2.00 0.75 1.80
16E 30.60 28.00 25.65 23.70 21.90 23.90 20.45 19.45 17.80 16.60 15.20 14.25 12.15 10.15 8.60 8.60 5.05 9.20 10.15 11.20 3.05 2.10 0.75
16W 30.60 28.00 25.65 23.70 21.90 23.90 20.45 19.45 17.80 16.60 15.20 14.25 12.15 10.15 8.60 8.60 5.05 9.20 10.15 11.20 3.05 2.10 2.85
17 4.90
18E 30.85 30.85 28.70 26.90 25.35 27.55 23.45 22.80 20.85 19.60 18.40 17.40 15.20 13.55 11.65 11.65 8.00 12.35 13.55 14.25 6.40 5.05 1.80
18W 30.85 30.85 28.70 26.90 25.35 27.55 23.45 22.80 20.85 19.60 18.40 17.40 15.20 13.55 11.65 11.65 8.00 12.35 13.55 14.25 6.40 5.05 2.85
Truck Class 3 (E-ZPass) O ff-Peak Toll Rates
New Jersey Turnpike

NEW JERSEY TURNPIKE AUTHORITY (A Component Unit of the State of New Jersey)
Schedules of Toll Rates
December 31, 2015
(Unaudited)
150 (Continued)
EN TR Y
1 2 3 4 5 6 6A 7 7A 8 8A 9 10 11 12 13 13A 14 14A 14B 14C 15E 15W 15X 16E 16W 17 18E 18W
1 3.30 6.35 8.65 11.45 18.00 13.90 15.45 16.90 18.80 20.60 22.20 24.55 27.10 29.55 29.55 33.65 39.95 40.75 41.85 36.40 38.00 39.65 40.75 40.75 42.75 42.75
2 3.30 3.30 5.65 8.25 14.55 10.65 11.80 13.90 15.60 16.90 18.80 21.35 23.85 26.25 26.25 30.60 36.40 37.80 38.85 32.95 34.75 36.40 37.80 37.80 41.70 41.70
3 6.35 3.30 2.45 4.90 11.45 7.40 8.40 10.65 12.30 13.90 15.60 18.00 20.60 22.70 22.70 27.30 32.95 34.50 35.55 29.75 31.65 33.20 34.50 34.50 38.25 38.25
4 8.65 5.65 2.45 2.45 8.65 4.90 6.10 8.25 9.85 11.45 13.10 15.60 18.00 20.60 20.60 24.95 30.60 31.90 32.95 27.30 29.20 30.60 31.90 31.90 35.80 35.80
5 11.45 8.25 4.90 2.45 6.35 2.45 3.50 5.65 7.40 8.65 10.65 13.10 15.60 18.00 18.00 22.40 28.15 29.55 30.60 24.95 26.45 28.30 29.55 29.55 33.45 33.45
6 18.00 14.55 11.45 8.65 6.35 5.30 6.35 8.40 10.40 11.80 13.40 15.85 18.65 21.10 21.10 25.15 30.85 32.35 33.45 27.60 29.55 31.05 32.35 32.35 36.40 36.40
6A 5.45
7 13.90 10.65 7.40 4.90 2.45 5.30 2.15 3.30 4.90 6.35 8.25 10.65 13.10 15.60 15.60 19.90 25.70 27.10 28.15 22.40 24.10 25.80 27.10 27.10 30.85 30.85
7A 15.45 11.80 8.40 6.10 3.50 6.35 2.15 2.15 4.35 5.30 7.20 9.35 11.80 14.25 14.25 18.80 24.55 25.70 27.10 21.35 22.70 24.55 25.70 25.70 29.75 29.75
8 16.90 13.90 10.65 8.25 5.65 8.40 3.30 2.15 2.15 3.30 4.90 7.40 9.85 12.30 12.30 16.70 22.40 23.85 24.95 19.20 21.10 22.55 23.85 23.85 27.60 27.60
8A 18.80 15.60 12.30 9.85 7.40 10.40 4.90 4.35 2.15 2.15 3.30 5.65 8.25 10.65 10.65 15.45 21.10 22.20 23.50 17.60 19.20 20.90 22.20 22.20 26.25 26.25
9 20.60 16.90 13.90 11.45 8.65 11.80 6.35 5.30 3.30 2.15 2.15 4.35 6.35 8.65 8.65 13.40 19.20 20.60 21.65 15.85 17.60 19.30 20.60 20.60 24.55 24.55
10 22.20 18.80 15.60 13.10 10.65 13.40 8.25 7.20 4.90 3.30 2.15 2.75 4.90 7.40 7.40 11.80 17.60 18.80 19.90 14.25 15.85 17.60 18.80 18.80 22.70 22.70
11 24.55 21.35 18.00 15.60 13.10 15.85 10.65 9.35 7.40 5.65 4.35 2.75 2.45 4.90 4.90 9.35 15.45 16.50 17.60 11.80 13.40 15.20 16.50 16.50 20.60 20.60
12 27.10 23.85 20.60 18.00 15.60 18.65 13.10 11.80 9.85 8.25 6.35 4.90 2.45 2.45 2.45 7.20 12.85 13.90 15.45 9.35 10.95 12.60 13.90 13.90 18.00 18.00
13 29.55 26.25 22.70 20.60 18.00 21.10 15.60 14.25 12.30 10.65 8.65 7.40 4.90 2.45 2.15 4.60 10.40 11.45 12.85 7.20 8.40 10.25 11.45 11.45 15.60 15.60
13A 29.55 26.25 22.70 20.60 18.00 21.10 15.60 14.25 12.30 10.65 8.65 7.40 4.90 2.45 2.15 3.00 10.40 11.45 12.85 7.20 8.40 10.25 11.45 11.45 15.60 15.60
14 33.65 30.60 27.30 24.95 22.40 25.15 19.90 18.80 16.70 15.45 13.40 11.80 9.35 7.20 4.60 3.00 5.65 7.20 8.25 2.45 4.35 5.90 7.20 7.20 10.95 10.95
14A 39.95 36.40 32.95 30.60 28.15 30.85 25.70 24.55 22.40 21.10 19.20 17.60 15.45 12.85 10.40 10.40 5.65 2.45 3.50 8.25 10.40 11.55 12.85 12.85 16.70 16.70
14B 40.75 37.80 34.50 31.90 29.55 32.35 27.10 25.70 23.85 22.20 20.60 18.80 16.50 13.90 11.45 11.45 7.20 2.45 2.45 9.35 11.45 12.60 13.90 13.90 18.00 18.00
14C 41.85 38.85 35.55 32.95 30.60 33.45 28.15 27.10 24.95 23.50 21.65 19.90 17.60 15.45 12.85 12.85 8.25 3.50 2.45 10.65 12.85 14.00 15.45 15.45 19.20 19.20
15E 36.40 32.95 29.75 27.30 24.95 27.60 22.40 21.35 19.20 17.60 15.85 14.25 11.80 9.35 7.20 7.20 2.45 8.25 9.35 10.65 2.45 3.30 4.60 4.60 8.40 8.40
15W 38.00 34.75 31.65 29.20 26.45 29.55 24.10 22.70 21.10 19.20 17.60 15.85 13.40 10.95 8.40 8.40 4.35 10.40 11.45 12.85 2.45 2.65 2.75 2.75 7.20 7.20
15X 39.65 36.40 33.20 30.60 28.30 31.05 25.80 24.55 22.55 20.90 19.30 17.60 15.20 12.60 10.25 10.25 5.90 11.55 12.60 14.00 3.30 2.65 1.20 2.30
16E 40.75 37.80 34.50 31.90 29.55 32.35 27.10 25.70 23.85 22.20 20.60 18.80 16.50 13.90 11.45 11.45 7.20 12.85 13.90 15.45 4.60 2.75 1.20
16W 40.75 37.80 34.50 31.90 29.55 32.35 27.10 25.70 23.85 22.20 20.60 18.80 16.50 13.90 11.45 11.45 7.20 12.85 13.90 15.45 4.60 2.75 3.80
17 5.60
18E 42.75 41.70 38.25 35.80 33.45 36.40 30.85 29.75 27.60 26.25 24.55 22.70 20.60 18.00 15.60 15.60 10.95 16.70 18.00 19.20 8.40 7.20 2.30
18W 42.75 41.70 38.25 35.80 33.45 36.40 30.85 29.75 27.60 26.25 24.55 22.70 20.60 18.00 15.60 15.60 10.95 16.70 18.00 19.20 8.40 7.20 3.80
Truck Class 4 (Cash) Toll Rates
New Jersey Turnpike
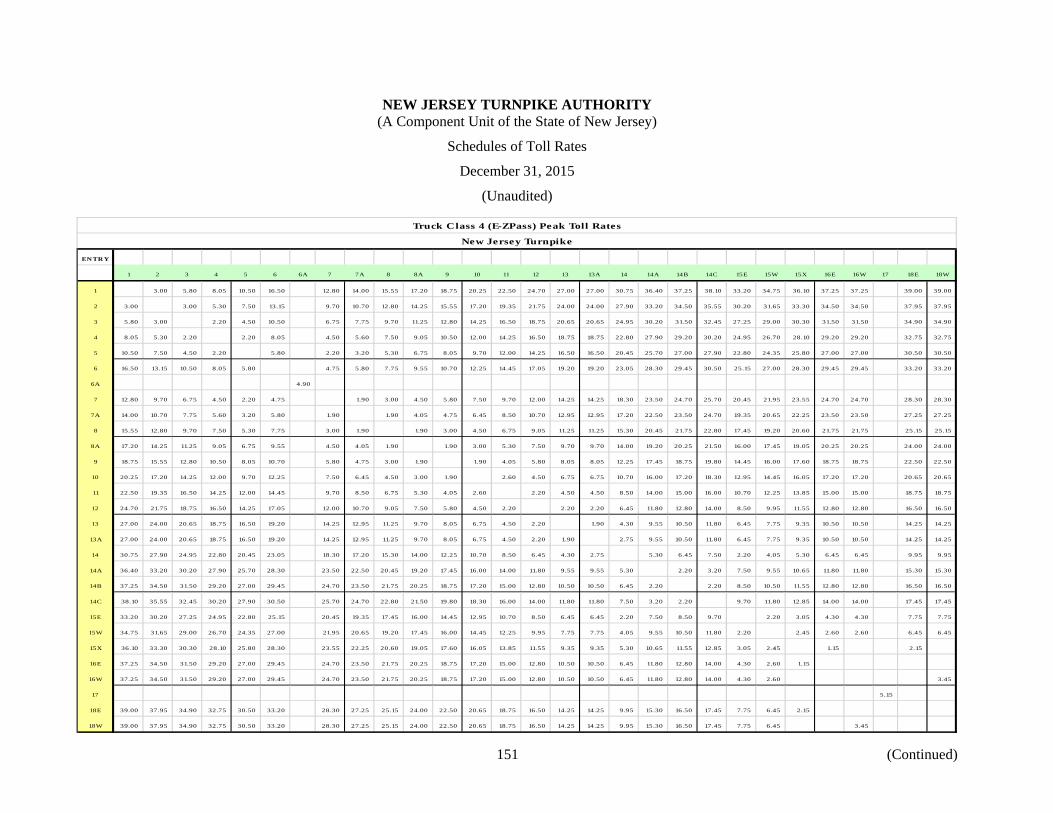
NEW JERSEY TURNPIKE AUTHORITY (A Component Unit of the State of New Jersey)
Schedules of Toll Rates
December 31, 2015
(Unaudited)
151 (Continued)
EN TR Y
1 2 3 4 5 6 6A 7 7A 8 8A 9 10 11 12 13 13A 14 14A 14B 14C 15E 15W 15X 16E 16W 17 18E 18W
1 3.00 5.80 8.05 10.50 16.50 12.80 14.00 15.55 17.20 18.75 20.25 22.50 24.70 27.00 27.00 30.75 36.40 37.25 38.10 33.20 34.75 36.10 37.25 37.25 39.00 39.00
2 3.00 3.00 5.30 7.50 13.15 9.70 10.70 12.80 14.25 15.55 17.20 19.35 21.75 24.00 24.00 27.90 33.20 34.50 35.55 30.20 31.65 33.30 34.50 34.50 37.95 37.95
3 5.80 3.00 2.20 4.50 10.50 6.75 7.75 9.70 11.25 12.80 14.25 16.50 18.75 20.65 20.65 24.95 30.20 31.50 32.45 27.25 29.00 30.30 31.50 31.50 34.90 34.90
4 8.05 5.30 2.20 2.20 8.05 4.50 5.60 7.50 9.05 10.50 12.00 14.25 16.50 18.75 18.75 22.80 27.90 29.20 30.20 24.95 26.70 28.10 29.20 29.20 32.75 32.75
5 10.50 7.50 4.50 2.20 5.80 2.20 3.20 5.30 6.75 8.05 9.70 12.00 14.25 16.50 16.50 20.45 25.70 27.00 27.90 22.80 24.35 25.80 27.00 27.00 30.50 30.50
6 16.50 13.15 10.50 8.05 5.80 4.75 5.80 7.75 9.55 10.70 12.25 14.45 17.05 19.20 19.20 23.05 28.30 29.45 30.50 25.15 27.00 28.30 29.45 29.45 33.20 33.20
6A 4.90
7 12.80 9.70 6.75 4.50 2.20 4.75 1.90 3.00 4.50 5.80 7.50 9.70 12.00 14.25 14.25 18.30 23.50 24.70 25.70 20.45 21.95 23.55 24.70 24.70 28.30 28.30
7A 14.00 10.70 7.75 5.60 3.20 5.80 1.90 1.90 4.05 4.75 6.45 8.50 10.70 12.95 12.95 17.20 22.50 23.50 24.70 19.35 20.65 22.25 23.50 23.50 27.25 27.25
8 15.55 12.80 9.70 7.50 5.30 7.75 3.00 1.90 1.90 3.00 4.50 6.75 9.05 11.25 11.25 15.30 20.45 21.75 22.80 17.45 19.20 20.60 21.75 21.75 25.15 25.15
8A 17.20 14.25 11.25 9.05 6.75 9.55 4.50 4.05 1.90 1.90 3.00 5.30 7.50 9.70 9.70 14.00 19.20 20.25 21.50 16.00 17.45 19.05 20.25 20.25 24.00 24.00
9 18.75 15.55 12.80 10.50 8.05 10.70 5.80 4.75 3.00 1.90 1.90 4.05 5.80 8.05 8.05 12.25 17.45 18.75 19.80 14.45 16.00 17.60 18.75 18.75 22.50 22.50
10 20.25 17.20 14.25 12.00 9.70 12.25 7.50 6.45 4.50 3.00 1.90 2.60 4.50 6.75 6.75 10.70 16.00 17.20 18.30 12.95 14.45 16.05 17.20 17.20 20.65 20.65
11 22.50 19.35 16.50 14.25 12.00 14.45 9.70 8.50 6.75 5.30 4.05 2.60 2.20 4.50 4.50 8.50 14.00 15.00 16.00 10.70 12.25 13.85 15.00 15.00 18.75 18.75
12 24.70 21.75 18.75 16.50 14.25 17.05 12.00 10.70 9.05 7.50 5.80 4.50 2.20 2.20 2.20 6.45 11.80 12.80 14.00 8.50 9.95 11.55 12.80 12.80 16.50 16.50
13 27.00 24.00 20.65 18.75 16.50 19.20 14.25 12.95 11.25 9.70 8.05 6.75 4.50 2.20 1.90 4.30 9.55 10.50 11.80 6.45 7.75 9.35 10.50 10.50 14.25 14.25
13A 27.00 24.00 20.65 18.75 16.50 19.20 14.25 12.95 11.25 9.70 8.05 6.75 4.50 2.20 1.90 2.75 9.55 10.50 11.80 6.45 7.75 9.35 10.50 10.50 14.25 14.25
14 30.75 27.90 24.95 22.80 20.45 23.05 18.30 17.20 15.30 14.00 12.25 10.70 8.50 6.45 4.30 2.75 5.30 6.45 7.50 2.20 4.05 5.30 6.45 6.45 9.95 9.95
14A 36.40 33.20 30.20 27.90 25.70 28.30 23.50 22.50 20.45 19.20 17.45 16.00 14.00 11.80 9.55 9.55 5.30 2.20 3.20 7.50 9.55 10.65 11.80 11.80 15.30 15.30
14B 37.25 34.50 31.50 29.20 27.00 29.45 24.70 23.50 21.75 20.25 18.75 17.20 15.00 12.80 10.50 10.50 6.45 2.20 2.20 8.50 10.50 11.55 12.80 12.80 16.50 16.50
14C 38.10 35.55 32.45 30.20 27.90 30.50 25.70 24.70 22.80 21.50 19.80 18.30 16.00 14.00 11.80 11.80 7.50 3.20 2.20 9.70 11.80 12.85 14.00 14.00 17.45 17.45
15E 33.20 30.20 27.25 24.95 22.80 25.15 20.45 19.35 17.45 16.00 14.45 12.95 10.70 8.50 6.45 6.45 2.20 7.50 8.50 9.70 2.20 3.05 4.30 4.30 7.75 7.75
15W 34.75 31.65 29.00 26.70 24.35 27.00 21.95 20.65 19.20 17.45 16.00 14.45 12.25 9.95 7.75 7.75 4.05 9.55 10.50 11.80 2.20 2.45 2.60 2.60 6.45 6.45
15X 36.10 33.30 30.30 28.10 25.80 28.30 23.55 22.25 20.60 19.05 17.60 16.05 13.85 11.55 9.35 9.35 5.30 10.65 11.55 12.85 3.05 2.45 1.15 2.15
16E 37.25 34.50 31.50 29.20 27.00 29.45 24.70 23.50 21.75 20.25 18.75 17.20 15.00 12.80 10.50 10.50 6.45 11.80 12.80 14.00 4.30 2.60 1.15
16W 37.25 34.50 31.50 29.20 27.00 29.45 24.70 23.50 21.75 20.25 18.75 17.20 15.00 12.80 10.50 10.50 6.45 11.80 12.80 14.00 4.30 2.60 3.45
17 5.15
18E 39.00 37.95 34.90 32.75 30.50 33.20 28.30 27.25 25.15 24.00 22.50 20.65 18.75 16.50 14.25 14.25 9.95 15.30 16.50 17.45 7.75 6.45 2.15
18W 39.00 37.95 34.90 32.75 30.50 33.20 28.30 27.25 25.15 24.00 22.50 20.65 18.75 16.50 14.25 14.25 9.95 15.30 16.50 17.45 7.75 6.45 3.45
Truck Class 4 (E-ZPass) Peak Toll Rates
New Jersey Turnpike

NEW JERSEY TURNPIKE AUTHORITY (A Component Unit of the State of New Jersey)
Schedules of Toll Rates
December 31, 2015
(Unaudited)
152 (Continued)
EN TR Y
1 2 3 4 5 6 6A 7 7A 8 8A 9 10 11 12 13 13A 14 14A 14B 14C 15E 15W 15X 16E 16W 17 18E 18W
1 2.85 5.50 7.65 10.00 15.65 12.15 13.30 14.75 16.35 17.80 19.25 21.40 23.45 25.65 25.65 29.20 34.60 35.40 36.20 31.55 33.00 34.30 35.40 35.40 37.05 37.05
2 2.85 2.85 5.05 7.15 12.50 9.20 10.15 12.15 13.55 14.75 16.35 18.40 20.65 22.80 22.80 26.50 31.55 32.75 33.75 28.70 30.05 31.65 32.75 32.75 36.05 36.05
3 5.50 2.85 2.10 4.30 10.00 6.40 7.35 9.20 10.70 12.15 13.55 15.65 17.80 19.60 19.60 23.70 28.70 29.90 30.85 25.90 27.55 28.80 29.90 29.90 33.15 33.15
4 7.65 5.05 2.10 2.10 7.65 4.30 5.30 7.15 8.60 10.00 11.40 13.55 15.65 17.80 17.80 21.65 26.50 27.75 28.70 23.70 25.35 26.70 27.75 27.75 31.10 31.10
5 10.00 7.15 4.30 2.10 5.50 2.10 3.05 5.05 6.40 7.65 9.20 11.40 13.55 15.65 15.65 19.45 24.40 25.65 26.50 21.65 23.15 24.50 25.65 25.65 28.95 28.95
6 15.65 12.50 10.00 7.65 5.50 4.50 5.50 7.35 9.05 10.15 11.65 13.75 16.20 18.25 18.25 21.90 26.90 28.00 28.95 23.90 25.65 26.90 28.00 28.00 31.55 31.55
6A 4.65
7 12.15 9.20 6.40 4.30 2.10 4.50 1.80 2.85 4.30 5.50 7.15 9.20 11.40 13.55 13.55 17.40 22.35 23.45 24.40 19.45 20.85 22.35 23.45 23.45 26.90 26.90
7A 13.30 10.15 7.35 5.30 3.05 5.50 1.80 1.80 3.85 4.50 6.10 8.00 10.15 12.30 12.30 16.35 21.40 22.35 23.45 18.40 19.60 21.15 22.35 22.35 25.90 25.90
8 14.75 12.15 9.20 7.15 5.05 7.35 2.85 1.80 1.80 2.85 4.30 6.40 8.60 10.70 10.70 14.55 19.45 20.65 21.65 16.60 18.25 19.55 20.65 20.65 23.90 23.90
8A 16.35 13.55 10.70 8.60 6.40 9.05 4.30 3.85 1.80 1.80 2.85 5.05 7.15 9.20 9.20 13.30 18.25 19.25 20.45 15.20 16.60 18.10 19.25 19.25 22.80 22.80
9 17.80 14.75 12.15 10.00 7.65 10.15 5.50 4.50 2.85 1.80 1.80 3.85 5.50 7.65 7.65 11.65 16.60 17.80 18.80 13.75 15.20 16.70 17.80 17.80 21.40 21.40
10 19.25 16.35 13.55 11.40 9.20 11.65 7.15 6.10 4.30 2.85 1.80 2.35 4.30 6.40 6.40 10.15 15.20 16.35 17.40 12.30 13.75 15.25 16.35 16.35 19.60 19.60
11 21.40 18.40 15.65 13.55 11.40 13.75 9.20 8.00 6.40 5.05 3.85 2.35 2.10 4.30 4.30 8.00 13.30 14.25 15.20 10.15 11.65 13.15 14.25 14.25 17.80 17.80
12 23.45 20.65 17.80 15.65 13.55 16.20 11.40 10.15 8.60 7.15 5.50 4.30 2.10 2.10 2.10 6.10 11.20 12.15 13.30 8.00 9.45 10.95 12.15 12.15 15.65 15.65
13 25.65 22.80 19.60 17.80 15.65 18.25 13.55 12.30 10.70 9.20 7.65 6.40 4.30 2.10 1.80 4.05 9.05 10.00 11.20 6.10 7.35 8.90 10.00 10.00 13.55 13.55
13A 25.65 22.80 19.60 17.80 15.65 18.25 13.55 12.30 10.70 9.20 7.65 6.40 4.30 2.10 1.80 2.60 9.05 10.00 11.20 6.10 7.35 8.90 10.00 10.00 13.55 13.55
14 29.20 26.50 23.70 21.65 19.45 21.90 17.40 16.35 14.55 13.30 11.65 10.15 8.00 6.10 4.05 2.60 5.05 6.10 7.15 2.10 3.85 5.05 6.10 6.10 9.45 9.45
14A 34.60 31.55 28.70 26.50 24.40 26.90 22.35 21.40 19.45 18.25 16.60 15.20 13.30 11.20 9.05 9.05 5.05 2.10 3.05 7.15 9.05 10.10 11.20 11.20 14.55 14.55
14B 35.40 32.75 29.90 27.75 25.65 28.00 23.45 22.35 20.65 19.25 17.80 16.35 14.25 12.15 10.00 10.00 6.10 2.10 2.10 8.00 10.00 10.95 12.15 12.15 15.65 15.65
14C 36.20 33.75 30.85 28.70 26.50 28.95 24.40 23.45 21.65 20.45 18.80 17.40 15.20 13.30 11.20 11.20 7.15 3.05 2.10 9.20 11.20 12.20 13.30 13.30 16.60 16.60
15E 31.55 28.70 25.90 23.70 21.65 23.90 19.45 18.40 16.60 15.20 13.75 12.30 10.15 8.00 6.10 6.10 2.10 7.15 8.00 9.20 2.10 2.90 4.05 4.05 7.35 7.35
15W 33.00 30.05 27.55 25.35 23.15 25.65 20.85 19.60 18.25 16.60 15.20 13.75 11.65 9.45 7.35 7.35 3.85 9.05 10.00 11.20 2.10 2.35 2.35 2.35 6.10 6.10
15X 34.30 31.65 28.80 26.70 24.50 26.90 22.35 21.15 19.55 18.10 16.70 15.25 13.15 10.95 8.90 8.90 5.05 10.10 10.95 12.20 2.90 2.35 1.10 2.00
16E 35.40 32.75 29.90 27.75 25.65 28.00 23.45 22.35 20.65 19.25 17.80 16.35 14.25 12.15 10.00 10.00 6.10 11.20 12.15 13.30 4.05 2.35 1.10
16W 35.40 32.75 29.90 27.75 25.65 28.00 23.45 22.35 20.65 19.25 17.80 16.35 14.25 12.15 10.00 10.00 6.10 11.20 12.15 13.30 4.05 2.35 3.30
17 4.90
18E 37.05 36.05 33.15 31.10 28.95 31.55 26.90 25.90 23.90 22.80 21.40 19.60 17.80 15.65 13.55 13.55 9.45 14.55 15.65 16.60 7.35 6.10 2.00
18W 37.05 36.05 33.15 31.10 28.95 31.55 26.90 25.90 23.90 22.80 21.40 19.60 17.80 15.65 13.55 13.55 9.45 14.55 15.65 16.60 7.35 6.10 3.30
Truck Class 4 (E-ZPass) O ff-Peak Toll Rates
New Jersey Turnpike

NEW JERSEY TURNPIKE AUTHORITY (A Component Unit of the State of New Jersey)
Schedules of Toll Rates
December 31, 2015
(Unaudited)
153 (Continued)
EN TR Y
1 2 3 4 5 6 6A 7 7A 8 8A 9 10 11 12 13 13A 14 14A 14B 14C 15E 15W 15X 16E 16W 17 18E 18W
1 3.80 8.05 10.65 13.40 21.65 16.70 18.65 20.60 22.70 24.95 26.25 29.55 32.35 35.55 35.55 40.40 47.60 49.05 49.75 43.45 45.45 47.60 49.05 49.05 49.75 49.75
2 3.80 3.80 6.90 9.85 17.60 12.85 14.25 16.70 18.80 20.60 22.70 25.70 28.45 31.65 31.65 36.65 43.45 45.05 46.50 39.95 41.85 43.70 45.05 45.05 49.75 49.75
3 8.05 3.80 2.75 6.10 13.40 8.65 10.40 12.85 15.00 16.70 18.80 21.65 24.95 27.30 27.30 32.75 39.95 41.25 42.75 35.80 38.00 39.70 41.25 41.25 46.30 46.30
4 10.65 6.90 2.75 2.75 10.65 6.10 7.20 9.85 12.00 13.40 15.60 18.80 21.65 24.95 24.95 29.75 36.65 38.25 39.95 32.75 34.75 36.70 38.25 38.25 42.90 42.90
5 13.40 9.85 6.10 2.75 8.05 2.75 4.35 6.90 8.65 10.65 12.85 15.60 18.80 21.65 21.65 27.10 33.65 35.55 36.65 29.75 31.90 33.95 35.55 35.55 40.15 40.15
6 21.65 17.60 13.40 10.65 8.05 6.35 8.05 10.40 12.30 14.25 16.50 19.20 22.20 25.15 25.15 30.05 36.95 38.85 40.15 33.45 35.55 37.40 38.85 38.85 43.45 43.45
6A 5.40
7 16.70 12.85 8.65 6.10 2.75 6.35 2.75 3.80 6.10 8.05 9.85 12.85 15.60 18.80 18.80 23.85 30.60 32.35 33.65 27.10 29.20 30.85 32.35 32.35 36.95 36.95
7A 18.65 14.25 10.40 7.20 4.35 8.05 2.75 2.45 4.90 6.35 8.40 10.95 14.25 16.90 16.90 22.70 29.55 30.60 32.35 25.70 27.30 29.20 30.60 30.60 35.80 35.80
8 20.60 16.70 12.85 9.85 6.90 10.40 3.80 2.45 2.45 3.80 6.10 8.65 12.00 15.00 15.00 19.90 27.10 28.45 29.75 23.05 25.15 27.00 28.45 28.45 33.45 33.45
8A 22.70 18.80 15.00 12.00 8.65 12.30 6.10 4.90 2.45 2.45 3.80 6.90 9.85 12.85 12.85 18.65 25.15 26.25 28.15 21.10 23.05 24.85 26.25 26.25 31.65 31.65
9 24.95 20.60 16.70 13.40 10.65 14.25 8.05 6.35 3.80 2.45 2.45 4.90 8.05 10.65 10.65 16.50 23.05 24.95 26.00 19.20 21.10 23.35 24.95 24.95 29.55 29.55
10 26.25 22.70 18.80 15.60 12.85 16.50 9.85 8.40 6.10 3.80 2.45 3.50 6.10 8.65 8.65 14.25 21.10 22.70 23.85 16.90 19.20 21.10 22.70 22.70 27.30 27.30
11 29.55 25.70 21.65 18.80 15.60 19.20 12.85 10.95 8.65 6.90 4.90 3.50 2.75 6.10 6.10 10.95 18.65 19.35 21.10 14.25 16.50 18.00 19.35 19.35 24.95 24.95
12 32.35 28.45 24.95 21.65 18.80 22.20 15.60 14.25 12.00 9.85 8.05 6.10 2.75 2.75 2.75 8.40 15.45 16.70 18.65 10.95 13.10 15.05 16.70 16.70 21.65 21.65
13 35.55 31.65 27.30 24.95 21.65 25.15 18.80 16.90 15.00 12.85 10.65 8.65 6.10 2.75 2.45 5.65 12.30 13.40 15.45 8.40 10.40 12.00 13.40 13.40 18.80 18.80
13A 35.55 31.65 27.30 24.95 21.65 25.15 18.80 16.90 15.00 12.85 10.65 8.65 6.10 2.75 2.45 3.75 12.30 13.40 15.45 8.40 10.40 12.00 13.40 13.40 18.80 18.80
14 40.40 36.65 32.75 29.75 27.10 30.05 23.85 22.70 19.90 18.65 16.50 14.25 10.95 8.40 5.65 3.75 6.90 8.40 9.85 2.75 4.90 6.90 8.40 8.40 13.10 13.10
14A 47.60 43.45 39.95 36.65 33.65 36.95 30.60 29.55 27.10 25.15 23.05 21.10 18.65 15.45 12.30 12.30 6.90 2.75 4.35 9.85 12.30 13.90 15.45 15.45 19.90 19.90
14B 49.05 45.05 41.25 38.25 35.55 38.85 32.35 30.60 28.45 26.25 24.95 22.70 19.35 16.70 13.40 13.40 8.40 2.75 2.75 10.95 13.40 15.05 16.70 16.70 21.65 21.65
14C 49.75 46.50 42.75 39.95 36.65 40.15 33.65 32.35 29.75 28.15 26.00 23.85 21.10 18.65 15.45 15.45 9.85 4.35 2.75 12.85 15.45 17.05 18.65 18.65 23.05 23.05
15E 43.45 39.95 35.80 32.75 29.75 33.45 27.10 25.70 23.05 21.10 19.20 16.90 14.25 10.95 8.40 8.40 2.75 9.85 10.95 12.85 2.75 4.05 5.65 5.65 10.40 10.40
15W 45.45 41.85 38.00 34.75 31.90 35.55 29.20 27.30 25.15 23.05 21.10 19.20 16.50 13.10 10.40 10.40 4.90 12.30 13.40 15.45 2.75 3.30 3.50 3.50 8.40 8.40
15X 47.60 43.70 39.70 36.70 33.95 37.40 30.85 29.20 27.00 24.85 23.35 21.10 18.00 15.05 12.00 12.00 6.90 13.90 15.05 17.05 4.05 3.30 1.60 2.80
16E 49.05 45.05 41.25 38.25 35.55 38.85 32.35 30.60 28.45 26.25 24.95 22.70 19.35 16.70 13.40 13.40 8.40 15.45 16.70 18.65 5.65 3.50 1.60
16W 49.05 45.05 41.25 38.25 35.55 38.85 32.35 30.60 28.45 26.25 24.95 22.70 19.35 16.70 13.40 13.40 8.40 15.45 16.70 18.65 5.65 3.50 4.60
17 5.60
18E 49.75 49.75 46.30 42.90 40.15 43.45 36.95 35.80 33.45 31.65 29.55 27.30 24.95 21.65 18.80 18.80 13.10 19.90 21.65 23.05 10.40 8.40 2.80
18W 49.75 49.75 46.30 42.90 40.15 43.45 36.95 35.80 33.45 31.65 29.55 27.30 24.95 21.65 18.80 18.80 13.10 19.90 21.65 23.05 10.40 8.40 4.60
Truck Class 5 (Cash) Toll Rates
New Jersey Turnpike

NEW JERSEY TURNPIKE AUTHORITY (A Component Unit of the State of New Jersey)
Schedules of Toll Rates
December 31, 2015
(Unaudited)
154 (Continued)
EN TR Y
1 2 3 4 5 6 6A 7 7A 8 8A 9 10 11 12 13 13A 14 14A 14B 14C 15E 15W 15X 16E 16W 17 18E 18W
1 3.45 7.25 9.70 12.25 19.80 15.30 17.05 18.75 20.65 22.80 24.00 27.00 29.45 32.45 32.45 37.05 43.45 44.75 45.45 39.65 41.55 43.40 44.75 44.75 45.45 45.45
2 3.45 3.45 6.20 9.05 16.00 11.80 12.95 15.30 17.20 18.75 20.65 23.50 26.00 29.00 29.00 33.45 39.65 41.15 42.40 36.40 38.10 39.85 41.15 41.15 45.45 45.45
3 7.25 3.45 2.60 5.60 12.25 8.05 9.55 11.80 13.85 15.30 17.20 19.80 22.80 24.95 24.95 30.00 36.40 37.70 39.00 32.75 34.75 36.35 37.70 37.70 42.25 42.25
4 9.70 6.20 2.60 2.60 9.70 5.60 6.45 9.05 11.00 12.25 14.25 17.20 19.80 22.80 22.80 27.25 33.45 34.90 36.40 30.00 31.65 33.50 34.90 34.90 39.15 39.15
5 12.25 9.05 5.60 2.60 7.25 2.60 4.05 6.20 8.05 9.70 11.80 14.25 17.20 19.80 19.80 24.70 30.75 32.45 33.45 27.25 29.20 31.00 32.45 32.45 36.70 36.70
6 19.80 16.00 12.25 9.70 7.25 5.80 7.25 9.55 11.25 12.95 15.00 17.45 20.25 23.05 23.05 27.55 33.75 35.55 36.70 30.50 32.45 34.20 35.55 35.55 39.65 39.65
6A 4.90
7 15.30 11.80 8.05 5.60 2.60 5.80 2.60 3.45 5.60 7.25 9.05 11.80 14.25 17.20 17.20 21.75 27.90 29.45 30.75 24.70 26.70 28.15 29.45 29.45 33.75 33.75
7A 17.05 12.95 9.55 6.45 4.05 7.25 2.60 2.20 4.50 5.80 7.75 9.95 12.95 15.55 15.55 20.65 27.00 27.90 29.45 23.50 24.95 26.70 27.90 27.90 32.75 32.75
8 18.75 15.30 11.80 9.05 6.20 9.55 3.45 2.20 2.20 3.45 5.60 8.05 11.00 13.85 13.85 18.30 24.70 26.00 27.25 20.90 23.05 24.65 26.00 26.00 30.50 30.50
8A 20.65 17.20 13.85 11.00 8.05 11.25 5.60 4.50 2.20 2.20 3.45 6.20 9.05 11.80 11.80 17.05 23.05 24.00 25.70 19.20 20.90 22.55 24.00 24.00 29.00 29.00
9 22.80 18.75 15.30 12.25 9.70 12.95 7.25 5.80 3.45 2.20 2.20 4.50 7.25 9.70 9.70 15.00 20.90 22.80 23.65 17.45 19.20 21.35 22.80 22.80 27.00 27.00
10 24.00 20.65 17.20 14.25 11.80 15.00 9.05 7.75 5.60 3.45 2.20 3.20 5.60 8.05 8.05 12.95 19.20 20.65 21.75 15.55 17.45 19.30 20.65 20.65 24.95 24.95
11 27.00 23.50 19.80 17.20 14.25 17.45 11.80 9.95 8.05 6.20 4.50 3.20 2.60 5.60 5.60 9.95 17.05 17.65 19.20 12.95 15.00 16.35 17.65 17.65 22.80 22.80
12 29.45 26.00 22.80 19.80 17.20 20.25 14.25 12.95 11.00 9.05 7.25 5.60 2.60 2.60 2.60 7.75 14.00 15.30 17.05 9.95 12.00 13.85 15.30 15.30 19.80 19.80
13 32.45 29.00 24.95 22.80 19.80 23.05 17.20 15.55 13.85 11.80 9.70 8.05 5.60 2.60 2.20 5.30 11.25 12.25 14.00 7.75 9.55 10.95 12.25 12.25 17.20 17.20
13A 32.45 29.00 24.95 22.80 19.80 23.05 17.20 15.55 13.85 11.80 9.70 8.05 5.60 2.60 2.20 3.30 11.25 12.25 14.00 7.75 9.55 10.95 12.25 12.25 17.20 17.20
14 37.05 33.45 30.00 27.25 24.70 27.55 21.75 20.65 18.30 17.05 15.00 12.95 9.95 7.75 5.30 3.30 6.20 7.75 9.05 2.60 4.50 6.35 7.75 7.75 12.00 12.00
14A 43.45 39.65 36.40 33.45 30.75 33.75 27.90 27.00 24.70 23.05 20.90 19.20 17.05 14.00 11.25 11.25 6.20 2.60 4.05 9.05 11.25 12.60 14.00 14.00 18.30 18.30
14B 44.75 41.15 37.70 34.90 32.45 35.55 29.45 27.90 26.00 24.00 22.80 20.65 17.65 15.30 12.25 12.25 7.75 2.60 2.60 9.95 12.25 13.85 15.30 15.30 19.80 19.80
14C 45.45 42.40 39.00 36.40 33.45 36.70 30.75 29.45 27.25 25.70 23.65 21.75 19.20 17.05 14.00 14.00 9.05 4.05 2.60 11.80 14.00 15.55 17.05 17.05 20.90 20.90
15E 39.65 36.40 32.75 30.00 27.25 30.50 24.70 23.50 20.90 19.20 17.45 15.55 12.95 9.95 7.75 7.75 2.60 9.05 9.95 11.80 2.60 3.75 5.30 5.30 9.55 9.55
15W 41.55 38.10 34.75 31.65 29.20 32.45 26.70 24.95 23.05 20.90 19.20 17.45 15.00 12.00 9.55 9.55 4.50 11.25 12.25 14.00 2.60 3.00 3.20 3.20 7.75 7.75
15X 43.40 39.85 36.35 33.50 31.00 34.20 28.15 26.70 24.65 22.55 21.35 19.30 16.35 13.85 10.95 10.95 6.35 12.60 13.85 15.55 3.75 3.00 1.45 2.65
16E 44.75 41.15 37.70 34.90 32.45 35.55 29.45 27.90 26.00 24.00 22.80 20.65 17.65 15.30 12.25 12.25 7.75 14.00 15.30 17.05 5.30 3.20 1.45
16W 44.75 41.15 37.70 34.90 32.45 35.55 29.45 27.90 26.00 24.00 22.80 20.65 17.65 15.30 12.25 12.25 7.75 14.00 15.30 17.05 5.30 3.20 4.30
17 5.15
18E 45.45 45.45 42.25 39.15 36.70 39.65 33.75 32.75 30.50 29.00 27.00 24.95 22.80 19.80 17.20 17.20 12.00 18.30 19.80 20.90 9.55 7.75 2.65
18W 45.45 45.45 42.25 39.15 36.70 39.65 33.75 32.75 30.50 29.00 27.00 24.95 22.80 19.80 17.20 17.20 12.00 18.30 19.80 20.90 9.55 7.75 4.30
Truck Class 5 (E-ZPass) Peak Toll Rates
New Jersey Turnpike

NEW JERSEY TURNPIKE AUTHORITY (A Component Unit of the State of New Jersey)
Schedules of Toll Rates
December 31, 2015
(Unaudited)
155 (Continued)
EN TR Y
1 2 3 4 5 6 6A 7 7A 8 8A 9 10 11 12 13 13A 14 14A 14B 14C 15E 15W 15X 16E 16W 17 18E 18W
1 3.25 6.90 9.20 11.65 18.80 14.55 16.20 17.80 19.60 21.65 22.80 25.65 28.00 30.85 30.85 35.20 41.30 42.50 43.20 37.65 39.45 41.25 42.50 42.50 43.20 43.20
2 3.25 3.25 5.90 8.60 15.20 11.20 12.30 14.55 16.35 17.80 19.60 22.35 24.70 27.55 27.55 31.80 37.65 39.10 40.30 34.60 36.20 37.85 39.10 39.10 43.20 43.20
3 6.90 3.25 2.45 5.30 11.65 7.65 9.05 11.20 13.15 14.55 16.35 18.80 21.65 23.70 23.70 28.50 34.60 35.80 37.05 31.10 33.00 34.55 35.80 35.80 40.15 40.15
4 9.20 5.90 2.45 2.45 9.20 5.30 6.10 8.60 10.45 11.65 13.55 16.35 18.80 21.65 21.65 25.90 31.80 33.15 34.60 28.50 30.05 31.80 33.15 33.15 37.20 37.20
5 11.65 8.60 5.30 2.45 6.90 2.45 3.85 5.90 7.65 9.20 11.20 13.55 16.35 18.80 18.80 23.45 29.20 30.85 31.80 25.90 27.75 29.45 30.85 30.85 34.85 34.85
6 18.80 15.20 11.65 9.20 6.90 5.50 6.90 9.05 10.70 12.30 14.25 16.60 19.25 21.90 21.90 26.15 32.05 33.75 34.85 28.95 30.85 32.50 33.75 33.75 37.65 37.65
6A 4.65
7 14.55 11.20 7.65 5.30 2.45 5.50 2.45 3.25 5.30 6.90 8.60 11.20 13.55 16.35 16.35 20.65 26.50 28.00 29.20 23.45 25.35 26.75 28.00 28.00 32.05 32.05
7A 16.20 12.30 9.05 6.10 3.85 6.90 2.45 2.10 4.30 5.50 7.35 9.45 12.30 14.75 14.75 19.60 25.65 26.50 28.00 22.35 23.70 25.35 26.50 26.50 31.10 31.10
8 17.80 14.55 11.20 8.60 5.90 9.05 3.25 2.10 2.10 3.25 5.30 7.65 10.45 13.15 13.15 17.40 23.45 24.70 25.90 19.85 21.90 23.40 24.70 24.70 28.95 28.95
8A 19.60 16.35 13.15 10.45 7.65 10.70 5.30 4.30 2.10 2.10 3.25 5.90 8.60 11.20 11.20 16.20 21.90 22.80 24.40 18.25 19.85 21.40 22.80 22.80 27.55 27.55
9 21.65 17.80 14.55 11.65 9.20 12.30 6.90 5.50 3.25 2.10 2.10 4.30 6.90 9.20 9.20 14.25 19.85 21.65 22.45 16.60 18.25 20.30 21.65 21.65 25.65 25.65
10 22.80 19.60 16.35 13.55 11.20 14.25 8.60 7.35 5.30 3.25 2.10 3.05 5.30 7.65 7.65 12.30 18.25 19.60 20.65 14.75 16.60 18.35 19.60 19.60 23.70 23.70
11 25.65 22.35 18.80 16.35 13.55 16.60 11.20 9.45 7.65 5.90 4.30 3.05 2.45 5.30 5.30 9.45 16.20 16.75 18.25 12.30 14.25 15.55 16.75 16.75 21.65 21.65
12 28.00 24.70 21.65 18.80 16.35 19.25 13.55 12.30 10.45 8.60 6.90 5.30 2.45 2.45 2.45 7.35 13.30 14.55 16.20 9.45 11.40 13.15 14.55 14.55 18.80 18.80
13 30.85 27.55 23.70 21.65 18.80 21.90 16.35 14.75 13.15 11.20 9.20 7.65 5.30 2.45 2.10 5.05 10.70 11.65 13.30 7.35 9.05 10.40 11.65 11.65 16.35 16.35
13A 30.85 27.55 23.70 21.65 18.80 21.90 16.35 14.75 13.15 11.20 9.20 7.65 5.30 2.45 2.10 3.15 10.70 11.65 13.30 7.35 9.05 10.40 11.65 11.65 16.35 16.35
14 35.20 31.80 28.50 25.90 23.45 26.15 20.65 19.60 17.40 16.20 14.25 12.30 9.45 7.35 5.05 3.15 5.90 7.35 8.60 2.45 4.30 6.00 7.35 7.35 11.40 11.40
14A 41.30 37.65 34.60 31.80 29.20 32.05 26.50 25.65 23.45 21.90 19.85 18.25 16.20 13.30 10.70 10.70 5.90 2.45 3.85 8.60 10.70 11.95 13.30 13.30 17.40 17.40
14B 42.50 39.10 35.80 33.15 30.85 33.75 28.00 26.50 24.70 22.80 21.65 19.60 16.75 14.55 11.65 11.65 7.35 2.45 2.45 9.45 11.65 13.15 14.55 14.55 18.80 18.80
14C 43.20 40.30 37.05 34.60 31.80 34.85 29.20 28.00 25.90 24.40 22.45 20.65 18.25 16.20 13.30 13.30 8.60 3.85 2.45 11.20 13.30 14.75 16.20 16.20 19.85 19.85
15E 37.65 34.60 31.10 28.50 25.90 28.95 23.45 22.35 19.85 18.25 16.60 14.75 12.30 9.45 7.35 7.35 2.45 8.60 9.45 11.20 2.45 3.55 5.05 5.05 9.05 9.05
15W 39.45 36.20 33.00 30.05 27.75 30.85 25.35 23.70 21.90 19.85 18.25 16.60 14.25 11.40 9.05 9.05 4.30 10.70 11.65 13.30 2.45 2.80 3.05 3.05 7.35 7.35
15X 41.25 37.85 34.55 31.80 29.45 32.50 26.75 25.35 23.40 21.40 20.30 18.35 15.55 13.15 10.40 10.40 6.00 11.95 13.15 14.75 3.55 2.80 1.40 2.50
16E 42.50 39.10 35.80 33.15 30.85 33.75 28.00 26.50 24.70 22.80 21.65 19.60 16.75 14.55 11.65 11.65 7.35 13.30 14.55 16.20 5.05 3.05 1.40
16W 42.50 39.10 35.80 33.15 30.85 33.75 28.00 26.50 24.70 22.80 21.65 19.60 16.75 14.55 11.65 11.65 7.35 13.30 14.55 16.20 5.05 3.05 4.10
17 4.90
18E 43.20 43.20 40.15 37.20 34.85 37.65 32.05 31.10 28.95 27.55 25.65 23.70 21.65 18.80 16.35 16.35 11.40 17.40 18.80 19.85 9.05 7.35 2.50
18W 43.20 43.20 40.15 37.20 34.85 37.65 32.05 31.10 28.95 27.55 25.65 23.70 21.65 18.80 16.35 16.35 11.40 17.40 18.80 19.85 9.05 7.35 4.10
Truck Class 5 (E-ZPass) Off-Peak Toll Rates
New Jersey Turnpike

NEW JERSEY TURNPIKE AUTHORITY (A Component Unit of the State of New Jersey)
Schedules of Toll Rates
December 31, 2015
(Unaudited)
156 (Continued)
EN TR Y
1 2 3 4 5 6 6A 7 7A 8 8A 9 10 11 12 13 13A 14 14A 14B 14C 15E 15W 15X 16E 16W 17 18E 18W
1 4.60 9.35 12.30 15.60 25.15 19.35 21.35 23.85 26.25 28.70 30.60 34.25 37.80 41.25 41.25 47.10 54.95 56.85 56.85 50.55 52.50 55.15 56.85 56.85 56.85 56.85
2 4.60 4.60 8.05 11.45 20.25 15.00 16.50 19.35 21.65 23.85 26.25 29.75 32.95 36.65 36.65 42.40 50.55 52.25 54.10 46.30 48.65 50.55 52.25 52.25 56.85 56.85
3 9.35 4.60 3.30 7.20 15.60 10.40 12.00 15.00 17.60 19.35 21.65 25.15 28.70 31.65 31.65 38.00 46.30 47.90 49.50 41.70 44.00 46.15 47.90 47.90 53.65 53.65
4 12.30 8.05 3.30 3.30 12.30 7.20 8.25 11.45 13.90 15.60 18.00 21.65 25.15 28.70 28.70 34.50 42.40 44.35 46.30 38.00 40.40 42.60 44.35 44.35 49.75 49.75
5 15.60 11.45 7.20 3.30 9.35 3.30 4.90 8.05 10.40 12.30 15.00 18.00 21.65 25.15 25.15 31.30 39.10 41.25 42.40 34.50 36.95 39.30 41.25 41.25 46.50 46.50
6 25.15 20.25 15.60 12.30 9.35 7.40 9.35 12.00 14.55 16.50 18.80 22.40 25.70 29.20 29.20 35.35 42.90 44.90 46.50 38.85 41.25 43.15 44.90 44.90 50.55 50.55
6A 5.45
7 19.35 15.00 10.40 7.20 3.30 7.40 3.30 4.60 7.20 9.35 11.45 15.00 18.00 21.65 21.65 27.60 35.55 37.80 39.10 31.30 33.65 35.95 37.80 37.80 42.90 42.90
7A 21.35 16.50 12.00 8.25 4.90 9.35 3.30 2.75 5.65 7.40 9.85 12.85 16.50 19.90 19.90 26.25 34.25 35.55 37.80 29.75 31.65 33.95 35.55 35.55 41.70 41.70
8 23.85 19.35 15.00 11.45 8.05 12.00 4.60 2.75 2.75 4.60 7.20 10.40 13.90 17.60 17.60 23.05 31.30 32.95 34.50 26.45 29.20 31.15 32.95 32.95 38.85 38.85
8A 26.25 21.65 17.60 13.90 10.40 14.55 7.20 5.65 2.75 2.75 4.60 8.05 11.45 15.00 15.00 21.35 29.20 30.60 32.75 24.10 26.45 28.85 30.60 30.60 36.65 36.65
9 28.70 23.85 19.35 15.60 12.30 16.50 9.35 7.40 4.60 2.75 2.75 5.65 9.35 12.30 12.30 18.80 26.45 28.70 30.05 22.40 24.10 27.00 28.70 28.70 34.25 34.25
10 30.60 26.25 21.65 18.00 15.00 18.80 11.45 9.85 7.20 4.60 2.75 4.35 7.20 10.40 10.40 16.50 24.10 26.25 27.60 19.90 22.40 24.55 26.25 26.25 31.65 31.65
11 34.25 29.75 25.15 21.65 18.00 22.40 15.00 12.85 10.40 8.05 5.65 4.35 3.30 7.20 7.20 12.85 21.35 22.70 24.10 16.50 18.80 20.95 22.70 22.70 28.70 28.70
12 37.80 32.95 28.70 25.15 21.65 25.70 18.00 16.50 13.90 11.45 9.35 7.20 3.30 3.30 3.30 9.85 17.75 19.35 21.35 12.85 15.45 17.60 19.35 19.35 25.15 25.15
13 41.25 36.65 31.65 28.70 25.15 29.20 21.65 19.90 17.60 15.00 12.30 10.40 7.20 3.30 2.75 6.90 14.55 15.60 17.75 9.85 12.00 14.00 15.60 15.60 21.65 21.65
13A 41.25 36.65 31.65 28.70 25.15 29.20 21.65 19.90 17.60 15.00 12.30 10.40 7.20 3.30 2.75 4.35 14.55 15.60 17.75 9.85 12.00 14.00 15.60 15.60 21.65 21.65
14 47.10 42.40 38.00 34.50 31.30 35.35 27.60 26.25 23.05 21.35 18.80 16.50 12.85 9.85 6.90 4.35 8.05 9.85 11.45 3.30 5.65 8.05 9.85 9.85 15.45 15.45
14A 54.95 50.55 46.30 42.40 39.10 42.90 35.55 34.25 31.30 29.20 26.45 24.10 21.35 17.75 14.55 14.55 8.05 3.30 4.90 11.45 14.55 16.05 17.75 17.75 23.05 23.05
14B 56.85 52.25 47.90 44.35 41.25 44.90 37.80 35.55 32.95 30.60 28.70 26.25 22.70 19.35 15.60 15.60 9.85 3.30 3.30 12.85 15.60 17.60 19.35 19.35 25.15 25.15
14C 56.85 54.10 49.50 46.30 42.40 46.50 39.10 37.80 34.50 32.75 30.05 27.60 24.10 21.35 17.75 17.75 11.45 4.90 3.30 15.00 17.75 19.60 21.35 21.35 26.45 26.45
15E 50.55 46.30 41.70 38.00 34.50 38.85 31.30 29.75 26.45 24.10 22.40 19.90 16.50 12.85 9.85 9.85 3.30 11.45 12.85 15.00 3.30 4.90 6.90 6.90 12.00 12.00
15W 52.50 48.65 44.00 40.40 36.95 41.25 33.65 31.65 29.20 26.45 24.10 22.40 18.80 15.45 12.00 12.00 5.65 14.55 15.60 17.75 3.30 4.05 4.35 4.35 9.85 9.85
15X 55.15 50.55 46.15 42.60 39.30 43.15 35.95 33.95 31.15 28.85 27.00 24.55 20.95 17.60 14.00 14.00 8.05 16.05 17.60 19.60 4.90 4.05 1.90 3.30
16E 56.85 52.25 47.90 44.35 41.25 44.90 37.80 35.55 32.95 30.60 28.70 26.25 22.70 19.35 15.60 15.60 9.85 17.75 19.35 21.35 6.90 4.35 1.90
16W 56.85 52.25 47.90 44.35 41.25 44.90 37.80 35.55 32.95 30.60 28.70 26.25 22.70 19.35 15.60 15.60 9.85 17.75 19.35 21.35 6.90 4.35 5.30
17 5.60
18E 56.85 56.85 53.65 49.75 46.50 50.55 42.90 41.70 38.85 36.65 34.25 31.65 28.70 25.15 21.65 21.65 15.45 23.05 25.15 26.45 12.00 9.85 3.30
18W 56.85 56.85 53.65 49.75 46.50 50.55 42.90 41.70 38.85 36.65 34.25 31.65 28.70 25.15 21.65 21.65 15.45 23.05 25.15 26.45 12.00 9.85 5.30
Truck Class 6 (Cash) Toll Rates
New Jersey Turnpike

NEW JERSEY TURNPIKE AUTHORITY (A Component Unit of the State of New Jersey)
Schedules of Toll Rates
December 31, 2015
(Unaudited)
157 (Continued)
EN TR Y
1 2 3 4 5 6 6A 7 7A 8 8A 9 10 11 12 13 13A 14 14A 14B 14C 15E 15W 15X 16E 16W 17 18E 18W
1 4.30 8.50 11.25 14.25 23.05 17.65 19.35 21.75 24.00 26.25 27.90 31.30 34.50 37.70 37.70 43.05 50.25 51.95 51.95 46.30 47.95 50.35 51.95 51.95 51.95 51.95
2 4.30 4.30 7.25 10.50 18.50 13.85 15.00 17.65 19.80 21.75 24.00 27.25 30.20 33.45 33.45 38.80 46.30 47.75 49.50 42.25 44.45 46.30 47.75 47.75 51.95 51.95
3 8.50 4.30 3.00 6.45 14.25 9.55 11.00 13.85 16.00 17.65 19.80 23.05 26.25 29.00 29.00 34.75 42.25 43.70 45.20 37.95 40.25 42.10 43.70 43.70 48.95 48.95
4 11.25 7.25 3.00 3.00 11.25 6.45 7.50 10.50 12.80 14.25 16.50 19.80 23.05 26.25 26.25 31.50 38.80 40.45 42.25 34.75 37.05 38.85 40.45 40.45 45.45 45.45
5 14.25 10.50 6.45 3.00 8.50 3.00 4.50 7.25 9.55 11.25 13.85 16.50 19.80 23.05 23.05 28.45 35.80 37.70 38.80 31.50 33.75 35.95 37.70 37.70 42.40 42.40
6 23.05 18.50 14.25 11.25 8.50 6.75 8.50 11.00 13.15 15.00 17.20 20.45 23.50 26.70 26.70 32.20 39.15 40.95 42.40 35.55 37.70 39.40 40.95 40.95 46.30 46.30
6A 4.90
7 17.65 13.85 9.55 6.45 3.00 6.75 3.00 4.30 6.45 8.50 10.50 13.85 16.50 19.80 19.80 25.15 32.45 34.50 35.80 28.45 30.75 32.75 34.50 34.50 39.15 39.15
7A 19.35 15.00 11.00 7.50 4.50 8.50 3.00 2.60 5.30 6.75 9.05 11.80 15.00 18.30 18.30 24.00 31.30 32.45 34.50 27.25 29.00 31.00 32.45 32.45 37.95 37.95
8 21.75 17.65 13.85 10.50 7.25 11.00 4.30 2.60 2.60 4.30 6.45 9.55 12.80 16.00 16.00 20.90 28.45 30.20 31.50 24.35 26.70 28.60 30.20 30.20 35.55 35.55
8A 24.00 19.80 16.00 12.80 9.55 13.15 6.45 5.30 2.60 2.60 4.30 7.25 10.50 13.85 13.85 19.35 26.70 27.90 30.00 21.95 24.35 26.25 27.90 27.90 33.45 33.45
9 26.25 21.75 17.65 14.25 11.25 15.00 8.50 6.75 4.30 2.60 2.60 5.30 8.50 11.25 11.25 17.20 24.35 26.25 27.55 20.45 21.95 24.65 26.25 26.25 31.30 31.30
10 27.90 24.00 19.80 16.50 13.85 17.20 10.50 9.05 6.45 4.30 2.60 4.05 6.45 9.55 9.55 15.00 21.95 24.00 25.15 18.30 20.45 22.40 24.00 24.00 29.00 29.00
11 31.30 27.25 23.05 19.80 16.50 20.45 13.85 11.80 9.55 7.25 5.30 4.05 3.00 6.45 6.45 11.80 19.35 20.65 21.95 15.00 17.20 19.05 20.65 20.65 26.25 26.25
12 34.50 30.20 26.25 23.05 19.80 23.50 16.50 15.00 12.80 10.50 8.50 6.45 3.00 3.00 3.00 9.05 16.15 17.65 19.35 11.80 14.00 16.05 17.65 17.65 23.05 23.05
13 37.70 33.45 29.00 26.25 23.05 26.70 19.80 18.30 16.00 13.85 11.25 9.55 6.45 3.00 2.60 6.20 13.15 14.25 16.15 9.05 11.00 12.80 14.25 14.25 19.80 19.80
13A 37.70 33.45 29.00 26.25 23.05 26.70 19.80 18.30 16.00 13.85 11.25 9.55 6.45 3.00 2.60 4.05 13.15 14.25 16.15 9.05 11.00 12.80 14.25 14.25 19.80 19.80
14 43.05 38.80 34.75 31.50 28.45 32.20 25.15 24.00 20.90 19.35 17.20 15.00 11.80 9.05 6.20 4.05 7.25 9.05 10.50 3.00 5.30 7.25 9.05 9.05 14.00 14.00
14A 50.25 46.30 42.25 38.80 35.80 39.15 32.45 31.30 28.45 26.70 24.35 21.95 19.35 16.15 13.15 13.15 7.25 3.00 4.50 10.50 13.15 14.55 16.15 16.15 20.90 20.90
14B 51.95 47.75 43.70 40.45 37.70 40.95 34.50 32.45 30.20 27.90 26.25 24.00 20.65 17.65 14.25 14.25 9.05 3.00 3.00 11.80 14.25 16.05 17.65 17.65 23.05 23.05
14C 51.95 49.50 45.20 42.25 38.80 42.40 35.80 34.50 31.50 30.00 27.55 25.15 21.95 19.35 16.15 16.15 10.50 4.50 3.00 13.85 16.15 17.90 19.35 19.35 24.35 24.35
15E 46.30 42.25 37.95 34.75 31.50 35.55 28.45 27.25 24.35 21.95 20.45 18.30 15.00 11.80 9.05 9.05 3.00 10.50 11.80 13.85 3.00 4.50 6.20 6.20 11.00 11.00
15W 47.95 44.45 40.25 37.05 33.75 37.70 30.75 29.00 26.70 24.35 21.95 20.45 17.20 14.00 11.00 11.00 5.30 13.15 14.25 16.15 3.00 3.75 4.05 4.05 9.05 9.05
15X 50.35 46.30 42.10 38.85 35.95 39.40 32.75 31.00 28.60 26.25 24.65 22.40 19.05 16.05 12.80 12.80 7.25 14.55 16.05 17.90 4.50 3.75 1.65 3.05
16E 51.95 47.75 43.70 40.45 37.70 40.95 34.50 32.45 30.20 27.90 26.25 24.00 20.65 17.65 14.25 14.25 9.05 16.15 17.65 19.35 6.20 4.05 1.65
16W 51.95 47.75 43.70 40.45 37.70 40.95 34.50 32.45 30.20 27.90 26.25 24.00 20.65 17.65 14.25 14.25 9.05 16.15 17.65 19.35 6.20 4.05 4.75
17 5.10
18E 51.95 51.95 48.95 45.45 42.40 46.30 39.15 37.95 35.55 33.45 31.30 29.00 26.25 23.05 19.80 19.80 14.00 20.90 23.05 24.35 11.00 9.05 3.05
18W 51.95 51.95 48.95 45.45 42.40 46.30 39.15 37.95 35.55 33.45 31.30 29.00 26.25 23.05 19.80 19.80 14.00 20.90 23.05 24.35 11.00 9.05 4.75
Truck Class 6 (E-ZPass) Peak Toll Rates
New Jersey Turnpike

NEW JERSEY TURNPIKE AUTHORITY (A Component Unit of the State of New Jersey)
Schedules of Toll Rates
December 31, 2015
(Unaudited)
158 (Continued)
EN TR Y
1 2 3 4 5 6 6A 7 7A 8 8A 9 10 11 12 13 13A 14 14A 14B 14C 15E 15W 15X 16E 16W 17 18E 18W
1 4.05 8.05 10.70 13.55 21.90 16.75 18.40 20.65 22.80 24.95 26.50 29.75 32.75 35.80 35.80 40.90 47.75 49.35 49.35 44.00 45.55 47.85 49.35 49.35 49.35 49.35
2 4.05 4.05 6.90 10.00 17.55 13.15 14.25 16.75 18.80 20.65 22.80 25.90 28.70 31.80 31.80 36.85 44.00 45.35 47.00 40.15 42.25 44.00 45.35 45.35 49.35 49.35
3 8.05 4.05 2.85 6.10 13.55 9.05 10.45 13.15 15.20 16.75 18.80 21.90 24.95 27.55 27.55 33.00 40.15 41.50 42.95 36.05 38.25 40.00 41.50 41.50 46.50 46.50
4 10.70 6.90 2.85 2.85 10.70 6.10 7.10 10.00 12.15 13.55 15.65 18.80 21.90 24.95 24.95 29.90 36.85 38.45 40.15 33.00 35.20 36.90 38.45 38.45 43.20 43.20
5 13.55 10.00 6.10 2.85 8.05 2.85 4.25 6.90 9.05 10.70 13.15 15.65 18.80 21.90 21.90 27.05 34.00 35.80 36.85 29.90 32.05 34.15 35.80 35.80 40.30 40.30
6 21.90 17.55 13.55 10.70 8.05 6.40 8.05 10.45 12.50 14.25 16.35 19.45 22.30 25.35 25.35 30.60 37.20 38.90 40.30 33.75 35.80 37.45 38.90 38.90 44.00 44.00
6A 4.65
7 16.75 13.15 9.05 6.10 2.85 6.40 2.85 4.05 6.10 8.05 10.00 13.15 15.65 18.80 18.80 23.90 30.85 32.75 34.00 27.05 29.20 31.10 32.75 32.75 37.20 37.20
7A 18.40 14.25 10.45 7.10 4.25 8.05 2.85 2.45 5.00 6.40 8.60 11.20 14.25 17.40 17.40 22.80 29.75 30.85 32.75 25.90 27.55 29.45 30.85 30.85 36.05 36.05
8 20.65 16.75 13.15 10.00 6.90 10.45 4.05 2.45 2.45 4.05 6.10 9.05 12.15 15.20 15.20 19.85 27.05 28.70 29.90 23.15 25.35 27.15 28.70 28.70 33.75 33.75
8A 22.80 18.80 15.20 12.15 9.05 12.50 6.10 5.00 2.45 2.45 4.05 6.90 10.00 13.15 13.15 18.40 25.35 26.50 28.50 20.85 23.15 24.95 26.50 26.50 31.80 31.80
9 24.95 20.65 16.75 13.55 10.70 14.25 8.05 6.40 4.05 2.45 2.45 5.00 8.05 10.70 10.70 16.35 23.15 24.95 26.15 19.45 20.85 23.40 24.95 24.95 29.75 29.75
10 26.50 22.80 18.80 15.65 13.15 16.35 10.00 8.60 6.10 4.05 2.45 3.85 6.10 9.05 9.05 14.25 20.85 22.80 23.90 17.40 19.45 21.30 22.80 22.80 27.55 27.55
11 29.75 25.90 21.90 18.80 15.65 19.45 13.15 11.20 9.05 6.90 5.00 3.85 2.85 6.10 6.10 11.20 18.40 19.60 20.85 14.25 16.35 18.10 19.60 19.60 24.95 24.95
12 32.75 28.70 24.95 21.90 18.80 22.30 15.65 14.25 12.15 10.00 8.05 6.10 2.85 2.85 2.85 8.60 15.35 16.75 18.40 11.20 13.30 15.25 16.75 16.75 21.90 21.90
13 35.80 31.80 27.55 24.95 21.90 25.35 18.80 17.40 15.20 13.15 10.70 9.05 6.10 2.85 2.45 5.90 12.50 13.55 15.35 8.60 10.45 12.15 13.55 13.55 18.80 18.80
13A 35.80 31.80 27.55 24.95 21.90 25.35 18.80 17.40 15.20 13.15 10.70 9.05 6.10 2.85 2.45 3.85 12.50 13.55 15.35 8.60 10.45 12.15 13.55 13.55 18.80 18.80
14 40.90 36.85 33.00 29.90 27.05 30.60 23.90 22.80 19.85 18.40 16.35 14.25 11.20 8.60 5.90 3.85 6.90 8.60 10.00 2.85 5.00 6.90 8.60 8.60 13.30 13.30
14A 47.75 44.00 40.15 36.85 34.00 37.20 30.85 29.75 27.05 25.35 23.15 20.85 18.40 15.35 12.50 12.50 6.90 2.85 4.25 10.00 12.50 13.80 15.35 15.35 19.85 19.85
14B 49.35 45.35 41.50 38.45 35.80 38.90 32.75 30.85 28.70 26.50 24.95 22.80 19.60 16.75 13.55 13.55 8.60 2.85 2.85 11.20 13.55 15.25 16.75 16.75 21.90 21.90
14C 49.35 47.00 42.95 40.15 36.85 40.30 34.00 32.75 29.90 28.50 26.15 23.90 20.85 18.40 15.35 15.35 10.00 4.25 2.85 13.15 15.35 17.00 18.40 18.40 23.15 23.15
15E 44.00 40.15 36.05 33.00 29.90 33.75 27.05 25.90 23.15 20.85 19.45 17.40 14.25 11.20 8.60 8.60 2.85 10.00 11.20 13.15 2.85 4.25 5.90 5.90 10.45 10.45
15W 45.55 42.25 38.25 35.20 32.05 35.80 29.20 27.55 25.35 23.15 20.85 19.45 16.35 13.30 10.45 10.45 5.00 12.50 13.55 15.35 2.85 3.55 3.85 3.85 8.60 8.60
15X 47.85 44.00 40.00 36.90 34.15 37.45 31.10 29.45 27.15 24.95 23.40 21.30 18.10 15.25 12.15 12.15 6.90 13.80 15.25 17.00 4.25 3.55 1.55 2.90
16E 49.35 45.35 41.50 38.45 35.80 38.90 32.75 30.85 28.70 26.50 24.95 22.80 19.60 16.75 13.55 13.55 8.60 15.35 16.75 18.40 5.90 3.85 1.55
16W 49.35 45.35 41.50 38.45 35.80 38.90 32.75 30.85 28.70 26.50 24.95 22.80 19.60 16.75 13.55 13.55 8.60 15.35 16.75 18.40 5.90 3.85 4.40
17 4.85
18E 49.35 49.35 46.50 43.20 40.30 44.00 37.20 36.05 33.75 31.80 29.75 27.55 24.95 21.90 18.80 18.80 13.30 19.85 21.90 23.15 10.45 8.60 2.90
18W 49.35 49.35 46.50 43.20 40.30 44.00 37.20 36.05 33.75 31.80 29.75 27.55 24.95 21.90 18.80 18.80 13.30 19.85 21.90 23.15 10.45 8.60 4.40
Truck Class 6 (E-ZPass) O ff-Peak Toll Rates
New Jersey Turnpike

NEW JERSEY TURNPIKE AUTHORITY (A Component Unit of the State of New Jersey)
Schedules of Toll Rates
December 31, 2015
(Unaudited)
159 (Continued)
EN TR Y
1 2 3 4 5 6 6A 7 7A 8 8A 9 10 11 12 13 13A 14 14A 14B 14C 15E 15W 15X 16E 16W 17 18E 18W
1 1.65 3.50 4.35 5.65 8.65 6.50 7.20 8.25 8.65 9.85 10.40 12.30 13.10 14.25 14.25 16.50 19.35 20.25 20.80 17.60 18.30 19.05 19.75 19.75 21.95 21.95
2 1.65 1.90 2.75 4.05 7.20 4.90 5.65 6.50 7.55 8.25 8.65 10.65 11.80 12.60 12.60 14.75 18.00 18.65 19.20 16.05 16.70 17.65 18.30 18.30 20.60 20.60
3 3.50 1.90 1.05 2.15 5.45 3.30 3.80 4.60 5.65 6.35 6.90 8.65 9.85 10.65 10.65 12.85 16.05 16.70 17.15 14.25 14.75 15.85 16.50 16.50 18.65 18.65
4 4.35 2.75 1.05 1.20 4.35 2.15 2.75 3.80 4.60 5.45 6.10 8.05 8.65 9.85 9.85 12.00 15.00 15.85 16.50 13.10 13.90 14.75 15.45 15.45 17.60 17.60
5 5.65 4.05 2.15 1.20 3.30 1.05 1.65 2.45 3.50 4.05 4.60 6.50 7.55 8.40 8.40 10.65 13.90 14.55 15.00 12.00 12.60 13.60 14.25 14.25 16.50 16.50
6 8.65 7.20 5.45 4.35 3.30 2.45 3.30 4.05 4.90 5.65 6.35 8.25 9.10 10.15 10.15 12.30 15.45 16.05 16.70 13.40 14.25 15.20 15.85 15.85 18.00 18.00
6A 5.46
7 6.50 4.90 3.30 2.15 1.05 2.45 1.05 1.65 2.45 3.30 3.80 5.65 6.50 7.55 7.55 9.85 12.85 13.40 14.25 10.95 11.80 12.40 13.10 13.10 15.45 15.45
7A 7.20 5.65 3.80 2.75 1.65 3.30 1.05 1.05 1.90 2.45 3.30 4.90 6.10 6.90 6.90 9.10 12.30 12.85 13.40 10.40 10.95 12.00 12.60 12.60 14.75 14.75
8 8.25 6.50 4.60 3.80 2.45 4.05 1.65 1.05 1.05 1.65 2.15 4.05 4.90 6.10 6.10 8.25 11.25 12.00 12.60 9.55 10.15 11.15 11.80 11.80 13.90 13.90
8A 8.65 7.55 5.65 4.60 3.50 4.90 2.45 1.90 1.05 1.05 1.65 3.50 4.35 5.45 5.45 7.55 10.65 11.25 12.00 8.65 9.55 10.25 10.95 10.95 13.10 13.10
9 9.85 8.25 6.35 5.45 4.05 5.65 3.30 2.45 1.65 1.05 1.05 2.45 3.50 4.35 4.35 6.50 9.85 10.40 10.95 8.05 8.40 9.55 10.15 10.15 12.30 12.30
10 10.40 8.65 6.90 6.10 4.60 6.35 3.80 3.30 2.15 1.65 1.05 1.90 2.75 3.80 3.80 6.10 9.10 9.85 10.40 7.20 8.05 8.85 9.55 9.55 11.80 11.80
11 12.30 10.65 8.65 8.05 6.50 8.25 5.65 4.90 4.05 3.50 2.45 1.90 1.05 1.90 1.90 4.05 7.20 8.05 8.40 5.45 6.10 6.95 7.55 7.55 9.85 9.85
12 13.10 11.80 9.85 8.65 7.55 9.10 6.50 6.10 4.90 4.35 3.50 2.75 1.05 1.05 1.05 3.30 6.35 6.90 7.55 4.35 4.90 5.90 6.50 6.50 8.65 8.65
13 14.25 12.60 10.65 9.85 8.40 10.15 7.55 6.90 6.10 5.45 4.35 3.80 1.90 1.05 1.05 2.15 5.45 6.10 6.50 3.50 4.05 5.05 5.65 5.65 8.05 8.05
13A 14.25 12.60 10.65 9.85 8.40 10.15 7.55 6.90 6.10 5.45 4.35 3.80 1.90 1.05 1.05 1.20 5.45 6.10 6.50 3.50 4.05 5.05 5.65 5.65 8.05 8.05
14 16.50 14.75 12.85 12.00 10.65 12.30 9.85 9.10 8.25 7.55 6.50 6.10 4.05 3.30 2.15 1.20 3.30 3.80 4.35 1.20 1.90 2.90 3.50 3.50 5.65 5.65
14A 19.35 18.00 16.05 15.00 13.90 15.45 12.85 12.30 11.25 10.65 9.85 9.10 7.20 6.35 5.45 5.45 3.30 1.20 1.90 4.35 4.90 5.90 6.50 6.50 8.65 8.65
14B 20.25 18.65 16.70 15.85 14.55 16.05 13.40 12.85 12.00 11.25 10.40 9.85 8.05 6.90 6.10 6.10 3.80 1.20 1.05 4.90 5.65 6.50 7.20 7.20 9.55 9.55
14C 20.80 19.20 17.15 16.50 15.00 16.70 14.25 13.40 12.60 12.00 10.95 10.40 8.40 7.55 6.50 6.50 4.35 1.90 1.05 5.65 6.35 7.40 8.05 8.05 10.15 10.15
15E 17.60 16.05 14.25 13.10 12.00 13.40 10.95 10.40 9.55 8.65 8.05 7.20 5.45 4.35 3.50 3.50 1.20 4.35 4.90 5.65 1.65 1.50 2.15 2.15 4.35 4.35
15W 18.30 16.70 14.75 13.90 12.60 14.25 11.80 10.95 10.15 9.55 8.40 8.05 6.10 4.90 4.05 4.05 1.90 4.90 5.65 6.35 1.65 1.65 1.65 1.65 3.80 3.80
15X 19.05 17.65 15.85 14.75 13.60 15.20 12.40 12.00 11.15 10.25 9.55 8.85 6.95 5.90 5.05 5.05 2.90 5.90 6.50 7.40 1.50 1.65 0.60 1.15
16E 19.75 18.30 16.50 15.45 14.25 15.85 13.10 12.60 11.80 10.95 10.15 9.55 7.55 6.50 5.65 5.65 3.50 6.50 7.20 8.05 2.15 1.65 0.60
16W 19.75 18.30 16.50 15.45 14.25 15.85 13.10 12.60 11.80 10.95 10.15 9.55 7.55 6.50 5.65 5.65 3.50 6.50 7.20 8.05 2.15 1.65 1.90
17 5.60
18E 21.95 20.60 18.65 17.60 16.50 18.00 15.45 14.75 13.90 13.10 12.30 11.80 9.85 8.65 8.05 8.05 5.65 8.65 9.55 10.15 4.35 3.80 1.15
18W 21.95 20.60 18.65 17.60 16.50 18.00 15.45 14.75 13.90 13.10 12.30 11.80 9.85 8.65 8.05 8.05 5.65 8.65 9.55 10.15 4.35 3.80 1.90
Bus Class B2 (Cash) Toll Rates
New Jersey Turnpike
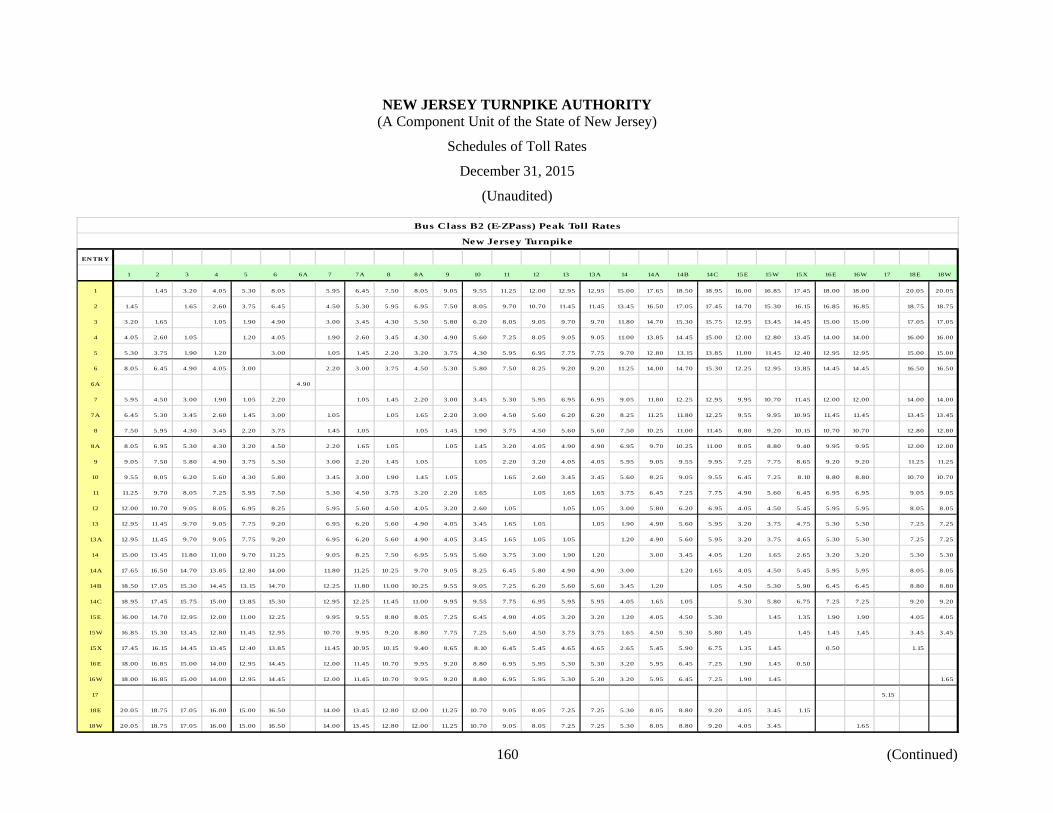
NEW JERSEY TURNPIKE AUTHORITY (A Component Unit of the State of New Jersey)
Schedules of Toll Rates
December 31, 2015
(Unaudited)
160 (Continued)
EN TR Y
1 2 3 4 5 6 6A 7 7A 8 8A 9 10 11 12 13 13A 14 14A 14B 14C 15E 15W 15X 16E 16W 17 18E 18W
1 1.45 3.20 4.05 5.30 8.05 5.95 6.45 7.50 8.05 9.05 9.55 11.25 12.00 12.95 12.95 15.00 17.65 18.50 18.95 16.00 16.85 17.45 18.00 18.00 20.05 20.05
2 1.45 1.65 2.60 3.75 6.45 4.50 5.30 5.95 6.95 7.50 8.05 9.70 10.70 11.45 11.45 13.45 16.50 17.05 17.45 14.70 15.30 16.15 16.85 16.85 18.75 18.75
3 3.20 1.65 1.05 1.90 4.90 3.00 3.45 4.30 5.30 5.80 6.20 8.05 9.05 9.70 9.70 11.80 14.70 15.30 15.75 12.95 13.45 14.45 15.00 15.00 17.05 17.05
4 4.05 2.60 1.05 1.20 4.05 1.90 2.60 3.45 4.30 4.90 5.60 7.25 8.05 9.05 9.05 11.00 13.85 14.45 15.00 12.00 12.80 13.45 14.00 14.00 16.00 16.00
5 5.30 3.75 1.90 1.20 3.00 1.05 1.45 2.20 3.20 3.75 4.30 5.95 6.95 7.75 7.75 9.70 12.80 13.15 13.85 11.00 11.45 12.40 12.95 12.95 15.00 15.00
6 8.05 6.45 4.90 4.05 3.00 2.20 3.00 3.75 4.50 5.30 5.80 7.50 8.25 9.20 9.20 11.25 14.00 14.70 15.30 12.25 12.95 13.85 14.45 14.45 16.50 16.50
6A 4.90
7 5.95 4.50 3.00 1.90 1.05 2.20 1.05 1.45 2.20 3.00 3.45 5.30 5.95 6.95 6.95 9.05 11.80 12.25 12.95 9.95 10.70 11.45 12.00 12.00 14.00 14.00
7A 6.45 5.30 3.45 2.60 1.45 3.00 1.05 1.05 1.65 2.20 3.00 4.50 5.60 6.20 6.20 8.25 11.25 11.80 12.25 9.55 9.95 10.95 11.45 11.45 13.45 13.45
8 7.50 5.95 4.30 3.45 2.20 3.75 1.45 1.05 1.05 1.45 1.90 3.75 4.50 5.60 5.60 7.50 10.25 11.00 11.45 8.80 9.20 10.15 10.70 10.70 12.80 12.80
8A 8.05 6.95 5.30 4.30 3.20 4.50 2.20 1.65 1.05 1.05 1.45 3.20 4.05 4.90 4.90 6.95 9.70 10.25 11.00 8.05 8.80 9.40 9.95 9.95 12.00 12.00
9 9.05 7.50 5.80 4.90 3.75 5.30 3.00 2.20 1.45 1.05 1.05 2.20 3.20 4.05 4.05 5.95 9.05 9.55 9.95 7.25 7.75 8.65 9.20 9.20 11.25 11.25
10 9.55 8.05 6.20 5.60 4.30 5.80 3.45 3.00 1.90 1.45 1.05 1.65 2.60 3.45 3.45 5.60 8.25 9.05 9.55 6.45 7.25 8.10 8.80 8.80 10.70 10.70
11 11.25 9.70 8.05 7.25 5.95 7.50 5.30 4.50 3.75 3.20 2.20 1.65 1.05 1.65 1.65 3.75 6.45 7.25 7.75 4.90 5.60 6.45 6.95 6.95 9.05 9.05
12 12.00 10.70 9.05 8.05 6.95 8.25 5.95 5.60 4.50 4.05 3.20 2.60 1.05 1.05 1.05 3.00 5.80 6.20 6.95 4.05 4.50 5.45 5.95 5.95 8.05 8.05
13 12.95 11.45 9.70 9.05 7.75 9.20 6.95 6.20 5.60 4.90 4.05 3.45 1.65 1.05 1.05 1.90 4.90 5.60 5.95 3.20 3.75 4.75 5.30 5.30 7.25 7.25
13A 12.95 11.45 9.70 9.05 7.75 9.20 6.95 6.20 5.60 4.90 4.05 3.45 1.65 1.05 1.05 1.20 4.90 5.60 5.95 3.20 3.75 4.65 5.30 5.30 7.25 7.25
14 15.00 13.45 11.80 11.00 9.70 11.25 9.05 8.25 7.50 6.95 5.95 5.60 3.75 3.00 1.90 1.20 3.00 3.45 4.05 1.20 1.65 2.65 3.20 3.20 5.30 5.30
14A 17.65 16.50 14.70 13.85 12.80 14.00 11.80 11.25 10.25 9.70 9.05 8.25 6.45 5.80 4.90 4.90 3.00 1.20 1.65 4.05 4.50 5.45 5.95 5.95 8.05 8.05
14B 18.50 17.05 15.30 14.45 13.15 14.70 12.25 11.80 11.00 10.25 9.55 9.05 7.25 6.20 5.60 5.60 3.45 1.20 1.05 4.50 5.30 5.90 6.45 6.45 8.80 8.80
14C 18.95 17.45 15.75 15.00 13.85 15.30 12.95 12.25 11.45 11.00 9.95 9.55 7.75 6.95 5.95 5.95 4.05 1.65 1.05 5.30 5.80 6.75 7.25 7.25 9.20 9.20
15E 16.00 14.70 12.95 12.00 11.00 12.25 9.95 9.55 8.80 8.05 7.25 6.45 4.90 4.05 3.20 3.20 1.20 4.05 4.50 5.30 1.45 1.35 1.90 1.90 4.05 4.05
15W 16.85 15.30 13.45 12.80 11.45 12.95 10.70 9.95 9.20 8.80 7.75 7.25 5.60 4.50 3.75 3.75 1.65 4.50 5.30 5.80 1.45 1.45 1.45 1.45 3.45 3.45
15X 17.45 16.15 14.45 13.45 12.40 13.85 11.45 10.95 10.15 9.40 8.65 8.10 6.45 5.45 4.65 4.65 2.65 5.45 5.90 6.75 1.35 1.45 0.50 1.15
16E 18.00 16.85 15.00 14.00 12.95 14.45 12.00 11.45 10.70 9.95 9.20 8.80 6.95 5.95 5.30 5.30 3.20 5.95 6.45 7.25 1.90 1.45 0.50
16W 18.00 16.85 15.00 14.00 12.95 14.45 12.00 11.45 10.70 9.95 9.20 8.80 6.95 5.95 5.30 5.30 3.20 5.95 6.45 7.25 1.90 1.45 1.65
17 5.15
18E 20.05 18.75 17.05 16.00 15.00 16.50 14.00 13.45 12.80 12.00 11.25 10.70 9.05 8.05 7.25 7.25 5.30 8.05 8.80 9.20 4.05 3.45 1.15
18W 20.05 18.75 17.05 16.00 15.00 16.50 14.00 13.45 12.80 12.00 11.25 10.70 9.05 8.05 7.25 7.25 5.30 8.05 8.80 9.20 4.05 3.45 1.65
Bus Class B2 (E-ZPass) Peak Toll Rates
New Jersey Turnpike

NEW JERSEY TURNPIKE AUTHORITY (A Component Unit of the State of New Jersey)
Schedules of Toll Rates
December 31, 2015
(Unaudited)
161 (Continued)
EN TR Y
1 2 3 4 5 6 6A 7 7A 8 8A 9 10 11 12 13 13A 14 14A 14B 14C 15E 15W 15X 16E 16W 17 18E 18W
1 2.15 4.35 6.10 7.55 12.00 9.10 9.85 11.25 12.30 13.40 14.55 16.50 18.00 19.35 19.35 22.70 26.45 27.30 27.30 24.35 25.40 26.30 27.10 27.10 27.30 27.30
2 2.15 2.15 3.80 5.45 9.85 6.90 7.55 9.10 10.40 11.25 12.30 14.25 15.85 17.15 17.15 20.60 24.35 25.15 25.70 22.20 23.25 24.15 24.95 24.95 27.30 27.30
3 4.35 2.15 1.65 3.30 7.55 4.35 5.45 6.90 8.25 9.10 10.15 12.00 13.40 15.00 15.00 18.30 22.20 23.05 23.50 19.75 21.10 21.90 22.70 22.70 25.40 25.40
4 6.10 3.80 1.65 1.65 6.10 3.30 3.80 5.45 6.50 7.55 8.40 10.40 12.00 13.40 13.40 16.70 20.60 21.35 22.20 18.30 19.35 20.35 21.10 21.10 23.85 23.85
5 7.55 5.45 3.30 1.65 4.35 1.65 2.15 3.80 4.90 6.10 6.90 8.65 10.40 12.00 12.00 15.00 18.80 19.75 20.60 16.70 18.00 18.65 19.35 19.35 22.40 22.40
6 12.00 9.85 7.55 6.10 4.35 3.50 4.05 5.65 6.90 8.05 8.65 10.65 12.30 13.90 13.90 16.90 20.80 21.65 22.40 18.65 19.75 20.60 21.35 21.35 24.35 24.35
6A 5.45
7 9.10 6.90 4.35 3.30 1.65 3.50 1.65 2.15 3.50 4.35 5.45 7.20 8.65 10.40 10.40 13.40 17.15 18.30 18.80 15.00 16.50 17.15 18.00 18.00 20.80 20.80
7A 9.85 7.55 5.45 3.80 2.15 4.05 1.65 1.65 2.75 3.80 4.60 6.50 8.25 9.85 9.85 12.85 16.70 17.60 18.30 14.55 15.85 16.35 17.15 17.15 20.25 20.25
8 11.25 9.10 6.90 5.45 3.80 5.65 2.15 1.65 1.20 2.15 3.30 4.90 6.50 8.25 8.25 11.25 15.00 16.05 16.70 12.85 14.25 15.00 15.85 15.85 18.65 18.65
8A 12.30 10.40 8.25 6.50 4.90 6.90 3.50 2.75 1.20 1.20 2.15 4.05 5.65 7.20 7.20 10.40 14.25 15.00 15.85 12.00 13.10 14.00 14.75 14.75 17.60 17.60
9 13.40 11.25 9.10 7.55 6.10 8.05 4.35 3.80 2.15 1.20 1.20 2.75 4.35 6.10 6.10 9.10 12.85 13.90 14.55 10.65 12.00 12.60 13.40 13.40 16.50 16.50
10 14.55 12.30 10.15 8.40 6.90 8.65 5.45 4.60 3.30 2.15 1.20 1.90 3.50 4.90 4.90 8.25 12.00 12.85 13.40 9.85 10.95 11.85 12.60 12.60 15.45 15.45
11 16.50 14.25 12.00 10.40 8.65 10.65 7.20 6.50 4.90 4.05 2.75 1.90 1.65 3.30 3.30 6.35 10.15 10.95 11.80 8.05 9.10 9.85 10.65 10.65 13.40 13.40
12 18.00 15.85 13.40 12.00 10.40 12.30 8.65 8.25 6.50 5.65 4.35 3.50 1.65 1.65 1.65 4.60 8.40 9.55 10.15 6.35 7.55 8.35 9.10 9.10 12.00 12.00
13 19.35 17.15 15.00 13.40 12.00 13.90 10.40 9.85 8.25 7.20 6.10 4.90 3.30 1.65 1.20 3.30 6.90 8.05 8.40 4.60 6.10 6.75 7.55 7.55 10.40 10.40
13A 19.35 17.15 15.00 13.40 12.00 13.90 10.40 9.85 8.25 7.20 6.10 4.90 3.30 1.65 1.20 2.00 6.90 8.05 8.40 4.60 6.10 6.75 7.55 7.55 10.40 10.40
14 22.70 20.60 18.30 16.70 15.00 16.90 13.40 12.85 11.25 10.40 9.10 8.25 6.35 4.60 3.30 2.00 3.80 4.60 5.45 1.65 2.75 3.60 4.35 4.35 7.20 7.20
14A 26.45 24.35 22.20 20.60 18.80 20.80 17.15 16.70 15.00 14.25 12.85 12.00 10.15 8.40 6.90 6.90 3.80 1.65 2.15 5.45 6.50 7.50 8.25 8.25 10.95 10.95
14B 27.30 25.15 23.05 21.35 19.75 21.65 18.30 17.60 16.05 15.00 13.90 12.85 10.95 9.55 8.05 8.05 4.60 1.65 1.65 6.35 7.55 8.35 9.10 9.10 12.00 12.00
14C 27.30 25.70 23.50 22.20 20.60 22.40 18.80 18.30 16.70 15.85 14.55 13.40 11.80 10.15 8.40 8.40 5.45 2.15 1.65 6.90 8.25 9.05 9.85 9.85 12.60 12.60
15E 24.35 22.20 19.75 18.30 16.70 18.65 15.00 14.55 12.85 12.00 10.65 9.85 8.05 6.35 4.60 4.60 1.65 5.45 6.35 6.90 1.65 2.00 2.75 2.75 5.65 5.65
15W 25.40 23.25 21.10 19.35 18.00 19.75 16.50 15.85 14.25 13.10 12.00 10.95 9.10 7.55 6.10 6.10 2.75 6.50 7.55 8.25 1.65 1.75 1.90 1.90 4.35 4.35
15X 26.30 24.15 21.90 20.35 18.65 20.60 17.15 16.35 15.00 14.00 12.60 11.85 9.85 8.35 6.75 6.75 3.60 7.50 8.35 9.05 2.00 1.75 0.75 1.60
16E 27.10 24.95 22.70 21.10 19.35 21.35 18.00 17.15 15.85 14.75 13.40 12.60 10.65 9.10 7.55 7.55 4.35 8.25 9.10 9.85 2.75 1.90 0.75
16W 27.10 24.95 22.70 21.10 19.35 21.35 18.00 17.15 15.85 14.75 13.40 12.60 10.65 9.10 7.55 7.55 4.35 8.25 9.10 9.85 2.75 1.90 2.45
17 5.60
18E 27.30 27.30 25.40 23.85 22.40 24.35 20.80 20.25 18.65 17.60 16.50 15.45 13.40 12.00 10.40 10.40 7.20 10.95 12.00 12.60 5.65 4.35 1.60
18W 27.30 27.30 25.40 23.85 22.40 24.35 20.80 20.25 18.65 17.60 16.50 15.45 13.40 12.00 10.40 10.40 7.20 10.95 12.00 12.60 5.65 4.35 2.45
Bus Class B3 (Cash) Toll Rates
New Jersey Turnpike

NEW JERSEY TURNPIKE AUTHORITY (A Component Unit of the State of New Jersey)
Schedules of Toll Rates
December 31, 2015
(Unaudited)
162 (Continued)
EN TR Y
1 2 3 4 5 6 6A 7 7A 8 8A 9 10 11 12 13 13A 14 14A 14B 14C 15E 15W 15X 16E 16W 17 18E 18W
1 1.90 4.05 5.60 6.95 11.00 8.25 9.05 10.25 11.25 12.25 13.15 15.00 16.50 17.65 17.65 20.65 24.35 24.95 24.95 22.20 23.25 24.00 24.70 24.70 24.95 24.95
2 1.90 1.90 3.45 4.90 9.05 6.20 6.95 8.25 9.55 10.25 11.25 12.95 14.45 15.75 15.75 18.75 22.20 23.05 23.50 20.25 21.35 22.05 22.80 22.80 24.95 24.95
3 4.05 1.90 1.45 3.00 6.95 4.05 4.90 6.20 7.50 8.25 9.20 11.00 12.25 13.85 13.85 16.85 20.25 20.90 21.50 18.00 19.20 19.90 20.65 20.65 23.25 23.25
4 5.60 3.45 1.45 1.45 5.60 3.00 3.45 4.90 5.95 6.95 7.75 9.55 11.00 12.25 12.25 15.30 18.75 19.35 20.25 16.85 17.65 18.50 19.20 19.20 21.75 21.75
5 6.95 4.90 3.00 1.45 4.05 1.45 1.90 3.45 4.50 5.60 6.20 8.05 9.55 11.00 11.00 13.85 17.20 18.00 18.75 15.30 16.50 17.05 17.65 17.65 20.45 20.45
6 11.00 9.05 6.95 5.60 4.05 3.20 3.75 5.30 6.20 7.25 8.05 9.70 11.25 12.80 12.80 15.55 18.95 19.80 20.45 17.05 18.00 18.75 19.35 19.35 22.20 22.20
6A 4.90
7 8.25 6.20 4.05 3.00 1.45 3.20 1.45 1.90 3.20 4.05 4.90 6.45 8.05 9.55 9.55 12.25 15.75 16.85 17.20 13.85 15.00 15.75 16.50 16.50 18.95 18.95
7A 9.05 6.95 4.90 3.45 1.90 3.75 1.45 1.45 2.60 3.45 4.30 5.95 7.50 9.05 9.05 11.80 15.30 16.00 16.85 13.15 14.45 15.00 15.75 15.75 18.50 18.50
8 10.25 8.25 6.20 4.90 3.45 5.30 1.90 1.45 1.20 1.90 3.00 4.50 5.95 7.50 7.50 10.25 13.85 14.70 15.30 11.80 12.95 13.70 14.45 14.45 17.05 17.05
8A 11.25 9.55 7.50 5.95 4.50 6.20 3.20 2.60 1.20 1.20 1.90 3.75 5.30 6.45 6.45 9.55 12.95 13.85 14.45 11.00 12.00 12.85 13.45 13.45 16.00 16.00
9 12.25 10.25 8.25 6.95 5.60 7.25 4.05 3.45 1.90 1.20 1.20 2.60 4.05 5.60 5.60 8.25 11.80 12.80 13.15 9.70 11.00 11.55 12.25 12.25 15.00 15.00
10 13.15 11.25 9.20 7.75 6.20 8.05 4.90 4.30 3.00 1.90 1.20 1.65 3.20 4.50 4.50 7.50 11.00 11.80 12.25 9.05 9.95 10.80 11.45 11.45 14.00 14.00
11 15.00 12.95 11.00 9.55 8.05 9.70 6.45 5.95 4.50 3.75 2.60 1.65 1.45 3.00 3.00 5.80 9.20 9.95 10.70 7.25 8.25 9.10 9.70 9.70 12.25 12.25
12 16.50 14.45 12.25 11.00 9.55 11.25 8.05 7.50 5.95 5.30 4.05 3.20 1.45 1.45 1.45 4.30 7.75 8.80 9.20 5.80 6.95 7.55 8.25 8.25 11.00 11.00
13 17.65 15.75 13.85 12.25 11.00 12.80 9.55 9.05 7.50 6.45 5.60 4.50 3.00 1.45 1.20 3.00 6.20 7.25 7.75 4.30 5.60 6.20 6.95 6.95 9.55 9.55
13A 17.65 15.75 13.85 12.25 11.00 12.80 9.55 9.05 7.50 6.45 5.60 4.50 3.00 1.45 1.20 1.75 6.20 7.25 7.75 4.30 5.60 6.20 6.95 6.95 9.55 9.55
14 20.65 18.75 16.85 15.30 13.85 15.55 12.25 11.80 10.25 9.55 8.25 7.50 5.80 4.30 3.00 1.75 3.45 4.30 4.90 1.45 2.60 3.30 4.05 4.05 6.45 6.45
14A 24.35 22.20 20.25 18.75 17.20 18.95 15.75 15.30 13.85 12.95 11.80 11.00 9.20 7.75 6.20 6.20 3.45 1.45 1.90 4.90 5.95 6.75 7.50 7.50 9.95 9.95
14B 24.95 23.05 20.90 19.35 18.00 19.80 16.85 16.00 14.70 13.85 12.80 11.80 9.95 8.80 7.25 7.25 4.30 1.45 1.45 5.80 6.95 7.55 8.25 8.25 11.00 11.00
14C 24.95 23.50 21.50 20.25 18.75 20.45 17.20 16.85 15.30 14.45 13.15 12.25 10.70 9.20 7.75 7.75 4.90 1.90 1.45 6.20 7.50 8.25 9.05 9.05 11.45 11.45
15E 22.20 20.25 18.00 16.85 15.30 17.05 13.85 13.15 11.80 11.00 9.70 9.05 7.25 5.80 4.30 4.30 1.45 4.90 5.80 6.20 1.45 1.75 2.60 2.60 5.30 5.30
15W 23.25 21.35 19.20 17.65 16.50 18.00 15.00 14.45 12.95 12.00 11.00 9.95 8.25 6.95 5.60 5.60 2.60 5.95 6.95 7.50 1.45 1.60 1.65 1.65 4.05 4.05
15X 24.00 22.05 19.90 18.50 17.05 18.75 15.75 15.00 13.70 12.85 11.55 10.80 9.10 7.55 6.20 6.20 3.30 6.75 7.55 8.25 1.75 1.60 0.65 1.45
16E 24.70 22.80 20.65 19.20 17.65 19.35 16.50 15.75 14.45 13.45 12.25 11.45 9.70 8.25 6.95 6.95 4.05 7.50 8.25 9.05 2.60 1.65 0.65
16W 24.70 22.80 20.65 19.20 17.65 19.35 16.50 15.75 14.45 13.45 12.25 11.45 9.70 8.25 6.95 6.95 4.05 7.50 8.25 9.05 2.60 1.65 2.20
17 5.15
18E 24.95 24.95 23.25 21.75 20.45 22.20 18.95 18.50 17.05 16.00 15.00 14.00 12.25 11.00 9.55 9.55 6.45 9.95 11.00 11.45 5.30 4.05 1.45
18W 24.95 24.95 23.25 21.75 20.45 22.20 18.95 18.50 17.05 16.00 15.00 14.00 12.25 11.00 9.55 9.55 6.45 9.95 11.00 11.45 5.30 4.05 2.20
Bus Class B3 (E-ZPass) Peak Toll Rates
New Jersey Turnpike
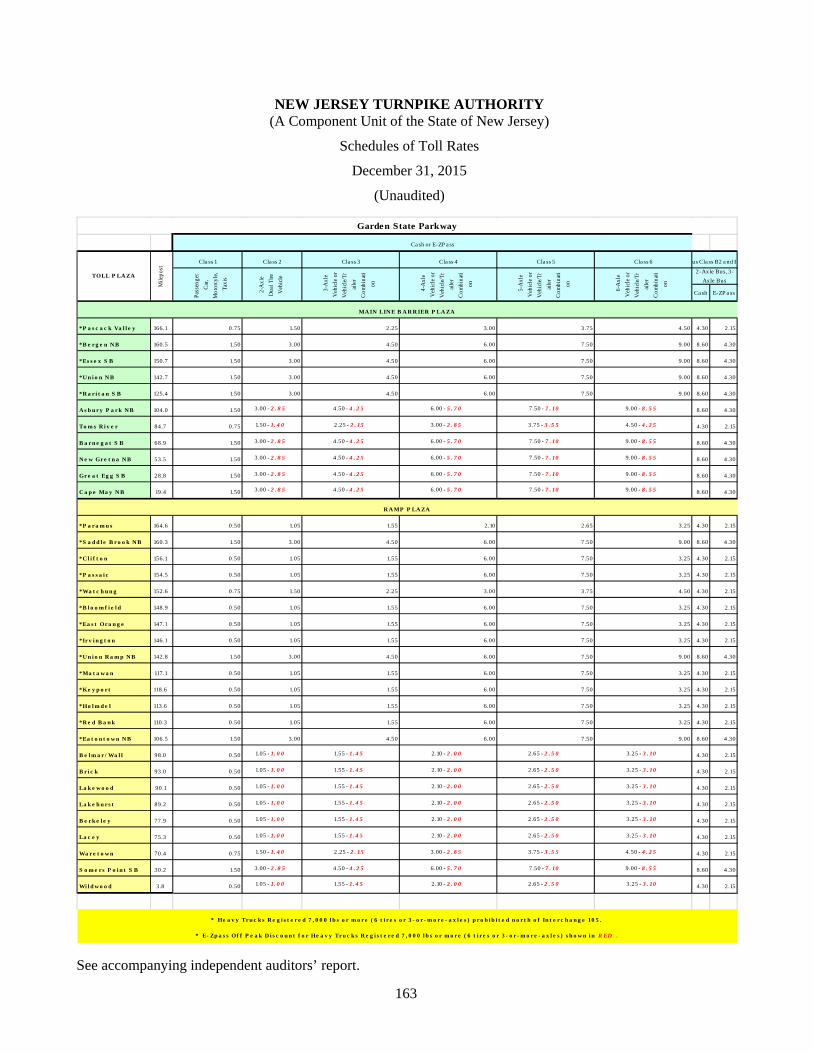
NEW JERSEY TURNPIKE AUTHORITY (A Component Unit of the State of New Jersey)
Schedules of Toll Rates
December 31, 2015
(Unaudited)
163
Cla ss 1 Cla ss 2 Cla ss 3 Cla ss 4 Cla ss 5 Class 6
Ca sh E-ZP a ss
*P a s c a c k Va l l e y 166.1 0.75 1.50 2.25 3.00 3.75 4.50 4.30 2.15
*B e r g e n N B 160.5 1.50 3.00 4.50 6.00 7.50 9.00 8.60 4.30
*Es s e x S B 150.7 1.50 3.00 4.50 6.00 7.50 9.00 8.60 4.30
*U n i o n N B 142.7 1.50 3.00 4.50 6.00 7.50 9.00 8.60 4.30
*R a r i t a n S B 125.4 1.50 3.00 4.50 6.00 7.50 9.00 8.60 4.30
A s b u r y P a r k N B 104.0 1.50 3.00 - 2 . 8 5 4.50 - 4 . 2 5 6.00 - 5 . 7 0 7.50 - 7 . 10 9.00 - 8 . 5 5 8.60 4.30
To m s R i v e r 84.7 0.75 1.50 - 1. 4 0 2.25 - 2 . 15 3.00 - 2 . 8 5 3.75 - 3 . 5 5 4.50 - 4 . 2 5 4.30 2.15
B a r n e g a t S B 68.9 1.50 3.00 - 2 . 8 5 4.50 - 4 . 2 5 6.00 - 5 . 7 0 7.50 - 7 . 10 9.00 - 8 . 5 5 8.60 4.30
N e w Gr e t n a N B 53.5 1.50 3.00 - 2 . 8 5 4.50 - 4 . 2 5 6.00 - 5 . 7 0 7.50 - 7 . 10 9.00 - 8 . 5 5 8.60 4.30
Gr e a t Eg g S B 28.8 1.50 3.00 - 2 . 8 5 4.50 - 4 . 2 5 6.00 - 5 . 7 0 7.50 - 7 . 10 9.00 - 8 . 5 5 8.60 4.30
C a p e Ma y N B 19.4 1.50 3.00 - 2 . 8 5 4.50 - 4 . 2 5 6.00 - 5 . 7 0 7.50 - 7 . 10 9.00 - 8 . 5 5 8.60 4.30
*P a r a m u s 164.6 0.50 1.05 1.55 2.10 2.65 3.25 4.30 2.15
*S a d d l e B r o o k N B 160.3 1.50 3.00 4.50 6.00 7.50 9.00 8.60 4.30
*C l i f t o n 156.1 0.50 1.05 1.55 6.00 7.50 3.25 4.30 2.15
*P a s s a i c 154.5 0.50 1.05 1.55 6.00 7.50 3.25 4.30 2.15
*Wa t c h u n g 152.6 0.75 1.50 2.25 3.00 3.75 4.50 4.30 2.15
*B l o o m f i e l d 148.9 0.50 1.05 1.55 6.00 7.50 3.25 4.30 2.15
*Ea s t Ora n g e 147.1 0.50 1.05 1.55 6.00 7.50 3.25 4.30 2.15
*Ir v i n g t o n 146.1 0.50 1.05 1.55 6.00 7.50 3.25 4.30 2.15
*U n i o n R a m p N B 142.8 1.50 3.00 4.50 6.00 7.50 9.00 8.60 4.30
*Ma t a w a n 117.1 0.50 1.05 1.55 6.00 7.50 3.25 4.30 2.15
*Ke y p o rt 118.6 0.50 1.05 1.55 6.00 7.50 3.25 4.30 2.15
*Ho l m d e l 113.6 0.50 1.05 1.55 6.00 7.50 3.25 4.30 2.15
*R e d B a n k 110.3 0.50 1.05 1.55 6.00 7.50 3.25 4.30 2.15
*Ea t o n t o w n N B 106.5 1.50 3.00 4.50 6.00 7.50 9.00 8.60 4.30
B e l m a r / Wa l l 98.0 0.50 1.05 - 1. 0 0 1.55 - 1. 4 5 2.10 - 2 . 0 0 2.65 - 2 . 5 0 3.25 - 3 . 10 4.30 2.15
B r i c k 93.0 0.50 1.05 - 1. 0 0 1.55 - 1. 4 5 2.10 - 2 . 0 0 2.65 - 2 . 5 0 3.25 - 3 . 10 4.30 2.15
La k e w o o d 90.1 0.50 1.05 - 1. 0 0 1.55 - 1. 4 5 2.10 - 2 . 0 0 2.65 - 2 . 5 0 3.25 - 3 . 10 4.30 2.15
La k e h u rs t 89.2 0.50 1.05 - 1. 0 0 1.55 - 1. 4 5 2.10 - 2 . 0 0 2.65 - 2 . 5 0 3.25 - 3 . 10 4.30 2.15
B e r k e l e y 77.9 0.50 1.05 - 1. 0 0 1.55 - 1. 4 5 2.10 - 2 . 0 0 2.65 - 2 . 5 0 3.25 - 3 . 10 4.30 2.15
La c e y 75.3 0.50 1.05 - 1. 0 0 1.55 - 1. 4 5 2.10 - 2 . 0 0 2.65 - 2 . 5 0 3.25 - 3 . 10 4.30 2.15
Wa r e t o w n 70.4 0.75 1.50 - 1. 4 0 2.25 - 2 . 15 3.00 - 2 . 8 5 3.75 - 3 . 5 5 4.50 - 4 . 2 5 4.30 2.15
S o m e rs P o i n t S B 30.2 1.50 3.00 - 2 . 8 5 4.50 - 4 . 2 5 6.00 - 5 . 7 0 7.50 - 7 . 10 9.00 - 8 . 5 5 8.60 4.30
Wi l d w o o d 3.8 0.50 1.05 - 1. 0 0 1.55 - 1. 4 5 2.10 - 2 . 0 0 2.65 - 2 . 5 0 3.25 - 3 . 10 4.30 2.15
Pass
enge
r
Car
,
Mo
torc
yle,
Tax
is
2-A
xle
Dua
l Tire
Veh
icle
3-A
xle
Veh
icle
or
Veh
icle
/Tr
aile
r
Com
bina
ti
on
4-A
xle
Veh
icle
or
Veh
icle
/Tr
aile
r
Com
bina
ti
on
5-A
xle
Veh
icle
or
Veh
icle
/Tr
aile
r
Com
bina
ti
on
6-A
xle
Veh
icle
or
Veh
icle
/Tr
aile
r
Com
bina
ti
on
2-Axle Bus, 3-
Axle Bus
Garden State Parkway
Ca sh or E-ZP a ss
TOLL P LA ZA
Mile
post
us Cla ss B2 a nd B
* E- Zp a s s Of f P e a k D i s c o u n t f o r He a v y Tr u c k s R e g i s t e r e d 7 , 0 0 0 l b s o r m o r e ( 6 t i r e s o r 3 - o r- m o r e - a x l e s ) s h o w n i n R ED .
R A MP P LA ZA
* He a v y Tr u c k s R e g i s t e r e d 7 , 0 0 0 l b s o r m o r e ( 6 t i r e s o r 3 - o r - m o r e - a x l e s ) p r o h i b i t e d n o r t h o f In t e r c h a n g e 10 5 .
MA IN LIN E B A R R IER P LA ZA
See accompanying independent auditors’ report.
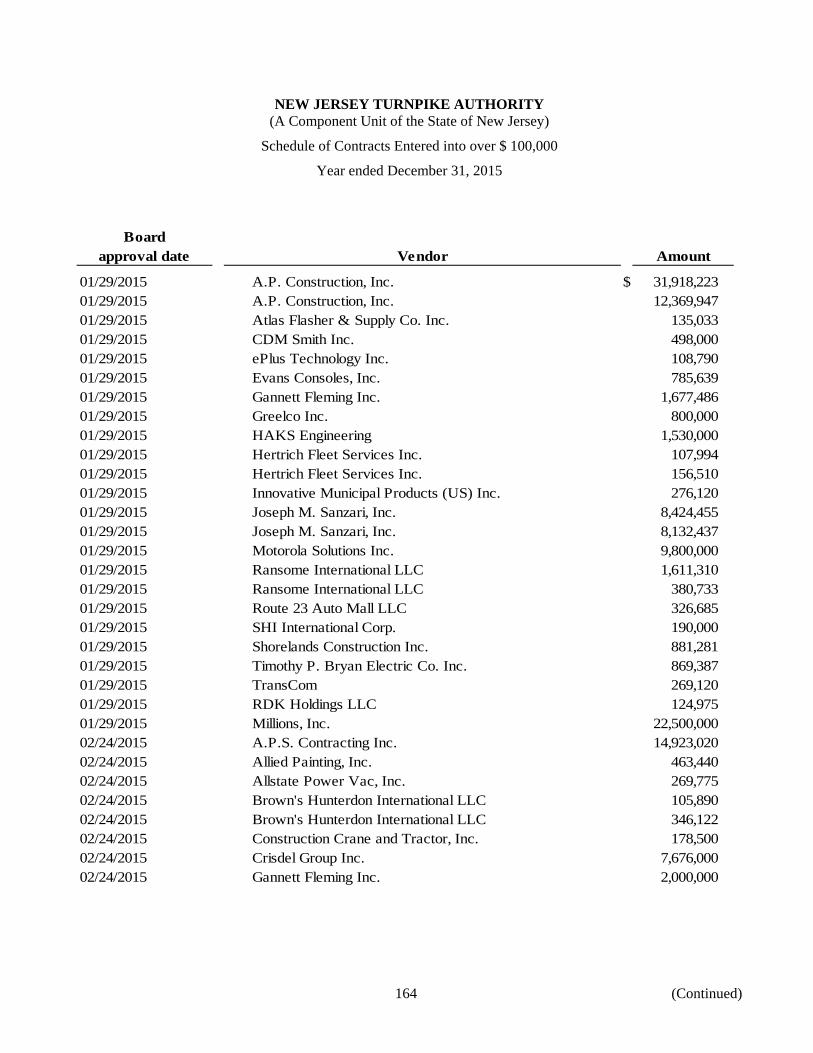
NEW JERSEY TURNPIKE AUTHORITY (A Component Unit of the State of New Jersey)
Schedule of Contracts Entered into over $ 100,000
Year ended December 31, 2015
164 (Continued)
Boardapproval date Amount
01/29/2015 A.P. Construction, Inc. $ 31,918,223 01/29/2015 A.P. Construction, Inc. 12,369,947 01/29/2015 Atlas Flasher & Supply Co. Inc. 135,033 01/29/2015 CDM Smith Inc. 498,000 01/29/2015 ePlus Technology Inc. 108,790 01/29/2015 Evans Consoles, Inc. 785,639 01/29/2015 Gannett Fleming Inc. 1,677,486 01/29/2015 Greelco Inc. 800,000 01/29/2015 HAKS Engineering 1,530,000 01/29/2015 Hertrich Fleet Services Inc. 107,994 01/29/2015 Hertrich Fleet Services Inc. 156,510 01/29/2015 Innovative Municipal Products (US) Inc. 276,120 01/29/2015 Joseph M. Sanzari, Inc. 8,424,455 01/29/2015 Joseph M. Sanzari, Inc. 8,132,437 01/29/2015 Motorola Solutions Inc. 9,800,000 01/29/2015 Ransome International LLC 1,611,310 01/29/2015 Ransome International LLC 380,733 01/29/2015 Route 23 Auto Mall LLC 326,685 01/29/2015 SHI International Corp. 190,000 01/29/2015 Shorelands Construction Inc. 881,281 01/29/2015 Timothy P. Bryan Electric Co. Inc. 869,387 01/29/2015 TransCom 269,120 01/29/2015 RDK Holdings LLC 124,975 01/29/2015 Millions, Inc. 22,500,000 02/24/2015 A.P.S. Contracting Inc. 14,923,020 02/24/2015 Allied Painting, Inc. 463,440 02/24/2015 Allstate Power Vac, Inc. 269,775 02/24/2015 Brown's Hunterdon International LLC 105,890 02/24/2015 Brown's Hunterdon International LLC 346,122 02/24/2015 Construction Crane and Tractor, Inc. 178,500 02/24/2015 Crisdel Group Inc. 7,676,000 02/24/2015 Gannett Fleming Inc. 2,000,000
Vendor
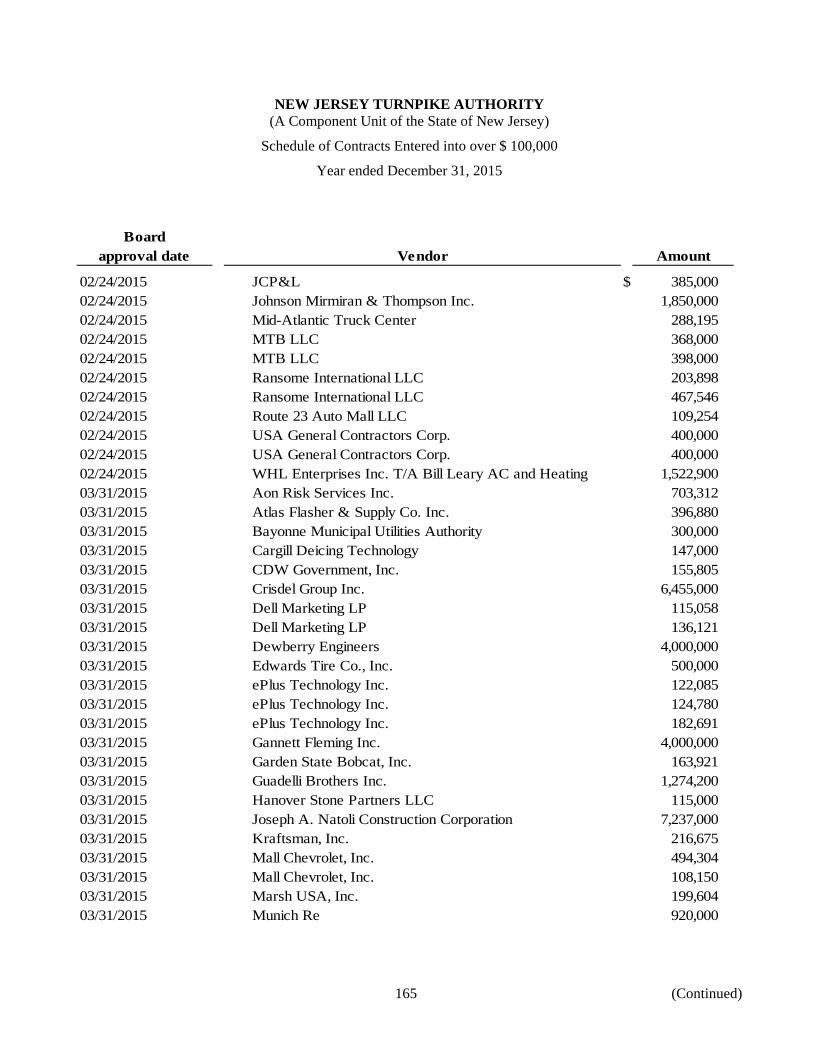
NEW JERSEY TURNPIKE AUTHORITY (A Component Unit of the State of New Jersey)
Schedule of Contracts Entered into over $ 100,000
Year ended December 31, 2015
165 (Continued)
Boardapproval date Amount
02/24/2015 JCP&L $ 385,000 02/24/2015 Johnson Mirmiran & Thompson Inc. 1,850,000 02/24/2015 Mid-Atlantic Truck Center 288,195 02/24/2015 MTB LLC 368,000 02/24/2015 MTB LLC 398,000 02/24/2015 Ransome International LLC 203,898 02/24/2015 Ransome International LLC 467,546 02/24/2015 Route 23 Auto Mall LLC 109,254 02/24/2015 USA General Contractors Corp. 400,000 02/24/2015 USA General Contractors Corp. 400,000 02/24/2015 WHL Enterprises Inc. T/A Bill Leary AC and Heating 1,522,900 03/31/2015 Aon Risk Services Inc. 703,312 03/31/2015 Atlas Flasher & Supply Co. Inc. 396,880 03/31/2015 Bayonne Municipal Utilities Authority 300,000 03/31/2015 Cargill Deicing Technology 147,000 03/31/2015 CDW Government, Inc. 155,805 03/31/2015 Crisdel Group Inc. 6,455,000 03/31/2015 Dell Marketing LP 115,058 03/31/2015 Dell Marketing LP 136,121 03/31/2015 Dewberry Engineers 4,000,000 03/31/2015 Edwards Tire Co., Inc. 500,000 03/31/2015 ePlus Technology Inc. 122,085 03/31/2015 ePlus Technology Inc. 124,780 03/31/2015 ePlus Technology Inc. 182,691 03/31/2015 Gannett Fleming Inc. 4,000,000 03/31/2015 Garden State Bobcat, Inc. 163,921 03/31/2015 Guadelli Brothers Inc. 1,274,200 03/31/2015 Hanover Stone Partners LLC 115,000 03/31/2015 Joseph A. Natoli Construction Corporation 7,237,000 03/31/2015 Kraftsman, Inc. 216,675 03/31/2015 Mall Chevrolet, Inc. 494,304 03/31/2015 Mall Chevrolet, Inc. 108,150 03/31/2015 Marsh USA, Inc. 199,604 03/31/2015 Munich Re 920,000
Vendor
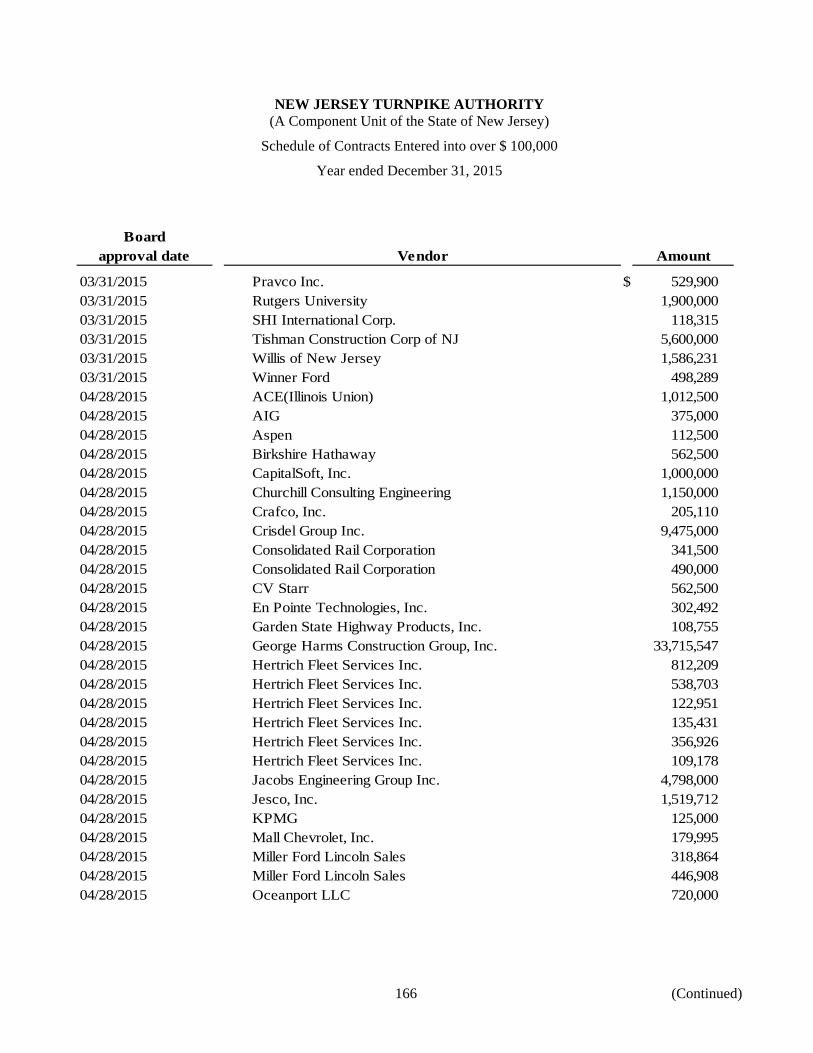
NEW JERSEY TURNPIKE AUTHORITY (A Component Unit of the State of New Jersey)
Schedule of Contracts Entered into over $ 100,000
Year ended December 31, 2015
166 (Continued)
Boardapproval date Amount
03/31/2015 Pravco Inc. $ 529,900 03/31/2015 Rutgers University 1,900,000 03/31/2015 SHI International Corp. 118,315 03/31/2015 Tishman Construction Corp of NJ 5,600,000 03/31/2015 Willis of New Jersey 1,586,231 03/31/2015 Winner Ford 498,289 04/28/2015 ACE(Illinois Union) 1,012,500 04/28/2015 AIG 375,000 04/28/2015 Aspen 112,500 04/28/2015 Birkshire Hathaway 562,500 04/28/2015 CapitalSoft, Inc. 1,000,000 04/28/2015 Churchill Consulting Engineering 1,150,000 04/28/2015 Crafco, Inc. 205,110 04/28/2015 Crisdel Group Inc. 9,475,000 04/28/2015 Consolidated Rail Corporation 341,500 04/28/2015 Consolidated Rail Corporation 490,000 04/28/2015 CV Starr 562,500 04/28/2015 En Pointe Technologies, Inc. 302,492 04/28/2015 Garden State Highway Products, Inc. 108,755 04/28/2015 George Harms Construction Group, Inc. 33,715,547 04/28/2015 Hertrich Fleet Services Inc. 812,209 04/28/2015 Hertrich Fleet Services Inc. 538,703 04/28/2015 Hertrich Fleet Services Inc. 122,951 04/28/2015 Hertrich Fleet Services Inc. 135,431 04/28/2015 Hertrich Fleet Services Inc. 356,926 04/28/2015 Hertrich Fleet Services Inc. 109,178 04/28/2015 Jacobs Engineering Group Inc. 4,798,000 04/28/2015 Jesco, Inc. 1,519,712 04/28/2015 KPMG 125,000 04/28/2015 Mall Chevrolet, Inc. 179,995 04/28/2015 Miller Ford Lincoln Sales 318,864 04/28/2015 Miller Ford Lincoln Sales 446,908 04/28/2015 Oceanport LLC 720,000
Vendor
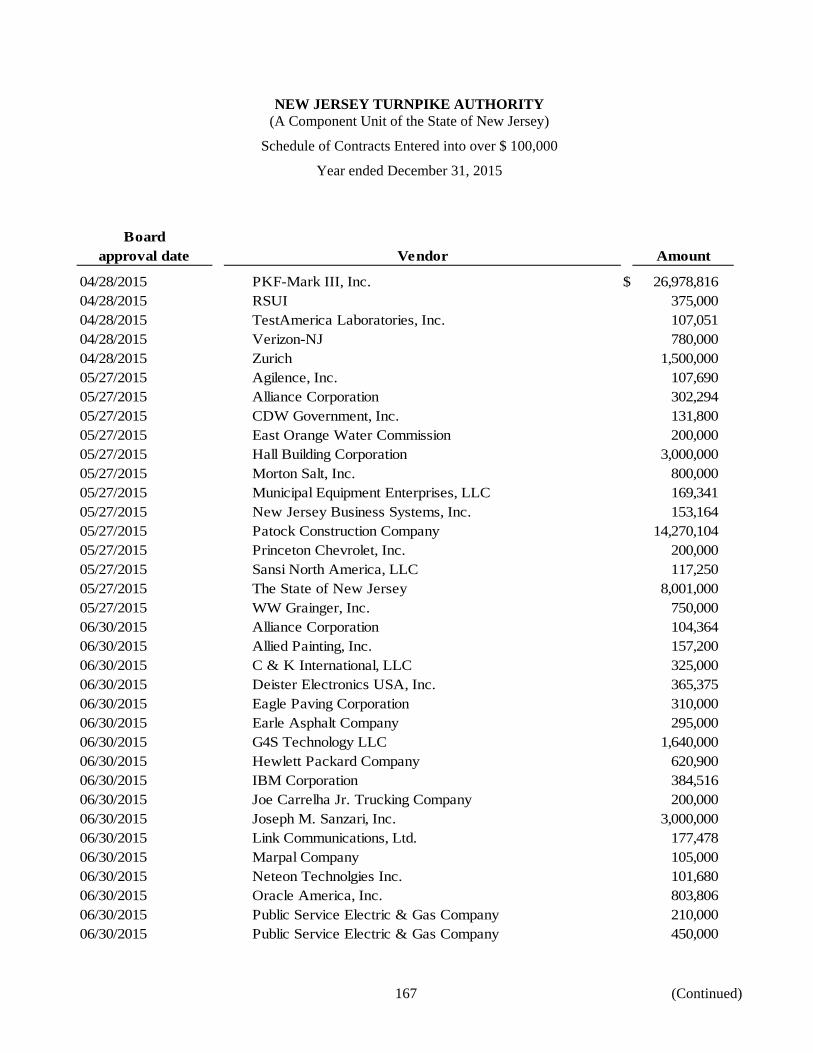
NEW JERSEY TURNPIKE AUTHORITY (A Component Unit of the State of New Jersey)
Schedule of Contracts Entered into over $ 100,000
Year ended December 31, 2015
167 (Continued)
Boardapproval date Amount
04/28/2015 PKF-Mark III, Inc. $ 26,978,816 04/28/2015 RSUI 375,000 04/28/2015 TestAmerica Laboratories, Inc. 107,051 04/28/2015 Verizon-NJ 780,000 04/28/2015 Zurich 1,500,000 05/27/2015 Agilence, Inc. 107,690 05/27/2015 Alliance Corporation 302,294 05/27/2015 CDW Government, Inc. 131,800 05/27/2015 East Orange Water Commission 200,000 05/27/2015 Hall Building Corporation 3,000,000 05/27/2015 Morton Salt, Inc. 800,000 05/27/2015 Municipal Equipment Enterprises, LLC 169,341 05/27/2015 New Jersey Business Systems, Inc. 153,164 05/27/2015 Patock Construction Company 14,270,104 05/27/2015 Princeton Chevrolet, Inc. 200,000 05/27/2015 Sansi North America, LLC 117,250 05/27/2015 The State of New Jersey 8,001,000 05/27/2015 WW Grainger, Inc. 750,000 06/30/2015 Alliance Corporation 104,364 06/30/2015 Allied Painting, Inc. 157,200 06/30/2015 C & K International, LLC 325,000 06/30/2015 Deister Electronics USA, Inc. 365,375 06/30/2015 Eagle Paving Corporation 310,000 06/30/2015 Earle Asphalt Company 295,000 06/30/2015 G4S Technology LLC 1,640,000 06/30/2015 Hewlett Packard Company 620,900 06/30/2015 IBM Corporation 384,516 06/30/2015 Joe Carrelha Jr. Trucking Company 200,000 06/30/2015 Joseph M. Sanzari, Inc. 3,000,000 06/30/2015 Link Communications, Ltd. 177,478 06/30/2015 Marpal Company 105,000 06/30/2015 Neteon Technolgies Inc. 101,680 06/30/2015 Oracle America, Inc. 803,806 06/30/2015 Public Service Electric & Gas Company 210,000 06/30/2015 Public Service Electric & Gas Company 450,000
Vendor
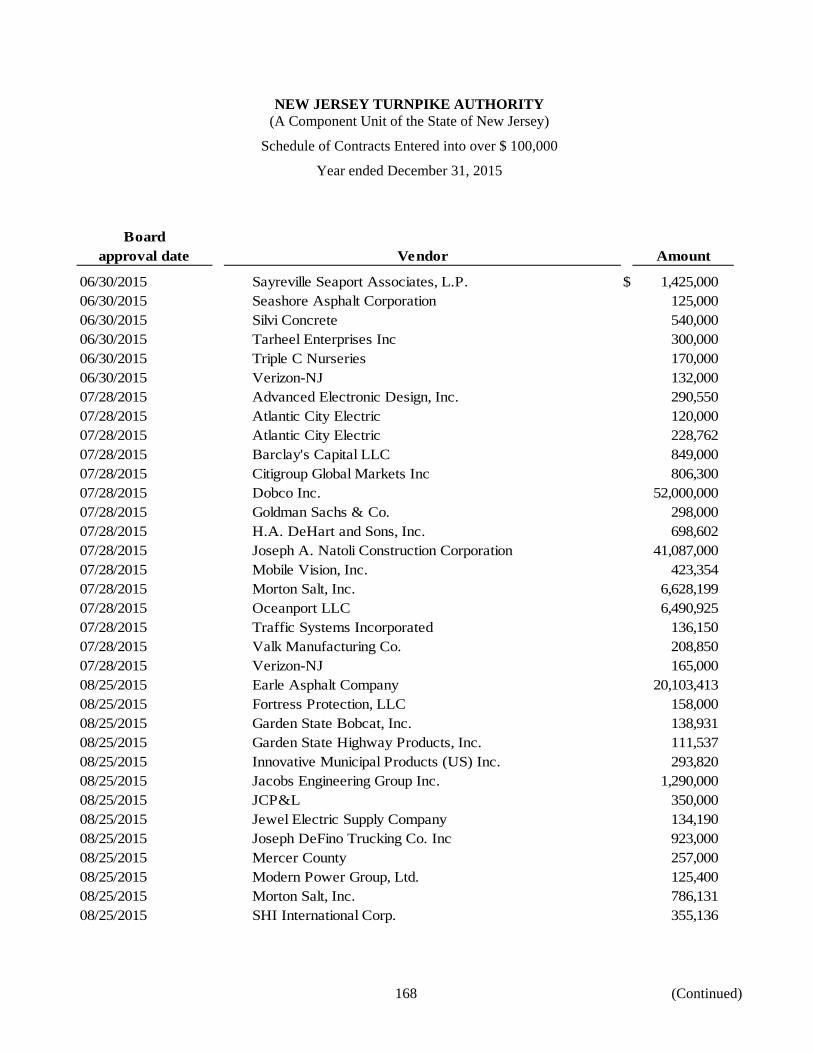
NEW JERSEY TURNPIKE AUTHORITY (A Component Unit of the State of New Jersey)
Schedule of Contracts Entered into over $ 100,000
Year ended December 31, 2015
168 (Continued)
Boardapproval date Amount
06/30/2015 Sayreville Seaport Associates, L.P. $ 1,425,000 06/30/2015 Seashore Asphalt Corporation 125,000 06/30/2015 Silvi Concrete 540,000 06/30/2015 Tarheel Enterprises Inc 300,000 06/30/2015 Triple C Nurseries 170,000 06/30/2015 Verizon-NJ 132,000 07/28/2015 Advanced Electronic Design, Inc. 290,550 07/28/2015 Atlantic City Electric 120,000 07/28/2015 Atlantic City Electric 228,762 07/28/2015 Barclay's Capital LLC 849,000 07/28/2015 Citigroup Global Markets Inc 806,300 07/28/2015 Dobco Inc. 52,000,000 07/28/2015 Goldman Sachs & Co. 298,000 07/28/2015 H.A. DeHart and Sons, Inc. 698,602 07/28/2015 Joseph A. Natoli Construction Corporation 41,087,000 07/28/2015 Mobile Vision, Inc. 423,354 07/28/2015 Morton Salt, Inc. 6,628,199 07/28/2015 Oceanport LLC 6,490,925 07/28/2015 Traffic Systems Incorporated 136,150 07/28/2015 Valk Manufacturing Co. 208,850 07/28/2015 Verizon-NJ 165,000 08/25/2015 Earle Asphalt Company 20,103,413 08/25/2015 Fortress Protection, LLC 158,000 08/25/2015 Garden State Bobcat, Inc. 138,931 08/25/2015 Garden State Highway Products, Inc. 111,537 08/25/2015 Innovative Municipal Products (US) Inc. 293,820 08/25/2015 Jacobs Engineering Group Inc. 1,290,000 08/25/2015 JCP&L 350,000 08/25/2015 Jewel Electric Supply Company 134,190 08/25/2015 Joseph DeFino Trucking Co. Inc 923,000 08/25/2015 Mercer County 257,000 08/25/2015 Modern Power Group, Ltd. 125,400 08/25/2015 Morton Salt, Inc. 786,131 08/25/2015 SHI International Corp. 355,136
Vendor
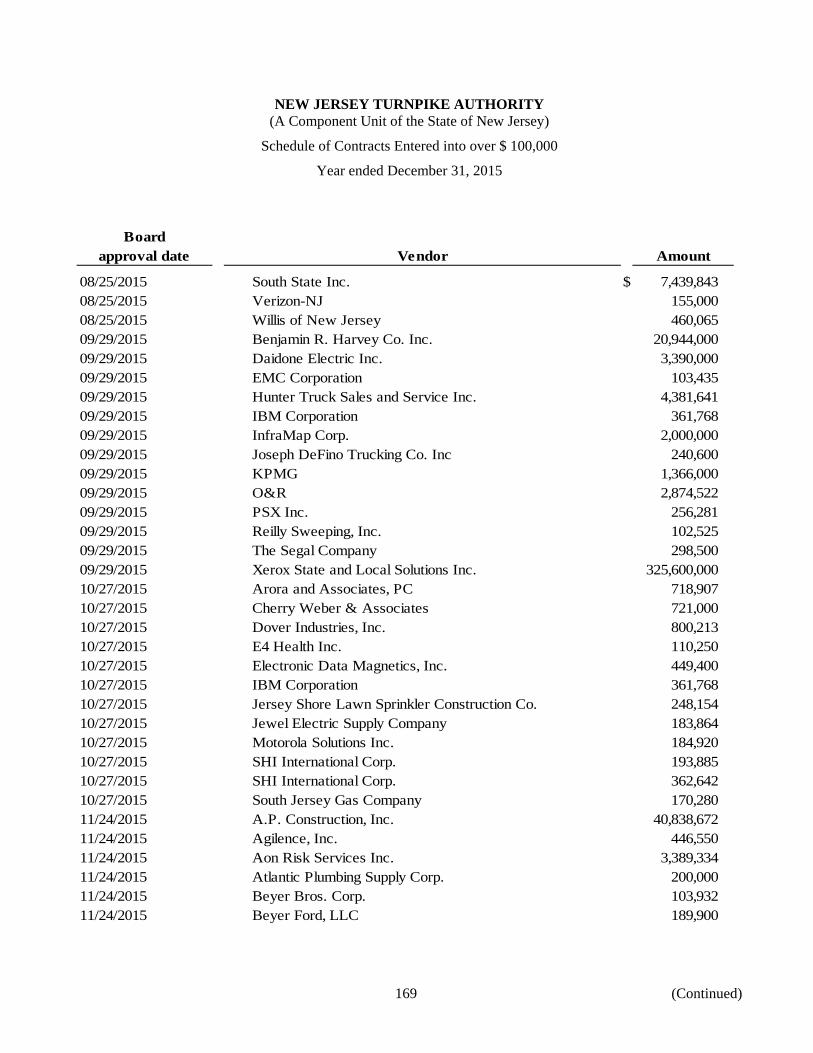
NEW JERSEY TURNPIKE AUTHORITY (A Component Unit of the State of New Jersey)
Schedule of Contracts Entered into over $ 100,000
Year ended December 31, 2015
169 (Continued)
Boardapproval date Amount
08/25/2015 South State Inc. $ 7,439,843 08/25/2015 Verizon-NJ 155,000 08/25/2015 Willis of New Jersey 460,065 09/29/2015 Benjamin R. Harvey Co. Inc. 20,944,000 09/29/2015 Daidone Electric Inc. 3,390,000 09/29/2015 EMC Corporation 103,435 09/29/2015 Hunter Truck Sales and Service Inc. 4,381,641 09/29/2015 IBM Corporation 361,768 09/29/2015 InfraMap Corp. 2,000,000 09/29/2015 Joseph DeFino Trucking Co. Inc 240,600 09/29/2015 KPMG 1,366,000 09/29/2015 O&R 2,874,522 09/29/2015 PSX Inc. 256,281 09/29/2015 Reilly Sweeping, Inc. 102,525 09/29/2015 The Segal Company 298,500 09/29/2015 Xerox State and Local Solutions Inc. 325,600,000 10/27/2015 Arora and Associates, PC 718,907 10/27/2015 Cherry Weber & Associates 721,000 10/27/2015 Dover Industries, Inc. 800,213 10/27/2015 E4 Health Inc. 110,250 10/27/2015 Electronic Data Magnetics, Inc. 449,400 10/27/2015 IBM Corporation 361,768 10/27/2015 Jersey Shore Lawn Sprinkler Construction Co. 248,154 10/27/2015 Jewel Electric Supply Company 183,864 10/27/2015 Motorola Solutions Inc. 184,920 10/27/2015 SHI International Corp. 193,885 10/27/2015 SHI International Corp. 362,642 10/27/2015 South Jersey Gas Company 170,280 11/24/2015 A.P. Construction, Inc. 40,838,672 11/24/2015 Agilence, Inc. 446,550 11/24/2015 Aon Risk Services Inc. 3,389,334 11/24/2015 Atlantic Plumbing Supply Corp. 200,000 11/24/2015 Beyer Bros. Corp. 103,932 11/24/2015 Beyer Ford, LLC 189,900
Vendor
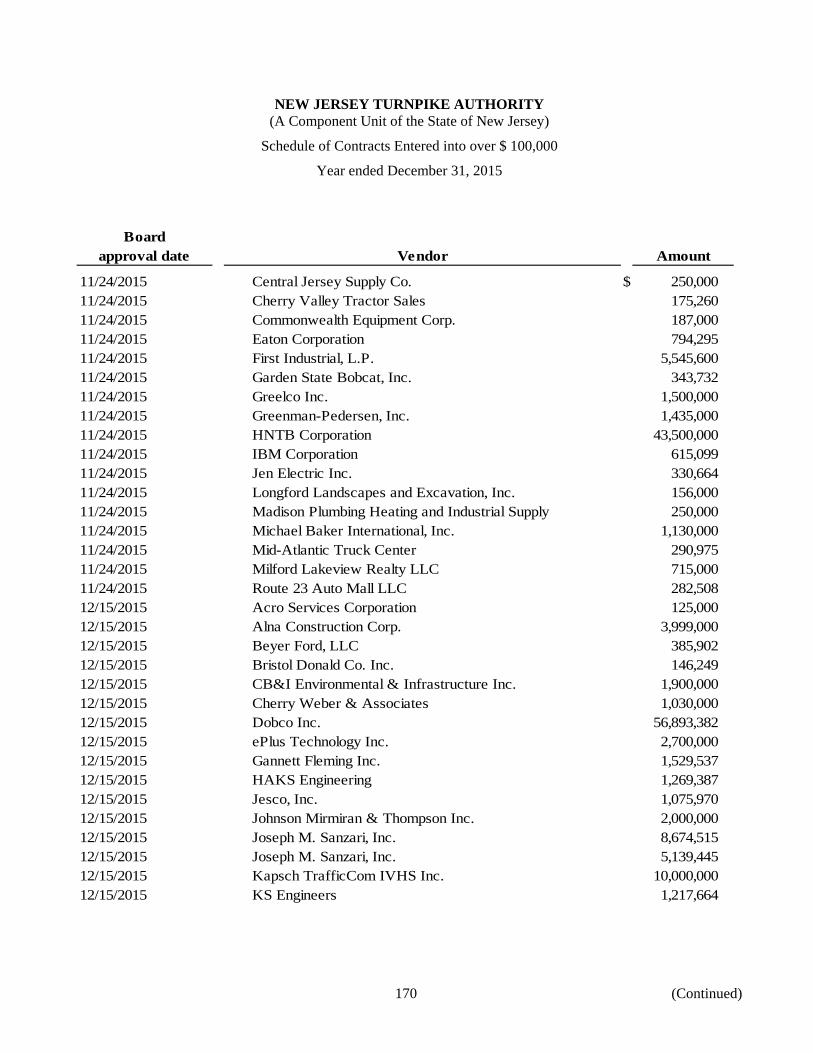
NEW JERSEY TURNPIKE AUTHORITY (A Component Unit of the State of New Jersey)
Schedule of Contracts Entered into over $ 100,000
Year ended December 31, 2015
170 (Continued)
Boardapproval date Amount
11/24/2015 Central Jersey Supply Co. $ 250,000 11/24/2015 Cherry Valley Tractor Sales 175,260 11/24/2015 Commonwealth Equipment Corp. 187,000 11/24/2015 Eaton Corporation 794,295 11/24/2015 First Industrial, L.P. 5,545,600 11/24/2015 Garden State Bobcat, Inc. 343,732 11/24/2015 Greelco Inc. 1,500,000 11/24/2015 Greenman-Pedersen, Inc. 1,435,000 11/24/2015 HNTB Corporation 43,500,000 11/24/2015 IBM Corporation 615,099 11/24/2015 Jen Electric Inc. 330,664 11/24/2015 Longford Landscapes and Excavation, Inc. 156,000 11/24/2015 Madison Plumbing Heating and Industrial Supply 250,000 11/24/2015 Michael Baker International, Inc. 1,130,000 11/24/2015 Mid-Atlantic Truck Center 290,975 11/24/2015 Milford Lakeview Realty LLC 715,000 11/24/2015 Route 23 Auto Mall LLC 282,508 12/15/2015 Acro Services Corporation 125,000 12/15/2015 Alna Construction Corp. 3,999,000 12/15/2015 Beyer Ford, LLC 385,902 12/15/2015 Bristol Donald Co. Inc. 146,249 12/15/2015 CB&I Environmental & Infrastructure Inc. 1,900,000 12/15/2015 Cherry Weber & Associates 1,030,000 12/15/2015 Dobco Inc. 56,893,382 12/15/2015 ePlus Technology Inc. 2,700,000 12/15/2015 Gannett Fleming Inc. 1,529,537 12/15/2015 HAKS Engineering 1,269,387 12/15/2015 Jesco, Inc. 1,075,970 12/15/2015 Johnson Mirmiran & Thompson Inc. 2,000,000 12/15/2015 Joseph M. Sanzari, Inc. 8,674,515 12/15/2015 Joseph M. Sanzari, Inc. 5,139,445 12/15/2015 Kapsch TrafficCom IVHS Inc. 10,000,000 12/15/2015 KS Engineers 1,217,664
Vendor
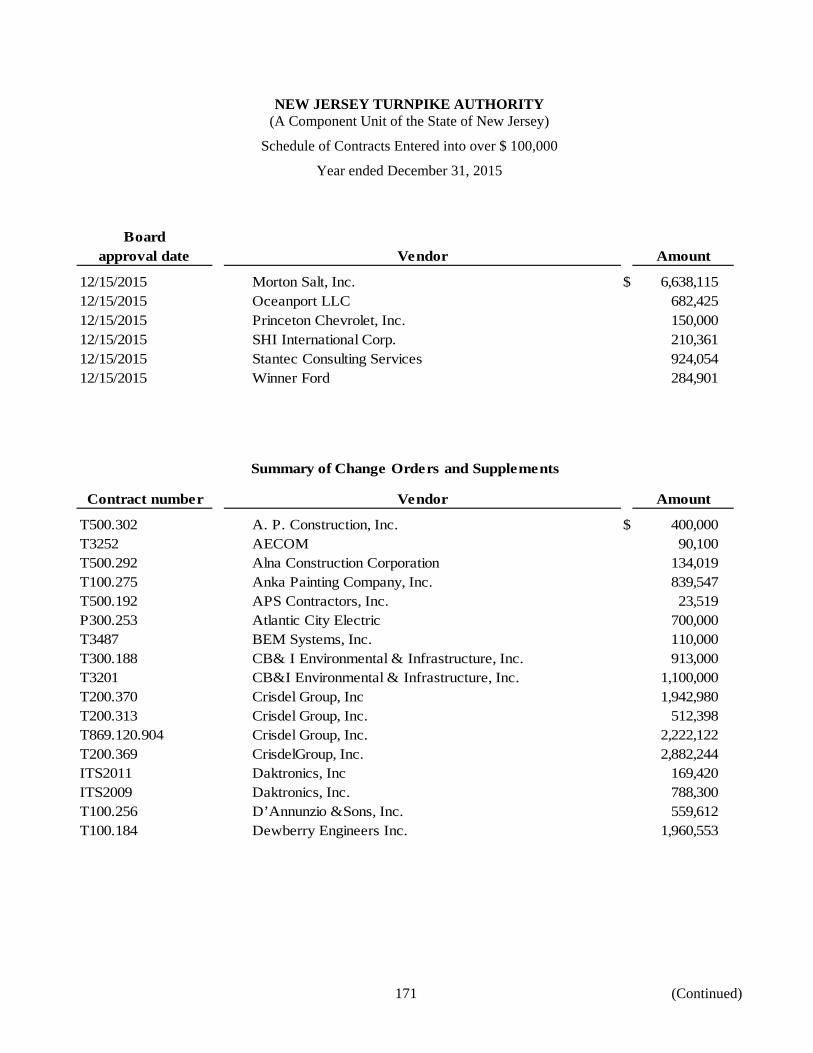
NEW JERSEY TURNPIKE AUTHORITY (A Component Unit of the State of New Jersey)
Schedule of Contracts Entered into over $ 100,000
Year ended December 31, 2015
171 (Continued)
Boardapproval date Amount
12/15/2015 Morton Salt, Inc. $ 6,638,115 12/15/2015 Oceanport LLC 682,425 12/15/2015 Princeton Chevrolet, Inc. 150,000 12/15/2015 SHI International Corp. 210,361 12/15/2015 Stantec Consulting Services 924,054 12/15/2015 Winner Ford 284,901
Vendor
Contract number Amount
T500.302 A. P. Construction, Inc. $ 400,000 T3252 AECOM 90,100 T500.292 Alna Construction Corporation 134,019 T100.275 Anka Painting Company, Inc. 839,547 T500.192 APS Contractors, Inc. 23,519 P300.253 Atlantic City Electric 700,000 T3487 BEM Systems, Inc. 110,000 T300.188 CB& I Environmental & Infrastructure, Inc. 913,000 T3201 CB&I Environmental & Infrastructure, Inc. 1,100,000 T200.370 Crisdel Group, Inc 1,942,980 T200.313 Crisdel Group, Inc. 512,398 T869.120.904 Crisdel Group, Inc. 2,222,122 T200.369 CrisdelGroup, Inc. 2,882,244 ITS2011 Daktronics, Inc 169,420 ITS2009 Daktronics, Inc. 788,300 T100.256 D’Annunzio &Sons, Inc. 559,612 T100.184 Dewberry Engineers Inc. 1,960,553
Vendor
Summary of Change Orders and Supplements
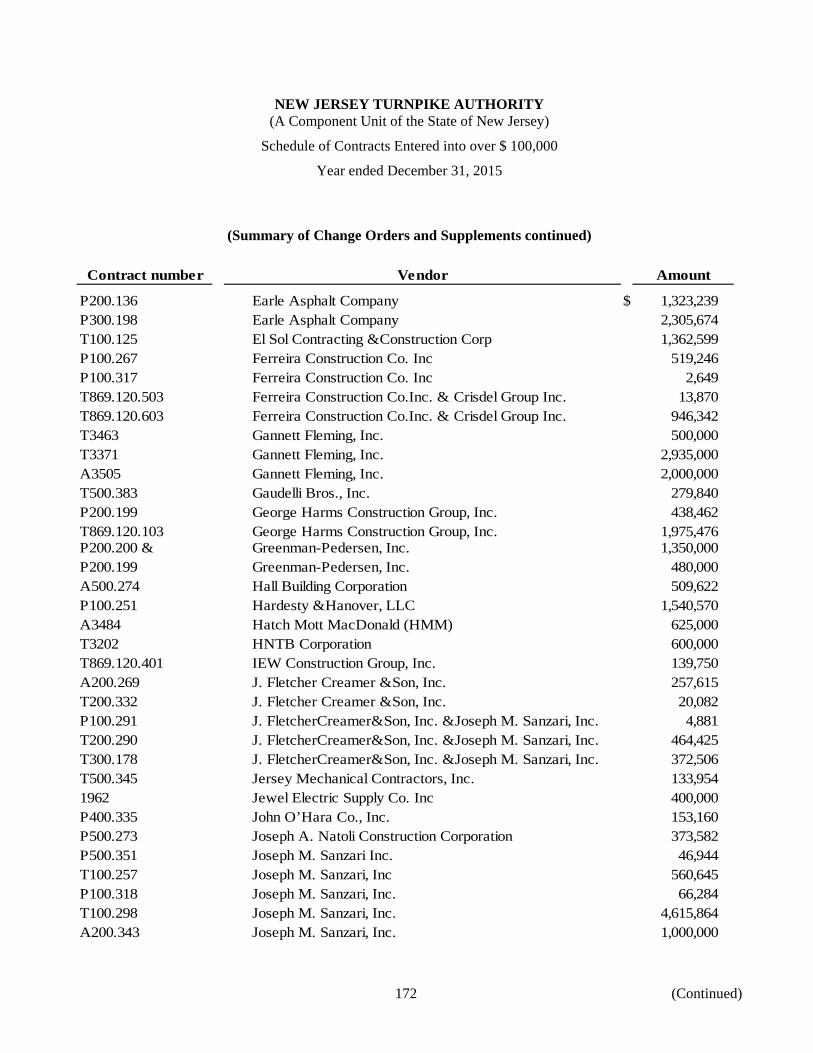
NEW JERSEY TURNPIKE AUTHORITY (A Component Unit of the State of New Jersey)
Schedule of Contracts Entered into over $ 100,000
Year ended December 31, 2015
172 (Continued)
(Summary of Change Orders and Supplements continued)
Contract number Amount
P200.136 Earle Asphalt Company $ 1,323,239 P300.198 Earle Asphalt Company 2,305,674 T100.125 El Sol Contracting &Construction Corp 1,362,599 P100.267 Ferreira Construction Co. Inc 519,246 P100.317 Ferreira Construction Co. Inc 2,649 T869.120.503 Ferreira Construction Co.Inc. & Crisdel Group Inc. 13,870 T869.120.603 Ferreira Construction Co.Inc. & Crisdel Group Inc. 946,342 T3463 Gannett Fleming, Inc. 500,000 T3371 Gannett Fleming, Inc. 2,935,000 A3505 Gannett Fleming, Inc. 2,000,000 T500.383 Gaudelli Bros., Inc. 279,840 P200.199 George Harms Construction Group, Inc. 438,462 T869.120.103 George Harms Construction Group, Inc. 1,975,476 P200.200 & Greenman-Pedersen, Inc. 1,350,000 P200.199 Greenman-Pedersen, Inc. 480,000 A500.274 Hall Building Corporation 509,622 P100.251 Hardesty &Hanover, LLC 1,540,570 A3484 Hatch Mott MacDonald (HMM) 625,000 T3202 HNTB Corporation 600,000 T869.120.401 IEW Construction Group, Inc. 139,750 A200.269 J. Fletcher Creamer &Son, Inc. 257,615 T200.332 J. Fletcher Creamer &Son, Inc. 20,082 P100.291 J. FletcherCreamer&Son, Inc. &Joseph M. Sanzari, Inc. 4,881 T200.290 J. FletcherCreamer&Son, Inc. &Joseph M. Sanzari, Inc. 464,425 T300.178 J. FletcherCreamer&Son, Inc. &Joseph M. Sanzari, Inc. 372,506 T500.345 Jersey Mechanical Contractors, Inc. 133,954 1962 Jewel Electric Supply Co. Inc 400,000 P400.335 John O’Hara Co., Inc. 153,160 P500.273 Joseph A. Natoli Construction Corporation 373,582 P500.351 Joseph M. Sanzari Inc. 46,944 T100.257 Joseph M. Sanzari, Inc 560,645 P100.318 Joseph M. Sanzari, Inc. 66,284 T100.298 Joseph M. Sanzari, Inc. 4,615,864 A200.343 Joseph M. Sanzari, Inc. 1,000,000
Vendor
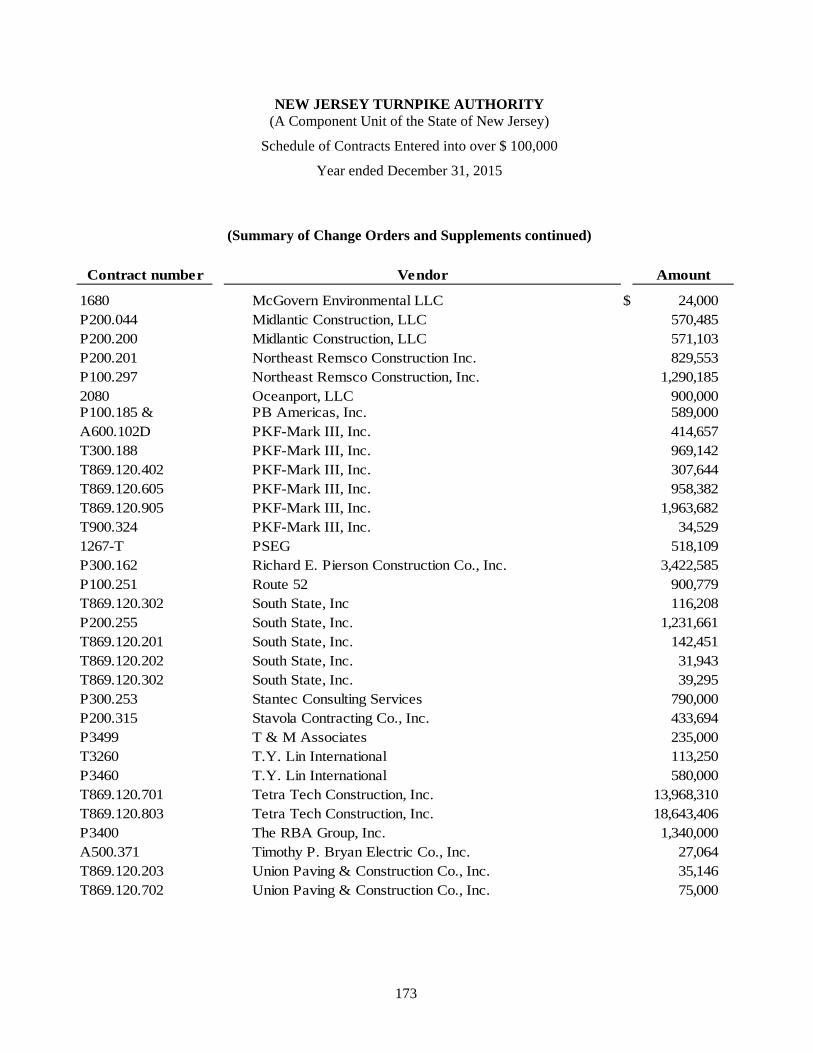
NEW JERSEY TURNPIKE AUTHORITY (A Component Unit of the State of New Jersey)
Schedule of Contracts Entered into over $ 100,000
Year ended December 31, 2015
173
(Summary of Change Orders and Supplements continued)
Contract number Amount
1680 McGovern Environmental LLC $ 24,000 P200.044 Midlantic Construction, LLC 570,485 P200.200 Midlantic Construction, LLC 571,103 P200.201 Northeast Remsco Construction Inc. 829,553 P100.297 Northeast Remsco Construction, Inc. 1,290,185 2080 Oceanport, LLC 900,000 P100.185 & PB Americas, Inc. 589,000 A600.102D PKF-Mark III, Inc. 414,657 T300.188 PKF-Mark III, Inc. 969,142 T869.120.402 PKF-Mark III, Inc. 307,644 T869.120.605 PKF-Mark III, Inc. 958,382 T869.120.905 PKF-Mark III, Inc. 1,963,682 T900.324 PKF-Mark III, Inc. 34,529 1267-T PSEG 518,109 P300.162 Richard E. Pierson Construction Co., Inc. 3,422,585 P100.251 Route 52 900,779 T869.120.302 South State, Inc 116,208 P200.255 South State, Inc. 1,231,661 T869.120.201 South State, Inc. 142,451 T869.120.202 South State, Inc. 31,943 T869.120.302 South State, Inc. 39,295 P300.253 Stantec Consulting Services 790,000 P200.315 Stavola Contracting Co., Inc. 433,694 P3499 T & M Associates 235,000 T3260 T.Y. Lin International 113,250 P3460 T.Y. Lin International 580,000 T869.120.701 Tetra Tech Construction, Inc. 13,968,310 T869.120.803 Tetra Tech Construction, Inc. 18,643,406 P3400 The RBA Group, Inc. 1,340,000 A500.371 Timothy P. Bryan Electric Co., Inc. 27,064 T869.120.203 Union Paving & Construction Co., Inc. 35,146 T869.120.702 Union Paving & Construction Co., Inc. 75,000
Vendor