New Jersey Educational Facilities Authority (A … Financial Statements...5 The following table...
41
F INANCIAL S TATEMENTS AND S UPPLEMENTAL F INANCIAL I NFORMATION New Jersey Educational Facilities Authority (A Component Unit of the State of New Jersey) Year Ended December 31, 2008 With Report of Independent Auditors
Transcript of New Jersey Educational Facilities Authority (A … Financial Statements...5 The following table...
F I N A N C I A L S T A T E M E N T S A N D S U P P L E M E N T A L F I N A N C I A L I N F O R M A T I O N
New Jersey Educational Facilities Authority (A Component Unit of the State of New Jersey) Year Ended December 31, 2008 With Report of Independent Auditors
New Jersey Educational Facilities Authority (A Component Unit of the State of New Jersey)
Financial Statements and
Supplemental Financial Information
December 31, 2008
Contents
Report of Management ....................................................................................................................1 Report of Independent Auditors.......................................................................................................2 Management’s Discussion and Analysis .........................................................................................4 Basic Financial Statements Balance Sheets .................................................................................................................................7 Statements of Revenues, Expenses and Changes in Fund Net Assets.............................................8 Statements of Cash Flows................................................................................................................9 Notes to Financial Statements........................................................................................................10 Required Supplementary Information Schedule of Funding Progress .......................................................................................................19 Supplemental Financial Information Balance Sheets - Trustee Held Funds ............................................................................................20 Statements of Changes in Trustee Held Funds ..............................................................................21 Notes to Supplemental Financial Statements.................................................................................22 Report on Internal Control Over Financial Reporting and on Compliance
and Other Matters Based on an Audit of the Financial Statements Performed In Accordance with Government Auditing Standards ................................................................36
1
2
Report of Independent Auditors
To the Members of the New Jersey Educational Facilities Authority We have audited the accompanying balance sheets of the New Jersey Educational Facilities Authority, a component unit of the State of New Jersey, as of December 31, 2008 and 2007, and the related statements of revenues, expenses and changes in fund net assets, and cash flows for the years then ended. These financial statements are the responsibility of the Authority’s management. Our responsibility is to express an opinion on these financial statements based on our audits.
We conducted our audits in accordance with auditing standards generally accepted in the United States and the standards applicable to financial audits contained in Government Auditing Standards, issued by the Comptroller General of the United States. Those standards require that we plan and perform the audit to obtain reasonable assurance about whether the financial statements are free of material misstatement. An audit includes consideration of internal control over financial reporting as a basis for designing audit procedures that are appropriate in the circumstances, but not for the purpose of expressing an opinion on the effectiveness of the Authority’s internal control over financial reporting. Accordingly, we express no such opinion. An audit also includes examining, on a test basis, evidence supporting the amounts and disclosures in the financial statements, assessing the accounting principles used and significant estimates made by management, and evaluating the overall financial statement presentation. We believe that our audits provide a reasonable basis for our opinion.
In our opinion, the financial statements referred to above present fairly, in all material respects, the financial position of the New Jersey Educational Facilities Authority as of December 31, 2008 and 2007, and the changes in its financial position and its cash flows for the years then ended in conformity with accounting principles generally accepted in the United States.
In accordance with Government Auditing Standards, we have also issued our report dated March 18, 2009, on our consideration of the Authority’s internal control over financial reporting and on our tests of its compliance with certain provisions of laws, regulations, contracts, and grant agreements and other matters. The purpose of that report is to describe the scope of our testing of internal control over financial reporting and compliance and the results of that testing, and not to provide an opinion on the internal control over financial reporting or on compliance. That report is an integral part of an audit performed in accordance with Government Auditing Standards and should be considered in assessing the results of our audit.
A member firm of Ernst & Young Global Limited
Ernst & Young LLP MetroPark 99 Wood Avenue South P.O. Box 751 Iselin, New Jersey 08830-0471
Tel: 1 732 516 4100 www.ey.com
3
Management’s discussion and analysis and the schedule of funding progress, on pages 4 to 6, and page 19, respectively are not a required part of the basic financial statements but are supplementary information required by the Governmental Accounting Standards Board. We have applied certain limited procedures, which consisted principally of inquiries of management regarding methods of measurement and presentation of this required supplementary information. However, we did not audit the information and express no opinion on it.
Our audits were conducted for the purpose of forming an opinion on the basic financial statements taken as a whole. The supplemental financial information is presented for purposes of additional analysis and is not a required part of the basic financial statements. Such information has been subjected to the auditing procedures applied in the audit of the basic financial statements and, in our opinion, is fairly stated, in all material respects, in relation to the basic financial statements taken as a whole.
ey March 18, 2009

4
New Jersey Educational Facilities Authority (A Component Unit of the State of New Jersey)
Management’s Discussion and Analysis
Year Ended December 31, 2008
Introduction
This section of the New Jersey Educational Facilities Authority’s (the Authority’s) annual financial report presents management’s discussion and analysis of the Authority’s financial performance during the fiscal year ended December 31, 2008 and the two immediately preceding years. It should be read in conjunction with the Authority’s financial statements and accompanying notes.
Overview of the Financial Statements
The Authority is supported entirely by fees charged for the services it provides. Accordingly, the Authority is considered an Enterprise Fund and utilizes the accrual basis of accounting. The Basic Financial Statements for an Enterprise Fund include: Balance Sheets; Statements of Revenues, Expenses and Changes in Fund Net Assets; and Statements of Cash Flows. These statements provide, respectively, a view of the Authority’s financial position as of the end of the year, a description of the financial activity during the year, and a description of the cash activity during the year.
Condensed Financial Information
The following table represents condensed balance sheet information and changes between December 31, 2007 and December 31, 2008 and between December 31, 2006 and December 31, 2008:
2008 2007 2006
Increase (Decrease)
2007 to 2008
Increase (Decrease)
2006 to 2008 Current assets $ 9,686,984 $ 10,905,763 $ 9,242,534 (11.18%) 4.81% Noncurrent assets 210,313 243,907 274,089 (13.77%) (23.27%) Total assets 9,897,297 11,149,670 9,516,623 (11.23%) 4.00% Current liabilities 334,945 289,182 273,500 15.82% 22.47% Noncurrent liabilities 132,021 2,441,484 2,390,529 (94.59%) (94.48%) Total liabilities 466,966 2,730,666 2,664,029 (82.90%) (82.47%) Total net assets $ 9,430,331 $ 8,419,004 $ 6,852,594 12.01% 37.62%

5
The following table represents condensed information from the Statements of Revenues, Expenses, and Changes in Fund Net Assets, and changes between 2007 and 2008 and between 2006 and 2008:
2008 2007 2006
Increase (Decrease)
2007 to 2008
Increase (Decrease)
2006 to 2008 Operating revenues:
Administrative fees $ 3,351,932 $ 3,824,201 $ 4,037,789 (12.35%) (16.99%) Total operating revenues 3,351,932 3,824,201 4,037,789 (12.35%) (16.99%) Operating expenses:
Salaries and related expenses 1,817,110 1,565,108 1,585,051 16.10% 14.64% Provision for (benefit from)
postemployment benefits (220,790) 155,570 1,069,835 – – General expenses 967,372 972,264 1,036,157 (0.50%) (6.64%)
Total operating expenses 2,563,692 2,692,942 3,691,043 (4.80%) (30.54%) Net operating income 788,240 1,131,259 346,746 (30.32%) 127.32% Nonoperating revenues
(expenses): Investment income 223,087 439,498 334,709 (49.24%) (33.35%) Loss on asset disposal – (4,347) – (100.00%) N/A
Change in net assets 1,011,327 1,566,410 681,455 (35.44%) 48.41% Net assets beginning of year 8,419,004 6,852,594 6,171,139 22.86% 36.43% Net assets end of year $ 9,430,331 $ 8,419,004 $ 6,852,594 12.01% 37.62%
Analysis of Overall Financial Position and Results of Operations
The Authority’s solid financial position and strong operating results continued.
Financial Highlights:
• 2008 financing activity set a new record of over $1.2 billion of debt issued for educational institutions.
• Net Assets increased $1,011,327, or 12.0% in 2008.
6
• The Authority’s 2008 operating margin (operating income as a percentage of operating revenues) was 23.5%.
• At 12/31/2008, Net Assets represent 3.68 times 2008 Total Operating Expenses.
During 2008 and 2007, demand for the Authority’s services remained strong and its financing activity continued at record levels. Amid the turbulence in the financial markets during 2008, the Authority worked with New Jersey’s colleges and universities to restructure those issues most affected. The State’s public and private institutions have continued to invest in the upgrading of their capital facilities, technology infrastructures and capital equipment to accommodate growing demand for higher education.
Revenues
The Authority’s revenues are derived primarily from two fees; annual fees charged to existing bond issues, and initial fees charged with respect to the issuance of new debt. Although total issuance continues to increase, total revenues for 2008 decreased 12.4% and 17.0% from 2007 and 2006, respectively. These decreases are the result of the Authority’s decision not to charge initial fees on restructuring issues in 2008 and the 20% rate reduction implemented in 2007.
Expenses
Despite another record-setting year in financing activities, operating expenses in 2008 decreased 4.8% and 30.5% from 2007 and 2006, respectively. The decreases in operating expenses are primarily related to reductions in the provisions for postemployment benefits.
Assets and Liabilities
Net assets increased $1.0 million, or 12.0% from 2007 to 2008 and $2.6 million, or 37.6% from 2006 to 2008. Additionally, during 2008 the Authority established and funded a trust for postemployment benefits in the amount of $2.0 million, thus reducing the liability on its balance sheet.
Contacting the Authority’s Financial Management
If you have questions about this report or need additional financial information, contact the Office of the Controller, New Jersey Educational Facilities Authority, 103 College Road East, Princeton, NJ 08540-6612. Readers are invited to visit the Authority’s website at www.njefa.com.
7
New Jersey Educational Facilities Authority (A Component Unit of the State of New Jersey)
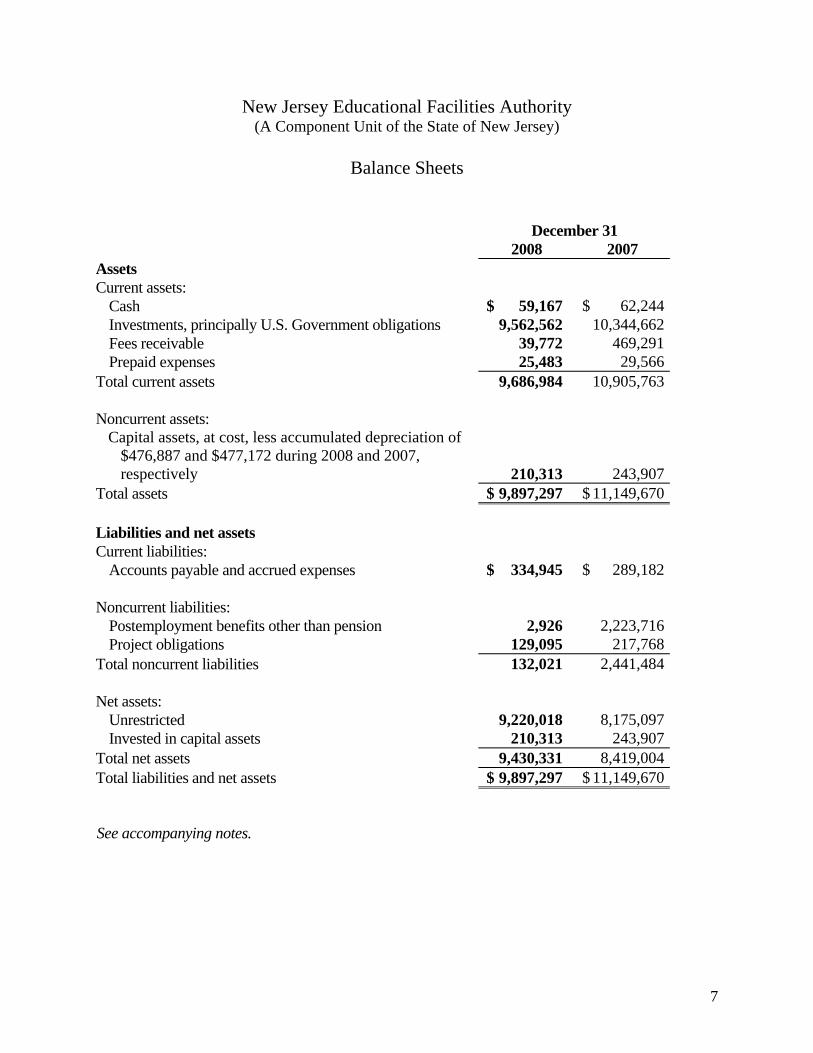
Balance Sheets
December 31 2008 2007 Assets Current assets:
Cash $ 59,167 $ 62,244Investments, principally U.S. Government obligations 9,562,562 10,344,662Fees receivable 39,772 469,291Prepaid expenses 25,483 29,566
Total current assets 9,686,984 10,905,763 Noncurrent assets:
Capital assets, at cost, less accumulated depreciation of $476,887 and $477,172 during 2008 and 2007, respectively 210,313 243,907
Total assets $ 9,897,297 $ 11,149,670 Liabilities and net assets Current liabilities:
Accounts payable and accrued expenses $ 334,945 $ 289,182
Noncurrent liabilities: Postemployment benefits other than pension 2,926 2,223,716Project obligations 129,095 217,768
Total noncurrent liabilities 132,021 2,441,484 Net assets:
Unrestricted 9,220,018 8,175,097Invested in capital assets 210,313 243,907
Total net assets 9,430,331 8,419,004Total liabilities and net assets $ 9,897,297 $ 11,149,670 See accompanying notes.

8
New Jersey Educational Facilities Authority (A Component Unit of the State of New Jersey)
Statements of Revenues, Expenses and
Changes in Fund Net Assets
Year Ended December 31 2008 2007
Operating revenues:
Administrative fees $ 3,351,932 $ 3,824,201 Total operating revenues 3,351,932 3,824,201 Operating expenses:
Salaries and related expenses 1,817,110 1,565,108 General and administrative expenses 792,909 834,373 Provision for (benefit from) postemployment benefits (220,790) 155,570 Professional fees 174,463 137,891
Total operating expenses 2,563,692 2,692,942 Net operating income 788,240 1,131,259 Nonoperating revenue (expense):
Investment income 223,087 439,498 Loss on asset disposal – (4,347)
Net changes in net assets 1,011,327 1,566,410 Net assets at beginning of year 8,419,004 6,852,594 Net assets at end of year $ 9,430,331 $ 8,419,004 See accompanying notes.

9
New Jersey Educational Facilities Authority (A Component Unit of the State of New Jersey)
Statements of Cash Flows
Year Ended December 31 2008 2007 Cash flows from operating activities Cash received from administrative fees $ 3,781,451 $ 3,488,587 Cash payments for operating expenses (4,744,442) (2,542,386)Net cash (used in) provided by operating activities (962,991) 946,201 Cash flows from investing activities Purchase of investments (18,412,872) (19,680,043)Sale and maturity of investments 19,146,172 18,354,543 Investment income 271,887 446,565 Net cash provided by (used in) investing activities 1,005,187 (878,935) Cash flows from capital and related financing activities Purchase of capital assets (45,273) (58,169)Net cash used in capital and related financing activities (45,273) (58,169) Net (decrease) increase in cash (3,077) 9,097 Cash at beginning of year 62,244 53,147 Cash at end of year $ 59,167 $ 62,244 Reconciliation of net operating income to net cash (used in) provided by operating activities:
Net operating income $ 788,240 $ 1,131,259 Adjustments to reconcile operating income to net cash (used in) provided by operating activities:
Depreciation 78,867 84,004 Changes in assets and liabilities:
Fees receivable and prepaids 433,602 (335,699)Accounts payable 45,763 15,682 Project obligations (88,673) (83,160)Postemployment benefits obligation (2,220,790) 134,115
Net cash (used in) provided by operating activities $ (962,991) $ 946,201 Supplemental schedule of noncash investing activities Change in fair value of investments $ (48,800) $ (7,067) See accompanying notes.

New Jersey Educational Facilities Authority (A Component Unit of the State of New Jersey)
Notes to Financial Statements
December 31, 2008
10
1. Organization and Function of the Authority
The New Jersey Educational Facilities Authority (the “Authority”), a component unit of the State of New Jersey, was created under the provisions of Chapter 106 of New Jersey Public Laws of 1966 as a public body corporate and politic. The powers of the Authority permit the sale of notes, bonds and other obligations to support the construction, acquisition and equipping of educational facilities for public and private institutions of higher education in the State of New Jersey. The Authority is also authorized, pursuant to statutory amendments, to issue State supported bonds to fund matching grants to qualified public libraries for capital improvements. The obligations issued by the Authority are not guaranteed by, nor do they constitute a debt or obligation of, the State of New Jersey.
The Authority is exempt from both federal and state taxes.
2. Significant Accounting Policies
The accounts are maintained on the accrual basis of accounting in conformity with accounting principles generally accepted in the United States.
In its accounting and financial reporting, the Authority follows the pronouncements of the Governmental Accounting Standards Board (GASB). Private-sector standards of accounting and financial reporting issued prior to December 1, 1989 are followed by the Authority to the extent that those standards do not conflict with or contradict guidance of the GASB.
Administrative Fees
The Authority charges administrative fees to its client institutions for which bond and note sales have been completed. Such fees are considered operating revenue and are charged for services related to the structuring and administration of Authority financings, investment management of bond proceeds, monitoring of financial performance and other project costs and services. These fees are recognized as earned. The fees are used to provide sufficient funds to ensure that the Authority’s operating expenses will be met, and that sufficient reserves will be available to provide for the Authority’s needs.
Depreciation
Furniture and equipment are carried at cost and depreciated over their useful lives using the straight-line method.

New Jersey Educational Facilities Authority (A Component Unit of the State of New Jersey)
Notes to Financial Statements (continued)
11
3. Cash and Investments
At year-end, the Authority’s bank balance was $94,131 all of which was covered by FDIC insurance.
The types of securities which are permitted investments for Authority funds are established by New Jersey Statutes. All funds of the Authority may be invested in obligations of, or guaranteed by, the United States Government. In addition, certain funds of the Authority may be invested in: obligations of agencies of the U.S. government; obligations of, or guaranteed by, the State of New Jersey; collateralized certificates of deposit and repurchase agreements; commercial paper; and other securities which shall be authorized for the investment of funds in the custody of the Treasurer of the State of New Jersey.
Investments of the Authority comprise the following:
2008 2007 Investments:
U.S. Treasury Bills $ 9,560,395 $10,297,370 Money Market Mutual Fund 2,167 47,292
Total investments $ 9,562,562 $10,344,662 In 2008 and 2007, the Authority had $2,167 and $47,292, respectively, invested in a money market mutual fund, which invests in short-term and other obligations of the U.S. Treasury. All investments are carried at fair value.
In accordance with Governmental Accounting Standards Board Statement No. 40 “Deposit and Investment Risk Disclosures” (“GASB 40”), the Authority has assessed the Custodial Credit Risk, the Concentration of Credit Risk, Credit Risk and Interest Rate Risk of its Cash and Investments.
(a) Custodial Credit Risk – The Authority’s deposits are exposed to custodial credit risk if they are not covered by depository insurance and the deposits are: uncollateralized, collateralized with securities held by the pledging financial institution, or collateralized with securities held by the pledging financial institution’s trust department or agent but not in the depositor-government’s name. The deposit risk is that, in the event of the

New Jersey Educational Facilities Authority (A Component Unit of the State of New Jersey)
Notes to Financial Statements (continued)
12
3. Cash and Investments (continued)
failure of a depository financial institution, the Authority will not be able to recover deposits or will not be able to recover collateral securities that are in the possession of an outside party. The Authority’s investment securities are exposed to custodial credit risk if the securities are uninsured, are not registered in the name of the Authority and are held by either: the counterparty or the counterparty’s trust department or agent but not in the Authority’s name. The investment risk is that, in the event of the failure of the counterparty to a transaction, the Authority will not be able to recover the value of the investment or collateral securities that are in the possession of an outside party.
At December 31, 2008 and 2007, the Authority’s bank balances were not exposed to custodial credit risk since the full amount was covered by FDIC insurance.
As of December 31, 2008 and 2007, the Authority’s investments consisted of U.S. Treasury Bills in the amount of $9,560,395 and $10,297,370, respectively. Since the investments are registered in the Authority’s name they are not exposed to custodial credit risk. The Authority does not have a written policy for investment securities custodial credit risk but its practice has been to maintain a safekeeping account for the securities at a financial institution.
(b) Concentration of Credit Risk – This is the risk associated with the amount of investments the Authority has with any one issuer that exceed five percent of its total investments. Investments issued or explicitly guaranteed by the U.S. government and investments in mutual funds, external investment pools, and other pooled investments are excluded from this requirement. The Authority places no limit on the amount it may invest in any one issuer, but its practice has been to invest, almost exclusively, in U.S. Treasury Securities. At December 31, 2008 or 2007, the Authority was not exposed to a concentration of credit risk.
(c) Credit Risk – GASB 40 requires that disclosure be made as to the credit rating of all debt security investments except for obligations of the U.S. government or obligations explicitly guaranteed by the U.S. government. This is the risk that an issuer or other counterparty to an investment will not fulfill its obligations. In general, the Authority does not have an investment policy regarding credit risk except to the extent previously outlined under the Authority’s investment policy. The Authority’s Money Market Mutual Fund is not rated.
New Jersey Educational Facilities Authority (A Component Unit of the State of New Jersey)
Notes to Financial Statements (continued)
13
3. Cash and Investments (continued)
(d) Interest Rate Risk – This is the risk that changes in interest rates will adversely affect the fair value of an investment. The Authority does not have a written policy that limits investment maturities as a means of managing its exposure to fair value losses arising from interest rate fluctuations, but the Authority does from time to time evaluate its investment portfolio to determine if, based on the interest rate environment, other investment vehicles would provide higher yields that lower the cost and risk. As of December 31, 2008, the U.S. Treasury Bills had maturities ranging from January 2, 2009 through July 2, 2009.
For the years ended December 31, 2008 and 2007, investment income comprised the following:
2008 2007 Interest earnings $ 271,887 $ 446,565 Net decrease in fair value of investments (48,800) (7,067) $ 223,087 $ 439,498
4. Retirement Plans
The Authority’s employees participate in the Public Employees Retirement System of New Jersey (PERS), a cost sharing multiple-employer defined benefit plan. The Authority’s contribution is determined by State statute and is based upon an actuarial computation performed by the PERS. The Authority’s required contribution and pension expense for the years ended December 31, 2008, 2007 and 2006 was $77,042, $40,057 and $19,112, respectively. Employees of the Authority also contribute a percentage of their wages to the pension system; the percentage range of contributions, as determined by PERS, was 5.5% for 2008, 5.0% to 5.5% for 2007 and 5% for 2006.
The PERS is administered by the New Jersey Division of Pensions and Benefits. The Division issues a publicly available financial report that includes financial statements and required supplementary information. That report may be obtained by writing to: State of New Jersey, Division of Pensions and Benefits, PO Box 295, Trenton, New Jersey, 08625-0295.
Employees hired after July 1, 2007 participate in PERS, the defined benefit plan, up to the annual maximum wage for social security. The employee contributions based on wages in excess of the

New Jersey Educational Facilities Authority (A Component Unit of the State of New Jersey)
Notes to Financial Statements (continued)
14
4. Retirement Plans (continued)
annual maximum wage are contributed to the Defined Contribution Retirement Program (DCRP). The Authority contributes 3% to the participants’ accounts on wages in excess of the social security limit.
In addition to the Plans noted above, employees may elect to make tax-deferred contributions to a 457 deferred compensation plan.
5. Postemployment Benefits Other than Pension
The Authority, as permitted by Chapter 88, P.L. 1974 as amended by Chapter 436, P.L. 1981, provides postemployment medical benefits for eligible retired employees through participation in the New Jersey Health Benefits Program as sponsored and administered by the State of New Jersey. The Authority does not issue a publicly available financial report for the plan which for financial reporting purposes is considered a single employer defined benefit health care plan. Employees become eligible for these benefits upon retirement after 25 years of creditable service in the PERS.
Benefit provisions for the plan are established and amended by the Authority’s Members, and there is no statutory requirement for the Authority to continue this plan for future Authority employees. The plan is a non-contributory plan with all payments for plan benefits being funded by the Authority.
During 2006, the Authority adopted the accounting provisions of GASB Statement No. 45, Accounting and Financial Reporting by Employers for Postemployment Benefits Other Than Pensions. This statement establishes guidelines for reporting costs associated with “other postemployment benefits” (OPEB). OPEB costs are actuarially calculated based on benefits (other than pensions), that current and retired employees have accrued as a result of their respective years of employment service.
The Authority’s annual OPEB cost for the plan is calculated based on the annual required contribution “ARC”, an amount actuarially determined in accordance with the parameters of GASB Statement 45. The ARC represents a level of funding that, if paid on an ongoing basis, is projected to cover normal costs each year and to amortize any unfunded actuarial liabilities (or

New Jersey Educational Facilities Authority (A Component Unit of the State of New Jersey)
Notes to Financial Statements (continued)
15
5. Postemployment Benefits Other than Pension (continued)
funding excess) over a period not to exceed thirty years. The Authority’s annual OPEB cost for the year ended December 31, 2008 and 2007 and the related information for the plan are as follows (dollar amounts in thousands):
2008 2007 Annual required contribution (benefit) $ (221) $ 156 Contributions made – payment for benefits during year (2,000) (22) (Decrease) increase in net OPEB obligation (2,221) 134 Net OPEB obligation – beginning of year 2,224 2,090 Net OPEB obligation – end of year $ 3 $ 2,224
The Authority’s annual OPEB cost, the percentage of annual OPEB cost contributed to the plan and the net OPEB obligations for fiscal years 2006 through 2008 were as follows (dollar amounts in thousands):
Fiscal Year Ended
Annual OPEB Cost
(Benefit)
Percentage of Annual OPEB
Cost Contributed Net OPEB Obligation
December 31, 2006 $ 1,070 1.96% $ 2,090 December 31, 2007 $ 156 14.20% $ 2,224 December 31, 2008 $ (221) N/A $ 3
As of December 31, 2008 and 2007, the actuarial liability for benefits was $2,002,926 and $2,223,716, respectively. In April 2008, the Authority established and funded an irrevocable trust in the amount of $2,000,000. At December 31, 2008 the fair value of this trust fund was $2,007,536 which, due to the establishment of the trust, is no longer reported as a liability on the Authority’s books.
The most recent actuarial valuation date is January 1, 2008. Actuarial valuations involve estimates of the value of reported amounts and assumptions about the probability of events in the future. Amounts determined regarding the funded status of the plan and the annual required contributions of the employer are subject to continual revision as actual results are compared to
New Jersey Educational Facilities Authority (A Component Unit of the State of New Jersey)
Notes to Financial Statements (continued)
16
5. Postemployment Benefits Other Than Pension (continued)
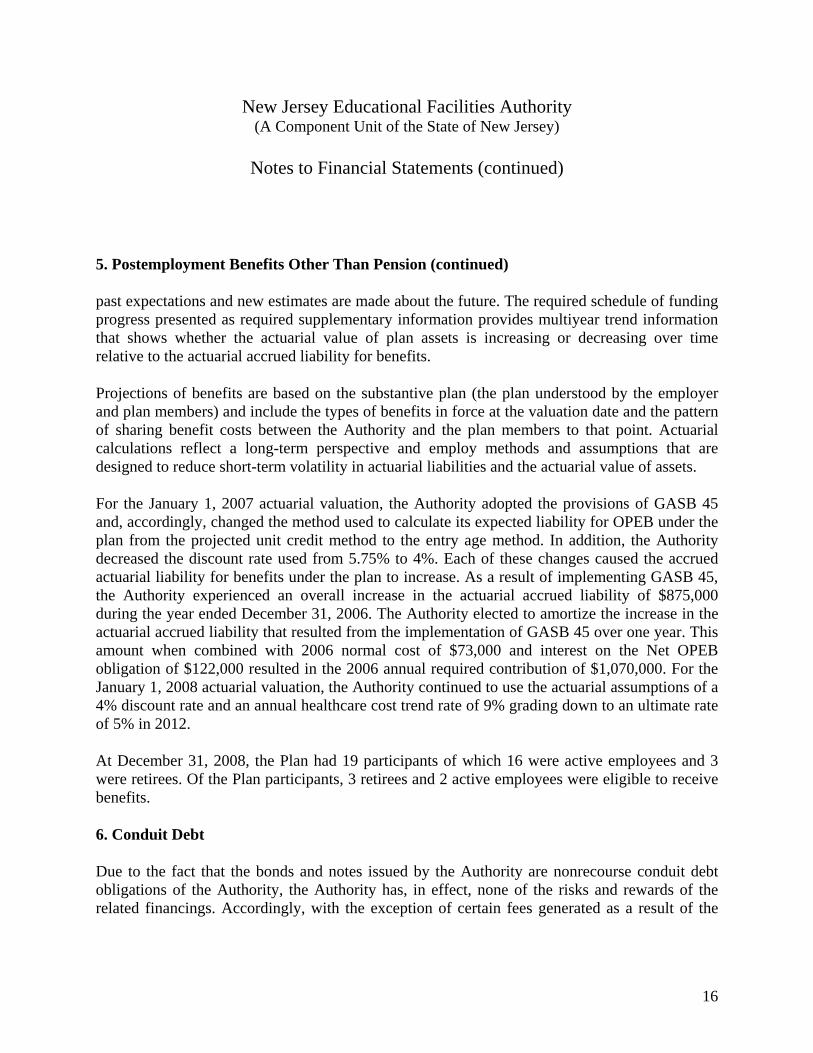
past expectations and new estimates are made about the future. The required schedule of funding progress presented as required supplementary information provides multiyear trend information that shows whether the actuarial value of plan assets is increasing or decreasing over time relative to the actuarial accrued liability for benefits.
Projections of benefits are based on the substantive plan (the plan understood by the employer and plan members) and include the types of benefits in force at the valuation date and the pattern of sharing benefit costs between the Authority and the plan members to that point. Actuarial calculations reflect a long-term perspective and employ methods and assumptions that are designed to reduce short-term volatility in actuarial liabilities and the actuarial value of assets.
For the January 1, 2007 actuarial valuation, the Authority adopted the provisions of GASB 45 and, accordingly, changed the method used to calculate its expected liability for OPEB under the plan from the projected unit credit method to the entry age method. In addition, the Authority decreased the discount rate used from 5.75% to 4%. Each of these changes caused the accrued actuarial liability for benefits under the plan to increase. As a result of implementing GASB 45, the Authority experienced an overall increase in the actuarial accrued liability of $875,000 during the year ended December 31, 2006. The Authority elected to amortize the increase in the actuarial accrued liability that resulted from the implementation of GASB 45 over one year. This amount when combined with 2006 normal cost of $73,000 and interest on the Net OPEB obligation of $122,000 resulted in the 2006 annual required contribution of $1,070,000. For the January 1, 2008 actuarial valuation, the Authority continued to use the actuarial assumptions of a 4% discount rate and an annual healthcare cost trend rate of 9% grading down to an ultimate rate of 5% in 2012.
At December 31, 2008, the Plan had 19 participants of which 16 were active employees and 3 were retirees. Of the Plan participants, 3 retirees and 2 active employees were eligible to receive benefits.
6. Conduit Debt
Due to the fact that the bonds and notes issued by the Authority are nonrecourse conduit debt obligations of the Authority, the Authority has, in effect, none of the risks and rewards of the related financings. Accordingly, with the exception of certain fees generated as a result of the

New Jersey Educational Facilities Authority (A Component Unit of the State of New Jersey)
Notes to Financial Statements (continued)
17
6. Conduit Debt (continued)
financing transaction, the financing transaction is given no accounting recognition in the accompanying financial statements. At December 31, 2008, the amount of conduit debt outstanding totaled $5,128,518,947.
7. Commitments and Contingencies
The Authority has an operating lease commitment for its offices at an annual rental of approximately $258,000 through November 16, 2010.
The Authority, in the normal course of business, is involved in various legal matters. Under the terms of the agreements between the Authority and the public and private institutions of higher education, any costs associated with litigation are the obligation of the institution involved. It is the opinion of the Authority after consultation with legal counsel that its financial position will not be adversely affected by the ultimate outcome of any existing legal proceedings.
8. Net Assets
The Authority’s net assets represent the excess of assets over liabilities and are categorized as follows:
• Invested in Capital Assets are the amounts expended by the Authority for the acquisition of capital assets, net of accumulated depreciation.
• Unrestricted Net Assets are the remaining net assets, which can be further categorized as designated or undesignated. Designated assets are not governed by statute or contract but are committed for specific purposes pursuant to Authority policy and/or directives. Designated assets include funds and assets committed to working capital.
On December 21, 2005, the Members of the Authority passed a resolution to designate $4,500,000 of the Authority’s operating fund balance as a reserve to facilitate the normal operations of the Authority and for counsel and consultants, if needed, in the event of difficulties experienced by the Authority or any of its client colleges. On February 27, 2008, the Authority’s Members passed a resolution to increase by $1,000,000 (to $5,500,000) the amount designated for this purpose.
New Jersey Educational Facilities Authority (A Component Unit of the State of New Jersey)
Notes to Financial Statements (continued)
18
8. Net Assets (continued)
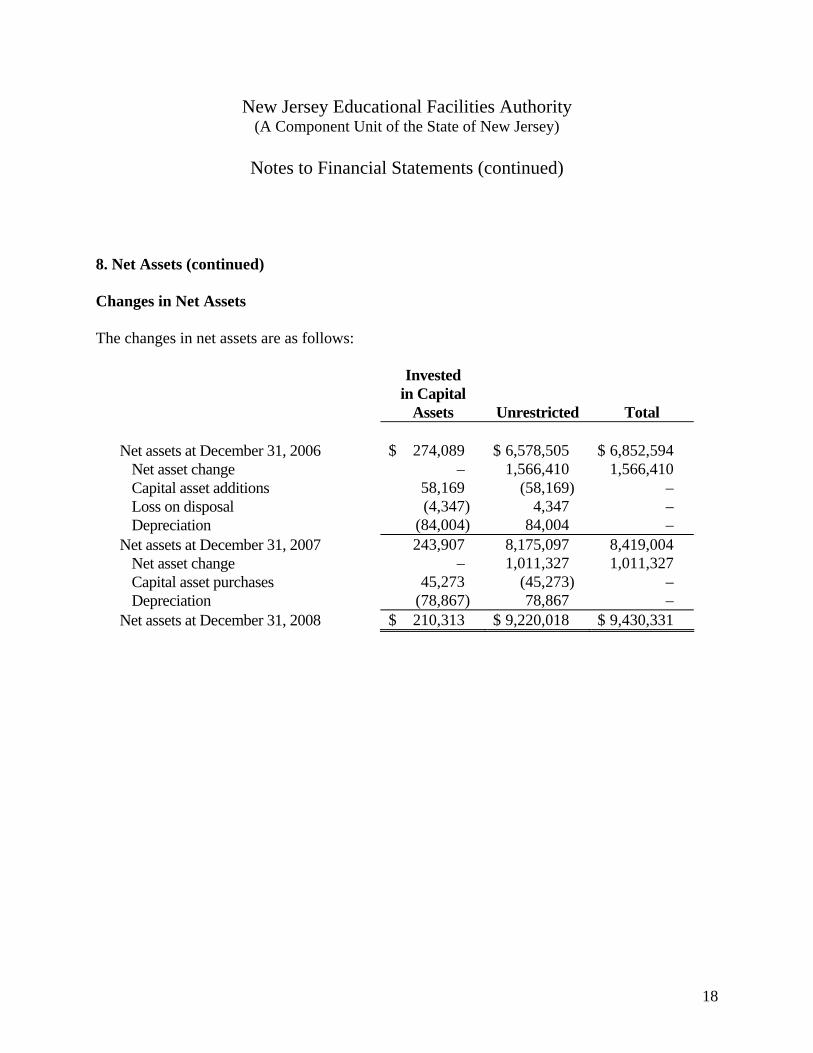
Changes in Net Assets
The changes in net assets are as follows:
Invested in Capital
Assets Unrestricted Total Net assets at December 31, 2006 $ 274,089 $ 6,578,505 $ 6,852,594
Net asset change – 1,566,410 1,566,410 Capital asset additions 58,169 (58,169) – Loss on disposal (4,347) 4,347 – Depreciation (84,004) 84,004 –
Net assets at December 31, 2007 243,907 8,175,097 8,419,004 Net asset change – 1,011,327 1,011,327 Capital asset purchases 45,273 (45,273) – Depreciation (78,867) 78,867 –
Net assets at December 31, 2008 $ 210,313 $ 9,220,018 $ 9,430,331

Required Supplementary Information
19
New Jersey Educational Facilities Authority (A Component Unit of the State of New Jersey)
Required Supplementary Information
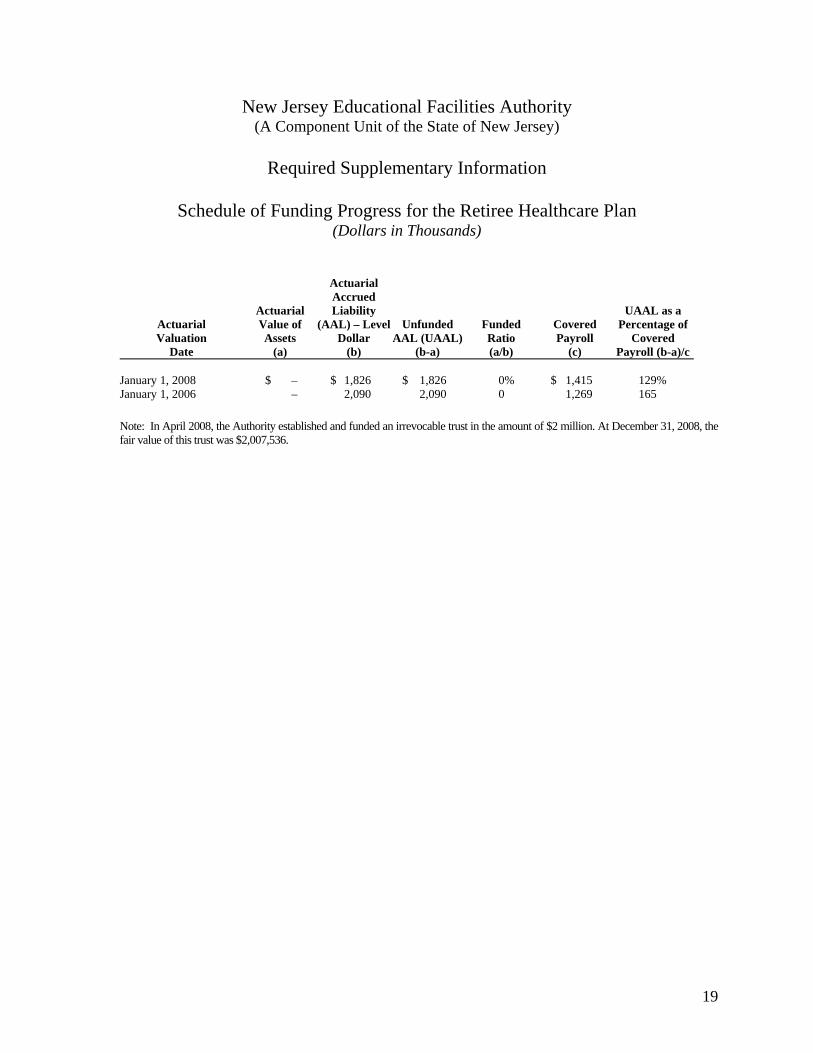
Schedule of Funding Progress for the Retiree Healthcare Plan
(Dollars in Thousands)
Actuarial Valuation
Date
Actuarial Value of Assets
(a)
Actuarial Accrued Liability
(AAL) – Level Dollar
(b)
Unfunded AAL (UAAL)
(b-a)
Funded Ratio (a/b)
Covered Payroll
(c)
UAAL as a Percentage of
Covered Payroll (b-a)/c
January 1, 2008 $ – $ 1,826 $ 1,826 0% $ 1,415 129% January 1, 2006 – 2,090 2,090 0 1,269 165
Note: In April 2008, the Authority established and funded an irrevocable trust in the amount of $2 million. At December 31, 2008, the fair value of this trust was $2,007,536.

Supplemental Financial Information

20
New Jersey Educational Facilities Authority (A Component Unit of the State of New Jersey)
Balance Sheets – Trustee Held Funds
December 31 2008 2007 Assets Cash $ 111,367 $ 98,647 Investments, principally U.S. Government obligations 1,112,379,745 1,121,897,919 Accrued interest receivable 2,653,234 776,063 Due from colleges and universities 362,576 185,602 Loans and leases receivable 5,095,051,447 4,822,410,068 U.S. Government debt service subsidies receivable 48,013 341,443 $ 6,210,606,382 $ 5,945,709,742 Liabilities Accounts payable and accrued expenses $ 72,917,749 $ 47,836,213 Accrued interest payable 98,006,340 82,112,451 Bonds and notes payable 5,128,518,947 4,854,470,068 Funds held in trust 911,163,346 961,291,010 $ 6,210,606,382 $ 5,945,709,742 The accompanying notes to supplemental financial statements are an integral part of this statement.

21
New Jersey Educational Facilities Authority (A Component Unit of the State of New Jersey)
Statements of Changes in Trustee Held Funds
Year Ended December 31 2008 2007 Funds held in trust at beginning of year $ 961,291,010 $ 753,574,251 Additions: Proceeds from sale of bonds and issuance of notes:
Par amount 1,213,270,268 1,079,748,710 Bond premium, net 27,918,544 13,857,586
Annual loan and rental requirements 372,063,734 331,355,960 Investment income 54,492,149 25,212,888 College and university contributions (returned) (2,801,255) (2,527,279)U.S. Government debt service subsidies 763,965 1,157,462 Change in investment valuation reserve 1,622,622 531,486
Total additions 1,667,330,027 1,449,336,813 Deductions: Debt service: Interest 264,038,179 201,695,883 Principal 167,036,240 131,178,304
Project costs 498,132,908 338,220,064 Issuance costs 14,859,088 11,400,196 Administrative fees 3,016,399 2,919,298 Transfers to escrow accounts for defeasance of refunded issues 770,374,877 556,206,309
Total deductions 1,717,457,691 1,241,620,054 (Decrease) increase in funds held in trust (50,127,664) 207,716,759 Funds held in trust at end of year $ 911,163,346 $ 961,291,010
The accompanying notes to supplemental financial statements are an integral part of this statement.

New Jersey Educational Facilities Authority (A Component Unit of the State of New Jersey)
Notes to Supplemental Financial Statements
December 31, 2008
22
1. Introduction
Under the terms of the Authority’s enabling legislation, the Authority has the power to issue bonds and notes on behalf of public and private institutions of higher education in the State of New Jersey. The obligations issued by the Authority are conduit debt and are not guaranteed by, nor do they constitute a debt or obligation of, the State of New Jersey.
Because the bonds and notes issued by the Authority are nonrecourse conduit debt obligations of the Authority, the Authority has, in effect, none of the risks and rewards of the related financings. The supplemental financial statements presented herein include information pertaining to funds held by Trustees of the various bond and note issuances of the Authority.
2. Significant Accounting Policies
The Trustee Held Funds as presented is an agency fund and as such is custodial in nature and does not present results of operations and utilizes the accrual basis of accounting.
3. Funds Held in Trust
Funds held in trust include amounts in the construction, debt service and debt service reserve funds and the renewal and replacement accounts established for each bond issue. Balances maintained in the construction funds represent unexpended proceeds allocated for specific projects; the debt service fund, debt service reserve fund, and renewal and replacement account balances represent amounts reserved for payment of debt service and the renewal and replacement of major components of projects as required by the provisions of the various series resolutions. The following is a schedule of the aggregate funds held in trust as of December 31, 2008 and 2007:
2008 2007 Construction funds $ 796,466,300 $ 836,437,711 Debt service funds 12,096,384 14,870,953 Debt service reserve funds 84,446,763 90,278,957 Renewal and replacement accounts 18,153,899 19,703,389 $ 911,163,346 $ 961,291,010
New Jersey Educational Facilities Authority (A Component Unit of the State of New Jersey)
Notes to Supplemental Financial Statements (continued)
23
4. Cash and Investments
Investments permitted in the Trustee Held Funds are authorized by the respective Bond Resolutions. All funds held by the trustees may be invested in obligations of, or guaranteed by, the United States Government. In addition, certain funds may be invested in: obligations of agencies of the U.S. government; obligations of, or guaranteed by, the State of New Jersey; collateralized certificates of deposit and repurchase agreements; commercial paper; and other securities which shall be authorized for the investment of funds in the custody of the Treasurer of the State of New Jersey.
Investments held by trustees are carried at fair value and comprise the following:
2008 2007 Investments:
Collateralized investment agreements $ 80,207,230 $ 507,700,448 U.S. Treasury and agency obligations* 1,032,172,515 614,197,471
Total investments $ 1,112,379,745 $ 1,121,897,919
* Includes $250,028,040 and $135,749,925 of investments in pooled U.S. Treasury funds at December 31, 2008 and 2007, respectively, which are uncategorized.
5. Loans and Leases Receivable
Since its inception, the Authority has issued obligations of $11,651,321,384 and $10,438,051,116 as of December 31, 2008 and 2007, respectively, for the benefit of various public and private institutions of higher education. The obligations are secured by loans, mortgages, leases and other agreements, the terms of which generally correspond to the amortization of the related bond issues.
The loans and mortgages are secured by revenues produced by the facilities and by other legally available funds of the institutions. The Authority is the owner of those projects under lease agreements. It is the intention of the Authority to transfer title in the projects at the expiration of the leases. Accordingly, the leases are being accounted for as financing transactions.

New Jersey Educational Facilities Authority (A Component Unit of the State of New Jersey)
Notes to Supplemental Financial Statements (continued)
24
5. Loans and Leases Receivable (continued)
Restricted fund receivables comprise the following:
December 31 2008 2007 Loans:
Institute for Advanced Study $ 62,735,000 $ 64,790,000 Princeton University 1,441,817,500 1,236,725,000
Mortgages: Beth Medrash Govoha – 7,530,000 Caldwell College 20,340,000 20,950,000 Centenary College 25,332,881 25,873,730 College of Saint Elizabeth 24,090,000 25,310,000 Drew University 60,326,807 61,207,500 Fairleigh Dickinson University 105,189,263 108,766,909 Felician College 10,110,000 10,685,000 Georgian Court University 31,257,577 32,005,246 Institute for Defense Analyses 14,585,000 15,015,000 Monmouth University 16,815,000 18,565,000 New Jersey Institute of Technology 136,237,500 139,735,000 Princeton Theological Seminary 41,525,000 42,445,000 Rider University 54,320,000 56,520,000 Saint Peter’s College 44,509,428 39,901,927 Seton Hall University 131,737,500 140,600,000 Stevens Institute of Technology 77,490,000 77,872,500 University of Medicine and Dentistry of New Jersey 102,710,000 106,170,000
Leases: Bloomfield College – 20,372 Kean University 318,909,610 319,995,365 Montclair State University 331,877,500 335,890,000 New Jersey City University (formerly Jersey City State College) 109,555,000 110,905,000 Ramapo College of New Jersey 239,843,496 245,241,682 Rider University 125,000 367,500 Rowan University (formerly Glassboro State College) 334,790,000 338,925,000 Rutgers, The State University – 217,500 Thomas Edison State College 3,013,385 3,708,337 The College of New Jersey (formerly Trenton State College) 328,460,000 326,370,000 The Richard Stockton College of New Jersey 254,659,000 151,074,000 William Paterson University of New Jersey 176,755,000 98,792,500
Equipment Leasing Fund 4,745,000 13,320,000 Higher Education Capital Improvement Fund 455,105,000 476,475,000 Higher Education Facilities Trust Fund 39,920,000 58,435,000 Higher Education Technology Infrastructure Fund – 6,165,000 County College Capital Projects Fund 12,670,000 14,755,000 Dormitory Safety Trust Fund 45,830,000 51,490,000 Library Grant Program 37,665,000 39,595,000 $ 5,095,051,447 $ 4,822,410,068

New Jersey Educational Facilities Authority (A Component Unit of the State of New Jersey)
Notes to Supplemental Financial Statements (continued)
25
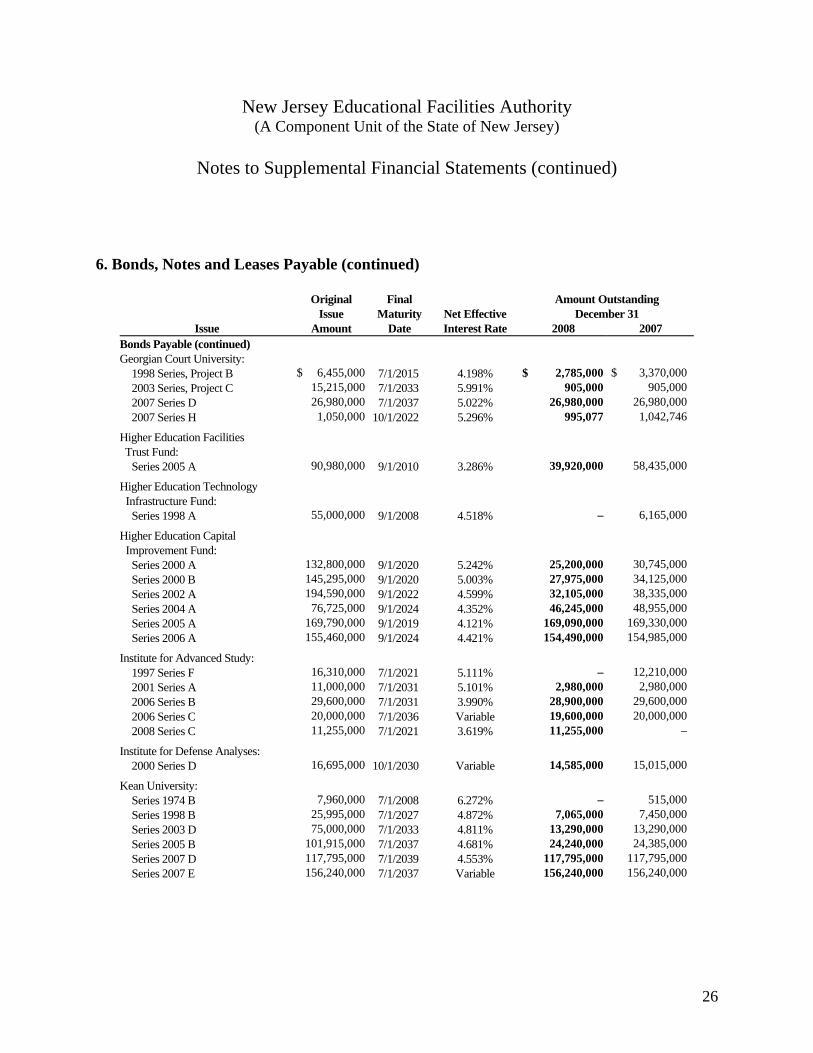
6. Bonds, Notes and Leases Payable
Bonds, notes and leases payable comprise the following:
Original Issue
Final Maturity
Net Effective
Amount Outstanding December 31
Issue Amount Date Interest Rate 2008 2007 Bonds Payable Beth Medrash Govoha:
2000 Series G $ 8,505,000 7/1/2030 6.720% $ – $ 7,610,000 Caldwell College:
2006 Series F 21,400,000 7/1/2032 Variable 20,340,000 20,950,000 Centenary College:
2003 Series A 14,775,000 10/1/2033 Variable 11,470,000 11,935,000 2006 Series J 9,154,113 11/1/2036 Variable 9,127,863 9,154,113 2007 Series B 4,784,617 11/1/2036 Variable 4,735,018 4,784,617
Drew University:
1998 Series C 27,935,000 7/1/2017 4.936% – 13,495,000 2003 Series C 20,855,000 7/1/2021 3.888% 18,835,000 19,530,000 2007 Series D 29,135,000 7/1/2037 4.601% 28,985,000 29,135,000 2008 Series B 10,765,000 7/1/2017 4.234% 10,765,000 – 2008 Series I 40,000,000 6/25/2018 Variable 2,331,807 –
Dormitory Safety Trust Fund:
Series 2001 A 67,970,000 3/1/2016 4.239% 38,840,000 43,695,000 Series 2001 B - taxable 5,800,000 3/1/2016 6.117% 3,310,000 3,725,000 Series 2003 A 5,440,000 3/1/2018 3.752% 3,680,000 4,070,000
Equipment Leasing Fund:
Series 2001 A 87,385,000 9/1/2009 3.089% 1,755,000 8,280,000 Series 2003 A 12,620,000 9/1/2011 2.517% 2,990,000 5,040,000
Fairleigh Dickinson University: 2002 Series D 63,650,000 7/1/2032 6.114% 59,320,000 60,485,000 2004 Series C 35,285,000 7/1/2023 5.534% 31,825,000 33,230,000 2006 Series G 14,505,000 7/1/2028 4.954% 14,095,000 14,505,000 2006 Series H 2,147,554 7/1/2027 4.954% 1,509,263 2,036,909
Felician College: 2006 Series I 11,445,000 11/1/2022 4.749% 10,155,000 10,685,000
New Jersey Educational Facilities Authority (A Component Unit of the State of New Jersey)
Notes to Supplemental Financial Statements (continued)
26
6. Bonds, Notes and Leases Payable (continued)
Original Issue
Final Maturity
Net Effective
Amount Outstanding December 31
Issue Amount Date Interest Rate 2008 2007 Bonds Payable (continued) Georgian Court University:
1998 Series, Project B $ 6,455,000 7/1/2015 4.198% $ 2,785,000 $ 3,370,000 2003 Series, Project C 15,215,000 7/1/2033 5.991% 905,000 905,000 2007 Series D 26,980,000 7/1/2037 5.022% 26,980,000 26,980,000 2007 Series H 1,050,000 10/1/2022 5.296% 995,077 1,042,746
Higher Education Facilities Trust Fund:
Series 2005 A 90,980,000 9/1/2010 3.286% 39,920,000 58,435,000 Higher Education Technology Infrastructure Fund: Series 1998 A 55,000,000 9/1/2008 4.518% – 6,165,000
Higher Education Capital Improvement Fund: Series 2000 A 132,800,000 9/1/2020 5.242% 25,200,000 30,745,000 Series 2000 B 145,295,000 9/1/2020 5.003% 27,975,000 34,125,000 Series 2002 A 194,590,000 9/1/2022 4.599% 32,105,000 38,335,000 Series 2004 A 76,725,000 9/1/2024 4.352% 46,245,000 48,955,000 Series 2005 A 169,790,000 9/1/2019 4.121% 169,090,000 169,330,000 Series 2006 A 155,460,000 9/1/2024 4.421% 154,490,000 154,985,000
Institute for Advanced Study:
1997 Series F 16,310,000 7/1/2021 5.111% – 12,210,000 2001 Series A 11,000,000 7/1/2031 5.101% 2,980,000 2,980,000 2006 Series B 29,600,000 7/1/2031 3.990% 28,900,000 29,600,000 2006 Series C 20,000,000 7/1/2036 Variable 19,600,000 20,000,000 2008 Series C 11,255,000 7/1/2021 3.619% 11,255,000 –
Institute for Defense Analyses:
2000 Series D 16,695,000 10/1/2030 Variable 14,585,000 15,015,000 Kean University:
Series 1974 B 7,960,000 7/1/2008 6.272% – 515,000 Series 1998 B 25,995,000 7/1/2027 4.872% 7,065,000 7,450,000 Series 2003 D 75,000,000 7/1/2033 4.811% 13,290,000 13,290,000 Series 2005 B 101,915,000 7/1/2037 4.681% 24,240,000 24,385,000 Series 2007 D 117,795,000 7/1/2039 4.553% 117,795,000 117,795,000 Series 2007 E 156,240,000 7/1/2037 Variable 156,240,000 156,240,000
New Jersey Educational Facilities Authority (A Component Unit of the State of New Jersey)
Notes to Supplemental Financial Statements (continued)
27
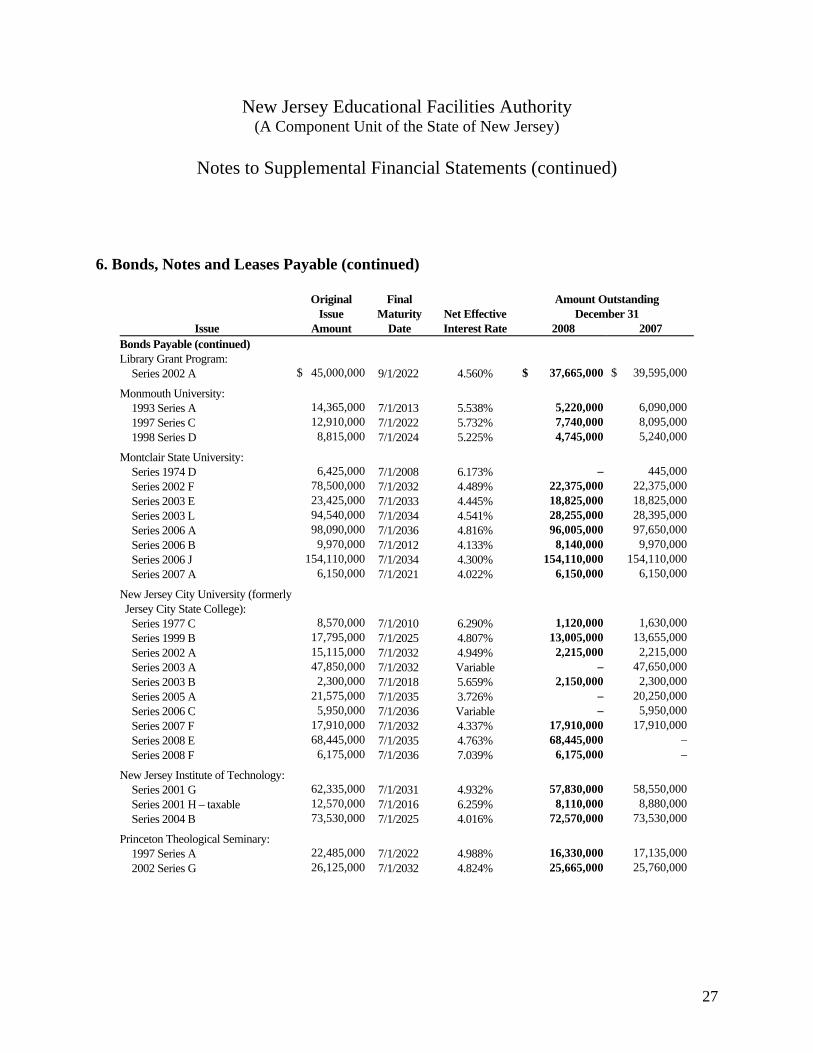
6. Bonds, Notes and Leases Payable (continued)
Original Issue
Final Maturity
Net Effective
Amount Outstanding December 31
Issue Amount Date Interest Rate 2008 2007 Bonds Payable (continued) Library Grant Program:
Series 2002 A $ 45,000,000 9/1/2022 4.560% $ 37,665,000 $ 39,595,000 Monmouth University:
1993 Series A 14,365,000 7/1/2013 5.538% 5,220,000 6,090,000 1997 Series C 12,910,000 7/1/2022 5.732% 7,740,000 8,095,000 1998 Series D 8,815,000 7/1/2024 5.225% 4,745,000 5,240,000
Montclair State University:
Series 1974 D 6,425,000 7/1/2008 6.173% – 445,000 Series 2002 F 78,500,000 7/1/2032 4.489% 22,375,000 22,375,000 Series 2003 E 23,425,000 7/1/2033 4.445% 18,825,000 18,825,000 Series 2003 L 94,540,000 7/1/2034 4.541% 28,255,000 28,395,000 Series 2006 A 98,090,000 7/1/2036 4.816% 96,005,000 97,650,000 Series 2006 B 9,970,000 7/1/2012 4.133% 8,140,000 9,970,000 Series 2006 J 154,110,000 7/1/2034 4.300% 154,110,000 154,110,000 Series 2007 A 6,150,000 7/1/2021 4.022% 6,150,000 6,150,000
New Jersey City University (formerly Jersey City State College):
Series 1977 C 8,570,000 7/1/2010 6.290% 1,120,000 1,630,000 Series 1999 B 17,795,000 7/1/2025 4.807% 13,005,000 13,655,000 Series 2002 A 15,115,000 7/1/2032 4.949% 2,215,000 2,215,000 Series 2003 A 47,850,000 7/1/2032 Variable – 47,650,000 Series 2003 B 2,300,000 7/1/2018 5.659% 2,150,000 2,300,000 Series 2005 A 21,575,000 7/1/2035 3.726% – 20,250,000 Series 2006 C 5,950,000 7/1/2036 Variable – 5,950,000 Series 2007 F 17,910,000 7/1/2032 4.337% 17,910,000 17,910,000 Series 2008 E 68,445,000 7/1/2035 4.763% 68,445,000 – Series 2008 F 6,175,000 7/1/2036 7.039% 6,175,000 –
New Jersey Institute of Technology:
Series 2001 G 62,335,000 7/1/2031 4.932% 57,830,000 58,550,000 Series 2001 H – taxable 12,570,000 7/1/2016 6.259% 8,110,000 8,880,000 Series 2004 B 73,530,000 7/1/2025 4.016% 72,570,000 73,530,000
Princeton Theological Seminary:
1997 Series A 22,485,000 7/1/2022 4.988% 16,330,000 17,135,000 2002 Series G 26,125,000 7/1/2032 4.824% 25,665,000 25,760,000

New Jersey Educational Facilities Authority (A Component Unit of the State of New Jersey)
Notes to Supplemental Financial Statements (continued)
28
6. Bonds, Notes and Leases Payable (continued)
Original Issue
Final Maturity
Net Effective
Amount Outstanding December 31
Issue Amount Date Interest Rate 2008 2007 Bonds Payable (continued) Princeton University:
1999 Series A $ 45,500,000 7/1/2029 4.798% $ 4,675,000 $ 5,725,000 1999 Series B 50,000,000 7/1/2019 4.980% 2,335,000 4,565,000 2000 Series E 50,000,000 7/1/2020 5.355% 4,535,000 6,625,000 2000 Series H 100,000,000 7/1/2030 5.336% 4,460,000 6,525,000 2001 Series B 100,000,000 7/1/2021 Variable – 79,200,000 2002 Series B 100,000,000 7/1/2031 Variable – 83,290,000 2003 Series D 114,495,000 7/1/2019 3.727% 85,205,000 90,420,000 2003 Series E 112,510,000 7/1/2028 3.944% 64,120,000 67,010,000 2003 Series F 75,000,000 7/1/2023 Variable – 63,325,000 2004 Series D 175,000,000 7/1/2029 4.497% 42,325,000 46,455,000 2005 Series A 139,590,000 7/1/2030 4.405% 135,160,000 135,735,000 2005 Series B 114,645,000 7/1/2035 4.236% 83,220,000 85,360,000 2006 Series D 74,290,000 7/1/2031 4.391% 72,550,000 74,290,000 2006 Series E 93,285,000 7/1/2027 4.504% 92,620,000 92,735,000 2007 Series E 325,000,000 7/1/2037 4.534% 319,550,000 325,000,000 2007 Series F 67,620,000 7/1/2030 4.392% 67,610,000 67,620,000 2008 Series J 250,000,000 7/1/2038 4.391% 250,000,000 – 2008 Series K 208,805,000 7/1/2023 4.356% 208,805,000 –
Ramapo College of New Jersey:
Series 1998 G 16,845,000 7/1/2028 4.832% 13,635,000 14,035,000 Series 1998 H 2,000,000 7/1/2013 4.309% 835,000 980,000 Series 1998 I 955,000 7/1/2008 4.044% – 120,000 Series 1999 E 19,900,000 7/1/2029 5.774% 455,000 890,000 Series 2001 D 40,480,000 7/1/2031 5.105% 6,040,000 6,040,000 Series 2001 E 2,535,000 7/1/2008 4.037% – 405,000 Series 2002 H 28,655,000 7/1/2032 4.485% 18,230,000 18,610,000 Series 2002 I 2,145,000 7/1/2032 4.485% 1,300,000 1,345,000 Series 2002 J 29,620,000 7/1/2032 4.485% 18,850,000 19,495,000 Series 2003 F 1,820,000 7/1/2013 3.257% 1,185,000 1,400,000 Series 2003 G 9,300,000 7/1/2013 3.110% 5,175,000 6,540,000 Series 2003 H 18,930,000 7/1/2029 4.346% 18,775,000 18,915,000 Series 2004 E 53,980,000 7/1/2034 4.630% 13,680,000 13,680,000 Series 2006 D 49,085,000 7/1/2036 4.521% 37,940,000 37,940,000 Series 2006 I 106,820,000 7/1/2036 4.417% 106,790,000 106,820,000

New Jersey Educational Facilities Authority (A Component Unit of the State of New Jersey)
Notes to Supplemental Financial Statements (continued)
29
6. Bonds, Notes and Leases Payable (continued)
Original Issue
Final Maturity
Net Effective
Amount Outstanding December 31
Issue Amount Date Interest Rate 2008 2007 Bonds Payable (continued) Rider University:
1971 Series A $ 3,700,000 7/1/2009 6.895% $ 250,000 $ 485,000 2002 Series A 27,560,000 7/1/2017 4.709% 19,595,000 21,295,000 2004 Series A 14,735,000 7/1/2034 5.301% 13,940,000 14,210,000 2007 Series C 22,000,000 7/1/2037 5.172% 22,000,000 22,000,000
Rowan University (formerly Glassboro State College):
Series 1974 E 6,080,000 7/1/2009 6.944% 415,000 805,000 Series 1983 D 3,500,000 7/1/2013 3.000% 850,000 1,005,000 Series 2000 B 51,620,000 7/1/2030 5.566% 2,360,000 3,460,000 Series 2001 B 8,790,000 7/1/2031 5.025% 210,000 210,000 Series 2001 C 60,930,000 7/1/2031 4.943% 40,470,000 42,025,000 Series 2002 K 14,920,000 7/1/2033 4.866% 665,000 665,000 Series 2003 I 64,910,000 7/1/2030 4.714% 7,820,000 7,820,000 Series 2003 J 4,555,000 7/1/2008 2.258% – 1,005,000 Series 2003 K 14,700,000 7/1/2033 Variable – 14,700,000 Series 2004 C 61,275,000 7/1/2034 4.697% 8,680,000 8,680,000 Series 2005 D 51,840,000 7/1/2030 4.532% 51,655,000 51,840,000 Series 2006 G 69,405,000 7/1/2031 4.362% 69,250,000 69,405,000 Series 2006 H 20,000,000 7/1/2036 Variable – 20,000,000 Series 2007 B 121,355,000 7/1/2034 4.266% 119,500,000 119,500,000 Series 2008 B 35,205,000 7/1/2027 4.839% 35,205,000 –
Rutgers, The State University: Series 1974 A 6,725,000 7/1/2008 5.945% – 435,000
Saint Peter’s College: 2007 Series G 36,053,465 7/1/2027 4.217% 36,053,466 36,053,465 2007 Series I 3,848,462 1/1/2013 3.925% 3,628,462 3,848,462 2008 Series H 5,000,000 7/1/2018 3.925% 4,827,500 –
Seton Hall University: 1998 Series, Project F 7,620,000 7/1/2021 5.189% 7,620,000 7,620,000 1999 Refunding Series 50,450,000 7/1/2018 5.122% 30,355,000 33,630,000 2001 Refunding Series A 22,840,000 7/1/2016 4.314% 6,485,000 7,100,000 2001 Refunding Series B 11,600,000 7/1/2016 4.314% 6,875,000 7,635,000 2001 Series Project G 8,740,000 7/1/2026 4.598% 8,740,000 8,740,000 2005 Series Project C 57,750,000 7/1/2037 Variable – 57,750,000 2006 Series A 20,750,000 7/1/2019 Variable – 20,450,000 2008 Series D 49,760,000 7/1/2037 Variable 49,760,000 – 2008 Series E 24,340,000 7/1/2037 6.127% 24,340,000 –
New Jersey Educational Facilities Authority (A Component Unit of the State of New Jersey)
Notes to Supplemental Financial Statements (continued)
30
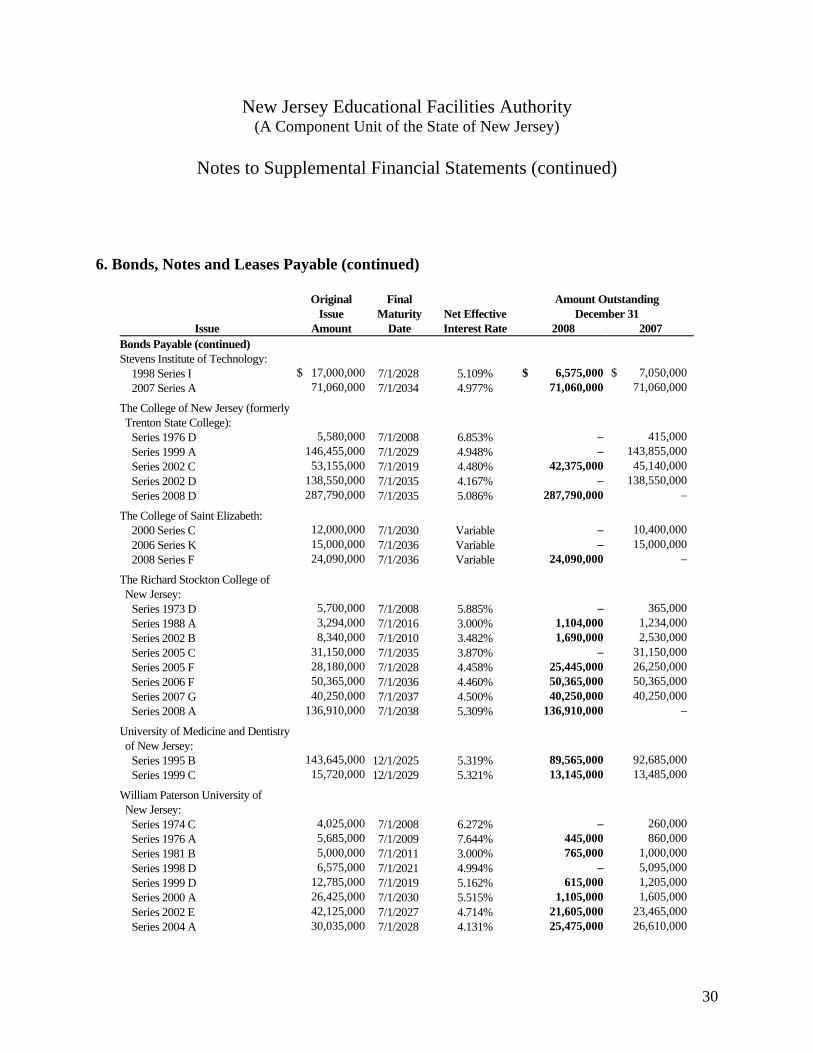
6. Bonds, Notes and Leases Payable (continued)
Original Issue
Final Maturity
Net Effective
Amount Outstanding December 31
Issue Amount Date Interest Rate 2008 2007 Bonds Payable (continued) Stevens Institute of Technology:
1998 Series I $ 17,000,000 7/1/2028 5.109% $ 6,575,000 $ 7,050,000 2007 Series A 71,060,000 7/1/2034 4.977% 71,060,000 71,060,000
The College of New Jersey (formerly Trenton State College):
Series 1976 D 5,580,000 7/1/2008 6.853% – 415,000 Series 1999 A 146,455,000 7/1/2029 4.948% – 143,855,000 Series 2002 C 53,155,000 7/1/2019 4.480% 42,375,000 45,140,000 Series 2002 D 138,550,000 7/1/2035 4.167% – 138,550,000 Series 2008 D 287,790,000 7/1/2035 5.086% 287,790,000 –
The College of Saint Elizabeth: 2000 Series C 12,000,000 7/1/2030 Variable – 10,400,000 2006 Series K 15,000,000 7/1/2036 Variable – 15,000,000 2008 Series F 24,090,000 7/1/2036 Variable 24,090,000 –
The Richard Stockton College of New Jersey:
Series 1973 D 5,700,000 7/1/2008 5.885% – 365,000 Series 1988 A 3,294,000 7/1/2016 3.000% 1,104,000 1,234,000 Series 2002 B 8,340,000 7/1/2010 3.482% 1,690,000 2,530,000 Series 2005 C 31,150,000 7/1/2035 3.870% – 31,150,000 Series 2005 F 28,180,000 7/1/2028 4.458% 25,445,000 26,250,000 Series 2006 F 50,365,000 7/1/2036 4.460% 50,365,000 50,365,000 Series 2007 G 40,250,000 7/1/2037 4.500% 40,250,000 40,250,000 Series 2008 A 136,910,000 7/1/2038 5.309% 136,910,000 –
University of Medicine and Dentistry of New Jersey:
Series 1995 B 143,645,000 12/1/2025 5.319% 89,565,000 92,685,000 Series 1999 C 15,720,000 12/1/2029 5.321% 13,145,000 13,485,000
William Paterson University of New Jersey:
Series 1974 C 4,025,000 7/1/2008 6.272% – 260,000 Series 1976 A 5,685,000 7/1/2009 7.644% 445,000 860,000 Series 1981 B 5,000,000 7/1/2011 3.000% 765,000 1,000,000 Series 1998 D 6,575,000 7/1/2021 4.994% – 5,095,000 Series 1999 D 12,785,000 7/1/2019 5.162% 615,000 1,205,000 Series 2000 A 26,425,000 7/1/2030 5.515% 1,105,000 1,605,000 Series 2002 E 42,125,000 7/1/2027 4.714% 21,605,000 23,465,000 Series 2004 A 30,035,000 7/1/2028 4.131% 25,475,000 26,610,000

New Jersey Educational Facilities Authority (A Component Unit of the State of New Jersey)
Notes to Supplemental Financial Statements (continued)
31
6. Bonds, Notes and Leases Payable (continued)
Original Issue
Final Maturity
Net Effective
Amount Outstanding December 31
Issue Amount Date Interest Rate 2008 2007 Bonds Payable (continued) William Paterson University of New Jersey (continued):
Series 2005 E $ 42,295,000 7/1/2030 4.546% $ 41,270,000 $ 41,370,000 Series 2008 C 88,670,000 7/1/2038 4.724% 88,670,000 –
Notes Payable Princeton University:
Various Commercial Paper 120,000,000* N/A Variable 12,680,000 12,680,000
Leases Payable Bloomfield College 315,000 4/1/2008 5.900% – 20,372 Kean University 916,666 6/1/2014 4.064% 654,610 842,865 Ramapo College 1,377,090 10/1/2010 Various 113,496 189,182 Thomas Edison State College 1,800,000 3/8/2012 3.647% 700,538 1,008,337 Thomas Edison State College 2,700,000 9/28/2022 Variable 2,312,847 2,700,000 Treasurer, State of New Jersey, Series 1999 A 19,295,000 9/1/2014
4.705% 2,290,000 2,610,000
Atlantic County, Series 1999 B 3,045,000 9/1/2009 4.799% 370,000 720,000 Essex County, Series 1999 C 4,570,000 9/1/2014 5.177% 2,205,000 2,520,000 Hudson County, Series 1999 D 7,750,000 9/1/2014 5.177% 3,745,000 4,275,000 Middlesex County, Series 1999 E 4,370,000 9/1/2014 5.053% 2,105,000 2,400,000 Passaic County, Series 1999 F 2,015,000 9/1/2014 5.125% 970,000 1,105,000 Hudson County Community College (Chapter 78), Series 1999 G 2,035,000 9/1/2014
5.177% 985,000 1,125,000
$ 5,128,518,947 $ 4,854,470,068
* Maximum authorized amount.

New Jersey Educational Facilities Authority (A Component Unit of the State of New Jersey)
Notes to Supplemental Financial Statements (continued)
32
6. Bonds, Notes and Leases Payable (continued)
The minimum aggregate principal maturities for each of the following five year periods are as follows:
2009 – 2013 $ 816,699,196 2014 – 2018 1,043,807,323 2019 – 2023 1,152,749,750 2024 – 2028 927,172,453 2029 – 2033 754,983,056 2034 –2038 425,822,169 2039 7,285,000 $ 5,128,518,947
7. Refunded Bond Issues
When conditions have warranted, the Authority has sold various issues of bonds to provide for the refunding of previously issued obligations.
The proceeds received from the sales of the bond issues were used to refund currently the outstanding bond issues or to deposit in an irrevocable escrow fund held by the Escrow Agent, an amount which, when combined with interest earnings thereon, is at least equal to the sum of the outstanding principal amount of the bonds, the interest to accrue thereon to and including the first optional redemption date thereof, and the premium required to redeem the bonds outstanding on such date. Accordingly, the trust account assets and the liability for defeased bonds are not included in the Authority’s financial statements.
During 2008, the Beth Medrash Govoha Issue, Series 2000 G, was refunded by Economic Development Authority Bonds.
Certain transactions defeased the outstanding bond issues with a resultant reduction in annual debt service during the term of the issues. The debt service savings, together with any accounting gain or loss that will be deferred, accrue to the respective institutions.

New Jersey Educational Facilities Authority (A Component Unit of the State of New Jersey)
Notes to Supplemental Financial Statements (continued)
33
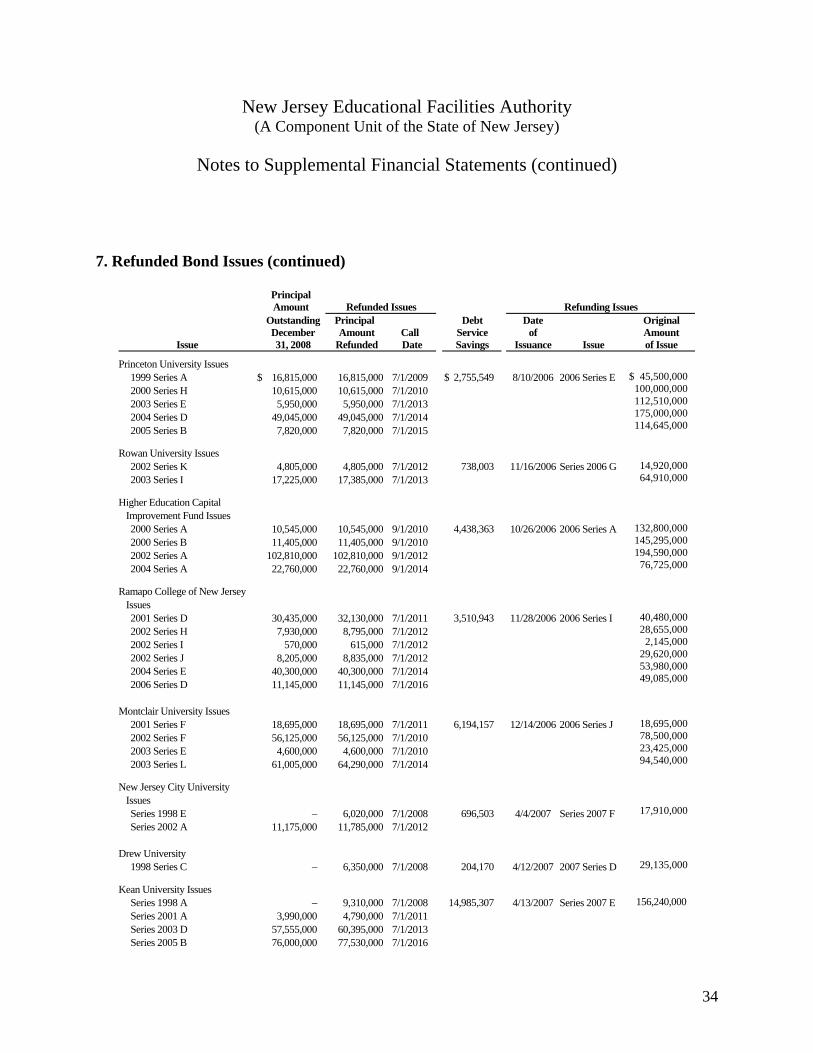
7. Refunded Bond Issues (continued)
Refunded bonds outstanding at December 31, 2008 comprise the following:
Principal Amount
Refunded Issues
Refunding Issues
Issue
Outstanding December 31, 2008
Principal Amount
Refunded
Call Date
Debt Service Savings
Date of
Issuance
Issue
Original Amount of Issue
Princeton University Issues 1999 Series B 2000 Series E 2000 Series H
$ 25,440,000 27,615,000 26,700,000
$ 25,440,00027,615,00026,700,000
7/1/2009 7/1/2010 7/1/2010
$ 5,434,717 10/23/2003 2003 Series D $114,495,000
Ramapo College of New Jersey
Issue
1999 Series E 16,825,000 16,825,000 7/1/2009 554,426 1/29/2004 Series 2003 H 18,930,000 Higher Educational Capital
Improvement Fund Issues
Series 2000 A Series 2000 B Series 2002 A
59,405,000 65,675,000 41,850,000
59,405,00065,675,00041,850,000
9/1/2010 9/1/2010 9/1/2012
5,080,385 8/10/2005 Series 2005 A 169,790,000
Rowan University Issues
2000 Series B 43,405,000 45,445,000 7/1/2010 1,912,380 4/13/2005 Series 2005 D 51,840,000 Princeton University Issues Partial
Refundings
1999 Series A 1999 Series B 2000 Series E 2000 Series H 2003 Series E 2004 Series D
10,400,000 5,535,000 3,935,000
45,435,000 25,000,000 31,470,000
10,400,0005,535,0003,935,000
45,435,00025,000,00031,470,000
7/1/2009 7/1/2009 7/1/2010 7/1/2010 7/1/2013 7/1/2014
4,243,735 4/12/2005 2005 Series A 139,590,000
The Richard Stockton College of
New Jersey Issues
Series 1998 C – 11,875,000 7/1/2008 1,452,794 10/27/2005 Series 2005 F 28,180,000 The William Paterson University
of New Jersey Issues
Series 1999 D Series 2000 A Series 2002 E
8,125,000 22,395,000 11,305,000
8,125,00022,395,00011,305,000
7/1/2009 7/1/2010 7/1/2012
1,420,584 11/10/2005 Series 2005 E 42,295,000
New Jersey City University
Issues
1999 Series B 450,000 450,000 7/1/2009 - 2/16/2006 Series 2006 C 5,950,000 Fairleigh Dickinson University
Issues
1998 Series G – 13,970,000 7/1/2008 551,612 6/29/2006 Series 2006 G 14,505,000 Institute for Advanced Study
Issues
1997 Series G 2001 Series A
– 6,730,000
21,070,0007,190,000
7/1/2008 7/1/2000
2,100,571 7/19/2006 2006 Series B 26,565,000 11,000,000
New Jersey Educational Facilities Authority (A Component Unit of the State of New Jersey)
Notes to Supplemental Financial Statements (continued)
34
7. Refunded Bond Issues (continued)
Principal Amount
Refunded Issues
Refunding Issues
Issue
Outstanding December 31, 2008
Principal Amount
Refunded
Call Date
Debt Service Savings
Date of
Issuance
Issue
Original Amount of Issue
Princeton University Issues
1999 Series A 2000 Series H 2003 Series E 2004 Series D 2005 Series B
$ 16,815,000 10,615,000 5,950,000
49,045,000 7,820,000
16,815,00010,615,0005,950,000
49,045,0007,820,000
7/1/2009 7/1/2010 7/1/2013 7/1/2014 7/1/2015
$ 2,755,549 8/10/2006 2006 Series E $ 45,500,000 100,000,000 112,510,000 175,000,000 114,645,000
Rowan University Issues
2002 Series K 2003 Series I
4,805,000 17,225,000
4,805,00017,385,000
7/1/2012 7/1/2013
738,003 11/16/2006 Series 2006 G 14,920,000 64,910,000
Higher Education Capital
Improvement Fund Issues
2000 Series A 2000 Series B 2002 Series A 2004 Series A
10,545,000 11,405,000
102,810,000 22,760,000
10,545,00011,405,000
102,810,00022,760,000
9/1/2010 9/1/2010 9/1/2012 9/1/2014
4,438,363 10/26/2006 2006 Series A 132,800,000 145,295,000 194,590,000
76,725,000 Ramapo College of New Jersey
Issues
2001 Series D 2002 Series H 2002 Series I 2002 Series J 2004 Series E 2006 Series D
30,435,000 7,930,000
570,000 8,205,000
40,300,000 11,145,000
32,130,0008,795,000
615,0008,835,000
40,300,00011,145,000
7/1/2011 7/1/2012 7/1/2012 7/1/2012 7/1/2014 7/1/2016
3,510,943 11/28/2006 2006 Series I 40,480,000 28,655,000
2,145,000 29,620,000 53,980,000 49,085,000
Montclair University Issues 2001 Series F 2002 Series F 2003 Series E 2003 Series L
18,695,000 56,125,000 4,600,000
61,005,000
18,695,00056,125,0004,600,000
64,290,000
7/1/2011 7/1/2010 7/1/2010 7/1/2014
6,194,157 12/14/2006 2006 Series J 18,695,000 78,500,000 23,425,000 94,540,000
New Jersey City University
Issues Series 1998 E Series 2002 A
– 11,175,000
6,020,00011,785,000
7/1/2008 7/1/2012
696,503
4/4/2007
Series 2007 F
17,910,000
Drew University 1998 Series C
– 6,350,000
7/1/2008
204,170
4/12/2007
2007 Series D
29,135,000
Kean University Issues
Series 1998 A Series 2001 A Series 2003 D Series 2005 B
–
3,990,000 57,555,000 76,000,000
9,310,0004,790,000
60,395,00077,530,000
7/1/2008 7/1/2011 7/1/2013 7/1/2016
14,985,307
4/13/2007
Series 2007 E 156,240,000

New Jersey Educational Facilities Authority (A Component Unit of the State of New Jersey)
Notes to Supplemental Financial Statements (continued)
35
7. Refunded Bond Issues (continued)
Principal Amount
Refunded Issues
Refunding Issues
Issue
Outstanding December 31, 2008
Principal Amount
Refunded Call Date
Debt Service Savings
Date of
Issuance Issue
Original Amount of Issue
Stevens Institute of Technology
Issues
1998 Series I 2002 Series C 2004 Series B
$ 5,635,000 48,335,000 12,590,000
6,050,00049,355,00012,825,000
No Call 7/1/2013 7/1/2014
N/A* 8/2/2007 2007 Series A $ 71,060,000
Princeton University Partial
Refundings
1999 Series A 2003 Series E 2004 Series D 2005 Series A 2005 Series B
5,305,000 4,270,000
36,805,000 2,095,000
17,625,000
5,305,0004,270,000
36,805,0002,095,000
17,625,000
7/1/2009 7/1/2013 7/1/2014 7/1/2015 7/1/2015
$ 2,361,004 6/19/2007 2007 Series F 67,620,000
Rowan University Issues
Series 2001 B Series 2001 C Series 2002 K Series 2003 I Series 2004 C
7,430,000 7,555,000 8,045,000
34,055,000 51,195,000
7,610,0007,850,0008,340,000
35,615,00051,595,000
7/1/2011 7/1/2011 7/1/2012 7/1/2013 7/1/2014
4,465,765
4/5/2007
Series 2007 B 121,355,000
Georgian Court University
2003 Series Project C
13,330,000 13,585,000
7/1/2013
1,034,788
7/19/2007 2007 Series D 26,980,000
Saint Peter’s College
Series 1998 B
– 28,690,000
7/1/2008
1,137,603
12/28/2007 2007 Series G 36,053,466
Princeton University Current
Refundings Series 2001 B Series 2002 B Series 2003 F
– – –
75,000,00079,425,00060,185,000
12/1/2008 12/1/2008 12/1/2008
N/A*N/A*N/A*
11/5/2008
2008 Series K 208,805,000
Seton Hall Partial Refunding
Series 2005 C
21,737,500 21,737,500
1/8/2009
N/A*
12/11/2008 Series 2008
24,340,000
Seton Hall Partial Refunding
2005 C and Current Refunding 2006 A Series 2005 C Series 2006A
28,287,500 20,200,000
28,287,50020,200,000
1/8/2009 1/8/2009
N/A*
12/11/2008
Series 2008 D
49,760,000
Beth Medrash Govoha
Series 2000 G
7,450,000 7,450,000
7/1/2010
N/A*
N/A N/A
N/A
* Debt restructuring

36
Report on Internal Control Over Financial Reporting and on Compliance and Other Matters Based on an
Audit of the Financial Statements Performed in Accordance with Government Auditing Standards
To the Members of the New Jersey Educational Facilities Authority We have audited the financial statements of the New Jersey Educational Facilities Authority as of and for the year ended December 31, 2008, and have issued our report thereon dated March 18, 2009. We conducted our audit in accordance with auditing standards generally accepted in the United States and the standards applicable to financial audits contained in Government Auditing Standards, issued by the Comptroller General of the United States.
Internal Control Over Financial Reporting
In planning and performing our audit, we considered the Authority’s internal control over financial reporting as a basis for designing our auditing procedures for the purpose of expressing our opinion on the financial statements, but not for the purpose of expressing an opinion on the effectiveness of the Authority’s internal control over financial reporting. Accordingly, we do not express an opinion on the effectiveness of the Authority’s internal control over financial reporting.
A control deficiency exists when the design or operation of a control does not allow management or employees, in the normal course of performing their assigned functions, to prevent or detect misstatements on a timely basis. A significant deficiency is a control deficiency, or combination of control deficiencies, that adversely affects the entity’s ability to initiate, authorize, record, process, or report financial data reliably in accordance with generally accepted accounting principles such that there is more than a remote likelihood that a misstatement of the entity’s financial statements that is more than inconsequential will not be prevented or detected by the entity’s internal control.
A material weakness is a significant deficiency, or combination of significant deficiencies, that results in more than a remote likelihood that a material misstatement of the financial statements will not be prevented or detected by the entity’s internal control.
Our consideration of internal control over financial reporting was for the limited purpose described in the first paragraph of this section and would not necessarily identify all deficiencies in internal control that might be significant deficiencies or material weaknesses. We did not identify any deficiencies in internal control over financial reporting that we consider to be material weaknesses, as defined above.
A member firm of Ernst & Young Global Limited
Ernst & Young LLP MetroPark 99 Wood Avenue South P.O. Box 751 Iselin, New Jersey 08830-0471
Tel: 1 732 516 4100 www.ey.com

37
Compliance and Other Matters
As part of obtaining reasonable assurance about whether the Authority’s financial statements are free of material misstatement, we performed tests of its compliance with certain provisions of laws, regulations, contracts, and grant agreements, for which noncompliance could have a direct and material effect on the determination of financial statement amounts. However, providing an opinion on compliance with those provisions was not an objective of our audit and, accordingly, we do not express such an opinion. The results of our tests disclosed no instances of noncompliance or other matters that are required to be reported under Government Auditing Standards.
This report is intended solely for the information and use of management, Members of the New Jersey Educational Facilities Authority, and others within the entity and is not intended to be and should not be used by anyone other than these specified parties.
ey March 18, 2009


![Condensed Consolidated Financial Statements [Company Update]](https://static.fdocuments.net/doc/165x107/577ca6081a28abea748bbc00/condensed-consolidated-financial-statements-company-update.jpg)