New Jersey 2014 Uniform Reporting System Mental Health Data … · 2014 SAMHSA Uniform Reporting...
28
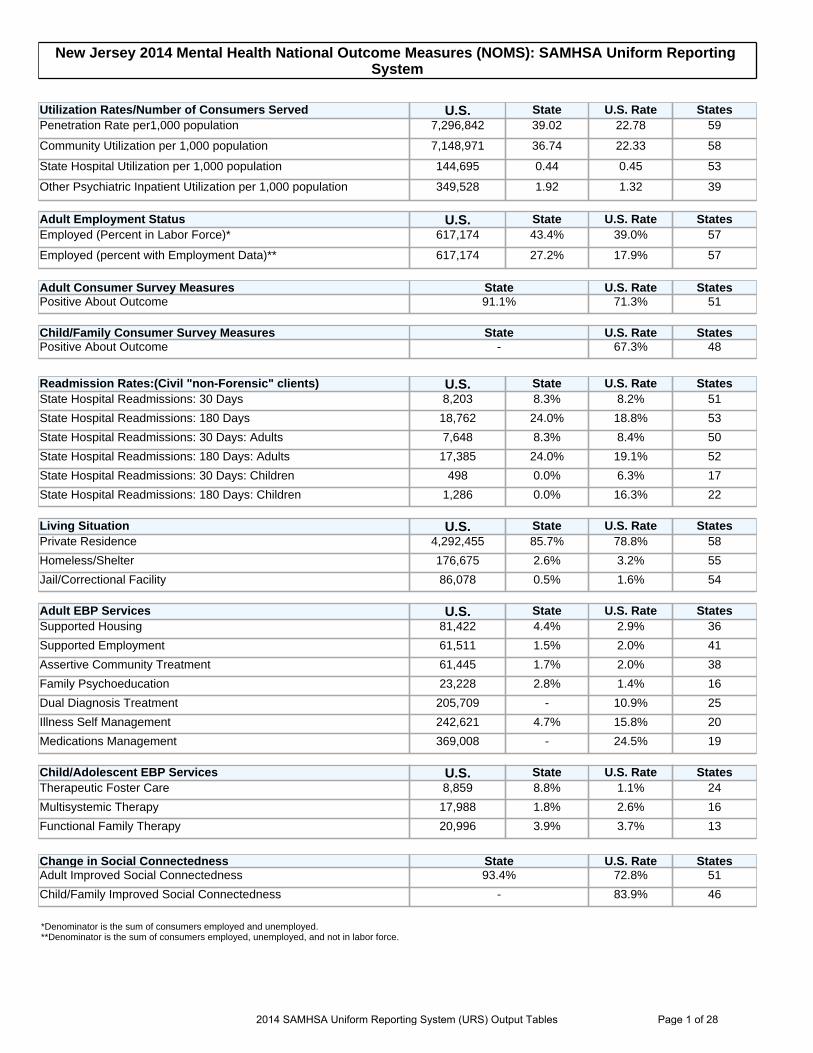
2014 SAMHSA Uniform Reporting System (URS) Output Tables Page 1 of 28 New Jersey 2014 Mental Health National Outcome Measures (NOMS): SAMHSA Uniform Reporting System Utilization Rates/Number of Consumers Served U.S. State U.S. Rate States Penetration Rate per1,000 population 7,296,842 39.02 22.78 59 Community Utilization per 1,000 population 7,148,971 36.74 22.33 58 State Hospital Utilization per 1,000 population 144,695 0.44 0.45 53 Other Psychiatric Inpatient Utilization per 1,000 population 349,528 1.92 1.32 39 Adult Employment Status U.S. State U.S. Rate States Employed (Percent in Labor Force)* 617,174 43.4% 39.0% 57 Employed (percent with Employment Data)** 617,174 27.2% 17.9% 57 Adult Consumer Survey Measures State U.S. Rate States Positive About Outcome 91.1% 71.3% 51 Child/Family Consumer Survey Measures State U.S. Rate States Positive About Outcome - 67.3% 48 Readmission Rates:(Civil "non-Forensic" clients) U.S. State U.S. Rate States State Hospital Readmissions: 30 Days 8,203 8.3% 8.2% 51 State Hospital Readmissions: 180 Days 18,762 24.0% 18.8% 53 State Hospital Readmissions: 30 Days: Adults 7,648 8.3% 8.4% 50 State Hospital Readmissions: 180 Days: Adults 17,385 24.0% 19.1% 52 State Hospital Readmissions: 30 Days: Children 498 0.0% 6.3% 17 State Hospital Readmissions: 180 Days: Children 1,286 0.0% 16.3% 22 Living Situation U.S. State U.S. Rate States Private Residence 4,292,455 85.7% 78.8% 58 Homeless/Shelter 176,675 2.6% 3.2% 55 Jail/Correctional Facility 86,078 0.5% 1.6% 54 Adult EBP Services U.S. State U.S. Rate States Supported Housing 81,422 4.4% 2.9% 36 Supported Employment 61,511 1.5% 2.0% 41 Assertive Community Treatment 61,445 1.7% 2.0% 38 Family Psychoeducation 23,228 2.8% 1.4% 16 Dual Diagnosis Treatment 205,709 - 10.9% 25 Illness Self Management 242,621 4.7% 15.8% 20 Medications Management 369,008 - 24.5% 19 Child/Adolescent EBP Services U.S. State U.S. Rate States Therapeutic Foster Care 8,859 8.8% 1.1% 24 Multisystemic Therapy 17,988 1.8% 2.6% 16 Functional Family Therapy 20,996 3.9% 3.7% 13 Change in Social Connectedness State U.S. Rate States Adult Improved Social Connectedness 93.4% 72.8% 51 Child/Family Improved Social Connectedness - 83.9% 46 *Denominator is the sum of consumers employed and unemployed. **Denominator is the sum of consumers employed, unemployed, and not in labor force.
Transcript of New Jersey 2014 Uniform Reporting System Mental Health Data … · 2014 SAMHSA Uniform Reporting...
2014 SAMHSA Uniform Reporting System (URS) Output Tables Page 1 of 28
New Jersey 2014 Mental Health National Outcome Measures (NOMS): SAMHSA Uniform Reporting System
Utilization Rates/Number of Consumers Served U.S. State U.S. Rate States Penetration Rate per1,000 population 7,296,842 39.02 22.78 59
Community Utilization per 1,000 population 7,148,971 36.74 22.33 58
State Hospital Utilization per 1,000 population 144,695 0.44 0.45 53
Other Psychiatric Inpatient Utilization per 1,000 population 349,528 1.92 1.32 39
Adult Employment Status U.S. State U.S. Rate States Employed (Percent in Labor Force)* 617,174 43.4% 39.0% 57
Employed (percent with Employment Data)** 617,174 27.2% 17.9% 57
Adult Consumer Survey Measures State U.S. Rate States Positive About Outcome 91.1% 71.3% 51
Child/Family Consumer Survey Measures State U.S. Rate States Positive About Outcome - 67.3% 48
Readmission Rates:(Civil "non-Forensic" clients) U.S. State U.S. Rate States State Hospital Readmissions: 30 Days 8,203 8.3% 8.2% 51
State Hospital Readmissions: 180 Days 18,762 24.0% 18.8% 53
State Hospital Readmissions: 30 Days: Adults 7,648 8.3% 8.4% 50
State Hospital Readmissions: 180 Days: Adults 17,385 24.0% 19.1% 52
State Hospital Readmissions: 30 Days: Children 498 0.0% 6.3% 17
State Hospital Readmissions: 180 Days: Children 1,286 0.0% 16.3% 22
Living Situation U.S. State U.S. Rate States Private Residence 4,292,455 85.7% 78.8% 58
Homeless/Shelter 176,675 2.6% 3.2% 55
Jail/Correctional Facility 86,078 0.5% 1.6% 54
Adult EBP Services U.S. State U.S. Rate States Supported Housing 81,422 4.4% 2.9% 36
Supported Employment 61,511 1.5% 2.0% 41
Assertive Community Treatment 61,445 1.7% 2.0% 38
Family Psychoeducation 23,228 2.8% 1.4% 16
Dual Diagnosis Treatment 205,709 - 10.9% 25
Illness Self Management 242,621 4.7% 15.8% 20
Medications Management 369,008 - 24.5% 19
Child/Adolescent EBP Services U.S. State U.S. Rate States Therapeutic Foster Care 8,859 8.8% 1.1% 24
Multisystemic Therapy 17,988 1.8% 2.6% 16
Functional Family Therapy 20,996 3.9% 3.7% 13
Change in Social Connectedness State U.S. Rate States Adult Improved Social Connectedness 93.4% 72.8% 51
Child/Family Improved Social Connectedness - 83.9% 46
*Denominator is the sum of consumers employed and unemployed. **Denominator is the sum of consumers employed, unemployed, and not in labor force.

2014 SAMHSA Uniform Reporting System (URS) Output Tables Page 2 of 28
SAMHSA Uniform Reporting System - 2014 State Mental Health Measures
STATE: New Jersey Utilization State Number State Rate U.S. U.S. Rate States Penetration Rate per 1,000 population 347,245 39.02 7,296,842 22.78 59 Community Utilization per 1,000 population 326,965 36.74 7,148,971 22.33 58 State Hospital Utilization per 1,000 population 3,908 0.44 144,695 0.45 53 Medicaid Funding Status 108,659 37% 4,453,600 64% 57 Employment Status (percent employed) 76,163 27% 617,174 18% 57 State Hospital Adult Admissions 2,284 0.59 110,845 0.83 53 Community Adult Admissions 35,454 0.12 11,138,443 2.32 55 Percent Adults with SMI and Children with SED 135,512 39% 5,048,543 69% 58
Utilization State Rate U.S. Rate States State Hospital LOS Discharged Adult patients (Median) 84 Days 68 Days 51 State Hospital LOS for Adult Resident patients in facility <1 year (Median) 63 Days 67 Days 50 Percent of Client who meet Federal SMI definition 42% 71% 56 Adults with Co-occurring MH/SA Disorders 24% 22% 51 Children with Co-occurring MH/SA Disorders 4% 5% 48
Adult Consumer Survey Measures State Rate U.S. Rate States Access to Services 97% 82% 50 Quality/Appropriateness of Services 99% 89% 50 Outcome from Services 91% 71% 51 Participation in Treatment Planning 97% 82% 50 General Satisfaction with Care 97% 89% 50
Child/Family Consumer Survey Measures State Rate U.S. Rate States Access to Services - 83% 47 General Satisfaction with Care - 88% 48 Outcome from Services - 67% 48 Participation in Treatment Planning - 87% 48 Cultural Sensitivity of Providers - 93% 47
Consumer Living Situations State Number State Rate U.S. U.S. Rate States Private Residence 259,218 85.7% 4,292,455 78.8% 58 Jail/Correctional Facility 1,529 0.5% 86,078 1.6% 54 Homeless or Shelter 7,870 2.6% 176,675 3.2% 55
Hospital Readmissions State Number State Rate U.S. U.S. Rate States State Hospital Readmissions: 30 Days 165 8.3% 8,203 8.2% 51 State Hospital Readmissions: 180 Days 480 24.0% 18,762 18.8% 53 Readmission to any psychiatric hospital: 30 Days - - 27,706 13.4% 24
State Mental Health Finance (FY2013) State Number State Rate U.S. U.S. Rate States SMHA Expenditures for Community MH * $1,279,843,000 68.9% $28,397,464,444 74.5% 50 SMHA Revenues from State Sources ** $934,743,000 51.0% $14,435,904,841 38.7% 50 Total SMHA Expenditures $1,857,208,000 - $38,098,637,217 - 50
Adult Evidence-Based Practices State Number State Rate U.S. U.S. Rate States Assertive Community Treatment 2,150 1.7% 61,445 2.0% 38 Supported Housing 5,531 4.4% 81,422 2.9% 36 Supported Employment 1,842 1.5% 61,511 2.0% 41 Family Psychoeducation 3,495 2.8% 23,228 1.4% 16 Integrated Dual Diagnosis Treatment - - 205,709 10.9% 25 Illness Self-Management and Recovery 5,855 4.7% 242,621 15.8% 20 Medications Management - - 369,008 24.5% 19
Child Evidence Based Practices State Number State Rate U.S. U.S. Rate States Therapeutic Foster Care 853 8.8% 8,859 1.1% 24 Multisystemic Therapy 177 1.8% 17,988 2.6% 16 Functional Family Therapy 379 3.9% 20,996 3.7% 13
Outcome State Number State Rate U.S. U.S. Rate States Adult Criminal Justice Contacts 58 7.7% 22,817 4.4% 36 Juvenile Justice Contacts 2 13.3% 5,834 3.6% 38 School Attendance (Improved ) - - 12,072 36.5% 25 * Includes Other 24 -Hour expenditures for state hospitals. ** Revenues for state hospitals and community MH

2014 SAMHSA Uniform Reporting System (URS) Output Tables Page 3 of 28
Mental Health Community Services Block Grant: 2014 State Summary Report
New Jersey
State URS Contact Person
Donna Migliorino
222 South Warren Street, PO Box 700 Trenton, NJ 08625
609-777-0669
State Revenue Expenditure Data Amount FY 2013 Mental Health Block Grant Revenues $13,665,000 FY 2013 SMHA Community MH Expenditures $1,279,843,000 FY 2013 Per Capita Community MH Expenditures $143.96 FY 2013 Community Percent of Total SMHA Spending 68.91% FY 2013 Total SMHA Mental Health Expenditure $1,857,208,000 FY 2013 Per Capita Total SMHA Mental Health Expenditures $208.90
Statewide Mental Health Agency Data*
Measure Number of Clients Utilization Rate Per 1,000 Population Total Clients Served by SMHA System 347,245 39.0 Clients Served in Community Settings 326,965 36.7 Clients Served in State Hospitals 3,908 0.4
Gender Percent Female 53.5% Male 46.3% Not Available -
Age Percent 0 to 12 2.7% 13 to 17 4.4% 18 to 20 3.7% 21 to 24 5.6% 25 to 44 30.8% 45 to 64 37.4% 65 to 74 8.1% 75 and over 6.9% Not Available 0.4%
Race/Ethnicity Percent American Indian or Alaska Native 1.0% Asian 1.4% Black or African American 19.2% Native Hawaiian or Other Pacific Islander -White 54.8% Hispanic or Latino 14.9% More Than One Race -Not Available 8.7%
Living Situation (with Known Status) Percent Private Residence 85.7% Foster Home 0.8% Residential Care 5.1% Crisis Residence -Residential Treatment Center 0.2% Institutional Setting 1.9% Jail (Correctional Facility) 0.5% Homeless (Shelter) 2.6% Other 3.3% Not Available -
Employment With Known Status (Adults) Percent Employed 27.2% Unemployed 35.5% Not In Labor Force 37.3%
Medicaid Funding Status of Consumers Percent Medicaid Only 29.6% Non-Medicaid 62.5% Both Medicaid and Other Funds 7.9%
Consumer Perception of Care: (Adults) Percent Access to Services 97.3% Quality/Appropriateness of Services 98.8% Outcome from Services 91.1% Participation in Treatment Planning 97.5% Overall Satisfaction with Care 97.1%
Consumer Perception of Care: (Children/Adolescents) Percent Access to Services -Overall Satisfaction with Care -Outcome from Services -Participation in Treatment Planning -Cultural Sensitivity of Providers -
Implementation of Evidence-Based Practices Percent Assertive Community Treatment 1.7% Supported Housing 4.4% Supported Employment 1.5% Family Psychoeducation 2.8% Integrated Dual Diagnosis Treatment -Illness Self-Management and Recovery 4.7% Medications Management -Therapeutic Foster Care 8.8% Multisystemic Therapy 1.8% Functional Family Therapy 3.9%
Outcome Measures Developmental Percent Adults Arrested this Year 7.7% Youth Arrested this Year 13.3% Improved School Attendance -
Hospital Readmissions (Civil Status Patients) Percent State Hospital Readmissions: 30 Days 8.3% State Hospital Readmissions: 180 Days 24.0% Readmission to any psychiatric hospital: 30 Days -
* Based on 2014 URS data provided by US States and Territories per annual reporting guidelines.
The Community Mental Health Block Grant is administered by the Center for Mental Health Services within the Substance Abuse and Mental Health Services Administration of the US Department of Health and Human Services
2014 SAMHSA Uniform Reporting System (URS) Output Tables Page 4 of 28
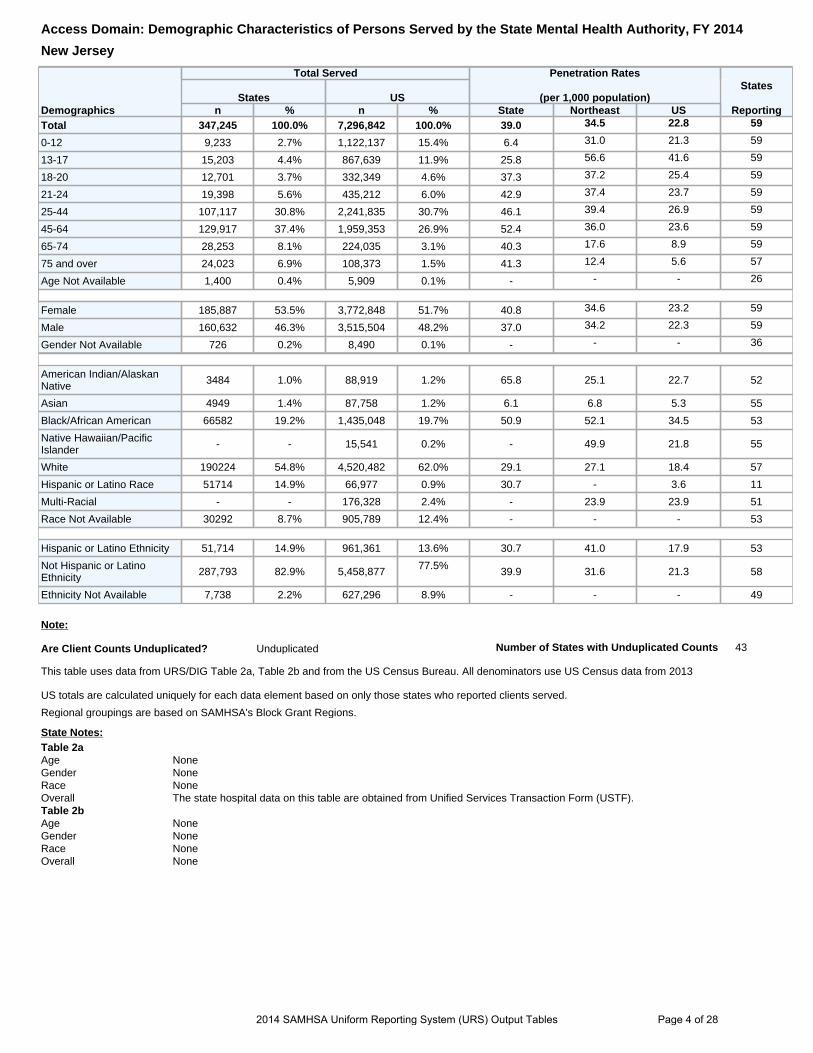
Access Domain: Demographic Characteristics of Persons Served by the State Mental Health Authority, FY 2014
New Jersey
Demographics
Total Served Penetration Rates
(per 1,000 population) States
Reporting States US
n % n % State Northeast US Total 347,245 100.0% 7,296,842 100.0% 39.0 34.5 22.8 59
0-12 9,233 2.7% 1,122,137 15.4% 6.4 31.0 21.3 59
13-17 15,203 4.4% 867,639 11.9% 25.8 56.6 41.6 59
18-20 12,701 3.7% 332,349 4.6% 37.3 37.2 25.4 59
21-24 19,398 5.6% 435,212 6.0% 42.9 37.4 23.7 59
25-44 107,117 30.8% 2,241,835 30.7% 46.1 39.4 26.9 59
45-64 129,917 37.4% 1,959,353 26.9% 52.4 36.0 23.6 59
65-74 28,253 8.1% 224,035 3.1% 40.3 17.6 8.9 59
75 and over 24,023 6.9% 108,373 1.5% 41.3 12.4 5.6 57
Age Not Available 1,400 0.4% 5,909 0.1% - - - 26
Female 185,887 53.5% 3,772,848 51.7% 40.8 34.6 23.2 59
Male 160,632 46.3% 3,515,504 48.2% 37.0 34.2 22.3 59
Gender Not Available 726 0.2% 8,490 0.1% - - - 36
American Indian/Alaskan Native 3484 1.0% 88,919 1.2% 65.8 25.1 22.7 52
Asian 4949 1.4% 87,758 1.2% 6.1 6.8 5.3 55
Black/African American 66582 19.2% 1,435,048 19.7% 50.9 52.1 34.5 53
Native Hawaiian/Pacific Islander - - 15,541 0.2% - 49.9 21.8 55
White 190224 54.8% 4,520,482 62.0% 29.1 27.1 18.4 57
Hispanic or Latino Race 51714 14.9% 66,977 0.9% 30.7 - 3.6 11
Multi-Racial - - 176,328 2.4% - 23.9 23.9 51
Race Not Available 30292 8.7% 905,789 12.4% - - - 53
Hispanic or Latino Ethnicity 51,714 14.9% 961,361 13.6% 30.7 41.0 17.9 53
Not Hispanic or Latino Ethnicity 287,793 82.9% 5,458,877 77.5% 39.9 31.6 21.3 58
Ethnicity Not Available 7,738 2.2% 627,296 8.9% - - - 49
Note:
Are Client Counts Unduplicated? Unduplicated Number of States with Unduplicated Counts 43
This table uses data from URS/DIG Table 2a, Table 2b and from the US Census Bureau. All denominators use US Census data from 2013
US totals are calculated uniquely for each data element based on only those states who reported clients served.
Regional groupings are based on SAMHSA's Block Grant Regions.
State Notes: Table 2a Age None Gender None Race None Overall The state hospital data on this table are obtained from Unified Services Transaction Form (USTF). Table 2b Age None Gender None Race None Overall None

2014 SAMHSA Uniform Reporting System (URS) Output Tables Page 5 of 28
Access Domain: Persons Served in Community Mental Health Programs by Age and Gender, FY 2014
New Jersey
Demographic
Served in Community Penetration Rates (rate per 1,000 population) States
Reporting State US
n % n % State US Age 0-17 23,800 7.3% 1,963,839 27.5% 11.8 26.7 58
Age 18-20 12,071 3.7% 323,935 4.5% 35.5 24.7 58
Age 21-64 240,329 73.5% 4,536,361 63.5% 45.7 24.6 58
Age 65+ 49,449 15.1% 319,424 4.5% 38.5 6.5 57
Age Not Available 1,316 0.4% 5,412 0.1% - - 23
Age Total 326,965 100.0% 7,148,971 100.0% 36.7 22.3 58
Female 177,047 54.1% 3,711,358 51.9% 38.9 22.8 58
Male 149,298 45.7% 3,429,670 48.0% 34.4 21.8 58
Gender Not Available 620 0.2% 7,943 0.1% - - 35
Total 326,965 100.0% 7,148,971 100.0% 36.7 22.3 58
Note:
US totals are based on states reporting.
This table uses data from URS/DIG Table 3.
US penetration rates are calculated uniquely for each data element based on only those states who reported numerator (clients served) data.
State Notes:
Age None
Gender None
Overall The state hospital data on this table are obtained from Oracle hospital census data system.

2014 SAMHSA Uniform Reporting System (URS) Output Tables Page 6 of 28
Access Domain: Persons Served in State Psychiatric Hospitals by Age and Gender, FY 2014
New Jersey
Demographic
Served in State Psychiatric Hospitals Penetration Rates (rate per 1,000 population) States
Reporting State US
n % n % State US Age 0-17 5 0.1% 10,896 7.5% 0.0 0.2 41
Age 18-20 123 3.1% 6,247 4.3% 0.4 0.5 53
Age 21-64 3,437 87.9% 120,179 83.1% 0.7 0.7 53
Age 65+ 343 8.8% 7,370 5.1% 0.3 0.2 53
Age Not Available - - 3 0.0% - - 2
Age Total 3,908 100.0% 144,695 100.0% 0.4 0.5 53
Female 1,296 33.2% 49,636 34.3% 0.3 0.3 53
Male 2,612 66.8% 95,035 65.7% 0.6 0.6 53
Gender Not Available - - 24 0.0% - - 9
Total 3,908 100.0% 144,695 100.0% 0.4 0.5 53
Notes:
US totals are based on states reporting.
This table uses data from URS/DIG Table 3.
US penetration rates are calculated uniquely for each data element based on only those states who reported numerator (clients served) data.
State Notes:
Age None
Gender None
Overall The state hospital data on this table are obtained from Oracle hospital census data system.

2014 SAMHSA Uniform Reporting System (URS) Output Tables Page 7 of 28
Access Domain: Demographic Characteristics of Adults with SMI and Children with SED Served by the State Mental Health Authority, FY 2014 New Jersey
Demographics
Total Served Penetration Rates
(per 1,000 population) States
Reporting State US
n % n % State Northeast US Total 135,512 100.0% 5,048,543 100.0% 15.2 22.2 15.8 58
0-12 3,714 2.7% 817,974 16.2% 2.6 24.5 15.5 58
13-17 6,025 4.4% 647,416 12.8% 10.2 42.9 31.0 58
18-20 4,499 3.3% 206,767 4.1% 13.2 21.2 15.8 58
21-64 97,954 72.3% 3,158,903 62.6% 18.6 22.9 17.1 58
65-74 11,281 8.3% 153,788 3.0% 16.1 11.0 6.1 58
75 and over 11,510 8.5% 62,429 1.2% 19.8 6.5 3.5 55
Age Not Available 529 0.4% 1,266 0.0% - - - 19
Female 68,717 50.7% 2,602,515 51.5% 15.1 21.8 16.0 58
Male 66,574 49.1% 2,443,006 48.4% 15.3 22.6 15.5 58
Gender Not Available 221 0.2% 3,022 0.1% - - - 33
American Indian/Alaskan Native 1,225 0.9% 57,235 1.1% 23.1 13.6 14.6 52
Asian 1,895 1.4% 66,479 1.3% 2.3 4.8 4.0 54
Black/African American 30,700 22.7% 1,050,479 20.8% 23.5 36.2 25.2 52
Native Hawaiian/Pacific Islander - - 9,740 0.2% - 36.3 13.5 55
White 69,773 51.5% 3,062,185 60.7% 10.7 17.0 12.5 55
Hispanic or Latino Race 22,323 16.5% 33,097 0.7% 13.3 - 0.6 10
Multi-Racial - - 127,822 2.5% - 18.6 16.5 51
Race Not Available 9,596 7.1% 641,506 12.7% - - - 52
Hispanic or Latino Ethnicity 22,323 16.5% 736,273 15.2% 13.3 28.7 13.6 52
Not Hispanic or Latino Ethnicity 110,013 81.2% 3,653,475 75.4% 15.2 20.2 13.9 57
Ethnicity Not Available 3,176 2.3% 454,506 9.4% - - - 48
Note: This table uses data from URS/DIG Table 14a, Table 14b and from the US Census Bureau. All denominators use US Census data from 2013
US totals are calculated uniquely for each data element based on only those states who reported clients served.
Regional groupings are based on SAMHSA's Block Grant Regions.
State Notes:
Table 14a Age None Gender None Race None Overall None Table 14b Age None Gender None Race None Overall None

2014 SAMHSA Uniform Reporting System (URS) Output Tables Page 8 of 28
Access Domain: Adults with SMI and Children with SED Served in Community Mental Health Programs by Age and Gender, FY 2014
New Jersey
Demographic
Served in Community Penetration Rates (rate per 1,000 population) States
Reporting State US
n % n % State US Age 0-17 9,318 7.7% 1,344,656 28.7% 4.6 19.0 56
Age 18-20 4,162 3.4% 189,120 4.0% 12.2 15.0 56
Age 21-64 86,256 71.5% 2,955,579 63.1% 16.4 16.6 56
Age 65+ 20,483 17.0% 196,492 4.2% 16.0 4.2 56
Age Not Available 471 0.4% 1,192 0.0% - - 17
Age Total 120,690 100.0% 4,687,039 100.0% 13.6 15.2 56
Female 62,008 51.4% 2,418,863 51.6% 13.6 15.5 56
Male 58,492 48.5% 2,265,273 48.3% 13.5 14.9 56
Gender Not Available 190 0.2% 2,903 0.1% - - 30
Total 120,690 100.0% 4,687,039 100.0% 13.6 15.2 56
Note:
US totals are based on states reporting.
This table uses data from URS/DIG Table 15a.
US penetration rates are calculated uniquely for each data element based on only those states who reported numerator (clients served) data.
State Notes:
Age None
Gender None
Overall None

2014 SAMHSA Uniform Reporting System (URS) Output Tables Page 9 of 28
Access Domain: Adults with SMI and Children with SED Served in State Psychiatric Hospitals by Age and Gender, FY 2014
New Jersey
Demographic
Served in State Psychiatric Hospitals Penetration Rates (rate per 1,000 population) States
Reporting State US
n % n % State US Age 0-17 - - 8,241 7.7% 0.0 0.1 32
Age 18-20 19 2.0% 4,133 3.9% 0.1 0.3 47
Age 21-64 865 91.3% 88,794 83.1% 0.2 0.5 47
Age 65+ 63 6.7% 5,441 5.1% 0.0 0.1 46
Age Not Available - - 211 0.2% - - 1
Age Total 947 100.0% 106,820 100.0% 0.1 0.4 48
Female 359 37.9% 36,266 34.0% 0.1 0.2 48
Male 588 62.1% 70,534 66.0% 0.1 0.5 48
Gender Not Available - - 20 0.0% - - 8
Total 947 100.0% 106,820 100.0% 0.1 0.4 48
Notes:
US totals are based on states reporting.
This table uses data from URS/DIG Table 15a.
US penetration rates are calculated uniquely for each data element based on only those states who reported numerator (clients served) data.
State Notes:
Age None
Gender None
Overall None

2014 SAMHSA Uniform Reporting System (URS) Output Tables Page 10 of 28
Appropriateness Domain: Percent of Adults and Children Served Who Meet the Federal Definition for SMI/SED and Percent of Adults and Children Served Who Have Co-Occurring MH/AOD Disorders, FY 2014
New Jersey
Adults and Children who meet the Federal Definition of SMI/SED State US Average US Median States
Reporting Percent of Adults served through the SMHA who meet the Federal definition for SMI 42.4% 71.4% 71.5% 56
Percent of Children served through the SMHA who meet the Federal definition for SED 43.5% 72.5% 76.0% 57
Co-occurring MH and Substance Abuse Consumers State US Average US Median States
Reporting Percent of Adults served through the SMHA who had a co-occurring MH and AOD disorder 23.7% 21.9% 20.0% 51
Percent of Children served through the SMHA who had a co-occurring MH and AOD disorder 3.8% 4.4% 3.5% 50
Percent of Adults served through the SMHA who met the Federal definitions of SMI who also have a substance abuse diagnosis 30.1% 22.3% 21.0% 51
Percent of Children served through the SMHA who met the Federal definitions of SED who also have a substance abuse diagnosis 5.4% 4.3% 3.5% 50
Note
This table uses data from URS/DIG Table 12.
State Notes None

2014 SAMHSA Uniform Reporting System (URS) Output Tables Page 11 of 28
ACCESS DOMAIN: Persons Served by SMHA System through Medicaid and Other Funding Sources by Race, Gender, and Ethnicity, FY 2014
STATE: New Jersey
Demographic
State US Averages
States Reporting
Number Served % Served Number Served % Served
Medicaid Only
Non-Medicaid
Only
Both Medicaid &
Other
Total Served with Known Funding
Status Medicaid
Only
Non-Medicaid
Only
Both Medicaid &
Other Medicaid
Only
Non-Medicaid
Only
Both Medicaid &
Other
Total Served with Known Funding
Status Medicaid Only Non-Medicaid
Only Both Medicaid
& Other
Female 48,450 95,261 12,161 155,872 31% 61% 8% 1,556,580 1,230,729 803,988 3,591,297 43% 34% 22% 56
Male 37,318 85,511 10,582 133,411 28% 64% 8% 1,334,731 1,235,595 755,032 3,325,358 40% 37% 23% 56
Gender Not Available 106 372 42 520 20% 72% 8% 1,951 2,896 1,318 6,165 32% 47% 21% 35
Total 85,874 181,144 22,785 289,803 30% 63% 8% 2,893,262 2,469,220 1,560,338 6,922,820 42% 36% 23% 56
American Indian or Alaska Native 982 1,904 240 3,126 31% 61% 8% 42,289 26,883 12,750 81,922 52% 33% 16% 51
Asian 898 2,557 284 3,739 24% 68% 8% 37,576 30,807 14,758 83,141 45% 37% 18% 53
Black or African American 23,784 26,434 5,005 55,223 43% 48% 9% 647,589 414,877 305,631 1,368,097 47% 30% 22% 51
Native Hawaiian or Other Pacific Islander
- - - - - - - 5,620 4,766 1,713 12,099 46% 39% 14% 51
White 33,524 113,440 12,229 159,193 21% 71% 8% 1,687,601 1,597,262 1,019,177 4,304,040 39% 37% 24% 54
Hispanic or Latino 20,962 22,241 2,850 46,053 46% 48% 6% 28,614 27,353 3,284 59,251 48% 46% 6% 9
More Than One Race - - - - - - - 76,943 57,421 34,100 168,464 46% 34% 20% 51
Race Not Available 5,724 14,568 2,177 22,469 25% 65% 10% 367,030 309,851 168,925 845,806 43% 37% 20% 51
Total 85,874 181,144 22,785 289,803 30% 63% 8% 2,893,262 2,469,220 1,560,338 6,922,820 42% 36% 23% 56
Hispanic or Latino 20,962 22,241 2,850 46,053 46% 48% 6% 369,454 309,705 236,160 915,319 40% 34% 26% 51
Not Hispanic or Latino 64,007 156,095 19,538 239,640 27% 65% 8% 2,076,616 1,870,287 1,261,230 5,208,133 40% 36% 24% 55
Ethnicity Not Available 905 2,808 397 4,110 22% 68% 10% 269,894 225,548 65,440 560,882 48% 40% 12% 48
Total 85,874 181,144 22,785 289,803 30% 63% 8% 2,715,964 2,405,540 1,562,830 6,684,334 41% 36% 23% 55
Note:
This table uses data from DIG Tables 5a, and 5b (Hispanic Origin).
Type of Medicaid Data Reported
Data based on Medicaid Eligibility, not Medicaid Paid Services.
State Notes
5a Age None
5a Gender None
5a Overall None
5b Overall None

2014 SAMHSA Uniform Reporting System (URS) Output Tables Page 12 of 28
APPROPRIATENESS DOMAIN: NUMBER OF ADMISSIONS DURING THE YEAR TO STATE HOSPITAL INPATIENT AND COMMUNITY-BASED PROGRAMS, FY 2014
STATE: New Jersey
Setting Demographic
State US Admission Rate States
Reporting Admissions During Year
Total Served At Start of Year
Total Served During Year
Admissions During Year
Total Served At Start of Year
Total Served During Year
State US
State Psychiatric Hospitals Total 2,284 1,615 3,908 120,912 42,121 144,695 0.58 0.84 53
Children - - 5 10,065 1,585 10,837 - 0.93 37
Adults 2,284 1,615 3,903 110,845 40,461 133,796 0.59 0.83 53 Age NA - - - 2 75 2 - 1.00 1
Other Inpatient Total 2,983 16,876 17,064 457,874 38,754 348,822 0.17 1.31 39
Children 381 638 631 65,184 2,275 51,464 0.60 1.27 30
Adults 2,602 16,170 16,363 392,611 36,403 297,187 0.16 1.32 39 Age NA - 68 70 79 76 71 - 1.11 6
Residential Treatment Centers Total - - - 59,805 13,130 41,036 - 1.46 39
Children - - - 41,538 6,252 18,635 - 2.23 38
Adults - - - 18,241 6,874 20,938 - 0.87 30 Age NA - - - 26 4 23 - 1.13 1
Community Programs Total 42,593 321,908 326,965 19,160,103 4,362,424 6,635,383 0.13 2.89 55
Children 7,122 22,425 23,800 8,011,615 1,130,744 1,837,226 0.30 4.36 54
Adults 35,454 298,209 301,849 11,138,443 3,228,864 4,792,729 0.12 2.32 55 Age NA 17 1,274 1,316 10,045 2,816 5,075 0.01 1.98 15
Note:
Admission Rate= number of admissions divided by total served during the year
US Admissions During Year uses data from states reporting data only. States are only included in "US Total Served" if they also reported data on admissions.
US Total Served During Year is calculated using data in URS/DIG Table 3.
This table uses data from URS/DIG Table3 and 6.
Table 3 State Notes: Age None Overall The state hospital data on this table are obtained from Oracle hospital census data system. Gender None
Table 6 State Notes: Hospital None Other Inpatient None Residential None Community None Overall None

2014 SAMHSA Uniform Reporting System (URS) Output Tables Page 13 of 28
APPROPRIATENESS DOMAIN: Length of Stays in State Psychiatric Hospitals, Other Psychiatric Inpatient and Residential Treatment Centers for Children Settings, FY 2014
STATE: New Jersey
Setting Demographic
State US
Length of Stay (Days) Length of Stay (Days)
Discharged Clients
Resident Clients in Facility 1 year
or less
Resident Clients in Facility more
than 1 year
Discharged Clients
Resident Clients in Facility 1 year
or less
Resident Clients in Facility more
than 1 year States
ReportingAverage Median Average Median Average Median Average Median Average Median Average Median
State Hospitals
All - - - - - - 157 57 98 74 1,463 897 12
Children - - - - - - 87 70 78 66 492 498 32
Adults 279 84 92 63 1,281 779 213 68 91 67 1,688 1,072 52
Age NA - - - - - - 2 - 147 - - - 1
Other Inpatient
All - - - - - - 411 117 50 37 1,902 832 5
Children - - - - - - 13 9 27 23 611 621 23
Adults - - - - - - 85 33 46 36 1,050 759 31
Age NA - - - - - - 14 9 30 29 - - 5
Residential Treatment Centers
All - - - - - - 181 190 113 111 486 445 3
Children - - - - - - 149 124 106 96 642 562 31
Adults - - - - - - 232 165 132 118 1,195 929 21
Age NA - - - - - - 12 13 139 139 - - 1
Note:
Resident clients are clients who were receiving services in inpatient settings at the end of the reporting period.
This table uses data from URS/DIG Table 6.
Table 6 State Notes:
Hospital None
Other Inpatient None
Residential None
Community None
Overall None
2014 SAMHSA Uniform Reporting System (URS) Output Tables Page 14 of 28
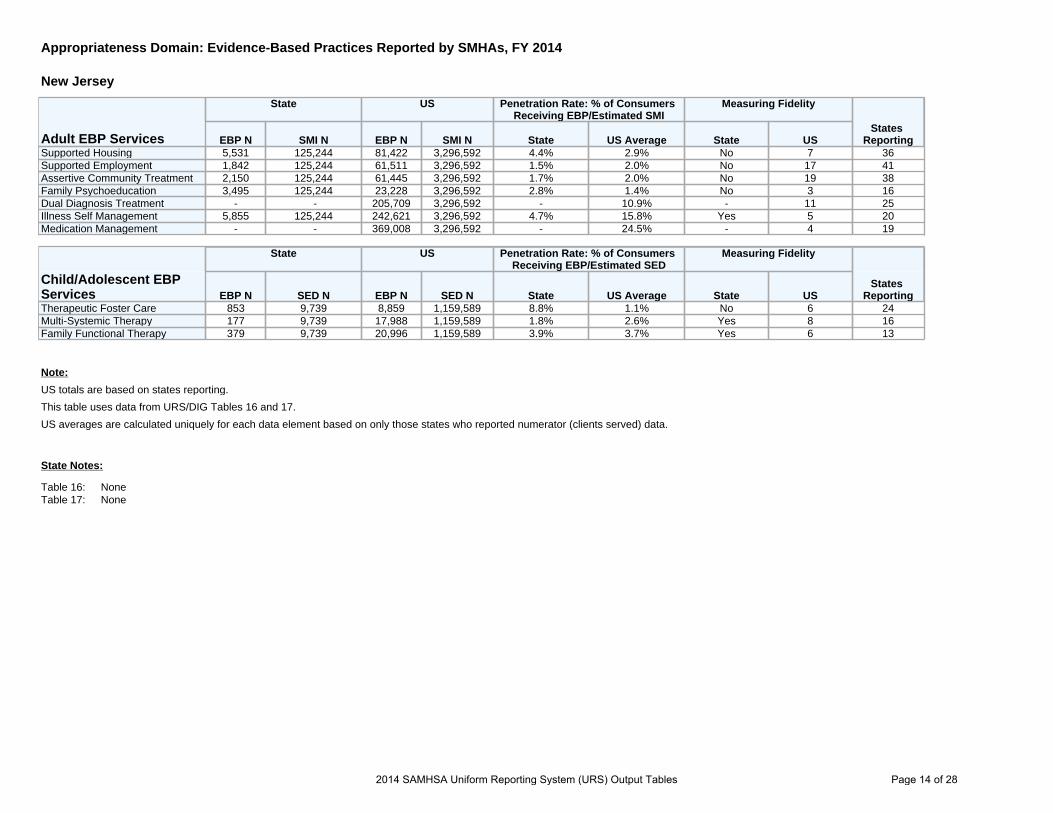
Appropriateness Domain: Evidence-Based Practices Reported by SMHAs, FY 2014
New Jersey
Adult EBP Services
State US Penetration Rate: % of Consumers Receiving EBP/Estimated SMI
Measuring Fidelity
States ReportingEBP N SMI N EBP N SMI N State US Average State US
Supported Housing 5,531 125,244 81,422 3,296,592 4.4% 2.9% No 7 36 Supported Employment 1,842 125,244 61,511 3,296,592 1.5% 2.0% No 17 41 Assertive Community Treatment 2,150 125,244 61,445 3,296,592 1.7% 2.0% No 19 38 Family Psychoeducation 3,495 125,244 23,228 3,296,592 2.8% 1.4% No 3 16 Dual Diagnosis Treatment - 205,709 3,296,592 - 10.9% - 11 25 Illness Self Management 5,855 125,244 242,621 3,296,592 4.7% 15.8% Yes 5 20 Medication Management - 369,008 3,296,592 - 24.5% - 4 19
Child/Adolescent EBP Services
State US Penetration Rate: % of Consumers Receiving EBP/Estimated SED
Measuring Fidelity
States ReportingEBP N SED N EBP N SED N State US Average State US
Therapeutic Foster Care 853 9,739 8,859 1,159,589 8.8% 1.1% No 6 24 Multi-Systemic Therapy 177 9,739 17,988 1,159,589 1.8% 2.6% Yes 8 16 Family Functional Therapy 379 9,739 20,996 1,159,589 3.9% 3.7% Yes 6 13
Note:
US totals are based on states reporting.
This table uses data from URS/DIG Tables 16 and 17.
US averages are calculated uniquely for each data element based on only those states who reported numerator (clients served) data.
State Notes:
Table 16: None Table 17: None

2014 SAMHSA Uniform Reporting System (URS) Output Tables Page 15 of 28
Outcomes Domain: Employment Status of Adult Mental Health Consumers Served in the Community by Age and Gender, FY 2014
New Jersey
Demographics
State Employed as Percent of those in Labor
Force Employed as Percent of Known
Employment Status States
ReportingEmployed Unemployed In Labor Force* With Known
Employment Status** State US State US Age Not Available - - - - - 73% - 42.2% 7 Age 21 to 64 65,139 82,098 147,237 222,933 44% 39% 29.2% 18.8% 57 Age 65 and over 9,939 15,249 25,188 45,316 39% 37% 21.9% 8.6% 56 Age 18 to 20 1,085 1,850 2,935 11,397 37% 38% 9.5% 14.2% 57 Age TOTAL 76,163 99,197 175,360 279,646 43% 39% 27.2% 17.9% 57
Female 42,968 55,296 98,264 154,277 44% 40% 27.9% 18.3% 57 Male 33,069 43,744 76,813 124,920 43% 37% 26.5% 17.3% 57 Gender Not Available 126 157 283 449 45% 42% 28.1% 17.8% 28 Gender TOTAL 76,163 99,197 175,360 279,646 43% 39% 27.2% 17.9% 57
What populations are reported? All Clients Number of States Reporting All Clients: 41 Number of States Reporting Some Clients: 16
When is Employment Status Measured? At Admission At Discharge Monthly Quarterly Other NJ Yes Yes - - -
US 39 28 3 4 35
Note:
*In Labor Force is the sum of consumers employed and unemployed.
**With Known Employment Status is the sum of consumer employed, unemployed and not in labor force.
Consumers employed as a % of those in labor force uses adults employed and unemployed as the denominator.
Consumers employed as % of known employment status uses the sum of persons employed, unemployed and not in labor force as the denominator.
This table uses data from URS/DIG Table 4.
State Notes:
Age None
Gender None
Overall None

2014 SAMHSA Uniform Reporting System (URS) Output Tables Page 16 of 28
Outcomes Domain: Employment Status of Adult Mental Health Consumers Served in the Community by Diagnosis, FY 2014
New Jersey
Diagnosis
State Employed as a % of Labor Force
Employed as % of Known Employment Status
% of Consumers with Dx
States ReportingEmployed Unemployed In Labor Force*
With Known Employment
Status** State US State US State US
Schizophrenia and Related Disorders 1,820 13,408 15,228 26,544 12.0% 25.6% 6.9% 6.4% 9.5% 13.8% 48
Bipolar and Mood Disorders 20,687 34,144 54,831 80,065 37.7% 37.2% 25.8% 14.3% 28.6% 47.7% 48
Other Psychoses 517 1,707 2,224 3,528 23.2% 25.1% 14.7% 7.1% 1.3% 3.4% 45
All other Diagnoses 36,962 29,682 66,644 108,598 55.5% 47.8% 34.0% 18.8% 38.8% 27.2% 48
No Diagnosis and Deferred Diagnosis 16,177 20,256 36,433 60,911 44.4% 41.2% 26.6% 12.8% 21.8% 7.9% 44
TOTAL 76,163 99,197 175,360 279,646 43.4% 39.2% 27.2% 14.1% 100.0% 100.0% 48
Note:
*In Labor Force is the sum of consumers employed and unemployed.
**With Known Employment Status is the sum of consumer employed, unemployed and not in labor force.
Consumers employed as a % of those in labor force uses adults employed and unemployed as the denominator.
Consumers employed as % of known employment status uses the sum of persons employed, unemployed and not in labor force as the denominator.
This table uses data for URS/DIG Table 4a.
State Notes:
None

2014 SAMHSA Uniform Reporting System (URS) Output Tables Page 17 of 28
APPROPRIATENESS DOMAIN: Living Situation of Consumers Served by State Mental Health Agency Systems, FY 2014
STATE: New Jersey
Age Group Setting
State US
States Reporting
Living Situation
Percent in Living
Situation
Percent with Known Living
Situation Living
Situation Percent in
Living Situation
Percent with Known Living
Situation
All Persons Served
Private Residence 259,218 74.6% 85.7% 4,292,455 65.8% 78.8% 58
Foster Home 2,271 0.7% 0.8% 88,652 1.4% 1.6% 49
Residential Care 15,405 4.4% 5.1% 208,478 3.2% 3.8% 53
Crisis Residence - - - 8,703 0.1% 0.2% 31
Residential Treatment Center
514 0.1% 0.2% 17,133 0.3% 0.3% 35
Institutional Setting 5,654 1.6% 1.9% 95,645 1.5% 1.8% 52
Jail (Correctional Facility) 1,529 0.4% 0.5% 86,078 1.3% 1.6% 54
Homeless (Shelter) 7,870 2.3% 2.6% 176,675 2.7% 3.2% 55
Other 9,939 2.9% 3.3% 475,868 7.3% 8.7% 44
Not Available 44,845 12.9% - 1,072,891 16.4% - 46
Total 347,245 100.0% 100.0% 6,522,578 100.0% 100.0% 58
Children under age 18
Private Residence 22,148 90.6% 95.1% 1,172,078 67.7% 82.3% 58
Foster Home 394 1.6% 1.7% 53,919 3.1% 3.8% 49
Residential Care 174 0.7% 0.7% 20,046 1.2% 1.4% 46
Crisis Residence - - - 1,960 0.1% 0.1% 25
Residential Treatment Center
70 0.3% 0.3% 9,820 0.6% 0.7% 33
Institutional Setting 124 0.5% 0.5% 11,096 0.6% 0.8% 45
Jail (Correctional Facility) 21 0.1% 0.1% 4,407 0.3% 0.3% 49
Homeless (Shelter) 97 0.4% 0.4% 7,488 0.4% 0.5% 51
Other 271 1.1% 1.2% 143,310 8.3% 10.1% 43
Not Available 1,137 4.7% - 306,290 17.7% - 42
Total 24,436 100.0% 100.0% 1,730,414 100.0% 100.0% 58
Adults over age 18
Private Residence 236,506 73.6% 85.0% 3,113,361 65.1% 77.5% 58
Foster Home 1,873 0.6% 0.7% 34,331 0.7% 0.9% 47
Residential Care 15,127 4.7% 5.4% 187,431 3.9% 4.7% 53
Crisis Residence - - - 6,742 0.1% 0.2% 29
Residential Treatment Center
444 0.1% 0.2% 7,309 0.2% 0.2% 27
Institutional Setting 5,432 1.7% 2.0% 83,788 1.8% 2.1% 52
Jail (Correctional Facility) 1,506 0.5% 0.5% 81,581 1.7% 2.0% 53
Homeless (Shelter) 7,768 2.4% 2.8% 169,116 3.5% 4.2% 54
Other 9,600 3.0% 3.5% 331,500 6.9% 8.3% 43
Not Available 43,186 13.4% - 763,942 16.0% - 46
Total 321,442 100.0% 100.0% 4,779,101 100.0% 100.0% 58
This table uses data from URS/DIG Table 15.
State Notes:
None

2014 SAMHSA Uniform Reporting System (URS) Output Tables Page 18 of 28
APPROPRIATENESS DOMAIN: Persons Who were Homeless by Age, Gender, Race, and Ethnicity, FY 2014
STATE: New Jersey
Demographic
Homeless or Living in Shelters Percent of Total with Known Living Situation
States
Reporting
State US State US
N % N % % %
Age 0 to 17 97 1.2% 7,488 4.2% 0.4% 0.5% 51
Age 18 to 64 7,048 89.6% 165,093 93.4% 3.0% 4.4% 54
Age 65+ 720 9.1% 4,023 2.3% 1.8% 1.6% 51
Age Not Available 5 0.1% 71 0.0% 0.6% 0.7% 10
Age Total 7,870 100.0% 176,675 100.0% 2.6% 3.2% 55
Female 3,057 38.8% 69,169 39.2% 1.9% 2.5% 54
Male 4,799 61.0% 107,318 60.7% 3.4% 4.1% 54
Gender Not Available 14 0.2% 188 0.1% 2.6% 2.8% 19
Gender Total 7,870 100.0% 176,675 100.0% 2.6% 3.2% 55
American Indian or Alaska Native 104 1.3% 2,454 1.4% 3.7% 3.4% 48
Asian 65 0.8% 1,325 0.7% 1.6% 1.8% 46
Black or African American 2,771 35.2% 57,144 32.3% 4.6% 5.2% 51
Native Hawaiian or Other Pacific Islander - - 364 0.2% - 3.2% 34
White 3,655 46.4% 93,620 53.0% 2.3% 2.9% 52
Hispanic or Latino 763 9.7% 940 0.5% 1.6% 1.7% 6
More Than One Race - - 4,342 2.5% - 2.8% 43
Race Not Available 512 6.5% 16,486 9.3% 2.0% 2.3% 45
Race Total 7,870 100.0% 176,675 100.0% 2.6% 3.2% 55
Hispanic or Latino 6,996 88.9% 29,369 16.6% 2.8% 2.7% 49
Not Hispanic or Latino 763 9.7% 132,750 75.1% 1.6% 3.4% 54
Not Available 111 1.4% 14,556 8.2% 2.6% 3.1% 43
Ethnicity Total 7,870 100.0% 176,675 100.0% 2.6% 3.2% 55
Note:
US totals are based on states reporting.
This table uses data from URS/DIG Table 15.
US totals are calculated uniquely for each data element based on only those states who reported numerator (clients served) data.
State Notes:
None

OUTCOMES DOMAIN: Consumer Survey Results, FY 2014
2014 SAMHSA Uniform Reporting System (URS) Output Tables Page 19 of 28
CONSUMER SURVEY RESULTS, FY 2014
STATE: New Jersey
Indicators Children: State Children: U.S. Average
States Reporting
Adults: State Adults: U.S. Average
States Reporting
Reporting Positively About Access - 82.8% 47 97.3% 85.1% 50
Reporting Positively About Quality and Appropriateness
98.8% 88.5% 50
Reporting Positively About Outcomes - 67.3% 48 91.1% 69.7% 51
Reporting on Participation in Treatment Planning
- 87.0% 48 97.5% 80.1% 50
Family Members Reporting High Cultural Sensitivity of Staff
- 92.7% 47
Reporting positively about General Satisfaction with Services
- 87.2% 48 97.1% 89.0% 50
Note: U.S. Average Children & Adult rates are calculated only for states that used a version of the MHSIP Consumer Survey
This table uses data from URS/DIG Table 11. Children/Family State U.S.
Type of Survey Used YSS-F=39
Type of Adult Consumer Survey Used 28-Item MHSIP Other MHSIP Other Survey state Yes - -
U.S. 26 24 1
Sample Size & Response Rate Children: State Children: U.S. States Reporting
Adults: State Adults: U.S. Average
States Reporting
Response Rate - 40.0% 39 16.1% 42.0% 41
Number of Surveys Attempted (send out) - 171,107 39 6,633 234,854 40
Number of Surveys Contacts Made - 142,206 37 6,633 179,944 39
Complete Surveys - 64,648 42 1,071 126,490 45
Populations covered in survey Children: State Children: U.S. Adults: State Adults: U.S.
All Consumers - 4 - 1
Sample - 43 Yes 50
Sample Approach Children: State Children: U.S. Adults: State Adults: U.S.
Random Sample - 7 - 7
Stratified Sample - 15 Yes 17
Convenience Sample - 18 - 22
Other Sample - 5 Yes 4
Who is Sampled? Children: State Children: U.S. Adults: State Adults: U.S.
Current Clients - 45 Yes 50
Former Clients - 16 - 18
Populations included in sample: (e.g., all adults, only adults with SMI, etc.)
Children: State Children: U.S. Adults: State Adults: U.S.
All Children or Adults Served - 26 Yes 32
SMI Adults or SED Children - 18 - 23
Persons Covered by Medicaid - 11 - 13
Other - 7 - 7
State Notes: Adult: In Fall 2014, 6,633 surveys were mailed to consumers of community-based, non-acute services at 628 service program sites run by 84 contracted agencies. 1,009 survey responses were collected & processed. SMHA not responsible for children’s data.

2014 SAMHSA Uniform Reporting System (URS) Output Tables Page 20 of 28
OUTCOMES DOMAIN: Consumer Survey Results, by Race/Ethnicity FY 2014 STATE: New Jersey
Race/Ethnicity
Adult Consumer Survey Indicators: Reporting Positively About...
States Access Quality & Appropriateness Outcomes Participation In Tx Planning General Satisfaction Social Connectedness Improved Functioning
State US Average State US Average State US Average State US Average State US Average State US Average State US Average
Total 97% 86% 99% 89% 91% 70% 97% 82% 97% 89% 93% 70% 94% 71% 42
American Indian or Alaska Native 71% 84% 100% 85% 71% 69% 100% 78% 86% 86% 86% 71% 86% 70% 36
Asian 95% 88% 100% 87% 89% 72% 100% 81% 95% 91% 90% 71% 85% 73% 34
Black or African American 99% 87% 99% 89% 92% 74% 97% 82% 98% 88% 95% 73% 94% 74% 39 Native Hawaiian or Other Pacific Islander 100% 84% 100% 87% 80% 73% 100% 82% 100% 90% 100% 63% 100% 72% 26
White 97% 86% 98% 90% 91% 70% 98% 83% 98% 89% 94% 70% 94% 70% 39
Hispanic or Latino 95% 88% 99% 91% 98% 73% 99% 84% 96% 90% 92% 73% 92% 74% 32
More Than One Race 97% 82% 97% 86% 91% 67% 93% 78% 97% 87% 88% 65% 91% 69% 32
Not Available 96% 84% 99% 88% 92% 72% 98% 81% 96% 88% 92% 70% 95% 71% 37
Race/Ethnicity
Family of Children Survey Indicators: Reporting Positively About...
States Access
General Satisfaction with Services Outcomes Participation In Tx Planning
Cultural Sensitivity of Staff Social Connectedness Improved Functioning
State US Average State US Average State US Average State US Average State US Average State US Average State US Average
Total - 86% - 87% - 69% - 88% - 94% - 87% - 71% 39
American Indian or Alaska Native - 84% - 85% - 69% - 86% - 92% - 87% - 70% 35
Asian - 82% - 86% - 71% - 88% - 92% - 82% - 76% 27
Black or African American - 86% - 86% - 68% - 88% - 95% - 87% - 69% 35 Native Hawaiian or Other Pacific Islander - 86% - 90% - 79% - 84% - 90% - 87% - 75% 20
White - 87% - 87% - 67% - 90% - 95% - 87% - 69% 36
Hispanic or Latino - 84% - 86% - 70% - 84% - 91% - 87% - 75% 29
More Than One Race - 83% - 85% - 65% - 87% - 94% - 84% - 69% 27
Not Available - 85% - 88% - 71% - 86% - 94% - 86% - 74% 35
Notes:
This table uses data from URS/DIG Table 11a.
State Notes:
None

2014 SAMHSA Uniform Reporting System (URS) Output Tables Page 21 of 28
Outcomes Domain: Change in Social Connectedness and Functioning, FY 2014
New Jersey
Indicators
Children Adults
State US Average US Median States
Reporting State US Average US Median States
Reporting Percent Reporting Improved Social Connectedness from Services - 83.9% 85.5% 46 93.4% 72.8% 70.0% 51
Percent Reporting Improved Functioning from Services - 69.5% 64.3% 48 94.1% 70.9% 70.2% 50
Note:
This table uses data from URS/DIG Table 9.
US State Averages and Medians are calculated only with states which used the recommended Social Connectedness and Functioning questions.
Adult Social Connectedness and Functioning Measures State US Did you use the recommended new Social Connectedness Questions? Yes 48
Did you use the recommended new Functioning Domain Questions? Yes 48
Did you collect these as part of your MHSIP Adult Consumer Survey? Yes 50
Children/Family Social Connectedness and Functioning Measures State US Did you use the recommended new Social Connectedness Questions? - 44
Did you use the recommended new Functioning Domain Questions? - 45
Did you collect these as part of your YSS-F Survey? - 45
State Notes:
None
2014 SAMHSA Uniform Reporting System (URS) Output Tables Page 22 of 28
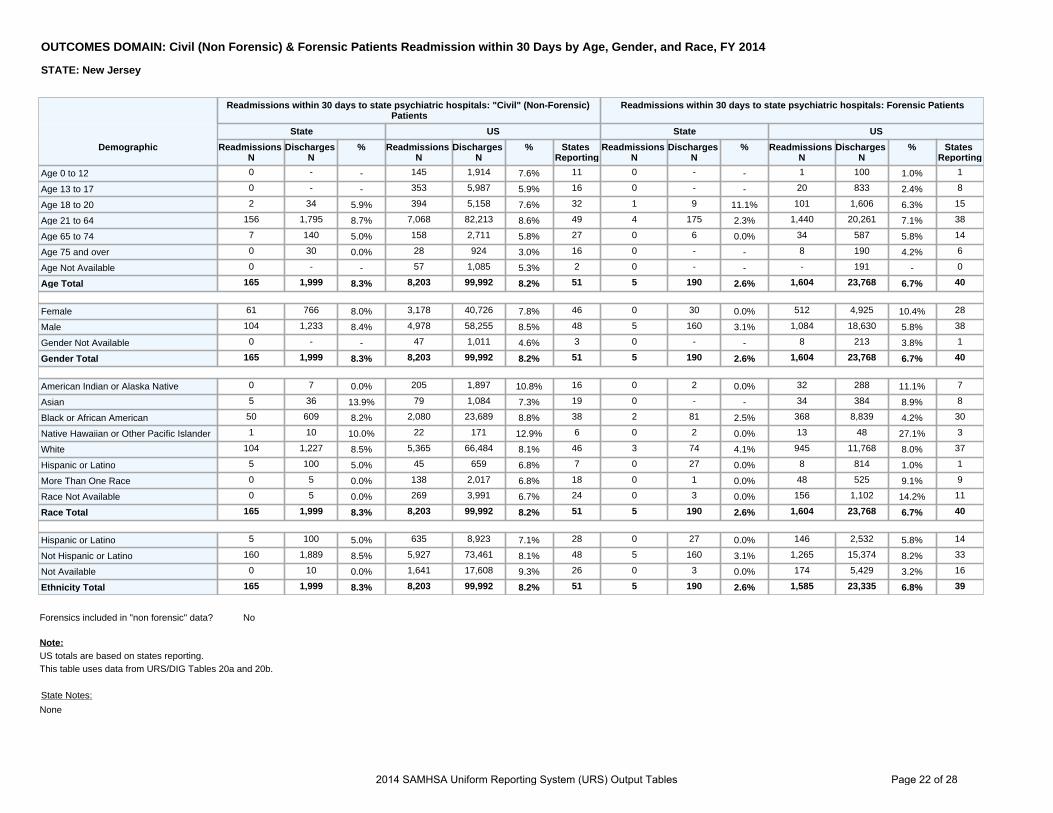
OUTCOMES DOMAIN: Civil (Non Forensic) & Forensic Patients Readmission within 30 Days by Age, Gender, and Race, FY 2014
STATE: New Jersey
Demographic
Readmissions within 30 days to state psychiatric hospitals: "Civil" (Non-Forensic) Patients
Readmissions within 30 days to state psychiatric hospitals: Forensic Patients
State US State US
Readmissions N
Discharges N
% Readmissions N
Discharges N
% States Reporting
Readmissions N
Discharges N
% Readmissions N
Discharges N
% States Reporting
Age 0 to 12 0 - - 145 1,914 7.6% 11 0 - - 1 100 1.0% 1
Age 13 to 17 0 - - 353 5,987 5.9% 16 0 - - 20 833 2.4% 8
Age 18 to 20 2 34 5.9% 394 5,158 7.6% 32 1 9 11.1% 101 1,606 6.3% 15
Age 21 to 64 156 1,795 8.7% 7,068 82,213 8.6% 49 4 175 2.3% 1,440 20,261 7.1% 38
Age 65 to 74 7 140 5.0% 158 2,711 5.8% 27 0 6 0.0% 34 587 5.8% 14
Age 75 and over 0 30 0.0% 28 924 3.0% 16 0 - - 8 190 4.2% 6
Age Not Available 0 - - 57 1,085 5.3% 2 0 - - - 191 - 0
Age Total 165 1,999 8.3% 8,203 99,992 8.2% 51 5 190 2.6% 1,604 23,768 6.7% 40
Female 61 766 8.0% 3,178 40,726 7.8% 46 0 30 0.0% 512 4,925 10.4% 28
Male 104 1,233 8.4% 4,978 58,255 8.5% 48 5 160 3.1% 1,084 18,630 5.8% 38
Gender Not Available 0 - - 47 1,011 4.6% 3 0 - - 8 213 3.8% 1
Gender Total 165 1,999 8.3% 8,203 99,992 8.2% 51 5 190 2.6% 1,604 23,768 6.7% 40
American Indian or Alaska Native 0 7 0.0% 205 1,897 10.8% 16 0 2 0.0% 32 288 11.1% 7
Asian 5 36 13.9% 79 1,084 7.3% 19 0 - - 34 384 8.9% 8
Black or African American 50 609 8.2% 2,080 23,689 8.8% 38 2 81 2.5% 368 8,839 4.2% 30
Native Hawaiian or Other Pacific Islander 1 10 10.0% 22 171 12.9% 6 0 2 0.0% 13 48 27.1% 3
White 104 1,227 8.5% 5,365 66,484 8.1% 46 3 74 4.1% 945 11,768 8.0% 37
Hispanic or Latino 5 100 5.0% 45 659 6.8% 7 0 27 0.0% 8 814 1.0% 1
More Than One Race 0 5 0.0% 138 2,017 6.8% 18 0 1 0.0% 48 525 9.1% 9
Race Not Available 0 5 0.0% 269 3,991 6.7% 24 0 3 0.0% 156 1,102 14.2% 11
Race Total 165 1,999 8.3% 8,203 99,992 8.2% 51 5 190 2.6% 1,604 23,768 6.7% 40
Hispanic or Latino 5 100 5.0% 635 8,923 7.1% 28 0 27 0.0% 146 2,532 5.8% 14
Not Hispanic or Latino 160 1,889 8.5% 5,927 73,461 8.1% 48 5 160 3.1% 1,265 15,374 8.2% 33
Not Available 0 10 0.0% 1,641 17,608 9.3% 26 0 3 0.0% 174 5,429 3.2% 16
Ethnicity Total 165 1,999 8.3% 8,203 99,992 8.2% 51 5 190 2.6% 1,585 23,335 6.8% 39
Forensics included in "non forensic" data? No
Note: US totals are based on states reporting. This table uses data from URS/DIG Tables 20a and 20b.
State Notes:
None

2014 SAMHSA Uniform Reporting System (URS) Output Tables Page 23 of 28
OUTCOMES DOMAIN: Civil (Non Forensic) & Forensic Patients Readmission within 180 Days by Age, Gender, and Race, FY 2014
STATE: New Jersey
Demographic
Readmissions within 180 days to state psychiatric hospitals: "Civil" (Non-Forensic) Patients
Readmissions within 180 days to state psychiatric hospitals: Forensic Patients
State US State US
Readmissions N
Discharges N
% Readmissions N
Discharges N
% States Reporting
Readmissions N
Discharges N
% Readmissions N
Discharges N
% States Reporting
Age 0 to 12 0 - - 369 1,914 19.3% 16 0 - - 6 100 6.0% 5
Age 13 to 17 0 - - 917 5,987 15.3% 20 0 - - 47 833 5.6% 11
Age 18 to 20 4 34 11.8% 850 5,158 16.5% 43 3 9 33.3% 275 1,606 17.1% 25
Age 21 to 64 450 1,795 25.1% 16,098 82,213 19.6% 52 22 175 12.6% 3,506 20,261 17.3% 44
Age 65 to 74 24 140 17.1% 360 2,711 13.3% 35 0 6 - 75 587 12.8% 22
Age 75 and over 2 30 6.7% 77 924 8.3% 22 0 - - 21 190 11.1% 15
Age Not Available 0 - - 91 1,085 8.4% 4 0 - - 8 191 4.2% 1
Age Total 480 1,999 24.0% 18,762 99,992 18.8% 53 25 190 13.2% 3,938 23,768 16.6% 47
Female 194 766 25.3% 7,374 40,726 18.1% 49 5 30 16.7% 1,096 4,925 22.3% 38
Male 286 1,233 23.2% 11,318 58,255 19.4% 50 20 160 12.5% 2,817 18,630 15.1% 45
Gender Not Available 0 - - 70 1,011 6.9% 3 0 - - 25 213 11.7% 2
Gender Total 480 1,999 24.0% 18,762 99,992 18.8% 53 25 190 13.2% 3,938 23,768 16.6% 47
American Indian or Alaska Native 0 7 0.0% 507 1,897 26.7% 23 0 2 - 65 288 22.6% 15
Asian 8 36 22.2% 174 1,084 16.1% 29 0 - - 78 384 20.3% 17
Black or African American 134 609 22.0% 4,715 23,689 19.9% 44 15 81 18.5% 1,202 8,839 13.6% 38
Native Hawaiian or Other Pacific Islander 1 10 10.0% 33 171 19.3% 11 0 2 - 23 48 47.9% 4
White 329 1,227 26.8% 12,403 66,484 18.7% 49 9 74 12.2% 2,109 11,768 17.9% 44
Hispanic or Latino 8 100 8.0% 119 659 18.1% 8 1 27 3.7% 49 814 6.0% 7
More Than One Race 0 5 0.0% 247 2,017 12.2% 24 0 1 - 99 525 18.9% 11
Race Not Available 0 5 0.0% 564 3,991 14.1% 28 0 3 - 313 1,102 28.4% 14
Race Total 480 1,999 24.0% 18,762 99,992 18.8% 53 25 190 13.2% 3,938 23,768 16.6% 47
Hispanic or Latino 8 100 8.0% 1,438 8,923 16.1% 34 1 27 3.7% 385 2,532 15.2% 21
Not Hispanic or Latino 472 1,889 25.0% 13,916 73,461 18.9% 49 24 160 15.0% 2,892 15,374 18.8% 41
Not Available 0 10 0.0% 3,408 17,608 19.4% 33 0 3 - 578 5,429 10.6% 22
Ethnicity Total 480 1,999 24.0% 18,762 99,992 18.8% 53 25 190 13.2% 3,855 23,335 16.5% 46
Forensics included in "non forensic" data? No
Note: US totals are based on states reporting. This table uses data from URS/DIG Tables 20a and 20b.
State Notes:
None

2014 SAMHSA Uniform Reporting System (URS) Output Tables Page 24 of 28
Structure Domain: Federal Mental Health Block Grant Expenditures for Non-Direct Service Activities, FY 2014
New Jersey
Service Non-Direct Block Grant Expenditures % Total US % Total
Technical Assistance Activities - - 40.4%
Planning Council $10,872 12.8% 4.2%
Administration $74,336 87.2% 24.0%
Data Collection/Reporting - - 7.3%
Other Activities - - 24.2%
Total $85,208 100.0% 100.0%
Note: This table use data from URS/DIG Table 8.
State Notes:
None

2014 SAMHSA Uniform Reporting System (URS) Output Tables Page 25 of 28
STRUCTURE DOMAIN: State Mental Health Agency Controlled Expenditures for Mental Health, FY 2013
STATE New Jersey
Expenditures: State Percent of Total Expenditures: State
Expenditures: U.S. Percent of Total Expenditures: U.S.
State Hospitals-Inpatient $551,934,000 30% $8,891,294,399 23%
Other 24-Hour Care $642,837,000 35% $7,208,595,272 19%
Ambulatory/Community $637,006,000 34% $21,188,869,172 56%
Total $1,857,208,000 - $38,098,637,217 -
Note:
Other 24-Hour Care includes state psychiatric hospital and community based other 24-hour as well as community based inpatient expenditures.
Ambulatory/Community includes expenditures for less than 24-hour care services provided at state psychiatric hospitals. It excludes community based other-24 hour and community based inpatient expenditures.
Total also includes additional SMHA Expenditures for research, training, administration, and other central and regional office expenditures.
Data from NRI's Funding Sources and Expenditures of State Mental Health Agencies, FY 2013 reports - Table 18 "SMHA-Controlled Expenditures for Mental Health Services."
U.S. totals are based on 50 states reporting.
More information on the State Mental Health Agency's Revenues & Expenditures as well as State Footnotes can be found on the NRI website: http://www.nri-incdata.org/

Note:
2014 SAMHSA Uniform Reporting System (URS) Output Tables Page 26 of 28
STRUCTURE DOMAIN: State Mental Health Agency Controlled Revenues by Funding Sources, FY 2013
STATE New Jersey
Funding Source Ambulatory/Community State Hospital
State Revenues Percent Total
(State) Percent Total (US) State Revenues Percent Total
(State) Percent Total (US)
Medicaid $498,746,000 39.0% 59.2% $8,744,000 1.6% 22.2%
Community MH Block Grant $13,504,000 1.1% 1.3% - - -
Other SAMHSA $2,476,000 0.2% 0.3% - - -
other Federal(non-SAMHSA) $40,334,000 3.2% 2.5% $18,790,000 3.4% 4.2%
State $460,256,000 36.0% 28.2% $474,487,000 86.0% 68.0%
Other $77,676,000 6.1% 5.6% $2,901,000 0.5% 4.5%
Total $1,279,843,000 100.0% 100.0% $551,934,000 100.0% 100.0%
Note:
Data from NRI's Funding Sources and Expenditures of State Mental Health Agencies, FY 2013 reports - State Mental Health Agency Controlled Expenditures and Revenus, Table 24, 25, and 26.
This table does not show Revenues for state central office including Research, Training, and Administration expenses.
More information on the State Mental Health Agency's Revenues & Expenditures as well as State Footnotes can be found on the NRI website: http://www.nri-incdata.org/

2014 SAMHSA Uniform Reporting System (URS) Output Tables Page 27 of 28
Structure Domain: Mental Health Programs Funded By the Federal Mental Health Block Grant, FY 2014
New Jersey
Total Programs = 30 Adult Total: $12,986,282 Total: $12,986,282
Agency Name Address Area Served Block Grant for Adults with SMI
Block Grant for Children with SED
AtlantiCare Behavioral Health 6550 Delilah Rd., Suite 301, Egg Harbor Twp, NJ 8234
Sub-State Planning Area $393,978 $0
Career Opportunity Development, Inc. 901 Atlantic Avenue, Egg Harbor, NJ 8215
Sub-State Planning Area $135,187 $0
Jewish Family Service of Atlantic County 607 N. Jerome Avenue, Margate, NJ 8402 Sub-State Planning Area $313,073 $0
Comprehensive Behavioral Healthcare, Inc. (CompCare)
516 Valley Brook Ave, Lyndhurst, NJ 7071 Sub-State Planning Area $355,681 $0
Care Plus NJ, Inc. 610 Valley Health Plaza, Paramus, NJ 7652
Sub-State Planning Area $525,126 $0
Legacy Treatment Services (formerly The Lester A. Drenk Behavioral Health Center)
1289 Route 38 West, Suite 203, Hainesport, NJ 8036
Sub-State Planning Area $287,646 $0
Twin Oaks Community Services (formerly FSB) 770 Woodlane Road, Mount Holly, NJ 8060
Sub-State Planning Area $1,779,939 $0
South Jersey Behavioral Health Resources (CAMcare)
2500 McClellan Avenue, Suite 300, Pennsauken, NJ 8109
Sub-State Planning Area $394,965 $0
Cape Counseling Services 1129 Route 9 South, Suite #1, Cape May Court House, NJ 8210
Sub-State Planning Area $172,601 $0
Cumberland County Guidance Center 2038 Carmel Road - Box 808, Millville, NJ 8332
Sub-State Planning Area $391,433 $0
Catholic Charities of the Archdiocese of Newark/ Mt. Carmel Guild Behavioral Healthcare Division
590 North 7th Street, Newark, NJ 7107 Sub-State Planning Area $508,361 $0
Newark Beth Israel Medical Center 201 Lyons Avenue at Osborne Terrace , Newark, NJ 7112
Sub-State Planning Area $144,446 $0
Mental Health Assoc. of Essex County 33 South Fullerton Avenue, Montclair, NJ 7042
Sub-State Planning Area $460,286 $0
East Orange General Hospital 300 Central Avenue, East Orange, NJ 7019
Sub-State Planning Area $227,364 $0
UMDNJ - University Behavioral Healthcare - NEWARK
Box 1392 - 671 Hoes Lane , Piscataway, NJ 8855
Sub-State Planning Area $207,781 $0
Project Live 465-475 Broadway, Newark, NJ 7104 Sub-State Planning Area $138,161 $0
NewPoint Behavioral Health Center 404 Tatum Street, Woodbury, NJ 8096 Sub-State Planning Area $311,943 $0
Jersey City Medical Center 395 Grand Street, 3rd Fl, Jersey City, NJ 7302
Sub-State Planning Area $633,575 $0
Greater Trenton Behavioral Healthcare Box 1393, Trenton, NJ 8607 Sub-State Planning Area $853,783 $0
Catholic Charities, Diocese of Trenton 383 W. State St., Box 1423, Trenton, NJ 8607
Sub-State Planning Area $508,751 $0
UMDNJ - University Behavioral Healthcare - PISCATAWAY
Box 1392 - 671 Hoes Lane Piscataway, Piscataway, NJ 8855
Sub-State Planning Area $393,277 $0
CPC Behavioral Healthcare, Inc. 10 Industrial Way East, Eatontown, NJ 7724
Sub-State Planning Area $242,285 $0
St. Clare’s Hospital, Inc. 50 Morris Avenue, Denville, NJ 7834 Sub-State Planning Area $385,420 $0
Ocean Mental Health Services, Inc. 160 Route 9, Bayville, NJ 8721 Sub-State Planning Area $198,495 $0
Preferred Behavioral Health of NJ 700 Airport Road, P.O. Box 2036 , Lakewood, NJ 8701
Sub-State Planning Area $330,020 $0
Mental Health Clinic of Passaic 1451 VanHouten Ave, Clifton, NJ 7013 Sub-State Planning Area $149,277 $0
St. Joseph's Hospital & Medical Center 703 Main St, Paterson , NJ 7503 Sub-State Planning Area $395,965 $0
Healthcare Commons, Inc. - Family Health Services
500 South Pennsville-Auburn Rd, Carneys Point, NJ 8069
Sub-State Planning Area $122,603 $0
Bridgeway Rehabilitation, Inc. 615 North Broad Street, Elizabeth, NJ 7208
Sub-State Planning Area $1,732,747 $0
Trinitas Hospital (Elizabeth General) 655 East Jersey Street, Elizabeth, NJ 7206
Sub-State Planning Area $292,113 $0

2014 SAMHSA Uniform Reporting System (URS) Output Tables Page 28 of 28
General Notes FY 2014
New Jersey
URS Table Number General Notes
6 Total Admission to Community Program during the year: at the time of URS data submission, the fourth quarter of FY2014 data was not complete. In addition, many screening centers did not submit their data. These two reasons account for the reduction of admission from 2013 to 2014.
6 The admissions to other psychiatric inpatient facilities have decreased steadily from 2013 to 2014. Additional reduction was due to the closure of one county psychiatric hospital in the FY 2014.
8 Given programmatic and operational needs in FY2014, the State decided to allocate more Mental Health Block Grant resources to direct services to clients.
9, 11, 11a, 19a
Consumer Survey Data for the adult population were collected and reported by NJ DHS DMHAS (the SMHA). Children's data are to be reported by the Division of the Children’s System of Care (DCSOC). DCSOC has a delay in processing the documents for distribution.
9, 11, 11a, 19a
Number of surveys completed: At the time of the survey analysis DMHAS had received 1,071 adult surveys. Unfortunately 62 of those surveys remained unprocessed due to paper/scanner incompatibilities (e.g., poor paper quality, missing pages, and ripped questionnaires). At the time of analysis & reporting (11/21/14) 1,009 questionnaires were processed, scanned, analyzed and included in URS data tables 9, 11, 11a & 19a.
10 The SMHA does not break the amount of CMHS Block Grant Allocation to agencies by adult and children.
16
Total number of children with SED in the year of 2014 was 9,739. This number was correct. Instead, the total number of children with SED in 2013 and 2012 were incorrect. The reported number 29,923 in 2013 was obtained from a different source and the number was not in agreement with the numbers presented in URS data table 14A.
17 Although Integrated Dual Diagnoses Services continue, SMHA no longer collects these data starting in 2014.
17
SMHA-funded IMR program focused on Supportive Housing programs for FY12 and FY13, which limited the opportunity to interface with the Partial Care/Partial Hospital (PC/PH) programs and resulted in a lower number in 2013. In FY14, due to the new launch of Community Support Services (CSS) training for Supportive Housing programs, the focus was returned to the formerly IMR-trained PC/PH programs. As a result, many more PC/PH programs submitted implementation data in FY14 as compared to FY13.