New Hope for Correctional Officers: An Innovative Program ... Hope for Correctional Officers...
22
New Hope for Correctional Officers: An Innovative Program for Reducing Stress and Health Risks Rollin McCraty Mike Atkinson Lee Lipsenthal Lourdes Arguelles Ó Springer Science+Business Media, LLC 2009 Abstract This study investigated the impact of a new stress management program on physiological and psycho- logical stress and health risk factors among 75 correctional officers. The experimental group received training in emotion self-regulation techniques intended to reduce stress and health risk factors. Practice of the techniques was enhanced by heart rate variability feedback, which helped participants learn and sustain use of the self-management tools. Measures of physiological stress included cortisol, DHEA, cholesterol, triglycerides, fasting glucose levels, 10-min resting electrocardiogram, heart rate variability, and blood pressure. Three psychological questionnaires assessed emotional stress and work-related variables. There were significant improvements in the experimental group in cholesterol, glucose, heart rate, blood pressure and positive outlook and significant reductions in overall psy- chological distress. There were significant increases in productivity, motivation, goal clarity, and perceived sup- port. The mean difference between pre- and post-inter- vention projected health care costs was calculated to be $1,179 per employee per year. Keywords HRV Heart rate variability Stress Correctional officers Health risk Introduction Employers give a range of reasons for implementing health promotion programs. There is a general interest in enhancing the quality of life, lowering health risks, and promoting overall employee well-being (Fronstin 1996). Stress management and health promotion programs are especially relevant in correctional settings, as correctional peace officers are exposed to stress outside the range of usual human experience. Correctional peace officers must cope with a great variety of stressors, both within and outside of their institutional role, since constant exposure to interpersonal violence, negative or confrontational inter- actions, and a sense of personal endangerment can affect officers on a chronic basis (Burke 1994). Shift schedules that disrupt normal sleep patterns and social life, authoritarian management styles, poor interpersonal rela- tionships with supervisors, interdepartmental politics, lack of adequate planning and resources, lack of promotion and transfer opportunities, lack of autonomy in performing duties, and lack of recognition for work accomplishments have been described as examples of organizational stress- ors for individuals in this profession (Brown and Campbell 1994; Cooper et al. 1982; Stotland and Pendleton 1989). Chronically stressful emotions related to job dissatisfac- tion, alienation, and burnout have been associated with depression, psychosomatic symptoms, and other symptoms of pathology and illness in over 90% of studies that examine these relationships in organizational psychology (Burke and Mikkelsen 2005). In addition to the operational stressors inherent in police and corrections work, numerous studies have shown that work-related stress has a seriously adverse impact on health and well-being (Chandola et al. 2008; Cooper et al. 1982; Kirkcaldy et al. 1995). For example, a recent study R. McCraty (&) M. Atkinson L. Lipsenthal HeartMath Research Center, Institute of HeartMath, 14700 West Park Ave., Boulder Creek, CA 95006, USA e-mail: [email protected] L. Arguelles Claremont Graduate University, Claremont, CA, USA 123 Appl Psychophysiol Biofeedback DOI 10.1007/s10484-009-9087-0
-
Upload
truongthien -
Category
Documents
-
view
227 -
download
0
Transcript of New Hope for Correctional Officers: An Innovative Program ... Hope for Correctional Officers...

New Hope for Correctional Officers: An Innovative Programfor Reducing Stress and Health Risks
Rollin McCraty Æ Mike Atkinson Æ Lee Lipsenthal ÆLourdes Arguelles
� Springer Science+Business Media, LLC 2009
Abstract This study investigated the impact of a new
stress management program on physiological and psycho-
logical stress and health risk factors among 75 correctional
officers. The experimental group received training in
emotion self-regulation techniques intended to reduce
stress and health risk factors. Practice of the techniques was
enhanced by heart rate variability feedback, which helped
participants learn and sustain use of the self-management
tools. Measures of physiological stress included cortisol,
DHEA, cholesterol, triglycerides, fasting glucose levels,
10-min resting electrocardiogram, heart rate variability,
and blood pressure. Three psychological questionnaires
assessed emotional stress and work-related variables. There
were significant improvements in the experimental group
in cholesterol, glucose, heart rate, blood pressure and
positive outlook and significant reductions in overall psy-
chological distress. There were significant increases in
productivity, motivation, goal clarity, and perceived sup-
port. The mean difference between pre- and post-inter-
vention projected health care costs was calculated to be
$1,179 per employee per year.
Keywords HRV � Heart rate variability � Stress �Correctional officers � Health risk
Introduction
Employers give a range of reasons for implementing health
promotion programs. There is a general interest in
enhancing the quality of life, lowering health risks, and
promoting overall employee well-being (Fronstin 1996).
Stress management and health promotion programs are
especially relevant in correctional settings, as correctional
peace officers are exposed to stress outside the range of
usual human experience. Correctional peace officers must
cope with a great variety of stressors, both within and
outside of their institutional role, since constant exposure to
interpersonal violence, negative or confrontational inter-
actions, and a sense of personal endangerment can affect
officers on a chronic basis (Burke 1994). Shift schedules
that disrupt normal sleep patterns and social life,
authoritarian management styles, poor interpersonal rela-
tionships with supervisors, interdepartmental politics, lack
of adequate planning and resources, lack of promotion and
transfer opportunities, lack of autonomy in performing
duties, and lack of recognition for work accomplishments
have been described as examples of organizational stress-
ors for individuals in this profession (Brown and Campbell
1994; Cooper et al. 1982; Stotland and Pendleton 1989).
Chronically stressful emotions related to job dissatisfac-
tion, alienation, and burnout have been associated with
depression, psychosomatic symptoms, and other symptoms
of pathology and illness in over 90% of studies that
examine these relationships in organizational psychology
(Burke and Mikkelsen 2005).
In addition to the operational stressors inherent in police
and corrections work, numerous studies have shown that
work-related stress has a seriously adverse impact on
health and well-being (Chandola et al. 2008; Cooper et al.
1982; Kirkcaldy et al. 1995). For example, a recent study
R. McCraty (&) � M. Atkinson � L. Lipsenthal
HeartMath Research Center, Institute of HeartMath,
14700 West Park Ave., Boulder Creek, CA 95006, USA
e-mail: [email protected]
L. Arguelles
Claremont Graduate University, Claremont, CA, USA
123
Appl Psychophysiol Biofeedback
DOI 10.1007/s10484-009-9087-0

evaluated the relationships among work stress, behavioral
risk factors, incidence of coronary heart disease, cortisol
levels, and metabolic syndrome (e.g., stress-related obes-
ity) in 10,308 London civil servants aged 35–55. The
results demonstrated that chronic work stress was signifi-
cantly associated with coronary heart disease and high rises
in cortisol. The authors reported that 32% of the effect of
work stress on coronary heart disease was attributable to its
effect on health behaviors and the metabolic syndrome
(Chandola et al. 2008). According to a recent article in the
‘‘Journal of the American Medical Association’’ (Cohen
et al. 2007), there is a documented link between stress and
an increased risk for heart attacks, depression, cancer and
the progression of HIV and AIDS. Notably, an accompa-
nying article in the same issue shows that workplace stress
may be as bad for your heart as smoking and high cho-
lesterol (Aboa-Eboule et al. 2007).
A comprehensive review of peer-reviewed and pub-
lished studies examining the financial impact of health
promotion programs concluded that there are good corre-
lational data to suggest that high levels of stress, excessive
body weight, and multiple risk factors are associated with
increased health care costs. This review also concluded that
health promotion programs are associated with reduced
health care costs (Aldana 2001).
Finally, a review of the Health Enhancement Research
Organization (HERO) database reveals a significant asso-
ciation between ten modifiable health risks and health
care expenditures (Goetzel et al. 1998).The focus of this
study and the central unit of analysis was the individual
employee. The study sought to document increased health
care expenditures associated with certain health risks at the
individual level. It was found that employees at high risk
for poor health outcomes had significantly higher expen-
ditures than did employees at lower risk in 7 of 10 risk
categories: those who reported themselves as depressed
(70% higher expenditures), at high stress (46%), with
high blood glucose levels (35%), at extremely high or low
body weight (21%), with high blood pressure (12%), and
with a sedentary lifestyle (10%). Employees with multiple
risk profiles for specific disease outcomes had higher
expenditures than did those without these profiles for the
following diseases: heart disease (228% higher expendi-
tures), psychosocial problems (147%), and stroke (85%).
The authors concluded that common modifiable health
risks are associated with increases in the likelihood of
incurring health expenditures and in the magnitude of those
expenditures.
Given the significant relationships among work stress,
employee health risk, and health care costs, this study
undertook to evaluate the impact of a workplace health
promotion program that provides tools and techniques to
help employees learn how to more effectively regulate the
unmanaged emotions that lie at the root of their stress.
From a psychophysiological perspective, it is important to
appreciate that the external incidents, situations, or events
that individuals typically equate with ‘‘causing’’ their stress
are actually only triggers of the stress response. In reality,
stress is the negative perceptions, feelings, and emotions
that are triggered by a perceived challenge or threat,
whether real or imagined (McCraty and Tomasino
2006b).These negative perceptual and emotional processes
in turn drive a wide range of physiological responses and
adaptations, commonly described as aspects of the ‘‘stress
response’’ (Barrios-Choplin et al. 1997). Thus, the actual
source of the ‘‘stress’’ that people experience consists pri-
marily of internal emotional unrest, such as feelings of
frustration, anger, worry, anxiety, fear, insecurity, depres-
sion, or resentment. Moreover, it is notable that police and
correctional officers deal with a unique form of stress in the
chronic state of emotional dissonance which is required by
their job, since they must internally cope with such, often
intense, negative emotions while maintaining an outward
expression of calm and emotional detachment (Zapf et al.
1999). Thus, the intervention program used in this study
adopts an emotion-focused perspective on stress reduction
and health promotion, training employees in self-regulation
skills designed to target stress at its emotional source.
Methods
The purpose of this research was to evaluate the effec-
tiveness of the Power to Change Performance stress and
health risk reduction program developed by the Institute of
HeartMath in reducing stress and health risk factors in
correctional peace officers.
Predictions
The two predictions were: (1) Psychological stress can be
reduced by providing correctional officers with specific
techniques to effectively manage stress as it occurs, and to
prepare for upcoming stressful events to help offset and
prevent stress reactions before they occur and (2) Reduc-
tions in psychological stress will correlate with reductions
in measures of heath risk. The specific objective was to
determine the psychosocial and physiological impact of an
established stress reduction program on reducing stress in
correctional officers.
Study Design
The study used a quasi-experimental field research design
with randomly assigned experimental and wait-list control
groups. Correctional officers from the Northern California
Appl Psychophysiol Biofeedback
123

Youth Correctional Center in Stockton participated in the
study. Volunteers for participation in the study were
recruited through posting of flyers at the sites. Institutional
Review Board approval for the study was obtained from
the Claremont Graduate University Institutional Review
Board, which meets all requirements of federal guidelines,
21 CRF 56.
Participants
Participants were fully informed about the study and signed
informed consent forms. One hundred correctional officers
were approached with information about the study and a
total of 94 participants were actually recruited and com-
pleted the baseline assessments. Shortly thereafter, three
dropped out of the study due to time conflicts. Two more
became trainers for the program and one became a program
coordinator, so they did not participate in the study. The
participants were not compensated financially for their
participation, but they were able to complete assessments
and training during paid working hours. The administration
supported their employees’ participation in the study, but
the training and assessment were voluntary.
Once the baseline data were analyzed, the remaining 88
volunteers were stratified into three relative risk groups:
high, medium, and low risk using the Adult Treatment
Panel III 10-years risk assessment guidelines (Yen et al.
1991; the method for projecting composite health care
costs based on individual risk factors, taken from research
by Yen et al. 1991, will be discussed in more detail in the
‘‘Results’’ section). Table 1 shows the parameters used to
define high risk and the percentage of employees in the
study who were designated at risk for each variable at
baseline, compared to corresponding percentages in a ref-
erence sample of working adults from a large workplace
study (Yen et al. 1991). Only those participants who par-
ticipated in both the pre and post measurements are
included in the analysis: N = 75.
Study participants were then randomly assigned from
each risk group to the experimental or wait-list control
group, with 44 participants in each. Age and gender were
also added to the stratification criteria to insure that both
groups had a homogeneous distribution. The mean age of
the correctional officers in the experimental group was 39,
and the mean age of the correctional officers in the control
group was 40. Sixty-nine percent of the experimental group
participants were male, and 70% of the control group
participants were male. Additional descriptive statistics on
the participants can be found in Table 2 in the ‘‘Results’’
section.
Table 1 High risk criteria and
percentage of employees at riskRisk factor High-risk criteria Employees (%)
Current
study
(N = 75)
Reference
group
(N = 1,838)
1. Lifestyle habits
Smoking Current smoker 5 34
Physical activity Rarely/never 35 10
Medication/drug use Almost every day, sometimes 5 10
Absences due to illness 5 days or more 53 12
Drinking alcohol Ex-drinker or heavy drinker
(more than 21 drinks per week)
0 9
Seatbelt usage Using seatbelt 25% of time or less 2 39
2. Psychological perceptions
Life satisfaction Not very satisfied or somewhat satisfied 8 15
Job satisfaction Strongly disagree or disagree 25 28
Physical health Fair or poor 17 18
Serious medical problems Yes 2 21
3. Health risks
Systolic blood pressure [140 mmHg 7 15
Diastolic blood pressure [90 mmHg 20 11
Cholesterol 240 mg/dl or greater 35 22
Relative body weight More than 20% overweight 35 28
Chronic bronchitis/emphysema Yes 0 8
Risk age index [4.0 Years (difference between
appraised and achievable ages)
83 38
Appl Psychophysiol Biofeedback
123
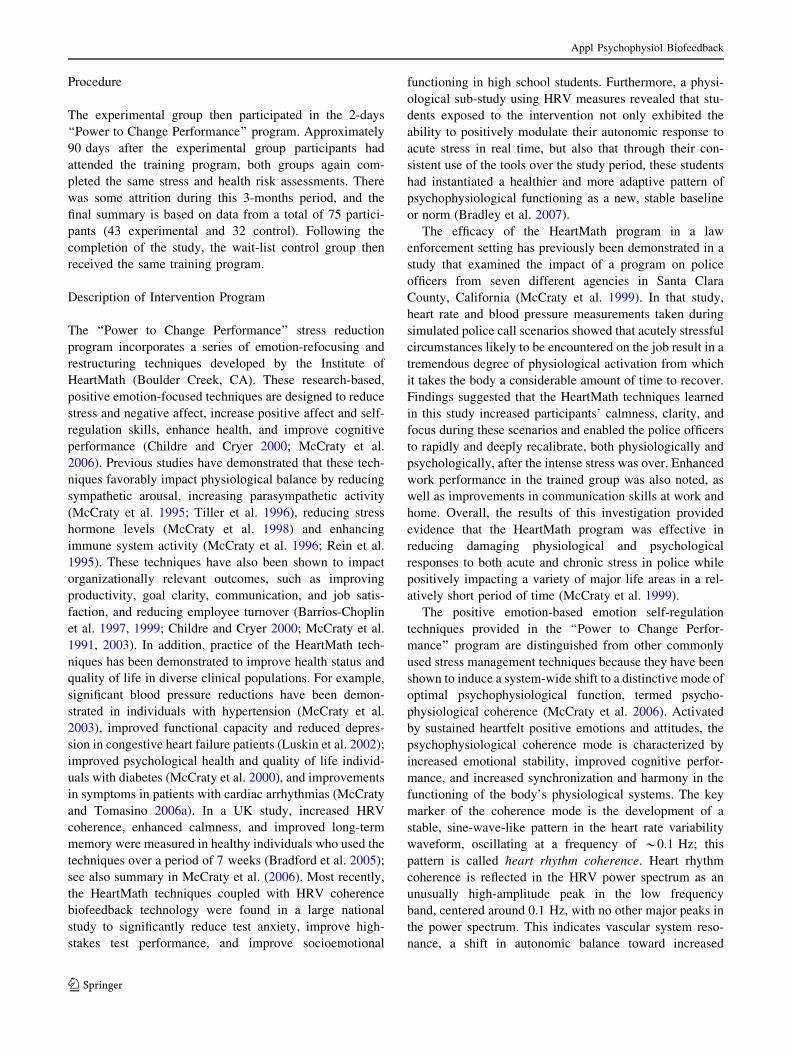
Procedure
The experimental group then participated in the 2-days
‘‘Power to Change Performance’’ program. Approximately
90 days after the experimental group participants had
attended the training program, both groups again com-
pleted the same stress and health risk assessments. There
was some attrition during this 3-months period, and the
final summary is based on data from a total of 75 partici-
pants (43 experimental and 32 control). Following the
completion of the study, the wait-list control group then
received the same training program.
Description of Intervention Program
The ‘‘Power to Change Performance’’ stress reduction
program incorporates a series of emotion-refocusing and
restructuring techniques developed by the Institute of
HeartMath (Boulder Creek, CA). These research-based,
positive emotion-focused techniques are designed to reduce
stress and negative affect, increase positive affect and self-
regulation skills, enhance health, and improve cognitive
performance (Childre and Cryer 2000; McCraty et al.
2006). Previous studies have demonstrated that these tech-
niques favorably impact physiological balance by reducing
sympathetic arousal, increasing parasympathetic activity
(McCraty et al. 1995; Tiller et al. 1996), reducing stress
hormone levels (McCraty et al. 1998) and enhancing
immune system activity (McCraty et al. 1996; Rein et al.
1995). These techniques have also been shown to impact
organizationally relevant outcomes, such as improving
productivity, goal clarity, communication, and job satis-
faction, and reducing employee turnover (Barrios-Choplin
et al. 1997, 1999; Childre and Cryer 2000; McCraty et al.
1991, 2003). In addition, practice of the HeartMath tech-
niques has been demonstrated to improve health status and
quality of life in diverse clinical populations. For example,
significant blood pressure reductions have been demon-
strated in individuals with hypertension (McCraty et al.
2003), improved functional capacity and reduced depres-
sion in congestive heart failure patients (Luskin et al. 2002);
improved psychological health and quality of life individ-
uals with diabetes (McCraty et al. 2000), and improvements
in symptoms in patients with cardiac arrhythmias (McCraty
and Tomasino 2006a). In a UK study, increased HRV
coherence, enhanced calmness, and improved long-term
memory were measured in healthy individuals who used the
techniques over a period of 7 weeks (Bradford et al. 2005);
see also summary in McCraty et al. (2006). Most recently,
the HeartMath techniques coupled with HRV coherence
biofeedback technology were found in a large national
study to significantly reduce test anxiety, improve high-
stakes test performance, and improve socioemotional
functioning in high school students. Furthermore, a physi-
ological sub-study using HRV measures revealed that stu-
dents exposed to the intervention not only exhibited the
ability to positively modulate their autonomic response to
acute stress in real time, but also that through their con-
sistent use of the tools over the study period, these students
had instantiated a healthier and more adaptive pattern of
psychophysiological functioning as a new, stable baseline
or norm (Bradley et al. 2007).
The efficacy of the HeartMath program in a law
enforcement setting has previously been demonstrated in a
study that examined the impact of a program on police
officers from seven different agencies in Santa Clara
County, California (McCraty et al. 1999). In that study,
heart rate and blood pressure measurements taken during
simulated police call scenarios showed that acutely stressful
circumstances likely to be encountered on the job result in a
tremendous degree of physiological activation from which
it takes the body a considerable amount of time to recover.
Findings suggested that the HeartMath techniques learned
in this study increased participants’ calmness, clarity, and
focus during these scenarios and enabled the police officers
to rapidly and deeply recalibrate, both physiologically and
psychologically, after the intense stress was over. Enhanced
work performance in the trained group was also noted, as
well as improvements in communication skills at work and
home. Overall, the results of this investigation provided
evidence that the HeartMath program was effective in
reducing damaging physiological and psychological
responses to both acute and chronic stress in police while
positively impacting a variety of major life areas in a rel-
atively short period of time (McCraty et al. 1999).
The positive emotion-based emotion self-regulation
techniques provided in the ‘‘Power to Change Perfor-
mance’’ program are distinguished from other commonly
used stress management techniques because they have been
shown to induce a system-wide shift to a distinctive mode of
optimal psychophysiological function, termed psycho-
physiological coherence (McCraty et al. 2006). Activated
by sustained heartfelt positive emotions and attitudes, the
psychophysiological coherence mode is characterized by
increased emotional stability, improved cognitive perfor-
mance, and increased synchronization and harmony in the
functioning of the body’s physiological systems. The key
marker of the coherence mode is the development of a
stable, sine-wave-like pattern in the heart rate variability
waveform, oscillating at a frequency of *0.1 Hz; this
pattern is called heart rhythm coherence. Heart rhythm
coherence is reflected in the HRV power spectrum as an
unusually high-amplitude peak in the low frequency
band, centered around 0.1 Hz, with no other major peaks in
the power spectrum. This indicates vascular system reso-
nance, a shift in autonomic balance toward increased
Appl Psychophysiol Biofeedback
123

parasympathetic activity (see ‘‘Discussion’’ for further
explanation), increased synchronization between the two
branches of the autonomic nervous system, and entrainment
between the heart rhythm pattern, respiration, and blood
pressure rhythms (McCraty et al. 2006; Tiller et al. 1996).
Heart rhythm coherence can be quantified by the fol-
lowing method. First, the maximum peak is identified in
the 0.04–0.26 Hz range of the HRV power spectrum (the
frequency range within which coherence and entrainment
can occur). The peak power is then determined by calcu-
lating the integral in a window 0.030 Hz wide, centered on
the highest peak in that region. The total power of the
entire spectrum is then calculated. The coherence ratio is
formulated as:
½Peak power=ðtotal power� peak powerÞ�2
This method provides an accurate measure of coherence
that allows for the nonlinear nature of the HRV waveform
over time.
Although the psychophysiological coherence mode encom-
passes beneficial aspects of the ‘‘relaxation response,’’ (e.g.,
reduced sympathetic activation and increased parasympa-
thetic activity), it should be noted that this mode is both psy-
chologically and physiologically distinct from a state of
relaxation, having a different set of autonomic, cognitive,
emotional, and behavioral correlates (see McCraty et al. 2006;
McCraty and Tomasino 2006b). Furthermore, while the
HeartMath intervention employs heart rhythm coherence
biofeedback in conjunction with positive emotion-focused
self-regulation techniques to activate the coherence mode,
heart rhythm coherence can also be achieved using other HRV
biofeedback protocols, such as those reported by Lehrer and
colleagues, who use the term ‘‘resonance’’ to describe the
target physiological state (Lehrer et al. 2000; Vaschillo et al.
2006). HRV biofeedback has been shown to increase HRV
and heart rhythm coherence and to produce positive out-
comes in various populations, including clinically significant
improvements in asthma (Lehrer et al. 2004), hypertension
(McCraty et al. 2003), and depression (Karavidas 2008;
Siepmann et al. 2008). This intervention has also been found
to augment vagal regulation of heart rate while facilitating
psychological adjustment in patients with coronary heart
disease (Nolan et al. 2005). Other recent effective applications
of HRV biofeedback include reducing test anxiety and
improving standardized test performance in high school stu-
dents (Bradley et al. 2007) and improving cognition in
recently returned combat veterans with post-traumatic stress
disorder (Ginsberg 2009).
Intervention Program Training Modules
The ‘‘Power to Change Performance’’ program consisted
of five training modules, which were delivered over two
consecutive days. More detailed descriptions of the tech-
niques, their conceptual basis, and their applications in
organizational settings can be found elsewhere (Childre
and Cryer 2000; Childre and Martin 1999; Childre and
Rozman 2005).
1. Risk factors: what they are, how to interpret them, and
how they relate to health and wellness.
2. Freeze-Frame: Freeze-Frame is a positive emotion-
refocusing technique designed specifically to improve
decision-making, especially in stressful or challenging
situations. The technique is intended to enable indi-
viduals to more effectively intervene in the moment
that a stress reaction is triggered, and with practice, to
offset the harmful or depleting physiological aspects of
the stress response. In essence, the technique enables
people to consciously disengage from draining nega-
tive mental and emotional reactions as they occur and
to activate a neutral or positive emotional state before
returning to address the stressor from a more emo-
tionally balanced perspective.
3. Coherent communication: enhancing communication,
teamwork, and goal clarity. This module includes the
Intuitive Listening technique, designed to facilitate
clear and constructive communication among people.
This technique involves shifting to a heart-coherent
state and reestablishing a neutral or appreciative
attitude as needed during communication.
4. Power tools for inner quality: creating a caring culture
and increasing job satisfaction. The Power to Change
Performance intervention is based on the theory that
the cumulative effect of many employees self-regulat-
ing emotions more effectively and communicating
with each other in a more constructive and caring
fashion will bring about a positive change in the
surrounding organizational culture within which
employees work. This module of the program includes
the following tools: the Heart Lock-In technique—an
emotional restructuring exercise designed to reduce
stress and increase psychophysiological coherence;
Appreciation—taking time out in one’s day to notice
and be grateful for the positive aspects of one’s
life; and Neutral—learning to neutralize distressing
emotions.
5. Workplace applications: operationalizing the above
tools in an organizational context and applying the key
techniques and concepts learned in the program to
increase planning and decision-making effectiveness.
The five training modules were augmented by HRV
coherence biofeedback training to facilitate learning and
effective implementation of the stress reduction techniques.
Using a computer-based heart rhythm coherence feedback
system (Freeze-Framer; Quantum Intech, Inc., Boulder
Appl Psychophysiol Biofeedback
123

Creek, CA),1 participants’ heart rate variability patterns
(heart rhythms) were displayed in real time as they prac-
ticed the self-regulation techniques. This enabled partici-
pants to see and feel for themselves how stress and
different emotions affect their heart rhythms, and to
objectively quantify the favorable shifts in HRV coherence
they could achieve by using the techniques. This process
also facilitated the learning experience of how to self-
activate a positive emotional shift, which is typically
reflected in a more sine wave-like heart rate variability
pattern and an increased numerical ‘‘coherence ratio’’
score, or degree of success in one of the technology’s
interactive modules designed to reinforce and help anchor
the self-regulation skills.
During the 3 months following the program, participants
were encouraged to practice the stress management tools
daily. It was recommended that they do at least five 15-min
Heart Lock-Ins and three written Freeze-Frames per week,
as well as using the Freeze-Frame technique for 30 s dur-
ing each hour at work. Freeze-Framer heart rhythm
coherence feedback training systems were made available
to experimental group participants, on a shared basis, for
use in the workplace and at home. Approximately 8 weeks
after the program, all experimental group participants
received a follow-up phone call from the program facili-
tator or study physician in order to answer any questions
and discuss any challenges they might be having with the
techniques they had learned or lifestyle changes they might
wish to make.
Measures
Health Risk Assessment
The measures used in the health risk assessment included
both a self-report survey and biometric data. The Personal
Wellness Profile (PWP; Wellsource, Portland, OR)
includes 75 questions pertaining to the following general
areas: health information; physical activity; eating prac-
tices; alcohol, drugs, and smoking; stress and coping;
social health; safety; medical care; and health view. The
validity and reliability of these questions have been studied
in numerous applications, a review of which was published
by Eddington et al. (1999). Additionally, the prediction of
future health care cost savings resulting from reductions in
the health risks measured by the PWP has been demon-
strated based on actual heath care expenditures (Yen et al.
1991). The four primary biometric measures used in the
health risk assessment were height, weight, blood pressure,
and cholesterol. These measures were collected at the
worksite by a licensed nurse. The criteria used to define
high risk are based largely on the recommendations of
national consensus scientific panels.
Lipid Panel
The lipid panel included measurements of total cholesterol,
high-density lipoprotein (HDL) cholesterol, low-density
lipoprotein (LDL) cholesterol, triglycerides, and blood
glucose levels. Blood samples were obtained using fin-
gerstick collection and assessed by reflectance photometry
(Cholestech-LDX System, Hayward, CA). Blood glucose
levels were measured after at least a 9-h fast. A total
cholesterol level of 240 mg/dl or higher was considered a
risk factor (National Cholesterol Education Program 2002).
Blood Pressure
Blood pressure measurements (auscultary method) were
made with an instrument that measures the pressure gen-
erated by the cuff and the arterial pulsation (DynaPulse,
Pulse Metric, San Diego, CA). A total of three blood
pressure readings were taken, with a 5-min rest period prior
to the first measure and between measures. The average of
the three measures was used as the final blood pressure
value. Systolic blood pressure[140 mmHg was considered
a risk factor, as was a diastolic blood pressure[90 mmHg.
Autonomic Function: Heart Rate Variability
Although not used as part of the risk analysis, a 10-min
resting electrocardiogram (ECG) was recorded for heart rate
variability analysis to provide an assessment of autonomic
nervous system function. Heart rate variability (HRV), which
is derived from the ECG, is a measure of the naturally
occurring beat-to-beat changes in heart rate. The analysis of
HRV provides important information relative to the function
and activity level of the autonomic nervous system, and
decreased HRV is a predictor of future heart disease,
increased risk of sudden death, and is correlated with all-
cause mortality (Dekker et al. 1997; Tsuji et al. 1994, 1996).
In this regard, HRV is increasingly being used as a nonin-
vasive screening tool to identify at-risk individuals.
Cortisol, DHEA, and S-IgA: Adrenal Stress Index
Measurements were also taken of the stress-related hor-
mones cortisol and dehydroepiandrosterone (DHEA), as
well secretory immunoglobulin A (S-IgA), a marker of
immunity. A number of investigators have proposed the
DHEA/cortisol ratio to be an important biological marker
of stress and aging (Kerr et al. 1991; Namiki 1994). When
1 Since this study was conducted, the Freeze-Framer system has been
upgraded and renamed the emWave PC.
Appl Psychophysiol Biofeedback
123

individuals are under prolonged stress, a divergence in the
DHEA/cortisol ratio results (Manolagas et al. 1979). The
effects of DHEA/cortisol imbalance can be severe, and
may include elevated blood sugar levels, increased bone
loss, compromised immune function, decreased skin repair
and regeneration, impaired memory and learning, increased
fat accumulation, and brain cell destruction (Jabaaij 1993;
Kerr et al. 1991; Manolagas et al. 1979; Namiki 1994).
S-IgA is the predominant antibody class found in mucosal
secretions, which serves as the body’s first line of defense
against pathogens, and is easily measured noninvasively.
To assess levels of cortisol, DHEA, and S-IgA, saliva
samples were collected at four time points over a 24-h
period (Adrenal Stress Index, Diagnos-Techs, Inc., Kent,
WA). Samples were sent to an external reference labora-
tory for analysis.
Psychological Assessment
In addition to the psychological scales of the PWP, three
other psychological instruments were used in this study.
These were included primarily to provide measures of
common psychological symptom and behavior patterns
associated with emotional stress. Additionally, measures of
positive emotions and attitudes, as well as measures rele-
vant to organizational climate and workplace effectiveness
were included in this part of the assessment.
Jenkins Activity Survey
The Jenkins activity survey (JAS; The Highlands, Chapel
Hill, NC) is a multiple-choice questionnaire that is
designed as a measure of Type A and coronary-prone
behavior. Type A behavior patterns are characterized by
extremes of competitiveness, striving for achievement and
personal recognition, aggressiveness, haste, impatience,
and explosiveness and loudness in speech. The JAS
yields a composite Type A scale score and three factor-
analytically derived subscales: Speed and Impatience, Job
Involvement, and Hard-Driving and Competitive. Concur-
rent validity has been established by comparing JAS scores
to Type A ratings based upon a structured interview.
Evidence for the predictive validity of the JAS comes
primarily from the prospective findings of the Western
Collaborative Group Study. Analysis of JAS Type A scores
of 2,750 healthy men showed the Type A scale to distin-
guish the 120 future clinical cases of coronary heart disease
from those men who subsequently remained healthy.
Brief Symptom Inventory
The brief symptom inventory (BSI; National Computer
Systems, Minneapolis, MN) is designed to reflect
psychological symptom patterns. This 53-item question-
naire contains nine symptom scales (somatization, obses-
sive-compulsive, interpersonal sensitivity, depression,
anxiety, hostility, phobic anxiety, paranoid ideation, and
psychoticism) and three global indices (global severity
index, positive symptom distress index, and positive
symptom total).
Personal and Organizational Quality Assessment
The personal and organizational quality assessment
(POQA; Institute of HeartMath, Boulder Creek, CA) is a
questionnaire designed to reflect the key psychological and
workplace elements that contribute to organizational cli-
mate. The instrument provides a comprehensive assess-
ment in the two main topic areas. Personal scales reflect
employees’ moods, attitudes, and stress-related symptoms.
The stress symptom items possess clinical relevance as
valid measures of stress, which can exert a significant
negative impact on employee health and work perfor-
mance. Organizational scales are comprised of questions
concerning such areas as strategic understanding, goal
clarity and work attitude, job involvement, and factors
related to employee behavior, attitudes toward work, and
ability to perform well. Standardized scores enable com-
parisons of the status or performance of an individual or
group with that of a relevant reference group.
Results
Baseline Comparisons
Tables 2 and 3 show the results of a single factor ANOVA,
which was used to compare the baseline physiological and
psychological data between the two groups. Taking a
conservative approach, differences with a p value \0.1
were considered significant. Overall, random distribution
was successful in creating equally distributed groups.
There were no significant differences between the groups
in any of the risk assessment measures. The only significant
differences in physiological measures were in S-IgA (an
indicator of immunity), with the control group having a
higher mean value (p = 0.099); and in the HRV measures
the RMS-SD (an indicator of parasympathetic function)
was lower in the control group (p = 0.094) (Table 2).
In terms of the psychological measures, there were no
differences in any scales on the BSI or the JAS. There were
differences in the following scales on the POQA: anger
(p = 0.04), resentfulness (p = 0.056), and intention to quit
(p = 0.049) were greater in the experimental group at
baseline, whereas work attitude (p = 0.021), manager
support (p = 0.003), freedom of expression (p = 0.03),
Appl Psychophysiol Biofeedback
123

and confidence in the organization (p = 0.006) were
greater in the control group (Table 3).
Comparison of Baseline Values to Reference Values
For comparisons to the general working population,
pooled baseline data were compared to the norms estab-
lished by authors of the individual psychometric surveys
as well as to established normal ranges for the physio-
logical data. Table 1 shows the percentage of officers
with each risk factor and the expected percentage for each
risk factor based on data from a reference group of
working adults. For lifestyle habits, the correctional
officers were under-active in terms of physical activity
(35 vs. 10%) and had a higher percentage of absences due
to illness (53 vs. 12%). In the health risks category the
officers had almost twice the percentage of a diastolic
blood pressure over 90 mmHg than would be expected
(20 vs. 11%), a higher percentage of employees with
cholesterol levels of 240 mg/dl or greater (35 vs. 22%),
and more than 20% overweight (35 vs. 28%). The risk
age index, which is calculated from the difference
between appraised and achievable ages projected by the
health risk assessment, indicated that 83% of the
Table 2 Baseline physiological characteristics
Mean ± SD p \ 0.1
Experimental group (N = 43) Control group (N = 32)
Age, years 39.47 ± 7.70 40.72 ± 8.12 NS
Gender, % male 67 69 NS
Height, in. 68.30 ± 3.14 67.84 ± 4.28 NS
Weight, lbs. 189.84 ± 33.75 199.03 ± 49.15 NS
Body mass index 28.44 ± 3.54 30.12 ± 5.51 NS
Cholesterol lowering medication status, % taking drugs 4.80 13.30 NS
Triglycerides, mg/dl 149.07 ± 71.07 155.37 ± 68.73 NS
Total cholesterol, mg/dl 217.45 ± 40.56 220.27 ± 38.08 NS
HDL cholesterol, mg/dl 43.08 ± 10.06 46.11 ± 8.23 NS
LDL cholesterol, mg/dl 148.98 ± 40.30 140.27 ± 36.56 NS
Total cholesterol/HDL ratio 5.39 ± 1.58 4.82 ± 1.33 NS
Glucose, mg/dl 103.00 ± 21.39 103.13 ± 16.23 NS
Cortisol burden, nM 30.94 ± 9.99 31.36 ± 11.67 NS
DHEA, ng/ml 5.11 ± 2.09 5.14 ± 2.03 NS
S-IgA, U/ml 11.25 ± 5.58 15.24 ± 12.32 *
Antihypertensive medication status, % taking drugs 7.30 20
Systolic blood pressure, mmHg 122.39 ± 13.33 121.26 ± 11.08 NS
Diastolic blood pressure, mmHg 80.75 ± 9.55 81.69 ± 8.76 NS
Mean arterial pressure, mmHg 92.79 ± 10.32 92.68 ± 9.11 NS
Heart rate, BPM 71.23 ± 10.89 73.23 ± 12.72 NS
Interbeat interval, ms 867.69 ± 144.36 843.56 ± 128.83 NS
Standard deviation of RR intervals, ms 59.31 ± 26.59 49.74 ± 22.71 NS
RMS-SD, ms 38.20 ± 28.90 26.97 ± 13.71 –
Ln(RMS-SD) 3.42 ± 0.66 3.15 ± 0.58 *
High frequency, ms2/Hz 192.36 ± 296.43 82.93 ± 67.93 –
Ln(high frequency) 4.40 ± 1.34 3.95 ± 1.21 NS
Low frequency, ms2/Hz 398.15 ± 383.12 357.17 ± 407.99 –
Ln(low frequency) 5.60 ± 0.93 5.33 ± 1.16 NS
Very low frequency, ms2/Hz 620.50 ± 626.39 513.84 ± 631.15 –
Ln(very low frequency) 6.04 ± 0.89 5.69 ± 1.07 NS
Total power, ms2/Hz 1277.83 ± 1138.74 1011.72 ± 1016.59 –
Ln(total power) 6.79 ± 0.90 6.45 ± 1.05 NS
Low frequency/high frequency ratio 4.84 ± 4.21 5.01 ± 3.37 –
Ln(low frequency/high frequency ratio) 1.20 ± 0.92 1.38 ± 0.72 NS
* p \ 0.1
Appl Psychophysiol Biofeedback
123
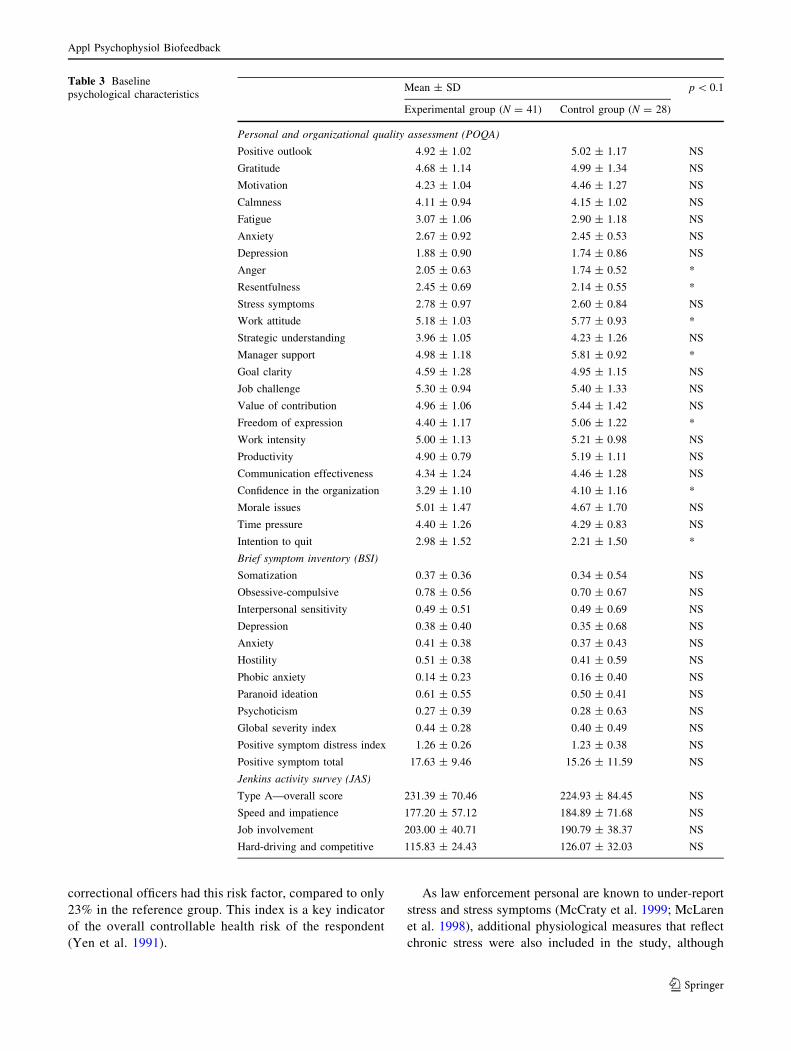
correctional officers had this risk factor, compared to only
23% in the reference group. This index is a key indicator
of the overall controllable health risk of the respondent
(Yen et al. 1991).
As law enforcement personal are known to under-report
stress and stress symptoms (McCraty et al. 1999; McLaren
et al. 1998), additional physiological measures that reflect
chronic stress were also included in the study, although
Table 3 Baseline
psychological characteristicsMean ± SD p \ 0.1
Experimental group (N = 41) Control group (N = 28)
Personal and organizational quality assessment (POQA)
Positive outlook 4.92 ± 1.02 5.02 ± 1.17 NS
Gratitude 4.68 ± 1.14 4.99 ± 1.34 NS
Motivation 4.23 ± 1.04 4.46 ± 1.27 NS
Calmness 4.11 ± 0.94 4.15 ± 1.02 NS
Fatigue 3.07 ± 1.06 2.90 ± 1.18 NS
Anxiety 2.67 ± 0.92 2.45 ± 0.53 NS
Depression 1.88 ± 0.90 1.74 ± 0.86 NS
Anger 2.05 ± 0.63 1.74 ± 0.52 *
Resentfulness 2.45 ± 0.69 2.14 ± 0.55 *
Stress symptoms 2.78 ± 0.97 2.60 ± 0.84 NS
Work attitude 5.18 ± 1.03 5.77 ± 0.93 *
Strategic understanding 3.96 ± 1.05 4.23 ± 1.26 NS
Manager support 4.98 ± 1.18 5.81 ± 0.92 *
Goal clarity 4.59 ± 1.28 4.95 ± 1.15 NS
Job challenge 5.30 ± 0.94 5.40 ± 1.33 NS
Value of contribution 4.96 ± 1.06 5.44 ± 1.42 NS
Freedom of expression 4.40 ± 1.17 5.06 ± 1.22 *
Work intensity 5.00 ± 1.13 5.21 ± 0.98 NS
Productivity 4.90 ± 0.79 5.19 ± 1.11 NS
Communication effectiveness 4.34 ± 1.24 4.46 ± 1.28 NS
Confidence in the organization 3.29 ± 1.10 4.10 ± 1.16 *
Morale issues 5.01 ± 1.47 4.67 ± 1.70 NS
Time pressure 4.40 ± 1.26 4.29 ± 0.83 NS
Intention to quit 2.98 ± 1.52 2.21 ± 1.50 *
Brief symptom inventory (BSI)
Somatization 0.37 ± 0.36 0.34 ± 0.54 NS
Obsessive-compulsive 0.78 ± 0.56 0.70 ± 0.67 NS
Interpersonal sensitivity 0.49 ± 0.51 0.49 ± 0.69 NS
Depression 0.38 ± 0.40 0.35 ± 0.68 NS
Anxiety 0.41 ± 0.38 0.37 ± 0.43 NS
Hostility 0.51 ± 0.38 0.41 ± 0.59 NS
Phobic anxiety 0.14 ± 0.23 0.16 ± 0.40 NS
Paranoid ideation 0.61 ± 0.55 0.50 ± 0.41 NS
Psychoticism 0.27 ± 0.39 0.28 ± 0.63 NS
Global severity index 0.44 ± 0.28 0.40 ± 0.49 NS
Positive symptom distress index 1.26 ± 0.26 1.23 ± 0.38 NS
Positive symptom total 17.63 ± 9.46 15.26 ± 11.59 NS
Jenkins activity survey (JAS)
Type A—overall score 231.39 ± 70.46 224.93 ± 84.45 NS
Speed and impatience 177.20 ± 57.12 184.89 ± 71.68 NS
Job involvement 203.00 ± 40.71 190.79 ± 38.37 NS
Hard-driving and competitive 115.83 ± 24.43 126.07 ± 32.03 NS
Appl Psychophysiol Biofeedback
123

they were not used as part of the risk assessment. In this
population of correctional officers, 21% had elevated cor-
tisol values equal to or [40 nM, the established cut-off
value for high cortisol based on a reference database of
over 150,000 individuals (Diagnos-Techs, Inc., Kent, WA).
This is double the expected number of individuals that
would be predicted based on the general population, sug-
gesting that this study sample had high stress levels.
From the heart rate variability analysis of each partici-
pant’s baseline ECG, eight measures commonly used in
risk assessment were calculated. These were:
Interbeat Interval
Mean interval between successive heart beats; inverse of
heart rate.
Standard Deviation of R–R Intervals
Provides a measure of overall heart rate variability; cor-
relates with total power.
RMS-SD
The root mean square of successive differences between
normal heartbeats. Reflects the high frequency (fast) beat-
to-beat variations in heart rate, which provide an estimate
of the parasympathetic regulation of the heart; correlates
with high frequency power.
High Frequency Power
Spectral power in the range between 0.15 and 0.4 Hz; reflects
parasympathetic or vagal activity. The power in this band
corresponds to heart rate variations related to the respiratory
cycle, commonly referred to as respiratory sinus arrhythmia.
Low Frequency Power
Spectral power in the range between 0.04 and 0.15 Hz; can
reflect both sympathetic and parasympathetic activity, espe-
cially in short-term recordings. Parasympathetic influences
are particularly present when respiration rates are below
seven breaths per minute (Tiller et al. 1996) or when an
individual takes a deep breath. This region was previously
called the ‘‘baroreceptor range,’’ as it also reflects barore-
ceptor activity (Malliani 1995) and at times blood pressure
wave activity and vascular system resonance.
Very Low Frequency Power
Spectral power in the range between 0.0033 and 0.04 Hz;
primarily an index of sympathetic activity. Reduced power
in the very low frequency band has been shown to have a
stronger association with all-cause mortality than the low
frequency and high frequency bands. In addition, low
power in the very low frequency band has been shown to
be associated with arrhythmically mediated death (Bigger
et al. 1992).
Total Power
Reflects the power in all frequency ranges. Most of the
power in this measure derives from the very low frequency
band.
Low Frequency/High Frequency Ratio
Ratio between low frequency and high frequency power.
This ratio is sometimes used (primarily in 24-h recordings)
to provide a measurement of the relative activity levels of
the sympathetic and parasympathetic systems, with a
higher number indicating increased sympathetic or reduced
parasympathetic activity; however, in some cases this
interpretation is misleading, as parasympathetic activity
also contributes to power in the low frequency band under
certain conditions (see ‘‘Discussion’’ for further elabora-
tion). For a more detailed explanation of the above mea-
sures and their clinical relevance, see the HRV Task Force
Report (Task Force of the European Society of Cardiology
and the North American Society of Pacing and Electro-
physiology 1996).
Of the officers whose HRV were analyzed, 8% were
considered to be at increased risk for sudden cardiac death
(Singer et al. 1988; Villareal et al. 2002). Furthermore,
from the analysis of the ECG, one officer was identified as
having significant ECG abnormalities. As this officer also
had high triglycerides and other symptoms, it is highly
likely that this condition would have led to a heart attack.
This individual and his physician were immediately con-
tacted by the study’s physician, who was able to insure that
the individual was evaluated, treated, and stabilized.
Between-group Comparisons
The results of an ANCOVA analysis performed to compare
pre–post changes between the experimental and control
groups showed no significant differences on either the
physiological or psychological measures. This is likely due
to the fact that the total number of participants in the study
was too low to provide the statistical power required to
detect between-group differences. Due to budgetary con-
straints and cutbacks, the number of participants originally
intended to be recruited into the study was reduced by two-
thirds. In addition, the control group exhibited directional
improvements in a variety of the physiological and
Appl Psychophysiol Biofeedback
123

psychological measures, which contributed to the lack of
significant differences in the between-group analysis.
Based on observations and reports from the worksite, a
cross-contamination effect between the experimental and
control groups was suspected to have contributed to the
directional improvements observed in the control group. To
test for the presence of such an effect, a post-study survey,
conducted via a telephone interview, was administered to
all control group participants. This survey included ques-
tions to determine whether control group participants had
been exposed to information about the content of the
‘‘Power to Change Performance’’ program through inter-
actions with colleagues in the experimental group, or if
their own behavior had been influenced by health- and
stress-related behavioral changes that had been made by
their experimental group colleagues following their train-
ing. Several questions were also included to assess other
potential factors that might have contributed to the
improvements observed in the control group.
The results of this survey provided clear evidence of a
cross-contamination effect between the experimental and
control groups. For example, 55% of the control group
participants reported having knowledge of the ‘‘Power to
Change Performance’’ program content. Forty-five percent
stated that discussing changes their co-workers had made
to their diet, exercise, or the way they handled stress had in
turn motivated them to make similar changes. It was found
that in two separate cases spouses had been assigned,
respectively, to the training and control groups. There were
also cases where managers who had attended the training
program supervised employees in the control group.
The survey results also suggested that the training of the
experimental group resulted in improvements in the overall
organizational climate that were noticed by and influenced
control group participants on a day-to-day basis. For
example, 55% of the control group participants felt that
their co-workers who had attended the program were
noticeably less stressed. There was clearly an enthusiasm
about the program that permeated the environment, as
100% of the control group participants reported that their
co-workers had indicated that the program was benefiting
them, and 100% also stated that they had been looking
forward to attending the program.
In addition to cross-contamination issues, the survey
revealed that the increased health awareness afforded by
the study was also likely a significant factor that inadver-
tently influenced the improvements in the control group.
This is supported by the fact that 84% of the control group
participants reported having been motivated to make
changes to their diet and exercise routines as a result of
having been made aware of their blood pressure, choles-
terol, and other health indicators at the initial data collec-
tion point.
In sum, the cross-contamination and motivation effects
mentioned above likely combined and reinforced each
other in the control group, effectively operating as a
methods artifact that reduced the expected pre–post dif-
ferences between the two groups on the psychological and
physiological measures.
Within-group Comparisons
Due to the issues just noted, pre to post changes for the two
groups were analyzed separately. The pre–post changes
within each group were analyzed using paired-sample t-
tests. The results are shown in Tables 4 and 5 and in
Figs. 1 and 2.
Analysis of Experimental Group Pre–Post Changes
The experimental group demonstrated significant pre–post
differences in numerous variables tested. In terms of
physiological measures, the experimental group partici-
pants demonstrated significant reductions in total choles-
terol (p \ 0.001), LDL cholesterol levels (p \ 0.001),
the total cholesterol/HDL ratio (p \ 0.001), and glucose
levels (p \ 0.01) from pre- to post-training. The Adrenal
Stress Index showed a significant reduction in DHEA
(p \ 0.001). The group also exhibited significant changes
in a number of cardiovascular variables, including signifi-
cant reductions in mean arterial pressure (p \ 0.001) and in
both systolic (p \ 0.001) and diastolic (p \ 0.01) blood
pressure, and a significant reduction in mean heart rate
(p \ 0.05). In measures of heart rate variability/autonomic
function, they showed a significant increase in the low
frequency/high frequency ratio (p \ 0.05).
In terms of psychological and work-related measures, on
the POQA the experimental group demonstrated significant
increases in scales measuring productivity (p \ 0.01), moti-
vation (p \ 0.01), goal clarity (p \ 0.05), perceived manager
support (p \ 0.05), gratitude (p \ 0.05), and positive outlook
(p \ 0.05), and significant reductions in anger (p \ 0.05) and
fatigue (p \ 0.05). On the BSI, the group exhibited signifi-
cant reductions (p \ 0.05) in hostility, interpersonal sensi-
tivity (feelings of personal inadequacy, inferiority and self-
doubt), paranoid ideation (fearfulness, suspiciousness and
mistrust), and the positive symptom total—a measure of
overall psychological distress. Finally, the JAS results for the
experimental group revealed significant reductions in the
global scale measuring the Type A behavior pattern
(p \ 0.05) and in speed and impatience (p \ 0.05).
Analysis of Control Group Pre–Post Changes
In terms of physiological measures, the control group
showed significant reductions (p \ 0.05) in total
Appl Psychophysiol Biofeedback
123
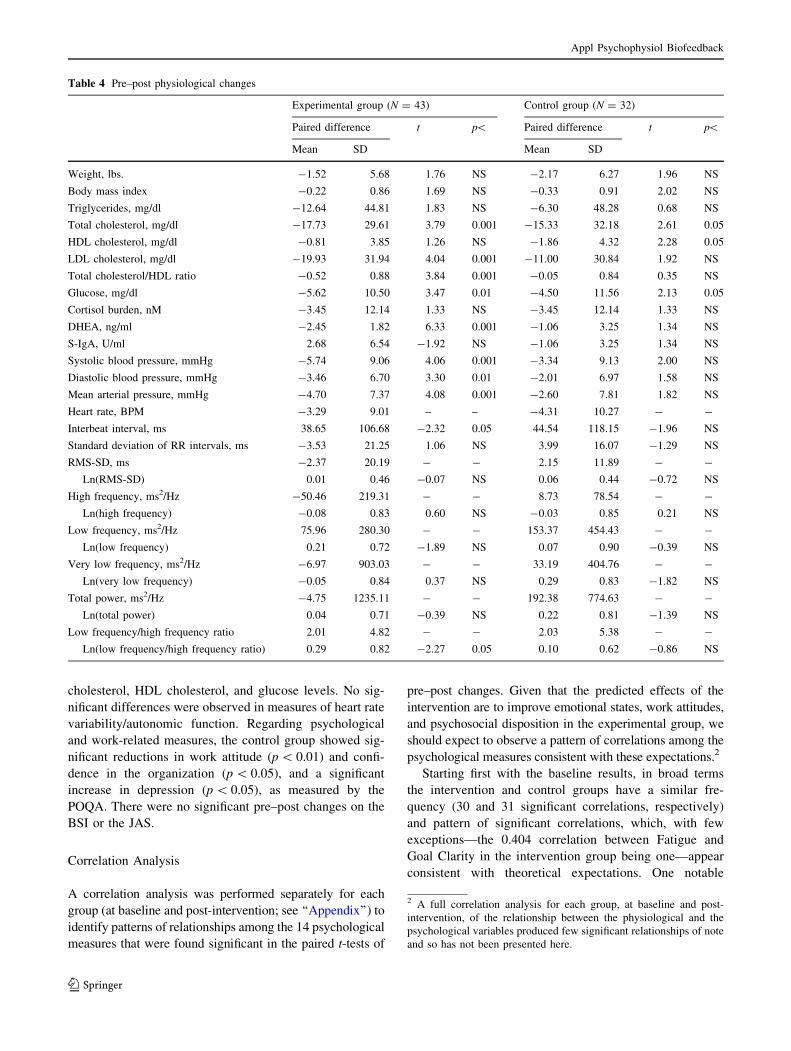
cholesterol, HDL cholesterol, and glucose levels. No sig-
nificant differences were observed in measures of heart rate
variability/autonomic function. Regarding psychological
and work-related measures, the control group showed sig-
nificant reductions in work attitude (p \ 0.01) and confi-
dence in the organization (p \ 0.05), and a significant
increase in depression (p \ 0.05), as measured by the
POQA. There were no significant pre–post changes on the
BSI or the JAS.
Correlation Analysis
A correlation analysis was performed separately for each
group (at baseline and post-intervention; see ‘‘Appendix’’) to
identify patterns of relationships among the 14 psychological
measures that were found significant in the paired t-tests of
pre–post changes. Given that the predicted effects of the
intervention are to improve emotional states, work attitudes,
and psychosocial disposition in the experimental group, we
should expect to observe a pattern of correlations among the
psychological measures consistent with these expectations.2
Starting first with the baseline results, in broad terms
the intervention and control groups have a similar fre-
quency (30 and 31 significant correlations, respectively)
and pattern of significant correlations, which, with few
exceptions—the 0.404 correlation between Fatigue and
Goal Clarity in the intervention group being one—appear
consistent with theoretical expectations. One notable
Table 4 Pre–post physiological changes
Experimental group (N = 43) Control group (N = 32)
Paired difference t p\ Paired difference t p\
Mean SD Mean SD
Weight, lbs. -1.52 5.68 1.76 NS -2.17 6.27 1.96 NS
Body mass index -0.22 0.86 1.69 NS -0.33 0.91 2.02 NS
Triglycerides, mg/dl -12.64 44.81 1.83 NS -6.30 48.28 0.68 NS
Total cholesterol, mg/dl -17.73 29.61 3.79 0.001 -15.33 32.18 2.61 0.05
HDL cholesterol, mg/dl -0.81 3.85 1.26 NS -1.86 4.32 2.28 0.05
LDL cholesterol, mg/dl -19.93 31.94 4.04 0.001 -11.00 30.84 1.92 NS
Total cholesterol/HDL ratio -0.52 0.88 3.84 0.001 -0.05 0.84 0.35 NS
Glucose, mg/dl -5.62 10.50 3.47 0.01 -4.50 11.56 2.13 0.05
Cortisol burden, nM -3.45 12.14 1.33 NS -3.45 12.14 1.33 NS
DHEA, ng/ml -2.45 1.82 6.33 0.001 -1.06 3.25 1.34 NS
S-IgA, U/ml 2.68 6.54 -1.92 NS -1.06 3.25 1.34 NS
Systolic blood pressure, mmHg -5.74 9.06 4.06 0.001 -3.34 9.13 2.00 NS
Diastolic blood pressure, mmHg -3.46 6.70 3.30 0.01 -2.01 6.97 1.58 NS
Mean arterial pressure, mmHg -4.70 7.37 4.08 0.001 -2.60 7.81 1.82 NS
Heart rate, BPM -3.29 9.01 – – -4.31 10.27 - -
Interbeat interval, ms 38.65 106.68 -2.32 0.05 44.54 118.15 -1.96 NS
Standard deviation of RR intervals, ms -3.53 21.25 1.06 NS 3.99 16.07 -1.29 NS
RMS-SD, ms -2.37 20.19 - - 2.15 11.89 - -
Ln(RMS-SD) 0.01 0.46 -0.07 NS 0.06 0.44 -0.72 NS
High frequency, ms2/Hz -50.46 219.31 - - 8.73 78.54 - -
Ln(high frequency) -0.08 0.83 0.60 NS -0.03 0.85 0.21 NS
Low frequency, ms2/Hz 75.96 280.30 - - 153.37 454.43 - -
Ln(low frequency) 0.21 0.72 -1.89 NS 0.07 0.90 -0.39 NS
Very low frequency, ms2/Hz -6.97 903.03 - - 33.19 404.76 - -
Ln(very low frequency) -0.05 0.84 0.37 NS 0.29 0.83 -1.82 NS
Total power, ms2/Hz -4.75 1235.11 - - 192.38 774.63 - -
Ln(total power) 0.04 0.71 -0.39 NS 0.22 0.81 -1.39 NS
Low frequency/high frequency ratio 2.01 4.82 - - 2.03 5.38 - -
Ln(low frequency/high frequency ratio) 0.29 0.82 -2.27 0.05 0.10 0.62 -0.86 NS
2 A full correlation analysis for each group, at baseline and post-
intervention, of the relationship between the physiological and the
psychological variables produced few significant relationships of note
and so has not been presented here.
Appl Psychophysiol Biofeedback
123

Table 5 Pre-post psychological changes
Experimental group (N = 41) Control group (N = 28)
Paired difference t p\ Paired difference t p\
Mean SD Mean SD
Personal and organizational quality assessment (POQA)
Positive outlook 0.33 0.89 -2.33 0.05 -0.01 0.83 0.08 NS
Gratitude 0.43 1.17 -2.36 0.05 0.27 1.26 -1.06 NS
Motivation 0.43 0.82 -3.38 0.01 0.13 0.91 -0.70 NS
Calmness 0.30 1.08 -1.78 NS 0.11 0.92 -0.62 NS
Fatigue -0.37 1.16 2.03 0.05 -0.11 0.96 0.56 NS
Anxiety -0.17 0.89 1.22 NS 0.23 0.87 -1.30 NS
Depression -0.08 0.76 0.63 NS 0.24 0.49 -2.47 0.05
Anger -0.19 0.56 2.18 0.05 -0.06 0.46 0.68 NS
Resentfulness -0.16 0.86 1.18 NS 0.07 0.48 -0.77 NS
Stress symptoms -0.23 1.02 1.42 NS -0.04 0.58 0.38 NS
Work attitude 0.07 0.84 -0.53 NS -0.37 0.54 3.47 0.01
Strategic understanding -0.09 1.12 0.53 NS 0.03 1.16 -0.14 NS
Manager support 0.30 0.83 -2.29 0.05 -0.36 1.00 1.85 NS
Goal clarity 0.33 0.90 -2.36 0.05 0.12 1.21 -0.48 NS
Job challenge -0.17 0.77 1.46 NS -0.29 0.97 1.55 NS
Value of contribution 0.02 0.95 -0.11 NS -0.05 0.95 0.28 NS
Freedom of expression 0.08 1.24 -0.43 NS 0.04 0.99 -0.23 NS
Work intensity 0.16 0.82 -1.26 NS 0.08 0.78 -0.50 NS
Productivity 0.33 0.74 -2.84 0.01 0.03 1.02 -0.16 NS
Communication effectiveness 0.29 1.22 -1.54 NS 0.42 1.41 -1.49 NS
Confidence in the organization 0.03 1.12 -0.14 NS -0.38 0.82 2.36 0.05
Morale issues -0.06 1.47 0.27 NS 0.02 1.76 -0.06 NS
Time pressure -0.20 1.08 1.21 NS -0.13 1.28 0.54 NS
Intention to quit -0.04 1.49 0.16 NS 0.23 0.94 -1.25 NS
Brief symptom inventory (BSI)
Somatization -0.08 0.44 1.18 NS -0.03 0.57 0.32 NS
Obsessive-compulsive -0.17 0.55 1.95 NS -0.05 0.73 0.38 NS
Interpersonal sensitivity -0.19 0.55 2.16 0.05 -0.10 0.62 0.84 NS
Depression -0.09 0.64 0.86 NS -0.01 0.59 0.05 NS
Anxiety -0.13 0.49 1.70 NS -0.04 0.43 0.46 NS
Hostility -0.15 0.43 2.13 0.05 -0.16 0.48 1.73 NS
Phobic anxiety -0.01 0.36 0.09 NS -0.11 0.39 1.55 NS
Paranoid ideation -0.17 0.50 2.19 0.05 -0.01 0.41 0.16 NS
Psychoticism -0.04 0.38 0.67 NS 0.00 0.51 0.02 NS
Global severity index -0.11 0.37 1.88 NS -0.05 0.44 0.62 NS
Positive symptom distress index -0.07 0.32 1.34 NS 0.00 0.39 -0.03 NS
Positive symptom total -4.53 11.11 2.57 0.05 -0.67 9.20 0.38 NS
Jenkins activity survey (JAS)
Type A—overall score -14.59 45.97 2.03 0.05 -13.79 52.03 1.40 NS
Speed and impatience -17.90 44.05 2.60 0.05 -14.61 39.86 1.94 NS
Job involvement -5.76 31.43 1.17 NS -8.29 29.31 1.50 NS
Hard-driving and competitive -0.71 22.79 0.20 NS -4.89 19.88 1.30 NS
Appl Psychophysiol Biofeedback
123

difference is that while most of the significant correlations
(26/30) in the intervention group were in the low to mod-
erate range (r = 0.312–0.494), in the control group most
(22/31) were in the moderately strong to high range
(r = 0.501–0.876).
Comparing these results to the post-intervention
results, it is evident that while the incidence and pattern
of significant correlations for the control group are
broadly similar to those at baseline, a notable shift is
clearly apparent for the intervention group. This shift is
evident in the increased number of significant correlations
(from 30 to 47); the greater strength of these correlations
(16 in the moderately strong to high range; r = 0.502–
0.719); and in the pattern of significant relationships.
While space limitations do not permit a detailed analysis
of the substantive changes, we will briefly highlight three
patterns of note.
The first is that the pattern of 47 significant correlations
appears to reflect a post-intervention shift in emotional
experience in the experimental group, toward more
appropriate and healthier interrelationships among most of
the variables. For example, the positive correlation
between gratitude and motivation (0.531) shows that
strengthened feelings of gratitude and motivation found in
the t-tests above likely reinforce each other, while the
negative correlation between gratitude and depression
(-0.426) indicates that strengthened feelings of gratitude
appear to mitigate feelings of depression.
The second pattern of note is the post-intervention
emergence of significant correlations between the BSI and
JAS measures of psychosocial disposition and the POQA-
work-related attitudes (only two significant correlations
were found pre-intervention, whereas post-intervention ten
are observed).
The final pattern we note here is pre to post-intervention
incidence of significant correlations involving depression
(an increase of seven correlates), productivity (an increase
of 5), and gratitude (an increase of 4). Overall, the
impression is one of a marked shift in the experimental
group toward healthier and more appropriate interrela-
tionships among emotions, psychosocial dispositions, and
work attitudes. Whether this shift has also involved a
greater conscious understanding of these interrelationships
is an important question for future research.
N = 43
Experimental Group: Physiological Measures Before and After Intervention
Total Cholesterol
***
180
190
200
210
220
230
Pre Post
mg
/dL
HDL Cholesterol
40
42
44
46
48
Pre Postm
g/d
L
LDL Cholesterol
***
110
120
130
140
150
160
Pre Post
mg
/dL
Glucose
**
90
95
100
105
110
Pre Post
mg
/dL
Systolic Blood Pressure
***
112
114
116
118
120
122
124
126
Pre Post
mm
Hg
Diastolic Blood Pressure
**
74
76
78
80
82
84
Pre Post
mm
Hg
Heart Rate
*
64
66
68
70
72
74
76
78
Pre Post
BP
M
Fig. 1 Physiological measures before and after intervention among
participants in experimental group. Bar graphs illustrate physiolog-
ical variables in the experimental group, measured before and
3 months after the intervention program. The group showed
significant reductions in total cholesterol, LDL cholesterol, blood
glucose levels, systolic and diastolic blood pressure, and heart rate
after the intervention. * p \ 0.05, ** p \ 0.01, *** p \ 0.001
Appl Psychophysiol Biofeedback
123

Program Evaluations
Written program evaluations completed by all experimental
group participants revealed some important insights, both in
identifying the most prominent sources of workplace stress
and in assessing the intervention’s perceived relevance,
applicability, and effectiveness in meeting the needs of this
population. Issues relating to managing and dealing with
staff and co-worker interpersonal relations were most fre-
quently cited as the greatest challenge faced by participants
in the workplace, followed closely by dealing with stress
after an incident. Overall, the program was rated highly by
the great majority of the officers and appears to directly
address issues relevant to correctional officers and the goals
of the organization. The Intuitive Listening technique,
Freeze-Frame technique, and heart rhythm coherence
feedback technology were most frequently cited as the
aspects of the program that participants found most rele-
vant. On a question asking what aspects of the program they
would improve, the most common response was ‘‘None,’’
followed by suggestions to increase the duration of the
training. Finally, in the section of the evaluation that asked
officers to express any additional comments or suggestions
they might have, the most common recommendation,
expressed by the majority of officers who participated, was
that the program be provided for all staff.
These findings are corroborated by the results of an
analysis of post-study telephone interviews conducted with
experimental group participants. Of the twenty participants
who were able to be located for interviewing, 19 (95%)
said that they found the program’s tools ‘‘useful.’’ When
asked how often they used the tools, 17 (85%) reported
using the tools at least three times a week, of which 11
(65%) said they used the tools daily or more often.
Risk Factor Reduction Cost Analysis
An analysis was performed to determine the projected cost
savings to the organization that would likely result from the
reduction in participants’ health risk factors. Separate cal-
culations were performed to determine projected changes
in health care costs and in absentee costs.
N = 32
Control Group: Physiological Measures Before and After Intervention
Total Cholesterol
*
180
190
200
210
220
230
Pre Post
mg
/dL
HDL Cholesterol
*
40
42
44
46
48
Pre Post
mg
/dL
LDL Cholesterol
110
120
130
140
150
160
Pre Post
mg
/dL
Glucose
*
90
95
100
105
110
Pre Post
mg
/dL
Systolic Blood Pressure
112
114
116
118
120
122
124
126
Pre Post
mm
Hg
Diastolic Blood Pressure
74
76
78
80
82
84
Pre Post
mm
Hg
Heart Rate
64
66
68
70
72
74
76
78
Pre PostB
PM
Fig. 2 Physiological measures before and after intervention among
participants in control group. Bar graphs illustrate physiological
variables in the control group, measured at baseline and 3 months
later. The group showed significant reductions in total cholesterol,
HDL cholesterol, and blood glucose levels at the 3-months measure-
ment point. * p \ 0.05
Appl Psychophysiol Biofeedback
123

Health Care Costs
A number of health risk factors have been shown to be
associated with higher health care costs (Table 1). The
presence of multiple risk factors provides a better predic-
tion of future costs than any single factor (Aldana 2001).
Studies by Yen et al. (1991) established annual health care
costs associated with multiple risk factors. It was found that
annual health care costs for the group with zero health risk
factors were only 37% of average; the group with one risk
factor had costs 70% of average; employees with two or
three risk factors had medical costs that were 105% of
average; those with four or five risk factors had medical
costs that were at 139%; and those with six or more risk
factors had the highest medical costs, at 301% of average.
In examining the baseline data for the experimental
group, it was found that 8% of this sample had only one
risk factor, 49% had two or three risk factors, 38% had four
or five risk factors and 5% had six or more risk factors. Of
the control group, 13% had one risk factor, 43% had two or
three risk factors, 39% had four or five risk factors, and 4%
had six or more. At the completion of the study, 43% of the
experimental group participants had reduced a sufficient
number of their risk factors to place them into a lower
projected cost status, whereas the percentage of control
group participants who lowered their projected cost
status was only 26% (Fig. 3). For both groups these
improvements were primarily due to reductions in choles-
terol, diastolic blood pressure, and the risk age index. The
experimental group also had risk reduction in systolic
blood pressure, and improved life satisfaction and
increased regular exercise.
An analysis was performed to calculate the projected
health care cost savings that would result from the reduction
in risk factors. Because actual annual medical costs were
unavailable, we used the US Department of Health and
Human Services/Center for Disease Control, National
Center for Health Statistics’ figure of $5,219, the average
national health expenditure per capita for 2004 (the most
recent year available at the time of the study) to represent the
average annual medical cost per employee. By multiplying
the average health expenditure by each participant’s risk-
related proportion of this cost, the projected health care cost
for each participant was determined. For example, a par-
ticipant with four health risk factors has a projected annual
health care cost of $7,129 ($5,129 9 139% = $7,129).
The mean difference between pre- and post-intervention
projected health care costs was calculated for both the
experimental and control groups. Using this procedure, a
pre-intervention average health care cost of $6,556 was
projected for each employee in the experimental group. At
the end of the study, the projected average health care cost
per employee was reduced to $5,377, resulting in an average
annual savings of $1,179 per employee. The control group’s
pre-intervention projected average health care cost per
employee was $6,381. At the end of the study, the projected
cost per employee was reduced to $5,995, resulting in an
annual savings of $386 per employee.
Discussion
This study was initiated by the State of California Com-
mission on Correctional Peace Officer Standards and
Training (CPOST) to determine if the Power to Change
Performance stress and health risk reduction program was an
effective intervention to help correctional peace officers
reduce the high levels of stress they face on a daily basis; to
determine if these officers have increased health risks; and if
so, to determine whether these risks could be reduced by this
intervention. The physiological measures were considered
important aspects of the research, as law enforcement per-
sonnel have the tendency to under-report stress levels and
stress symptoms (McCraty et al. 1999). It has been suggested
by a number of researchers that law enforcement affords a
professional environment that encourages emotional
detachment from others as well as from workers’ own
feelings. This may explain officers’ tendency to under-report
their stress levels (Blackmore 1978; Coman and Evans
1991; Sewell 1981). The repercussions of this clearly extend
43%49%
8%
26%
65%
9%
0%
10%
20%
30%
40%
50%
60%
70%
Reduced coststatus
No change incost status
Increased coststatus
% o
f P
arti
cip
ants
Experimental Group Control Group
Impact of Risk Factor Changes on Health Care Cost Status
Fig. 3 Impact of risk factor changes on health care cost status.
Illustrates changes in health care cost status, based on number of
health risk factors in the experimental and control groups over the
study period. Reductions in cost status were achieved by 43% of the
experimental group 3 months after the intervention program and by
26% of the control group over this same time period
Appl Psychophysiol Biofeedback
123

to officers’ families, where it is reflected in poor relation-
ships with spouses and children and the notably high rates of
marital disruption and divorce known to exist within this
profession (Coman and Evans 1991; Jackson and Malasch
1982; Territo and Vetter 1981).
Overall, the emotion self-regulation and communication
techniques, together with the HRV biofeedback component
of the program, appear to have helped the officers to
manage the unavoidable sources of stress they face and to
reduce the impact of this stress on their health. The analysis
of within-group changes indicated that numerous signifi-
cant improvements were realized by the implementation of
the intervention. The POQA showed significant reductions
in fatigue and anger along with increased positive outlook,
gratitude, productivity, motivation, goal clarity, and man-
ager support in the experimental group, but not in the
control group. The BSI also showed that the experimental
group experienced significant reductions in interpersonal
sensitivity, hostility, and overall psychological distress,
while the JAS showed significant reductions in the global
Type A behavior pattern and in speed and impatience.
Physiological measures were also impacted. Total cho-
lesterol and glucose were reduced in both groups, while LDL
cholesterol fell in the experimental group. Heart rate, sys-
tolic, and diastolic blood pressure were also significantly
reduced in the experimental group but not in the control
group. We anticipated blood pressure reductions in employ-
ees who had elevated blood pressure based on findings from
previous studies (Barrios-Choplin et al. 1997; McCraty et al.
2003), however, this study also demonstrated significant
reductions in blood pressure in the experimental group as a
whole, which supports the perspective that the program
reduced the officers’ overall stress levels.
The HRV analysis revealed a significant increase in the
low frequency/high frequency ratio in the experimental
group but not in the control group. It should be noted that
while an increase in this ratio is often interpreted to signify
an increase in sympathetic activation, a different interpre-
tation is warranted here, in light of the heart rhythm
coherence-building intervention used in this study. As
mentioned above, the coherence state is marked by
entrainment between the heart rhythm, respiration, and
blood pressure rhythm at a frequency around 0.1 Hz, which
falls in the center of the low frequency band. While this
could be misinterpreted as a large increase in sympathetic
activity, in reality in this case it is primarily due to an
increase in parasympathetic activity and vascular reso-
nance (Tiller et al. 1996). Sophisticated modeling tech-
niques have shown that about 50% of the total power in the
low frequency band is explained by signals impinging on
the sinus node which are generated at a central level, and
the majority of the remaining power is due to resonance in
the arterial pressure regulation feedback loop (Baselli et al.
1994). The sympathetic system does not appear to operate
much above frequencies of 0.1 Hz, while the parasympa-
thetic can be observed to operate down to frequencies of
0.05 Hz (Aguirre et al. 1990). Parasympathetic influences
in the low frequency range are particularly present when
the respiration rate is below seven breaths per minute, as is
true when individuals are in a state of heart rhythm
coherence (Tiller et al. 1996). Thus, in this study, the
increase in the low frequency/high frequency ratio in
experimental group participants most likely reflects an
overall increase in heart rhythm coherence and parasym-
pathetic activity facilitated by use of the coherence-build-
ing techniques and biofeedback technology. This result is
also consistent with the findings that experimental group
participants experienced significant increases in gratitude
and positive outlook after the training, as positive affective
states have been associated both with heart rhythm coher-
ence and with increased power in the low frequency range
(McCraty et al. 1995; Tiller et al. 1996; Bacon et al. 2004).
There was a significant decrease in DHEA in the
experimental group in this study. One would typically
expect a gradual increase in DHEA after a stress reduction
intervention (McCraty et al. 1998). The finding that DHEA
was decreased in this study sample after the short follow-
up period, combined with the finding that a higher number
of officers than would be expected had high baseline levels
of cortisol, suggests that these officers are under higher
levels of stress than the general population. In the case of a
chronically stressed individual, it typically takes between 6
and 9 months for the system to recover (i.e., for cortisol to
decrease to normal levels and DHEA to increase); there-
fore, a longer follow-up period would be required to detect
such changes in this study sample.
Limitations and Future Directions
A main limitation of this study was that the total number of
participants was too small to provide the statistical power
required to detect between-group differences associated
with the intervention program. This, combined with the
presence of cross-contamination effects between the two
groups, precluded the possibility of a meaningful between-
group analysis. Use of a matched-group design in which
there is no contact between participants in the experimental
and control groups would prevent cross-contamination
effects and should be employed, if possible, in future fol-
low-up studies. While this would have been an ideal design
for the current study, unfortunately it did not prove logis-
tically possible given the available study population. It is
unfortunate that the control group was exposed to cross-
contamination, which was clearly verified in the post-study
questionnaire. On the other hand, it highlighted the desire
and enthusiasm the officers had for such a program.
Appl Psychophysiol Biofeedback
123

A further limitation was that beyond the initial group
training, participant use of the Freeze-Framer heart rhythm
coherence feedback system was not systematically moni-
tored or tracked, partly due to the institutional constraints
inherent in conducting field research in a secure correctional
facility. The main purpose of the technology in this study
was to support participants in the learning and effective use
of the emotion self-regulation techniques taught in the
program. To this end, units were made available, on a shared
basis, for participants to use at their convenience at the work
site and to take home. While not directly asked, there is
some evidence from post-study interviews that the HRV
feedback technology was among the tools many respondents
found useful—40% named the Freeze-Framer system
among the tools that they ‘‘used the most.’’ Even so, under
ideal conditions, implementing and tracking a systematic
practice schedule for all participants would have allowed for
a more accurate assessment of the technology’s specific
contribution to the study’s overall outcomes.
Another limitation of the study was its relatively short
follow-up period (90 days). Studies with a longer follow-
up period could reasonably be expected to demonstrate
additional reductions in health risk factors and increased
health care cost savings.
Conclusion
In conclusion, the results of this study indicate that the
‘‘Power to Change Performance’’ program is a time-effi-
cient and cost-effective means to significantly reduce stress
and health risk factors in a population of correctional peace
officers, while enhancing employee productivity and psy-
chological well-being. Based on these outcomes, reduc-
tions in annual health care costs are projected. In sum, by
reducing the physiological, psychological, performance-
related, and financial impact of high stress and health risks
in this crucial and demanding profession, the program
promises significant benefits both to the employees as
individuals and to the organization as a whole. From a
broader perspective, the program is likely to prove a
valuable stress reduction and health promotion intervention
for other high-risk, high-stress professions.
Acknowledgments The research project on which this paper is
based, ‘‘Impact of the Power to Change Performance Program on
Stress and Health Risks in Correctional Officers,’’ was financially
supported by the State of California Commission on Correctional
Peace Officer Standards and Training (CPOST).
Appendix
See Table 6. Ta
ble
6
12
34
56
78
91
01
11
21
3
Inte
rven
tio
ng
rou
pp
rest
ud
yco
rrel
ati
on
s(N
=4
1)
PO
QA
-R1
.G
rati
tud
e
PO
QA
-R2
.M
oti
vat
ion
0.2
21
PO
QA
-R3
.F
atig
ue
0.2
65
0.0
83
PO
QA
-R4
.D
epre
ssio
n0
.16
4-
0.4
47
**
0.1
9
PO
QA
-R5
.A
ng
er0
.04
-0
.22
30
.27
50
.02
1
PO
QA
-R6
.W
ork
atti
tud
e0
.09
40
.49
4*
*0
.17
6-
0.3
43
*-
0.2
43
PO
QA
-R7
.M
anag
ersu
pp
ort
0.1
87
0.3
76
*0
.17
50
.01
8-
0.3
12
*0
.48
5*
*
PO
QA
-R8
.G
oal
clar
ity
0.2
62
0.4
31
**
0.4
04
**
-0
.10
7-
0.1
85
0.4
38
**
0.6
59
**
PO
QA
-R9
.P
rod
uct
ivit
y0
.27
90
.56
6*
*0
.02
7-
0.1
13
-0
.28
20
.38
1*
0.2
90
.34
1*
PO
QA
-R1
0.
Co
nfi
den
cein
the
org
aniz
atio
n
0.0
29
0.1
71
-0
.05
7-
0.0
78
-0
.26
60
.30
40
.36
8*
0.3
46
*0
.21
BS
I1
1.
Inte
rper
son
alse
nsi
tiv
ity
-0
.01
8-
0.3
75
*0
.20
90
.43
5*
*0
.38
0*
-0
.22
1-
0.0
11
-0
.26
3-
0.1
97
0.0
71
BS
I1
2.
Ho
stil
ity
-0
.20
4-
0.4
94
**
0.2
87
0.0
95
0.4
28
**
-0
.44
6*
*-
0.1
76
-0
.23
2-
0.3
63
*-
0.0
76
0.4
68
**
BS
I1
3.
Par
ano
idid
eati
on
-0
.22
2-
0.3
07
0.3
82
*0
.27
30
.21
4-
0.2
21
-0
.01
30
.01
5-
0.1
23
0.1
31
0.5
40
**
0.6
10
**
JAS
14
.S
pee
dan
dim
pat
ien
ce-
0.3
29
*-
0.2
17
0.3
73
*-
0.1
16
0.4
07
**
0.0
55
-0
.05
1-
0.0
24
-0
.24
6-
0.1
86
0.1
91
0.4
25
**
0.2
13
Appl Psychophysiol Biofeedback
123
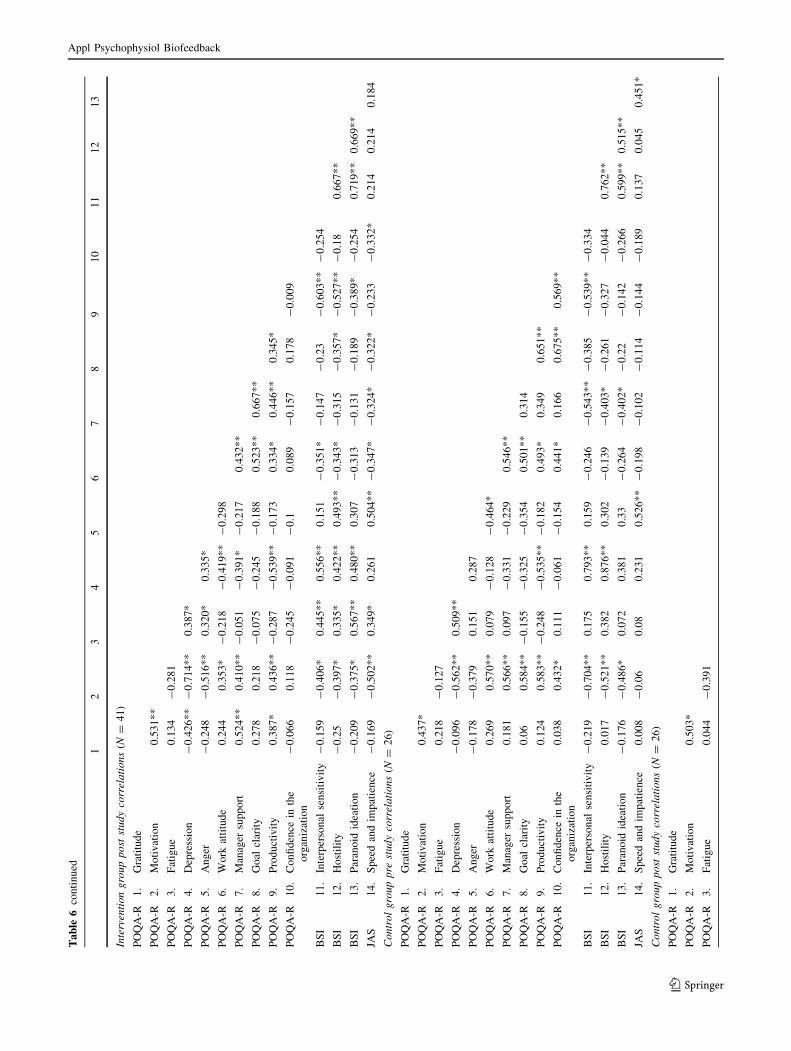
Ta
ble
6co
nti
nu
ed
12
34
56
78
91
01
11
21
3
Inte
rven
tio
ng
rou
pp
ost
stu
dy
corr
ela
tio
ns
(N=
41
)
PO
QA
-R1
.G
rati
tud
e
PO
QA
-R2
.M
oti
vat
ion
0.5
31
**
PO
QA
-R3
.F
atig
ue
0.1
34
-0
.28
1
PO
QA
-R4
.D
epre
ssio
n-
0.4
26
**
-0
.71
4*
*0
.38
7*
PO
QA
-R5
.A
ng
er-
0.2
48
-0
.51
6*
*0
.32
0*
0.3
35
*
PO
QA
-R6
.W
ork
atti
tud
e0
.24
40
.35
3*
-0
.21
8-
0.4
19
**
-0
.29
8
PO
QA
-R7
.M
anag
ersu
pp
ort
0.5
24
**
0.4
10
**
-0
.05
1-
0.3
91
*-
0.2
17
0.4
32
**
PO
QA
-R8
.G
oal
clar
ity
0.2
78
0.2
18
-0
.07
5-
0.2
45
-0
.18
80
.52
3*
*0
.66
7*
*
PO
QA
-R9
.P
rod
uct
ivit
y0
.38
7*
0.4
36
**
-0
.28
7-
0.5
39
**
-0
.17
30
.33
4*
0.4
46
**
0.3
45
*
PO
QA
-R1
0.
Co
nfi
den
cein
the
org
aniz
atio
n
-0
.06
60
.11
8-
0.2
45
-0
.09
1-
0.1
0.0
89
-0
.15
70
.17
8-
0.0
09
BS
I1
1.
Inte
rper
son
alse
nsi
tiv
ity
-0
.15
9-
0.4
06
*0
.44
5*
*0
.55
6*
*0
.15
1-
0.3
51
*-
0.1
47
-0
.23
-0
.60
3*
*-
0.2
54
BS
I1
2.
Ho
stil
ity
-0
.25
-0
.39
7*
0.3
35
*0
.42
2*
*0
.49
3*
*-
0.3
43
*-
0.3
15
-0
.35
7*
-0
.52
7*
*-
0.1
80
.66
7*
*
BS
I1
3.
Par
ano
idid
eati
on
-0
.20
9-
0.3
75
*0
.56
7*
*0
.48
0*
*0
.30
7-
0.3
13
-0
.13
1-
0.1
89
-0
.38
9*
-0
.25
40
.71
9*
*0
.66
9*
*
JAS
14
.S
pee
dan
dim
pat
ien
ce-
0.1
69
-0
.50
2*
*0
.34
9*
0.2
61
0.5
04
**
-0
.34
7*
-0
.32
4*
-0
.32
2*
-0
.23
3-
0.3
32
*0
.21
40
.21
40
.18
4
Co
ntr
ol
gro
up
pre
stu
dy
corr
ela
tio
ns
(N=
26
)
PO
QA
-R1
.G
rati
tud
e
PO
QA
-R2
.M
oti
vat
ion
0.4
37
*
PO
QA
-R3
.F
atig
ue
0.2
18
-0
.12
7
PO
QA
-R4
.D
epre
ssio
n-
0.0
96
-0
.56
2*
*0
.50
9*
*
PO
QA
-R5
.A
ng
er-
0.1
78
-0
.37
90
.15
10
.28
7
PO
QA
-R6
.W
ork
atti
tud
e0
.26
90
.57
0*
*0
.07
9-
0.1
28
-0
.46
4*
PO
QA
-R7
.M
anag
ersu
pp
ort
0.1
81
0.5
66
**
0.0
97
-0
.33
1-
0.2
29
0.5
46
**
PO
QA
-R8
.G
oal
clar
ity
0.0
60
.58
4*
*-
0.1
55
-0
.32
5-
0.3
54
0.5
01
**
0.3
14
PO
QA
-R9
.P
rod
uct
ivit
y0
.12
40
.58
3*
*-
0.2
48
-0
.53
5*
*-
0.1
82
0.4
93
*0
.34
90
.65
1*
*
PO
QA
-R1
0.
Co
nfi
den
cein
the
org
aniz
atio
n
0.0
38
0.4
32
*0
.11
1-
0.0
61
-0
.15
40
.44
1*
0.1
66
0.6
75
**
0.5
69
**
BS
I1
1.
Inte
rper
son
alse
nsi
tiv
ity
-0
.21
9-
0.7
04
**
0.1
75
0.7
93
**
0.1
59
-0
.24
6-
0.5
43
**
-0
.38
5-
0.5
39
**
-0
.33
4
BS
I1
2.
Ho
stil
ity
0.0
17
-0
.52
1*
*0
.38
20
.87
6*
*0
.30
2-
0.1
39
-0
.40
3*
-0
.26
1-
0.3
27
-0
.04
40
.76
2*
*
BS
I1
3.
Par
ano
idid
eati
on
-0
.17
6-
0.4
86
*0
.07
20
.38
10
.33
-0
.26
4-
0.4
02
*-
0.2
2-
0.1
42
-0
.26
60
.59
9*
*0
.51
5*
*
JAS
14
.S
pee
dan
dim
pat
ien
ce0
.00
8-
0.0
60
.08
0.2
31
0.5
26
**
-0
.19
8-
0.1
02
-0
.11
4-
0.1
44
-0
.18
90
.13
70
.04
50
.45
1*
Co
ntr
ol
gro
up
po
stst
ud
yco
rrel
ati
on
s(N
=2
6)
PO
QA
-R1
.G
rati
tud
e
PO
QA
-R2
.M
oti
vat
ion
0.5
03
*
PO
QA
-R3
.F
atig
ue
0.0
44
-0
.39
1
Appl Psychophysiol Biofeedback
123

References
Aboa-Eboule, C., Brisson, C., Maunsell, E., Masse, B., Bourbonnais,
R., Vezina, M., et al. (2007). Job strain and risk of acute
recurrent coronary heart disease events. Journal of the AmericanMedical Association, 298(14), 1652–1660. doi:10.1001/jama.
298.14.1652.
Aguirre, A., Wodicka, G. R., Maayan, C., & Shannon, D. C. (1990).
Interaction between respiratory and RR interval oscillations at
low frequencies. Journal of the Autonomic Nervous System, 29,
241–246. doi:10.1016/0165-1838(90)90150-H.
Aldana, S. G. (2001). Financial impact of health promotion programs:
A comprehensive review of the literature. American Journal ofHealth Promotion, 15(5), 296–320.
Bacon, S. L., Watkins, L. L., Babyak, M., Sherwood, A., Hayano, J.,
Hinderliter, A. L., et al. (2004). Effects of daily stress on
autonomic cardiac control in patients with coronary artery
disease. The American Journal of Cardiology, 93(10), 1292–
1294. doi:10.1016/j.amjcard.2004.02.018.
Barrios-Choplin, B., McCraty, R., & Cryer, B. (1997). An inner
quality approach to reducing stress and improving physical and
emotional wellbeing at work. Stress Medicine, 13(3), 193–201.
doi:10.1002/(SICI)1099-1700(199707)13:3\193::AID-SMI744
[3.0.CO;2-I.
Barrios-Choplin, B., McCraty, R., Sundram, J., & Atkinson, M. (1999).
The effect of employee self-management training on personal andorganizational quality. Boulder Creek, CA: HeartMath Research
Center, Institute of HeartMath. publication no. 99-083.
Baselli, G., Cerutti, S., Badilini, F., Biancardi, L., Porta, A., Pagani,
M., et al. (1994). Model for the assessment of heart period
variability interactions of respiration influences. Medical &Biological Engineering & Computing, 32(2), 143–152. doi:
10.1007/BF02518911.
Bigger, J. T., Jr, Fleiss, J. L., Steinman, R. C., Rolnitzky, L. M.,
Kleiger, R. E., & Rottman, J. N. (1992). Frequency domain
measures of heart period variability and mortality after myo-
cardial infarction. Circulation, 85(1), 164–171.
Blackmore, J. (1978). Are police allowed to have problems of their
own? Police Magazine, 1(3), 47–55.
Bradford, E. J., Wesnes, K. A., & Brett, D. (2005). Effects of peak
performance training on cognitive function. Journal of Psycho-pharmacology (Oxford, England), 19(suppl 5), A44.
Bradley, R. T., McCraty, R., Atkinson, M., Arguelles, L., Rees, R. A., &
Tomasino, D. (2007). Reducing test anxiety and improving testperformance in America’s schools: Results from the TestEdgenational demonstration study. Boulder Creek, CA: HeartMath
Research Center, Institute of HeartMath. publication no. 07-09-01.
Brown, J., & Campbell, E. (1994). Stress and policing: Sources andstrategies. Chichester: Wiley.
Burke, R. J. (1994). Stressful events, work-family conflict, coping,
psychological burnout, and well-being among police officers.
Psychological Reports, 75(2), 787–800.
Burke, R. J., & Mikkelsen, A. (2005). Career stage and police
cynicism. Psychological Reports, 96(3 pt 2), 989–992.
Chandola, T., Britton, A., Brunner, E., Hemingway, H., Malik, M.,
Kumari, M., et al. (2008). Work stress and coronary heart
disease: What are the mechanisms? European Heart Journal,29(5), 640–648. doi:10.1093/eurheartj/ehm584.
Childre, D., & Cryer, B. (2000). From chaos to coherence: The powerto change performance. Boulder Creek, CA: Planetary.
Childre, D., & Martin, H. (1999). The HeartMath solution. San
Francisco: HarperSanFrancisco.
Childre, D., & Rozman, D. (2005). Transforming stress: TheHeartMath solution to relieving worry, fatigue, and tension.
Oakland, CA: New Harbinger.
Ta
ble
6co
nti
nu
ed
12
34
56
78
91
01
11
21
3
PO
QA
-R4
.D
epre
ssio
n-
0.4
27
*-
0.0
72
0.2
65
PO
QA
-R5
.A
ng
er-
0.2
84
-0
.50
9*
*0
.49
9*
0.2
15
PO
QA
-R6
.W
ork
atti
tud
e0
.23
40
.52
3*
*0
.08
90
.17
9-
0.1
23
PO
QA
-R7
.M
anag
ersu
pp
ort
0.2
69
0.3
89
0.3
86
0.1
57
0.3
23
0.4
81
*
PO
QA
-R8
.G
oal
clar
ity
-0
.04
80
.39
8*
-0
.22
50
.26
1-
0.0
25
0.2
88
0.2
57
PO
QA
-R9
.P
rod
uct
ivit
y0
.13
30
.46
5*
-0
.22
6-
0.0
33
-0
.18
60
.51
1*
*0
.15
50
.22
4
PO
QA
-R1
0.
Co
nfi
den
cein
the
org
aniz
atio
n
0.0
54
0.3
18
-0
.28
0.1
69
-0
.03
80
.49
5*
0.3
44
0.3
56
0.4
03
*
BS
I1
1.
Inte
rper
son
alse
nsi
tiv
ity
-0
.29
5-
0.5
16
**
0.3
90
.38
10
.23
4-
0.2
77
-0
.13
-0
.19
4-
0.3
76
-0
.49
0*
BS
I1
2.
Ho
stil
ity
-0
.49
2*
-0
.51
0*
0.4
38
*0
.50
0*
0.6
25
**
-0
.04
0.2
04
0.2
31
0.0
04
0.0
09
0.5
38
**
BS
I1
3.
Par
ano
idid
eati
on
-0
.54
1*
*-
0.6
56
**
0.1
92
0.1
49
0.4
07
*-
0.4
67
*-
0.3
75
-0
.21
8-
0.1
58
-0
.55
1*
*0
.64
3*
*0
.55
9*
*
JAS
14
.S
pee
dan
dim
pat
ien
ce-
0.1
88
-0
.30
30
.20
9-
0.1
52
0.3
3-
0.2
67
-0
.08
8-
0.0
99
0.0
62
-0
.29
2-
0.0
01
0.2
10
.38
4
*p\
0.0
5,
**
p\
0.0
1
Appl Psychophysiol Biofeedback
123

Cohen, S., Janicki-Deverts, D., & Miller, G. E. (2007). Psychological
stress and disease. Journal of the American Medical Association,298(14), 1685–1687. doi:10.1001/jama.298.14.1685.
Coman, G., & Evans, B. (1991). Stressors facing Australian police in
the 1990s. Policy Studies, 14(4), 153–165.
Cooper, C. L., Davidson, M. J., & Robinson, P. (1982). Stress in the
police service. Journal of Occupational Medicine, 24(1), 30–36.
Dekker, J., Schouten, E. G., Klootwijk, P., Pool, J., Swenne, C. A., &
Kromhout, D. (1997). Heart rate variability from short electro-
cardiographic recordings predicts mortality from all causes in
middle-aged and elderly men. American Journal of Epidemiol-ogy, 145(10), 899–908.
Eddington, D., Yen, L., & Braunstein, A. (1999). The reliability and
validity of HRAs. In SPM Handbook of Health Assessment Tools(pp. 135–141). The Society of Prospective Medicine and the
Institute for Health and Productivity Management.
Fronstin, P. (1996). Health promotion and disease prevention: A look
at demand management programs. EBRI Issue Brief, (177), 1–14.
Ginsberg, J. P. (2009). Autonomic control of heart rate and heart rate
variability: Influences on orienting and information processing in
combat veterans with PTSD. In D. A. Powell (Ed.), Centralnervous system control of learned autonomic adjustments (in
press). Kerala, India: Research Signposts.
Goetzel, R. Z., Anderson, D. R., Whitmer, R. W., Ozminkowski, R. J.,
Dunn, R. L., & Wasserman, J. (1998). The relationship between
modifiable health risks and health care expenditures. An analysis
of the multi-employer HERO health risk and cost database. The
Health Enhancement Research Organization (HERO) Research
Committee. Journal of Occupational and EnvironmentalMedicine, 40(10), 843–854. doi:10.1097/00043764-199810000-
00003.
Jabaaij, L. (1993). Immunologic, endocrine and psychological
influences on cortisol-induced immunoglobulin synthesis in
vitro. Psychoneuroendocrinology, 18, 591–605. doi:10.1016/
0306-4530(93)90036-K.
Jackson, S., & Malasch, C. (1982). After-effects of job-related stress:
Families as victims. Journal of Occupational Behavior, 3, 63–
77. doi:10.1002/job.4030030106.
Karavidas, M. (2008). Heart rate variability biofeedback for major
depression. Biofeedback, 36(1), 18–21.
Kerr, D. S., Campbell, L. W., Applegate, M. D., Brodish, A., &
Landfield, P. W. (1991). Chronic stress-induced acceleration of
electrophysiologic and morphometric biomarkers of hippocam-
pal aging. The Journal of Neuroscience, 11(5), 1316–1324.
Kirkcaldy, B., Cooper, C. L., & Ruffalo, P. (1995). Work stress and
health in a sample of U.S. police. Psychological Reports, 76(2),
700–702.
Lehrer, P. M., Vaschillo, E., & Vaschillo, B. (2000). Resonant frequency
biofeedback training to increase cardiac variability. Rationale and
manual for training. Applied Psychophysiology and Biofeedback,25(3), 177–191. doi:10.1023/A:1009554825745.
Lehrer, P., Vaschillo, E., Vaschillo, B., Lu, S. E., Scardella, A.,
Siddique, M., et al. (2004). Biofeedback treatment for asthma.
Chest, 126(2), 352–361. doi:10.1378/chest.126.2.352.
Luskin, F., Reitz, M., Newell, K., Quinn, T. G., & Haskell, W. (2002).
A controlled pilot study of stress management training of elderly
patients with congestive heart failure. Preventive Cardiology,5(4), 168–172, 176. doi:10.1111/j.1520.037X.2002.01029.x.
Malliani, A. (1995). Association of heart rate variability components
with physiological regulatory mechanisms. In M. Malik & A. J.
Camm (Eds.), heart rate variability (pp. 173–188). Armonk, NY:
Futura Publishing Company, Inc.
Manolagas, S. C., Anderson, D. C., & Lindsay, R. (1979). Adrenal
steroids and the development of osteoporosis in oophorecto-
mised women. Lancet, 2(8143), 597–600. doi:10.1016/S0140-
6736(79)91663-5.
McCraty, R., Atkinson, M., & Lipsenthal, L. (2000). Emotional self-regulation program enhances psychological health and qualityof life in patients with diabetes. Boulder Creek, CA: HeartMath
Research Center, Institute of HeartMath. publication no. 00-006.
McCraty, R., Atkinson, M., Rein, G., & Watkins, A. D. (1996). Music
enhances the effect of positive emotional states on salivary IgA.
Stress Medicine, 12(3), 167–175. doi:10.1002/(SICI)1099-1700
(199607)12:3\167::AID-SMI697[3.0.CO;2-2.
McCraty, R., Atkinson, M., Tiller, W. A., Rein, G., & Watkins, A. D.
(1995). The effects of emotions on short-term power spectrum
analysis of heart rate variability. The American Journal of Cardi-ology, 76(14), 1089–1093. doi:10.1016/S0002-9149(99)80309-9.
McCraty, R., Atkinson, M., & Tomasino, D. (2003). Impact of a
workplace stress reduction program on blood pressure and
emotional health in hypertensive employees. Journal of Alter-native and Complementary Medicine (New York, NY), 9(3), 355–
369. doi:10.1089/107555303765551589.
McCraty, R., Atkinson, M., Tomasino, D., & Bradley, R. T. (2006).
The coherent heart: Heart-brain interactions, psychophysiolog-ical coherence, and the emergence of system-wide order.
Boulder Creek, CA: HeartMath Research Center, Institute of
HeartMath. publication no. 06-022.
McCraty, R., Barrios-Choplin, B., Rozman, D., Atkinson, M., &
Watkins, A. D. (1998). The impact of a new emotional self-
management program on stress, emotions, heart rate variability,
DHEA and cortisol. Integrative Physiological and BehavioralScience, 33(2), 151–170. doi:10.1007/BF02688660.
McCraty, R., & Tomasino, D. (2006a). Coherence-building tech-
niques and heart rhythm coherence feedback: New tools for
stress reduction, disease prevention, and rehabilitation. In E.
Molinari, A. Compare, & G. Parati (Eds.), Clinical psychologyand heart disease (Vol. 488–509). Milan: Springer.
McCraty, R., & Tomasino, D. (2006b). Emotional stress, positive
emotions, and psychophysiological coherence. In B. B. Arnetz &
R. Ekman (Eds.), Stress in health and disease (pp. 342–365).
Weinheim: Wiley-VCH.
McCraty, R., Tomasino, D., Atkinson, M., & Sundram, J. (1991).
Impact of the HeartMath self-management skills program on
physiological stress in police officers. Report number, publica-
tion no. 99-075. Retrieved from http://www.heartmath.org/
research/research-publications.html.
McCraty, R., Tomasino, D., Atkinson, M., & Sundram, J. (1999).
Impact of the HeartMath self-management skills program onphysiological and psychological stress in police officers. Boulder
Creek, CA: Heartmath Research Center, Institute of HeartMath.
publication no. 99-075.
McLaren, S., Gollan, W., & Horwell, C. (1998). Perceived stress as a
function of occupation. Psychological Reports, 82(3 (Pt 1)), 794.
Namiki, M. (1994). Biological markers of aging. Nippon RonenIgakkai Zasshi. Japanese Journal of Geriatrics, 31, 85–95.
Nolan, R. P., Kamath, M. V., Floras, J. S., Stanley, J., Pang, C.,
Picton, P., et al. (2005). Heart rate variability biofeedback as a
behavioral neurocardiac intervention to enhance vagal heart rate
control. American Heart Journal, 49(6), 1137.e1–1137.e7.
Rein, G., Atkinson, M., & McCraty, R. (1995). The physiological and
psychological effects of compassion and anger. Journal ofAdvancement in Medicine, 8(2), 87–105.
Sewell, J. (1981). Police stress. In FBI Law enforcement bulletin (pp.
7–11). Washington, DC: Federal Bureau of Investigation.
Siepmann, M., Aykac, V., Unterdorfer, J., Petrowski, K., & Mueck-
Weymann, M. (2008). A pilot study on the effects of heart rate
variability biofeedback in patients with depression and in healthy
subjects. Applied Psychophysiology and Biofeedback, 33(4),
195–201.
Singer, D. H., Martin, G. J., Magid, N., Weiss, J. S., Schaas, J. W.,
Kehoe, R., et al. (1988). Low heart rate variability and sudden
Appl Psychophysiol Biofeedback
123

cardiac death. Journal of Electrocardiology, (Suppl), S46–S55.
doi:10.1016/0022-0736(88)90055-6.
Stotland, E., & Pendleton, M. (1989). Workload, stress, and strain
among police officers. Behavioral Medicine (Washington, D.C.),15(1), 5–17.
Territo, L., & Vetter, H. (1981). Stress and police personnel. Journalof Police Science and Administration, 9, 195–208.
Tiller, W. A., McCraty, R., & Atkinson, M. (1996). Cardiac
coherence: A new, noninvasive measure of autonomic nervous
system order. Alternative Therapies in Health and Medicine,2(1), 52–65.
Tsuji, H., Larson, M. G., Venditti, F. J. Jr., Manders, E. S., Evans, J.
C., Feldman, C. L., et al. (1996). Impact of reduced heart rate
variability on risk for cardiac events: The Framingham heart
study. Circulation, 94, 2850–2855.
Tsuji, H., Venditti, F. J. Jr., Manders, E. S., Evans, J. C., Larson, M.
G., Feldman, C. L., et al. (1994). Reduced heart rate variability
and mortality risk in an elderly cohort. The Framingham heart
study. Circulation, 90(2), 878–883.
Vaschillo, E. G., Vaschillo, B., & Lehrer, P. (2006). Characteristics of
resonance in heart rate variability stimulated by biofeedback.
Applied Psychophysiology and Biofeedback, 31(2), 129–142.
doi:10.1007/s10484-006-9009-3.
Villareal, R. P., Liu, B. C., & Massumi, A. (2002). Heart rate
variability and cardiovascular mortality. Current AtherosclerosisReports, 4(2), 120–127. doi:10.1007/s11883-002-0035-1.
Yen, L. T., Eddington, D. W., & Witting, P. (1991). Associations
between health risk appraisal scores and employee medical
claims costs in a manufacturing company. American Journal ofHealth Promotion, 6(1), 46–54.
Zapf, D., Vogt, C., Seifert, C., Mertini, H., & Isic, A. (1999). Emotion
work as a source of stress: The concept and development of an
instrument. European Journal of Work and OrganizationalPsychology, 8, 371–400. doi:10.1080/135943299398230.
Appl Psychophysiol Biofeedback
123