New Hampshire Statewide Forest Resources Assessment – 2010 · The New Hampshire Statewide Forest...
59
New Hampshire Statewide Forest Resources Assessment – 2010 Important Data and Information about New Hampshire’s Forests New Hampshire Department of Resources and Economic Development Division of Forests and Lands
Transcript of New Hampshire Statewide Forest Resources Assessment – 2010 · The New Hampshire Statewide Forest...

New Hampshire Statewide Forest Resources Assessment – 2010 Important Data and Information about New Hampshire’s Forests
New Hampshire Department of Resources and Economic Development Division of Forests and Lands

The New Hampshire Statewide Forest Resources Assessment – 2010 is an update of:
New Hampshire Forest Resources Plan Revision Assessment Report 2006
Charles A. Levesque Innovative Natural Rsources Solutions, LLC
Acknowledgements
A report such as this requires many sources and many people to review those sources in order to assure the results are cohesive and useful to interested parties. Many people assisted with the development of this report:
Constance Carpenter Sherri Wormstead Susan Francher Matt Tansey Philip Bryce NH Forest Advisory Board Data sub-group of the NH Forest Advisory Board
Numerous individuals at organizations and agencies providing data
Funding for this project was provided by the USDA Forest Service, State & Private Forestry.
New Hampshire Division of Forests and Lands is an equal opportunity employer.

CONTENTS Page
Introduction 1
Criterion 1: Conservation of Biological Diversity 2 1. Area of total land, forest land, and reserved forest land 2. Forest type, size class, and age class 3. Extent of forest land conversion, fragmentation, and parcelization 4. Status of forest/woodland communities and associated species of concern
Criterion 2: Maintenance of Productive Capacity of Forest Ecosystems 16 . 5. Area of timberland
6. Annual removal of merchantable wood volume compared to net growth Criterion 3: Maintenance of Forest Ecosystem Health and Vitality 21
7. Area of forest land affected by potentially damaging agents Criterion 4: Conservation and Maintenance of Soil and Water Resources 24
8. Soil quality on forest land 9. Area of forest land adjacent to surface water, and forest land by watershed 10. Water Quality in Forested Areas
Criterion 5: Maintenance of Forest Contribution to Global Carbon Cycles 30 11. Forest ecosystem biomass and forest carbon pools
Criterion 6: Maintenance and Enhancement of Long-term Multiple 32 Socio-economic Benefits to Meet the Needs of Societies
12. Wood and wood products production, consumption, and trade 13. Outdoor recreational facilities and activities 14. Investments in forest health, management, research, and wood processing 15. Forest ownership, land use, and specially designated areas 16. Employment and wages in forest-related sectors
Criterion 7: Legal, Institutional, and Economic Framework for Forest 43 Conservation and Sustainable Management
17. Forest management standards/guidelines 18. Forest-related planning, assessment, policy, and law
Priority Forest Landscapes 46 Multi-state Priority Areas 51 Bibliography 53


New Hampshire Forest Resources Plan Revision 1 Assessment Report – 2006; Updated 2010
New Hampshire Statewide Forest Resources Assessment – 2010
Introduction
In 1996, New Hampshire’s Forest Resources Plan was adopted after over a year of work by the Forest Resources Plan Steering Committee and the NH Division of Forests and Lands. By law, this Plan must be revised every ten years. This Assessment Report is essentially a background paper designed to provide the best information available about the status of New Hampshire’s forests to facilitate a revision to the Plan with input from many stake holder groups. With assistance from the USDA Forest Service, the Division of Forests and Lands has decided to use the framework of the Montreal Process Criteria and Indicators as the basis for the Assessment report.
The Criteria and Indicators used for this assessment are a series of 7 Criteria and 18 Indicators and associated data sources that the USDA Forest Service, Northeastern Area (NA) and the 20 State forestry agencies in the Northeastern Area Association of State Foresters (NAASF) developed for use in ongoing monitoring efforts in this region. In this way, subsequent use of the framework will yield comparable results within districts (geographic areas like the State of New Hampshire) or among districts. The report is structured directly around these 7 Criterion and 18 Indicators.
Much has changed in the years since the 1996 Forest Resources Plan was adopted. This report is designed to focus on the major changes and trends affecting the forests of New Hampshire.
The completion of this Assessment has been guided by a data sub-group of the NH Forest Advisory Board with input from the full Forest Advisory Board, staff at the Division of Forests and Lands and many stakeholder groups.

New Hampshire Forest Resources Plan Revision 2 Assessment Report – 2006; Updated 2010
CRITERION 1:
Conservation of Biological Diversity
1. Area of total land, forest land, and reserved forest land
New Hampshire’s forests are changing rapidly. Still considered the 2nd most forested state in the U.S. behind Maine at 84% forested, the Granite State continues to lose forestland each year to other land use—chiefly development. Of New Hampshire’s 5,712,968 acres of land, since 1997 NH has lost 148,000 acres of forest to other land uses. We are projected to lose another 288,000 acres between now and 2025 — another 5% of our forests (USDA Forest Service, USDA NRCS and SPNHF). Figure 1 shows the early decline of forested acreage in NH from settlement to the late 1800s followed by a steady increase until 1987 when loss to development began outpacing the reversion of farmland to forests.
Figure 1 Forestland Area of NH
0 1,000,000 2,000,000 3,000,000 4,000,000 5,000,000 6,000,000
1630
1907
1938
1953
1963
1977
1987
1997
2002
2004
2025 (Projected)
Year
Acres
Source: USDA Forest Service, Forest Inventory and Analysis & SPNHF, NH’s Changing Forest Landscape
Table 1 shows that the most significant projected loss of forestland will be in Hillsborough and Rockingham Counties.
Table 1—Projected Forest loss 20012025 (rounded to whole %)
Belknap 3% Carroll 2% Cheshire 2% Coos 0% Grafton 1% Hillsborough 4% Merrimack 3% Rockingham 4% Strafford 3% Sullivan 2%
Source: SPNHF, NH’s Changing Landscape and GRANIT

New Hampshire Forest Resources Plan Revision 3 Assessment Report – 2006; Updated 2010
Acres of Forestland in NH per person
0.0 2.0 4.0 6.0 8.0
10.0
1953
1963
1977
1987
1997
2002
2004
2025 (Projected)
yea r
#acres per perso
n
200,000
400,000
600,000
800,000
1,000,000
1,200,000
acres
Belknap
Carroll
Cheshire
Coos
Grafton
Hillsborough
Merr im
ack
Rockingham
Strafford
Sullivan
County
Protected lands in NH
4 Public land that can be developed 3a Permanent public ownership, some restric tions 3 Public and private conservation group fee 2 Unofficial conservation land
1 Permanent conservation land Unprotected
New Hampshire’s forests are most dense in Coos, Grafton and Carroll counties. As forest density statewide has declined statewide, population has increased. Figure 2 shows that in 1953 NH had nearly 9 acres of forest for every person. Today that figure has dropped to under 4 acres of forest for every person.
Figure 2
Source: USDA Forest Service, Forest Inventory and Analysis, SPNHF, NH’s Changing Landscape, US Census
Permanently conserved land has increased from 1.2 million acres in 1998 to over 1.63 million acres in 2010(GRANIT Consland Data Layer level 1). Included in that increase is the 171,000 acre Connecticut Lakes tract in northern NH, conserved in 2002. Figure 3 shows conserved land in NH on a continuum based on protected status. This shows that most of the conserved land is still north of the lakes region (beginning with the White Mountain National Forests 760,000 acres). Most of the state’s population is south of this.
Figure 3
Source: NH TNC and GRANIT

New Hampshire Forest Resources Plan Revision 4 Assessment Report – 2006; Updated 2010
Figure 4 shows where conserved land is – providing more evidence that protected acres are not where NH’s population lives.
New Hampshire Forest Resources Plan Revision 5 Assessment Report – 2006; Updated 2010
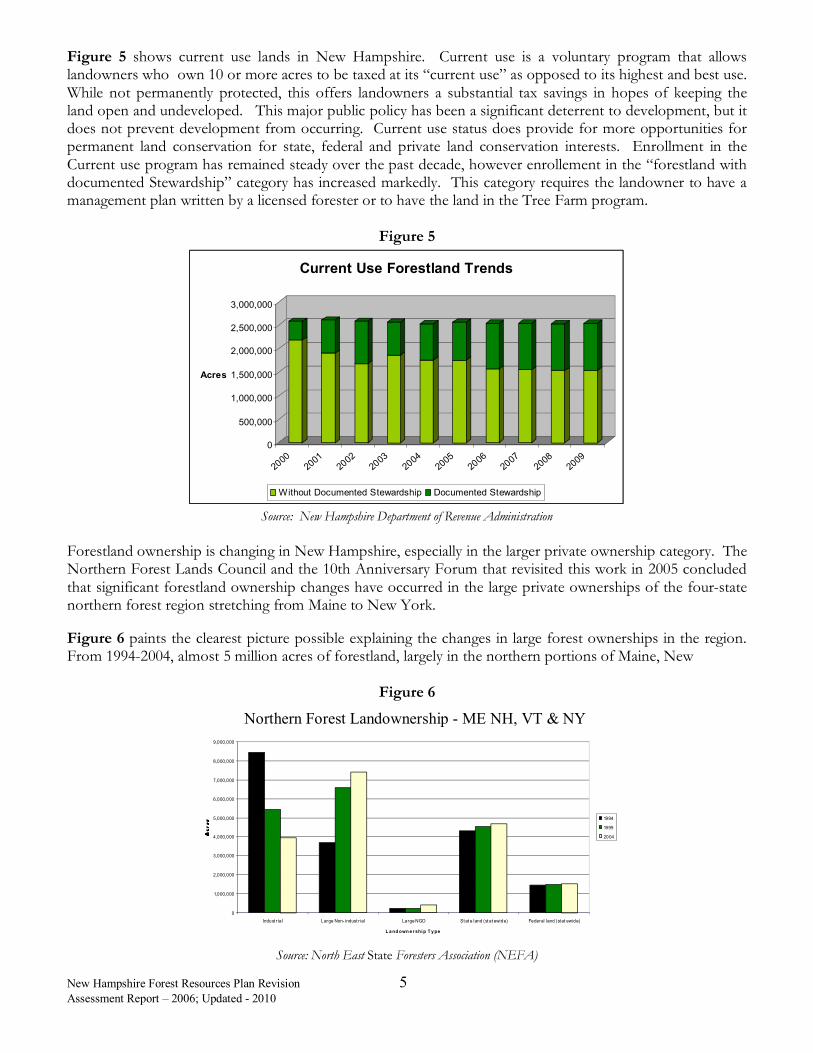
Figure 5 shows current use lands in New Hampshire. Current use is a voluntary program that allows landowners who own 10 or more acres to be taxed at its “current use” as opposed to its highest and best use. While not permanently protected, this offers landowners a substantial tax savings in hopes of keeping the land open and undeveloped. This major public policy has been a significant deterrent to development, but it does not prevent development from occurring. Current use status does provide for more opportunities for permanent land conservation for state, federal and private land conservation interests. Enrollment in the Current use program has remained steady over the past decade, however enrollement in the “forestland with documented Stewardship” category has increased markedly. This category requires the landowner to have a management plan written by a licensed forester or to have the land in the Tree Farm program.
Figure 5
0
500,000
1,000,000
1,500,000
2,000,000
2,500,000
3,000,000
Acres
2000
2001
2002
2003
2004
2005
2006
2007
2008
2009
Current Use Forestland Trends
Without Documented Stewardship Documented Stewardship
Source: New Hampshire Department of Revenue Administration
Forestland ownership is changing in New Hampshire, especially in the larger private ownership category. The Northern Forest Lands Council and the 10th Anniversary Forum that revisited this work in 2005 concluded that significant forestland ownership changes have occurred in the large private ownerships of the four-state northern forest region stretching from Maine to New York.
Figure 6 paints the clearest picture possible explaining the changes in large forest ownerships in the region. From 1994-2004, almost 5 million acres of forestland, largely in the northern portions of Maine, New
Figure 6 Northern Forest Landownership ME, NH, VT & NY
0
1,000,000
2,000,000
3,000,000
4,000,000
5,000,000
6,000,000
7,000,000
8,000,000
9,000,000
Indust r ial Large Non indust r ial Large NGO St at e land (st at ewide) Federal land (st at ewide)
L andowne r ship T ype
1994
1999
2004
Source: North East State Foresters Association (NEFA)
Northern Forest Landownership ME NH, VT & NY

New Hampshire Forest Resources Plan Revision 6 Assessment Report – 2006; Updated 2010
Hampshire, Vermont and New York, went from industrial forest ownerships– i.e. those ownerships connected to forest products manufacturing – to Timberland Investment Management Organizations (TIMO). TIMOs use investor funds to purchase these forestland assets and manage the lands for a period of time, typically 7-10 years, before re-selling the lands. The return on the investment is chiefly made through appreciated land values, timber management, selling of high value development parcels and sometimes conservation-related transactions (such as sale of a conservation easement).
New Hampshire’s portion of the TIMO trend is significant. No large industrial timberland remains in the state. The largest remaining industrial ownerships — the Connecticut Lakes 170,000 ownership formerly owned by International Paper and Champion International previously in the Pittsburg area and the over 120,000 Mead Westvaco ownership in the Androscoggin River valley — both went to TIMOs in the early 2000’s. Some fragmentation and change in ownership to public land resulted from many of the industrial to TIMO changeovers.
Figure 6 also suggests very minor additions to federal and state ownerships in the 10-year period ending in 2004.
Figure 7
Source: National Woodland Owners Survey, USDA Forest Service
While the large private ownerships changed type, smaller ownerships, especially south of the lakes region, got even smaller. From 1993 and 2003, parcel size in New Hampshire has been reduced. In the 500-999 acre size-class, the data suggests a 50% drop in acreage. In the 1-9 acre category, a 7% increase was seen. Figure 7 shows the current number and acreage of private land holdings. These kinds of changes in the smaller size classes are not readily visible but the “nibbling” effect of size-class changes in the smaller landownership classes can be quite serious — especially in the loss of the 500 acre+ size classes since they provide for such a wide-range of public and private benefits.
Approximatly 49%, or 2.36 million acres, of forestland are owned by 124,000 family forest owners in New Hampshire. Most interestingly, only 4% of family forstland owners are under 45 years of age, 45% are between 45 and 64 and, 51% of owners are 65 or older. This demographic data implys a large percentage of forest land may be sold or past down to heirs in the near future, increasing the chances of parcilization.
Size of Forest Holding
0%
10%
20%
30%
40%
50%
60%
70%
19 1019 2049 5099 100199 200499 500999 1,000 4,999
5,000+
Acres Number

New Hampshire Forest Resources Plan Revision 7 Assessment Report – 2006; Updated 2010
Forest type and size class
In acreage terms, New Hampshire’s forests are dominated by northern hardwood. Figure 8 shows that approximately 2,500,000 acres are found in this category. The next largest forest type category is white pine, followed by oak/hickory and spruce fir. Many of the changes in forest acreage from 1983 to 2008 have been minor however, Spruce and fir forests are on the decline. The aspen/birch type lost of about 50% during the period between 1983 and 1997 but rebounded slightly by 2008, as did northern hardwoods.
Figure 8
Area of Timberland by Species Group
0
500,000
1,000,000
1,500,000
2,000,000
2,500,000
3,000,000
White & red pine
Spruce & Fir
Pitch Pine
Oak / pine
Oak / hickory
Elm / ash / red maple
Northern Hardwood
Aspen / birch group
acres 1983
1997
2008
Source: USDA Forest Service, Forest Inventory & Analysis
Figure 9
0%
20%
40%
60%
80%
100%
120%
Forestland
Area
Belknap
Carroll
Cheshire
Coos
Grafton
Hillsborough
Merrim
ack
Rockingham
Strafford
Sullivan
2008 Forestland Size Classes
Large Diameter (>9 in) Medium Diameter (59 in) Small Diameter (<5 in) Nonstocked
Source: USDA Forest Service, Forest Inventory & Analysis
Size and age classes of most of New Hampshire’s forest are increasing. Figure 8, however, shows that Coos and Grafton Counties both have less than 40% of their forest cover in larger diameter forest

New Hampshire Forest Resources Plan Revision 8 Assessment Report – 2006; Updated 2010
200,000
0
200,000
400,000
Acres
Int o Cropland & Pasture
Addit ions t o Federal Forest
Reduct ion f rom Nonf ederal
f orest
Addit ions t o Urban &
Transport at ion
Forestland Changes in NH 19821997 Note: Developed land in NH changed from 379,000 acres in 1982 to 621,413 in 2003.
stands (larger than 9 inches in diameter). Figure 9 shows that statewide, New Hampshire’s forests are getting older and larger.
2. Extent of forest land conversion, fragmentation, and parcelization
Understanding specifically the historical changes in land use should be helpful in deciding priorities for the future. Figure 10 shows that most of the reduction in forestland acreage from 1983-1997 resulted from urbanization or development of forest with structures and pavement.
Figure 10 One can expect similar changes to the present and into the future with 4% losses in forestland projected from the present until 2025 in Rockingham and Hillsborough counties. Interestingly, some land is still reverting from forest to farm pasture and cropland — though only a small amount.
Source: Natural Resource Conservation Service and SPNHF
Statewide, it is expected that over 115,000 additional acres of forestland will be lost to development by 2025 (Figure 11). Figure 12 shows a key wildlife habitat result of this fragmentation – the most populous and developed counties (Hillsboro, Rockingham and Strafford) have the fewest 500+ acre blocks of forestland, a key attribute for wide-ranging wildlife species such as moose and bear.
Figure 11
Loss of Forestland to Development in NH
0 20,000 40,000 60,000 80,000 100,000 120,000 140,000 160,000 180,000 200,000
19832003 20042025
ac
Source: USDA Forest Service FIA & SPNHF, NH’s Changing Landscape for the projection
Figure 12

New Hampshire Forest Resources Plan Revision 9 Assessment Report – 2006; Updated 2010
0.0% 10.0% 20.0% 30.0% 40.0% 50.0% 60.0% 70.0% 80.0% 90.0%
% of Cty in 500+ ac Forest blocks
Belknap
Carroll
Cheshire
Coos
Grafton
Hillsboro
Merrim
ack
Rockingham
Strafford
Sullivan
County NH Forest Blocks 500 acres+
Source: SPNHF, NH’s Changing Landscape
3. Status of forest/woodland communities and associated species of concern
Given the amount of development and fragmentation occurring across New Hampshire’s forested landscape, wildlife and plant species are at risk of population reduction or even extirpation in some cases. New Hampshire’s Wildlife Action Plan (WAP) is the definitive source to review for possible effects on the state’s wildlife communities. According to the WAP, fully twenty-six habitat types in New Hampshire are at risk and are in need of permanent conservation (habitats of conservation concern). Table 2 shows the list – which covers most of the state’s habitat types. This further reinforces what we know about the development paradigm we are experiencing: it is affecting all the land types in NH.
Table 2 New Hampshire’s habitats of greatest conservation need based on wildlife species.
Watershed Groupings Medium and Small Scale Habitats Connecticut River Mainstem Watershed Alpine Southern Upland Watersheds Grassland Northern Upland Watersheds Shrublands Montane Watersheds Caves and Mines Coastal Transitional Watersheds Cliffs NonTidal Coastal Watersheds Coastal Islands Tidal Coastal Watersheds Dunes
Floodplain Forests Matrix Forest Types Marsh and Wet Meadows Appalachian OakPine Forests Shrub Wetlands HighElevation SpruceFir Forest Peatlands Lowland SpruceFir Forest Pine Barrens Northern HardwoodConifer Forest Rocky Ridges and Talus Slopes HemlockHardwood Pine Forest
Source: NH Wildlife Action Plan

New Hampshire Forest Resources Plan Revision 10 Assessment Report – 2006; Updated 2010
The 26 habitats of conservation concern include five large-scale matrix forest types: Appalachian oak-pine, hemlock-hardwood-pine, northern hardwood-conifer, lowland spruce-fir, and high-elevation spruce-fir. Two small-scale forest types are also included: pitch pine and floodplain forest.
The WAP also identifies 124 wildlife species of conservation concern in New Hampshire. Of these, 47 species (38%) are associated with matrix forests (Table 3). One species is federally endangered, one is federally threatened, seven are state endangered, and 10 are state threatened. Canada lynx bridges two of these categories and is classified as federally threatened and state endangered. By taxa, forest related species of conservation concern include five amphibians, eight reptiles, 23 birds, and 11 mammals. A more comprehensive list of wildlife of concern (includes all endangered and threatened and other species of concern) can be found in the Appendix.
If species associated with pitch pine and floodplain forest were included, the list of species would increase by twelve for a total of 60 species (48%) associated with forests. Eleven of the twelve additional species are rare insects associated only with pitch pine forests in New Hampshire.
Three matrix forest types (Appalachian oak-pine, hemlock-hardwood-pine, and lowland spruce-fir) along with pitch pine forest are among the most at-risk habitats in the state. The three matrix forest types together comprise 72% of New Hampshire’s land area. As can be expected, risk intensity varies considerably within this extensive area.
Risk to Appalachian oak-pine and hemlock-hardwood-pine forest is highest in the southern part of the state where development pressures are the highest. Lowland spruce-fir occurs primarily in the northern part of the state. Historical harvesting practices in some areas of northern New Hampshire have resulted in conversion of former spruce-fir sites to northern hardwood-conifer forest. A comparison of lowland spruce-fir data developed for the WAP and current spruce-fir cover as depicted by the 2001 New Hampshire Landcover Assessment from the GRANIT Geographic Information System source indicates that there is 45% less spruce-fir forest than what could occur naturally.
Table 3
Wildlife species of conservation concern associated with matrix forest types in New Hampshire. E = NH endangered (List revised 2008), T = NH Threatened (List revised 2008), SC = NH special concern (List revised 2009). RC = Regional Conservation Concern (2009), FE = Federally endangered (2008), FT = Federally threatened (2008)
Amphibians Jefferson salamander SC, RC Bluespotted salamander SC, RC Fowler’s toad SC Northern Leopard frog SC, RC Marbled salamander E
Reptiles Timber rattlesnake E Blandings turtle E Eastern hognose snake E Spotted turtle T Black Racer T Wood Turtle SC, RC Eastern box turtle SC, RC Smooth green snake SC
Birds Common nighthawk E Bald Eagle T Sedge wren E Common loon T American threetoed
Woodpecker T Grasshopper sparrow T Piedbilled grebe T Bald eagle T Peregrine falcon T Rusty blackbird SC
Birds (cont’d) Spruce grouse SC Osprey SC American kestrel SC Sora SC Common moorhen SC Whippoorwill SC, RC Olivesided flycatcher SC Horned lark SC Purple martin SC Bicknell’s thrush SC, RC American pilpit SC Goldenwinged warbler SC, RC Cerulean warbler SC , RC
Mammals Canada lynx E, FT Smallfooted bat E Gray wolf FE New England cottontail E American marten T Eastern red bat SC, RC Hoary bat SC, RC Silverhaired bat SC, RC
Northern longear bat SC Tricolored bat SC Northern bog lemming SC, RC

New Hampshire Forest Resources Plan Revision 11 Assessment Report – 2006; Updated 2010
Development and fire suppression are considered the biggest risks to pitch pine habitats. New Hampshire had at one time supported intact pitch pine barrens, along the Merrimack River from Concord to Nashua and in the towns of Ossipee, Freedom, Tamworth, Madison, and Effingham. Increased development and urban sprawl throughout the state drastically reduced the extent of these communities. Both the Nashua and Manchester pine barrens have been entirely altered, while about 560 acres of the historic Concord Pine Barrens and 43% of the Ossipee pine barrens remain today.
An interesting breakdown of permanently protected acreage by elevation developed by the NH Chapter of The Nature Conservancy shows that most of the protected acreage in the state is at higher elevations (Figure 13) while, over 70% of the protected acreage is north of the lakes region. This shows that the current permanently conserved acreage in New Hampshire is uneven at best.
Figure 13
Source: NH Chapter The Nature Conservancy
New Hampshire is a diverse environment with a multitude of plant and animal species. To this end the Natural Heritage Bureau has developed a scientific approach to classifying these recurring assemblages of plants and animals. The bureau has described 193 natural communities; which are based on plant species composition, physical structure (like a forest or grassland) and a set of physical conditions (like local climate or water availability). The Bureau’s primary mission is to collect and analyze data on the status, location, and distribution of rare or declining plant species and exemplary natural communities. Additionally, they develop and implement measures for the management of native plants.
Currently, New Hampshire has 397 taxa listed as endangered and threatened under the Native Plant Protection Act 1 .
1 The Native Plant Protection Act (RSA 217-A) purpose recognizes that "for human needs and enjoyment, the interests of science, and the economy of the state, native plants throughout this state should be protected and conserved; and . . . their numbers should
99% % Public & Conservation Land by elevation in NH
91%
66%
22%
12%
23%
2,500 – 4,000’
>4,000’
1,700 – 2,500’
800 – 1,700’
20 800’

New Hampshire Forest Resources Plan Revision 12 Assessment Report – 2006; Updated 2010
Many federal, state, and local agencies that issue permits or provide grants require that applicants contact the NH Natural Heritage Bureau to check for potential impacts to known occurrences of rare species or exemplary natural communities. To facilitate the process of requesting a review, an online "DataCheck Tool" was developed in 2007. The first year the tool was available more than 1,400 reviews were generated, 2,661 were completed in 2009.
The regional study, Patterns in Biogeographic Dynamics and Decline of 71 Rare Plant Species in New England: Evidence from Historical Collections and Contemporary Monitoring, discusses the importance and complexity of analyzing species occurrence data. An excerpt from the abstract of this research paper best describes the information:
“Detecting range shifts and contractions is critical for determining the conservation priority of rare and declining taxa. However, data on rare species occurrences frequently lack precise information on locations and habitats, and may present a biased picture of biogeographic distributions and presumed habitat preferences…” “Using data from herbaria and Natural Heritage Programs on numbers of occurrences within individual municipalities (towns, cities, or townships), we quantified temporal changes in the estimated distributions of 110 rare plant species in the six New England states…” “we eliminated taxa with high probabilities of pseudo- absence (that would yield an inaccurate profile of species distributions), narrowing the set for final analysis to 71 taxa. We then expressed occurrences as centroids of town polygons and estimated current and historical range areas (extents of occurrence as defined by á-hulls inscribing occurrences), mean distances between occurrences and latitudinal and longitudinal range boundaries. Using a geographic information system, we modeled first, second, and third circular standard deviational polygons around the mean center of the historical range. Examining the distribution of current occurrences within each standard deviational polygon, we asked whether ranges were collapsing to a center, expanding, fragmenting, or contracting to a margin of the former range. Extant ranges of the species were on average almost 67% smaller than their historical ranges and distances among occurrences decreased. Five New England hotspots were observed to contain over 35% of rare plant populations. Extant occurrences were more frequently marginalized at the periphery of the historical range than would be expected by chance. Coarse-grained data on current and historical occurrences can be used to examine large suites of species to prioritize taxa and sites for conservation.”
Resulting maps from this project are very instructive. Figures 14 and 15 show distribution of 71 rare plant species in New Hampshire and surrounding New England states with the extent of the loss in the latter coming from comparisons of historic distribution records with current records.
be maintained and enhanced to insure their perpetuation as viable components of their ecosystems for the benefit of the people of New Hampshire."

New Hampshire Forest Resources Plan Revision 13 Assessment Report – 2006; Updated 2010
Figure 14 Distribution of 71 species of existing rare plants in New England
Source: PATTERNS IN BIOGEOGRAPHIC DYNAMICS AND DECLINE OF 71 RARE PLANT SPECIES IN NEW ENGLAND: EVIDENCE FROM HISTORICAL COLLECTIONS AND CONTEMPORARY MONITORING, Harvard Forest

New Hampshire Forest Resources Plan Revision 14 Assessment Report – 2006; Updated 2010
Figure 15 Comparing historic and current distributions in New England (same 71 species)
Darker areas indicate areas with high populations losses
As expected, more loss of rare plant species distribution is found in southern NH south of the White Mountain National Forest. Perhaps a more important body of data is found in Figure 15 but in Connecticut, Rhode Island and Massachusetts where much more significant loss of species distribution was found. This may be a premonition for the future in New Hampshire if habitat is not conserved.
Source: PATTERNS IN BIOGEOGRAPHIC DYNAMICS AND DECLINE OF 71 RARE PLANT SPECIES IN NEW ENGLAND: EVIDENCE FROM HISTORICAL COLLECTIONS AND CONTEMPORARY MONITORING, Harvard Forest
New Hampshire Forest Resources Plan Revision 15 Assessment Report – 2006; Updated 2010
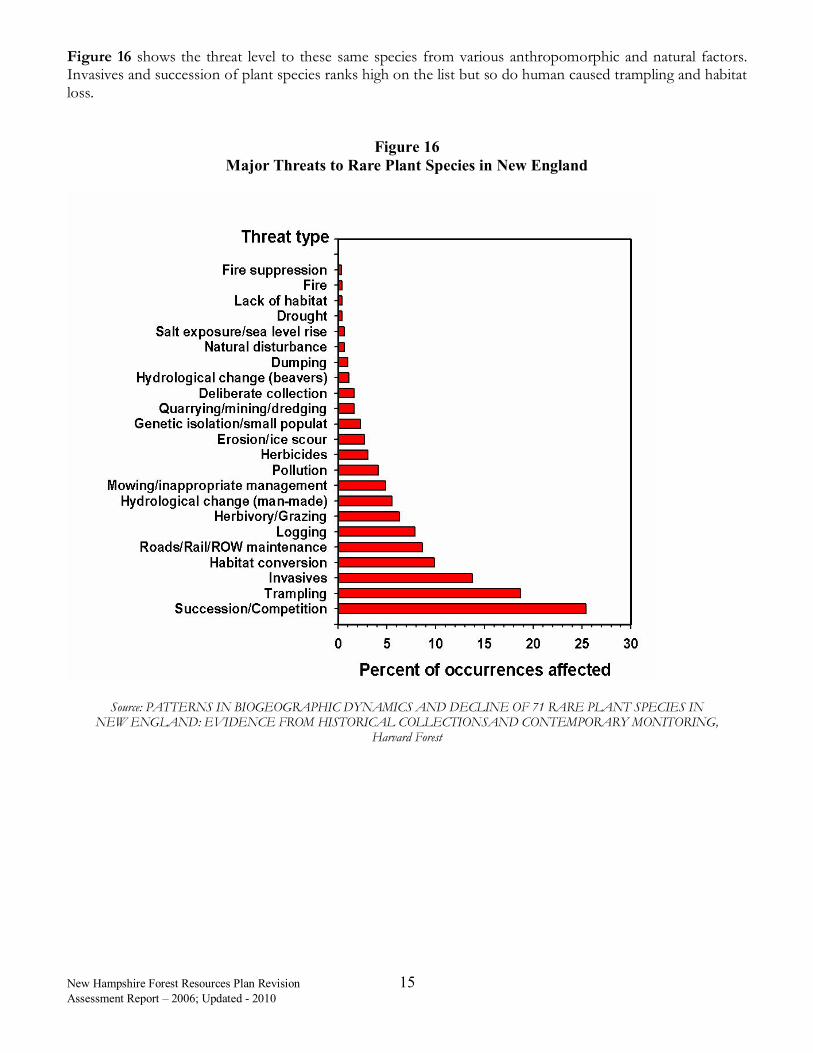
Figure 16 shows the threat level to these same species from various anthropomorphic and natural factors. Invasives and succession of plant species ranks high on the list but so do human caused trampling and habitat loss.
Figure 16 Major Threats to Rare Plant Species in New England
Source: PATTERNS IN BIOGEOGRAPHIC DYNAMICS AND DECLINE OF 71 RARE PLANT SPECIES IN NEW ENGLAND: EVIDENCE FROM HISTORICAL COLLECTIONSAND CONTEMPORARY MONITORING,
Harvard Forest

New Hampshire Forest Resources Plan Revision 16 Assessment Report – 2006; Updated 2010
CRITERION 2:
Maintenance of Productive Capacity of Forest Ecosystems
4. Area of timberland
As with all forestland, timberland acreage has declined in the last 50 years in New Hampshire. Timberland is forestland capable of producing 20 cubic feet of wood/acre/year 2 . Figure 17 shows that we have lost over 300,000 acres to non-timberland uses since 1953 – from 4,875,000 acres statewide to 4,575,000 acres. Some of the oscillation in the timberland numbers are due to sampling techniques and the fact that the definition of timberland has changed since the earlier inventories.
Figure 17 NH Timberland Acreage
4,400
4,500
4,600
4,700
4,800
4,900
5,000
5,100
Thou
sand
Acres
1948 1960 1973 1983 1997 2008
Change in Forestland and Timberland
Timberland All forest land
Source: FIA Timberland = forest capable of producing 20 cubic feet of wood/acre/year
5. Annual removal of merchantable wood volume compared to net growth
While timber is only one area of economic output associated with forests in New Hampshire, it is the most significant. Details of the economic value of the forest-related industries can be found later in this report. Given this, understanding the state of timber volumes and growth and harvest levels is critical to understanding the current state of New Hampshire’s forests. Figure 18 shows annual harvest levels by softwood and hardwood and then by product class in Figure 19. Softwood and hardwood harvests are roughly equal but lower quality wood is the majority of the timber harvested.
2 USDA Forest Service, Forest Inventory and Analysis

New Hampshire Forest Resources Plan Revision 17 Assessment Report – 2006; Updated 2010
Figure 18
0
200,000
400,000
600,000
800,000
1,000,000
1,200,000
1,400,000
1,600,000
Cords
2000 2001 2002 2003 2004 2005 2006
NH Timber Harvest from Report of Cut
Softwood Hardwood
Source: NH Division of Forests & Lands
Figure 19
0
200,000
400,000
600,000
800,000
1,000,000
1,200,000
1,400,000
1,600,000
Cords
2000 2001 2002 2003 2004 2005 2006
Timber Harvest by Product Type
Sawtimber Lowgrade
Source: NH Division of Forests & Lands

New Hampshire Forest Resources Plan Revision 18 Assessment Report – 2006; Updated 2010
Growing Stock Volume of Commercial Species
0
500
1,000
1,500
2,000
2,500
White & red pine
Spruce & fir
Eastern hemlock
Northern red oak
Yellow birch
Sugar maple
Red maple
Ash
MM Cub
ic Fee
t
1983
1997
2008
Figure 20 shows in gross that, harvest levels are less than net growth. This suggests that overall timber volumes are increasing though the loss of forestland to development more than likely negates this increase in terms of availability. More revealing, however, is a closer look at growth and removals at the sub- state level. Figure 21 looks at the growth to removal ratios for selected species. This figure suggests that removals of balsam fir and spruce may be in excess of growth. Continued harvesting at levels over net growth will result in a reduction in the timber inventory for these species. More analysis at sub-state levels might reveal more useful information.
Growth of timber volumes can be better viewed in standing volume data. Figure 22 shows standing timber volume data for the years 1983, 1997 & 2008. The trends suggest that increased volumes in hardwood and most softwood species for the period. This further confirms that, in gross, NH timber harvesters are cutting less than growth in both softwood and hardwood as we have generally increasing inventories of timber over this 20 year time period. Additionally, sawtimber size class is increasing in
both hardwood and softwood from 1983 to 2008.
Taken together, these data show clearly that we have increasing inventories of standing timber in New Hampshire and that, statewide, we are harvesting less each year than the growth from our forest. This is not to say that imbalances in growth to harvest levels do not exist in smaller geographic regions or in species, because the data suggests they may.
Further, these data do not confirm availability of standing timber for harvest, another topic entirely and for which no reliable new data exists. Some availability work was done for New Hampshire in 1995 as part of an update to the FIA data called
Sawtimber Volumes of Commercial Species
0
2,000
4,000
6,000
8,000
10,000
White & red pine
Spruce & fir
Eastern hemlock
Northern red oak
Yellow birch
Sugar maple
Red m
aple
Ash
MMBF 1983
1997
2008
2008 Growth and Removals of Growing Stock on Timberland
.
5.
10.
15.
20.
25.
30.
35.
40.
45.
White & red pine
Spruce & f ir
Northern red oak
Eastern hemlock
Yellow birch
Hard maple Soft maple
Millions
of C
UFT
per Year
Grow th Removals
Figure 20 (Source FIA)
Figure 21 (Source FIA)
Figure 22 (Source FIA)

New Hampshire Forest Resources Plan Revision 19 Assessment Report – 2006; Updated 2010
the New Hampshire Forest Inventory Project (NHFIP). This study sought to understand how much land is unavailable for timber harvesting at any given moment in time due to the myriad of regulatory and landowner attitude constraints. An excerpt from the executive summary of the project states:
• “701,000 acres of forest land in the North Unit [Coos, Grafton & Carroll Counties] and 227,028 acres of forest land in the South Unit [southern 7 counties] are not available for timber harvest due to non-landowner attitudinal harvest constraints 3 . Landowner attitudinal harvest constraints represent 2,529,844 acres statewide. Total acres not available statewide then are 3,457,872 acres of forest land. This is 75% of the forest land in New Hampshire . This leaves 1,147,891 acres available for harvesting.
• The acres not available for harvest represent 5.701 billion cubic feet or 10.896 billion board feet of standing timber volume statewide. The non-landowner attitudinal acres represent 1.200 billion cubic feet or 2.670 billion board feet of timber in the North Unit and 243.288 million cubic feet or 717.104 million board feet of timber in the South Unit.
• The non-landowner attitude constraints represent 29 % of the forest land in the North Unit and 11 % of the forest land in the South Unit. The landowner attitudinal constraints alone represent 55% of New Hampshire’s forest land (not available for harvest).
• The volume figures above represent all of the merchantable timber on the constrained acres -- using a figure of approximately 10 cords per acre (an average harvest volume) -- the volume of harvestable timber affected is 35.08 million cords.” 4
While produced in 1995 with the expressed disclaimer that this data was a snapshot in time not intended for use in other timeframes, this analysis, nevertheless, gives an idea that the timber availability issue is of a sufficient magnitude to warrant extreme caution in reviewing timber volumes for New Hampshire.
3 these are regulation and physical constraints 4 N.H. Forest Inventory Project - Timber Availability Analysis 1995

New Hampshire Forest Resources Plan Revision 20 Assessment Report – 2006; Updated 2010
One final note of importance regarding timber availability is the issue of terminal harvests – those timber harvests that occur prior to conversion of land to a developed use. A 2001 study from the Society for the Protection of NH Forests entitled NH’s Vanishing Forests, looked at, among other issues related to the title, terminal harvests. Figure 23 from that report shows that nearly 30% of timber harvest acres in Rockingham and Strafford Counties were terminal harvests while the state average is approximately 7%. Hillsborough County terminal harvests are similar to those in Rockingham and Strafford Counties.
Figure 23
0%
5%
10%
15%
20%
25%
30%
35%
% of all acres harvested
Rockingham and Strafford Counties NH statewide
NH Terminal Harvest Acres
Source: SPNHF NH’s Vanishing Forests, 2001
New Hampshire Forest Resources Plan Revision 21 Assessment Report – 2006; Updated 2010
CRITERION 3: Maintenance of Forest Ecosystem Health and Vitality
6. Area of forest land affected by potentially damaging agents
Damage to our forests can come in the form of insect pests, invasive plants, ice storms or wildfire. In some instances this is a normal part of nature and considered an agent of change. However, at larger scales these forces can negatively impact the suite of goods and services we rely on from our forests. As an example a wind storm might blow down a mature crop of white pine causing a financial loss to the landowner. Or perhaps, a hemlock stand that is prime deer habitat is destroyed by hemlock wooly adelgid. To this end the Division of Forests and Lands monitors the State’s forest annually in an effort to detect these problems in the early phases.
While not considered significant compared to other stressors, it is important to understand the extent to which wildfire affects the forested landscape in New Hampshire. Wildfires affect between 100 and 1000 acres annually over the last 20 years. Some peak years in the mid-1990s appear to be spike years. Given the climate and forest cover, New Hampshire and the surrounding northeastern states are simply not going to be affected by wildfire like other regions of the country. The Forest Protection Bureau is working with local fire departments and communities to always be prepared. The division offers training programs and aids in the development of Community Wildfire Protection Plans. Ten New Hampshire communities have developed Community Wildfire Protection Plans
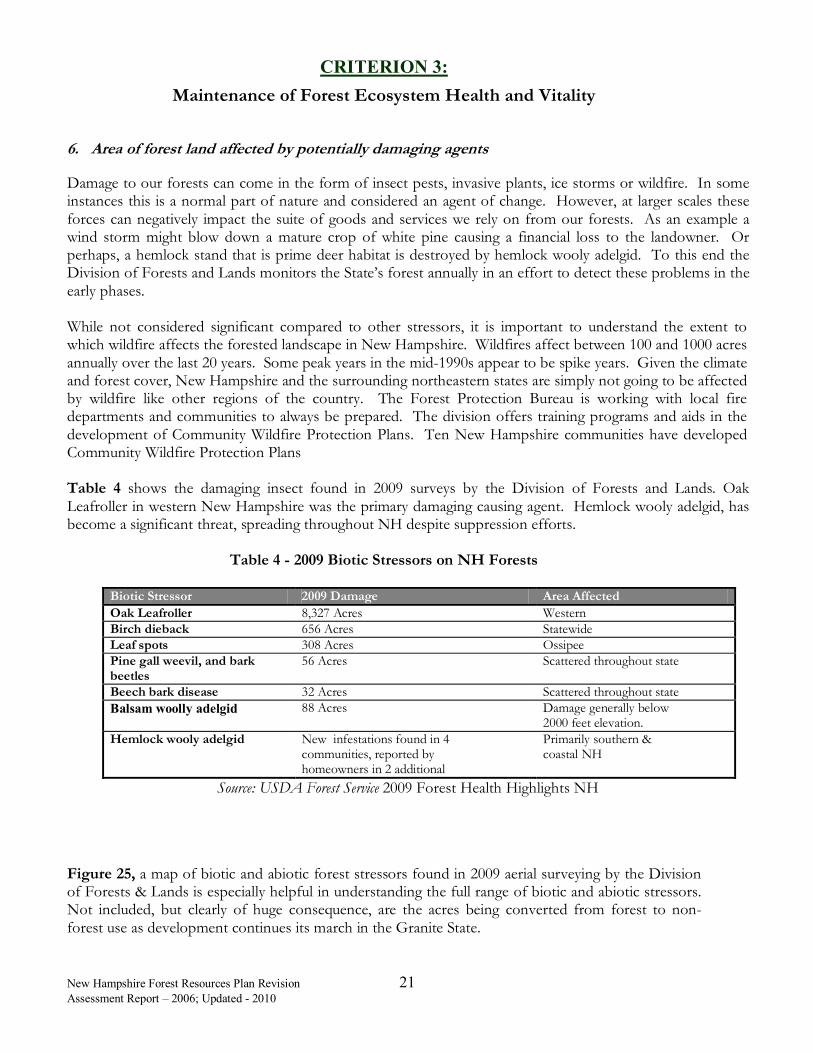
Table 4 shows the damaging insect found in 2009 surveys by the Division of Forests and Lands. Oak Leafroller in western New Hampshire was the primary damaging causing agent. Hemlock wooly adelgid, has become a significant threat, spreading throughout NH despite suppression efforts.
Table 4 - 2009 Biotic Stressors on NH Forests
Biotic Stressor 2009 Damage Area Affected Oak Leafroller 8,327 Acres Western Birch dieback 656 Acres Statewide Leaf spots 308 Acres Ossipee Pine gall weevil, and bark beetles
56 Acres Scattered throughout state
Beech bark disease 32 Acres Scattered throughout state Balsam woolly adelgid 88 Acres Damage generally below
2000 feet elevation. Hemlock wooly adelgid New infestations found in 4
communities, reported by homeowners in 2 additional
Primarily southern & coastal NH
Source: USDA Forest Service 2009 Forest Health Highlights NH
Figure 25, a map of biotic and abiotic forest stressors found in 2009 aerial surveying by the Division of Forests & Lands is especially helpful in understanding the full range of biotic and abiotic stressors. Not included, but clearly of huge consequence, are the acres being converted from forest to non- forest use as development continues its march in the Granite State.

New Hampshire Forest Resources Plan Revision 22 Assessment Report – 2006; Updated 2010
One of the biggest threats to the health of our forest is the introduction of non-native insects and diseases. In 1900, there were a handful of exotic insects and diseases in North America. Today, there are more than 500 exotic, invasive insects and diseases impacting forests of the United States.
The ecological, social and economic damage invasive exotics have already caused is extensive, and the potential for more lingers. With expanding world-wide trade and transport (50% of the toys sold in the U.S come from China) natural barriers like oceans, deserts, and trade winds are no longer restricting the movement of damaging insects and diseases. The global economy has given pests the opportunity to establish populations where there is little genetic resistance within host trees and no native biological controls. Examples from the past are the Chestnut Blight and Dutch Elm Disease. Each of these diseases has virtually eliminated respective host species as a major component of the eastern forest. Examples of exotic insects currently found in NH forests include Gypsy moth, Hemlock wooly adelgid(Figure 26), Balsam wooly adelgid, and Winter moth. Of these pests, Hemlock wooly adelgid is considered the most destructive. There are active outbreaks in several New Hampshire towns however, some isolated outbreaks have been eradicated. Unfortunately, there is no native means of control and large scale use of pesticides or other treatments are not a realistic defense.
Figure 26
The number of exotic invasive pests moving toward New Hampshire’s forest continues to grow. Pests at high risk of invading our forests include the Emerald ash borer, Asian long-horn beetle, Sudden Oak death, Oak wilt, the Asian gypsy moth, Browntail moth and most recently the Sirex woodwasp. These pests all share the common trait of being aggressive killers of tree species found in New Hampshire and there are no natural controls in our ecosystem. Specifically, the Asian long-horn beetle was discovered in Worchester, MA in 2008. Efforts to eradicate this pest have been extensive. All host trees in the area have been removed and chipped or chemically treated and landowners can request to have new trees planted. The cost of this specific outbreak is tens of millions of dollars however, the economic and environmental cost would be devastating if left unchecked.

New Hampshire Forest Resources Plan Revision 23 Assessment Report – 2006; Updated 2010
Figure 25

New Hampshire Forest Resources Plan Revision 24 Assessment Report – 2006; Updated 2010
CRITERION 4: Conservation and Maintenance of Soil and Water Resources
7. Soil quality on forest land
Forest soil quality data is not easy to come by on a statewide basis but there are some key metrics that help tell the story of New Hampshire’s forest soils for today and give us a sense of their potential for the future. The Appendix under this section contains some helpful baseline information relative to soil Ph, carbon and bulk density 5 . These data will be helpful in comparing future data when the next Forest Resources Plan is developed. A more useful set of data is from a recent report from the Conference of New England Governors and Eastern Canadian Premiers Forest Mapping Group in a December 2005 publication entitled: Assessment of Forest Sensitivity to Nitrogen and Sulfur Deposition in New Hampshire and Vermont. A series of maps tell an interesting story about New Hampshire’s soils and their vulnerability to change.
Figure 27 shows that certain areas of New Hampshire are particularly sensitive to nitrogen and sulfur deposition. The North Country and high elevation areas in particular are very sensitive given generally
Figure 27 Soils Sensitive to Sulfur and Nitrogen Deposition 2005 – 18% of NH is Sensitive
Source: Conference of New England Governors and Eastern Canadian Premiers Forest Mapping Group
5 All from USDA Forest Service Forest Inventory and Analysis
New Hampshire Forest Resources Plan Revision 25 Assessment Report – 2006; Updated 2010
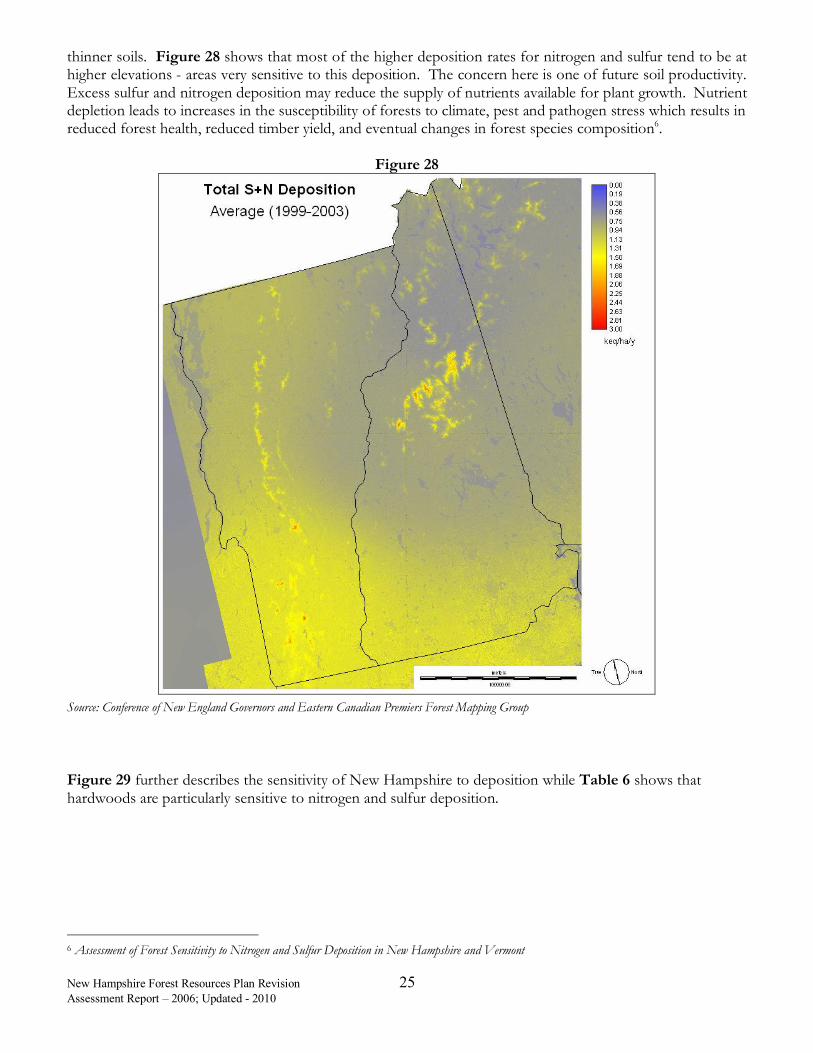
thinner soils. Figure 28 shows that most of the higher deposition rates for nitrogen and sulfur tend to be at higher elevations - areas very sensitive to this deposition. The concern here is one of future soil productivity. Excess sulfur and nitrogen deposition may reduce the supply of nutrients available for plant growth. Nutrient depletion leads to increases in the susceptibility of forests to climate, pest and pathogen stress which results in reduced forest health, reduced timber yield, and eventual changes in forest species composition 6 .
Figure 28
Source: Conference of New England Governors and Eastern Canadian Premiers Forest Mapping Group
Figure 29 further describes the sensitivity of New Hampshire to deposition while Table 6 shows that hardwoods are particularly sensitive to nitrogen and sulfur deposition.
6 Assessment of Forest Sensitivity to Nitrogen and Sulfur Deposition in New Hampshire and Vermont

New Hampshire Forest Resources Plan Revision 26 Assessment Report – 2006; Updated 2010
Table 5 Forest Sensitivity to Acid Deposition by Forest Type in NH
Source: Conference of New England Governors and Eastern Canadian Premiers Forest Mapping Group
Forest Type % of Forest Area
% Sensitive (of forest area)
Mixed Evergreen and Deciduous 20.1% 7.9% Northern Hardwoods 18.9% 2.1% Hemlock, Red Spruce, Balsam Fir 14.8% 10.4% Sugar Maple Northern Hardwoods 11.4% 39.8% Balsam Fir, Red Spruce, Northern Hardwoods 7.9% 26.6% Central Hardwoods 6.1% 49.6% Balsam Fir, Red Spruce 5.9% 27.4% White Pine, Hemlock, Central Hardwoods 3.3% 13.3% White Pine, Hemlock, Red Spruce 3.1% 13.3% Balsam Fir, Red Spruce, Birch 2.6% 18.0% White Pine, Central Hardwoods 2.1% 25.1% White Pine 2.0% 1.0% Birch, Northern Hardwoods 1.9% 50.4% All Forest 100.9% 17.6%
Figure 29 – The deposition index for atmospheric sulfur and nitrogen deposition to New Hampshire and Vermont (1999 – 2003) with respect to forest ecosystem critical loads. Positive values of the deposition index reflect the capacity of a forest ecosystem to tolerate additional acidic deposition. Negative values of the index correspond to the reduction in S & N deposition required to eliminate present or deter the development of nutrient limitations. Redorange yellow areas indicate current sulfur and nitrogen atmospheric deposition rates greater than the critical load. The deposition index is expressed in terms of kilo equivalents of charge per hectare per year. Nitrogen deposition includes both ammonium + nitrate forms. White areas are non forested land or water.

New Hampshire Forest Resources Plan Revision 27 Assessment Report – 2006; Updated 2010
8. Area of forest land adjacent to surface water, and forest land by watershed While increasingly New Hampshire’s riparian areas are under development pressure, understanding the land base associated with the immediate zone adjacent to rivers, lakes and great ponds in the state is helpful since degradation of these lands may have a particularly negative effect on riparian ecosystems. Figure 30 uses GIS data from Complex Systems at UNH to understand what kind of land is found within 30 meters of waterbodies. Surprisingly, this corridor is dominated by undeveloped uses. This is an important finding, but represents only one point in time. It will be especially helpful to run this kind of analysis in 10 years when the next forest plan is developed.
Figure 30 Riparian Landcover for NH - 2001
0.00 10,000.00 20,000.00 30,000.00 40,000.00 50,000.00 60,000.00 70,000.00
Residential, commercial, or industrial
Transportation
Row Crops
Hay/rotation/permanent pasture
Fruit orchards
Beech/oak
Paper birch/aspen
Other hardwoods
White/red pine
Spruce/fir
Hemlock
Pitch pine
Mixed forest
Alpine (Krumholz)
Open water Wetlands
Forested wetlands
Non-forested wetlands
Tidal wetlands
Disturbed
Bedrock/vegetated
Sand dunes
Cleared/other open
Tundra
acres
Complex Systems Research Center, University of New Hampshire. 2002. New Hampshire Land Cover Assessment - 2001. 30 meter riparian area.
9. Water quality in forested areas The Environmental Protection Agency analysis of water quality in New Hampshire is generally considered a thorough and reliable indication of the state’s water quality. Figure 31 contains a series of tables designed to describe the level of impairment to water bodies in New Hampshire. These analyses give an insight into what threats exists to the state’s waters – both moving (rivers and streams) and standing (lakes and ponds) waters.
Figure 31 New Hampshire Assessed Waters Individual Use Support for Rivers and Streams
State Designated Use Total Miles Assessed
Percent Good
Percent Threatened
Percent Impaired
% Good % Threatened % Impaired
Fish, Shellfish, and Wildlife Protection and Propagation
766.52 .00 1.60 98.40
Recreation 1,233.57 66.32 .00 33.68 Public Water Supply 334.89 100.00 .00 .00 Aquatic Life Harvesting 9,606.91 .00 .00 100.00

New Hampshire Forest Resources Plan Revision 28 Assessment Report – 2006; Updated 2010
New Hampshire Top Probable Sources of Impairments for Rivers and Streams # State Source Name Total
Miles Impaired by Source
1 ATMOSPHERIC DEPOSITON - TOXICS
9,605.90
2 SOURCE UNKNOWN 1,038.73 3 COMBINED SEWER OVERFLOWS 49.50 4 ILLICIT CONNECTIONS/HOOK-
UPS TO STORM SEWERS 32.23
5 INDUSTRIAL POINT SOURCE DISCHARGE
27.32
6 LANDFILLS 27.21 7 MUNICIPAL POINT SOURCE
DISCHARGES 25.97
8 LIVESTOCK 8.01
9 IMPACTS FROM HYDROSTRUCTURE FLOW REGULATION/MODIFICATION
6.86
10 ACID MINE DRAINAGE 5.25
New Hampshire Assessed Waters Individual Use Support for Lakes, Ponds, and Reservoirs
State Designated Use Total Miles Assessed
Percent Good
Percent Threatened
Percent Impaired
% Good % Threatened % Impaired
Fish, Shellfish, and Wildlife Protection and Propagation
85,511.96 .00 .01 99.99
Recreation 98,783.81 98.95 .00 1.05 Public Water Supply 13,991.23 95.58 .00 4.42 Aquatic Life Harvesting 187,728.66 .00 .00 100.00
New Hampshire Top Causes of Impairments for Lakes, Ponds and Reservoirs # State Cause Name Total
Acres Impaired
1 MERCURY 187,728.66 2 NON-NATIVE AQUATIC PLANTS 70,466.97 3 PH 14,878.87 4 POLYCHLORINATED BIPHENYLS 14,719.90 5 COPPER 2,000.00 6 ESCHERICHIA COLI 988.03 7 EXCESS ALGAL GROWTH 618.80 8 DISSOLVED OXYGEN SATURATION 508.00 9 ALUMINUM 485.50 10 DIOXIN (INCLUDING 2,3,7,8-TCDD) 384.10
New Hampshire Top Causes of Impairments for Rivers and Streams
# State Cause Name Total Miles Impaired
1 2 3 4 5 6 7 8 9 10
MERCURY PH ESCHERICHIA COLI POLYCHLORINATED BIPHENYLS OXYGEN, DISSOLVED NON-NATIVE AQUATIC PLANTS DISSOLVED OXYGEN SATURATION LEAD IRON COPPER
9,606.91 613.81 415.41 176.05 109.12 34.21 28.06 26.33 21.53 18.49

New Hampshire Forest Resources Plan Revision 29 Assessment Report – 2006; Updated 2010
New Hampshire Top Probable Sources of Impairments for Lakes, Ponds and Reservoirs
# State Source Name Total Acres Impaired by Source 1 ATMOSPHERIC DEPOSITON - TOXICS 187,728.66 2 SOURCE UNKNOWN 86,502.37 3 ATMOSPHERIC DEPOSITON - ACIDITY 10,005.69 4 NATURALLY OCCURRING ORGANIC ACIDS 4,171.18 5 COMBINED SEWER OVERFLOWS 562.00 6 MUNICIPAL (URBANIZED HIGH DENSITY AREA) 389.50 7 INDUSTRIAL POINT SOURCE DISCHARGE 386.10 8 TRANSFER OF WATER FROM AN OUTSIDE WATERSHED 245.40 9 ILLICIT CONNECTIONS/HOOK-UPS TO STORM SEWERS 238.50 10 MUNICIPAL POINT SOURCE DISCHARGES 59.00
Source for all of 10.1: Environmental Protection Agency, Water Quality Assessment Data for the State of New Hampshire Year 2002
These data, and the subsequent analysis showing sources of pollution, suggest that forestry and forest recreation are not significant contributors to water quality degradation. Airborne pollutants (much from sources far away such as the mid-western coal-fired power plants), along with the activities associated with development such as septic systems, run-off on non-natural surfaces and industrial pollutants, lead the list.
New Hampshire Forest Resources Plan Revision 30 Assessment Report – 2006; Updated 2010
CRITERION 5:
Maintenance of Forest Contribution to Global Carbon Cycles 10. Forest ecosystem biomass and forest carbon pools
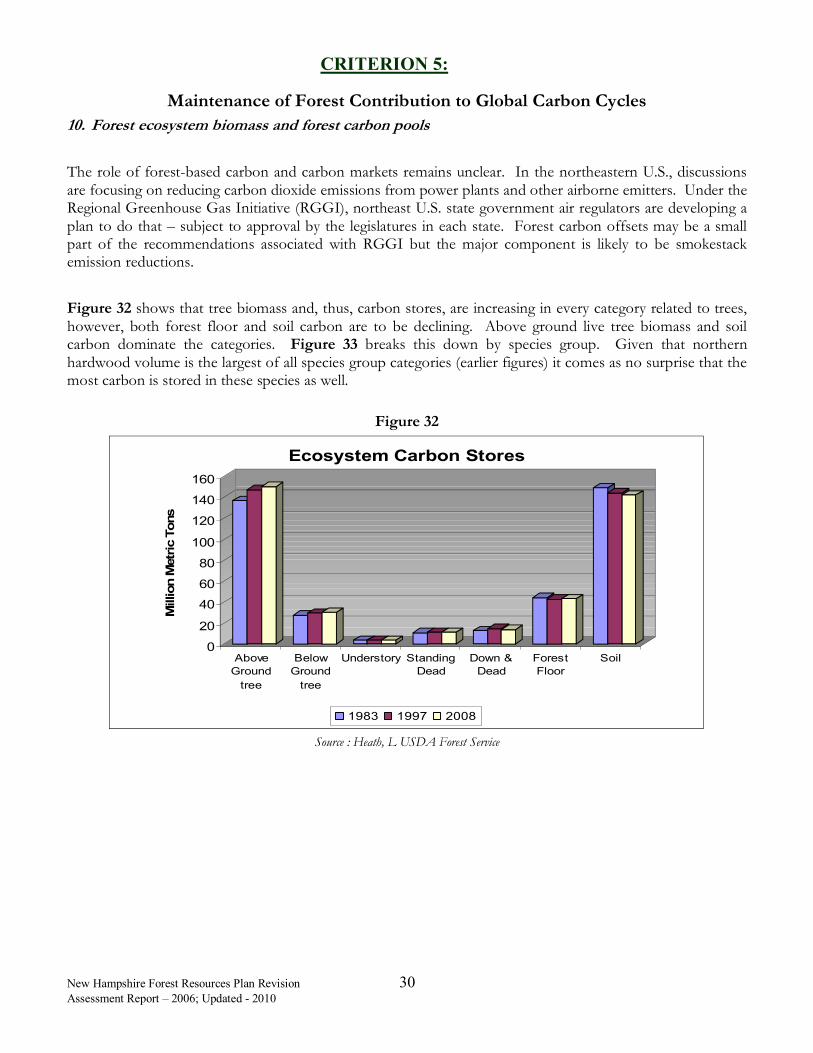
The role of forest-based carbon and carbon markets remains unclear. In the northeastern U.S., discussions are focusing on reducing carbon dioxide emissions from power plants and other airborne emitters. Under the Regional Greenhouse Gas Initiative (RGGI), northeast U.S. state government air regulators are developing a plan to do that – subject to approval by the legislatures in each state. Forest carbon offsets may be a small part of the recommendations associated with RGGI but the major component is likely to be smokestack emission reductions.
Figure 32 shows that tree biomass and, thus, carbon stores, are increasing in every category related to trees, however, both forest floor and soil carbon are to be declining. Above ground live tree biomass and soil carbon dominate the categories. Figure 33 breaks this down by species group. Given that northern hardwood volume is the largest of all species group categories (earlier figures) it comes as no surprise that the most carbon is stored in these species as well.
Figure 32
0
20
40
60
80
100
120
140
160
Million Metric Tons
Above Ground tree
Below Ground tree
Understory Standing Dead
Down & Dead
Forest Floor
Soil
Ecosystem Carbon Stores
1983 1997 2008
Source : Heath, L USDA Forest Service

New Hampshire Forest Resources Plan Revision 31 Assessment Report – 2006; Updated 2010
Figure 33
0 10
20
30 40
50
60 70
80
MM Short Tons
White & red pine
Spruce & fir
Pitch pine
Oak / pine
Oak / hickory
Elm / ash / red maple
Northern hardwood
Aspen / birch
Aboveground Carbon on Forestland 2008
Source: USDA Forest Service FIA
If the role of tree carbon becomes more important in carbon offset programs or markets, New Hampshire’s increasing biomass tree stores could play a role in the future and both landowners and the public may be the beneficiaries. Since a significant amount of forest-related carbon is found in forest-soils 7 (rather than tree boles, branches and leaves or underground woody material), intact forests could become an important factor in this increasingly important issue. Soil carbon stores in NH in 2008 were estimated at 142,240,000 metric tons 8 .
7 Heath, Linda. Research Forester, USDA Forest Service, various publications on carbon offsets from forests. 8 Heath, Linda. Research Forester, USDA Forest Service, various publications on carbon offsets from forests.

New Hampshire Forest Resources Plan Revision 32 Assessment Report – 2006; Updated 2010
CRITERION 6:
Maintenance and Enhancement of Long-term Multiple Socio-economic Benefits to Meet the Needs of Societies
11. Wood and wood products production, consumption, and trade
The forests of New Hampshire provide many different benefits to citizens and visitors. One key suite of benefits falls into the category of economics. The forests of the state are integral to the economy of New Hampshire from both the timber and forest products and recreation/tourism portions of the equation.
The value of the combined forest products manufacturing and forest-related recreation industries in NH is $2.6 billion annually (Figure 34). Of this, forest-based manufacturing is $ 1.7 billion annually while forest related recreation and tourism adds another $ 940 million each year. The closure of the pulp mill in Berlin in May of 2006 reduced the annual economic output for the state by $ 114 million. The start-up of the Schiller biomass energy facility in Portsmouth has made up for about $ 30 million of that loss.
Figure 34
Source: NEFA and U.S. Census
Figure 35 shows the 1997 and 2001 harvesting output and manufacturing balance. Approximatly 80% of the wood harvested in the state is processed here.
V a l ue of pr oduc t i on and ser v i c es i n NH 2002
0
200,000,000
400,000,000
600,000,000
800,000,000
1,000,000,000
1,200,000,000
1,400,000,000
1,600,000,000
1,800,000,000
For es tpr oduct s manuf actur i ng For es t r el at ed r ecr eat i on
$

New Hampshire Forest Resources Plan Revision 33 Assessment Report – 2006; Updated 2010
Figure 35
NH Timber Harvested and Flows 1997 & 2001
Source: NEFA
Timber harvests on all lands (state, federal or private) bring 1.2 to 1.4 million cords of wood to market annually. In 2006, 70.1 million board feet3 of hardwood sawlogs and 162.5 million board feet of softwood sawlogs were harvested from the forests of New Hampshire. In that same year, 485 thousand cords pulpwood were harvested in the State. Over 859,000 green tons of whole tree chips were harvested in 2006 as well. The estimated value of these timber sales ranges from $30 to $50 million. Figure 36 shows the flows of wood from the major categories of wood harvested – all calibrated in cords for easy comparison.
Figure 36 Wood Flows in New Hampshire 2005
Source: NEFA
Table 6 shows the status of the wood-fired power plants in New Hampshire. Of the original eight plants built in the 1980s, three have been closed (Bio-Energy, Alexandria & TIMCO) while four of the remaining five plants (Pinetree Bethlehem, Pinetree Tamworth, Hemphill and Bridgewater) all face expiring rate-orders 9
9 Rate-orders – are essentially long term contracts for selling power to a utility.
0
500
1,000
1,500
2,000
2,500
cords (1,000)
Harvested Processed Exported Imported
1997
2001

New Hampshire Forest Resources Plan Revision 34 Assessment Report – 2006; Updated 2010
beginning in 2006. Whitefield Power had its rate-order bought out and is operating in the open market due in large part because of investments made to qualify for the Renewable Portfolio Standard (RPS) in Connecticut. An RPS is public policy requiring use of renewable power in the regional market, and provides a price premium to power generators who can meet certain environmental standards with their power generation 10 . Public Service Company of New Hampshire has opened its new Schiller wood energy plant in Portsmouth, NH (a retro-fit of a coal-fired boiler). This plant, at 50 Megawatts, is more than double the size of any of the existing wood-fired plants. It will use approximately 450,000 tons of wood chips per year. Currently, there are two facilities vying for site aproval in the town of Berlin. One will produce steam and 29 Megawatts of electricity, the other will be produce between 60 and 70 Megawatts of electricty. It remains to be seen which facility will be sited and when in will be opperational.
Table 6
New Hampshire Wood-Fired Electric Generating Plants Plant and Location Size (MW) Annual Wood
Consumption (tons/yr)
Status
Bio Energy – Hopkinton (CLOSED)
11 146,000 Rate order bought out 11/2001; tried to operate on C&D – state ban imposed 2005
Bridgewater Power – Bridgewater
15 229,000 Rate order expires 8/31/2007
Hemphill Power & Light – Springfield
13.8 208,000 Rate order expires 11/30/2007
Pinetree Power – Bethlehem
15 227,000 Rate order expires 11/30/2006
Pinetree Power – Tamworth
20 286,000 Rate order expires 3/31/2008
Whitefield Power & Light – Whitefield
13.8 187,000 Rate order bought out 11/2001; expects to continue operating for 1-3 years
Alexandria Power – Alexandria (CLOSED)
15 225,000 Rate order bought out mid-1994; restrictions on future power sales
Timco – Pittsfield (CLOSED)
4 55,000 Rate order bought out 1994; restrictions on future power sales
Public Service Company of NH – Schiller, Portsmouth
50 450,000 Coal plant retrofit
Source: Existing and Potential Markets for Low-grade Wood in NH, 2002- updated 12. Outdoor recreational facilities and activities A 1997 study at UNH determined the level of participation from NH households and individuals in various recreational activities (Table 7). Top household activities included (in order):
- wildlife observation - driving for pleasure - sightseeing - jogging/running/walking - dayhiking - stream/river/lake swimming
10 Renewable Portfolio Standards allow the trading of Renewable Energy Certificates (RECs) representing the renewable power generated from these facilities. As a result, the REC qualified power provider sells both electricity and RECs – hence the price premium.

New Hampshire Forest Resources Plan Revision 35 Assessment Report – 2006; Updated 2010
Table 7
NEW HAMPSHIRE PARTICIPATION RATES AND FREQUENCY OF PARTICIPATION
Overall Household Participation
Percent who participate 16 times
a year
Percent who participate 7 + times a year
Wildlife Observation 85% 35% 50% Driving for Pleasure 84% 32% 52% Sightseeing 84% 45% 39% Jogging/Running/Walking 79% 17% 62% Day Hiking 73% 48% 29% Stream/Lake Swimming 71% 37% 34% Picnicking 68% 49% 19% Photography 64% 37% 27% Ocean Swimming 58% 40% 18% Bicycling 55% 29% 26% Outdoor Pool Swimming 54% 26% 28% Freshwater Fishing 50% 23% 27% Nature Study 47% 33% 14% Canoeing/kayaking/rowing 45% 33% 12% Motorboating 43% 23% 20% Playing on playgrounds 40% 20% 20% Tennis/Volleyball/Golf 37% 16% 21% Baseball/basketball/soccer 36% 14% 22% Downhill Skiing 35% 17% 18% Camping in National Forest 33% 30% 3% Camping at State Parks 31% 26% 5% Crosscountry skiing 31% 20% 11% Backpacking 29% 24% 5% Camping at Private Campground 28% 21% 7% Mountain biking 27% 15% 12% Large Game Hunting 25% 10% 15% Offroad Vehicle Driving 21% 13% 8% Snowshoeing 20% 13% 7% Snowmobiling 19% 9% 10% ATV 17% 6% 11% Bird Hunting 17% 9% 8% Water skiing 17% 11% 6% Horseback Riding 15% 10% 5% Sailing 14% 10% 4% Sea Kayaking 4% 3% 1%
Source: NH Outdoor Needs Assessment (UNH)
Interestingly, snowmobiling and ATV riding ranked toward the bottom of the list though these activities require significant investment. Snowmobiling is worth $ 367 million per year to the NH economy according to a study commissioned by the NH Snowmobile Association in 2001. Snowmobile sales nationally peaked nationally in 1997 at 260,735 units and were at 208,592 units in 2001. New Hampshire OHRV registrations (Figure 37) have been ranged from 50 to 60,000 in-state registrations and approximately 25,000 out-of-state registrations in recent years.

New Hampshire Forest Resources Plan Revision 36 Assessment Report – 2006; Updated 2010
Figure 37
Hunting and fishing activities have been declining, as measured by sale of hunting and fishing licenses. Figure 38 shows the last 15 years of sales. Hunting license sales peaked in 1996 at about 83,000 licenses and stand at about 59,000 in 2008. Fishing license sales peaked in 1997 at just under 167,000 and are currently at about 145,000 licenses. The sales of licenses are integral to the mission of the NH Fish & Game Department which is a self-funded agency. License sale make up a significant portion of its operating budget.
Figure 38
Source: NH Fish & Game Department
Table 8 shows current use assessment 11 acres in NH by county. The 2,919,339 acres in current use represent over 51% of the land area in the state. Of this, over 48% is enrolled in the 20% recreational
11 Current use land is privately held undeveloped land voluntarily enrolled in a state-based reduced assessment program that significantly reduces property taxes on these lands if they are kept in their undeveloped state.
NH Hunting & Fishing License Sales
0
20,000
40,000
60,000
80,000
100,000
120,000
140,000
160,000
180,000
1994 1995 1996 1997 1998 1999 2000 2001 2002 2003 2004 2005 2006 2007 2008
Hunting Fishing
10,000
20,000
30,000
40,000
50,000
60,000
70,000
2007 2008 2009
Sales of OHRV Permits
Snow machine Wheeled OHRV
New Hampshire Forest Resources Plan Revision 37 Assessment Report – 2006; Updated 2010
Funding for State & Private Forestry Northeastern Area
$0
$20
$40
$60
$80
$100
$120
1999 2000 2001 2002 2003 2004 2005 2006 2007 2008
Million
Economic Action Urban and Community Forestry Forest Legacy Forest Stewardship Cooperative Fire Protection Forest Health
discount option whereby the landowner agrees not to post his/her land against passive recreational access.
Table 8
Source: New Hampshire Department of Revenue Administration 13. Investments in forest health, management, research, and wood processing
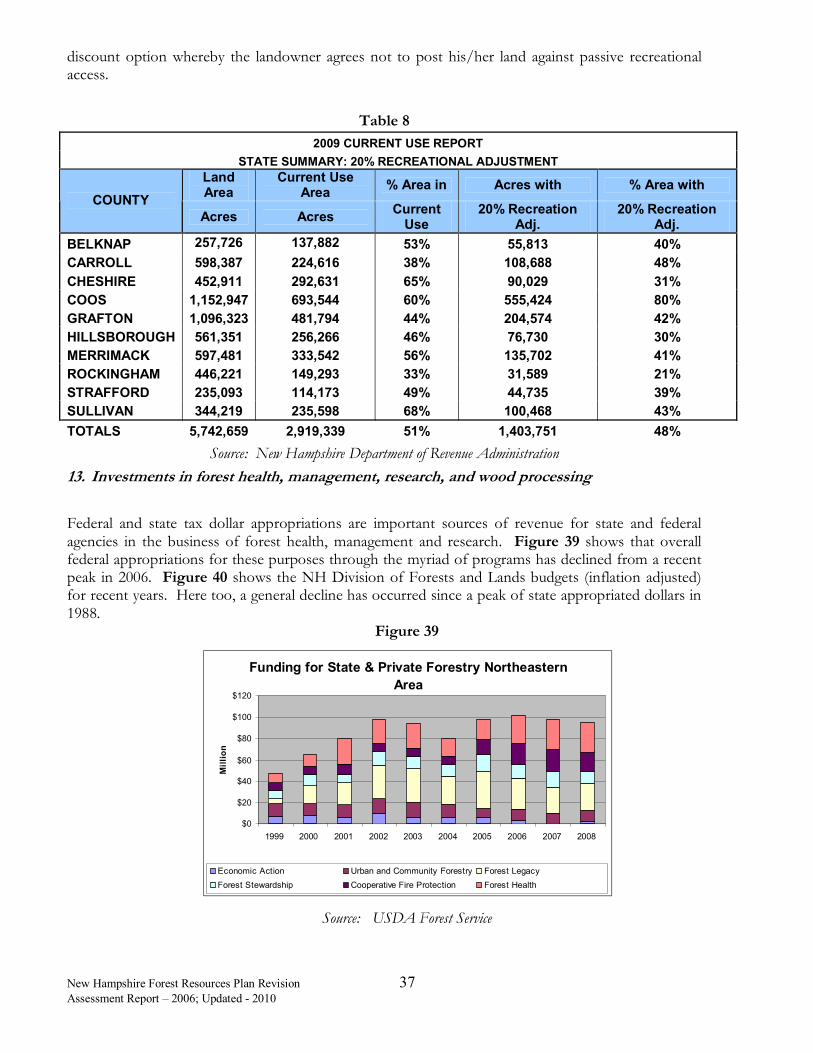
Federal and state tax dollar appropriations are important sources of revenue for state and federal agencies in the business of forest health, management and research. Figure 39 shows that overall federal appropriations for these purposes through the myriad of programs has declined from a recent peak in 2006. Figure 40 shows the NH Division of Forests and Lands budgets (inflation adjusted) for recent years. Here too, a general decline has occurred since a peak of state appropriated dollars in 1988.
Figure 39
Source: USDA Forest Service
2009 CURRENT USE REPORT STATE SUMMARY: 20% RECREATIONAL ADJUSTMENT
Land Area
Current Use Area % Area in Acres with % Area with
COUNTY Acres Acres Current
Use 20% Recreation
Adj. 20% Recreation
Adj. BELKNAP 257,726 137,882 53% 55,813 40% CARROLL 598,387 224,616 38% 108,688 48% CHESHIRE 452,911 292,631 65% 90,029 31% COOS 1,152,947 693,544 60% 555,424 80% GRAFTON 1,096,323 481,794 44% 204,574 42% HILLSBOROUGH 561,351 256,266 46% 76,730 30% MERRIMACK 597,481 333,542 56% 135,702 41% ROCKINGHAM 446,221 149,293 33% 31,589 21% STRAFFORD 235,093 114,173 49% 44,735 39% SULLIVAN 344,219 235,598 68% 100,468 43% TOTALS 5,742,659 2,919,339 51% 1,403,751 48%

New Hampshire Forest Resources Plan Revision 38 Assessment Report – 2006; Updated 2010
Figure 40 NH Division of Forests & Lands funding
0
500000
1000000
1500000
2000000
2500000
3000000
3500000
4000000
4500000
5000000
$$
1984 1986 1988 1990 1992 1994 1996 1998 2002
NH Division of Forests and Lands Budget (inflation adjusted)
Private Other
Revenue
Other Government
State
Federal
Source: agency (Note: large 2002 federal revenue from Forest Legacy program – Conn. Lakes)
USDA Forest Service research funding for the northeast region of the US has increased since a low in 1996. Figure 41 shows this to be true even if we view the numbers in inflation-adjusted dollars.
Figure 41 USDA Forestry Research Funding – Northeast Region
0
5000000
10000000
15000000
20000000
25000000
30000000
35000000
40000000
$$
1995 1996 1997 1998 1999 2000 2001 2002 2003 2004 2005
Northeast USDA Forest Service Research Funding
Current Dollars Inflation Adjusted Dollars
Source: USDA Forest Service, Research and Development
Capital expenditures in any manufacturing industry is a good measure of health since these are long- term investments seeking returns over a long period into the future. Figure 42 shows forest products manufacturing investment in NH in 1997 and 2002. A general increase occurred during this period with investment in wood products (sawmills) and pulp and paper in 2002 topping $ 35,000,000.

New Hampshire Forest Resources Plan Revision 39 Assessment Report – 2006; Updated 2010
Given recent closure of pulp and paper facilities in Groveton and Berlin, we can expect investments in this sector to decline though there are still paper manufacturing facilities in both locations.
Figure 42
0
5000000
10000000
15000000
20000000
25000000
30000000
35000000
40000000
$$
Logging
Wood
prod
ucts
Pap
er
Woo
d furnitu
re
Logging
Wood
prod
ucts
Pap
er
Woo
d furnitu
re
1997 1997 1997 1997 2002 2002 2002 2002
Private Sector Forest Products Manufacturing Capital Expenditures for NH
Source: USDA TPO survey 14. Forest ownership, land use, and specially designated areas
Forestland ownership trends in New Hampshire are similar to other states in the region. The largest change in recent years is the shift from industrial forest owners (those companies whose lands are part of a company structure that includes forest products manufacturing such as pulp and paper) to non- industrial ownership – primarily Timber Management Investment Organizations using private investor money for somewhat term-limited investments, generally 7 – 10 years, in timberland for profit.
Figure 43 shows that this phenomenon has resulted in more than a two-thirds reduction in industrial forestland ownerships (most in Coos, Grafton and Carroll counties) from 1977 to present. Public lands (state and federal) have seen a slight increase during this period – largely as part of some of the sales of the former industrial timberland.

New Hampshire Forest Resources Plan Revision 40 Assessment Report – 2006; Updated 2010
Figure 43
0
500000
1000000
1500000
2000000
2500000
3000000
3500000
4000000
4500000
5000000
acres
1953 1977 1987 1997 2002
Forestland Ownership in NH
Private Non-industrial
Private Industrial
County
State
Federal
Source: USDA FIA and National Woodland Owner Survey
Since the last Forest Resources Plan, the forest certification phenomenon has taken hold in North America and the world. Forest certification is a system whereby a private forest sustainability standard is measured on a particular forest ownership by an independent third-party auditor. If the property meets the standard then it becomes “certified” under that program’s system. The thinking about forest certification in the early 1990s was that it would result in price premiums for forest landowners and manufacturers and that this market phenomenon would drive the efforts. In reality, few market premiums are found. Certification is, however, becoming a market entrance requirement for some markets or market preference, with no prices premium, is being given in some cases.
The two major forest certification systems in the US are the Forest Stewardship Council and the Sustainable Forestry Initiative. While these have widespread use in other parts of the US and, nearby, particularly in Maine, where over 7 million acres are certified, there has been less interest in New Hampshire. Almost 605,000 acres (or 13% of the state’s timberland) are certified in New Hampshire under these two programs. Tree Farm is the longest standing certification program but the recent decline of funding to this long-standing program is threatening its viability since it runs primarily on volunteer efforts with funding from the national program. As of 2010 there were 1,540 certified Tree Farms with over 569,762 acres.
15. Employment and wages in forest-related sectors
As forest products manufacturing in New Hampshire and North America face the global competition brought on by inexpensive Russian timber and lower cost manufacturing in places like China and South America, employment in the sector is hardest hit. Manufacturing facilities must upgrade their technology and equipment to run more efficiently and keep unit costs down or they will go out of business as margins get smaller and smaller. Many mills in New Hampshire have increased production while reducing employment. Figures 44 and 45 tell this story. In 2001 the forest products industry employed almost 11,000 people directly, that number fell to 9,200 in 2005. As of 2008 the number fell to about 7,200, illustrating the closing of several facilities and the overall national economy. Over this time period paper manufacturing and wood products manufacturing workers, which are the largest sectors, encoured the largest losses.

New Hampshire Forest Resources Plan Revision 41 Assessment Report – 2006; Updated 2010
Figure 44
Source: US Department of Commerce, Bureau of Economic Analysis
Figure 45
0
50,000 100,000
150,000 200,000
250,000 300,000
350,000 400,000
450,000 500,000
$1,000
2001 2002 2003 2004 2005 2006 2007 2008
Forest Industry Earnings
Logging Wood products Paper manufacturing Furniture
Source: US Department of Commerce, Bureau of Economic Analysis
People in forest and wood-products manufacturing are likely to have living-wage jobs and good benefits. There are several economic metrics to help measure the size and health of the forest products sectory. The US Dept. of Commerce collects data on total earnings, wages and salary, and compensation. Many of those data are currently trending downward. The domestic forest products market are hurt by the housing market, global trade and the national recession. Not surprisingly, the 2008 earnings data is the lowest in recent history. In 2008 total earnings was nearly $385 million, down from a high of $463 million in 2001. Employment in forest-related recreation is estimated at 11,500 full-time employee equivalents, but total payroll is $ 181 million annually. Average annual wage in the forest related recreation sector is $ 14,454.
0
2,000
4,000
6,000
8,000
10,000
12,000
Employ
ees
2001 2002 2003 2004 2005 2006 2007 2008
Forest Industry Employment
Logging Wood Products Paper Manufacturing Furniture

New Hampshire Forest Resources Plan Revision 42 Assessment Report – 2006; Updated 2010
The Division of Forests and Lands has 53 full time employees in 2010, in the near term the division is expected to lose employees because of a state wide hiring freeze and retirements. This number is up from a low of 40 in the 1990’s, but still lower than a high of over 60 in the mid-1980s. The UNH Cooperative extension Forestry and Wildlife program also employees over a dozen natural resource specialists. The Durham Field Office employs about 40 federal researchers and specialists and the White Mountain National Forest has over 80 full time natural resource managers.

New Hampshire Forest Resources Plan Revision 43 Assessment Report – 2006; Updated 2010
CRITERION 7:
Legal, Institutional, and Economic Framework for Forest Conservation and Sustainable Management
16. Forest management standards/guidelines
New Hampshire has a series of laws and regulations designed to assure sustainable management of timber and non-timber attributes on forestland in New Hampshire. The state’s laws are not found in a comprehensive forest practices act like some states – where all the forestry related topics fall under one title – but the list of laws in New Hampshire, is nevertheless, wide-ranging.
New Hampshire has laws requiring permitting to harvest (Intent to Cut and Report of Cut), water quality protection (wetland and alteration of terrain laws), timber tax, forester licensing, and some wildlife related regulations. Other states in the region have similar laws and regulations, though some are packaged in forest practices acts. Table 9 provides a comparison of broad law categories for New Hampshire and the surrounding states of Maine, Massachusetts and Vermont.
Table 9 Forestry Laws and Regulations – some New England States
Type of Law NH VT ME MA Forester Licensing X X X Logger Licensing X
Forest Practices Act X X Water Quality regulations X X X X
Timber tax X Intent to Harvest permitting X X X
Cutting/Management Plan Approval Certain Certain X Wildlife Management Requirements Some Some Some Some
Source: Ellefson et al, REGULATION OF FORESTRY PRACTICES ON PRIVATE LAND IN THE UNITED STATES: ASSESSMENT OF STATE AGENCY RESPONSIBILITIES ANDPROGRAM
EFFECTIVENESS, October 2004
A review of the laws referenced in the table reveals that one area covered by laws in all three of these states but not New Hampshire is that of intensity of cutting practices not associated with road or wetland buffers – or more specifically – clearcutting or heavy cutting. All three of these states regulate certain size (or larger) clearcuts to an extent. Permits and extra planning is required when associated with these kinds of harvest. New Hampshire is the only state of these four with a timber (severance) tax.
17. Forest-related planning, assessment, policy, and law
Beyond the state statute requirement for a Forest Resources Plan (and to be revised every 10 years), a significant amount of forest related planning goes on the New Hampshire. The Forest Stewardship Program, funded with federal dollars, has encouraged forest management planning on private forestlands for years.

New Hampshire Forest Resources Plan Revision 44 Assessment Report – 2006; Updated 2010
Table 10 shows the progress made there since 1990. New Hampshire has over 775,000 acres under official forest stewardship plans. Certified Tree Farms must also have written management plans. Other private forestland is required to be covered by forest management plans as well, such as the over 600,000 acres under the forest certification programs. Other private forest acreage is covered by formal plans as well.
Table 10 NH Forest Stewardship Plans
Source: DRED
A comprehensive forest management planning is underway for all state lands under the management of the Division of Forests and Lands. The revision of the White Mountain National Forest Plan (covering over 800,000 acres – nearly all of which is in NH) was completed in 2006.
Formal statewide plans have become more numerous than one would expect. Though not all of them affect forests specifically, many involve forestlands, forest industry, or other areas of concern to New Hampshire’s forest community. The recently developed Wildlife Action Plan through NH Fish & Game is one such plan that directly affects NH’s forests since its recommendations for conservation and management largely fall on forested habitats. Table 11 provides a brief list of the statewide plans.
Table 11 NH Wildlife Action Plan--update 2010
NH Transportation Business Plan 2006 State Comprehensive Outdoor Recreation Plan 2002 NH Comparative Risk Project (ranked risks) 1998 White Mountain National Forest Plan 2005 NH Energy Plan 2002 NH State Parks Commission Report 2006 State Development Plan 2000 Climate Change Action Plan 2009 Ten Year Strategic Plan – NH Division of Parks 2010
New Plans Revised Plans New Acres Revised
Acres Total Plans Total Acres
1990 — — 21,600 — — 21,600 1991 237 — 48,418 — 237 48,418 1992 265 — 37,615 — 265 37,615 1993 262 — 55,462 — 262 55,462 1994 190 31 28,520 31,671 221 60,191 1995 186 24 26,958 19,236 210 46,194 1996 115 28 26,805 5,297 143 32,102 1997 139 18 39,640 7,262 157 46,902 1998 108 18 14,143 3,554 126 17,697 1999 182 60 35,128 19,203 242 54,331 2000 102 25 20,835 9,955 127 30,790 2001 94 27 15,336 32,149 121 47,485 2002 36 20 9,626 18,742 56 28,368 2003 15 14 20,772 24,669 29 45,441 2004 53 11 26,043 12,426 64 38,469 2005 60 16 161,833 2,266 76 164,099 Totals 2,044 292 588,734 186,430 2,336 775,164

New Hampshire Forest Resources Plan Revision 45 Assessment Report – 2006; Updated 2010
Conclusion – This Assessment component of the revision process for New Hampshire’s Forest Resource Plan is marked by one major theme – change. Most particularly, the change that is resulting from the conversion of forestland to non-forest uses as a result of the development pressure and growth being felt in the Granite State. Like nothing else, these forces will continue to work to change the fabric of what New Hampshire’s forests represent.

New Hampshire Forest Resources Plan Revision 46 Assessment Report – 2006; Updated 2010
PRIORITY FOREST LANDSCAPES for NEW HAMPSHIRE
It is becoming increasingly commonplace to use GIS (Geographic Information Systems) to inform natural resource management. One common practice is to collect several geographic data layers and lay them on top of one another in what is called an overlay analysis. These layers are added together and where the different layers intersect they accumulate a higher score. The final layer is that of relative landscape values across an area. When done across a large landscape this becomes an informative forest planning tool. The Division of Forests and Lands developed four priority forest landscape maps; one urban forest landscape map, and three rural forest landscape maps based on the USDA Forest Service national priorities (themes).
One theme of the forest planning effort is to conserve working forest landscapes (Figure 46). Several data layers were selected to create an overlay analyses for this specific theme. The layers used for New Hampshire were; unfragmented forest blocks, important forest soils, NH Wildlife Action Plan, timber tax revenue created, drinking water, and conservation lands. Although, there is a range of numerical values, the data is arranged to give a relative value of high, medium or low.
Another theme is enhancing public benefits from trees and forests (Figure 47). This analysis is designed to emphasize ecosystem services and social benefits of forests. As an example the GRANIT conservation lands data layer was used. The layer was queried to select parcels that offer the chance for greater recreational opportunities (public access). The layers used were unfragmented forest blocks, NH Wildlife Action Plan, timber tax revenue created, stream boundaries, drinking water, and conservation lands.
New Hampshire forests are under threat from insect pests, weather events, development, and fire. Protecting forests from harm (Figure 48) is another national theme. Layers used for this analysis generally delineated some from of environmental threat or degradation. For example, the ability to produce clean water (APCW) layer was queried to show areas with some level of impairment. This same layer was used in the “enhancing public benefits” analysis, only it was filtered to show areas with higher ranked water quality. Other data layers used were areas of known forest damage, active outbreaks of hemlock wooly adelgid (Figure 26), NH fire risk assessment, rapidly developing towns, and smaller forested blocks.
Lastly, an analysis was conducted to locate urban forestry opportunity areas (Figure 49). New Hampshire is a rural state but also one that is rapidly growing. Many town and cities, especially in the south, are expanding in population and this brings changes to both the urban and rural landscapes. This analysis was conducted to illustrate the confluence of population centers and environmental quality. Data layers used were from the “Maryland Method”, housing density, air quality non attainment areas and APCW.
It should be noted that this type of analysis is created with the most current data layers available from state and federal agencies. That said, many of these layers require frequent updating, like the conservation land data layer. Some datasets, like soils, are incomplete. Currently, no digital soil data for the White Mountain National Forest exists. And some data layers will become out dated and may be replaced with newer or different data. As such, this type of analysis should be considered a snapshot in time and may not be able to keep pace with our changing environment.

New Hampshire Forest Resources Plan Revision 47 Assessment Report – 2006; Updated 2010
Figure 46

New Hampshire Forest Resources Plan Revision 48 Assessment Report – 2006; Updated 2010
Figure 47

New Hampshire Forest Resources Plan Revision 49 Assessment Report – 2006; Updated 2010
Figure 48

New Hampshire Forest Resources Plan Revision 50 Assessment Report – 2006; Updated 2010
Figure 49

New Hampshire Forest Resources Plan Revision 51 Assessment Report – 2006; Updated 2010
MULTISTATE PRIORITIES
The New Hampshire Division of Forests and Lands has a long and successful tradition of working collaborativly on projects and policy development. Projects have ranged from Forest Health efforts such as Asian Longhorned Beetle detection and eradication to wildland fire prevention with the Northeastern Forest Fire Protection Compact and participation in the four-state North Eastern State Foresters Association (NEFA). These cooperative efforts enable states to better address areas of common opportunity or concern.
New Hampshire has identified the following multi-state priority forest areas (Figure 50):
Northern Forest Lands (NFL) – New Hampshire’s northern most county (Coos) lies within the planning area for NFL which stretches over 20 million acres from Maine to New York. This area was the focus of a regioanl study and planning effort in the 1990’s. Issues needing attention include forest land conservation, economic development and community infrastructure. States: Maine, New Hampshire, Vermont, New York
Connecticut River Valley - The Connecticut River is the largest river in New England. It flows south from northern New Hampshire and forms the state border between Vermont and New Hampshire. Continuing through western Massachusetts and into central Connecticut, it flows into Long Island Sound. According to the US Forest Service publication “Forest on the Edge” this is one of the most at-risk areas of New England for forest fragmentation. Issues associated with this area include invasive species control, urban and agricultural runoff impacting water quality, fisheries and wildlife habitat. States: Vermont, New Hampshire, Massachusetts, Connecticut
Quabbin to Cardigan Corridor - The Quabbin to Cardigan region encompasses more than 3,000 square miles in the Monadnock Highlands of central Massachusetts and western New Hampshire. The region contains one of the largest remaining areas of intact contiguous forest in central New England. The region is the watershed boundary between the Connecticut and Merrimack River valleys and the highlands provide habitat for many species of migratory birds and wide-ranging wildlife— animals that are in decline elsewhere in New England due to habitat fragmentation. The area’s forests also form the basis of a vibrant tourism, recreation and forest products economy. To address issues of concern in the region the Quabbin to Cardigan Partnership (Q2C) was formed in 2000. Since that time the partnership’s efforts have helped to protect more than 60,000 acres. The Q2C partnership includes a unique assemblage of 27 state and federal public agencies (USFS, NRCS, FSA, RD and state forestry and economic development agencies), private conservation groups, forestry organizations and landscape-scale partnerships. States: New Hampshire and Massachusetts

New Hampshire Forest Resources Plan Revision 52 Assessment Report – 2006; Updated 2010
Figure 50

New Hampshire Forest Resources Plan Revision 53 Assessment Report – 2006; Updated 2010
Bibliography
American Forest & Paper Association – Pulp and Paper Statistics
Conference of New England Governors and Eastern Canadian Premiers Forest Mapping Group, Assessment of Forest Sensitivity to Nitrogen and Sulfur Deposition in New Hampshire and Vermont, 15 December 2005
Paul V. Ellefson, Michael A. Kilgore, Calder M. Hibbard and James E. Granskog, Regulation of Forestry Practices on Private Land in the United States: Assessment of State Agency Responsibilities and Program Effectiveness, October 2004, 201 pp.
Environmental Protection Agency, Water Quality Assessment Data for the State of New Hampshire Year 2002
Innovative Natural Resource Solutions LLC and Draper/Lennon Inc., Existing and Potential Markets for Low-grade Wood in NH, 2002
National Association of State Foresters, State Agency Salary information
NatureServe
New Hampshire Forest Inventory Project, Levesque, Charles, Timber Availability Analysis, 1995
NH Chapter, The nature Conservancy, GAP Status Assessment of New Hampshire Conservation Lands 2005 and 2006
NH Dept. of Revenue Administration, Current Use Assessment data
NH Fish and Game Department – Hunting, Fishing and OHRV statistics
NH Natural Heritage Bureau
NH Office of Energy and Planning, NH Statewide Comprehensive Outdoor Recreation Plan 2003-2007
NH Snowmobile Association and Univ. of NH
North East State Foresters Association (NEFA), 2004 The Economic Importance of New Hampshire’s Forests
North East State Foresters Association (NEFA), 2007 The Economic Importance and Wood Flows from New Hampshire’s Forests
North East State Foresters Association (NEFA), 2003 Wood Flows
North East State Foresters Association (NEFA), 2004 The Northern Forest of Maine, New Hampshire, Vermont and New York: A look at the land, economies and communities 1994-2004
North East State Foresters Association (NEFA), 2000 Ice Storm of 1998
USDA Forest Service, Forest Inventory and Assessment, 1983, 1997 and current
USDA Forest Service, Performance Measurement Accountability System (PMAS) Farnsworth, Elizabeth, Ogurcak, Danielle, Patterns in Biogeographic Dynamics and Decline of 71 Rare Plant Species in New England: Evidence from Historical Collections and Contemporary Monitoring, 2005.

New Hampshire Forest Resources Plan Revision 54 Assessment Report – 2006; Updated 2010
USDA Natural Resource Conservation Service, National Resources Inventory, 1983 and 1997
Society for the Protection of New Hampshire Forests, NH’s Changing Landscape, 2005
Society for the Protection of New Hampshire Forests, NH’s Vanishing Forests, Conversion, Fragmentation and Parcelization of Forests in the Granite State, 2001
The Nature Conservancy, Winrock International, The Sampson Group,Terrestrial Carbon Sequestration in the Northeast, Quantities and Costs Part 2: Recent Trends in Sinks and Sources of Carbon, 2006
U.S. Census and NH Office of Energy and Planning
US Department of the Interior Fish & Wildlife Service and U.S. Department of Commerce, Bureau of the Census. 1991 National Survey of Fishing, Hunting, & Wildlife-Associated Recreation.
US Department of the Interior Fish & Wildlife Service and U.S. Department of Commerce, Bureau of the Census. 1996 National Survey of Fishing Hunting, & Wildlife-Associated Recreation (FHW/96 NAT)
U.S. DOI, F&WS and US DOC, US Census Bureau. 2001 National Survey of Fishing, Hunting, and Wildlife-Associated Recreation. (Oct. 2002).
Woodall's Publications Corp Campground Statistics

New Hampshire Forest Resources Plan Revision 55 Assessment Report – 2006; Updated 2010