New Hampshire Independent Study of Energy Policy Issues Board/Meetings/2011/20110408Mtg/NH... · 3....
35
1 New Hampshire Independent Study of Energy Policy Issues
Transcript of New Hampshire Independent Study of Energy Policy Issues Board/Meetings/2011/20110408Mtg/NH... · 3....

1
New Hampshire Independent Study of
Energy Policy Issues

2
Mobilizing Markets:
Key Attributes of Developing Markets &
What we Look for When Assessing EE & SE Programs

3
Presentation for the NH EESE Board
April 8, 2011
Christine Donovan, Project Manager, VEIC
Jim Grevatt, VEICDavid, VEIC
Jeffrey Taylor, JHTA

4
Agenda 1. Introductions and Purpose
Christine
2. EE Program Assessment Jim
3. SE Program Assessment David
4. Future EESE Board Engagement Christine
Discussion Facilitator Throughout: Jeff Taylor

Desired End Result
An effective approach to transforming EE and SE markets that
… reflects what is unique about NH and
… applies learning from other states & jurisdiction
… when helpful for achieving NH’s goals.
5

6
1. EE Market Assessment

Energy Efficiency MarketsWhat is the desired outcome?
7

Market DevelopmentCaptures cost-effective savings while supporting market growth:
Enhancing market drivers that already existLeveraging private investmentEngaging market playersNo dead ends- allows for and encourages future market growth
ScaleEfficiency impact
8

Key IngredientsClear, stable message to market players
Ease of finding informationContractors, retailers, manufacturers, business and home owners all drive to one resultConsistent market presence
Optimized incentive structures
Ease of participation
9

Savings AcquisitionAre results in-line with leading programs?Are best-practice approaches used?Are there market opportunities are not addressed?Is there innovation that addresses market-specific barriers?Are savings values defensible?Are investments strategically targeted to maximize benefits?
10
11
2. SE Market Assessment

Sustainable Energy MarketsWhat is the desired outcome?
12

Ideally:Multi year commitments Market responsive and catalyzingMarket pace based incentive declinesTraining and workforce developmentCompetitive pressureGood communications
Sustained Orderly Market Development

New Hampshire’s Solar Resource Is Better than Germany and Japan’s
New Hampshire 4.0-4.5 kWh/m2/dayNew Hampshire 4.0-4.5 kWh/m2/day Germany & Japan <4.0 kWh/m2/dayGermany & Japan <4.0 kWh/m2/day

New Hampshire’s Wind Resource is Significant On Shore & Off Shore
Source: NREL Wind Powering America

• Solar domestic hot water can meet a substantial portion of hot water needs (typical systems deliver 60%-70% annual load)• Maintain back up water heating source• Don’t want to oversize due to summer overheating
• Proven technology• Established product quality control –• Solar Rating & Certification Corp.
• Leverages Federal and state tax credits• Local solar installers are interested –
helps build sustainable business models
Solar Domestic Hot Water

NH Solar Hot Water ExampleCapacity: kBTU/day 64.00 Household Size (persons) 4Installed Cost 8,000$ State and ARRA Incentive 2,750$ Year 1 kWh savings 3,900 Year 1 $ savings 620$ Customer NPV 20 years 4,007$

Customer Economics Comparison - 20 year NPVResidential 2-panel (64 sq. ft.) System, Current New Hampshire and ARRA Incentive
$(7,547)
$8,312
$2,594
$1,486
$(838)
$4,007
$(10,000)
$(8,000)
$(6,000)
$(4,000)
$(2,000)
$-
$2,000
$4,000
$6,000
$8,000
$10,000
Initial Dow npayment Electricity savings State & ARRA Incentive Federal Personal Income TaxCredit
O&M - Tank replace, labor,glycol & pump
Present value net cash f low
Solar Hot Water Customer Economics

• Limited Residential Scale Market in NH and most states
• Consider Possible medium scale >10 kW initiative
• Expected Performance Based Incentives (Target Good Sites)
• Providing Customer Education and Information
• Sponsoring Contractor Training Seminars
Small Wind

Source: IREC US Solar Market Trends and Greentech Media US Solar Market Insight 3Q 2010.
TOP TEN STATES Ranked by Grid‐Connected PV Capacity Installed in 2009
2009 2008 Growth mkt% 2008 rank
1. California 212.1 197.6 7% 49% 1
2. New Jersey 57.3 22.5 155% 13% 2
3. Florida 35.7 0.9 3668% 8% 16
4. Colorado 23.4 21.7 8% 5% 4
5. Arizona 21.1 6.2 243% 5% 8
6. Hawaii 12.7 8.6 48% 3% 5
7. New York 12.1 7.0 72% 3% 7
8. Massachusetts 9.5 3.5 174% 2% 11
9. Connecticut 8.7 7.5 16% 2% 6
10. North Carolina 7.8 4.0 96% 2% 10
All Other States 34.2 24.6 41% 7% ‐‐
Total 434.6 311.3 40% ‐‐ ‐‐
2008 and 2009 columns include installations completed in those years. “2009 Market Share” means share of 2009 installations. “2008 Rank” is the state ranking for installations completed in 2008.
US Photovoltaic Markets

Markets are developing and prices are coming downIncentives can be less expensive and need to be designed to continue progress towards lower installed costs as markets develop
Source: Greentech Media US Solar Market Insight 3Q 2010.
PV Observations

Foundation – Net Metering/IC
Essential Complements
Standard Approaches
Innovative Approaches
Market Development Strategies

Net Metering and Interconnection
Foundations
Workforce development Customer education and outreachFinancial Incentives (pick one or more of the following)
Essential Complements

RebatesRPS and RPS with Solar Set AsideFeed In Tariffs Tax Incentives
Standard Approaches

RebatesCapacity based Performance basedDynamic (capacity block)Steadily decliningMulti-yearMost States including CA and NJ
Standard Approaches

29 states 14 states with solar set asides56% of electric retail sales Market drivenNeeds to have ACP
Standard Approaches
Illustrative SACP and SREC Market Value
$0
$100
$200
$300
$400
$500
$600
$700
$800
2009 2010 2011 2012 2013 2014 2015 2016
Energy Year
$/M
Wh
SACP Average SREC Market Value (Hypothetical)
Hypothetical Range of SREC Trading Values and Annual Average
Actuals will be determined by Market
RPS and RPS with Solar Set Aside
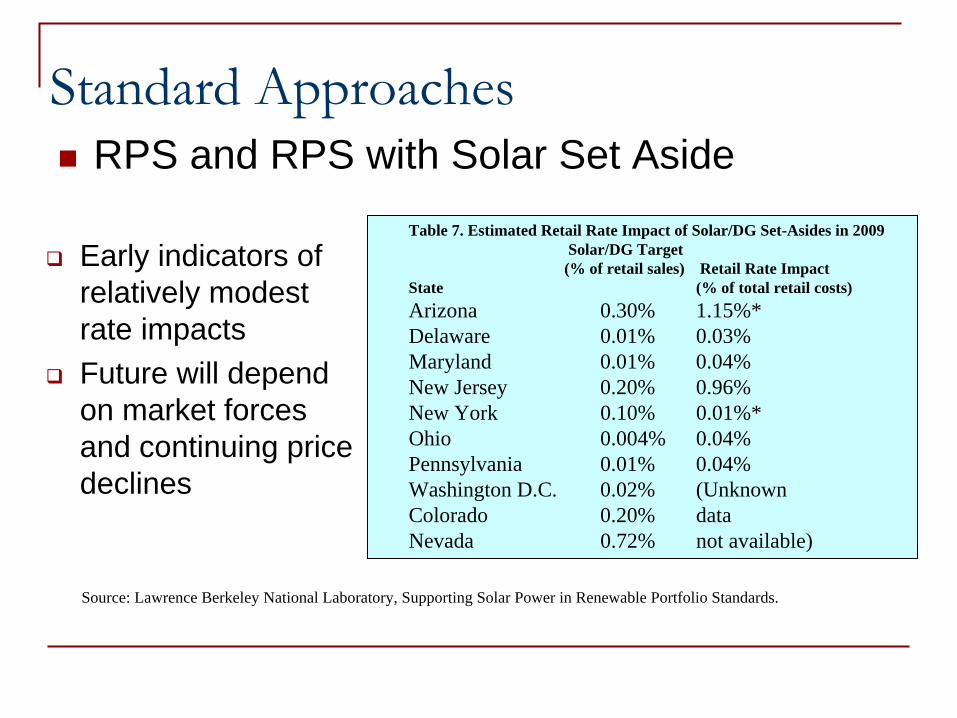
Early indicators of relatively modest rate impactsFuture will depend on market forces and continuing price declines
Standard ApproachesRPS and RPS with Solar Set Aside
Table 7. Estimated Retail Rate Impact of Solar/DG Set-Asides in 2009 Solar/DG Target (% of retail sales) Retail Rate Impact
State (% of total retail costs)Arizona 0.30% 1.15%* Delaware 0.01% 0.03% Maryland 0.01% 0.04% New Jersey 0.20% 0.96% New York 0.10% 0.01%* Ohio 0.004% 0.04% Pennsylvania 0.01% 0.04% Washington D.C. 0.02% (Unknown Colorado 0.20% dataNevada 0.72% not available)
Source: Lawrence Berkeley National Laboratory, Supporting Solar Power in Renewable Portfolio Standards.
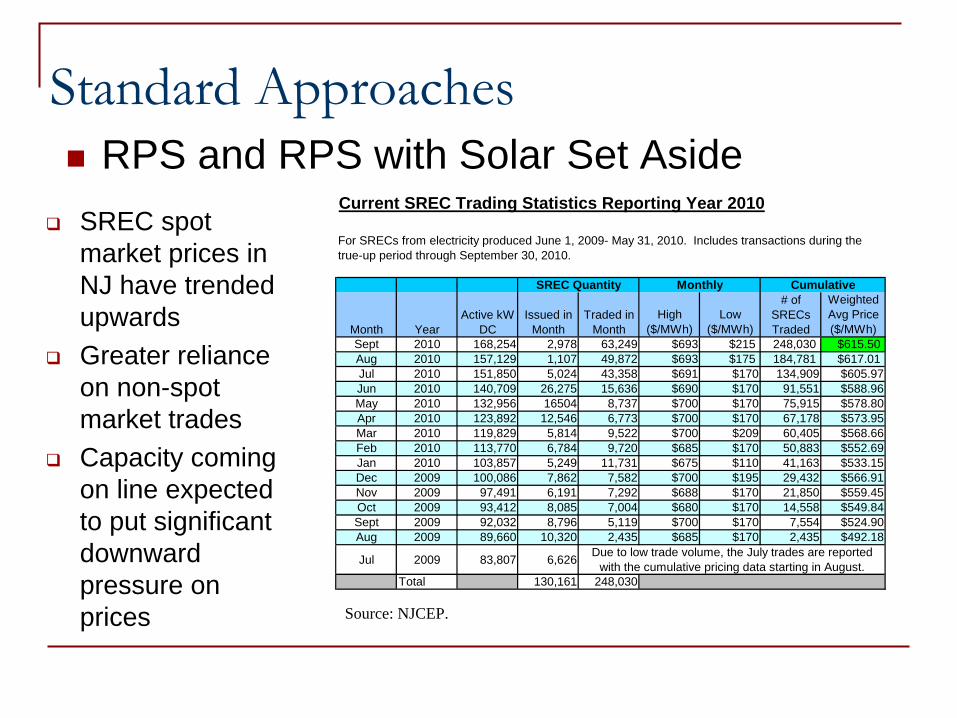
SREC spot market prices in NJ have trended upwardsGreater reliance on non-spot market tradesCapacity coming on line expected to put significant downward pressure on prices
Standard ApproachesRPS and RPS with Solar Set Aside
Source: NJCEP.
Current SREC Trading Statistics Reporting Year 2010
High LowWeighted Avg Price
($/MWh) ($/MWh) ($/MWh)Sept 2010 168,254 2,978 63,249 $693 $215 248,030 $615.50 Aug 2010 157,129 1,107 49,872 $693 $175 184,781 $617.01 Jul 2010 151,850 5,024 43,358 $691 $170 134,909 $605.97 Jun 2010 140,709 26,275 15,636 $690 $170 91,551 $588.96 May 2010 132,956 16504 8,737 $700 $170 75,915 $578.80 Apr 2010 123,892 12,546 6,773 $700 $170 67,178 $573.95 Mar 2010 119,829 5,814 9,522 $700 $209 60,405 $568.66 Feb 2010 113,770 6,784 9,720 $685 $170 50,883 $552.69 Jan 2010 103,857 5,249 11,731 $675 $110 41,163 $533.15 Dec 2009 100,086 7,862 7,582 $700 $195 29,432 $566.91 Nov 2009 97,491 6,191 7,292 $688 $170 21,850 $559.45 Oct 2009 93,412 8,085 7,004 $680 $170 14,558 $549.84 Sept 2009 92,032 8,796 5,119 $700 $170 7,554 $524.90 Aug 2009 89,660 10,320 2,435 $685 $170 2,435 $492.18
Jul 2009 83,807 6,626
Total 130,161 248,030
For SRECs from electricity produced June 1, 2009- May 31, 2010. Includes transactions during the true-up period through September 30, 2010.
Month YearActive kW
DCIssued in
Month
# of SRECs Traded
Due to low trade volume, the July trades are reported with the cumulative pricing data starting in August.
CumulativeSREC Quantity Monthly
Traded in Month

Feed In TariffsChallenged by FERC and PURPA jurisdictionMore popular in European marketsFederal commerce issuesHigh Priced and over-subscribedBetter to let market set priceVermont biomass and PV substantially oversubscribed in first day – need to run a lotteryDrove rapid development of high visibility projects but at a price
Standard Approaches

Tax IncentivesFederal Grant in lieu of credit drove market in 2010 available for projects starting before 12/31/11Includes accelerated depreciationSignificant leverage to state and program investments
State Tax CreditsSales and Property Tax Exemptions
Standard Approaches

Less Experience and Track RecordCan help to create more attention for a state market initiative.
Community scaleCustomer aggregation (including govt. procurement) Utility geo-targeting – high value installationsIntegrated RE/EE deep retrofit Pace with loan loss reserve fund Manufacturing and economic development (partnerships with academic and IP communities)
Innovative Approaches

32
3. Future EESE Board Engagement

Next Steps
EESE Board Presentation - Preview of Findings – May
EESE Board Presentation - Draft Report – June
EESE Board Presentation – Final Report – August
2 Public Presentation Days - Fall 2011 & Winter 2012
33

We welcome your insights and ideas!
34

For More Information
35
Christine Donovan Project Manager, VEIC
255 So. Champlain Street
Burlington, Vermont 05401
802-658-6060 Ext. 1301 [email protected]