New Functional Conductive Polymer Composites … Functional Conductive Polymer Composites Containing...
12
Transcript of New Functional Conductive Polymer Composites … Functional Conductive Polymer Composites Containing...

*e-mail: [email protected]
1598-5032/06/194-12©2005 Polymer Society of Korea
194
Macromolecular Research, Vol. 13, No. 3, pp 194-205 (2005)
New Functional Conductive Polymer Composites Containing Nickel
Coated Carbon Black Reinforced Phenolic Resin
Farid El-Tantawy
Department of Physics, Faculty of Science, Suez Canal University, Ismailia, Egypt
Nadia Abdel Aal
Department of Chemistry, Faculty of Science, Suez Canal University, Ismailia, Egypt
Yong Kiel Sung*
*Department of Chemistry, College of Science, Dongguk University, Seoul 100-715, Korea
Received December 16, 2004; Revised April 30, 2005
Abstract: The network structure of Ni-coated carbon black (NCB) composites filled with phenolic resin was
investigated by means of using scanning electron microscopy, viscosity, interfacial tension, shrinkability, Flory-
Huggins interaction parameters, and swelling index. The electrical properties of the composites have been charac-
terized by measurement of the specific conductivity as a function of temperature. Additionally, the variation of
conductivity with temperature for the composites has been reported and analyzed in terms of the dilution volume
fraction, relative volume expansion, and barrier heights energy. The thermal stability of phenolic-NCB composites
has been also studied by means of the voltage cycle processes. The experimental data of EMI wave shielding were
analyzed and compared with theoretical calculations. The mechanical properties such as tensile strength, tensile
modulus, hardness and elongation at break (EB) of NCB-phenolic resin composites were also investigated.
Keywords: Ni-coated carbon black composites, polymer matrix, microstructure, electrical property, stability,
mechanical property, electro-magnetic wave shielding effectiveness.
Introduction
Conducting polymer composites have been the subject of
much interest not only from fundamental scientific view
point, for various functional applications.1-4 The increasing
request for thermistors, current switching, temperature con-
trollers, electrofusion welding, electromagnetic interference
shielding and lightning protection (static charge) are push-
ing many researchers to explore new concepts and related
materials.5-9 Thermistors are thermally sensitive resistors.
Most thermistors exhibits a decrease in conductivity with an
increase in temperature and are referred to as negative tem-
perature coefficient of conductivity (NTCσ) type. Thermistors
are widely used in industries for self–regulating heaters,
temperature controls, compensation in electronic devices,
degassers, etc. especially as overflow protection devices and
precise temperature controllers.10-15 Typical problems asso-
ciated with thermistors are stability and reproducibility,
which become even more pronounced at relatively high
temperature and long reliability under severe operation pro-
cess. Therefore commercialization of high temperature ther-
mistors is yet too realized. However, all electrical and
electronic devices emit electromagnetic signals. During
recent years, the concerns have grown increasingly about
the electromagnetic interference shielding effectiveness (EMI),
and the effect on human body of electromagnetic wave radi-
ation from electronics devices. Human tissues may be acci-
dentally or intentionally exposed to electromagnetic
sources, cellular mobiles, radars, microwave oven, indus-
trial microwave equipments and others.16-20 Generally, EMI
shielding by absorption rather than reflection is more
important for many applications at the present time. Metals
or materials coated with metals possess very high EMI rang-
ing from 40 to 100 dB. However, they cannot be used as an
electromagnetic wave absorbent since their shallow skin
depth makes them shield EMI mainly through the surface
reflection.21,22 On the other hand, electrically conducting
polymers are capable of not only reflecting but absorbing
the electromagnetic wave and therefore exhibit a significant
New Functional Conductive Polymer Composites Containing Nickel Coated Carbon Black Reinforced Phenolic Resin
Macromol. Res., Vol. 13, No. 3, 2005 195
advantage over the metallic shielding materials.23,24 With the
above consideration in our mind, we report a novel approach
to enhancing the physico-chemical properties of conducting
filler into phenolic resin matrix. Our approach is based on
the coated of carbon black with nickel metal, which is a
precursor on conducting filler of phenolic matrix. In this
study the influence of NCB content on physico-chemical
properties of phenolic resin composites is addressed.
Experimental
The insulating matrix polymer consists of phenolic resin
(resole-type), purchased from (Kuk Do Chemical Industry
Co., LTD, Korea). Carbon black (CB) with particle size 8
µm and surface area 90 m2g-1 was obtained from (Fluka
A.G) and used as received. Nickel coated CB powders (CB-
10 vol% Ni) were prepared using a CB powder and
analytically pure Ni(NO3)2 · 6H2O and NH4HCO3. Ni-
(NO3)2 · 6H2O and CB were first mixed in ethanol by
alumina ball milling for 2 days. Next, NH4HCO3 solution of
1.0 mol was added drop wise to the above slurry under
vigorous magnetic stirring for 12 h with controlled the pH at
11 by using excess NH4HCO3. The resulting precipitates
were filletered by using distilled water and then dried at
100 oC for 1 day on electrical oven. The as dried powders
were calcined at 500 oC for 10 h and then the as-calcined
samples were reduced at 750 oC for 5 h in hydrogen
atmosphere. Several batches of nickel coated carbon black
(NCB)/phenolic weight ratios are: 90/10, 80/20, 70/30, 60/
40 and 50/50 respectively and abbreviated as NCB10,
NCB20, NCB30, NCB40, and NCB50 respectively. The
green phenolic with different content of NCB was prepared
by centrifuging mixer for 2 min at room temperature. The
bulk samples of composite were obtained by casting the
green composites on Teflon mould. Before the specimens
were cured, the phenolic resin was debunked by removing
all entrapped air bubbles using a hot plate. The temperature
of the hot plate was kept at 55 oC to achieve minimum vis-
cosity of the resin. Once the air bubbles were removed, the
specimens were transferred to a hot press for curing for 2 h
under uniaxial pressure 200 KN/m2 and temperature 150 oC.
The shrinkability (S) can be calculated from the weight
determinations as follows2,18:
(1)
where is the theoretical density of the component and
is the density of the composites. The was measured
by Archimedes principle. The composite samples were first
weighted dry and dipped into water for 2 h, then
weighted again after fluid immersion , and finally
weighted while immersed in water . Then the is
given by:
(2)
Morphology study of the phenolic composites was con-
ducted on scanning electron microscopy SEM, (s-4100,
Hitachi, Tokyo, Japan). The interfacial tension (γ) of com-
posites was tested by contact angle measurements using a
(CA-2000, Tokyo, Japan) contact angle meter. The viscosity
of the composites was measured by using viscometer analyzer
(VS-100, Tokyo, Japan). The thermal volume expansion
coefficient V(T) was measured by a dilatometer technique as
described elsewhere.5 The dilution of volume fraction DVF(T)
is related to the relative thermal volume expansion V(T)/V0
by the following equation19:
(3)
where V0 is the initial volume of the NCB composite at
room temperature and f is the filler volume fraction at room
temperature.
For electrical characterization, Cu-electrodes were embed-
ded into samples during preparation process to reduce the
sample- electrode contact resistance.1,17 The bulk electrical
conductivity (σ) was measured using a Multi-Mega–Ohm-
meter type MOM12 and a measuring cell ODW2 (from
WTW Co., Germany). The data were automatically collected
using a suitable interface and data acquisition pc code. Con-
ductivity was calculated from current-voltage characteristics
using the following equation: , where
I is the current, L thickness of the sample, A area of the sam-
ple and V is the voltage applied. For the measurement of the
potential–dependent temperature, the sample was placed in
controlled chamber at 20 oC. Computer controlled the tem-
perature for each applied potential.
Thermoelectric power (TEP) seebeck coefficient was mea-
sured in air by steady - state temperature gradient method.1
The TEP was evaluated by correcting the linear gradient of
TEP= for thermo-power of platinum, where
and are the thermo-electromotive force and temperature
difference between both ends of sample measured with Pt
leads and Pt/Pt-Rh thermocouples, respectively. The
dielectric properties were calculated from the capacitance
measurements made using a Hewlett Packard 4994-A
impedance analyzer at room temperature in the frequency
range from 1 KHz to 10 GHz. The static energy (SE) of the
composites was measured with a static charge meter (AX-
221, Tokyo, Japan). For measuring the discharge properties
the tested samples were charged in a 15 kV electric filed
(corona discharge). The discharge voltage time dependence
was displayed by using an integration electrometer. The
electromagnetic wave shielding effectiveness properties
were also determined by the Hewlett-Packard waveguide
line in which has containing spectro-analyzer, power meter,
S %( )ρth
ρc
------= 100×
ρth
ρc ρc
w0( )
w1( )
w2( ) ρc
ρc
w0
w1 w2–----------------= ρwater×
DVF T( )f e⋅
1 f–( )eV T( ) V⁄
0 f e⋅+------------------------------------------=
σ IL VA⁄( ) Ωcm( )=1–
F∆ T∆⁄ F∆
T∆

F. El-Tantawy et al.
196 Macromol. Res., Vol. 13, No. 3, 2005
reflection meter, and attenuation meter. The measurements
were carried out in the frequency ranges 1.0-15 GHz. The
thickness of the testing sample was about 1 mm. The mecha-
nical properties of the samples were determined using a
testing instrument Instron, UK. Hardness (Hv) has been deter-
mined using a universal testing machine (ASTM-D2240-78).
Results and Discussion
Morphological and Network Structure of the Compos-
ites. The scanning electron microphotograph (SEM) of the
phenolic resin-NCB composites of samples NCB10 and
NCB50 are shown in Figure 1(a) and 1(b), respectively. The
micrograph of sample NCB10 consists of gallery space in
the resin into composites matrix and the density of resin is
higher. On the other hand, the micrograph of sample NCB50
exhibits a good interface adhesion between NCB and resin
matrix, and the NCB particles are more tight contacts
through the composites forming effective conducting network
structure. The SEM results are also analyzed from the point
of view of packing density. The NCB50 sample, show a
progressive improvement with respect to particle-to-particle
connectivity (i.e. high packing density and aspect ratio).
The average particle size observed from the scanning
micrographs is about 9 micron. In order to confirm this
observation, the interfacial tension (γ), viscosity(η), and
shrinkability(S) as a function of NCB content has been
analyzed and is plotted in Figure 2(a). It is clearly that both
the γ, η, and S increases with increasing NCB content in the
composites. The increment of γ is due to the fact that the
NCB particles are well wetted by phenolic resin and have
been bonded to molecules of the resin with intensive
physical and chemical bonds.5 While the increment in η val-
ues with increasing NCB loadings indicates that as more
and more NCB particles gets into the resin matrix and the
mobility of the macromolecular chains of the resin reduces
resulting in more rigid composites.3 The S increases with
increase NCB content in the composites. It is tempting to
speculate that when the NCB increases the entanglement
network structure increases (i.e. the void formation decreases)
with NCB addition into the composites as confirmed by
SEM photographs above. To gain more deep light on the
influence of NCB content on the network structure, the
number of elastically effective chains (NEC) of the compos-
ites has been estimated using the relation20:
(4)
where is the polymer density, NA is the Avogadro’s
number and Ma is the average molecular weight of polymer
between crosslink’s, and is calculated by the following
relation1,21:
(5)
where Vs is the molar volume of solvent, χ is the Flory-
Huggins interaction parameter between solvent and poly-
mer and is given by6:
(6)
where θ the lattice constant, and the solubility
parameter of solvent and polymer respectively, R the univer-
sal gas constant, T the absolute temperature and Vrf the vol-
ume fraction of polymer in the solvent swollen filled sample
and is given by15:
NECρrNA
Ma
-----------=
ρr
Ma
ρrVsVrf
1 3⁄
1 Vrf–( ) Vrf χ+ + Vrf
2ln--------------------------------------------------–=
χ θVs δs δp–( )
2
RT--------------------------+=
δs δp
Figure 1. The scanning electron microphotograph (SEM) of the
phenolic resin - NCB composites: (a) samples NCB10 and (b)
NCB50.

New Functional Conductive Polymer Composites Containing Nickel Coated Carbon Black Reinforced Phenolic Resin
Macromol. Res., Vol. 13, No. 3, 2005 197
(7)
where d the deswollen weight of sample, w0 the initial
weight of sample, As the amount of solvent absorbed by
sample and ρp is the density of solvent.
The swelling index (SI), which is a measure of the
swelling resistance of polymer composite, is calculated using
the equation22:
(8)
Figure 2(a) shows the NEC, Vrf, χ, and SI of phenolic
resin-NCB composites versus the NCB content. The aug-
mentation of NEC, can be ascribed to the NCB favors the
formation of an effective chains network across the matrix
and forms more links branches within the composite
network. Also, it is found that the Vrf increases with increas-
ing NCB content. This indicates that NCB is a better adhe-
sion and higher extent of interaction between NCB particles
and resin matrix. The relationship between SI and χ as a
function of NCB content is also presented in Figure 2(a). It
is seen that the SI decreases with increasing NCB content.
This indicates that the intermolecular distance decreases
with NCB loading level and the solvent uptake also
decreases. Furthermore, as loading increase the amount of
solvent absorbed by sample decreases which lead to
decrease in χ values and in turn increases the interaction
between filler and matrix. The polymer–filler interaction
parameter (m) is given by23:
(9)
where Vr0 the volume fraction of green phenolic vulcani-
zates. The value of m is calculated from the slope Vr0/Vrf
versus (f /1 - f), as example in Figure 2(b). It is seen that the
Vr0/Vrf decreases with increasing NCB content in the com-
posites. This behavior leads to a negative slope indicating
the reinforcement effect of NCB particles within resin com-
posites.13 It is interesting to note that the m values increase
with increasing NCB content into the composites as shown
in Figure 2(b). This fact supports that the inclusion of NCB
particles improves the molecular structure and increase the
excluded volume (i.e., the molecular connectivity) of the
composites.
Insulator – Conductor Transition. The resistivity (ρ), µ
and TEP of phenolic-NCB composites were determined in
Figure 3 as a function of the NCB weight fraction. Phenolic
resin is electrically nonconductive and has a bulk conductivity
about 10-15 (Ohm cm)-1 in dry state at room temperature.
The resistivity of composites increases with NCB content
into phenolic matrix and shows an S-shaped profile. When
the NCB particles are lowering dispersed into resin matrix,
fewer particles-particles can be formed, resulting in a lower
conductivity of the composites. The conductivity increases
much with increasing volume fraction of NCB particles.
This may be the dispersion of NCB grains and increase of
adhesion force between NCB and resin matrix. The more
Vrf
d fw0–( )ρp
1–
d fw0–( )ρp
1–Asρs
1–+
---------------------------------------------=
SI %( )As
w0 100×--------------------=
Vr0
Vrf
------- 1= mf
1 f–---------
⎝ ⎠⎛ ⎞–
Figure 2. (a) γ, η, S, NEC, Vrf, χ, and SI of phenolic resin com-
posites versus the NCB content and (b) variation of Vr0/Vrf and
with (f/1-f) of phenolic resin composites.

F. El-Tantawy et al.
198 Macromol. Res., Vol. 13, No. 3, 2005
extreme the links of the NCB particles-resin is, the larger its
excluded volume was. The larger the excluded volume is,
the higher the resistivity of the composites. In Figure 3 it is
seen that the µ increases with increasing NCB. This demon-
strates that the NCB particles promote charge carriers trans-
port between polymer chains by this means improve the
composites conductivity. Also, the charge carriers promote
to induce the interfacial force among NCB and resin matrix.
The percolation threshold in the composites is about
13 wt% of which is much smaller than that of conventional
conducting macro composites.1-3 This result is consistent with
non-universal conducting polymer composites.12 However,
the relation between composite conductivity (σm) and con-
ductivity of NCB content (σf) in the viciency of the critical
percolation threshold can be described by the following
equation24:
(10)
where fc is the onset conduction or percolation threshold
and N is a constant determining the power law-conductivity
behavior.
The calculated value of N for NCB-phenolic resin
composites is about 4.03. The high value of N indicates that
the non-universal transport behavior and conduction in the
composites have controlled by tunneling process.1-4 In Figure
3, it is clear that the TEP is a negative values and increases
with increasing NCB content in the composites up to the
percolation threshold and then slightly increased. The
negative values of TEP for NCB composites mean that the
conduction is controlled by electron. It is worthily that the
TEP above the fc was not depend on content of NCB
particles. This indicates that the conducting network by
NCB is formed at the loading level higher than the fc.
Negative Temperature Coefficient of Conductivity
(NTCσ) Thermistors. A more important feature of this kind
of conducting polymer composite is the negative tempe-
rature coefficient of the conductivity (NTCσ). Figure 4(a)
shows the variation of electrical conductivity (σ) of the
NCB-phenolic composite samples with temperature in the
range of room temperature to 150 oC. It is seen that as
temperature increases, the conductivity decreases first slowly,
and then at a switch temperature, falls abruptly decreases.
This is attributed to a lowered real NCB volume fraction
(i.e. a diluted NCB composition) due to the increase of
thermal volume expansion of the resin matrix as confirmed
by measured the relative thermal volume expansion V(T)/V0
and dilution volume fraction DVF(T) versus temperature as
shown in Figure 4(b). Additionally, we believe that with
increasing temperature the height of the energy barriers (φE)
increases along the grain boundary of the composites and
thereby the conductivity decreases. The energy barrier is
given by the equation6:
(11)
where Ns is the interface state density, Nd is the carrier
density in the composites, ε0 is the dielectric constant of
composite in vacuum, εr is the effective dielectric constant
of the composites in air and e is the electronic charge.
Figure 4(c) shows the variation of φB versus T of NCB-
resin composites. It seen that the φB of composites increased
with the increased T. A possible explanation is that with
increase of temperature the contact between conductive
particles, i.e., grain boundary area, increased. Thereat the
relative frequency of electrons scattering increases, and
their energy barrier increases, resulting in a decrease of
conductivity.
However, from σ-T curve, a temperature coefficient (ψ)
of NTCσ thermistor is defined as:
(12)
Also, the value of thermistor constant (B) for a practical
thermistor material can be found by measuring the resistiv-
ity at two values of absolute temperature T1 and T2 by using
the following equation14:
(13)
where ρ is the resistivity of NTC composites.
σm σf f fc–( )N=
φE
e2Ns
2
8ε0εrNd
------------------=
ψ∂ σlog
∂T----------------=
B 2.303T1T2
T2 T1–---------------
⎝ ⎠⎛ ⎞ TT1log ρT2log–( )=
Figure 3. The resistivity, µ and TEP of phenolic-NCB compos-
ites as a function of the NCB content.

New Functional Conductive Polymer Composites Containing Nickel Coated Carbon Black Reinforced Phenolic Resin
Macromol. Res., Vol. 13, No. 3, 2005 199
The predicted switch temperature (Ts) can be also
determined at a temperature as the following:
(14)
The dependence of ψ, B, and Ts on volume fraction of
NTC content in the composites is plotted in Figure 4(d). It is
clear that the Ts is shifts to a higher temperature with
increasing NCB content. Larger B and ψ values correspond
to higher thermal-electrical switch rates. Above Results
show that 20 to 50 v/v fraction of NCB loading makes the
resin composite a potential NTCσ thermistor material for
use in the electronics industry with high quality microstruc-
ture and good thermal stability.
Applicability of Conduction Mechanism to the Com-
posite Systems. According to the variable range hopping
theory, conductivity depends on temperature in the form:
(15)
where σ0 and Tc are constant and Y is a parameter which is
∂2
σlog
∂2T
-----------------⎝ ⎠⎛ ⎞
T Ts=
0=
σ T( ) σ0
Tc
T-----
⎝ ⎠⎛ ⎞–
Y
exp=
Figure 4. (a) Variation of σ of the NCB-phenolic composite samples with T in the range of room temperature to 150 oC, (b) variation of
relative thermal volume expansion V(T)/V0 and dilution volume fraction DVF(T) versus T of phenolic composites, (c) variation of φE ver-
sus T of NCB-resin composites, and (d) variation of ψ, B, Ts, α, Ea, and Eh on volume fraction of NTC content.

F. El-Tantawy et al.
200 Macromol. Res., Vol. 13, No. 3, 2005
related to the dimensionality by Y = 1/(ds + 1).
The conductivity data fits the straight line only when lnσ
values were plotted against T-1/4. This result supports that
the mechanism of conductivity is 3-dimentional tunneling
of electrons inside resin matrix.1-3 To confirm the above fact
we attempt to computed the activation energy (Ea) and
hoping energy (Eh) by using the following equations:
(16)
and
(17)
where σ1 and σ0 is the pre-exponential factor and K is the
Boltzmann constant.
The estimated values of Ea and Eh vs. NCB content are
recorded in Figure 4(d). It is seen that the values of Ea and
Eh are not the same for the composites. This indicates that
the conductivity is controlled by conduction mechanism of
the tunneling process as confirmed before.
Applicability of the Composites as Current Switching
and Plastic Welding. The current-voltage (I-V) characteristic
of NCB-phenolic composites is presented in Figure 5. From
the I -V characteristic it can be seen that at low applied
voltage there is no nonlinearity at all. At relatively higher
voltage there are nonlinear behaviors. This is attributed to
with increasing applied voltage, the electrical power dis-
sipation in the composite leads to rise in body temperature.
Thereby, a self-heating in the composite is due to the
localized thermal effects. It is to note that the I -V
characteristics for the NCB composites show the turn – on
current (i.e. current switching) at certain voltage depending
on NCB content. The observed difference in current switching
values is due to the variation of the microstructure and the
degree of crosslinking density of the composites.
The nonlinear behavior curve can be determined by using
the following formula15:
(18)
where I1 is the current at the voltage V1 and I2 is the cur-
rent at the voltage V2.
The estimated values of α as a function of NCB content
are plotted in Figure 4(d). The increase of α indicates that
these NCB improve the crosslinking density and molecular
texturing of the phenolic matrix.
For welding applications, it is well know that the welding
principle using conductive polymer composites, is usually
as films, is comparable with resistance welding like
electrofusion welding of thermoplastics.9 The conductive
composites used for the films are mostly the same as the
plastics to be welded. The welding procedure is the same as
electrofusion welding.10 The welding properties of the NCB
composites are listed in Table I. A close look to the data in
Table I, it is seen that the samples NCB10 and NCB20 have
a higher resistivity, welding voltage and time. While the
samples NCB30, NCB40, and NCB50 have low resistivity,
welding voltage and time. Therefore, we recommended using
the samples NCB40 and NCB50 as a welding material
because the welding voltage is absolutely safe and the
welding time is acceptable practically with good thermal
stability.
Applicability of the Composites as Temperature-Voltage
Controls. The study of the temperature–voltage characteristics
of the NCB composites thermistors and determination of the
optimum temperature are very important from the point of
view of producing reliable thermistor, in which a priori
knowledge of ultimate temperature to fix the upper limit of
applied potential within which the thermistors can be
operated safely without any performance degradation. The
σ σ1
Ea
KT-------–⎝ ⎠
⎛ ⎞exp=
σT
1
2---
σ0
Eh
KT-------
⎝ ⎠⎛ ⎞exp=
α
I2 I1⁄( )log
V2 V1⁄( )log--------------------------=
Figure 5. Current-voltage (I-V) characteristic of NCB-phenolic
composites.
Table I. The Welding Properties of NCB-phenolic Resin
Composites
Sample Code Welding Voltage (volt) Welding Time (sec)
NCB10 200 240
NCB20 120 180
NCB30 70 50
NCB40 40 21
NCB50 25 13

New Functional Conductive Polymer Composites Containing Nickel Coated Carbon Black Reinforced Phenolic Resin
Macromol. Res., Vol. 13, No. 3, 2005 201
dependence of temperature of composites on applied
voltage is shown in Figure 6. It is clear that the temperature
increase with increasing applied potential and strongly
depends on NCB content. The incorporation of NCB into
the resin matrix had increased the maximum temperature
level of phenolic resin composites. In other words, the
lower the composite resistance, the higher the heat-up rate
and the lower the voltage applied. We believe that with
increasing applied voltage, the electrical field dissipation in
the com-posite leads to a rise in body temperature. Thus a
self–heating phenomenon in the composites is due to the
localized thermal effects. A linear dependence of tempera-
ture on the applied voltage is observed for NCB contents up
to 20 wt% in the composites. The linear behavior of the
temperature as a function of the applied voltage demonstrates
their potential application for temperature controls.
Thermal Stability of the Composites. The durability of
the thermistors is evaluated by subjecting the thermistors to
the applied voltage cycles test. Figure 7(a) displays the
temperature-time curve in presence of an external applied
voltage of about 20 volt on and off for NCB10 and NCB50
sample. One can observe that there is no significant change
in the maximum temperature upon several cycles for NCB50
sample. While at low volume fraction of NCB, i.e., NCB10,
there is an increase of temperature with increasing cycle
order. The bulk temperature of the composites is increased
rapidly until dipping time 3 min, depending on NCB
content, after 3 min it reaches an equilibrium temperature.
But the bulk temperature at equilibrium of the composites is
increased with increasing NCB content. The results could
be explained by NCB particles forming more compact
cross-linking structures in the composites. Thus, the
composite at high loading had a thermal stability. However,
the tempera-ture-time curve in Figure 7(a) can be described
by the exponential growth relation5,6:
(19)
where Tm and T0 are the maximum and initial temperature
respectively and τg is the characteristics growth time con-
stant depends on NCB content and is calculated at tg= τ.
The estimated values of τg as a function of NCB content
T T0–( ) Tm To–( ) 1 t τg⁄( )–exp–( )=
Figure 6. Dependence of temperature of composites on applied
voltage.
Figure 7. (a) Temperature-time curve in presence of an external applied voltage of about 20 volt on and off for NCB10 and NCB50 sam-
ple and (b) Dependence of internal stress in NCB content of phenolic composites.

F. El-Tantawy et al.
202 Macromol. Res., Vol. 13, No. 3, 2005
are 17, 13, 10, 8, 6, and 3 min, respectively. This result
indicates that the inclusion of NCB particles into resin
matrix increases the cross-linking density and their thermal
stability as confirmed by estimated the internal stress of the
composites.
It was known that when the thermistor was cooled the
volume change and the network structure distortion would
occur. Thereby the internal stress (E) would produce in the
composites. The value of internal stress is derived from the
Young’s modulus (YMS) by the following equation20:
(20)
where P is the porosity and b is the material constant is
about 6 for our composites.6
The variation of internal stress in NCB content of phe-
nolic composites is plotted in Figure 7(b). It is found that
the internal stress increase with increasing NCB content.
This fact suggests that the NCB acting as a clamping force
and thermodynamically stabilizing agent within resin com-
posites as confirmed before.
Applicability of the Composites as Lightening Protec-
tion Materials. The energy of the composites as a function
of NCB content is plotted in Figure 8(a). It is clear that the
energy decreases with increasing NCB content. The values
of energy for NCB10 and NCB20 sample are quite
acceptable for lighting protection application.6,10 The
discharge voltage of NCB-phenolic resin composites as a
function of time is plotted in Figure 8(b). It is seen that, after
the time reached 10 s, the voltage of the composites tended
to level off with further increasing time. The data in Figure
9(b) can be described by the exponential decay equation as:
(21)
where Vm is the maximum voltage and τd is the exponen-
tial decay time constant and strongly depend on NCB con-
tent and is calculated at τd= t.
The computed values of τd as a function of NCB content
for phenolic composites are presented in Figure 8(a). It is
clearly that the values of τd for NCB10 and NCB20 sample
are quite acceptable for lighting protection (i.e. antistatic
charge dissipation). We recommended to use this NCB com-
posite at low loading level i.e. samples NCB10 and NCB20
as lighting protection (antistatic charge dissipation).
Applicability of the Composites as EMI Shielding
Effectiveness Materials. It is believed that the network
structure and interface adhesion were major factors contri-
buting to improved EMI shielding properties of the filler-
matrix composites. The performance of shielding composites
can be evaluated by comparing the EMI measurements by
theoretical equations as follows22-24:
(22)
where R and A are the shielding efficiency due to reflec-
tion and absorption respectively.
Each term is explicitly written as:
(23)
(24)
E YMS bP–( )exp=
V Vm–( ) Vm Vo–( ) 1 t τd⁄( )–exp–( )=
EMI dB( ) R A+=
R dB( ) 20=0.462
rµ
fσ-----
------------- 0.316rfiσ
µ------ 0.354+ +log
A dB( ) 3.34= 103–h fiµtσ×
Figure 8. (a) The energy and decay time constant of the composites as a function of NCB content and (b) The discharge voltage of the
composites as a function of time.
New Functional Conductive Polymer Composites Containing Nickel Coated Carbon Black Reinforced Phenolic Resin
Macromol. Res., Vol. 13, No. 3, 2005 203
where r is the distance from the emission source to the
shielding material, f i is the incident frequency, µ t is the mag-
netic permeability and h is the thickness of sample.
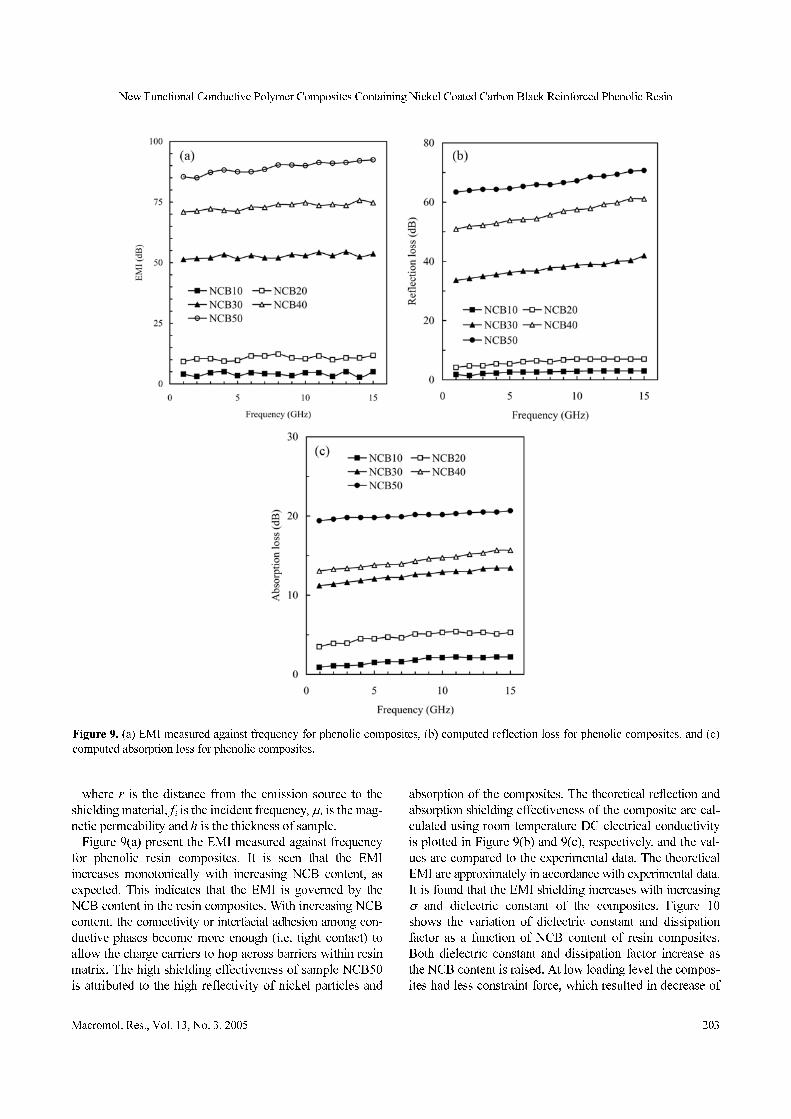
Figure 9(a) present the EMI measured against frequency
for phenolic resin composites. It is seen that the EMI
increases monotonically with increasing NCB content, as
expected. This indicates that the EMI is governed by the
NCB content in the resin composites. With increasing NCB
content, the connectivity or interfacial adhesion among con-
ductive phases become more enough (i.e. tight contact) to
allow the charge carriers to hop across barriers within resin
matrix. The high shielding effectiveness of sample NCB50
is attributed to the high reflectivity of nickel particles and
absorption of the composites. The theoretical reflection and
absorption shielding effectiveness of the composite are cal-
culated using room temperature DC electrical conductivity
is plotted in Figure 9(b) and 9(c), respectively, and the val-
ues are compared to the experimental data. The theoretical
EMI are approximately in accordance with experimental data.
It is found that the EMI shielding increases with increasing
σ and dielectric constant of the composites. Figure 10
shows the variation of dielectric constant and dissipation
factor as a function of NCB content of resin composites.
Both dielectric constant and dissipation factor increase as
the NCB content is raised. At low loading level the compos-
ites had less constraint force, which resulted in decrease of
Figure 9. (a) EMI measured against frequency for phenolic composites, (b) computed reflection loss for phenolic composites, and (c)
computed absorption loss for phenolic composites.

F. El-Tantawy et al.
204 Macromol. Res., Vol. 13, No. 3, 2005
the internal stress as confirmed in Figure 7(b). At the same
time, this was less bonding between individual chains into
the composites. As the NCB content is raised, the NCB par-
ticles get more tight contact and clusters of particles are
formed. The average interfacial polarization associated with
a cluster is larger than that of an individual particle, because
of the increase in the dimensions of the conducting NCB
inclusion. This leads to the increase of the charge carrier
density and the EMI shielding of the resin composites.
Mechanical Properties of the Composites. Figure 11
shows the dependence of the Young’s modules (YM), ten-
sile strength (TS), tear strength (TRS), hardness (HV) and
elongation at break (EBK) on NCB content for resin com-
posites. As expected, the variation of the mechanical prop-
erties depends on the amount of NCB in the composites. It
is clear that the YM, TS, and TRS, and HV increases with
increasing NCB loadings. This increase is primarily due to
the entanglement of the NCB particles in the network,
which reinforces the composites much more effectively.
Another possible reason is probably due to the strong inter-
facial strength between NCB particles and resin matrix.
This strong bonding between NCB and matrix increases the
load transfer from the resin matrix to NCB particles. The
increase of the tear strength originates from an increase in
the crystallinity and rigidity of the resin matrix with increas-
ing filler content as confirmed by viscosity result before. On
the other hand, the EBK decreases with increasing NCB
content. This is attributed to that with increasing NCB con-
tent the resin matrix become stiffer and harder. This leads to
decrease the composite resilience and toughness and thereby
the EBK decreases. The NCB composites exhibit as both
high performance and electrically conductive polymeric
material. Therefore, they show functional applications in
high temperature conducting adhesive, antistatic coatings,
electromagnetic shielding and bipolar plates of polymer
electrolyte membranes.
Conclusions
The development of conductive polymer composites
comes up a new avenue for the possible application of con-
ductive phenolic resin-NCB composites in a wide range of
industries including the negative temperature coefficient of
conductivity (NTCσ) thermistors, current switching, tem-
perature sensor, lightening protection, and electromagnetic
shielding effectiveness with thermal stability. The present
investigation can be summarized as follows:
1. The nickel coated carbon black particles show good
distribution, interface adhesion, and acting as a clamping
force within resin matrix.
2. The electrical conductivity of the composites decreases
with increasing temperature and behaves as negative
temperature coefficient of conductivity (NTCσ) thermistors.
The conductivity is controlled by the conduction mechanism
of tunneling process. The activation and hoping energies are
strongly depending on the NCB contents in the composites.
3. The current turn–on with voltage and the linear depen-
Figure 10. Dielectric constant and dissipation factor as a func-
tion of NCB content.Figure 11. Young’s modules (YM), tensile strength (TS), tear
strength (TRS), hardness (HV) and elongation at break (EBK) as
a function of NCB content.

New Functional Conductive Polymer Composites Containing Nickel Coated Carbon Black Reinforced Phenolic Resin
Macromol. Res., Vol. 13, No. 3, 2005 205
dence of the temperature on the voltage is a warranty that
these composites can be applied for current switching and
temperature controls. In addition, it is worthwhile to note
that for welding application, the welding voltage is abso-
lutely safe and the welding time is acceptable practically.
4. The EMI shielding effectiveness is governed by the
NCB particles in the resin matrix. The EMI at high loading
level reaching 95 dB and this value are higher than all val-
ues of the shielding effectiveness that have been previously
reported for conventional conducting polymer composites.
5. The mechanical properties increase with increasing
NCB loading level and are due to the entanglement of the
NCB in the structure, which reinforces the composites
much more effectively.
Acknowledgements. This work has been supported by
Suez Canal University and Dongguk University.
References
(1) F. El-Tantawy, K. Kamada, and H. Ohnabe, J. Appl. Polym.
Sci., 87, 97 (2003).
(2) F. El-Tantawy, Eur. Polym. J., 38, 567 (2002).
(3) F. El-Tantawy, K. Kameda, and H. Ohnebe, Polym. Inter., 51,
635 (2002).
(4) F. El-Tantawy, Eur. Polym. J., 37, 565 (2001).
(5) F. El-Tantawy, Proceedings of the 7th Japan International
SAMPE Symposium & Exhibition, Nov. 13-16, 797 (2001).
(6) F. El-Tantawy, and Y. K. Sung, Proceedings of the 25 Arab
School of Science & Technology, Damascus, Syria, August
28-3 September, 100 (2004).
(7) Y. K. Sung and F. El-Tantawy, Macromol. Res., 10, 67
(2002).
(8) Z. Jingvhang, L. Longtu, and G. Zhilum, Sensor. Actuat., A 5,
3108 (2001).
(9) B. O. Lee, W. J. Woo, and M. S. Kim, Macromol. Mater.
Eng., 286, 114 (2001).
(10) S. Y. Xiao, G. Wu, and Y. Pan, Polym. Int., 44,117 (1998).
(11) D. C. Hyung, W. S. Hwan, Y. C. Kwng, J. L. Hyuck, S. P.
Chan, and G. Y. Ho, J. Appl. Polym. Sci., 72, 75 (1999).
(12) R. Mihai, S. Nicoleta, and R. Daniela, Polym. Testing, 20,
409 (2001).
(13) J. L. Wan, J. K. Yong, and K. Shinyoung, Synth. Metal, 113,
237 (2001).
(14) Y. H. Chi and C. W. Chang, Eur. Polym. J., 36, 2729 (2000).
(15) N. C. Das, D. Khastgir, T. K. Chaki, and A. Chakraborty,
Composites, Part A, 31, 1069 (2000).
(16) H. S. Sack and M. C. Moriarity, Solid State Commun., 3, 93
(1995).
(17) S. Y. Xiao, S. Lie, and Y. Pan, Composites Sci. Tech., 61, 949
(2001).
(18) F. Cespeds, E. M. Fabregas, and A. Alegret, Anal. Chem., 15,
296 (1996).
(19) W. Jia, R. Tchoudakov, E. Segal, R. Joseph, M. Narkis, and
A. Siegmann, Synth. Metal, 132, 269 (2003).
(20) J. Fournier, G. Boiteux, G. Seytre, and G. Marichy, Synth.
Metal, 84, 839 (1996).
(21) S. Vishal, A. N. Tiwari, and A. R. Kulkarni, Mater. Sci. Eng.,
B 41, 310 (1996).
(22) G. J. Li, X. Huang, J. K. Guo, and D. M. Chen, Ceram. Inter.,
28, 623 (2002).
(23) G. Chen, W. Wang, D. Wu, and C. Wu, Eur. Polym. J., 39,
2329 (2003).
(24) M. Jacob, S. Thomas, and K. Varughese, Composites
Sci.Tech., 64, 955 (2004).