New FIJI Toolsets for Bioimage Analysis
1
New FIJI Toolsets for Bioimage Analysis Volker Bäcker ([email protected]) Introduction At the imaging facility Montpellier Ressources Imagerie (MRI) we provide the creation of custom image analysis and automation solutions on demand as a service. The biologist contacts us and we find a protocol that solves the image analysis problem. If the protocol can not be executed using existing software packages, we create the necessary tools based on FIJI. The protocol and the tools are evaluated in cooperation with the biologist, using data provided by him. Once the evaluation done, the biologist uses the provided tools by himself to solve the image analysis task. Some of the tools created in this context have been presented before, see: http://dev.mri.cnrs.fr/projects/imagejmacros/wiki Some of the tools like the Wound Healing Tool (Scratch Assay), theAdipocytes Tool and the Colony Blob Count Tool have been downloaded and used a large number of times with more than 23000 downloads for the Wound Healing Tool. Some of the tools recently created will be presented here. BISE: Bio Imaging Search Engine The Network of European BioImage Analysts (NEUBIAS Cost Action 15124) is a unique network, aiming at strengthening the bridge between life science, computer science and digital image processing. In the context of NEUBIAS we have created an online tool, the Bio Imaging Search Engine (BISE biii.eu). BISE allows to find image analysis workflows and seeks to provide a unification of views: problembased (e.g. “find nuclei in cells”), method based (e.g. “active contour based segmentation”) and tool based (e.g. “CellProfiler”). The image analysis toolsets developped at MRI are indexed in BISE. New Bioimage Analysis Toolsets In this section some examples of macro toolsets recently developed at MRI will be described. Spheroid Cell Invasion In 3D Matrix The tool allows to measure the area of the invading cancer cells in a 3D cell invasion assay. The image analysis is done on a time series of 2Dimages. MRI Fibrosis Tool The tool measures the relative area of sirius red stained fibrosis within a selection. It uses the colour deconvolution plugin from Gabriel Landini. The tool can be used for different stainings, by adapting the colour vector for the colour deconvolution. Intensity Ratio Nuclei Cytoplasm Tool The tool calculates the ratio of the intensity in the nuclei and the cytoplasm. It needs two images as input: the cytoplasm channel and the nuclei channel. The nuclei channel is used to segment the nuclei. The measurements are made in the cytoplasm channel, after the background intensity has been corrected. MRI Retina Tool The aim of the tool is to measure the thickness of retinal layers. The input images are from in vivo imaging of the mouse retina with highresolution spectral domain optical coherence tomography. By default the thickness of the the retinal nerve fiber layer together with the ganglion cell layer (RNFL/GCL) is measured. At each given xposition of the layer, a profile plot is created. The first maximum, ntimes the standard deviation above the background level is detected. A minimum to the right of this maximum, that is at least mtimes the standard deviation below the maximum, is detected. A horizontal line from this point to the left is drawn and the point where it crosses the plot found. The length of this line segment is considered the thickness of the layer at the given xposition. Jagodzinska, J., Sarzi, E., Cavalier, M., Seveno, M., Baecker, V., Hamel, C., Péquignot, M., and Delettre, C. (2017). Optical Coherence Tomography: Imaging Mouse Retinal Ganglion Cells In Vivo. Journal of Visualized Experiments. Cochlea Hair Cell Counting The cochlea is the auditory organ of the inner ear, containing inner and outer sensory hair cells, organized in respectively one and three rows inside the organ of Corti. The tool allows to count the outer hair cells in sections of 200µm from the apex of the cochlear to its base. It needs two types of input images: the 3d stack of the hair cells and a binary mask created from this stack by using the spot detection algorithm of Imaris (Bitplane). The tool allows to make a projections of the two kinds of input images in batch mode. The operator then traces the cochlear on the projection of the cells image. Both images are straightened and an overlay is displayed. The operator can manually correct the image using the overlay. The cells are then automatically counted in sections of a given length. Saleur, A., Baecker, V., DyhrfjeldJohnsen, J., poster: AUTOMATED CELL COUNTING IN COCHLEAR HISTOLOGICAL SAMPLES, 53. Workshop Inner Ear Biology, Montpellier, 2016
Transcript of New FIJI Toolsets for Bioimage Analysis
New FIJI Toolsets for Bioimage AnalysisVolker Bäcker ([email protected])
IntroductionAt the imaging facility Montpellier Ressources Imagerie
(MRI) we provide the creation of custom image analysis and
automation solutions on demand as a service. The biologist
contacts us and we find a protocol that solves the image
analysis problem. If the protocol can not be executed using
existing software packages, we create the necessary tools
based on FIJI. The protocol and the tools are evaluated in
cooperation with the biologist, using data provided by him.
Once the evaluation done, the biologist uses the provided
tools by himself to solve the image analysis task.
Some of the tools created in this context have been
presented before, see:
http://dev.mri.cnrs.fr/projects/imagejmacros/wiki
Some of the tools like the Wound Healing Tool (Scratch
Assay), the Adipocytes Tool and the Colony Blob Count Tool
have been downloaded and used a large number of times
with more than 23000 downloads for the Wound Healing
Tool. Some of the tools recently created will be presented
here.
BISE: Bio Imaging Search EngineThe Network of European BioImage Analysts (NEUBIAS
Cost Action 15124) is a unique network, aiming at
strengthening the bridge between life science, computer
science and digital image processing. In the context of
NEUBIAS we have created an online tool, the Bio Imaging
Search Engine (BISE biii.eu). BISE allows to find image
analysis workflows and seeks to provide a unification of
views: problembased (e.g. “find nuclei in cells”), method
based (e.g. “active contour based segmentation”) and tool
based (e.g. “CellProfiler”). The image analysis toolsets
developped at MRI are indexed in BISE.
New Bioimage Analysis ToolsetsIn this section some examples of macro toolsets recently
developed at MRI will be described.
Spheroid Cell Invasion In 3D Matrix
The tool allows to measure the area of the invading cancer
cells in a 3D cell invasion assay. The image analysis is done
on a time series of 2Dimages.
MRI Fibrosis Tool
The tool measures the relative area of sirius red stained
fibrosis within a selection. It uses the colour deconvolution
plugin from Gabriel Landini. The tool can be used for
different stainings, by adapting the colour vector for the
colour deconvolution.
Intensity Ratio Nuclei Cytoplasm Tool
The tool calculates the ratio of the intensity in the nuclei and
the cytoplasm. It needs two images as input: the cytoplasm
channel and the nuclei channel. The nuclei channel is used
to segment the nuclei. The measurements are made in the
cytoplasm channel, after the background intensity has been
corrected.
MRI Retina Tool
The aim of the tool is to measure the thickness of retinal
layers. The input images are from in vivo imaging of the
mouse retina with highresolution spectral domain optical
coherence tomography. By default the thickness of the the
retinal nerve fiber layer together with the ganglion cell layer
(RNFL/GCL) is measured.
At each given xposition of the layer, a profile plot is
created. The first maximum, ntimes the standard deviation
above the background level is detected. A minimum to the
right of this maximum, that is at least mtimes the standard
deviation below the maximum, is detected. A horizontal line
from this point to the left is drawn and the point where it
crosses the plot found. The length of this line segment is
considered the thickness of the layer at the given xposition.
Jagodzinska, J., Sarzi, E., Cavalier, M., Seveno, M.,
Baecker, V., Hamel, C., Péquignot, M., and Delettre, C.
(2017). Optical Coherence Tomography: Imaging Mouse
Retinal Ganglion Cells In Vivo. Journal of Visualized
Experiments.
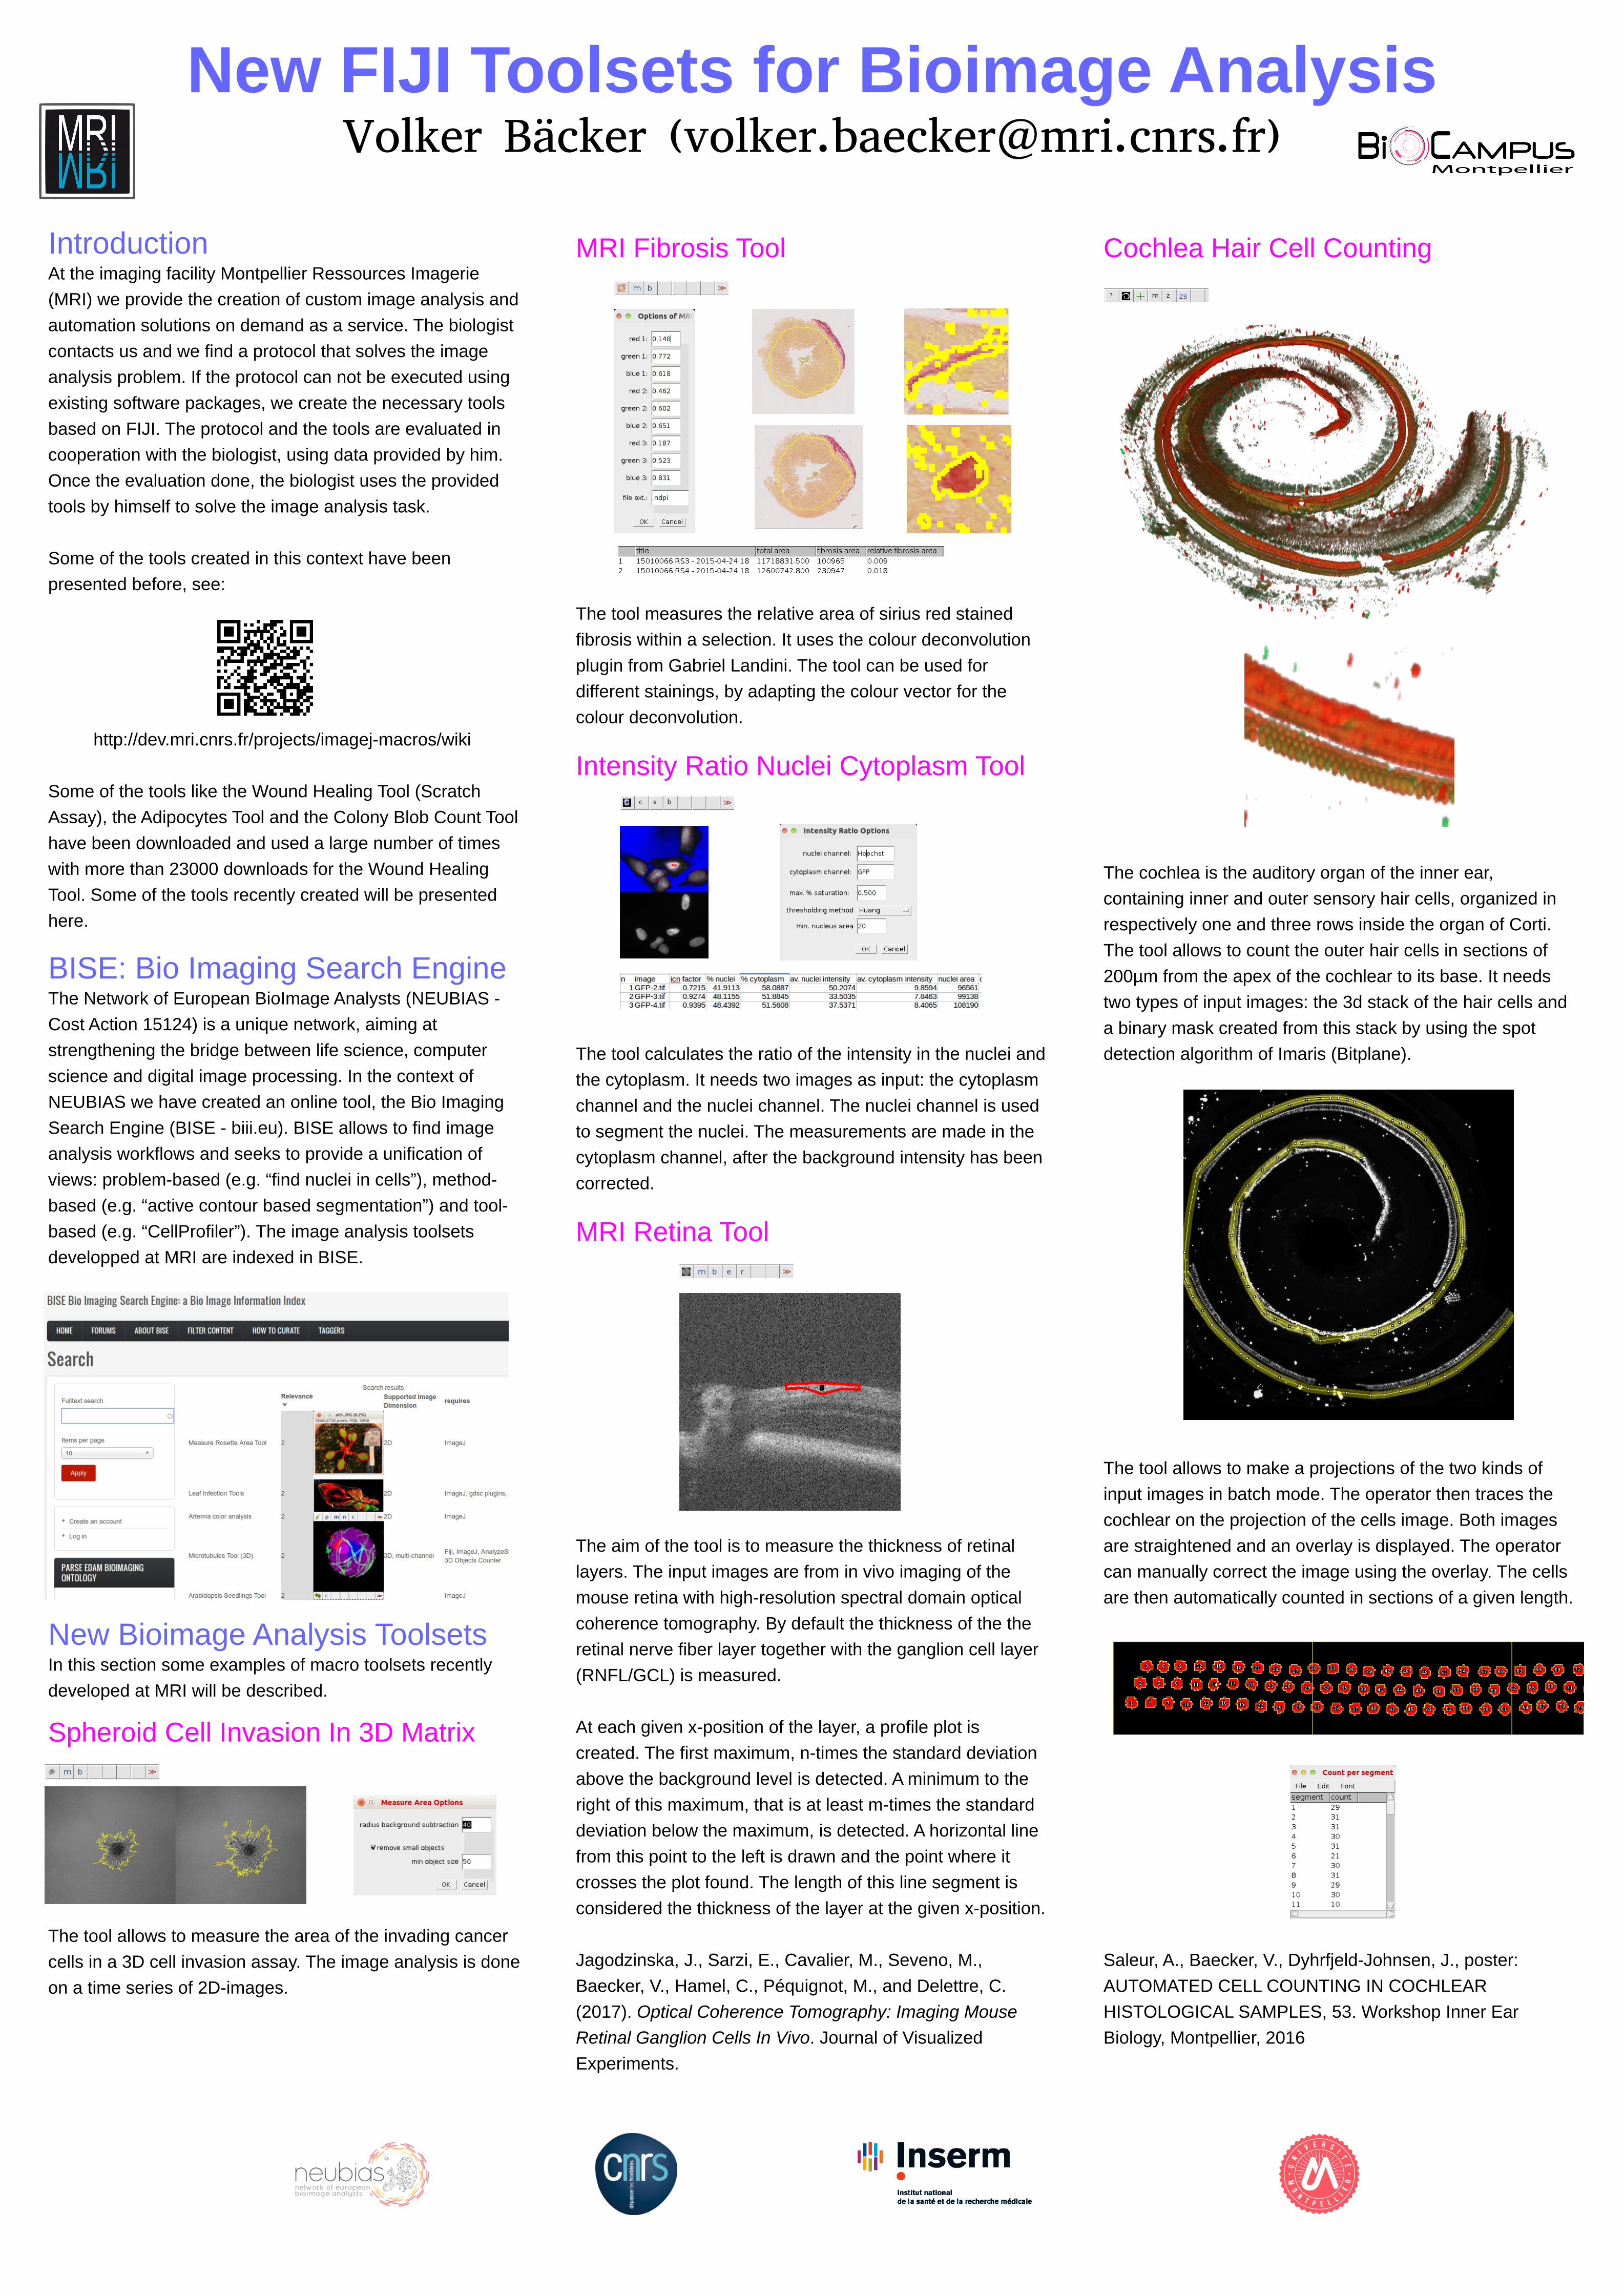
Cochlea Hair Cell Counting
The cochlea is the auditory organ of the inner ear,
containing inner and outer sensory hair cells, organized in
respectively one and three rows inside the organ of Corti.
The tool allows to count the outer hair cells in sections of
200µm from the apex of the cochlear to its base. It needs
two types of input images: the 3d stack of the hair cells and
a binary mask created from this stack by using the spot
detection algorithm of Imaris (Bitplane).
The tool allows to make a projections of the two kinds of
input images in batch mode. The operator then traces the
cochlear on the projection of the cells image. Both images
are straightened and an overlay is displayed. The operator
can manually correct the image using the overlay. The cells
are then automatically counted in sections of a given length.
Saleur, A., Baecker, V., DyhrfjeldJohnsen, J., poster:
AUTOMATED CELL COUNTING IN COCHLEAR
HISTOLOGICAL SAMPLES, 53. Workshop Inner Ear
Biology, Montpellier, 2016