New England Vegetable Report - USDA
12
New England Vegetable Report NATIONAL AGRICULTURAL STATISTICS SERVICE United States Department of Agriculture Washington, D.C. 20250 New England Field Office Concord, NH 03301-9902 53 Pleasant Street, Room 3450 www.nass.usda.gov For Immediate Release Contact: Pam Hird February 11, 2021 (202) 615-9845 We are pleased to present the New England Vegetable Report for crops produced in 2020. USDA’s National Agricultural Statistics Service (NASS), Northeast Regional Field Office collects, analyzes, and estimates vegetable prices and yields at the request of USDA Farm Service Agency (FSA). Funding was provided by the State Departments of Agriculture in Connecticut, Maine, Massachusetts, New Hampshire, Rhode Island, and Vermont. This data series provides a valuable tool for growers to use in making production and marketing decisions and for FSA to administer farm programs based on State yield and price data. It is also used by Cooperative Extension to provide outreach and education, as well as for the State Departments of Agriculture to assist growers. Over 2,000 vegetable producer responses were tabulated for this publication. Producers in the six State region were asked to provide acreage, production, and price information for vegetable crops. This publication compiles New England vegetable data from 2016 through 2020 into one report. Since total acreage data are not available for most vegetable crops, data from the 2017 Census of Agriculture are also included. Published prices and yields do not distinguish between organically and conventionally grown products. The success of this project is credited to the cooperation of growers across New England. We sincerely appreciate their time and effort in supplying crop information. As with all NASS surveys, individual grower information is kept strictly confidential and is exempted from requests under the Freedom of Information Act. The individual reports were used only in combination with other reports to establish State and regional estimates. Estimates in this report that could disclose individual farm data were recorded as a “(D)”. Fresh Market Vegetables: Yield and Price, 2016 – 2020 Asparagus Reports 1 Yield per Acre 2 Reports 3 All Price per Pound 4 Asparagus Reports 1 Yield per Acre 2 Reports 3 All Price per Pound 4 Number Pounds Number Dollars Number Pounds Number Dollars Connecticut New Hampshire 2016 1,400 3.05 2016 1,600 2.75 2017 800 3.50 2017 1,100 3.85 2018 1,500 5.00 2018 1,100 2.90 2019 1,300 3.95 2019 1,200 2.60 2020 1,300 (D) 2020 (D) (D) Maine Rhode Island 2016 1,200 3.95 2016 900 4.75 2017 1,300 3.60 2017 (D) (D) 2018 1,300 5.30 2018 (D) (D) 2019 1,200 3.85 2019 (D) (D) 2020 1,200 5.35 2020 (D) (D) Massachusetts Vermont 2016 1,400 3.45 2016 1,400 5.30 2017 1,300 3.85 2017 1,400 4.50 2018 1,400 4.35 2018 1,300 4.35 2019 500 4.50 2019 1,300 4.75 2020 1,700 3.45 2020 1,200 4.10 New England 2016 1,400 3.50 2017 1,400 3.40 2018 1,400 4.35 2019 900 3.90 2020 1,500 4.00 See footnotes at end of table on page 10. NASS is the federal statistical agency responsible for producing official data about U.S. agriculture and is committed to providing timely, accurate and useful statistics in service to U.S. agriculture. USDA is an equal opportunity provider, employer and lender. To file a complaint of discrimination, write to USDA, Assistant Secretary for Civil Rights, Office of the Assistant Secretary for Civil Rights, 1400 Independence Avenue, S.W., Stop 9410, Washington, DC 20250-9410, or call toll-free at (866) 632-9992 (English) or (800) 877-8339 (TDD) or (866) 377-8642 (English Federal-relay) or (800) 845-6136 (Spanish Federal-relay). New England Vegetable Report, 2020 Crop
Transcript of New England Vegetable Report - USDA

New England Vegetable Report NATIONAL AGRICULTURAL STATISTICS SERVICE
United States Department of Agriculture Washington, D.C. 20250 New England Field Office Concord, NH 03301-9902 53 Pleasant Street, Room 3450 www.nass.usda.gov
For Immediate Release Contact: Pam Hird February 11, 2021 (202) 615-9845
We are pleased to present the New England Vegetable Report
for crops produced in 2020. USDA’s National Agricultural
Statistics Service (NASS), Northeast Regional Field Office
collects, analyzes, and estimates vegetable prices and yields at the
request of USDA Farm Service Agency (FSA). Funding was
provided by the State Departments of Agriculture in Connecticut,
Maine, Massachusetts, New Hampshire, Rhode Island, and
Vermont. This data series provides a valuable tool for growers to
use in making production and marketing decisions and for FSA to
administer farm programs based on State yield and price data. It
is also used by Cooperative Extension to provide outreach and
education, as well as for the State Departments of Agriculture to
assist growers.
Over 2,000 vegetable producer responses were tabulated for this
publication. Producers in the six State region were asked to
provide acreage, production, and price information for vegetable
crops.
This publication compiles New England vegetable data from
2016 through 2020 into one report. Since total acreage data are
not available for most vegetable crops, data from the 2017
Census of Agriculture are also included. Published prices and
yields do not distinguish between organically and
conventionally grown products.
The success of this project is credited to the cooperation of
growers across New England. We sincerely appreciate their
time and effort in supplying crop information. As with all
NASS surveys, individual grower information is kept strictly
confidential and is exempted from requests under the Freedom
of Information Act. The individual reports were used only in
combination with other reports to establish State and regional
estimates. Estimates in this report that could disclose individual
farm data were recorded as a “(D)”.
Fresh Market Vegetables: Yield and Price, 2016 – 2020
Asparagus Reports 1 Yield
per Acre 2 Reports 3
All Price per Pound 4
Asparagus Reports 1 Yield
per Acre 2 Reports 3
All Price per Pound 4
Number Pounds Number Dollars Number Pounds Number Dollars Connecticut New Hampshire 2016 1,400 3.05 2016 1,600 2.75 2017 800 3.50 2017 1,100 3.85 2018 1,500 5.00 2018 1,100 2.90 2019 1,300 3.95 2019 1,200 2.60 2020 1,300 (D) 2020 (D) (D) Maine Rhode Island 2016 1,200 3.95 2016 900 4.75 2017 1,300 3.60 2017 (D) (D) 2018 1,300 5.30 2018 (D) (D) 2019 1,200 3.85 2019 (D) (D) 2020 1,200 5.35 2020 (D) (D) Massachusetts Vermont 2016 1,400 3.45 2016 1,400 5.30 2017 1,300 3.85 2017 1,400 4.50 2018 1,400 4.35 2018 1,300 4.35 2019 500 4.50 2019 1,300 4.75 2020 1,700 3.45 2020 1,200 4.10 New England 2016 1,400 3.50 2017 1,400 3.40 2018 1,400 4.35 2019 900 3.90
2020 1,500 4.00
See footnotes at end of table on page 10.
NASS is the federal statistical agency responsible for producing official data about U.S. agriculture and is committed to providing timely, accurate and useful statistics in service to U.S. agriculture. USDA is an equal opportunity provider, employer and lender. To file a complaint of discrimination, write to USDA, Assistant Secretary for Civil Rights, Office of the Assistant Secretary for Civil Rights, 1400 Independence Avenue, S.W., Stop 9410, Washington, DC 20250-9410, or call toll-free at (866) 632-9992 (English) or (800) 877-8339 (TDD) or (866) 377-8642 (English Federal-relay) or (800) 845-6136 (Spanish Federal-relay).
New England Vegetable Report, 2020 Crop

2 – New England Vegetable Report USDA, NASS, New England Field Office
Fresh Market Vegetables: Yield and Price, 2016 – 2020 Beans, Snap (Bush and Pole)
Reports 1 Yield
per Acre 2 Reports 3
All Price per Pound 4
Beans, Snap (Bush and Pole)
Reports 1 Yield
per Acre 2 Reports 3
All Price per Pound 4
Number Pounds Number Dollars Number Pounds Number Dollars Connecticut New Hampshire 2016 4,200 1.40 2016 3,800 1.90 2017 3,900 1.30 2017 3,200 1.60 2018 2,500 1.10 2018 1,800 3.10 2019 2,000 2.50 2019 2,700 1.70 2020 2,600 2.15 2020 3,000 1.90 Maine Rhode Island 2016 2,900 1.20 2016 (D) (D) 2017 3,600 1.60 2017 3,400 (D) 2018 2,800 1.55 2018 (D) (D) 2019 2,800 1.70 2019 (D) (D) 2020 2,200 1.65 2020 (D) (D) Massachusetts Vermont 2016 2,400 1.70 2016 3,500 2.80 2017 3,000 1.85 2017 2,800 2.75 2018 3,900 2.80 2018 3,300 2.30 2019 2,400 2.25 2019 3,200 3.25 2020 2,800 2.80 2020 1,900 3.25 New England 2016 3,400 1.45 2017 3,600 1.50 2018 2,900 1.85 2019 2,300 2.25
2020 2,600 2.20
Beets Reports 1 Yield
per Acre 2 Reports 3
All Price per Pound 4
Beets Reports 1 Yield
per Acre 2 Reports 3
All Price per Pound 4
Connecticut New Hampshire 2016 7,000 1.55 2016 6,900 1.55 2017 7,000 1.95 2017 4,900 1.85 2018 4,400 1.95 2018 10,700 1.65 2019 6,000 1.35 2019 5,900 1.70 2020 7,300 1.40 2020 7,900 1.80 Maine Rhode Island 2016 4,700 1.05 2016 (D) (D) 2017 7,000 1.00 2017 (D) (D) 2018 10,700 0.90 2018 (D) (D) 2019 11,200 0.90 2019 (D) (D) 2020 3,800 2.25 2020 (D) (D) Massachusetts Vermont 2016 5,400 1.40 2016 11,400 1.20 2017 7,800 1.25 2017 10,500 1.05 2018 5,000 1.30 2018 11,600 1.20 2019 4,600 1.35 2019 6,800 1.30 2020 6,100 1.35 2020 6,300 1.20 New England 2016 6,200 1.30 2017 7,300 1.20 2018 8,800 1.10 2019 8,100 1.10
2020 5,300 1.70
Broccoli Reports 1 Yield
per Acre 2 Reports 3
All Price per Pound 4
Broccoli Reports 1 Yield
per Acre 2 Reports 3
All Price per Pound 4
Connecticut New Hampshire 2016 2,500 1.60 2016 4,300 2.40 2017 2,000 1.45 2017 2,800 1.45 2018 1,700 1.25 2018 2,500 2.20 2019 1,400 2.40 2019 (D) (D) 2020 2,600 1.60 2020 5,300 (D) Maine Rhode Island 2016 (D) (D) 2016 (D) (D) 2017 (D) (D) 2017 (D) (D) 2018 (D) (D) 2018 (D) (D) 2019 (D) (D) 2019 (D) (D) 2020 (D) (D) 2020 (D) (D) Massachusetts Vermont 2016 1,400 2.05 2016 5,300 1.05 2017 4,200 2.20 2017 6,700 1.70 2018 3,100 2.35 2018 3,300 2.10 2019 2,700 2.40 2019 3,100 1.70 2020 (D) (D) 2020 2,600 1.90 New England 2016 (D) (D) 2017 (D) (D) 2018 (D) (D) 2019 (D) (D)
2020 (D) (D)
See footnotes at end of table on page 10.

USDA, NASS, New England Field Office New England Vegetable Report – 3
Fresh Market Vegetables: Yield and Price, 2016 – 2020
Cabbage (All) Reports 1 Yield
per Acre 2 Reports 3
All Price per Pound 4
Cabbage (All) Reports 1 Yield
per Acre 2 Reports 3
All Price per Pound 4
Number Pounds Number Dollars Number Pounds Number Dollars Connecticut New Hampshire 2016 20,900 0.20 2016 7,400 0.95 2017 26,100 0.25 2017 9,400 0.80 2018 11,700 0.60 2018 8,400 0.85 2019 5,000 0.45 2019 6,500 0.70 2020 6,400 0.55 2020 11,100 (D) Maine Rhode Island 2016 12,900 0.65 2016 (D) (D) 2017 9,400 0.65 2017 13,200 (D) 2018 10,100 0.50 2018 (D) (D) 2019 17,000 0.50 2019 (D) (D) 2020 9,700 0.80 2020 (D) (D) Massachusetts Vermont 2016 12,300 0.40 2016 17,100 0.60 2017 17,300 0.35 2017 16,100 0.60 2018 12,000 0.45 2018 13,800 0.60 2019 16,500 0.45 2019 19,000 0.45 2020 18,800 0.45 2020 14,000 0.50 New England 2016 13,900 0.45 2017 17,000 0.40 2018 11,800 0.50 2019 13,600 0.45
2020 13,200 0.50
Cantaloupe and Muskmelon
Reports 1 Yield
per Acre 2 Reports 3
All Price per Pound 4
Cantaloupe and Muskmelon
Reports 1 Yield
per Acre 2 Reports 3
All Price per Pound 4
Connecticut New Hampshire 2016 10,500 0.70 2016 3,900 1.00 2017 8,000 0.80 2017 4,000 (D) 2018 9,300 0.65 2018 7,600 1.10 2019 9,100 0.90 2019 13,100 0.95 2020 9,700 0.70 2020 5,900 1.05 Maine Rhode Island 2016 8,200 0.80 2016 (D) (D) 2017 8,200 1.00 2017 7,100 (D) 2018 5,900 0.75 2018 (D) (D) 2019 12,700 0.55 2019 (D) (D) 2020 5,900 1.00 2020 (D) (D) Massachusetts Vermont 2016 11,200 0.70 2016 6,400 1.00 2017 6,600 1.00 2017 9,000 1.75 2018 7,100 1.10 2018 11,000 1.00 2019 7,800 0.90 2019 13,500 1.20 2020 8,700 0.60 2020 8,000 1.10 New England 2016 8,000 0.80 2017 7,000 1.00 2018 8,000 0.90 2019 10,400 0.90
2020 7,900 0.80
Carrots Reports 1 Yield
per Acre 2 Reports 3
All Price per Pound 4
Carrots Reports 1 Yield
per Acre 2 Reports 3
All Price per Pound 4
Connecticut New Hampshire 2016 6,300 1.60 2016 13,500 2.10 2017 8,700 2.90 2017 6,600 1.90 2018 5,300 2.45 2018 15,500 1.45 2019 4,900 2.80 2019 9,500 2.65 2020 11,900 1.80 2020 13,500 2.10 Maine Rhode Island 2016 10,600 1.50 2016 (D) (D) 2017 6,000 1.60 2017 (D) (D) 2018 8,700 1.40 2018 (D) (D) 2019 16,200 1.45 2019 (D) (D) 2020 11,500 1.80 2020 (D) (D) Massachusetts Vermont 2016 12,300 2.10 2016 18,000 0.80 2017 10,000 1.50 2017 15,900 1.15 2018 13,300 2.35 2018 16,900 1.10 2019 9,200 2.15 2019 12,100 1.30 2020 8,100 2.25 2020 11,200 1.25 New England 2016 13,400 1.50 2017 9,200 1.55 2018 11,400 1.75 2019 11,000 1.80
2020 10,600 1.80
See footnotes at end of table on page 10.

4 – New England Vegetable Report USDA, NASS, New England Field Office
Fresh Market Vegetables: Yield and Price, 2016 – 2020
Cauliflower Reports 1 Yield
per Acre 2 Reports 3
All Price per Pound 4
Cauliflower Reports 1 Yield
per Acre 2 Reports 3
All Price per Pound 4
Number Pounds Number Dollars Number Pounds Number Dollars Connecticut New Hampshire 2016 6,600 (D) 2016 (D) (D) 2017 10,000 1.10 2017 12,500 (D) 2018 3,300 1.50 2018 7,500 2.25 2019 8,300 1.25 2019 2,400 2.35 2020 3,900 1.45 2020 (D) (D) Maine Rhode Island 2016 3,100 2.70 2016 (D) (D) 2017 2,400 2.45 2017 (D) (D) 2018 2,300 2.60 2018 (D) (D) 2019 2,500 1.85 2019 (D) (D) 2020 1,900 2.55 2020 (D) (D) Massachusetts Vermont 2016 7,100 1.60 2016 4,400 2.40 2017 5,600 1.30 2017 5,000 1.45 2018 2,500 2.40 2018 6,200 (D) 2019 4,900 1.25 2019 4,000 2.60 2020 (D) (D) 2020 4,400 1.55 New England 2016 7,200 2.00 2017 4,700 1.60 2018 2,700 2.45 2019 3,300 1.65
2020 3,200 1.85
Cucumbers (Excludes Pickles)
Reports 1 Yield
per Acre 2 Reports 3
All Price per Pound 4
Cucumbers (Excludes Pickles)
Reports 1 Yield
per Acre 2 Reports 3
All Price per Pound 4
Connecticut New Hampshire 2016 (D) (D) 2016 9,250 1.10 2017 11,600 1.00 2017 9,800 0.85 2018 6,000 1.00 2018 10,400 1.30 2019 6,400 1.20 2019 14,300 0.80 2020 7,600 1.05 2020 16,700 (D) Maine Rhode Island 2016 6,000 1.05 2016 (D) (D) 2017 9,300 1.10 2017 8,100 (D) 2018 5,900 1.00 2018 10,500 0.95 2019 10,500 0.95 2019 5,000 0.80 2020 9,200 0.90 2020 6,800 0.90 Massachusetts Vermont 2016 9,000 1.25 2016 11,500 1.25 2017 9,600 1.05 2017 11,700 1.20 2018 4,800 1.05 2018 12,400 1.20 2019 14,400 0.95 2019 11,600 1.00 2020 9,400 0.85 2020 11,600 1.00 New England 2016 10,300 1.00 2017 10,000 1.00 2018 6,900 1.10 2019 11,100 0.95
2020 10,000 0.90
Eggplant Reports 1 Yield
per Acre 2 Reports 3
All Price per Pound 4
Eggplant Reports 1 Yield
per Acre 2 Reports 3
All Price per Pound 4
Connecticut New Hampshire 2016 8,000 0.40 2016 7,700 1.75 2017 12,200 0.60 2017 7,700 1.45 2018 8,000 0.80 2018 7,500 1.95 2019 5,800 1.55 2019 6,500 1.95 2020 7,200 0.95 2020 6,300 2.10 Maine Rhode Island 2016 (D) (D) 2016 2,700 0.70 2017 6,500 1.80 2017 (D) (D) 2018 5,300 2.30 2018 8,400 1.75 2019 6,800 2.25 2019 5,200 1.90 2020 5,500 2.10 2020 (D) (D) Massachusetts Vermont 2016 10,300 0.75 2016 7,800 2.60 2017 11,400 0.95 2017 8,500 1.70 2018 8,100 1.10 2018 8,900 2.10 2019 7,300 1.65 2019 8,800 1.35 2020 11,400 1.60 2020 4,000 3.00 New England 2016 8,150 0.80 2017 11,200 0.80 2018 7,900 1.25 2019 6.500 1.70
2020 7,800 1.45
See footnotes at end of table on page 10.

USDA, NASS, New England Field Office New England Vegetable Report – 5
Fresh Market Vegetables: Yield and Price, 2016 – 2020
Garlic Reports 1 Yield
per Acre 2 Reports 3
All Price per Pound 4
Garlic Reports 1 Yield
per Acre 2 Reports 3
All Price per Pound 4
Number Pounds Number Dollars Number Pounds Number Dollars Connecticut New Hampshire 2016 2,200 8.25 2016 3,300 5.90 2017 2,000 7.85 2017 2,100 5.50 2018 1,300 7.75 2018 1,300 6.85 2019 1,200 10.30 2019 1,000 10.95 2020 1,500 8.65 2020 2,400 (D) Maine Rhode Island 2016 3,300 7.15 2016 (D) (D) 2017 1,700 7.90 2017 2,000 (D) 2018 1,800 6.30 2018 (D) (D) 2019 1,400 7.95 2019 (D) (D) 2020 1,900 9.75 2020 (D) (D) Massachusetts Vermont 2016 2,500 8.65 2016 2,300 7.60 2017 2,000 6.50 2017 2,500 8.50 2018 3,000 5.50 2018 2,200 9.20 2019 1,500 9.35 2019 1,500 10.50 2020 2,300 10.15 2020 2,900 11.00 New England 2016 2,500 7.85 2017 2,100 7.10 2018 2,300 6.85 2019 1,400 9.40 2020 2,300 10.15
Kale Reports 1 Yield
per Acre 2 Reports 3
All Price per Pound 4
Kale Reports 1 Yield
per Acre 2 Reports 3
All Price per Pound 4
Connecticut New Hampshire 2016 11,100 0.75 2016 10,900 2.50 2017 10,800 1.40 2017 10,500 2.10 2018 3,700 1.20 2018 5,600 2.75 2019 2,700 2.00 2019 3,600 3.95 2020 6,000 1.80 2020 6,100 2.50 Maine Rhode Island 2016 2,900 3.25 2016 (D) (D) 2017 6,700 2.15 2017 (D) (D) 2018 5,800 2.75 2018 (D) (D) 2019 4,200 3.10 2019 (D) (D) 2020 3,700 2.75 2020 (D) (D) Massachusetts Vermont 2016 9,800 1.05 2016 20,400 1.15
2017 16,900 0.90 2017 6,500 1.45 2018 16,000 (D) 2018 12,400 1.30 2019 12,600 0.90 2019 15,300 1.20 2020 9,600 0.95 2020 8,500 1.40 New England 2016 12,750 1.20 2017 12,900 1.10 2018 12,000 0.95 2019 10,000 1.15 2020 8,100 1.25
See footnotes at end of table on page 10.

6 – New England Vegetable Report USDA, NASS, New England Field Office
Fresh Market Vegetables: Yield and Price, 2016 – 2020
Lettuce, Head Reports 1 Yield
per Acre 2 Reports 3
All Price per Pound 4
Lettuce, Head Reports 1 Yield
per Acre 2 Reports 3
All Price per Pound 4
Number Pounds Number Dollars Number Pounds Number Dollars Connecticut New Hampshire 2016 5,800 3.40 2016 (D) (D) 2017 7,500 2.40 2017 11,200 1.95 2018 5,000 1.70 2018 11,900 1.60 2019 3,100 1.90 2019 6,600 2.30 2020 9,100 1.65 2020 6,900 2.95 Maine Rhode Island 2016 4,800 2.00 2016 (D) (D) 2017 7,100 2.00 2017 (D) (D) 2018 7,000 2.60 2018 (D) (D) 2019 5,600 2.35 2019 (D) (D) 2020 3,700 2.55 2020 (D) (D) Massachusetts Vermont 2016 11,600 1.90 2016 9,900 (D) 2017 9,700 1.90 2017 8,400 1.50 2018 10,600 1.75 2018 5,000 2.50 2019 6,000 3.00 2019 8,200 1.60 2020 10,800 1.85 2020 10,300 1.45 New England 2016 10,500 1.80 2017 9,300 1.90 2018 8,400 1.95 2019 5,900 2.40
2020 8,500 1.90
Lettuce, Leaf Reports 1 Yield
per Acre 2 Reports 3
All Price per Pound 4
Lettuce, Leaf Reports 1 Yield
per Acre 2 Reports 3
All Price per Pound 4
Connecticut New Hampshire 2016 (D) (D) 2016 7,800 1.75 2017 9,300 3.30 2017 8,400 1.75 2018 3,700 (D) 2018 4,100 3.15 2019 4,500 2.20 2019 3,900 6.70 2020 6,100 1.75 2020 6,400 3.60 Maine Rhode Island 2016 9,000 4.15 2016 (D) (D) 2017 5,200 3.15 2017 (D) (D) 2018 4,400 5.00 2018 3,200 (D) 2019 2,600 6.60 2019 (D) (D) 2020 8,000 3.50 2020 (D) (D) Massachusetts Vermont 2016 8,400 1.80 2016 10,000 1.15 2017 10,500 2.00 2017 8,300 1.40 2018 4,800 2.85 2018 8,800 1.30 2019 6,000 1.60 2019 11,000 2.15 2020 7,800 2.65 2020 7,400 1.75 New England 2016 9,200 1.55 2017 8,500 2.25 2018 5,200 2.50 2019 5,800 2.50
2020 7,100 2.60
Lettuce, Romaine
Reports 1 Yield
per Acre 2 Reports 3
All Price per Pound 4
Lettuce, Romaine
Reports 1 Yield
per Acre 2 Reports 3
All Price per Pound 4
Connecticut New Hampshire 2016 (D) (D) 2016 (D) (D) 2017 3,700 1.50 2017 (D) (D) 2018 (D) (D) 2018 4,000 2.15 2019 5,900 1.70 2019 (D) (D) 2020 5,000 1.80 2020 (D) (D) Maine Rhode Island 2016 3,200 2.00 2016 (D) (D) 2017 4,200 2.80 2017 (D) (D) 2018 3,800 1.90 2018 (D) (D) 2019 3,800 1.25 2019 (D) (D) 2020 6,200 2.25 2020 (D) (D) Massachusetts Vermont 2016 (D) (D) 2016 (D) (D) 2017 (D) (D) 2017 8,000 1.40 2018 5,200 2.10 2018 6,100 1.35 2019 2,500 1.45 2019 4,900 1.10 2020 (D) (D) 2020 8,000 1.20 New England 2016 10,400 1.10 2017 6,600 1.90 2018 5,100 1.70 2019 3,900 1.40
2020 7,300 1.60
See footnotes at end of table on page 10.

USDA, NASS, New England Field Office New England Vegetable Report – 7
Fresh Market Vegetables: Yield and Price, 2016 – 2020
Onions, Dry Reports 1 Yield
per Acre 2 Reports 3
All Price per Pound 4
Onions, Dry Reports 1 Yield
per Acre 2 Reports 3
All Price per Pound 4
Number Pounds Number Dollars Number Pounds Number Dollars Connecticut New Hampshire 2016 7,400 1.90 2016 8,100 1.75 2017 9,700 2.15 2017 5,600 1.70 2018 6,300 2.25 2018 10,700 1.25 2019 7,600 2.20 2019 7,500 2.10 2020 6,100 1.70 2020 8,700 2.00
Maine Rhode Island 2016 3,700 1.30 2016 (D) (D) 2017 12,300 1.60 2017 (D) (D) 2018 4,200 2.10 2018 (D) (D) 2019 4,300 1.50 2019 (D) (D) 2020 7,700 1.95 2020 (D) (D) Massachusetts Vermont 2016 7,200 0.90 2016 19,200 0.85 2017 10,200 0.65 2017 11,200 1.30 2018 17,100 0.65 2018 8,700 1.25 2019 25,000 0.75 2019 13,600 1.25 2020 15,900 0.65 2020 6,600 1.60 New England 2016 8,700 1.10 2017 9,600 1.10 2018 11,400 1.00 2019 15,400 1.00
2020 11,000 1.10
Onions, Green Reports 1 Yield
per Acre 2 Reports 3
All Price per Pound 4
Onions, Green Reports 1 Yield
per Acre 2 Reports 3
All Price per Pound 4
Connecticut New Hampshire 2016 (D) (D) 2016 1,300 1.65 2017 4,200 1.70 2017 (D) (D) 2018 3,300 1.05 2018 4,300 1.85 2019 (D) (D) 2019 7,000 1.40 2020 7,700 2.55 2020 6,300 2.80 Maine Rhode Island 2016 1,600 3.45 2016 (D) (D) 2017 3,600 2.50 2017 (D) (D) 2018 3,500 1.75 2018 (D) (D) 2019 5,800 1.85 2019 (D) (D) 2020 7,400 2.45 2020 (D) (D) Massachusetts Vermont 2016 5,200 1.90 2016 5,800 2.35 2017 6,100 1.00 2017 5,600 2.95 2018 8,200 1.40 2018 6,600 2.55 2019 9,100 1.35 2019 5,000 2.55 2020 4,400 2.85 2020 8,600 2.25 New England 2016 4,100 2.00 2017 5,900 1.40 2018 6,000 1.65 2019 6,500 1.60
2020 6,200 2.50
Peas, Green (Fresh Only)
Reports 1 Yield
per Acre 2 Reports 3
All Price per Pound 4
Peas, Green (Fresh Only)
Reports 1 Yield
per Acre 2 Reports 3
All Price per Pound 4
Connecticut New Hampshire 2016 2,800 1.10 2016 2,400 3.10 2017 3,200 1.10 2017 3,500 1.70 2018 1,600 3.00 2018 3,600 2.10 2019 1,500 3.10 2019 2,500 1.70 2020 2,000 2.05 2020 2,200 2.65 Maine Rhode Island 2016 1,500 2.40 2016 (D) (D) 2017 1,600 2.70 2017 (D) (D) 2018 1,900 2.80 2018 (D) (D) 2019 1,700 2.50 2019 (D) (D) 2020 1,800 3.10 2020 (D) (D) Massachusetts Vermont 2016 3,800 1.50 2016 2,000 3.30 2017 1,200 2.80 2017 2,800 4.90 2018 2,100 3.60 2018 2,200 2.95 2019 1,900 3.70 2019 1,500 3.10 2020 2,400 2.75 2020 1,200 3.90 New England 2016 2,800 1.80 2017 1,900 2.55 2018 2,100 3.05 2019 1,800 2.95
2020 2,100 2.80
See footnotes at end of table on page 10.

8 – New England Vegetable Report USDA, NASS, New England Field Office
Fresh Market Vegetables: Yield and Price, 2016 – 2020
Peppers, Bell Reports 1 Yield
per Acre 2 Reports 3
All Price per Pound 4
Peppers, Bell Reports 1 Yield
per Acre 2 Reports 3
All Price per Pound 4
Number Pounds Number Dollars Number Pounds Number Dollars Connecticut New Hampshire 2016 12,900 0.55 2016 8,200 1.70 2017 11,400 0.65 2017 11,000 1.20 2018 4,500 1.00 2018 8,800 0.85 2019 5,100 1.70 2019 6,900 0.95 2020 7,000 1.05 2020 6,100 1.50
Maine Rhode Island 2016 7,500 1.05 2016 (D) (D) 2017 9,300 1.80 2017 11,200 1.20 2018 5,200 1.50 2018 11,800 0.85 2019 9,000 1.20 2019 9,900 1.85 2020 10,900 1.15 2020 4,400 1.00 Massachusetts Vermont 2016 12,300 0.75 2016 8,300 1.70 2017 12,700 1.20 2017 9,600 2.00
2018 13,100 0.85 2018 7,600 1.75 2019 12,300 0.80 2019 12,000 1.50 2020 11,600 1.05 2020 9,000 2.05 New England 2016 12,500 0.75 2017 11,300 1.10 2018 8,500 1.00 2019 8,900 1.20
2020 8,800 1.15
Peppers, Other (Excludes Bell)
Reports 1 Yield
per Acre 2 Reports 3
All Price per Pound 4
Peppers, Other (Excludes Bell)
Reports 1 Yield
per Acre 2 Reports 3
All Price per Pound 4
Connecticut New Hampshire 2016 (D) (D) 2016 8,500 2.15 2017 4,400 1.60 2017 (D) (D) 2018 2,800 1.75 2018 4,600 2.40 2019 2,200 2.45 2019 5,300 3.00 2020 2,800 1.75 2020 4,800 (D) Maine Rhode Island 2016 1,500 4.10 2016 (D) (D) 2017 (D) (D) 2017 (D) (D) 2018 2,400 3.30 2018 (D) (D) 2019 3,000 2.65 2019 (D) (D) 2020 4,800 2.15 2020 (D) (D) Massachusetts Vermont 2016 6,600 0.80 2016 7,400 (D) 2017 (D) 1.30 2017 3,000 2.15 2018 8,300 0.90 2018 10,700 2.15
2019 8,100 2.00 2019 6,200 1.75 2020 5,100 1.50 2020 4,700 2.55 New England 2016 8,200 1.15 2017 5,200 1.70 2018 6,600 1.20 2019 6,200 2.10
2020 4,500 1.70
Pumpkins Reports 1 Yield
per Acre 2 Reports 3
All Price per Pound 4
Pumpkins Reports 1 Yield
per Acre 2 Reports 3
All Price per Pound 4
Connecticut New Hampshire 2016 4,200 0.45 2016 8,700 0.50 2017 7,200 0.45 2017 14,300 0.45 2018 7,900 0.45 2018 12,500 0.40 2019 5,800 0.30 2019 18,000 0.45 2020 4,700 0.35 2020 11,700 0.50 Maine Rhode Island 2016 10,800 0.30 2016 (D) (D) 2017 11,500 0.30 2017 7,300 (D) 2018 6,400 0.30 2018 9,100 0.30 2019 8,900 0.35 2019 7,200 0.35 2020 9,300 0.35 2020 3,200 (D) Massachusetts Vermont 2016 7,600 0.30 2016 17,900 0.25 2017 7,700 0.50 2017 18,600 0.25 2018 6,700 0.60 2018 19,400 0.20 2019 7,500 0.20 2019 22,000 0.20 2020 10,000 0.30 2020 27,200 0.15 New England 2016 10,400 0.25 2017 11,900 0.40 2018 8,900 0.40 2019 9,800 0.30
2020 10,300 0.30
See footnotes at end of table on page 10.

USDA, NASS, New England Field Office New England Vegetable Report – 9
Fresh Market Vegetables: Yield and Price, 2016 – 2020
Squash, Summer Reports 1 Yield
per Acre 2 Reports 3
All Price per Pound 4
Squash, Summer Reports 1 Yield
per Acre 2 Reports 3
All Price per Pound 4
Number Pounds Number Dollars Number Pounds Number Dollars Connecticut New Hampshire 2016 12,900 0.40 2016 5,600 1.25 2017 9,100 0.45 2017 12,800 0.95 2018 6,100 1.05 2018 13,200 1.05 2019 5,500 1.00 2019 12,200 1.05 2020 5,700 1.05 2020 13,200 1.00 Maine Rhode Island 2016 8,500 0.80 2016 (D) (D) 2017 12,400 1.15 2017 (D) (D) 2018 6,000 1.15 2018 (D) (D) 2019 7,800 1.00 2019 (D) (D) 2020 8,200 1.05 2020 (D) (D) Massachusetts Vermont 2016 11,100 0.80 2016 16,000 0.70 2017 8,300 0.95 2017 9,300 1.25 2018 4,400 1.05 2018 8,200 1.50 2019 7,600 1.00 2019 16,900 1.25 2020 7,700 0.85 2020 16,400 1.00 New England 2016 11,800 0.50 2017 9,600 0.65 2018 6,800 1.05 2019 7,900 1.05
2020 8,100 0.95
Squash, Winter Reports 1 Yield
per Acre 2 Reports 3
All Price per Pound 4
Squash, Winter Reports 1 Yield
per Acre 2 Reports 3
All Price per Pound 4
Connecticut New Hampshire 2016 7,700 0.35 2016 5,300 0.40 2017 8,500 0.30 2017 3,600 0.55 2018 11,700 0.45 2018 3,800 0.80 2019 (D) (D) 2019 5,500 0.90 2020 9,300 0.55 2020 8,600 0.75 Maine Rhode Island 2016 4,200 0.55 2016 19,100 0.20 2017 7,300 0.65 2017 (D) (D) 2018 9,600 0.55 2018 15,000 0.80 2019 5,800 0.70 2019 (D) (D) 2020 8,700 0.70 2020 (D) (D) Massachusetts Vermont 2016 12,500 0.25 2016 10,000 0.65 2017 12,400 0.35 2017 7,100 0.70 2018 7,600 0.65 2018 10,200 0.80 2019 9,000 0.75 2019 11,500 0.80 2020 10,000 0.75 2020 9,000 0.85 New England 2016 10,300 0.30 2017 9,900 0.40 2018 8,800 0.60 2019 9,400 0.80
2020 9,700 0.70
See footnotes at end of table on page 10.
10 – New England Vegetable Report USDA, NASS, New England Field Office
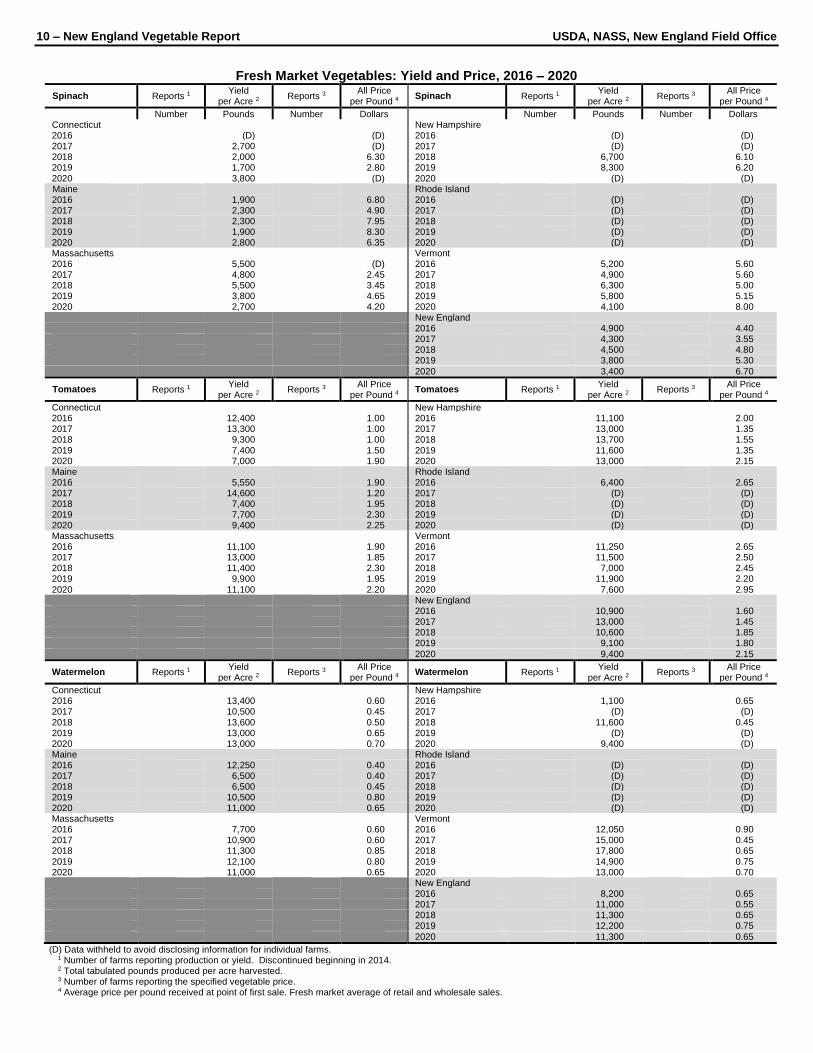
Fresh Market Vegetables: Yield and Price, 2016 – 2020
Spinach Reports 1 Yield
per Acre 2 Reports 3
All Price per Pound 4
Spinach Reports 1 Yield
per Acre 2 Reports 3
All Price per Pound 4
Number Pounds Number Dollars Number Pounds Number Dollars Connecticut New Hampshire 2016 (D) (D) 2016 (D) (D) 2017 2,700 (D) 2017 (D) (D) 2018 2,000 6.30 2018 6,700 6.10 2019 1,700 2.80 2019 8,300 6.20 2020 3,800 (D) 2020 (D) (D)
Maine Rhode Island 2016 1,900 6.80 2016 (D) (D) 2017 2,300 4.90 2017 (D) (D) 2018 2,300 7.95 2018 (D) (D) 2019 1,900 8.30 2019 (D) (D) 2020 2,800 6.35 2020 (D) (D) Massachusetts Vermont 2016 5,500 (D) 2016 5,200 5.60 2017 4,800 2.45 2017 4,900 5.60 2018 5,500 3.45 2018 6,300 5.00 2019 3,800 4.65 2019 5,800 5.15 2020 2,700 4.20 2020 4,100 8.00 New England 2016 4,900 4.40 2017 4,300 3.55 2018 4,500 4.80 2019 3,800 5.30
2020 3,400 6.70
Tomatoes Reports 1 Yield
per Acre 2 Reports 3
All Price per Pound 4
Tomatoes Reports 1 Yield
per Acre 2 Reports 3
All Price per Pound 4
Connecticut New Hampshire 2016 12,400 1.00 2016 11,100 2.00 2017 13,300 1.00 2017 13,000 1.35 2018 9,300 1.00 2018 13,700 1.55 2019 7,400 1.50 2019 11,600 1.35 2020 7,000 1.90 2020 13,000 2.15 Maine Rhode Island 2016 5,550 1.90 2016 6,400 2.65 2017 14,600 1.20 2017 (D) (D) 2018 7,400 1.95 2018 (D) (D) 2019 7,700 2.30 2019 (D) (D) 2020 9,400 2.25 2020 (D) (D) Massachusetts Vermont 2016 11,100 1.90 2016 11,250 2.65 2017 13,000 1.85 2017 11,500 2.50 2018 11,400 2.30 2018 7,000 2.45 2019 9,900 1.95 2019 11,900 2.20 2020 11,100 2.20 2020 7,600 2.95 New England 2016 10,900 1.60 2017 13,000 1.45 2018 10,600 1.85 2019 9,100 1.80
2020 9,400 2.15
Watermelon Reports 1 Yield
per Acre 2 Reports 3
All Price per Pound 4
Watermelon Reports 1 Yield
per Acre 2 Reports 3
All Price per Pound 4
Connecticut New Hampshire 2016 13,400 0.60 2016 1,100 0.65 2017 10,500 0.45 2017 (D) (D) 2018 13,600 0.50 2018 11,600 0.45 2019 13,000 0.65 2019 (D) (D) 2020 13,000 0.70 2020 9,400 (D) Maine Rhode Island 2016 12,250 0.40 2016 (D) (D) 2017 6,500 0.40 2017 (D) (D) 2018 6,500 0.45 2018 (D) (D) 2019 10,500 0.80 2019 (D) (D) 2020 11,000 0.65 2020 (D) (D) Massachusetts Vermont 2016 7,700 0.60 2016 12,050 0.90 2017 10,900 0.60 2017 15,000 0.45 2018 11,300 0.85 2018 17,800 0.65 2019 12,100 0.80 2019 14,900 0.75 2020 11,000 0.65 2020 13,000 0.70 New England 2016 8,200 0.65 2017 11,000 0.55 2018 11,300 0.65 2019 12,200 0.75
2020 11,300 0.65
(D) Data withheld to avoid disclosing information for individual farms. 1 Number of farms reporting production or yield. Discontinued beginning in 2014. 2 Total tabulated pounds produced per acre harvested. 3 Number of farms reporting the specified vegetable price. 4 Average price per pound received at point of first sale. Fresh market average of retail and wholesale sales.

USDA, NASS, New England Field Office New England Vegetable Report – 11
Sweet Corn: Acreage, Yield, Production, and Value, 2016 – 2020
State and Year
Area Yield per Acre
Production Value per
Cwt Value of
Production Yield per
Acre 1 Production
Value per Dozen Planted Harvested
Acres Cwt 1,000 Cwt Dollars 1,000 Dollars Dozen 1,000 Dozen Dollars Connecticut 2016 3,700 3,600 72 259 40.00 10,368 847 3,049 3.40 2017 4,100 3,900 69 269 30.00 8,073 812 3,166 2.55 2018 2,700 2,100 53 111 40.00 4,452 624 1,309 3.40 2019 2,100 2,000 48 96 40.00 3,840 565 1,129 3.40 2020 2,000 1,600 47 75 50.00 3,760 553 885 4.25 Maine 2016 1,400 1,200 62 74 40.00 2,976 729 875 3.40 2017 1,300 1,100 52 57 40.00 2,288 612 673 3.40 2018 900 800 63 50 40.00 2,016 741 593 3.40 2019 1,100 770 52 40 45.00 1,802 612 471 3.83 2020 900 800 62 50 50.00 2,480 729 584 4.25 Massachusetts 2016 3,500 3,300 53 175 40.00 6,996 624 2,058 3.40 2017 3,100 2,900 56 162 55.00 8,932 659 1,911 4.68 2018 3,400 3,000 83 249 50.00 12,450 976 2,929 4.25 2019 3,700 3,500 85 298 40.00 11,900 1,000 3,500 3.40 2020 3,200 3,000 72 216 45.00 9,720 847 2,541 3.83 New Hampshire 2016 1,300 1,100 63 69 45.00 3,119 741 815 3.83 2017 1,000 900 77 69 50.00 3,465 906 815 4.25 2018 1,300 1,200 68 82 50.00 4,080 800 960 4.25 2019 1,300 1,200 70 84 40.00 3,360 824 988 3.40 2020 1,000 900 66 59 50.00 2,970 776 699 4.25 Rhode Island 2016 550 520 48 25 70.00 1,747 565 294 5.95 2017 600 550 70 39 45.00 1,733 824 453 3.83 2018 300 250 70 18 50.00 875 824 206 4.25 2019 300 250 50 13 40.00 500 588 147 3.40 2020 (D) (D) (D) (D) (D) (D) (D) (D) (D) Vermont 2016 700 650 50 33 52.00 1,690 588 382 4.42 2017 600 550 44 24 50.00 1,210 518 285 4.25 2018 500 450 51 23 55.00 1,262 600 270 4.68 2019 500 460 42 19 60.00 1,159 494 227 5.10 2020 (D) (D) (D) (D) (D) (D) (D) (D) (D) New England 2 2016 11,150 10,370 61 633 42.00 26,568 718 7,442 3.57 2017 10,700 9,900 61 604 45.00 27,176 718 7,105 3.83 2018 9,100 7,800 68 530 45.00 23,868 800 6,240 3.83 2019 9,000 8,180 65 532 40.00 21,268 765 6,255 3.40
2020 8,100 7,120 61 434 50.00 21,716 718 5,110 4.25 1 Standard weight used for one dozen ears is 8.5 pounds. 2 New England includes CT, ME, MA, NH, RI, and VT.
Fall Potatoes: Yield and Price, 2016 – 2020
State and Year Yield per Acre Price per Cwt State and Year Yield per Acre Price per Cwt
Cwt Dollars Cwt Dollars Connecticut 2 New Hampshire 2 2016 55 160.00 2016 75 53.00 2017 85 120.00 2017 180 115.00 2018 50 200.00 2018 100 145.00 2019 20 175.00 2019 70 148.00 2020 35 127.00 2020 55 145.00 Maine 1 Rhode Island 1 2016 320 11.50 2016 (D) (D) 2017 310 10.20 2017 (D) (D) 2018 310 11.10 2018 (D) (D) 2019 3 325 10.90 2019 (D) (D) 2020 4 255 12.50 2020 (D) (D) Massachusetts 1 Vermont 2 2016 150 11.00 2016 155 46.00 2017 180 13.00 2017 185 140.00 2018 100 80.00 2018 90 100.00 2019 325 22.00 2019 180 134.00 2020 290 (D) 2020 100 90.00 New England 2016 305 9.70 2017 300 11.60 2018 290 12.10 2019 315 12.30
2020 255 23.70
(D) Data withheld to avoid disclosing information for individual farms. 1 ME, MA, RI yield and price for all uses including fresh market, processing, seed, and feed. 2 CT, NH, VT yield for fresh market only; price is fresh market average of retail and wholesale sales. Average price is higher than ME, MA, and RI price because the crop is sold by the pound.
3 Revised. 4 Preliminary.
SOURCE: (ME) Crop Production – Annual Summary, January 12, 2021, National Agricultural Statistics Service, USDA.

12 – New England Vegetable Report USDA, NASS, New England Field Office
STATE DATA – SELECTED ITEMS – 2017 CENSUS OF AGRICULTURE
Connecticut Maine Massachusetts New Hampshire Rhode Island Vermont
All Farms 1 number 5,521 7,600 7,241 4,123 1,043 6,808 Fresh Market Vegetables Harvested for Sale 2 farms 957 1,337 1,360 585 208 692 acres 9,017 31,227 18,407 3,656 2,078 3,370
Asparagus, harvested farms 85 74 125 59 16 60 acres 54 31 179 29 3 44 Beans, Snap, harvested farms 249 388 340 171 46 171 acres 879 320 421 138 47 61 Beets, harvested farms 148 335 245 102 32 116 acres 38 229 130 27 12 56 Broccoli, harvested farms 132 273 243 116 27 116 acres 62 (D) 147 52 18 76 Cabbage, Head, harvested farms 109 234 182 112 19 100 acres 152 160 313 32 16 61 Cantaloupes, harvested farms 90 113 114 50 22 50 acres 56 32 65 36 8 28 Carrots, harvested farms 145 376 233 125 24 135 acres 63 128 146 35 6 69 Cauliflower, harvested farms 63 134 107 56 12 52 acres 48 (D) 65 23 3 18 Cucumbers, harvested farms 286 403 355 181 47 179 acres 201 154 248 104 24 69 Eggplant, harvested farms 221 183 275 92 43 71 acres 110 27 148 18 59 20 Garlic, harvested farms 177 303 240 125 30 242 acres 44 65 79 (D) 11 70 Kale, harvested farms 169 256 262 105 25 121 acres 65 46 234 21 5 55 Lettuce, all, harvested farms 230 333 325 142 42 185 acres 130 150 351 73 30 149 Onions, Dry, harvested farms 107 303 164 102 12 109 acres (D) 63 133 (D) 3 45 Onions, Green, harvested farms 83 172 144 40 16 57 acres 18 26 55 6 5 21 Peas, Green (excl. cowpeas) harvested farms 85 225 140 67 16 88 acres 35 115 129 36 8 (D) Peppers, Bell, harvested farms 319 275 322 147 54 135 acres 250 (D) 253 61 68 55 Peppers, Other (excluding bell) harvested farms 154 183 224 67 28 80 acres 85 28 265 17 14 18 Potatoes, excluding sweet potatoes farms 167 537 274 154 50 198 acres 94 50,211 3,640 107 624 248 Pumpkins, harvested farms 267 375 403 169 66 170 acres 1,127 673 1,735 489 110 437 Squash, harvested farms 399 582 531 241 55 232 acres 785 643 1,999 248 188 234 Sweet corn, harvested farms 300 340 346 159 38 159 acres 3,769 1.468 5,109 1,398 720 775 Tomatoes in open, harvested farms 498 451 517 231 85 206 acres 410 128 569 128 49 95
Land in Orchards 3 4 farms 439 580 614 306 94 461 acres 3,141 2,941 4,704 1,703 381 2,803
Apples, total farms 208 449 443 228 57 343 acres 2,036 2,668 3,739 1,458 219 2,483 Peaches, total farms 167 118 216 114 12 40 acres 365 44 461 83 (D) 13 Pears, total farms 86 121 148 71 12 71 acres 95 44 126 22 2 31
Land in Berries 4 farms 404 1,054 979 371 74 478 acres 744 39,930 14,994 754 228 662 Blueberries, Tame, harvested farms 227 270 356 233 37 289 acres (D) 627 599 271 (D) 317 Blueberries, Wild, harvested farms 2 485 35 27 4 11 acres (D) 38,660 308 269 (D) 9 Cranberries, harvested farms 2 17 363 2 2 3 acres (D) 91 13,555 (D) (D) (D) Raspberries, harvested farms 136 245 225 121 24 158 acres 70 131 140 54 10 81 Strawberries, harvested farms 156 178 221 116 37 136 acres 208 316 320 124 47 172
(D) Data withheld to avoid disclosing information for individual farms. 1 A farm is any place from which $1,000 or more of agricultural products were produced and sold, or normally would have been sold, during the census year. 2 The acres of vegetables harvested is the summation of the acres of individual vegetables harvested for fresh market. Vegetable acreage harvested for processing is
excluded. All the individual vegetable crops are not shown. 3 Orchard land includes land in bearing and non-bearing fruit trees, vineyards, and nut trees of all ages, including land on which all fruit crops failed. Respondents were
instructed not to report abandoned plantings and plantings of fewer than 20 total fruit trees, nut trees, or grapevines. 4 Acreage includes area harvested for fresh and processing.