New Economical, Political and Social Trends in Latin...
29
Bernardo Kliksberg DPADM/DESA/ONU 21 April, 2006 New Economical, Political and Social Trends in Latin America, and the Demands for Participation
-
Upload
truongkhanh -
Category
Documents
-
view
217 -
download
0
Transcript of New Economical, Political and Social Trends in Latin...

Bernardo Kliksberg
DPADM/DESA/ONU
21 April, 2006
New Economical, Political and Social
Trends in Latin America,
and the Demands for Participation

AGENDA
1. POLITICAL CHANGES2. THE STRUCTURAL ROOTS OF THE
DEMAND FOR CHANGE3. THE LATIN-AMERICAN PARADOX4. IMPACT OF INEQUALITY ON POVERTY5. NEW SOCIAL DEMANDS FOR
CITIZENSHIP PARTICIPATION

ADDITIONAL INFORMATION
• Inter-American Initiative on Social Capital, Ethics, and Development: www.iadb.org/etica
•Bernardo Kliksberg, “Más Ética, Más Desarrollo”(Temas, Argentina)

I. POLITICAL CHANGES
• 8 Presidents resigned before finishing their term in the last 10 years
• The reason was not coup d’etat but massive social unrest through democratic channels
• The political map of the region is changing dramatically• In Argentina, Brazil, Chile, Uruguay, Bolivia, and Venezuela
different variants of the centre left or left are in power• For the first time in the region’s history:
• a single woman with children has been elected president of Chile, a very conservative and “machist” country
• a steel worker is president of Brazil, the 8th largest economy of the world
• an indigenous has been elected president of Bolivia• Centre leftist candidates lead the polls in the next Mexican
(July) and Equatorian (December) elections while a nationalist leads the polls in Peru (April)

1. Persistent Poverty
Poverty and Extreme Poverty in Latin America 1980-2003(% of people)
II. STRUCTURAL ROOTS OF THE DEMAND FOR CHANGE
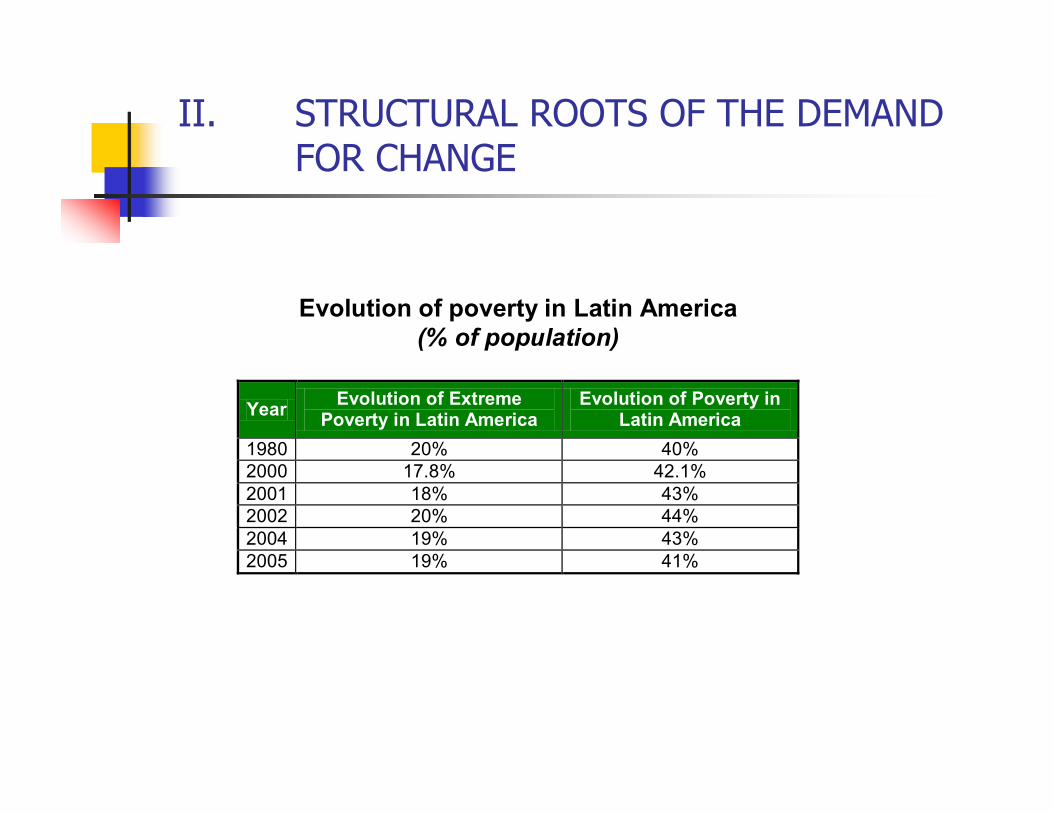
Evolution of poverty in Latin America(% of population)
Year Evolution of Extreme
Poverty in Latin America Evolution of Poverty in
Latin America 1980 20% 40% 2000 17.8% 42.1% 2001 18% 43% 2002 20% 44% 2004 19% 43% 2005 19% 41%
II. STRUCTURAL ROOTS OF THE DEMAND FOR CHANGE
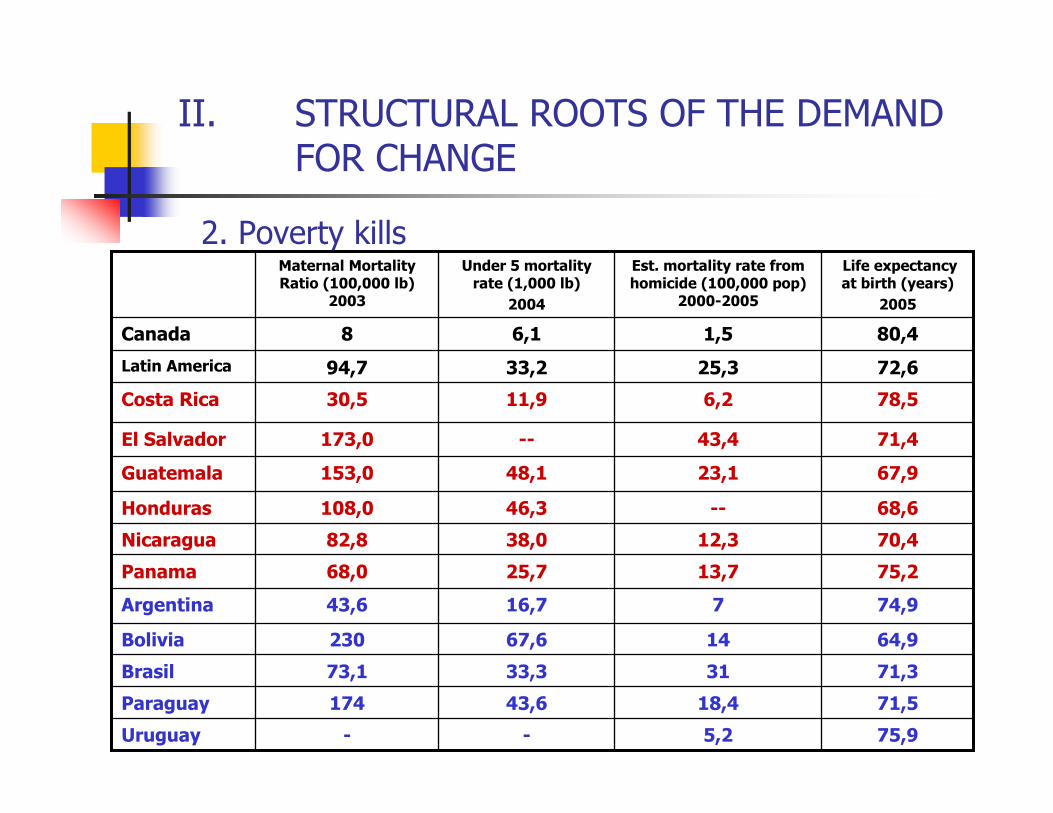
75,213,725,768,0Panama
74,9716,743,6Argentina
64,91467,6230Bolivia
71,33133,373,1Brasil
71,518,443,6174Paraguay
75,95,2--Uruguay
68,6--46,3108,0Honduras
70,412,338,082,8Nicaragua
80,41,56,18Canada
48,1
--
11,9
33,2
Under 5 mortality rate (1,000 lb)
2004
23,1
43,4
6,2
25,3
Est. mortality rate from homicide (100,000 pop)
2000-2005
72,694,7Latin America
67,9153,0Guatemala
71,4173,0El Salvador
78,530,5Costa Rica
Life expectancy at birth (years)
2005
Maternal Mortality Ratio (100,000 lb)
2003
II. STRUCTURAL ROOTS OF THE DEMAND FOR CHANGE
2. Poverty kills

3. The Situation of young people
40% of the population is youngProblems:
a) More povertyBetween 1990 and 2002, there were 17,600,000 more youth in poverty totaling 58 million800,000 more homeless young people totaling 21 million
II. STRUCTURAL ROOTS OF THE CHANGES

3. The Situation of young people b) UnemploymentRise in unemployment. Youth unemployment is two and a half times the general rate of unemployment
For every 100 new jobs, 93 are for adults and 7 are for young people
Instability of youth employment in the face economic cycles
II. STRUCTURAL ROOTS OF THE CHANGES

3. The Situation of young people
c) Access to Education39.8% of young people graduate from high school, whereas in OECD countries 85% graduate
In 20% of the poorest people, only 12% graduate from high school
6.5% graduate from university In 20% of the poorest, only 0.9% graduate
A “Catch 22” situation80% of young people whose parents did not finish primary school, do not finish either
II. STRUCTURAL ROOTS OF THE CHANGES

3. The Situation of young people d) Young people excluded
1 of 4 youth aged 15-29 years old is outside the school system and the labor market
e) High youth mortalityMortality rate is 134 per 100,000 (In Spain, 49 per 100,000)
Of every 100 deaths of male youth, 77 are from violent causes
II. STRUCTURAL ROOTS OF THE CHANGES

4. Children at Risk58% of children under 5 are poor (Economic Commission for Latin America and the Caribbean- ECLAC)
36% of children under 2 are in high-risk situations from the perspective of nutrition (ECLAC)
190,000 children die annually from preventable diseases linked to poverty (WHO)
22 million children under 14 work (ILO)
II. STRUCTURAL ROOTS OF THE CHANGES

5. The family at riskA large majority of young people live with the family
58% nuclear families; 33% in extended familiesSurveys reveal that people give a lot of value to the familyPeople value care, support, spaces of trust, and resolving problems through dialoguePoverty causes broken familiesAround 30% of families have a poor single mother as head of the householdMany families have become the “new poor”; this has produced high interfamily tensions. (Research from the University of Buenos Aires)There has been increasing rate of young people who want to marry but they did not because of fear of economic factors
II. STRUCTURAL ROOTS OF THE CHANGES

6. Discrimination
There are 40 million indigenous, 80% of which are below the poverty line
30% of the region are Afro descendents; poverty and illiteracy rates are much higher than the average
The rate of female unemployment is 50% higher than male; informality is 12% higher for women
There are 50 million people with disabilities. Their poverty levels are higher than the average
The rates of poverty of young women are 2.7% greater that that of men
II. STRUCTURAL ROOTS OF THE CHANGES

7. Alarming Juvenile DelinquencyThe number of homicides grew by 40% in the 1990sThere are 40 homicides for every 100.000 inhabitants each year (more than 6 times the petty crime rate of Western Europe)Among the principle causes:
High levels of youth unemploymentDestroyed families: According to an ECLAC study in Uruguay, 2/3 of juvenile delinquents come from single-parent householdsLow education levels
II. STRUCTURAL ROOTS OF THE CHANGES

III. THE LATIN-AMERICAN PARADOX
Brazil- 8th in the world in annual GDP / 58th in GDP per capita- 108th in life expectancy- 108th in literacy- 113th in infant mortalityMexico- 12th in the world in annual GDP / 57th in GDP per capita- 64th in life expectancy- 92nd in literacy- 108th in infant mortalityArgentina- 5th producer of food in the world- Exported in 2002 enough food for 300 million people- The country’s most populace region, Greater Buenos Aires, sees
20 percent infant malnutrition

IV. IMPACT OF INEQUALITY ON POVERTY
Latin America is one of the most unequal regions of the world with 10% of the richest of it habitants possessing 48% of income and 10% of the poorest possess just 1.6%

IV. IMPACT OF INEQUALITY ON POVERTY
1. Dimensions of InequalityThe highest-earning 10%, earn around 50 times more than the lowest 10% and 19 times more than the lowest 40%Between 2/3 and 3/4 of the population, depending on the country, have an income per capita lower than the country’s average income
2. Education and years of schoolingThe richest 10% of the population: 12The poorest 30% of the population: 5

0.12
0.14
0.16
0.18
0.2
0.22
0.24
0.26
Inco
me
of th
e w
ealth
iest
5%
0 2000 4000 6000 8000 10000 12000 14000 GDP per capita
Africa Latin America
Central Asia
Eastern Asia
Developed Countries
Income of the Wealthiest 5%(percentage of total income)
IV. IMPACT OF INEQUALITY ON POVERTY

0.07
0.08
0.09
0.1
0.11
0.12
0.13
Inco
me
of th
e po
ores
t 30%
0 2000 4000 6000 8000 10000 12000 14000 GDP per capita
Africa
Central Asia East Asia Developed Nations
Latin America
Income of the Poorest 30%(percentage of total income)
IV. IMPACT OF INEQUALITY ON POVERTY
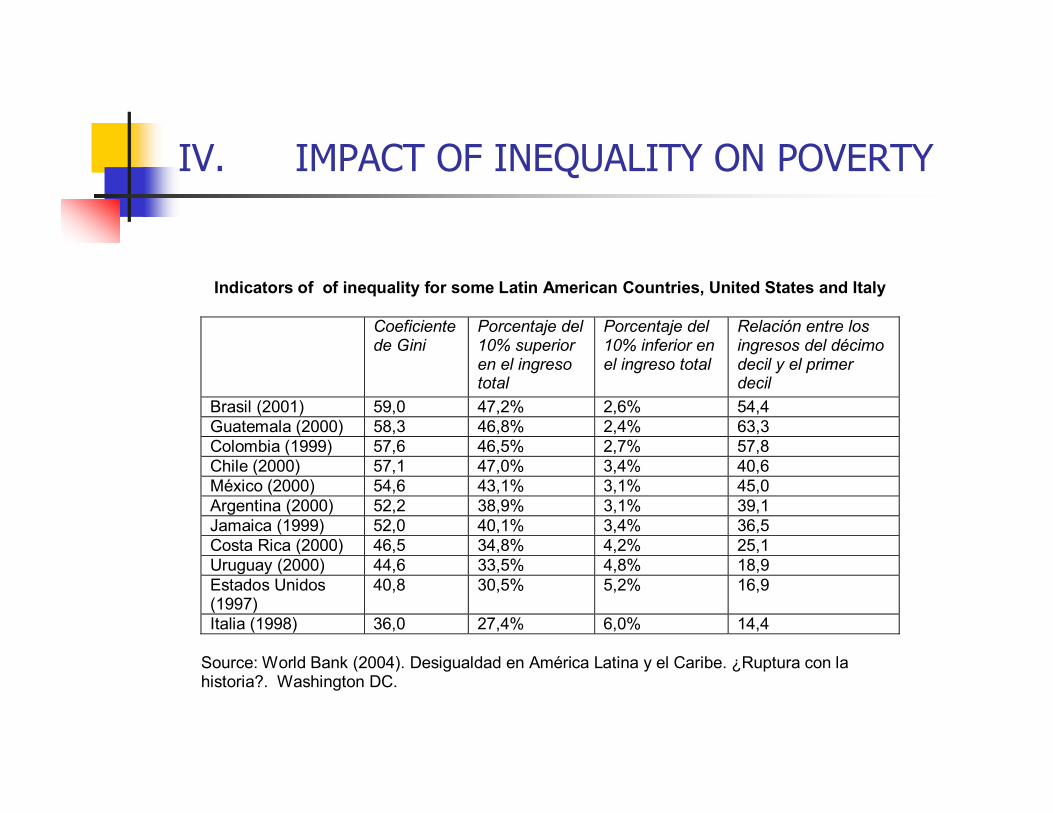
Indicators of of inequality for some Latin American Countries, United States and Italy
Coeficiente de Gini
Porcentaje del 10% superior en el ingreso total
Porcentaje del 10% inferior en el ingreso total
Relación entre los ingresos del décimo decil y el primer decil
Brasil (2001) 59,0 47,2% 2,6% 54,4 Guatemala (2000) 58,3 46,8% 2,4% 63,3 Colombia (1999) 57,6 46,5% 2,7% 57,8 Chile (2000) 57,1 47,0% 3,4% 40,6 México (2000) 54,6 43,1% 3,1% 45,0 Argentina (2000) 52,2 38,9% 3,1% 39,1 Jamaica (1999) 52,0 40,1% 3,4% 36,5 Costa Rica (2000) 46,5 34,8% 4,2% 25,1 Uruguay (2000) 44,6 33,5% 4,8% 18,9 Estados Unidos (1997)
40,8 30,5% 5,2% 16,9
Italia (1998) 36,0 27,4% 6,0% 14,4 Source: World Bank (2004). Desigualdad en América Latina y el Caribe. ¿Ruptura con la historia?. Washington DC.
IV. IMPACT OF INEQUALITY ON POVERTY

Education Inequality measure Gini Index
Norway 0.11Finland 0.15Sweden 0.16USA 0.13Canada 0.13Denmark* 0.11China 0.37Chile 0.23Colombia 0.36Paraguay 0.35Bolivia* 0.38Peru 0.30Uruguay 0.24Venezuela 0.30Argentina* 0.22El Salvador 0.45Ecuador* 0.33Dominican Rep.* 0.38Guatemala* 0.54Haiti 0.61
Year 2000 except:Denmark* 1992Argentina* 2001Bolivia* 1998Ecuador* 1998/1999Dominican Rep.* 2002Guatemala* 1998/1999
Education Inequality in LAC
IV. IMPACT OF INEQUALITY ON POVERTY

The Effect of Inequality on Poverty in Latin America, 1970-1995
This is an econometric simulation
model prepared by Nancy Birdsall
(former Vice President of the IDB)
and other economists to measure
the impact of Latin American
inequality on poverty.
The first curve represents the level of poverty, which has been increasing from 40% of the population in 1980 to 44% in 2002.
The second curve represents a projection of poverty levels had inequality remained the same as in the end of the 60s. It was high then but has grown in recent decades.
It is estimated that poverty would be half what it is.
They call it “unnecessary poverty” caused only by the growth in inequality
Source: Birdsall, N., Londoño, L. “ Asset inequality matters: an assessment of the World Bank’s approach to Poverty reduction”, American Economist Review, May, 1997.
60
80
100
120
140
160
1970 1974 1978 1982 1986 1990 1994

V. NEW SOCIAL DEMANDS FOR CITIZENSHIP PARTICIPATION
Social pressure for moving from a passive democracy to an increasingly active oneIn Latin America, demand for participation is growing every day with the spread of democratizationCitizens no longer tolerate that in a region with such wealth potential, there is so much poverty. They see participation as a way to control and improve the situationThe capabilities of civil society to participate are growing

V. NEW SOCIAL DEMANDS FOR CITIZENSHIP PARTICIPATION
Call for more active public policiesUniversal access to education and healthAccess to creditPressure on the State to be decentralized, strengthening municipalities and facilitating participation Demands for concrete forms of participation by the population in social programs, budgeting, public services, and social control of public management

V. NEW SOCIAL DEMANDS FOR CITIZENSHIP PARTICIPATION
Example of a successful caseParticipatory Municipal Budget of Porto Alegre, Brazil
According to IDB’s evaluation, PMB enabled the 1,2 million Porto Alegre citizens to:
Express their understanding of the crucial problems facing the city
Set priorities in terms of problems that merited the most immediate attention
Choose the priorities and devise practical solutions
Have the opportunity to compare solutions with those adopted in other parts of the city or in other subject areas
Arrive at a final decision about whether or not to approve the spending plan
Examine the successes and failures of the spending plan so as toimprove the criteria for the following year

V. NEW SOCIAL DEMANDS FOR CITIZENSHIP PARTICIPATION
Example of a successful caseParticipatory Municipal Budget of Porto Alegre, Brazil
Some Results:Notable increase in school attendance, access to
potable water and sewage, paving of poor areas and facilities for SMB’sNearly eradicated corruption and clientelism

V. NEW SOCIAL DEMANDS FOR CITIZENSHIP PARTICIPATION
Example of a successful caseParticipatory Municipal Budget of Porto Alegre, Brazil
IDB’s Evaluation. Final Conclusion:
“Good materials, however, were only part of the benefits realized by the city of Porto Alegre. The participatory process has also had an incommensurable impact on the capacity of citizens to confront problems together with the community and to work collectively toimprove the quality of public adminsitration and in turn the quality of live.”

V. NEW SOCIAL DEMANDS FOR CITIZENSHIP PARTICIPATION
According to public opinion surveys, citizens demand also:
Eradication of all forms of corruption
Public policies that are ethical consistent
Corporate social responsibility
Ethical responsibility in the media
Strengthening of volunteerism