NEW ECI Website and Individualization Workshop September 22-23, 2005 Juniper Gardens Children’s...
48
NEW ECI Website and Individualization Workshop September 22-23, 2005 Juniper Gardens Children’s Project Presenters: Jay Buzhardt & Charlie Greenwood
-
date post
22-Dec-2015 -
Category
Documents
-
view
214 -
download
1
Transcript of NEW ECI Website and Individualization Workshop September 22-23, 2005 Juniper Gardens Children’s...

NEW ECI Website and Individualization Workshop
September 22-23, 2005
Juniper Gardens Children’s Project
Presenters: Jay Buzhardt & Charlie Greenwood

Agenda
Welcome Introductions Logistics of Meeting
Day 1 - What’s new Day 2 - Individualization
Brief Review of the ECI Review the Agenda Materials (handouts) Access to the NEW Website (www.igdi.ku.edu )

Project Staff
Jay Buzhardt, Ph.D. Judith Carta, Ph.D. Charles Greenwood, Ph.D. Barbara Terry, Ph.D. Dale Walker, Ph.D. Original development team:
Judith Carta, Charles Greenwood, Dale Walker
Jane Atwater, Gayle Luze, Deborah Linebarger, Carol Leitschuh, Ken Parsley, Annessa Staab, Gabe Cline, and Susan Higgins

Sponsors
Office of Special Education Programs, USDE SRS, Kansas The Kansas Mental Retardation and
Developmental Disabilities Research Center Schiefelbusch Institute for Life Span Studies

Improved and Added Web Features
New management and data entry tools More control over user accounts and access levels Email notifications of user account updates Personalized Usernames/Passwords
New look for on-demand individual child reports Easier to access
New, on-demand program and project level reports Graphs of Key Skill Elements
Normative ECI data based on over 1300 children Inactive children separated from Active children
Improved and Added Web Features
Better security Tools based on user testing Greater reliability, fewer errors

The IGDI Home PageAutomated
password update
Descriptions of all IGDI measures. What they measure, how they’ve been tested, and how to use
and score them
Training requirements for certification, training videos, PowerPoint presentations, etc.
Reports and presentations of IGDI research, descriptions, and training materials
Send us questions using an online form or give us a call
Printable forms for conducting and scoring assessments

What You Can Do With the Child Data System
Depends on your ‘level’ or ‘role’Levels: Administrators (JGCP Developers)
Project Directors ECI Designated Program
Coordinators/Directors Assessors/Coders
Data Entry These roles can be changed
No need to create a new account if you need to change levels

What You Can Do With the Data SystemData Entry Personnel (most restricted level)
Edit and add children to the system
Update your account
Edit, add, browse, ECI data (Primary
and Reliability)
Child reports

What You Can Do With the Data SystemAssessor Personnel (Need to be certified)
Edit, add, browse, ECI data (Primary
and Reliability)
Edit/add children,activate/deactivate
children
Update your account
Child reports

What You Can Do With the Data System
Edit and add children to the system
activate/deactivate children
Edit programAdd, modify, delete users
Personalize your password/username
Edit, add, browse, ECI data (Primary
and Reliability)
Child and Program Reports
Program Coordinator/Director
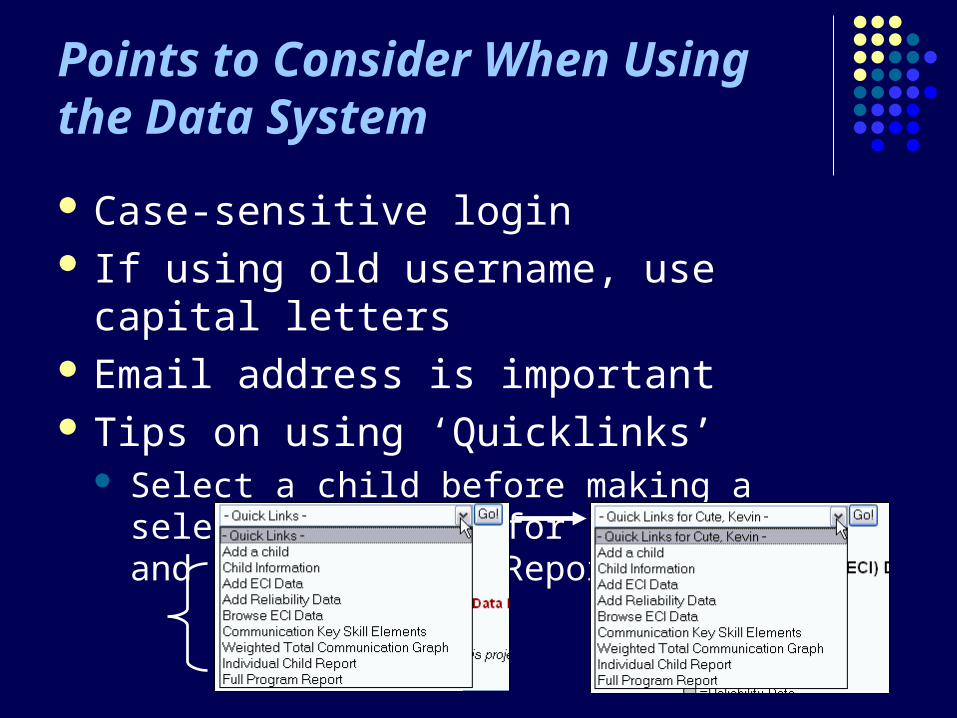
Points to Consider When Using the Data System
Case-sensitive login If using old username, use capital letters Email address is important Tips on using ‘Quicklinks’
Select a child before making a selection (except for ‘Add a Child’ and ‘Full Program Report’)

ECI Reports and What They Contain
Get the Results NOW! Individual Child Reports Program- and Project-level Reports

The Big Picture Perspective
Getting Result: Individual Child Reports
Displays and summarizes all data for this child List of ECI observations by date as the rate of:
Gestures Vocalizations Single Words Multiple Words Total Communication List of intervention conditions
Average Scores for Each: Average rate per minute for each (Mean Level All Data) Average “Goes-upness” per month (Slope – The Growth
Factor)

Report Tool

Child’s Data Summary
Child’s Data Table

Individual Child Report (Continued)
Total Communication Graphic, containing: Normative or Bench Mark trajectories Child’s observed progress Intervention changes marked at start Slope (average “goes-uppness” per month)
and estimated future trajectory (yellow line)

36 Mos Expectation
Below Average (-1.5 SD) Trajectory
Child’s Observed Trajectory
Child’s Forecasted
Growth Rate(Yellow)
Gray Zone(Max Scores)
Normative Trajectory
Total Communication Graph

Individual Child Report (Continued)
4 Key Skill Element Graphs Normative trajectory Child’s observed progress
Tools Print the report Copy, Past (to another document) Copy, Paste, Print (Just the graphics) Display and print all children’s reports

Normative Trajectory
Child’s Observed Trajectory
Gestures Graph

Vocalizations Graph

Single Words Graph

Multiple Words Graph

Displaying and Printing Individual Child Results
Option 1: Click Communication Tool, Select a Child’s graph to display Total Communication Graph
4 Key Skills Graphs Display All Children in Program
Option 2: Click Reports Tool, Select Individual Child Report Data Summary Table + Total Communication Graph + 4 Key Skills Graphs for one child as requested

Communication Tool Screen
Communication (ECI) Tools

Quick Links Go-To Tool!! Get there FAST!

Order All Graphs in Program Displayed
Show This Child’s Key Skill Elements

Program- and Project-level Reports
Click Reports to find: Assessor Information
Assessor List and Description Inter-observer Reliability (Agreement) Information

Click Reports, Select Full Report


All Assessor
Information

Assessor’s Cumulative Reliability
Program- and Project-level Reports (Continued)
Child Information (Active Children) Enrollment (Active and Inactive By Age By Gender By Needs (IFSP) By Primary Home Language By Source of Funding

Child Enrollment Information
All Following Data for Active Only

Program- and Project-level Reports (Continued)
Child Information For all Active and Inactive Children
Enrollment (Active and Inactive) For Active Children ONLY
By Age By Gender By Needs (IFSP) By Primary Home Language By Source of Funding


Program– and Project-level Reports (Continued)
Data Collected Facts Children with ECI Data House/Barn Usage Languages of Administration Intervention Changes Summary
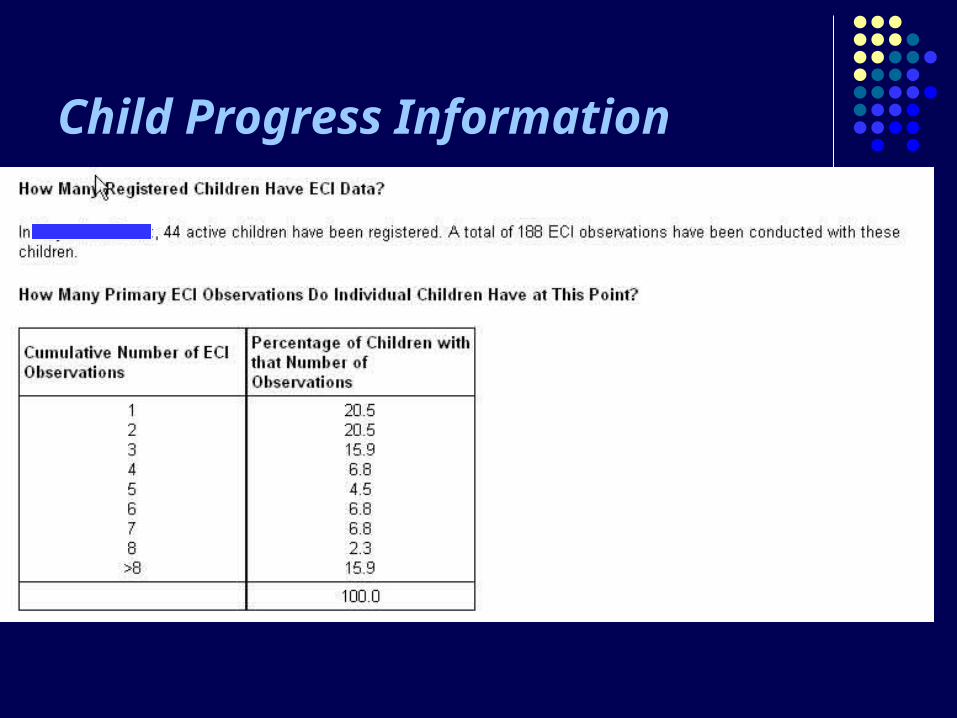
Child Progress Information


Intervention Changes Occurring

Child Progress Information
Child Progress Information Communication Distribution for Children in
Program/Project Percentage of Children Whose Progress is On Target
vs. Slightly Below Average, vs. Below Average By age group By Program/Project
Key Skills Program Average Trajectory Total Communication Program Average Trajectory
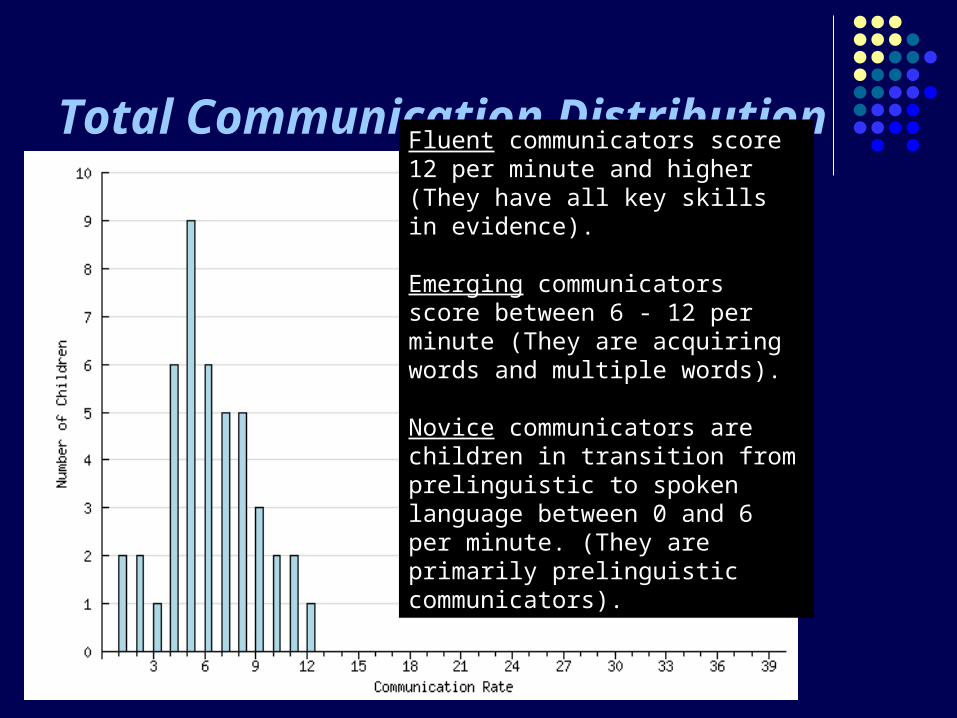
Total Communication DistributionFluent communicators score 12 per minute and higher (They have all key skills in evidence).
Emerging communicators score between 6 - 12 per minute (They are acquiring words and multiple words).
Novice communicators are children in transition from prelinguistic to spoken language between 0 and 6 per minute. (They are primarily prelinguistic communicators).

Communication Proficiency Table


Total Communication – Program Level

Program Management Questions
Assessor Reports – Indicators of program quality How many assessors are registered appropriately? How many assessors are certified? How many ECI’s have assessors administered? How many reliability checks have been completed? How well do coders agree on what they code?
Management Tools Is your program information current?
Update user information by editing it? Add new staff by enrolling them Inactivate staff who have left