
NEW DRUGS FOR AN O DISEASE
43
NEW DRUGS FOR AN OLD DISEASE DISCOVERY AND UNDERSTADING OF ANTIBIOTICS AND OXIDATIVE STRESS EFFECTS ON THE M. SMEGMATIS TRANSCRIPTOME A Major Qualifying Project submitted to the Faculty of WORCESTER POLYTECHNIC INSTITUTE In partial fulfillment of requirements for the degree of Bachelor of Science in Biology and Biotechnology and Bioinformatics and Computational Biology Written By: Casey Maffucci (BBT), Rachel Murphy (BBT & BCB), and Caeli Tegan (BBT) April 26, 2018 Approved by: Dr. Michael Buckholt, Advisor Dr. Scarlet Shell, Advisor Dr. Dmitry Korkin, Advisor This report represents work of WPI undergraduate students submitted to the faculty as evidence of a degree requirement. WPI routinely publishes these reports on its web site without editorial or peer review. For more information about the projects program at WPI, see http://www.wpi.edu/Academics/Projects.
Transcript of NEW DRUGS FOR AN O DISEASE

NEW DRUGS FOR AN OLD DISEASE
DISCOVERY AND UNDERSTADING OF ANTIBIOTICS AND OXIDATIVE STRESS EFFECTS
ON THE M. SMEGMATIS TRANSCRIPTOME
A Major Qualifying Project submitted to the Faculty of
WORCESTER POLYTECHNIC INSTITUTE
In partial fulfillment of requirements for the degree of Bachelor of Science in Biology
and Biotechnology and Bioinformatics and Computational Biology
Written By:
Casey Maffucci (BBT), Rachel Murphy (BBT & BCB), and Caeli Tegan (BBT)
April 26, 2018
Approved by:
Dr. Michael Buckholt, Advisor
Dr. Scarlet Shell, Advisor
Dr. Dmitry Korkin, Advisor
This report represents work of WPI undergraduate students submitted to the faculty as evidence of a degree
requirement. WPI routinely publishes these reports on its web site without editorial or peer review. For more
information about the projects program at WPI, see http://www.wpi.edu/Academics/Projects.

2
TABLE OF CONTENTS Acknowledgments ................................................................................................................................................. 4
Abstract ................................................................................................................................................................. 5
Introduction .......................................................................................................................................................... 5
Materials and Methods ......................................................................................................................................... 8
Materials & Methods for Antibiotic Discovery ................................................................................................. 8
Selecting soil isolates for the study ............................................................................................................. 8
Growing Soil Isolates .................................................................................................................................... 8
Growing Mycobacterium smegmatis Culture in Liquid Media ................................................................... 8
Inhibition Assays ........................................................................................................................................... 9
Genomic DNA Extraction for PCR ................................................................................................................. 9
Colony PCR Sample Preparation .................................................................................................................. 9
PCR amplification ......................................................................................................................................... 9
Identification of soil isolates by 16S rRNA sequencing ............................................................................. 10
Methanol Extractions ................................................................................................................................. 11
Ethyl Acetate Extractions ........................................................................................................................... 11
Extraction Inhibition Assays ....................................................................................................................... 11
High Performance Liquid Chromatography ............................................................................................... 12
Selection of Resistant Mutants .................................................................................................................. 13
Materials & Methods for Effects of Oxidative Stress ...................................................................................... 14
Obtaining RNA Sequence Expression Library ............................................................................................ 14
Aligning RNAseq Library ............................................................................................................................. 14
Gene Expression Analysis and Visualization.............................................................................................. 15
Analyzing Protein Function of Selected Genes .......................................................................................... 15
Results and Discussion ........................................................................................................................................ 15
Results and Discussion for Antibiotic Discovery ............................................................................................. 15
Inhibition Assay of M. smegmatis Growth by Bacterial Isolates .............................................................. 15
Sequencing for Isolate Identification ......................................................................................................... 16
Inhibition Assay of M. smegmatis by Bacterial Isolate Extractions .......................................................... 17
High Performance Liquid Chromatography ............................................................................................... 21
Selection of Resistant Mutants .................................................................................................................. 23

3
Results & Discussion for Effects of Oxidative Stress ....................................................................................... 24
Conclusion ........................................................................................................................................................... 26
References........................................................................................................................................................... 27
Appendix ............................................................................................................................................................. 29
Part 1: Protocols .............................................................................................................................................. 29
1.A Colony PCR Protocol............................................................................................................................. 29
1.B. Gel Electrophoresis Protocol .............................................................................................................. 29
1.C. Organic Extraction ............................................................................................................................... 30
Part 2: Supplemental Material for Antibiotic Discovery ................................................................................. 32
2.A. Full HPLC Result for Methanol ............................................................................................................ 32
2.B Full HPLC Result for 2014-02 ................................................................................................................ 33
2.C Full HPLC Result for 2014-16 ................................................................................................................ 34
2.D Full HPLC Result for 2015-01 ................................................................................................................ 35
2.E Full HPLC Result for 2015-27 ................................................................................................................ 36
Part 3: Supplemental Material for Antibiotic Effects ...................................................................................... 37

4
ACKNOWLEDGMENTS We would like to thank our advisors, Dr. Michael Buckholt and Dr. Scarlet Shell, for the guidance and continued
effort in helping us complete this Qualifying Project.
We would also like to thank the Graduate students in Professor Shell’s lab for providing the data for oxidative stress analysis and for the help with the RNAseq data analysis. Paula De Camargo Bertuso conducted the oxidative stress experiment and built the RNAseq library used for the analysis and Huaming Sun for conducting parts of the analysis.

5
ABSTRACT Tuberculosis is an epidemic disease that is now considered to rival the HIV/AIDS pandemic as the leading cause
of death globally due to a single infectious pathogen. Mycobacterium tuberculosis is responsible for
tuberculosis and antibiotic resistant strains of the bacteria have developed, making current treatments
ineffective. The goals of this study were to identify potential new antibiotics as well as understand the how
antibiotics affect the mycobacterium. Through coursework in Searching for Solutions in Soil: Microbial and
Molecular Investigations (BB2905) at Worcester Polytechnic Institute, students collected bacterial isolates
originating from soil in hopes of finding novel antibiotics. Our project worked to select isolates that inhibited
the growth of Mycobacterium smegmatis from the putative antibiotic producing organisms identified in the
course as a means to find antibiotics that are effective against M. tuberculosis. Of the samples, 4 separate
bacteria showed signs of antibiotic activity. Extracts from these bacteria were derived and tested to determine
if they contained compounds that could inhibit the growth of M. smegmatis. One of the resulting organic
extracts demonstrated inhibitory activity for M. smegmatis growth, showing promise that it may contain a
possible antibiotic for tuberculosis. High Performance Liquid Chromatography was performed on the extract
as a first step towards identifying the compound responsible for antibiotic activity against M. smegmatis. In
addition to identifying antibiotics, this project sought to understand how antibiotics affect gene expression in
M. smegmatis. This was studied through RNAseq analysis of the effects of oxidative stress on the
transcriptome. We found that many of the genes with altered expression are used in DNA repair pathways.
INTRODUCTION Tuberculosis (TB) is an epidemic disease that is now considered to rival the HIV/AIDS pandemic as the leading
cause of death globally due to a single infectious disease. In 2016, 1.7 billion people were infected with TB,
6
with almost 1.7 million deaths (World Health Organization 2017). Due to this, the World Health Organization
initiated an “End TB Strategy” that set a goal of reducing the TB incidence rate by 90% by the year 2035 (World
Health Organization 2015). This strategy shines a spotlight on the development of drug resistant forms of TB.
Drug-resistant TB was first characterized in 1948, and since then drug resistant strains have become
increasingly more common (Srivastava et al. 2011).
Tuberculosis is caused by Mycobacterium tuberculosis. It typically affects the human pulmonary system and is
transmissible through the aerosol route; it is commonly spread when a person coughs or sneezes. Inhaling the
airborne M. tuberculosis brings the bacteria into the lungs where it can cause disease by infecting the host. In
its latent forms of infection, an infected individual will not express symptoms and is non-contagious (Centers
for Disease Control and Prevention 2016). The World Health Organization (WHO) estimates that ⅓ of the
human population is latently infected with M. tuberculosis (World Health Organization 2017). These infected
individuals are at an increased risk of developing active TB disease in their lifetime.
There are 10 FDA-approved drugs used to treat TB. Treatments involve taking multiple antibiotics for 6-9
months, with the most commonly prescribed drugs being isoniazid, ethambutol, pyrazinamide, and rifampin.
TB is often grouped into three categories: drug-sensitive TB, multidrug-resistant TB (MDR-TB), and extensively
drug-resistant TB (XDR-TB) (Skrahina et al. 2012; Srivastava et al. 2011). When a patient has MDR TB, more
expensive, and more toxic antibiotics are used instead of isoniazid and rifampicin. XDR TB is even more difficult
to treat and requires a specialist to develop a customized treatment (Centers for Disease Control and
Prevention 2016). The common belief is that antibiotic resistance results from patients not completing their
prescriptions; that is, they stop taking the medicine when they feel better instead of when an appropriate
amount of time has passed to ensure all bacteria are killed. However, recent studies have concluded that non-
adherence to the common and lengthy TB medication regimen may not be the cause of the drug-resistant
forms of TB, leaving the cause to be uncertain (Srivastava et al 2011).
Antibiotic resistance poses many problems to the microbial and medical field. With antibiotic resistance, there
becomes an increased difficulty in treating infections of the resistant bacteria. This poses a major threat to all
organisms that can become infected with antibiotic resistant bacteria. The CDC has classified resistance into 3
hazard levels, placing MDR- TB at the second highest level: Hazard Level Serious (Centers for Disease Control
and Prevention 2013). Drug resistant TB poses a considerable problem in the control of this disease. Once TB
has become drug resistant, there are limited ways to control the bacteria from spreading and growing. This
leads to a worsening of the illness in the host organism, and increasing the spread of infection in others. The
antibiotic resistance crisis, specifically in M. tuberculosis, calls for new antibiotics to be discovered and for their
downstream effects to be understood.
Currently research is being conducted to understand the downstream effects that an antibiotic has on a
bacteria. Studies have shown that many common antibiotics alter the metabolic rate of the target bacterium
(Dwyer et al. 2014). Further analysis has suggested that in altering the metabolic rate, the antibiotics have a
downstream effect of inducing the production of reactive oxygen species (ROS) (Dwyer et al. 2014). The
oxidative stress on the cell, caused by the antibiotics is seen to be a cause of cellular death (Dwyer et al. 2014).
DNA damage induced by ROS is believed to be a cause of M. tuberculosis cell death (Vilchèze et al 2017). Not
only do antibiotics affect the metabolism of the target bacterium but the effectiveness of the antibiotic is
affected by the target bacterium's metabolic state when targeted (Lobritz et al. 2015). Studies focusing on M.
tuberculosis have found that the metabolic rate of the treated mycobacterium affects how it reacts to the
antibiotic; M. tuberculosis that exists in a quiescent form has a characteristically low metabolism allowing it to
persist in the presence of the antibiotic because the ROS species that are linked to cell death are not produced

7
(Vilchèze et al 2017). These persisting bacteria are not killed by the antibiotic and remain in the host even after
antibiotic treatments.
Antibiotic resistance occurs due to genetic variations that allow some bacteria to survive even after exposure
to antibiotics (Davies and Davies 2010). Even in the absence of resistance-conferring mutations, M. tuberculosis
can survive treatment with the TB drug isoniazid if it is in a state of low metabolic activity, preventing the
buildup of ROS (Vilchèze et al 2017). This is termed antibiotic tolerance. Understanding how M. tuberculosis
tolerates antibiotics can allow for new methods of treatment to be developed; in the case of isoniazid
tolerance, pairing isoniazid with cysteine can counteract the isoniazid tolerance and allow the antibiotic to
effectively kill the tolerant cells by increasing the metabolic rate (Vilchèze et al 2017).
The first antibiotic discovery was in 1928, when penicillin was produced and isolated from a mold, penicillium,
and acted against the staphylococcus bacterium. Since then, there have been widespread initiatives developed
to continually discover new antibiotics, that act in unique and specific ways, to be utilized in the defense against
more bacterial infections. These efforts involved multiple different approaches to discovering new antibiotics.
Today, antibiotics can be synthetic or semi-synthetic, or naturally produced. Naturally produced antibiotics are
derived from different cells or organisms, such as mold or microbes. When placed under specific stressors,
microbes may release chemicals in order to compete with surrounding organisms in order to survive (Lewis
2012). The resulting chemicals secreted by these microbes, can be isolated and utilized to act as an antibiotic,
and treat different bacterial infections. A specific approach that has contributed to the discoveries of novel
antibiotics is through screening naturally occurring antibiotics produced by microbes found in soil. Throughout
the peak of antibiotic discovery, the surveying of soil for microbes was a major contributor to finding several
microbes that were successful antibiotic producers. This method of finding novel antibiotics was abandoned in
the 1990s as scientists moved towards focusing on genomic-based antibiotic discovery; this new technology
drew the focus in the antibiotic community and outshined previous discovery methods. The method yielded
success in bringing many antibiotics into clinical trials, however, this method alone cannot identify all potential
antibiotics. Soil based antibiotic discovery is currently being reintroduced in an attempt to find novel antibiotics
that can be used against antibiotic resistant bacteria that are continuously emerging (Gallegos 2017).
The issue of antibiotic resistance and tuberculosis is being approached in many different ways. The Small World
Initiative is a program that promotes the crowdsourcing of antibiotic discovery by allowing high school and
college students to collect soil and test it for potential antibiotic properties (Small World Initiative 2016). At
Worcester Polytechnic Institute (WPI), the class “Searching for Solutions in Soil: Microbial and Molecular
Investigations” (BB 2905) follows this program in hopes of discovering organisms producing compounds that
could be used as antibiotics. Some isolates that exhibited these properties were subject to further research for
a 2016-2017 Major Qualifying Project. Students tested 75 isolates and determined that 14 of them inhibited
the growth of Mycobacterium smegmatis (Barter and McCarron 2017). We sought to continue work on 7 of
these isolates as well as additional isolates identified in unpublished research by the lab of Scarlet Shell. We
chose to use M. smegmatis as a model organism because it is fast-growing and non-pathogenic, allowing
research to be conducted at lower biosafety levels. Like M. tuberculosis, M. smegmatis enters dormant states
when exposed to oxygen depleted environments (Dick et al. 1998). M. tuberculosis and M. smegmatis also
have similar cell wall structures which is important when studying how an antibiotic can interact with cell walls
(Zimhony et al. 2004).
There were two areas of focus for this study: antibiotic discovery using soil microbes and understanding the
effects of downstream oxidative stress caused by antibiotics. Within the two areas of focus, there were three
objectives in this study: (1) evaluate the antibiotic capabilities of microbes against M. smegmatis; (2) extract

8
and identify the individual compounds causing the antibiotic characteristics; (3) conduct a transcriptome
analysis on the response of M. smegmatis to oxidative stress. To complete these objectives isolates were
assessed for the capability of inhibiting M. smegmatis growth, and extractions from these isolates were
individually tested for inhibition capabilities to identify the compound responsible. To identify the mechanism
of action by which the compound affected M. smegmatis, mutation experiments were attempted to find
compound resistant strains of M. smegmatis to analyze the resistance-causing mutations. To better understand
the effects of oxidative stress on the M. smegmatis transcriptome, we analyzed a previously generated RNAseq
dataset from bacteria exposed to hydrogen peroxide.
Our results indicate that extracted compounds from soil microbes can yield potential M. smegmatis inhibiting
agents. We identified four soil microbes that inhibit M. smegmatis growth. One soil isolate produced an ethyl
acetate extract that showed inhibitory activity against M. smegmatis. These results justify the future study of
extractions from all four of the microbes studied. Our transcriptomic analysis showed that in response to
oxidative stress, many of the upregulated genes are involved in DNA repair mechanisms. Among some of the
most upregulated genes are those encoding hypothetical proteins. We conclude that further research on these
upregulated genes should be conducted to understand the mycobacterial response to oxidative stress.
MATERIALS AND METHODS
Materials & Methods for Antibiotic Discovery
Selecting soil isolates for the study Eleven microbial isolates derived from soil samples studied in the WPI biology lab course, “Searching for
Solutions in Soil: Microbial and Molecular Investigations”, were further explored in regards to their antibiotic
activity. The soil samples were tested for antibiotic properties against a wide range of bacteria, therefore, only
those previously tested against M. smegmatis were selected. Two groups, including a previous MQP team and
students in Professor Scarlet Shell’s lab at Worcester Polytechnic Institute, had worked to test these isolates
against M. smegmatis (Barter and McCarron 2017, Barros dos Santos 2016). Based on the positive inhibitory
results of these isolates studied, twelve microbial isolates were selected for our analysis. The soil isolates were
collected in years ranging from 2014 to 2016. The isolates were collected and stored in small aliquots in a -80ºC
freezer.
Growing Soil Isolates To test the antimicrobial properties of each of the twelve soil isolates, they were first grown from the preserved
aliquots. Each of the twelve isolates were streaked on LB plates and grown at 37ºC for 24 hours. A single colony
was picked and maintained on LB agar for use in all subsequent experiments including the inhibition assays,
PCR, and extractions.
Growing Mycobacterium smegmatis Culture in Liquid Media Mycobacterium smegmatis strain mc2155 was grown in Middlebrook 7H9 broth supplemented with 0.05%
Tween 80, 0.2% glycerol, 5 mg/ml bovine serum albumin fraction V, and 2 mg/mL dextrose. The mycobacterium
culture was incubated at 37°C in a shaker (200 RPMs) until the OD reached 0.8 when measured at 600 nm using
a spectrophotometer. Aliquots of the culture were stored in a -80ºC freezer to be later used in inhibition assays.
Later in trials of inhibition assays, it was found that fresh M. smegmatis grew better for the experiment. For
inhibition assays that were set up with fresh growing M. smegmatis, the frozen aliquots were allowed to start

9
the growth phase by incubation at 37°C in a shaker (200 RPMs), for 24 hours then the samples were diluted to
an OD of 0.8 at 600 nm for use in inhibition assays.
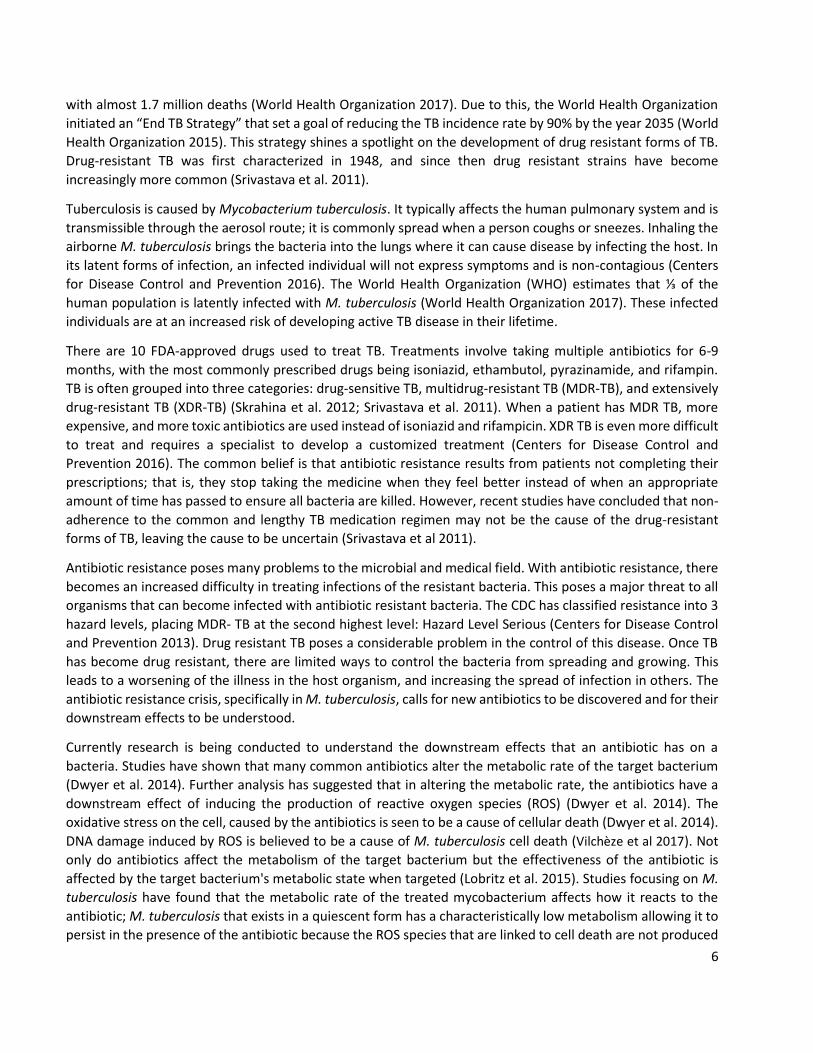
Inhibition Assays An inhibition assay was performed in duplicate to determine which of the original eleven soil isolates prevented
the growth of M. smegmatis. LB plates were split into four quadrants and spread with 200 µL of 0.84 OD
(measured at 600 nm) M. smegmatis. After the M. smegmatis was dry, isolates were patched onto the plate in
their respective quadrants using individual sterile loops, and were incubated at 37℃ for 48 hours. The plates
were then assessed for zones of inhibition, if inhibition was present, there would be no growth of M. smegmatis
around the plated isolate, and if there is no inhibition, the growth of M. smegmatis would not be diminished
(Figure 1).
Figure 1: Method design for isolate inhibition assays with blue arrow showing the area around the isolate with no spread
of M. smegmatis indicating a zone of inhibition
Genomic DNA Extraction for PCR To extract genomic DNA from bacterial colonies, colonies were grown on LB agar plates, colonies were picked
using sterile loops and vortexed in 500 µL of ddH20.1 mL of Wizard DNA Clean up resin from Promega was
combined with the 500 µL of picked colony and added to the Wizard DNA minicolumn. The minicolumn was
washed with 2 mL of 80% isopropanol and micro centrifuged at 10,000x g for 2 minutes. To elute, 50 µL of
ddH20, warmed to 50ºC, was added then spun at 10,000 x g for 20 seconds. The resulting extracted genomic
DNA was stored at -20ºC. PCR was performed on the prepared genomic DNA samples.
Colony PCR Sample Preparation For each sample, colonies were grown on LB agar plates, colonies were picked using a sterile toothpick. The
picked colony was mixed in 100 µL of sterile ddH20 contained in a 0.2 mL microfuge tube. The microfuge tubes
containing picked colonies were placed in the thermocycler and heated for 10 minutes at 100℃. After boiling
the colonies, PCR was performed on the prepared colony samples
PCR amplification To run PCR on either the prepared genomic DNA or prepared colony (see above methods) the following were
combined in a 0.2 mL microfuge tube: 25 µL of 2X OneTAQ reaction mix (New England Biolabs), 2 µL of forward
primer at a 10µM concentration, 2 µL of reverse primer at a 10µM concentration, and 21µL of prepared sample.
The mixture was placed in the thermocycler and the following protocol was run: 2 minutes at 90℃, followed
by 30 repetitions of 30 secs at 95℃, 45 secs at 49℃ and 2 minutes at 72 ℃, then 10 minutes at 72℃ to finish.
To test if the PCR reaction worked, 8 µL samples were run on a 1% agarose gel at 100V for 45 minutes and
visualized with Sybr Green.

10
Identification of soil isolates by 16S rRNA sequencing Isolate identification was accomplished by amplifying part of the 16S rRNA gene, sequencing the DNA, and
using NCBI Blast to analyze the sequence results. The gene encoding the 16S rRNA was amplified using the PCR
Protocol in the previous paragraph. PCR was performed using a set of forward and reverse primers: either the
forward primer, 27F (10µM) and the reverse primer, 1492R (10µM) or the forward primer 8F (10µM) and the
reverse primer 1391R (10µM). PCR products were assessed by gel electrophoresis with a 1% agarose gel and
SYBR green staining. PCR products were sequenced by Eton Biosciences (Charlestown, MA).
Table 1: The 16S primer sequences
Primer Sequence (5’-3’ direction)
27F AGAGTTTGATCMTGGCTCAG
1492R TACGGYTACCTTGTTACGACTT
8F AGAGTTTGATCCTGGCTCAG
1391R GACGGGCGGTGTGTRCA
The .ab1 files received from Eton Biosciences were opened in a chromatogram visualizing software program
called SnapGene® software (GSL Biotech). This software allows users to visualize chromatogram data and trim
sequence results based on quality. Sequences with at least 200 consecutive nucleotides with high quality reads
were selected and low quality sections were trimmed using the software. Figure 2 below highlights high quality
reads that would be selected for based on the low noise and clear peaks (DNA Sequencing Core). Figure 2B.
shows an example of low quality sequence with excessive noise in the results, sections like this would be
excluded from the Blast. The trimmed sequences were run through the National Center of Biotechnology
Information (NCBI) BLAST tool to search the database to find homologous sequences.

11
Figure 2: Both high quality (A) and low quality (B) sequence reads as a result of sequencing the 16S region for the isolate
samples viewed and analyzed in SnapGene
BLAST results were analyzed on the following criteria: Query Cover, E-value, and Identity. Query cover rates
the percentage that the query sequence matches the BLAST result on a nucleotide to nucleotide comparison;
a query cover above 90% was accepted. E-value rates the expected value that the match occurred by chance,
the lower the E-value the more significant the result is, E-values less than 1.0 were accepted. The Identity rates
the percentage that the sequence is identical to a Blast result, Identity rates above 95% were accepted.
Methanol Extractions Following the Small World Initiative Research Protocols for Organic Extractions, extraction assays were
performed on each isolate (Small World Initiative Inc. 2015). To prepare isolates for extraction assays, isolates
are grown into a dense lawn on LB plates. After 48 hours of growth the bacteria-coated agar was cut up and
frozen at -80ºC. Following freezing, 20 mL of methanol was combined in the glass bottle containing the frozen
LB agar and isolate and placed in room temperature rocking shaker for 24 hours. Using glass Pasteur pipettes
all liquid was transferred from the glass bottle to a scintillation vial and the samples were lyophilized to
evaporate the solvent. The extract remaining in the vial was later resuspended in methanol to test for inhibition
of M. smegmatis growth.
Ethyl Acetate Extractions To prepare isolates for extraction assays, isolates are grown into a dense lawn on LB plates. After 48 hours of
growth the bacterial lawns were cut up and frozen at -80ºC. Following freezing, 20 mL of ethyl acetate was
combined in the glass bottle containing the frozen LB agar and isolate and placed in room temperature shaker
for 24 hours. Using glass Pasteur pipettes the top layer of the separated liquid was transferred from the glass
bottle to a scintillation vial and left uncapped in a fume hood to allow the solvent to evaporate, leaving the
formed extract in the vial. The extract remaining in the vial was later resuspended in methanol to test for
inhibition of M. smegmatis growth.
Extraction Inhibition Assays To test the inhibition of M. smegmatis growth by the extractions from both the methanol and ethyl acetate
protocols an inhibition assay using 0.7% soft LB top agar was performed. Extractions were resuspended in

12
methanol, determined by calculating for every 10 µg of extract formed, 1 µl of methanol was added. The
amount of extract formed was determined by weighing the vial before and after adding the extract. 60 µl of
the resuspended extract was pipetted onto sterile filter discs (Figure 3). The filter discs used had a 3mm
thickness and were from Whatman. 7 mL of 0.7% soft top agar was warmed and combined with 200 uL of
freezer stock M. smegmatis (OD 0.8) and plated onto LB agar plates. Plates were allowed 15 minutes to cool
before adding the dried filter discs containing extract to the surface. Plates were incubated at 37ºC for 48 hours
and analyzed for zones of inhibition .Similar to the inhibition assays performed on the soil isolates, inhibition
is identified when there is no M. smegmatis growth around the filter disc in each section of the plate. If there
is no inhibition of M. smegmatis by the extract, there would be no change in bacterial growth. Methanol was
used as a control for the experiment because this was used to resuspend each of the ethyl acetate and
methanol extractions. In some instances, the extraction assays showed that the extraction itself was
contaminated. In these situations, the extracts were filtered with a 0.22 µm filter and syringe and retested.
Figure 3: Method design for extract inhibition assays with blue arrow pointing to an observed zone of inhibition where
there is no M. smegmatis growth
High Performance Liquid Chromatography High Performance Liquid Chromatography (HPLC) was run using the Agilent HPLC Series 1100 from Pfizer. The
protocol followed for HPLC analysis is from Richard Wobbe of WPI, and is outlined in table below (Wobbe,
2015). Reverse HPLC was run using a 4.6 x 250mm column of Silica C18 (5µm, 300Ǻ) from PepMap kept at 25℃.
Each HPLC run used 0.1% Formic Acid in H20 and 0.1% Formic Acid in Acetonitrile for solvents and recordings
were measured at the following wavelengths: 246, 273, 285, 330. The flow rate was maintained at 1 mL per
minute.

13
Table 2: HPLC Protocol
Time
(minutes)
% Solvent A
(0.1% Formic Acid in H20)
% Solvent B
(0.1% Formic Acid in Acetonitrile)
0 92 8
4.25 92 8
29.25 20 80
37.55 20 80
37.56 10 90
45.85 10 90
45.86 92 8
54.15 92 8
Selection of Resistant Mutants We attempted to identify mutations in M. smegmatis mutants that could grow in the presence of inhibiting
isolates. Following the protocol for Extraction Inhibition Assays, LB plates were layered in 7 mL of 0.7% soft LB
top agar combined with 200uL of M. smegmatis (OD of 0.8 at 600nm). Once cooled, isolates of interest were
patched on the plate, just like the original growth Inhibition Assays (Figure 4).
Figure 4: Method design for selection of resistant mutants experiments. The blue arrow indicates a mutated M. smegmatis
colony.

14
Materials & Methods for Effects of Oxidative Stress
Obtaining RNA Sequence Expression Library RNA sequence was performed in different study at WPI in Professor Scarlet Shell’s Lab and the resulting data
was used for analysis in this study. The RNAseq library was built from oxidative stress experiments conducted
by Paula De Camargo Bertuso. In the previous study, the transcriptomic changes in regards to oxidative stress
on M. smegmatis were measured using RNA sequencing. RNA sequencing was performed on M. smegmatis
after 3 hours and 6 hours of exposure to hydrogen peroxide. The expression library results from the RNAseq
generated fastq files were obtained for the purpose of this analysis of the oxidative stress effects on M.
smegmatis. For each of the two time points (3 hours and 6 hours) there are two replicates and there are two
untreated control replicates for comparison.
Aligning RNAseq Library Alignment of the RNAseq reads required initial quality screening, removal of the adaptor sequences, and
alignment. The quality of the fastq files was assessed using FastQC 0.11.7. The detected adaptor sequences
were trimmed from the files using the Trimmomatic software (Bolger, Lohse, and Usadel 2014). The alignment
software, Bowtie 1.0.0 (Langmead et al. 2009) was used to align the cleaned up RNAseq reads to the M.
smegmatis reference genome (Mc2155 NC_008596). Following alignment to the reference genome, HTSeq was
used to count the number of alignments for each gene feature (Anders, Pyl, and Huber 2014).
Figure 5: FastQC output showing the quality of the sequence results with sequences scoring in the green section being
considered high quality and sequences scoring in the red section being poor quality. This output is from one of the 3 hour
exposure reads.

15
Gene Expression Analysis and Visualization The differential expression analysis of the aligned sequences was done using the DESeq2 package in R (Love,
Huber, Anders 2014). The results from the analysis were visualized using the ggPlot library (Wickman 2009). To
identify genes with an altered expression level the P-value and fold change were examined. To be considered
as a gene with an altered expression the following criteria must be met: have an adjusted P-value < 0.01 and a
fold change > 2. The ggPlot visualization highlights these genes with an identified change in gene expression.
Analyzing Protein Function of Selected Genes The genes that fit in the category of altered expression were output in a table. The top 5 most changed genes
from both the 3 hour and 6 hour tests were selected for functional analysis. The output table contained the
gene name, this name was input to the Mycobrowser database where annotations of M. smegmatis genes are
curated (Kapopoulou, Lew, Cole 2011).
RESULTS AND DISCUSSION
Results and Discussion for Antibiotic Discovery
Inhibition Assay of M. smegmatis Growth by Bacterial Isolates Select frozen soil isolates that were collected in the Searching for Solutions in Soil: Microbial and Molecular
Investigations (BB 2905) laboratory course were retested for the ability to inhibit growth of M. smegmatis. The
eleven selected isolates were chosen based on the results from previous students research (Barter & McCarron
2017, Barros dos Santos 2016). Inhibition assays were performed to determine if the bacteria inhibited M.
smegmatis growth. Of the eleven isolates, four yielded zones of inhibition which indicated the ability to inhibit
M. smegmatis (Table 3).
Table 3: Bacterial isolates that inhibit the growth of M. smegmatis
Isolate Name Observed Inhibition of M. smegmatis growth
2015-01 yes
2015-27 yes
2014-16 yes
2014-02 yes
2016-22 no
2015-32 no
SSX-0012 no
SSX-0016 no
SSX-009 no
SSX-014 no
SSX007 no

16
Figure 6: M. smegmatis growth inhibition assay with bacterial isolates
Isolates 2014-02, 2014-16, 2015-01, and 2015-27 produced zones of inhibition during the initial isolate
screenings (Figure 6). The zones of inhibition seen in the inhibition assays can be compared to the distinct zones
seen in Figure 7 below. Figure 7 shows rifampicin, a known and commonly used antibiotic for M. Tuberculosis,
and its inhibition of M. smegmatis. The presence of these zones of inhibition indicate that there is something
responsible for inhibiting the growth of M. smegmatis. These results could be due to a number of things
happening at the cellular level. The tested isolate could be secreting compounds that inhibit the growth of M.
smegmatis or there could be a high competition for nutrients that resulted in M. smegmatis not being able to
grow in that area. To further understand why and what caused these results, we sought to extract compounds
from the isolates to test for their ability to individually inhibit the growth of M. smegmatis.
Figure 7: Inhibition of M. smegmatis by the control, rifampicin (15 μL at 50mg/mL)
Sequencing for Isolate Identification We used PCR to amplify part of the 16S rRNA gene from isolates that showed zones of inhibition. Blast results
from the amplified and sequenced 16S rRNA gene with the best values for the three criteria, Query Cover, E-
value, Identity, were selected as the identity of the tested isolates. Table 4 shows the top BLAST results for
each of the isolates. Overall, the sequencing results were inconclusive due to poor sequence quality and/ or

17
contradictory results obtained from multiple attempts. Multiple sequences generated from both primer sets
(27F & 1492R and 8F & 1391R) yielded different results, all without strong support from the query cover, and
identity values generated from NCBI Blast. Table 4 summarizes the potential Genus that had the highest
Identity matches to the isolate sequences as a result from sequencing analysis with both primer sets.
Table 4: Blast results for each isolate
Isolate 2014-02 2014-16 2015-01 2015-27
Potential Genus Enterobacter, Bacillus
Inconclusive Klebsiella, Enterobacter, Bacillus
Citrobacter, Klebsiella, Bacillus
Table 4 summarizes the 16S ribosomal sequencing results after 2 attempts at 27F and 8F primer sets.
These results in Table 4 should be considered inconclusive, as the initial sequence data used for BLAST
alignment was poor. Frequently the sequenced files would contain only half of the expected base pairs (the
amplified region should have been about 1500 bp). Figure 8 shows that the PCR amplified products sent in for
sequencing were indeed the expected 1500 bp. Interestingly, the two different primer sets seemed to amplify
at different quantities and generate sequences of two different lengths. It is possible that the PCR amplification
was done on a contaminated sample, causing more than one bacterial DNA to be amplified. The sequence
results were also poor quality; chromatogram analysis of the sequence showed that often most of the sequence
quality was too low to be used in the BLAST alignment for identification.
Figure 8: Gel Electrophoresis showing colony PCR products for bacterial isolates
Inhibition Assay of M. smegmatis by Bacterial Isolate Extractions The four isolates that showed inhibatory activity against M. smegmatis in the inhibition assays were 2014-02,
2014-16, 2015-01, and 2015-27. Organic extractions were performed on each of these isolates separately in
methanol and ethyl acetate. The organic extractions allowed the for possible antibiotic compounds in the
bacteria to be isolated from the bacteria and further analyzed for their effectiveness against M. smegmatis.

18
The organic extracts of the 2014-02, 2014-16, 2015-01, and 2015-27 isolates were resuspended in methanol,
and then added to sterile filter discs to be placed on LB top agar containing M. smegmatis. Inhibition assays
were run in duplicate for both the ethyl acetate and methanol extractions, along with a control of just
methanol. On the plates with the initial ethyl acetate extraction, the 2014-16 organic extraction showed
inhibition of the surrounding M. smegmatis, while the remaining 3 isolate extracts and the control showed no
inhibition as seen in Figures 9 and 10 below.
Figure 9: M. smegmatis inhibition assay with initial ethyl acetate extraction
Figure 10: M. smegmatis inhibition assay with initial methanol extraction

19
Table 5: Observed inhibition of M. smegmatis growth by ethyl acetate and methanol extractions
Observed Inhibition of M. smegmatis growth
Isolate Ethyl Acetate Methanol
2015-01 No No
2015-27 No No
2014-16 Yes, but inconsistent No
2014-02 No No
Methanol (control) No No
As shown in Figures 9 and 10, some extracted compounds exhibited microbial growth. In order to prevent this
in future trials, the methanol and resuspended extracts were filtered using a 0.22µm filter and syringe. The
filter disks and top agar were also re-sterilized in an autoclave. All inhibition results were negative after this
process, except for 2014-16. The resulting plates, after methanol, extracts, and top agar were sterilized can be
seen in the Figures 11 and 12 below.
Figure 11: M. smegmatis inhibition assay with filter sterilized methanol extractions

20
Figure 12: M. smegmatis inhibition assay with filter sterilized ethyl acetate extractions
The plates that were created after sterilization of the extracts, top agar, and filter discs, appeared to exhibit no
inhibition of M. smegmatis. None of the extracts, including 2014-16, the extract that previously showed
inhibition in the ethyl acetate extraction, had resulting zones of inhibition. In order to attempt to find
conclusive results for the extracts, in particular determining if the 2014-16 extract could inhibit M. smegmatis
growth, multiple other trials were run. These new trials appeared inconclusive, with no zones of inhibition
forming to show antibiotic effects towards M. smegmatis. To limit possible variables that could limit 2014-16’s
ability to inhibit M. smegmatis growth, a fresh spread of the 2014-16 bacteria isolate was made and extracted.
Growing the bacterial isolate fresh could limit mutations that could have occurred due to the isolate being
saved on an LB masterplate in the fridge over the duration of the experiment. The organic extraction on freshly
grown 2014-16 freezer stock was performed only with ethyl acetate, following the same procedure as the
previous extractions and compared to a methanol control, as seen in Figure 13 below. Small areas of inhibition
can be seen, showing that the extraction from 2014-16 continues to have the ability to inhibit M. smegmatis
growth, though larger concentrations may be needed for future testing.
Figure 13: M. smegmatis inhibition with ethyl acetate extraction of freshly grown 2014-16
freezer stock, with methanol control

21
Throughout the duration of the extraction inhibition assays, the procedure of plating M. smegmatis was altered
for best growth. While the top agar technique used to grow the M. smegmatis was more effective in achieving
a complete coverage when compared to the hockey stick streaking method (See figure 14), there were still
some issues in getting the top agar method to consistently grow M. smegmatis. It was found that M. smegmatis
grew most consistently in the top agar when the liquid culture of the bacterium was allowed 24-48 hours in
the shaking incubator prior to plating in the top agar. Even with freshly growing M. smegmatis the top agar
growth was still not consistent, even amongst plates created at the same time with the same M. smegmatis
and same top agar. In some plates, the mycobacterium would grow ‘spotty’ (Figure 14) and the density of the
growth would vary. In the future, time should be devoted to finding the growing conditions that produce the
most consistent and even M. smegmatis growth. Throughout our studies, we determined that M. smegmatis
growth for inhibition assays occurs best in top agar, with mycobacterium that has recently been incubated. A
focus should be on finding the best ratio of mycobacterium to top agar. It is possible that either too much
mycobacterium was plated and there were not enough nutrients, or too little was plated and did not have the
time to grow evenly.
Figure 14: Comparison of “hockey stick” method and “top agar” method of plating M. smegmatis for growth
High Performance Liquid Chromatography HPLC was run on ethyl acetate extractions, from 2014-02, 2014-16, 2015-01, and 2015-27 as well as a methanol
only control. The saved results from the HPLC run were compared amongst each other to identify unique
regions. Since 2014-16 was the only extraction to exhibit zones of inhibition, peaks unique to 2014-16 could be
identified as the potential cause of those zones of inhibition. Analysis of the results showed that at 273 nm,
there are three peaks showing absorbance between minute 18 and 22 that are unique to the ethyl acetate
extract from 2014-16.

22
Figure 15: HPLC comparing the 2014-02, 2014-16, 2015-01, 2015-27 and methanol compound absorbances at 273 nm
The figure above displays the aforementioned peaks unique to 2014-16 highlighted in red (Figure 15). It is
possible that these compounds are what is causing the inhibition of M. smegmatis, since they are only present
in the isolate extract that showed positive results in the inhibition assay. This can easily be tested in the future
by taking fractions of the eluted extraction at this time point and testing them against M. smegmatis. It should
also be noted that methanol showed multiple peaks, when it should only have one. It is possible that the

23
column used or the methanol itself was contaminated, resulting in this reading. Throughout multiple tests the
control runs that used methanol all produced a similar multi peak result.
Selection of Resistant Mutants Multiple colonies of the 2014-16 isolate were grown against M. smegmatis on 4 different LB plates in an
attempt to select for M. smegmatis colonies that were resistant against the antibiotic compounds produced
by the isolate.
Figure 16: Mutation assays of M. smegmatis grown with the 2014-16 isolate
The figure above shows the results of mutation assays (Figure 16). Each plate has M. smegmatis grown in top
agar with the bacterial isolate of 2014-16 patched on top in sectioned areas on the plate. The purpose of this
experiment is to find a mutated colony of M. smegmatis growing within a distinct zone of inhibition that has
formed due to the antibiotic properties of the 2014-16 isolate. There are apparent zones of inhibition forming
around the 2014-16 colonies, as seen in the decreased concentration of surrounding M. smegmatis. However,
the test for mutated M. smegmatis shows inconclusive results. In the 4 plates grown, M. smegmatis grew in a
spotty formation with many distinct small colonies forming throughout the plate. This growth made it difficult
to distinguish between colonies that grew within distinct zones of inhibition formed around the 2014-16
colonies, despite the antibiotic activity, and just normally growing M. smegmatis. Additionally, the zones of
inhibition were small. This experiment could be continued to identify possible mutated M. smegmatis. Future
experiments can select the colonies that appear in the zones of inhibition and sequence them to identify
mutations potentially responsible for the apparent resistance. This further research could provide an increased
understanding of areas within the M. smegmatis genome that mutate to produce antibiotic resistance.

24
Results & Discussion for Effects of Oxidative Stress To investigate the effects of oxidative stress on gene expression in M. smegmatis, we analyzed RNAseq datasets
previously generated in the Shell lab. RNAseq libraries were prepared from duplicate M. smegmatis cultures
that were treated with 3.2 mM hydrogen peroxide for three or six hours or left untreated. The RNAseq analysis
on identified genes that had significant expression changes in response to the oxidative stress. Figure 17 below
shows the ggPlot generated visualization of the transcriptome changes. There are 6938 genes in M. smegmatis
and there were 13872 gene features (considering both the sense and antisense strands for each gene). For
altered gene expression to be considered, the gene features must have an adjusted P-value < 0.01 and a Log2
Fold Change > 2. The DESeq2 analysis identified 96 gene features that matched the standards for having altered
expression after 3 hours of hydrogen peroxide exposure compared to the untreated control. After 6 hours of
hydrogen peroxide treatment, 198 gene features were identified as having an altered gene expression
compared to the untreated controls. The table below indicates the genes with the largest expression changes
and their identified proteins (Table 6). A full list of the genes with identified expression changes can be found
in the Appendix (Appendix Part 3).
Figure 17: Transcriptome Changes in response to 3 Hours of Oxidative Stress (A) and 6 Hours of Oxidative Stress (B). The
blue gene features are highlighted because there was a large change in expresssion. The 5 most affected gene features
are labeled above.
An initial response to oxidative stress exposure is to upregulate genes, and as exposure lengthens the number
of genes regulated in the mycobacterium increases; more specifically the number of downregulated genes
increases (Figure 17).
Transcriptome Expression after 3 Hour Exposure Transcriptome Expression after 6 Hour Exposure

25
Table 6: Genes with the most change in expression at 3 and 6 hours
Transcriptome at 3 Hours of Hydrogen Peroxide Exposure
Transcriptome at 6 Hours of Hydrogen Peroxide Exposure
Gene Name Protein Function Gene Name Protein Function
MSMEG_5583 - HNH Endonuclease MSMEG_5583 - HNH Endonuclease
MSMEG_4566 - Unknown Product MSMEG_1633 + DNA Pol III (α subunit)
MSMEG_1622 + DNA repair polymerase MSMEG_4566 - Unknown Product
MSMEG_1633 + DNA Pol III (α subunit) MSMEG_5026 + Hypothetical Protein
MSMEG_1620 + Hypothetical Protein MSMEG_1622 + DNA repair polymerase
MSMEG_6025 + Hypothetical Protein MSMEG_4064 - Zinc binding alcohol dehydrogenase
MSMEG_5026 + Hypothetical Protein MSMEG_6025 + Hypothetical Protein
MSMEG_1621 + Pyrimidine - specific ribonucleoside hydrolase
RihA
MSMEG_4032 - Zinc binding alcohol dehydrogenase
MSMEG_ 2742 + DNA damage inducible protein
MSMEG_1620 + Hypothetical Protein
MSMEG_2016 - Molybdate ABC transporter
MSMEG_2514 - Unknown Product
It is interesting to note that the genes most affected by oxidative stress is similar in both the early exposure
reaction (3 hours) and late exposure reaction (6 hours). The functions of the known genes are largely part of
DNA repair mechanisms. This supports the previous studies that identify DNA damage as the ultimate cause of
cell death due to oxidative stress (Lobritz et al. 2015). While some of the protein functions are known, further
studies should be conducted to understand the roles of the upregulated hypothetical proteins.

26
CONCLUSION This work shows that soil microbes serve as a viable source for antibiotic discovery methods. The antibiotic
discovery results yielded four potential antibiotic producing microbes to stop M. smegmatis growth.
Furthermore, our results have identified that more research should be conducted on the potential antibiotic
compounds in the ethyl acetate extractions of 2014-16. In addition to verifying a discovery method, the results
from the oxidative stress analysis support the theory that oxidative stress leads to DNA damage within the cell
and ultimately death. Results show that there is both an early and a prolonged gene expression change that is
a result of oxidative stress. Further analysis should be conducted on the roles that the identified hypothetical
genes have in the mycobacterium. Future studies can also use similar RNAseq methods to see how specific
antibiotics alter the mycobacterial transcriptome; this could provide information on how the antibiotics affect
the bacteria and provide ideas for how antibiotics could be combined to maximize their effects.

27
REFERENCES Anders S, Pyl P, Huber W. 2014. HTSeq--a Python framework to work with high-throughput sequencing data.
Bioinformatics 31:166-169. Antibiotic Resistance Threats in the United States. 2013. Centers for Disease Control and Prevention.
[accessed 2017 Oct 6]. https://www.cdc.gov/drugresistance/threat-report-2013/pdf/ar-threats-2013-508.pdf
Barros dos Santos D. 2016. Antibiotic discovery against tuberculosis through isolation and identification of soil bacteria. .
Barter M, McCarron C. 2017. New treatment for an old disease. Bolger A, Lohse M, Usadel B. 2014. Trimmomatic: a flexible trimmer for Illumina sequence data.
Bioinformatics 30:2114-2120.
Gallegos J. 2017. In the hunt for new antibiotics, scientists hit pay dirt. Washington Post.
Davies J, Davies D. 2010. Origins and evolution of antibiotic resistance. Microbiology and Molecular Biology Reviews 74(3):417-33.
Dick T, Lee B, Murugasu-Oei B. 1998. Oxygen depletion induced dormancy in Mycobacterium smegmatis.
FEMS Microbiology Letters 163:159-164. Dwyer D, Belenky P, Yang J, MacDonald I, Martell J, Takahashi N, Chan C, Lobritz M, Braff D, Schwarz E et al.
2014. Antibiotics induce redox-related physiological alterations as part of their lethality. Proceedings of the National Academy of Sciences 111:E2100-E2109.
Interpretation of Sequencing Chromatograms. 2018. DNA Sequencing Core. [accessed 2017 Nov 15].
https://seqcore.brcf.med.umich.edu/sites/default/files/html/interpret.html Kapopoulou A, Lew J, Cole S. 2011. The MycoBrowser portal: A comprehensive and manually annotated
resource for mycobacterial genomes. Tuberculosis 91:8-13. Langmead B, Trapnell C, Pop M, Salzberg S. 2009. Ultrafast and memory-efficient alignment of short DNA
sequences to the human genome. Genome Biology 10.
Lewis K. 2012. Antibiotics: Recover the lost art of drug discovery. Nature 485:439-440. Lobritz M, Belenky P, Porter C, Gutierrez A, Yang J, Schwarz E, Dwyer D, Khalil A, Collins J. 2015. Antibiotic
efficacy is linked to bacterial cellular respiration. Proceedings of the National Academy of Sciences 112:8173-8180.
Love M, Huber W, Anders S. 2014. Moderated estimation of fold change and dispersion for RNA-seq data
with DESeq2. Genome Biology 15.

28
National Center for Biotechnology Information (NCBI) [Internet]. Bethesda (MD): National Library of Medicine (US), National Center for Biotechnology Information; [1988] – [cited 2018 Apr 06]. Available from: https://www.ncbi.nlm.nih.gov/
Our Mission. 2016. Small World Initiative. [accessed 2017 Oct 5].
http://www.smallworldinitiative.org/mission/
Skrahina A, Hurevich H, Zalutskaya A, Sahalchyk E, Astrauko A, Gemert W, Hoffner S, Rusovich V, Zignol M. 2012. Alarming levels of drug-resistant tuberculosis in belarus: Results of a survey in minsk. Eur Respir J 39.
Small World Initiative Inc. 2015. Small World Initiative: Research Protocols and Research Guide to Microbial and Chemical Diversity Package. 4th ed. XanEdu Publishing Inc.
SnapGene® software (from GSL Biotech; available at snapgene.com Srivastava S, Pasipanodya JG, Meek C, Leff R, Gumbo T. 2011. Multidrug-resistant tuberculosis not due to
noncompliance but to between-patient pharmacokinetic variability. J Infect Dis 204. Treatment for TB Disease. 2016. Centers for Disease Control and Prevention. [accessed 2017 Oct 5].
https://www.cdc.gov/tb/topic/treatment/tbdisease.htm Global Tuberculosis Report 2017. 2017. Geneva: World Health Organization. [accessed 2017 Oct 10] What is TB? How is it treated?. 2017. World Health Organization. [accessed 2017 Oct 8].
http://www.who.int/features/qa/08/en/ Wickham, H. 2009. ggplot2: Elegant Graphics for Data Analysis. Springer-Verlag New York. Wobbe R. 2015. Methods for purifying and analyzing antibacterial compounds from soil microbes in an
undergraduate laboratory course. Zimhony O, Vilcheze C, Jacobs W. 2004. Characterization of Mycobacterium smegmatis Expressing the
Mycobacterium tuberculosis Fatty Acid Synthase I (fas1) Gene. Journal of Bacteriology 186:4051-4055.

29
APPENDIX
Part 1: Protocols
1.A Colony PCR Protocol Materials:
1. Streak plates of soil isolates / Master plate
2. Sterile toothpicks
3. 0.15 mL tubes
4. ddH2O
5. TAQ (New England BioLabs - OneTaq QuikLoad 2xMM)
6. 27 F primer (10uM)
7. 1492 primer (10uM)
8. Bio Rad Thermocycler
To get DNA sequences for identification, isolated DNA was extracted and amplified using the following
extraction and pcr amplification technique. For each sample, a sterile toothpick was used to pick a colony from
the streak plate. The picked colony was mixed in 100 uL of ddH20 contained in a 0.15 mL microfuge tube. The
microfuge tubes containing picked colonies were placed in the thermocycler and the boil protocol was run (10
minutes at 100℃). After boiling the colonies, PCR was performed using a both the forward and reverse primer.
For each PCR sample, 25 uL of TAQ, 2 uL of 1492R primer, 2 uL of 27F primer and 21uL of boiled colony sample
were combined in a 0.15 mL microfuge tube. These were placed in the thermocycler and the Small Worlds PCR
protocol was run (2 minutes at 90℃, followed by 30 repetitions of 30 secs at 95℃, 45 secs at 49℃ and 2
minutes at 72 ℃, then 10 minutes at 100℃ to finish). Gel electrophoresis was run to test if the PCR reaction
worked a sample of the PCR product (see appendix ).
1.B. Gel Electrophoresis Protocol Materials:
1. Agarose (Fisher Scientific)
2. 1x TAE (Tris-acetate-EDTA)
3. Erlenmyer flask (125 mL)
4. Gel Box (EasyCast Electrophoresis System)
5. Gel tray
6. Well comb
7. Voltage source and electrodes
8. PCR samples
9. Hyperladder (Bioline 1kb hyperladder)
10. SYBER Green (100x)
11. BioRad ChemiDoc XRS Imaging System and Image Lab Software
PCR samples were run on a 1% agarose gel to see if the DNA was amplified during the PCR process. The 1% gel
was made by combining 0.5g of Agarose with 50uL of 1xTAE buffer in a 125 mL Erlenmyer flask. The flask was
microwaved at 30 second intervals or until boiling. Once the agarose powder dissolved the gel was allowed to
cool for 5 minutes. After cooling the gel was poured into the assembled gel apparatus (well comb, gel tray, and

30
gel box). The agarose was allowed to cool for 20 minutes. After cooling, the well comb was removed and the
gel box was filled with 1x TAE buffer (enough to cover the gel).For each isolate PCR sample: 10 uL of PCR sample
was combined with 1 uL of 100x SYBR Green and 4 uL of this solution was loaded into an empty well. After
loading all samples and 4 uL of hyperladder in separate lanes, the electrodes were attached and the gel was
run at 100 V for 45 minutes. Images of the gel recorded using the UV setting on the BioRad ChemiDoc system.
1.C. Organic Extraction Protocol Modified from Small World Initiative: Research Protocols “Organic Extraction” (2015)
Materials:
1. LB agar plates
2. Masterplate (previously made containing each isolate colony)
3. Bunsen burner
4. Inoculating Loop
5. 50 mL conical tube (1 for each isolate)
6. Microspatula or cutting device
7. Freezing Compartment ( -80°C)
8. Ethyl Acetate or Methanol (or other solvents depending on experiment)
9. ddH20
10. Glass pasteur pipettes with bulbs
11. Scintillation vial (or substitute with other glass containers)
12. 0.7% Soft Top Agar
13. Liquid culture of M. smegmatis
14. 15-mL conical tube
15. 3mm thick sterile filter discs
Part 1:
To extract possible antibiotic compounds within a bacterial isolate, they must be extracted using solvents such
as ethyl acetate and methanol used in this experiment. The first step is to streak and grow a lawn plate of each
bacterial isolate on an LB agar plate. Allow the bacteria to grow on the plate overnight in a 37°C incubator.
Once the plates are grown, chop up the plate with a sterile microspatula or other cutting device. Place the
chopped agar into a 50 mL conical tube. Place the tube in a -80°C freezer overnight. After being frozen, take
the tubes out of the freezer and add the solvent to each. If using ethyl acetate, add 12 mL ethyl acetate and 8
mL of ddH20 to the tube. If using methanol, add 12 mL of methanol and no water. Place the tubes in a shaker
at room temperature overnight, or until next lab period. After shaking for a substantial amount of time, use a
glass pasteur pipette and bulb to transfer the liquid from bottle to the scintillation vials. Pre-weigh the
scintillation vials, in order to later determine the amount of extract formed and amount of methanol to re-
suspend in. If ethyl acetate was used as the solvent, two layers will form (organic top layer and aqueous bottom
layer). Once layers have formed, transfer top layer into the pre-weighed vial. If using methanol, transfer all the
liquid from the conical tube into the pre-weighed vial, because no layers will form. Place the vials open in the
fume hood and allow the liquid to evaporate. Other methods can be used to quicken evaporation, such as using
the lyophilizer. Once the liquid is evaporated, reweigh the scintillation vials, and subtract the initial weight of

31
the vial to determine the amount of extract that has formed. Next, the extract is resuspended in methanol. The
amount of methanol added is 1 µl of methanol for every 10 µg of extract formed. After being resuspended, the
extracts can be plated using sterile filter discs on an LB plate with LB top agar containing M. smegmatis. 200 µl
of M. smegmatis at an OD of 0.8 is added to liquid top agar. The top agar is then poured on the plate agar plate
and allowed to cool and solidify for 15 minutes. Add 60 µl of each the extract and a methanol control to a
sterile filter disc in 15 µl increments, letting the disc dry between additions of more extract. Once all discs are
dry, and the agar is solidified, place the filter discs on top of the agar. Place the plate in the 37°C incubator for
48 hours. Observe the plates and identify zones of inhibition that could have formed.

32
Part 2: Supplemental Material for Antibiotic Discovery
2.A. Full HPLC Result for Methanol

33
2.B Full HPLC Result for 2014-02

34
2.C Full HPLC Result for 2014-16

35
2.D Full HPLC Result for 2015-01

36
2.E Full HPLC Result for 2015-27

37
Part 3: Supplemental Material for Antibiotic Effects Hydrogen Peroxide - 3 Hour Exposure Hydrogen Peroxide - 6 Hour Exposure
Gene Feature baseMean log2FoldChange padj Gene Feature baseMean log2FoldChange padj
MSMEG_5583_- 773.17626 4.452424478 1.95E-22 MSMEG_5583_- 621.02104 4.457262821 5.44E-46
MSMEG_4566_- 244.683279 4.380341871 7.22E-20 MSMEG_1633_+ 245.26649 3.668197278 1.38E-25
MSMEG_1622_+ 137.088587 4.449060307 1.19E-18 MSMEG_4566_- 131.86423 3.701441161 7.59E-18
MSMEG_1633_+ 418.658084 4.146786472 1.19E-18 MSMEG_5026_+ 102.35457 3.546620648 1.31E-15
MSMEG_1620_+ 140.868086 4.348602183 2.45E-18 MSMEG_1622_+ 72.718195 3.710435744 7.84E-14
MSMEG_6025_+ 121.645204 4.078026102 1.02E-15 MSMEG_4064_- 238.99398 2.730310383 1.36E-13
MSMEG_5026_+ 164.811417 3.867466058 8.55E-13 MSMEG_6025_+ 73.906736 3.500771484 9.04E-13
MSMEG_1621_+ 72.3972706 3.702034341 5.83E-11 MSMEG_4032_- 204.36221 2.627094551 1.83E-12
MSMEG_2742_+ 116.062622 3.550566113 6.65E-11 MSMEG_1620_+ 63.073418 3.349307291 4.19E-11
MSMEG_2016_- 78.112109 -3.915155269 7.09E-11 MSMEG_2514_- 92.197033 2.834796083 1.01E-08
MSMEG_5025_+ 57.8292416 3.450685161 3.54E-09 MSMEG_2725_+ 163.56581 2.14811759 2.98E-08
MSMEG_2990_+ 125.827467 3.526512108 3.74E-09 MSMEG_3404_+ 213.78273 2.104973499 3.26E-08
MSMEG_0543_- 69.3222137 3.332783893 1.25E-08 MSMEG_6859_- 173.92732 2.167071006 3.56E-08
MSMEG_1225_- 330.429222 2.868684114 1.25E-08 MSMEG_0493_- 221.35767 2.569836054 3.81E-08
MSMEG_2514_- 154.881475 3.290012561 1.25E-08 MSMEG_3447_+ 122.62615 2.245480211 8.95E-08
MSMEG_2740_- 413.899903 2.553158053 1.66E-08 MSMEG_2663_- 114.25934 2.61787507 1.22E-07
MSMEG_2725_+ 234.708742 2.664132332 2.50E-08 MSMEG_4399_+ 208.74168 1.976586526 1.22E-07
MSMEG_6573_- 89.8349983 3.168146703 2.50E-08 MSMEG_5680_+ 681.28113 1.757079209 1.22E-07
MSMEG_1264_+ 103.268098 2.87092054 3.64E-08 MSMEG_1225_- 171.15122 1.986371421 5.61E-07
MSMEG_6783_- 277.758918 2.559381194 4.68E-08 MSMEG_5540_- 218.20222 -1.889355787 6.88E-07
MSMEG_4399_+ 342.339591 2.65632836 8.96E-08 MSMEG_0546_- 115.82943 2.086773832 1.31E-06
MSMEG_4064_- 238.769938 2.651472956 1.29E-07 MSMEG_1267_- 83.402276 2.206295782 2.06E-06
MSMEG_4032_- 205.327256 2.585738827 1.70E-07 MSMEG_1789_+ 459.67922 -1.837366996 2.06E-06
MSMEG_5215_- 125.203835 2.616181148 2.05E-07 MSMEG_1790_+ 1480.1111 -1.735864509 2.06E-06
MSMEG_2663_- 196.754726 3.057833093 3.91E-07 MSMEG_0520_+ 2049.0033 -1.677136835 2.68E-06
MSMEG_5582_- 59.3012895 2.882785698 6.59E-07 MSMEG_5558_+ 326.25133 1.599610822 2.68E-06
MSMEG_4400_+ 102.901973 2.566542422 1.13E-06 MSMEG_5025_+ 35.608325 2.82620263 3.40E-06
MSMEG_2724_+ 196.199911 2.33560735 2.34E-06 MSMEG_3713_+ 87.607533 2.308608082 6.20E-06
MSMEG_1941_+ 129.699069 2.454599393 2.62E-06 MSMEG_2740_- 234.62321 1.647487474 6.61E-06
MSMEG_2015_- 31.1461506 -3.160622368 2.62E-06 MSMEG_4714_- 706.74858 -1.430271709 6.88E-06

38
Hydrogen Peroxide - 3 Hour Exposure Hydrogen Peroxide - 6 Hour Exposure
Gene Feature baseMean log2FoldChange padj Gene Feature baseMean log2FoldChange padj
MSMEG_2723_+ 2599.99413 2.106033783 2.62E-06 MSMEG_4063_- 368.06741 1.703415875 7.62E-06
MSMEG_5216_- 89.8692549 2.500646591 6.19E-06 MSMEG_5004_- 287.60882 1.571034861 9.45E-06
MSMEG_6572_- 56.668246 2.733567445 7.56E-06 MSMEG_5956_- 259.59834 1.63931479 1.32E-05
MSMEG_3404_+ 236.923565 2.241466198 1.23E-05 MSMEG_1269_- 86.506643 2.08577514 1.57E-05
MSMEG_3447_+ 138.33143 2.373962933 1.23E-05 MSMEG_1270_- 38.744724 2.613512262 1.63E-05
MSMEG_2017_- 25.7256334 -3.01733254 2.15E-05 MSMEG_6573_- 47.631353 2.404316563 1.66E-05
MSMEG_0185_- 310.421006 2.159121469 2.62E-05 MSMEG_3680_+ 3184.6325 1.714376829 2.53E-05
MSMEG_1236_- 86.6509182 2.387799455 2.62E-05 MSMEG_1019_- 156.56195 1.866035971 2.63E-05
MSMEG_6759_+ 793.908685 -1.937320952 2.87E-05 MSMEG_1771_+ 194.36955 -1.779825848 2.63E-05
MSMEG_5451_+ 67.262385 2.384400441 6.46E-05 MSMEG_2299_- 156.56195 1.866035971 2.63E-05
MSMEG_5681_+ 106.422262 2.172720455 6.49E-05 MSMEG_1097_+ 160.34306 -1.778009889 3.03E-05
MSMEG_6781_- 49.6720916 2.486785666 6.49E-05 MSMEG_5215_- 81.65824 1.963111156 3.55E-05
MSMEG_6648_+ 70.0889685 2.428564522 9.49E-05 MSMEG_2742_+ 45.64473 2.363991443 3.96E-05
MSMEG_5004_- 341.939204 1.898316887 0.0001146 MSMEG_6759_+ 958.06219 -1.433911588 3.96E-05
MSMEG_0546_- 136.840004 2.247386842 0.0001311 MSMEG_1766_+ 148.73236 -1.699352262 4.30E-05
MSMEG_1269_- 98.4836805 2.245378853 0.0001362 MSMEG_1004_- 69.187632 -2.52499778 4.86E-05
MSMEG_5680_+ 819.735994 2.017873369 0.0001558 MSMEG_2284_- 68.912048 -2.520815718 4.92E-05
MSMEG_5214_- 43.7610433 2.392584378 0.0001929 MSMEG_6005_+ 94.889002 1.994393317 4.92E-05
MSMEG_2739_- 67.936963 2.33555265 0.0002326 MSMEG_5483_- 2251.9267 -1.378524566 5.73E-05
MSMEG_6250_- 259.241192 1.871382285 0.000242 MSMEG_5543_- 268.2421 -1.693648092 6.10E-05
MSMEG_2744_+ 42.4312125 2.433919471 0.0002638 MSMEG_1030_+ 1452.3004 1.289362112 6.45E-05
MSMEG_1497_- 197.22055 -1.902372295 0.0002727 MSMEG_2310_+ 1452.3004 1.289362112 6.45E-05
MSMEG_6645_+ 35.3086033 2.505325737 0.0003099 MSMEG_2415_+ 546.75424 -1.533494528 6.45E-05
MSMEG_3242_+ 26.4318374 2.583515859 0.0003602 MSMEG_2094_+ 119.79899 1.738836797 8.22E-05
MSMEG_3816_- 460.684581 1.723668492 0.0005898 MSMEG_3255_- 132.89723 -1.820376055 0.0001068
MSMEG_5558_+ 449.338692 2.022651155 0.0005898 MSMEG_4737_- 328.39508 1.553208639 0.0001068
MSMEG_4961_- 146.015337 1.948326268 0.000694 MSMEG_2027_- 1449.6625 1.510034523 0.0001123
MSMEG_6782_- 75.3513465 2.159038083 0.0007254 MSMEG_1098_+ 116.85741 -1.835074213 0.0001226
MSMEG_1279_+ 247.733143 1.851176568 0.0007363 MSMEG_3816_- 381.18248 1.337935011 0.0001226
MSMEG_1943_+ 274.817752 1.716909357 0.0009321 MSMEG_5542_- 273.30052 -1.532178148 0.0001226
MSMEG_2984_+ 45.6782174 2.248773098 0.0010445 MSMEG_5787_+ 37.297076 -2.659127392 0.0001371

39
Hydrogen Peroxide - 3 Hour Exposure Hydrogen Peroxide - 6 Hour Exposure
Gene Feature baseMean log2FoldChange padj Gene Feature baseMean log2FoldChange padj
MSMEG_3384_- 69.4882684 2.076231523 0.0010445 MSMEG_0448_- 76.436291 1.956053158 0.0001392
MSMEG_2014_- 15.7762434 -2.59007874 0.0010502 MSMEG_4031_- 41.025759 2.233226257 0.0001392
MSMEG_6249_- 108.533316 1.849153782 0.0013811 MSMEG_4518_+ 28.418526 -2.519868499 0.0001622
MSMEG_4401_+ 23.6939447 2.389767233 0.0014092 MSMEG_1337_+ 54.335291 -2.488710544 0.0001692
MSMEG_1498_- 235.911649 -1.698248559 0.0014668 MSMEG_1621_+ 28.312418 2.438163921 0.0001989
MSMEG_6761_+ 650.454417 -1.598489036 0.0014996 MSMEG_1941_+ 85.805688 1.813126442 0.0001989
MSMEG_6647_+ 58.0891294 2.166318743 0.0017992 MSMEG_4195_- 319.02387 -1.525719294 0.0001989
MSMEG_0544_- 41.0246609 2.176442163 0.0018679 MSMEG_1264_+ 56.352548 1.981492131 0.0002125
MSMEG_3159_+ 220.479115 -1.667885116 0.0019627 MSMEG_1272_- 56.423221 2.052785483 0.0002559
MSMEG_1267_- 68.7124449 1.908979753 0.002328 MSMEG_6892_- 2049.7498 1.212077972 0.0002606
MSMEG_1280_+ 156.129554 1.777004212 0.002328 MSMEG_2926_- 479.9909 -1.332401945 0.0002658
MSMEG_5002_- 249.235354 1.640465597 0.002328 MSMEG_2723_+ 1557.3275 1.180701939 0.0002993
MSMEG_6758_+ 287.214958 -1.623128116 0.002328 MSMEG_3405_+ 44.554023 2.068297733 0.0003048
MSMEG_4141_+ 324.848844 1.811306213 0.002803 MSMEG_6250_- 203.69479 1.417727401 0.0003048
MSMEG_6646_+ 31.76554 2.265590341 0.0028105 MSMEG_3022_- 205.65937 -1.579207492 0.0003324
MSMEG_6024_+ 56.265827 1.960089862 0.00287 MSMEG_5078_- 543.5878 -1.314187819 0.0003441
MSMEG_1543_+ 121.081052 -1.759104746 0.0028725 MSMEG_5102_- 70.422687 1.789629937 0.0003848
MSMEG_4063_- 392.816975 1.78295379 0.0030108 MSMEG_5216_- 59.843993 1.888018675 0.0004353
MSMEG_3385_- 68.8847955 1.859085666 0.0032828 MSMEG_6760_+ 126.4244 -1.709432003 0.0004585
MSMEG_1270_- 33.7225304 2.242194749 0.003578 MSMEG_1605_+ 310.41618 -1.427685791 0.0004931
MSMEG_5106_- 49.5978478 2.075476952 0.0038101 MSMEG_1421_+ 112.12699 -1.813720137 0.0005305
MSMEG_3405_+ 45.7047187 2.050137562 0.0038312 MSMEG_1770_- 1359.0866 -1.466839977 0.0005305
MSMEG_2723_- 25.812163 2.20746683 0.0039892 MSMEG_2724_+ 119.53212 1.523322151 0.0006054
MSMEG_6005_+ 93.2565259 1.915453959 0.0046482 MSMEG_1812_- 298.40189 -1.520169197 0.0006103
MSMEG_1237_+ 36.2941533 2.139849212 0.0050776 MSMEG_1423_+ 361.42705 -1.237946732 0.0007238
MSMEG_1357_- 21.5421954 2.265913564 0.005138 MSMEG_2317_- 1976.358 1.079234447 0.0007377
MSMEG_4031_- 41.2721297 2.098646107 0.0055048 MSMEG_1037_- 1983.2753 1.079530704 0.0007408
MSMEG_5788_+ 447.586516 -1.517746141 0.0056677 MSMEG_0669_- 182.29955 -1.509488017 0.0008255
MSMEG_2107_+ 116.831696 -1.654533754 0.0062535 MSMEG_6783_- 141.75184 1.469021358 0.0008255
MSMEG_6858_- 48.4008549 1.87181139 0.0065958 MSMEG_4717_- 491.68192 -1.228631792 0.0010114
MSMEG_5739_+ 131.378509 1.601840997 0.0072725 MSMEG_0451_- 649.14472 -1.271361212 0.0010343

40
Hydrogen Peroxide - 3 Hour Exposure Hydrogen Peroxide - 6 Hour Exposure
Gene Feature baseMean log2FoldChange padj Gene Feature baseMean log2FoldChange padj
MSMEG_1953_+ 68.7673297 1.77255503 0.0075834 MSMEG_1474_+ 533.55969 -1.556981582 0.0010343
MSMEG_1757_- 185.38094 1.545114082 0.0085193 MSMEG_1772_+ 110.25357 -1.808515364 0.0010343
MSMEG_4257_- 524.344001 1.458566112 0.0085193 MSMEG_6354_+ 296.44733 -1.28375409 0.0010343
MSMEG_0116_+ 31.6948198 -2.011076501 0.0087828 MSMEG_4736_- 304.98211 1.35342254 0.0010408
MSMEG_4536_- 177.80244 -1.337364901 0.0011084
MSMEG_1237_+ 35.253008 2.151573889 0.0011193
MSMEG_5679_+ 72.580275 1.872622494 0.0011196
MSMEG_6355_+ 289.18946 -1.265567217 0.001246
MSMEG_1669_- 397.71303 -1.30963674 0.0013695
MSMEG_2346_- 118.17191 -1.55249659 0.0018377
MSMEG_1166_+ 37.866198 -2.156250418 0.0018738
MSMEG_1803_+ 604.48278 -1.187267915 0.0018769
MSMEG_2924_- 206.61364 -1.456499676 0.0018769
MSMEG_5051_+ 113.4167 -1.500706674 0.001881
MSMEG_4141_+ 238.77451 1.310832473 0.0018964
MSMEG_3360_- 703.48255 1.23560517 0.0020319
MSMEG_5082_- 252.94351 1.228808578 0.0020504
MSMEG_1757_- 165.91786 1.291238724 0.002097
MSMEG_1497_- 248.32833 -1.220687983 0.0021563
MSMEG_4920_- 2074.9278 -1.095406203 0.0021574
MSMEG_0932_+ 292.26642 -1.193978688 0.0022896
MSMEG_1781_- 35.932986 -2.026722769 0.0022896
MSMEG_6572_- 32.722515 1.980542838 0.0023493
MSMEG_3185_- 377.73573 -1.175674358 0.002385
MSMEG_1280_+ 123.34883 1.354060825 0.0026536
MSMEG_6891_- 78.311039 1.520408655 0.0027307
MSMEG_0450_- 168.22758 -1.411730307 0.0027766
MSMEG_0550_- 785.00349 -1.118469025 0.0028139
MSMEG_3419_- 266.24343 -1.251366715 0.0028139
MSMEG_4993_- 80.360577 -1.561039873 0.0028139
MSMEG_5826_+ 117.39058 -1.495895583 0.0028139

41
Hydrogen Peroxide - 6 Hour Exposure
Gene Feature baseMean log2FoldChange padj
MSMEG_4257_- 455.10241 1.123732652 0.0028509
MSMEG_0879_+ 591.73349 -1.054077622 0.0028985
MSMEG_2833_- 40.689102 -2.116574715 0.0030551
MSMEG_1782_- 350.70766 -1.202253147 0.0031181
MSMEG_4400_+ 57.53809 1.652365683 0.0031181
MSMEG_1279_+ 182.13769 1.296469975 0.0031655
MSMEG_2575_- 173.00453 -1.518760808 0.0033375
MSMEG_1422_+ 93.11301 -1.652357814 0.0033378
MSMEG_1520_- 50.154676 1.944424315 0.0033378
MSMEG_3377_- 114.12819 1.348993788 0.0033378
MSMEG_0637_- 244.35366 -1.204831412 0.0035179
MSMEG_0721_- 49.738548 -1.879238419 0.0035783
MSMEG_1678_- 63.079449 -1.607395142 0.003743
MSMEG_1519_- 76.582022 1.691876113 0.0039376
MSMEG_1680_- 349.51926 -1.259004018 0.0039877
MSMEG_2850_+ 148.15988 1.263579763 0.0040316
MSMEG_2927_- 185.56849 -1.258797299 0.0040749
MSMEG_6858_- 44.620823 1.714195285 0.0040749
MSMEG_3543_- 55.856285 -1.698400847 0.0042366
MSMEG_6500_+ 75.161929 -1.52688885 0.0043167
MSMEG_3325_- 102.65833 1.431063332 0.004444
MSMEG_6232_- 950.01733 -1.175034119 0.0045047
MSMEG_6761_+ 809.72075 -1.039301121 0.0045047
MSMEG_2925_- 185.17559 -1.240883387 0.0045991
MSMEG_6822_+ 308.26002 -1.181305485 0.0046005
MSMEG_1783_- 119.37324 -1.393611334 0.0047971
MSMEG_3536_+ 179.85976 -1.322271581 0.0049831
MSMEG_5342_- 94.242468 -1.543263921 0.0050804
MSMEG_6461_- 39.566777 -1.945538562 0.0051411
MSMEG_6249_- 86.041924 1.414496512 0.0052411
MSMEG_0239_- 194.73675 -1.206158106 0.0052853

42
Hydrogen Peroxide - 6 Hour Exposure
Gene Feature baseMean log2FoldChange padj
MSMEG_2679_+ 135.73651 1.321767358 0.0053942
MSMEG_5277_+ 149.30969 -1.28402807 0.0054626
MSMEG_5343_- 247.14641 -1.248044576 0.0058344
MSMEG_5582_- 29.413498 1.85997184 0.0058379
MSMEG_5643_+ 45.580681 1.689193893 0.0058379
MSMEG_2757_- 263.48429 1.17579971 0.0060982
MSMEG_6309_+ 64.057662 -1.493782476 0.0061818
MSMEG_0201_- 37.337643 -1.945485073 0.0061848
MSMEG_2340_+ 37.337643 -1.945485073 0.0061848
MSMEG_1794_+ 117.29618 -1.356632614 0.0062699
MSMEG_3291_+ 34.37598 1.814029189 0.0062872
MSMEG_6467_- 2577.329 -1.07463756 0.0063888
MSMEG_4049_+ 67.709335 1.594424578 0.0065824
MSMEG_6758_+ 349.50142 -1.148404113 0.0066214
MSMEG_6307_+ 228.32177 -1.095675204 0.0070666
MSMEG_1679_- 556.16451 -1.094815596 0.0072129
MSMEG_4738_+ 307.91573 1.104605184 0.0072554
MSMEG_5890_+ 67.226038 -1.791996044 0.0072706
MSMEG_6696_- 37.570294 -1.907414943 0.0073106
MSMEG_3385_- 56.893968 1.510121378 0.007375
MSMEG_1583_+ 670.31913 -1.086869898 0.0075651
MSMEG_1864_- 182.60766 1.503134599 0.0075651
MSMEG_6665_- 312.06421 -1.152360553 0.0076764
MSMEG_3167_+ 37.877985 -1.903336535 0.0077192
MSMEG_1367_- 88.822184 1.502500938 0.0077643
MSMEG_1916_- 90.935502 -1.553530751 0.0077643
MSMEG_1558_+ 299.13366 -1.13130499 0.0077753
MSMEG_1281_+ 227.17137 1.098461045 0.0078229
MSMEG_3139_+ 461.84254 1.154475237 0.0078229
MSMEG_1259_+ 38.331136 -1.882051519 0.0078514
MSMEG_6645_+ 22.839574 1.92777407 0.0079447

43
Hydrogen Peroxide - 6 Hour Exposure
Gene Feature baseMean log2FoldChange padj
MSMEG_1953_+ 58.80575 1.484785921 0.0082214
MSMEG_2347_- 105.61554 -1.33553576 0.0082214
MSMEG_3698_+ 38.055553 -1.873522348 0.0082214
MSMEG_6612_- 246.16494 -1.116490182 0.0085179
MSMEG_5002_- 194.61984 1.126293227 0.0087966
MSMEG_6190_- 135.23087 -1.397474095 0.0087966
MSMEG_2827_- 39.069003 -1.848545507 0.0092598
MSMEG_4789_- 38.087661 -1.860074268 0.0092598
MSMEG_5265_- 203.30262 -1.224205635 0.0094085
MSMEG_2680_+ 67.423362 1.44721733 0.0095138
MSMEG_0396_- 39.415005 -1.807677956 0.0095928
MSMEG_5448_- 231.27699 1.312637999 0.0095928
MSMEG_4478_- 32.753961 -1.919570191 0.0097682